Embed Size (px)
Citation preview
PRODUCTION OF SEIZED DRUG
ANALYSIS STANDARDS BY INKJET
PRINTING
Jeanita S. Pritchett1, Jeffrey A. Lawrence2, Karen W. Phinney3 , and Jennifer R.
Verkouteren2
National Institute of Standards and Technology
1.Chemical Science Division 2. Materials Measurement Science
Division 3. Biomolecular Measurement Division
100 Bureau Dr. Gaithersburg MD, 20899
Introduction
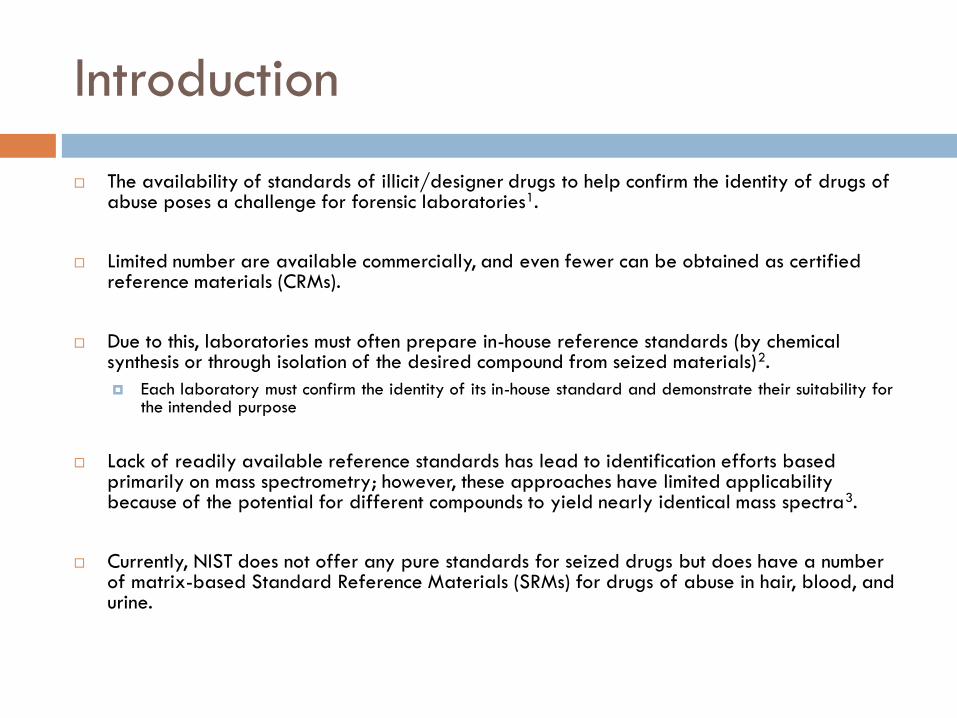
The availability of standards of illicit/designer drugs to help confirm the identity of drugs of abuse poses a challenge for forensic laboratories1.
Limited number are available commercially, and even fewer can be obtained as certified reference materials (CRMs).
Due to this, laboratories must often prepare in-house reference standards (by chemical synthesis or through isolation of the desired compound from seized materials)2.
Each laboratory must confirm the identity of its in-house standard and demonstrate their suitability for the intended purpose
Lack of readily available reference standards has lead to identification efforts based primarily on mass spectrometry; however, these approaches have limited applicability because of the potential for different compounds to yield nearly identical mass spectra3.
Currently, NIST does not offer any pure standards for seized drugs but does have a number of matrix-based Standard Reference Materials (SRMs) for drugs of abuse in hair, blood, and urine.
Objectives
The goal of the proposed research is to produce cost effective, easy to use seized drug standards by inkjet printing technology for analysis by LC-MS(/MS) or GC-MS.
If successful, this method could be expanded to the development of quantitative standards for drug analysis and to the production of materials for quality assurance programs.
This work would also serve as a foundation for possible NIST reference material (RM or SRM) development in the future.
Inkjet Printing Technology
Piezoelectric drop-on-demand (DoD) inkjet printing
is a versatile method for the quantitative delivery of
micro volumes of solution4.
Inkjet printing technology will be used to deposit
known amounts (nanoliter-picoliter volumes) of pure
substances (illicit drugs), or mixtures of substances
onto inert substrates.
At the time of use, the compounds will be desorbed
by a small amount of solvent, then used in analysis.
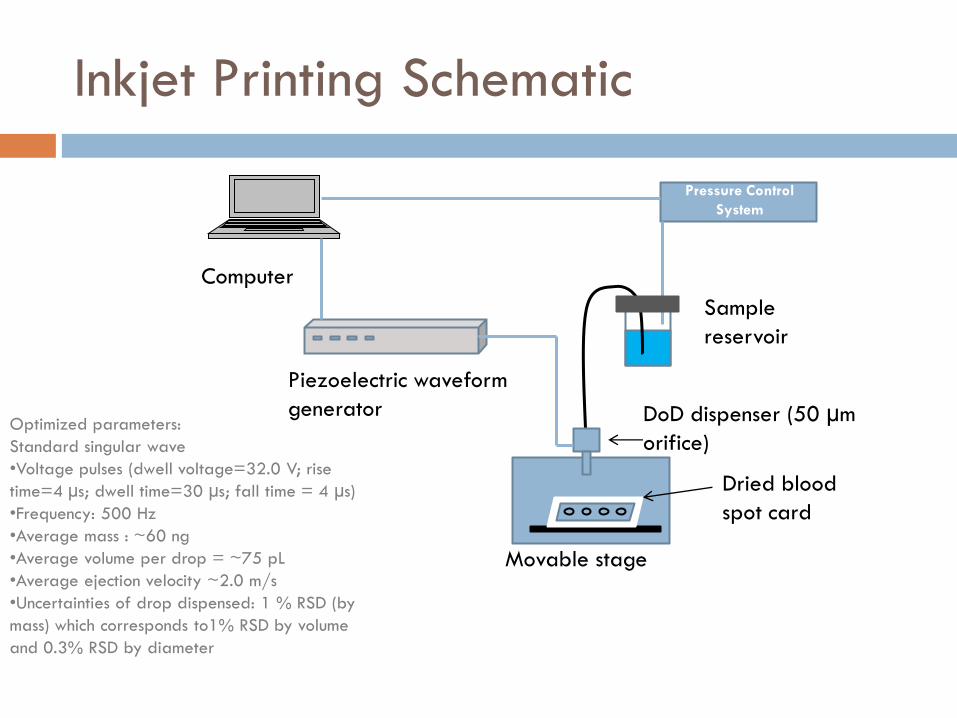
Inkjet Printing Schematic
Pressure Control
System
Movable stage
Dried blood
spot card
DoD dispenser (50 µm
orifice)
Piezoelectric waveform
generator
Computer
Sample
reservoir
Optimized parameters:
Standard singular wave
•Voltage pulses (dwell voltage=32.0 V; rise
time=4 µs; dwell time=30 µs; fall time = 4 µs)
•Frequency: 500 Hz
•Average mass : ~60 ng
•Average volume per drop = ~75 pL
•Average ejection velocity ~2.0 m/s
•Uncertainties of drop dispensed: 1 % RSD (by
mass) which corresponds to1% RSD by volume
and 0.3% RSD by diameter
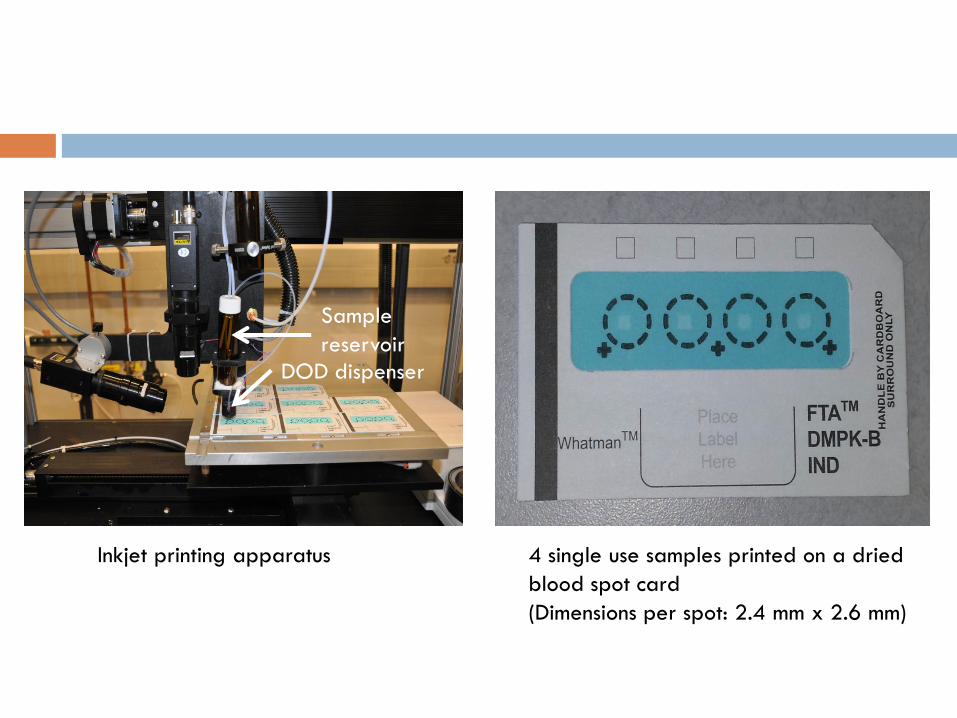
Inkjet printing apparatus 4 single use samples printed on a dried
blood spot card
(Dimensions per spot: 2.4 mm x 2.6 mm)
Sample
reservoir
DOD dispenser
Benefits of Inkjet Printed Standards
Noncontact, high-throughput deposition of precise quantities (nano- to picoliter deposits)5.
Reproducibility of optimized inkjet printers have been reported better than 1% relative standard deviation for day-to-day measurements6.
Dynamic ranges in deposited analyte concentrations (105) can be achieved by varying the number of drops printed5.
Very small amount of compound needed for each printed standard (cost effective).
Single use materials reduce potential contamination from multiple uses of the same batch of material.
Application of Inkjet Printing
Technology
Has been applied to diverse range of applications
Printing of DNA microarrays 7
Dispensing metallic solder for interconnects in the
electronic industry8
Production of RDX (1,3,5-trinitro-13,5 triazcyclohexane)
test materials for trace level explosive analysis to
evaluate ion mobility spectrometers 5.
Factors to consider
1. Identification of suitable substrates and solvents
for printing
2. Determination of quantities of drug compounds
that need to be deposited for extraction and use
with LC-MS and/or GC-MS
3. Efficiency of release of the printed substances
from the substrate
4. Stability of printed compounds on different
substrates and under varying storage conditions
Preliminary work will focus on Methamphetamine (MAMP), a common drug
of abuse, to access feasibility before investigating other substances
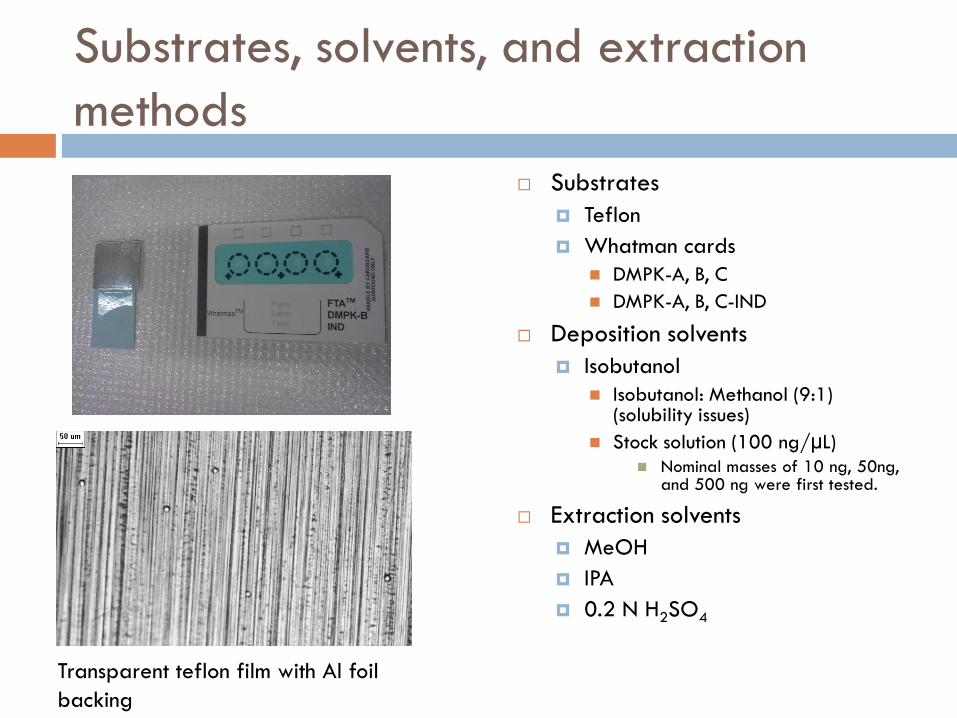
Substrates, solvents, and extraction
methods
Substrates
Teflon
Whatman cards
DMPK-A, B, C
DMPK-A, B, C-IND
Deposition solvents
Isobutanol
Isobutanol: Methanol (9:1) (solubility issues)
Stock solution (100 ng/µL)
Nominal masses of 10 ng, 50ng, and 500 ng were first tested.
Extraction solvents
MeOH
IPA
0.2 N H2SO4
Transparent teflon film with Al foil
backing
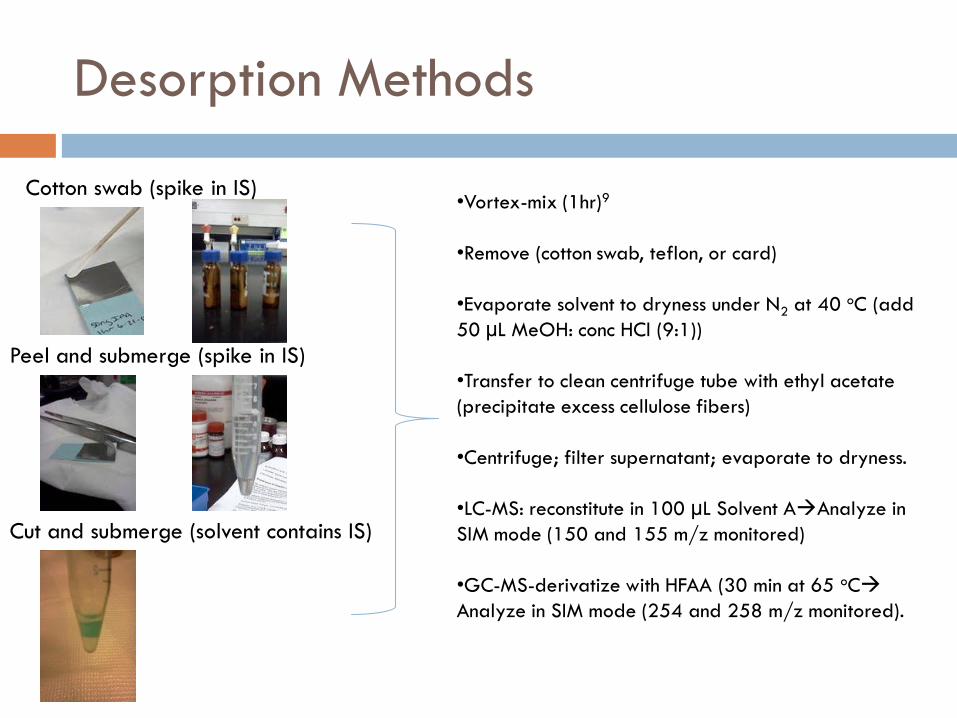
Desorption Methods
•Vortex-mix (1hr)9
•Remove (cotton swab, teflon, or card)
•Evaporate solvent to dryness under N2 at 40 oC (add
50 µL MeOH: conc HCl (9:1))
•Transfer to clean centrifuge tube with ethyl acetate
(precipitate excess cellulose fibers)
•Centrifuge; filter supernatant; evaporate to dryness.
•LC-MS: reconstitute in 100 µL Solvent AAnalyze in
SIM mode (150 and 155 m/z monitored)
•GC-MS-derivatize with HFAA (30 min at 65 oC
Analyze in SIM mode (254 and 258 m/z monitored).
Cotton swab (spike in IS)
Peel and submerge (spike in IS)
Cut and submerge (solvent contains IS)

LC-MS parameters for MAMP analysis
LC/MSD with multimode electrospray ionization in the positive mode.
Column: Phenomenex Luna C18 15 cm x 2.0 mm; 5µm); 20 oC; 0.25 mL/min flow rate
Gradient : Initially 0.1% acetic acid in H2O: MeOH (92:8) for 3 min, ramped to 90:10 at 10 min, then ramped back to 92:8 at 15 min, and equilibrated for 5 min.
MSD Parameters:
Fragmentor: 70 V
Drying gas: 12 L/min; 350 oC
Nebulizer Pressure: 25 psig
Vaporizer temperature: 150 oC
Capillary Voltage: 3500 V
MAMP (150 m/z)
MAMP-d5 (155 m/z)
Reconstructed selected ion chromatograms for
MAMP calibrant (1:1)
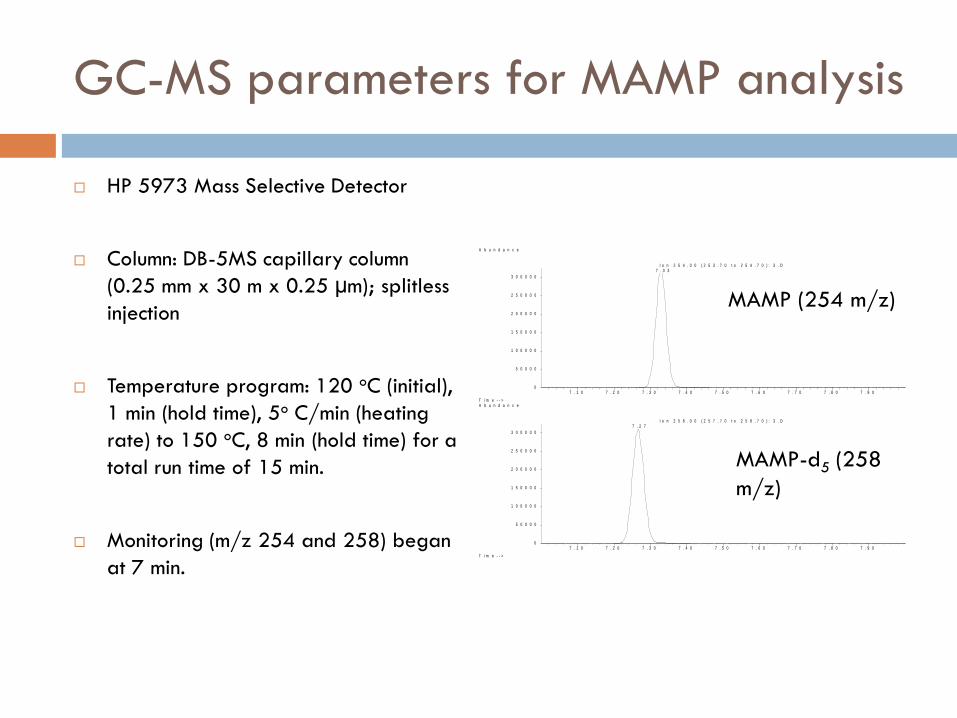
GC-MS parameters for MAMP analysis
HP 5973 Mass Selective Detector
Column: DB-5MS capillary column
(0.25 mm x 30 m x 0.25 µm); splitless
injection
Temperature program: 120 oC (initial),
1 min (hold time), 5o C/min (heating
rate) to 150 oC, 8 min (hold time) for a
total run time of 15 min.
Monitoring (m/z 254 and 258) began
at 7 min.
7 . 1 0 7 . 2 0 7 . 3 0 7 . 4 0 7 . 5 0 7 . 6 0 7 . 7 0 7 . 8 0 7 . 9 00
5 0 0 0 0
1 0 0 0 0 0
1 5 0 0 0 0
2 0 0 0 0 0
2 5 0 0 0 0
3 0 0 0 0 0
T i m e - - >
A b u n d a n c e
I o n 2 5 4 . 0 0 ( 2 5 3 . 7 0 t o 2 5 4 . 7 0 ) : 3 . D 7 . 3 3
7 . 1 0 7 . 2 0 7 . 3 0 7 . 4 0 7 . 5 0 7 . 6 0 7 . 7 0 7 . 8 0 7 . 9 00
5 0 0 0 0
1 0 0 0 0 0
1 5 0 0 0 0
2 0 0 0 0 0
2 5 0 0 0 0
3 0 0 0 0 0
T i m e - - >
A b u n d a n c e
I o n 2 5 8 . 0 0 ( 2 5 7 . 7 0 t o 2 5 8 . 7 0 ) : 3 . D 7 . 2 7
MAMP (254 m/z)
MAMP-d5 (258
m/z)
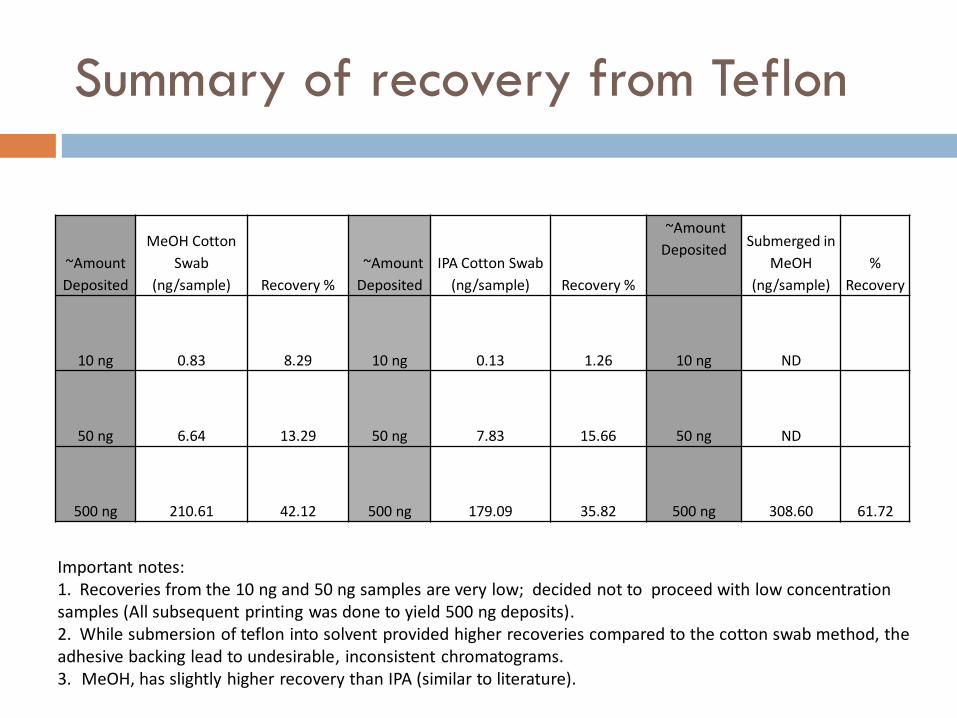
Summary of recovery from Teflon
~Amount
Deposited
MeOH Cotton
Swab
(ng/sample) Recovery %
~Amount
Deposited
IPA Cotton Swab
(ng/sample) Recovery %
~Amount
Deposited
Submerged in
MeOH
(ng/sample)
%
Recovery
10 ng 0.83 8.29 10 ng 0.13 1.26 10 ng ND
50 ng 6.64 13.29 50 ng 7.83 15.66 50 ng ND
500 ng 210.61 42.12 500 ng 179.09 35.82 500 ng 308.60 61.72
Important notes: 1. Recoveries from the 10 ng and 50 ng samples are very low; decided not to proceed with low concentration samples (All subsequent printing was done to yield 500 ng deposits). 2. While submersion of teflon into solvent provided higher recoveries compared to the cotton swab method, the adhesive backing lead to undesirable, inconsistent chromatograms. 3. MeOH, has slightly higher recovery than IPA (similar to literature).
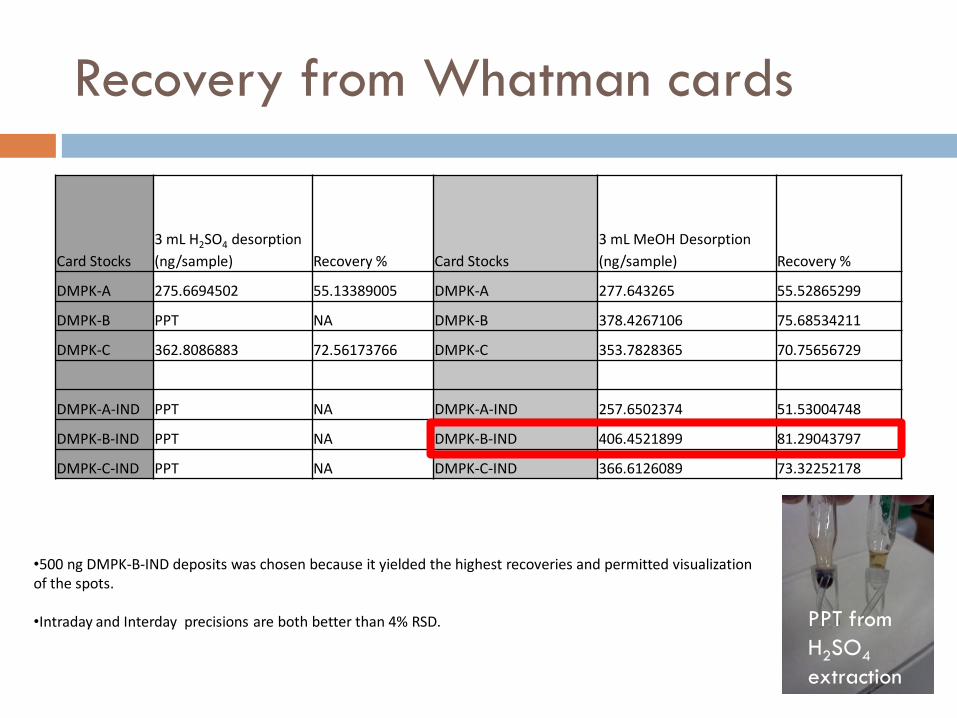
Recovery from Whatman cards
Card Stocks
3 mL H2SO4 desorption
(ng/sample) Recovery % Card Stocks
3 mL MeOH Desorption
(ng/sample) Recovery %
DMPK-A 275.6694502 55.13389005 DMPK-A 277.643265 55.52865299
DMPK-B PPT NA DMPK-B 378.4267106 75.68534211
DMPK-C 362.8086883 72.56173766 DMPK-C 353.7828365 70.75656729
DMPK-A-IND PPT NA DMPK-A-IND 257.6502374 51.53004748
DMPK-B-IND PPT NA DMPK-B-IND 406.4521899 81.29043797
DMPK-C-IND PPT NA DMPK-C-IND 366.6126089 73.32252178
•500 ng DMPK-B-IND deposits was chosen because it yielded the highest recoveries and permitted visualization of the spots.
•Intraday and Interday precisions are both better than 4% RSD. PPT from
H2SO4
extraction
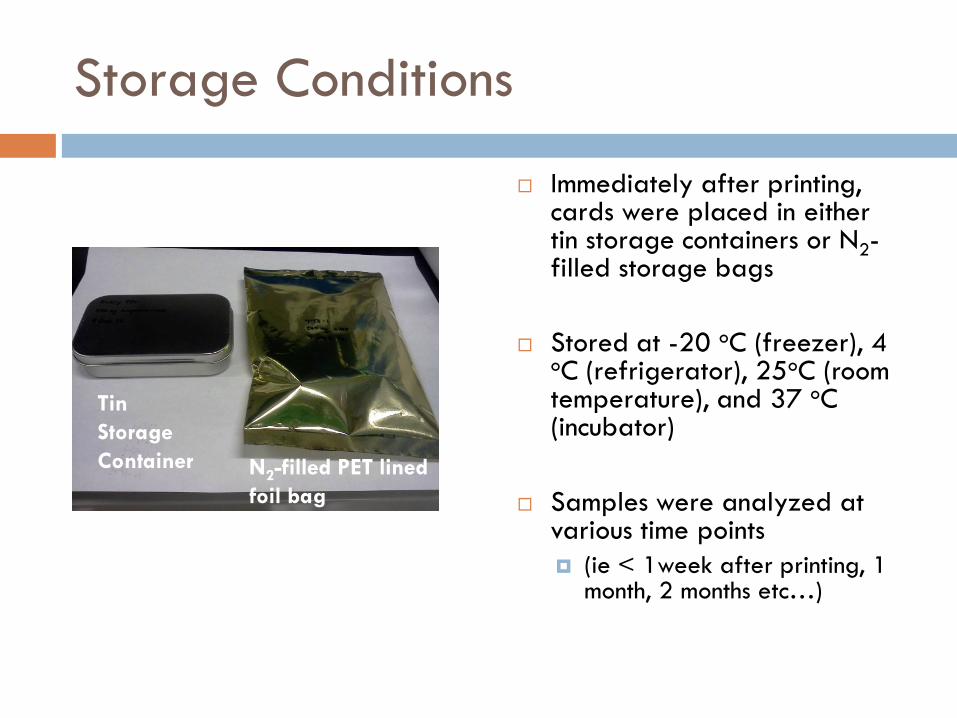
Storage Conditions
Immediately after printing, cards were placed in either tin storage containers or N2-filled storage bags
Stored at -20 oC (freezer), 4 oC (refrigerator), 25oC (room temperature), and 37 oC (incubator)
Samples were analyzed at various time points
(ie < 1week after printing, 1 month, 2 months etc…)
Tin
Storage
Container N2-filled PET lined
foil bag
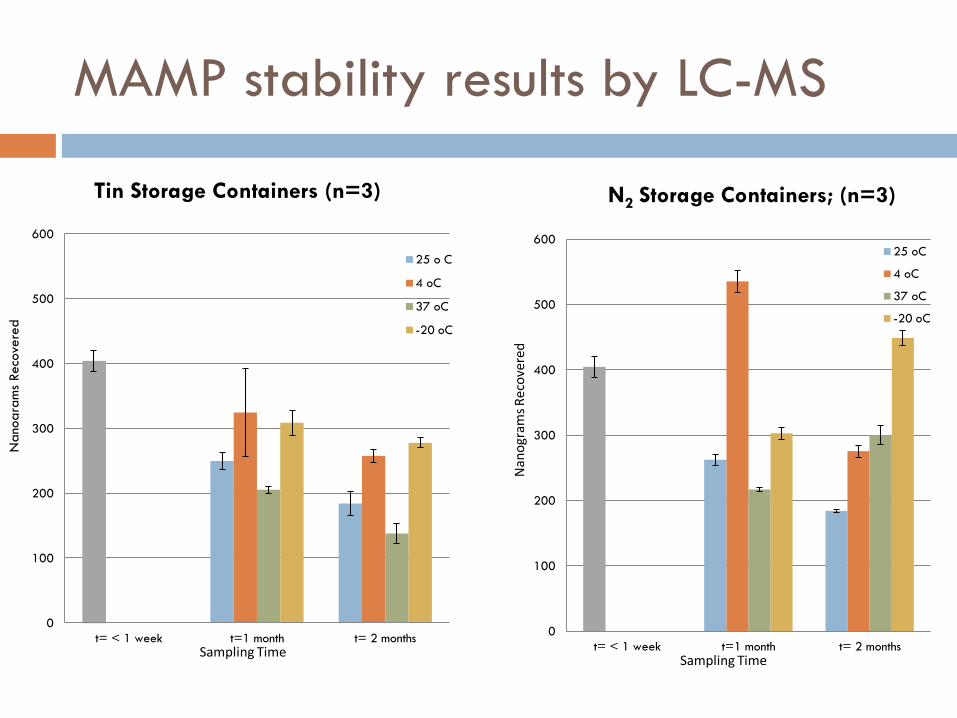
MAMP stability results by LC-MS
0
100
200
300
400
500
600
t= < 1 week t=1 month t= 2 months
Tin Storage Containers (n=3)
25 o C
4 oC
37 oC
-20 oC
Nano
gra
ms
Reco
vere
d
Sampling Time
0
100
200
300
400
500
600
t= < 1 week t=1 month t= 2 months
N2 Storage Containers; (n=3)
25 oC
4 oC
37 oC
-20 oC
Nan
ogr
ams
Rec
ove
red
Sampling Time
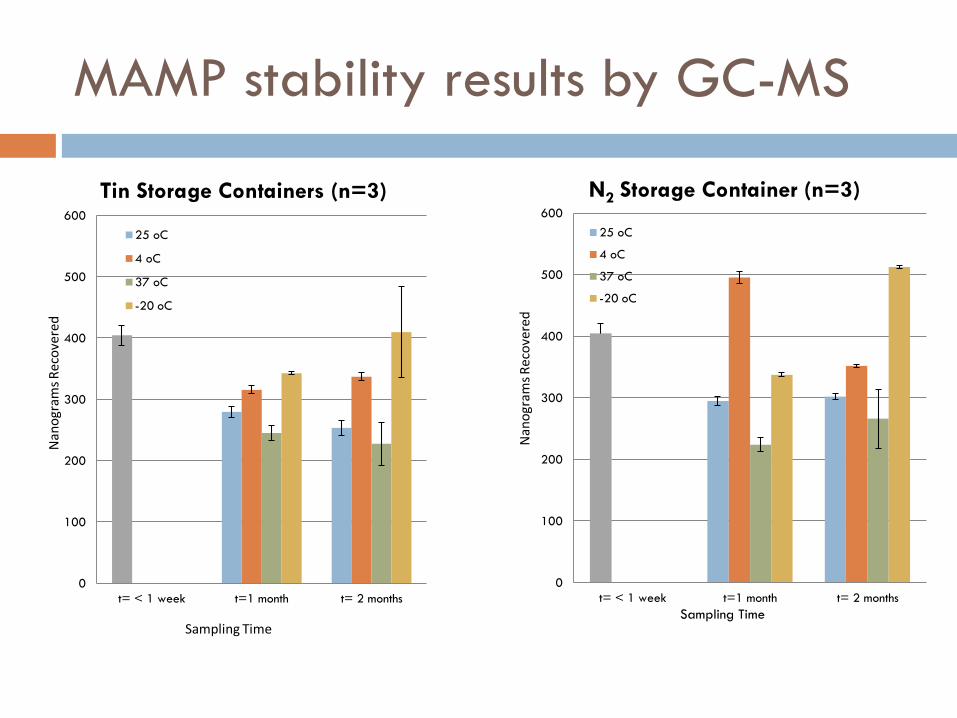
MAMP stability results by GC-MS
0
100
200
300
400
500
600
t= < 1 week t=1 month t= 2 months
Tin Storage Containers (n=3)
25 oC
4 oC
37 oC
-20 oC
Nan
ogr
ams
Rec
ove
red
Sampling Time
0
100
200
300
400
500
600
t= < 1 week t=1 month t= 2 months
N2 Storage Container (n=3)
25 oC
4 oC
37 oC
-20 oC
Nan
ogr
ams
Rec
ove
red
Sampling Time
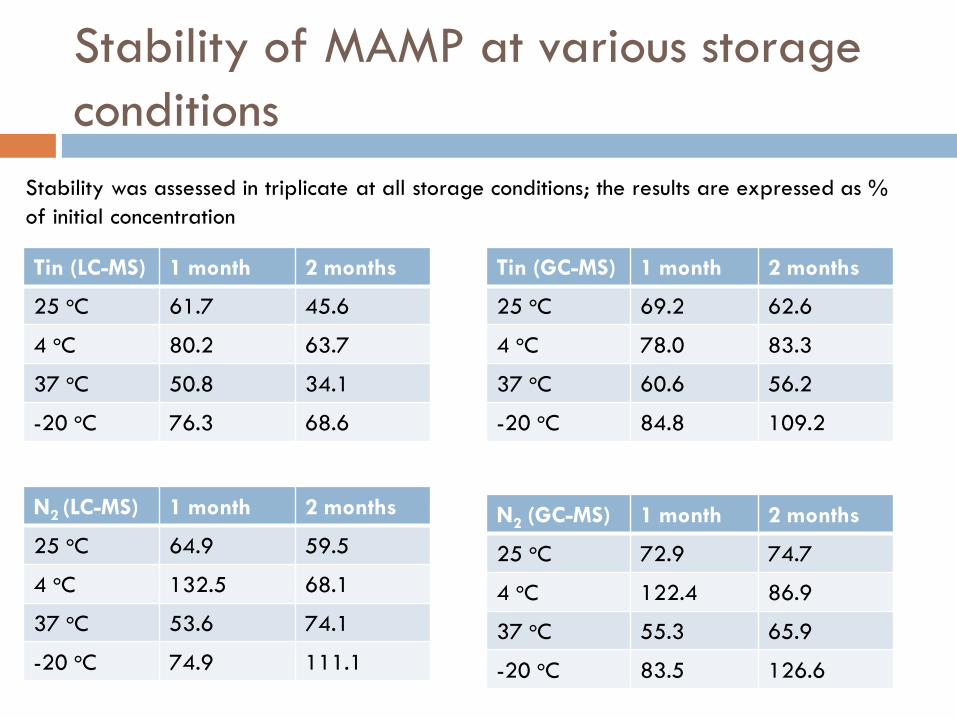
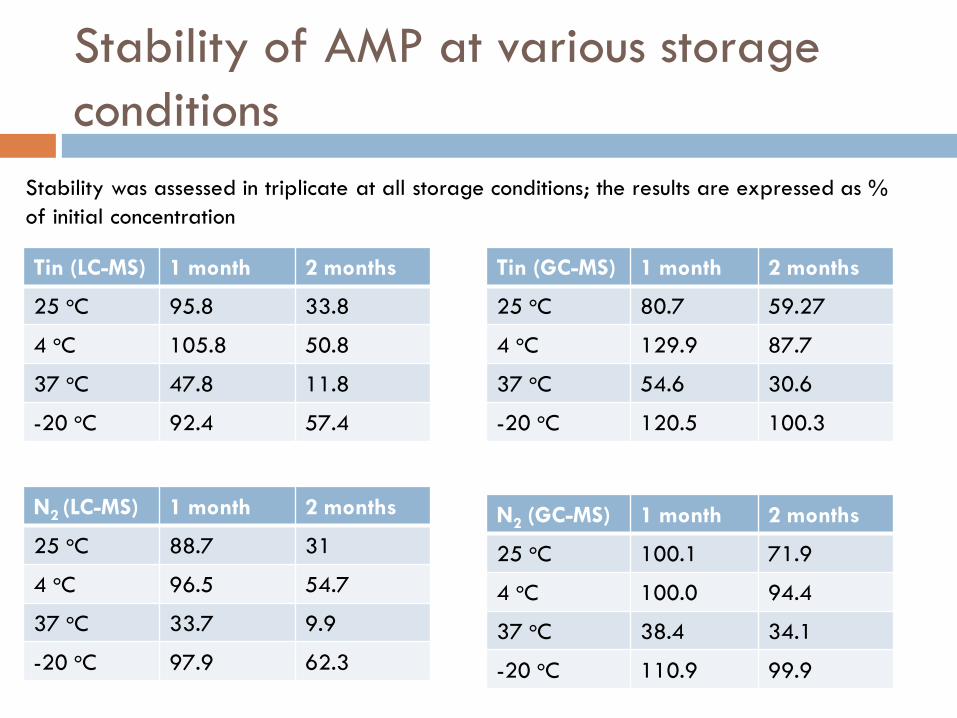
Stability of MAMP at various storage
conditions
Tin (LC-MS) 1 month 2 months
25 oC 61.7 45.6
4 oC 80.2 63.7
37 oC 50.8 34.1
-20 oC 76.3 68.6
Stability was assessed in triplicate at all storage conditions; the results are expressed as %
of initial concentration
N2 (LC-MS) 1 month 2 months
25 oC 64.9 59.5
4 oC 132.5 68.1
37 oC 53.6 74.1
-20 oC 74.9 111.1
Tin (GC-MS) 1 month 2 months
25 oC 69.2 62.6
4 oC 78.0 83.3
37 oC 60.6 56.2
-20 oC 84.8 109.2
N2 (GC-MS) 1 month 2 months
25 oC 72.9 74.7
4 oC 122.4 86.9
37 oC 55.3 65.9
-20 oC 83.5 126.6
MAMP stability discussion
Appears that storage at 4oC and -20oC mitigates the degree of degradation of MAMP on the DMPK-B-IND cards.
Reduction trend similar to Saussereau et. al. report that observed~50-59% (4 oC) and ~85-87% (-20oC) of MAMP remained in dried blood spots on filter paper after 6 months compared to the initial measurement10.
The data is too preliminary to determine if there is benefit to sealing in the N2-filled storage bag.
Sample analysis will continue to determine if a more definitive trend exists.
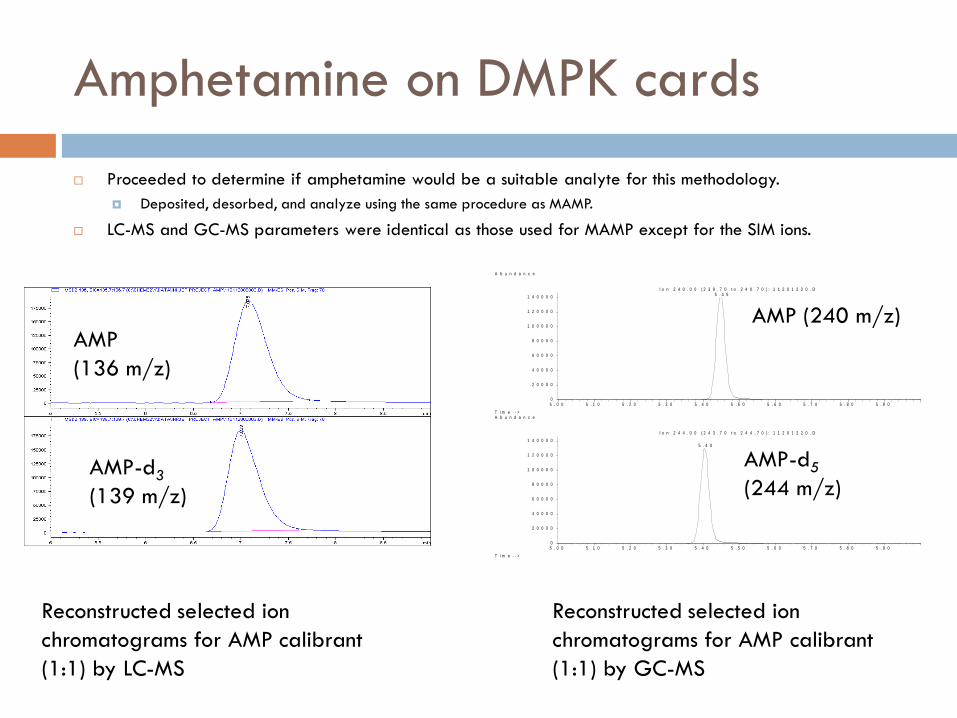
Amphetamine on DMPK cards
Proceeded to determine if amphetamine would be a suitable analyte for this methodology.
Deposited, desorbed, and analyze using the same procedure as MAMP.
LC-MS and GC-MS parameters were identical as those used for MAMP except for the SIM ions.
Reconstructed selected ion
chromatograms for AMP calibrant
(1:1) by LC-MS
AMP-d3
(139 m/z)
AMP
(136 m/z)
5 . 0 0 5 . 1 0 5 . 2 0 5 . 3 0 5 . 4 0 5 . 5 0 5 . 6 0 5 . 7 0 5 . 8 0 5 . 9 00
2 0 0 0 0
4 0 0 0 0
6 0 0 0 0
8 0 0 0 0
1 0 0 0 0 0
1 2 0 0 0 0
1 4 0 0 0 0
T i m e - - >
A b u n d a n c e
I o n 2 4 0 . 0 0 ( 2 3 9 . 7 0 t o 2 4 0 . 7 0 ) : 1 1 2 0 1 2 2 0 . D 5 . 4 5
5 . 0 0 5 . 1 0 5 . 2 0 5 . 3 0 5 . 4 0 5 . 5 0 5 . 6 0 5 . 7 0 5 . 8 0 5 . 9 00
2 0 0 0 0
4 0 0 0 0
6 0 0 0 0
8 0 0 0 0
1 0 0 0 0 0
1 2 0 0 0 0
1 4 0 0 0 0
T i m e - - >
A b u n d a n c e
I o n 2 4 4 . 0 0 ( 2 4 3 . 7 0 t o 2 4 4 . 7 0 ) : 1 1 2 0 1 2 2 0 . D
5 . 4 0
Reconstructed selected ion
chromatograms for AMP calibrant
(1:1) by GC-MS
AMP (240 m/z)
AMP-d5
(244 m/z)
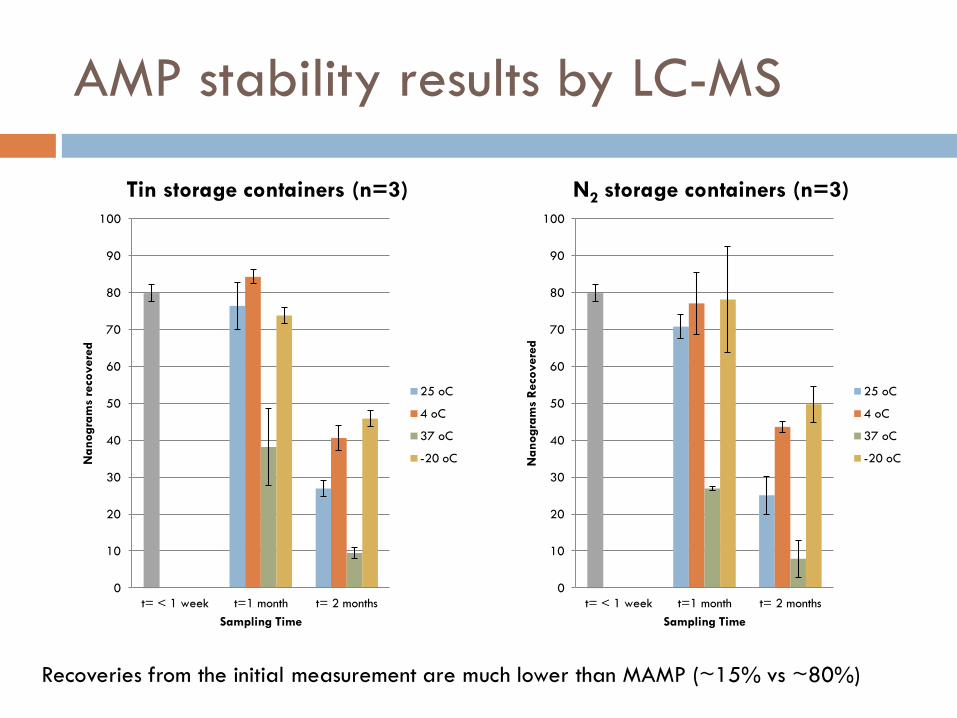
AMP stability results by LC-MS
0
10
20
30
40
50
60
70
80
90
100
t= < 1 week t=1 month t= 2 months
Nanogra
ms
reco
vere
d
Sampling Time
Tin storage containers (n=3)
25 oC
4 oC
37 oC
-20 oC
0
10
20
30
40
50
60
70
80
90
100
t= < 1 week t=1 month t= 2 months
Nanogra
ms
Reco
vere
d
Sampling Time
N2 storage containers (n=3)
25 oC
4 oC
37 oC
-20 oC
Recoveries from the initial measurement are much lower than MAMP (~15% vs ~80%)
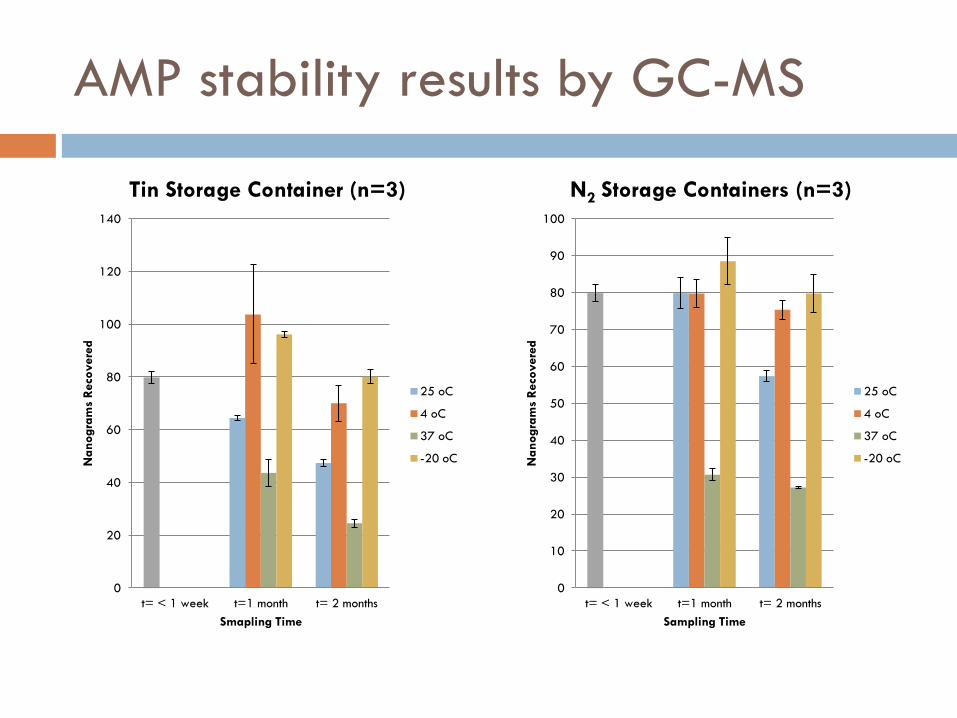
AMP stability results by GC-MS
0
20
40
60
80
100
120
140
t= < 1 week t=1 month t= 2 months
Nanogra
ms
Reco
vere
d
Smapling Time
Tin Storage Container (n=3)
25 oC
4 oC
37 oC
-20 oC
0
10
20
30
40
50
60
70
80
90
100
t= < 1 week t=1 month t= 2 months
Nanogra
ms
Reco
vere
d
Sampling Time
N2 Storage Containers (n=3)
25 oC
4 oC
37 oC
-20 oC
Stability of AMP at various storage
conditions
Tin (LC-MS) 1 month 2 months
25 oC 95.8 33.8
4 oC 105.8 50.8
37 oC 47.8 11.8
-20 oC 92.4 57.4
Stability was assessed in triplicate at all storage conditions; the results are expressed as %
of initial concentration
N2 (LC-MS) 1 month 2 months
25 oC 88.7 31
4 oC 96.5 54.7
37 oC 33.7 9.9
-20 oC 97.9 62.3
Tin (GC-MS) 1 month 2 months
25 oC 80.7 59.27
4 oC 129.9 87.7
37 oC 54.6 30.6
-20 oC 120.5 100.3
N2 (GC-MS) 1 month 2 months
25 oC 100.1 71.9
4 oC 100.0 94.4
37 oC 38.4 34.1
-20 oC 110.9 99.9
AMP stability discussion summary
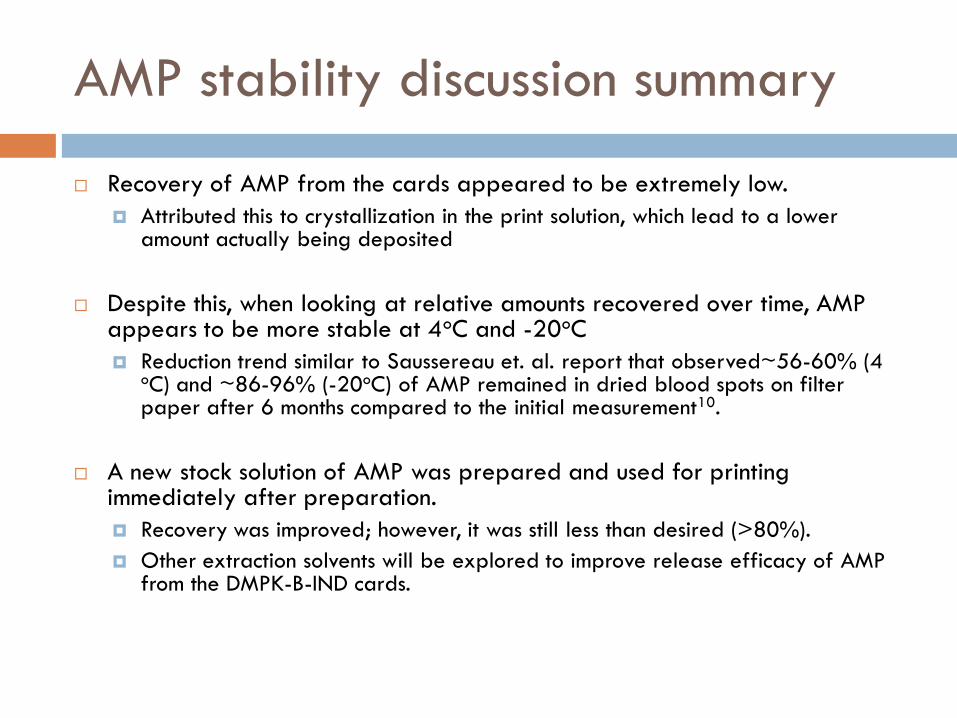
Recovery of AMP from the cards appeared to be extremely low.
Attributed this to crystallization in the print solution, which lead to a lower amount actually being deposited
Despite this, when looking at relative amounts recovered over time, AMP appears to be more stable at 4oC and -20oC
Reduction trend similar to Saussereau et. al. report that observed~56-60% (4 oC) and ~86-96% (-20oC) of AMP remained in dried blood spots on filter paper after 6 months compared to the initial measurement10.
A new stock solution of AMP was prepared and used for printing immediately after preparation.
Recovery was improved; however, it was still less than desired (>80%).
Other extraction solvents will be explored to improve release efficacy of AMP from the DMPK-B-IND cards.
Summary/ Future Work
This work has demonstrated the feasibility of utilizing inkjet printing technologies to produce single use, illicit drug testing material.
Further characterization of the test materials will continue to better understand the stability of these compounds over time as well as efficacy of release from the printing substrates.
In the future, this study will be expanded to include other illicit drugs (ie cocaine) and mixtures of drugs to serve as a foundation for potential NIST reference materials for seized drug analysis.

References
1. Laks, S., Pelander, A., Vuori, E., Ali-Tolppa, E., Sippola, E., and Ojanpera, I., Anal. Chem., 76 (2004) 7375-7379.
2. ENFSI Guidelines on the Use of Reference Materials in Forensic Drug Analysis, available from www. Enfsi.eu
3. Maher, H.M., Awad, T., DeRuiter, J., and Clark, C.R., J. Chromatogr. Sci., 50 (2012)1-9.
4. Lee, E. Microdrop Generation; CRC Press: Boca Raton, FL, 2003.
5. Windsor, E., Najarro, M., Bloom, A., Benner, Jr., Fletcher, R., Lareau, R., and Gillen, G., Anal. Chem., 82 (2010) 8519-9524
6. Verkouteren, R.M. and Verkouteren, J.R. Langmuir 2011, 27, 9644-9653.
7. Theriault, T. P.; Winder, S. C.; Gamble, R. C. DNA Microarrays-A Practical Approach; Schena, M., Ed.; Oxford University Press, Oxford,1999; Chapter 6.
8. Hayes, D. J.; Wallace, D. B.; Cox, W. R. Proc. IMAPS Int. Conf. High Density Packag. MCMs 1999, 242.
9. Procedure for Whatman DMPK Cards found at (http://www.whatman.com/References/Initial%20Protocol%20for%20Whatman%20DMPK%20Cards%2019May09.pdf)
10. Saussereau, E.; Lacroix, C.; Gaulier, J.M.; Goulle, J.P. Journal of Chromatography B, 885-886(2012)1-7
Funding:
National Research Council Postdoctoral Fellowship
NIST Forensics Measurement Challenge 2012