Embed Size (px)
Citation preview
MPP–2014–348
Production of Sterile Neutrino dark matter and the 3.5 keV line
Alexander Merlea,b∗ and Aurel Schneiderc,d†
aMax-Planck-Institut fur Physik (Werner-Heisenberg-Institut),Fohringer Ring 6, 80805 Munchen, Germany
bPhysics and Astronomy, University of Southampton, Southampton, SO17 1BJ, United KingdomcInstitute for Computational Science, University of Zurich,
Winterthurerstrasse 190, CH-8057, Zurich SwitzerlanddDepartment of Physics & Astronomy, University of Sussex, Brighton, BN1 9QH, United Kingdom
(Dated: February 12, 2015)
The recent observation of an X-ray line at an energy of 3.5 keV mainly from galaxy clusters hasinitiated a discussion about whether we may have seen a possible dark matter signal. If confirmed,this signal could stem from a decaying sterile neutrino of a mass of 7.1 keV. Such a particle couldmake up all the dark matter, but it is not clear how it was produced in the early Universe. Inthis letter we show that it is possible to discriminate between different production mechanisms withpresent-day astronomical data. The most stringent constraint comes from the Lyman-α forest andseems to disfavor all but one of the main production mechanisms proposed in the literature, whichis the production via decay of heavy scalar singlets. Pinning down the production mechanism willhelp to decide whether the X-ray signal indeed comprises an indirect detection of dark matter.
PACS numbers:
INTRODUCTION
A dream of particle physicists, cosmologists, and astro-physicists is to discover the true nature of dark matter(DM), which makes up more than 80% of the matterin the Universe [1]. The generic candidate is a WeaklyInteracting Massive Particle (WIMP), i.e. a heavy par-ticle which interacts as weakly as neutrinos. However,the many recent attempts to directly detect such a parti-cle [2] or to produce it at colliders [3], as well as the huntsfor its annihilation products [4], have so far not found aclear indication. In this situation, the detection of an X-ray line in several galaxy clusters and in the Andromedagalaxy [5, 6] has attracted the attention of the commu-nity. This line, if stemming from DM decay, could be asmoking gun signal for a very different type of DM parti-cle: an extremely weakly interacting (“sterile”) neutrinowith a mass smaller than that of a WIMP by about sevenorders of magnitude. WIMPs are produced by thermalfreeze-out [7] which means that they decouple from theprimordial thermal plasma as soon as the Hubble expan-sion becomes larger than the interaction rate. Sterileneutrinos with keV-masses cannot be produced in thisway because their interactions are too weak. However,even very feebly interacting particles can be gradually
∗[email protected]†[email protected]
produced in the early Universe [8]. For sterile neutri-nos this can be achieved by their tiny admixtures θ toactive neutrinos, the so-called Dodelson-Widrow (DW)mechanism [9], but this is known to produce a too hotspectrum [10, 11], i.e., too fast DM particles. However,active-sterile neutrino transitions could be resonantly en-hanced if the background medium carries a net leptonnumber. This production proposed by Shi and Fuller [12]seems in a better shape when confronted with data [13],and it has been recently advocated to be able to produceDM in agreement with the line signal [14].
What is the status of the 3.5 keV line? Refs. [5, 6]have independently reported evidence in samples by theXMM-Newton and Chandra satellites from nearby clus-ters and the Andromeda galaxy (stating > 4σ signifi-cance for the stacked signal). These findings were criti-cised by Refs. [15, 16], who state that Chandra should seea line signal from the center of the Milky way and thatother chemical lines are able to explain the signal. How-ever, these remarks were again criticised in Refs. [17–20],arguing that the centre of the Milky Way is too noisy fora clear signal. Ref. [18] questions the range of validity ofthe background model assumed in [16]. Finally, Ref. [21]has found no signal in stacked XMM-Newton data fromdwarf galaxies, which they claim should provide a cleansignal, although the constraint provided is not signifi-cantly more stringent than previous ones [22]. Obviouslythe situation is not clear at the moment and more datais required. On the other hand, the technical develop-ment of satellites proceeds slower than one would like, so
arX
iv:1
409.
6311
v2 [
hep-
ph]
11
Feb
2015
2
that we cannot expect to see a very bright signal wherenone had been seen before. Ultimately, we should takethe tentative 3.5 keV line as a motivation to scrutinizeboth the signal and its implications – the latter we willdo here.
With the signal taken seriously, to find out whetherDM decay causes it, non-standard production mecha-nisms must be tested. If the sterile neutrino was chargedbeyond the SM gauge group [see 23, for a review ofseveral such settings], freeze-out may be revived if asignificant amount of entropy is produced to dilute theabundance [24], but this is strongly constrained by BigBang Nucleosynthesis [25]. However, there is anotherproduction mechanism which is in a better shape, usinga scalar that decays into sterile neutrinos: S → νsνs.This scalar could be the inflaton [26] or a general singletS that is thermally produced in the early Universeby either freeze-out [27] or freeze-in [28]. Ultimatelythe production mechanism has an impact on the DMvelocity profile and thus on structure formation.
In this letter we present a snapshot of an extensivestudy to be available soon [29]. We show that, contraryto common believe, sterile neutrino production by scalardecays seems to be in better agreement with data thanShi-Fuller production, in particular when looking at theLyman-α (Ly-α) bound. Knowing which mechanisms fitthe data will be of uttermost importance when aiming atidentifying whether DM decay could be behind the X-raysignal.
DARK MATTER PRODUCTION FROM DECAYSOF SCALAR SINGLETS
Just as the fermions in the SM obtain their masses bythe so-called “Yukawa” couplings to the Higgs scalar fieldH, sterile neutrinos νs could couple to a singlet scalarfield S like y
2Sνcsνs + h.c. If S settles at its vacuum ex-pectation value vS = 〈S〉, this leads to a sterile neutrinomass ms = yvS similarly to the ordinary Higgs mecha-nism. However, the scalar field S is also allowed by allsymmetries to couple to the SM Higgs field via a “portal”H†HS2. This coupling could produce sizeable amountsof S particles (i.e., the physical components of S) whichwill decay with strength y into two sterile neutrinos. Thismechanism can lead to efficient DM production.
Because the S particles only decay efficiently once theyare non-relativistic, they do not contribute to the DMmomentum distribution. Only their abundance is impor-tant for the DM abundance, since every scalar singletdecays in exactly two sterile neutrinos.
The momentum distribution of a decay produced ster-ile neutrino with adjacent DW production is [30–32],
f(p) =βSD
(p/TSD)exp
(−p2/T 2
SD
)+
βDW
exp(p/TDW) + 1, (1)
10-1 100 101
x = p/T
10-6
10-5
10-4
10-3
10-2
x2
f(x)
X-ray line: ms=7.1keV, Θ=6.8e-11
SD Prod (ms=7.1keV, Θ=6.8e-11)
Res Prod (ms=7.1keV, Θ=6.8e-11)
NonRes Prod (ms=7.1keV, Θ=4e-10)
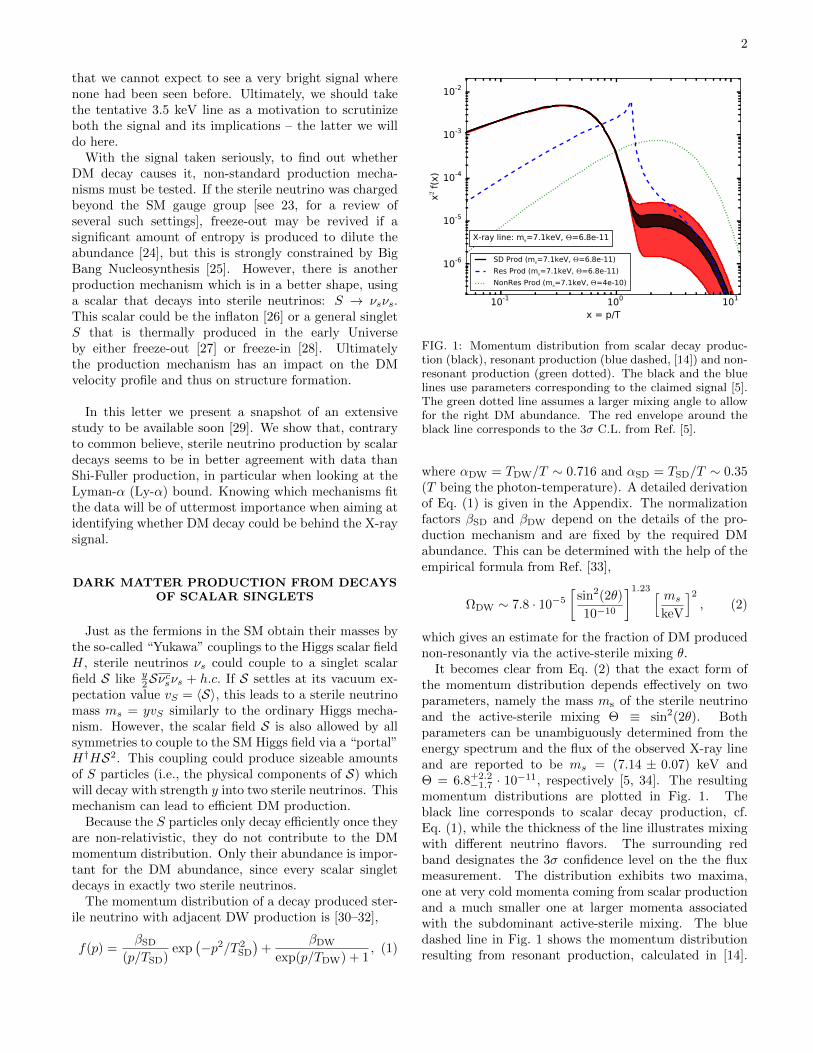
FIG. 1: Momentum distribution from scalar decay produc-tion (black), resonant production (blue dashed, [14]) and non-resonant production (green dotted). The black and the bluelines use parameters corresponding to the claimed signal [5].The green dotted line assumes a larger mixing angle to allowfor the right DM abundance. The red envelope around theblack line corresponds to the 3σ C.L. from Ref. [5].
where αDW = TDW/T ∼ 0.716 and αSD = TSD/T ∼ 0.35(T being the photon-temperature). A detailed derivationof Eq. (1) is given in the Appendix. The normalizationfactors βSD and βDW depend on the details of the pro-duction mechanism and are fixed by the required DMabundance. This can be determined with the help of theempirical formula from Ref. [33],
ΩDW ∼ 7.8 · 10−5
[sin2(2θ)
10−10
]1.23 [ ms
keV
]2, (2)
which gives an estimate for the fraction of DM producednon-resonantly via the active-sterile mixing θ.
It becomes clear from Eq. (2) that the exact form ofthe momentum distribution depends effectively on twoparameters, namely the mass ms of the sterile neutrinoand the active-sterile mixing Θ ≡ sin2(2θ). Bothparameters can be unambiguously determined from theenergy spectrum and the flux of the observed X-ray lineand are reported to be ms = (7.14 ± 0.07) keV andΘ = 6.8+2.2
−1.7 · 10−11, respectively [5, 34]. The resultingmomentum distributions are plotted in Fig. 1. Theblack line corresponds to scalar decay production, cf.Eq. (1), while the thickness of the line illustrates mixingwith different neutrino flavors. The surrounding redband designates the 3σ confidence level on the the fluxmeasurement. The distribution exhibits two maxima,one at very cold momenta coming from scalar productionand a much smaller one at larger momenta associatedwith the subdominant active-sterile mixing. The bluedashed line in Fig. 1 shows the momentum distributionresulting from resonant production, calculated in [14].

3
It assumes a lepton number of L = 4.6 · 10−4 and has acharacteristic spike at low momenta due to the resonancein the active-sterile mixing. The green dotted line inFig. 1 illustrates the standard non-resonant productionbased on the DW mechanism [9] as sole source ofDM. The X-ray line measurement trivially excludesthis mechanism, since non-resonantly produced sterileneutrinos would require a considerably larger mixingangle to make up for all of the DM in the Universe(and they would be too hot). We nevertheless plot thenon-resonant case as reference, however, with a mixingangle Θ = 4 ·10−10 to obtain the correct DM abundance.
COSMOLOGICAL PERTURBATIONS
DM particles with a mass in the keV-range are usu-ally categorized as warm DM (WDM) candidates becausethey generate an important amount of free streaming,which suppresses perturbations at dwarf galaxy scales.The free-streaming length (λfs) does however not onlydepend on the particle mass but also on the average par-ticle momentum, i.e. λfs ∼ 〈q〉/ms. Since the averagemomentum of scalar-decay produced sterile neutrinos iscomparatively small, the effect of free-streaming is ex-pected to be reduced in comparison to production viaactive-sterile mixing. It is therefore important to prop-erly calculate the free-streaming effect in order to see howstrongly scalar decay sterile neutrinos suppress the col-lapse of dwarf galaxies and whether they act more likewarm or cold DM (CDM) [35].
We use the numerical Boltzmann solver CLASS [36] tocompute matter perturbations for the DM scenarios in-troduced above. The suppression of small structures withrespect to pure CDM is shown in Fig. 2, where we plotthe ratio of the transfer functions (i.e., the square-root ofthe linear power-spectrum T/TCDM =
√P/PCDM). The
black line with red envelope corresponds to the scalardecay momentum distribution, in agreement with themeasured X-ray line and 3σ errors [5]. The blue dashed(green dotted) lines represent (non-)resonant production– the former is obtained from Ref. [14]. The gray shadedregion illustrates the bound on the free-streaming fromLy-α data [37, 38].
The transfer functions plotted in Fig. 2 all stem fromsterile neutrinos with the exact same mass. The factthat they exhibit very different suppression scales illus-trates the strong effect the momentum distribution, andthus the production mechanism, has on particle free-streaming. DM candidates in the keV mass range caneither act as cold, warm, or hot DM, depending on theiraverage momentum and their distribution. For this rea-son it is crucial to know the details of particle productionto constrain sterile neutrino DM.
Fig. 2 clearly illustrates the power of the Ly-α method
101 102
k [h/Mpc]
0.2
0.4
0.6
0.8
1.0
T/T
CD
M
Lyman-α excluded (Viel et al 2013)
X-ray line: ms=7.1keV, Θ=6.8e-11
SD Prod (ms=7.1keV, Θ=6.8e-11)
Res Prod (ms=7.1keV, Θ=6.8e-11)
NonRes Prod (ms=7.1keV, Θ=4e-10)
FIG. 2: Ratios of the transfer functions (i.e. square-root ra-
tios of power spectra, T/TCDM =√P/PCDM) from scalar
decay production (black, with red-shaded region, correspond-ing to the 90% C.L.), resonant production [14] (blue dashed),and non-resonant production (green dotted). The gray regionrepresents the range of scales disfavored by Ly-α [37].
to discriminate different DM scenarios. The non-resonantDW production of sterile neutrinos can be ruled out athigh significance [39]. More surprising is the fact that theresonant production mechanism seems to be in tensionwith the Ly-α data, too, while the scalar decay produc-tion mechanism is perfectly consistent. The tension is atthe 2.5σ level and hence not strong enough to excludethe resonant scenario as the driving production mecha-nism. Moreover, there could be sources of error in bothdata and theory that have to be clarified before drawingany final conclusions. For example, changes in the tem-perature evolution of the plasma could influence resonantproduction, or some previously unknown feedback effectscould affect the inter-galactic medium (IGM) and there-fore the Ly-α analysis [40]. Another potential sourceof uncertainty is the X-ray flux measurement. Recentconstraints from Ref. [22] clearly disfavor mixing anglesabove Θ = 5 · 10−11 and taking these more stringentlimits into account increases the tension between reso-nant production and Ly-α data even further (cf. Fig. 2in Ref. [14]).
Despite these potential systematics, it is encouragingthat present-day astronomical data can start to discrim-inate between different production mechanism of ster-ile neutrino DM. Future weak lensing surveys, such asEUCLID, are expected to provide robust constraints andyield an independent check of the Lyman-α results [41],which would form a solid basis to discriminate the knownmechanisms.

4
HALO FORMATION
Understanding the formation of DM haloes – the build-ing blocks of structure formation and main components ofevery galaxy – is crucial to distinguish different DM sce-narios with astronomical data. Unfortunately, the small-est and most relevant scales are dominated by complexnonlinear physics of both gravitational and hydrodynam-ical origin. The modeling of the hydrodynamical effectsis particularly cumbersome because it depends on var-ious feedback mechanisms that are poorly understoodand tend to suppress luminous sources, mimicking theexpected suppression by WDM.
It has been known for a long time that dwarf galaxynumber counts and internal kinematics are in conflictwith predictions from N -body simulations in the stan-dard ΛCDM scenario [42], i.e., the cosmological standardmodel including Dark Energy and cold DM. Suggestionsto solve these small scale problems are numerous andgo from invoking a more realistic treatment of baryonicphysics [43] to postulating alternative DM scenarios [44].
Studying small scale structure formation of sterile neu-trino DM in detail would therefore be very desirable.This would however imply running extensive numericalsimulations and lies beyond the scope of this work. Itis nevertheless possible to gain some insight into nonlin-ear clustering by applying an extended Press-Schechter(EPS) approach [45], which approximates structure for-mation by combining linear growth with idealized ellip-soidal collapse. Standard EPS models are designed forΛCDM cosmologies and it turns out that they completelyfail in the presence of suppressed power spectra. Wetherefore use a modified EPS approach constructed tocope with arbitrarily shaped power spectra and testedfor warm and mixed DM cosmologies [46]. In this ap-proach the halo mass function (i.e. the number densityof haloes per logarithmic mass bin) can be written as
dn
d lnM=
ρ
Mf(ν)
1
12π2σ2(R)
P (1/R)
R3
with σ(R) =
∫dk3
(2π)3P (k) ΘH(1− kR), (3)
where ΘH(x) is the Heaviside step-function and f(ν) =A√
2ν/π(1+ν−p)e−ν/2 is the ‘first-crossing distribution’with ν = (1.686/σ)2, A = 0.322, and p = 0.3. The massand length scales are connected by the relation M =4πρ(cR)3/3, where c = 2.5. A detailed description of theprocedure can be found in Refs. [46].
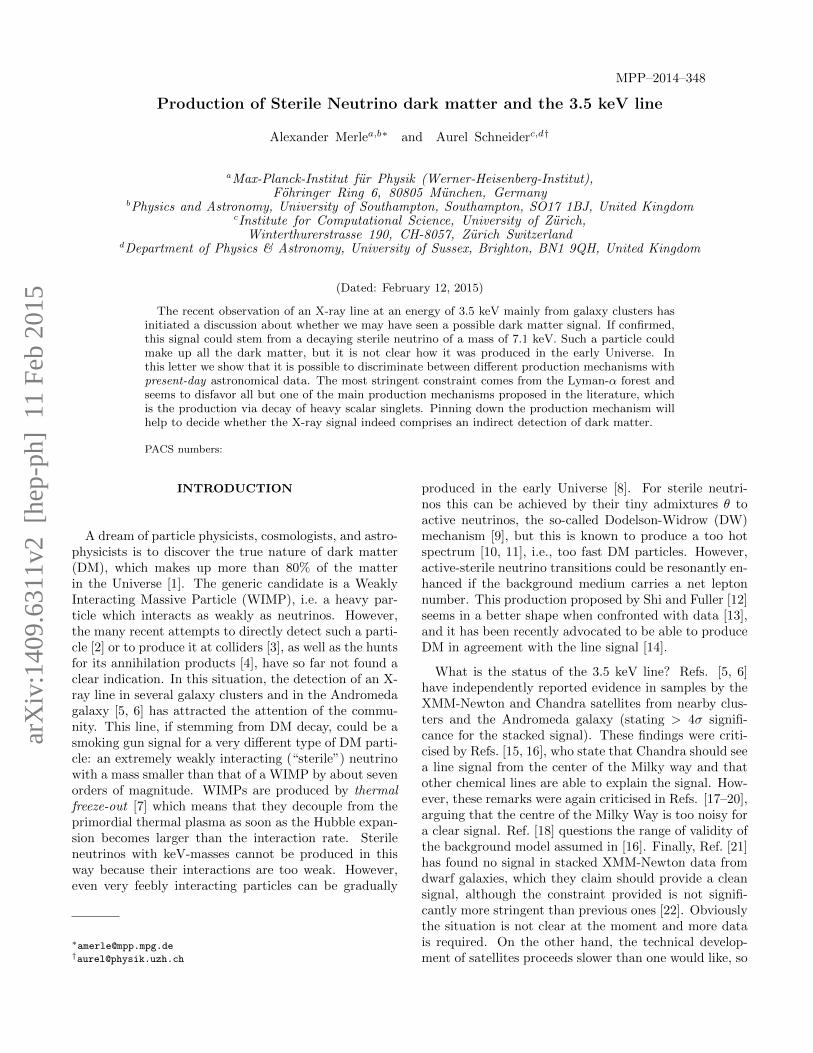
In Fig. 3 we plot the halo mass function based on thetransfer functions from Fig. 2, where the black line (withred band) corresponds to scalar decay production, theblue dashed line to resonant production, and the greendotted line to the standard non-resonant production. Forcomparison, the CDM halo mass function is given by thedashed black line and the relevant dwarf galaxy scales
107 108 109 1010
M [M¯/h]
10-1
100
101
102
dn/d
lnM
[M
pc/
h]−
3
Dwarf Galaxies
X-ray line: ms=7.1keV, Θ=6.8e-11
CDM
SD Prod (ms=7.1keV, Θ=6.8e-11)
Res Prod (ms=7.1keV, Θ=6.8e-11)
NonRes Prod (ms=7.1keV, Θ=4e-10)
FIG. 3: Halo mass function for WDM from scalar decayproduction (black, with red-shaded region corresponding tothe 3σ confidence level), resonant production (blue dashed),and non-resonant production (green dotted). The CDM massfunction is given for reference (black dashed line). The grayregion illustrates the typical range of scales of dwarf galaxies.
are highlighted in gray.This figure shows that the halo mass function of scalar
decay produced DM is close to the CDM case at dwarfgalaxy scales. The halo abundance starts to be signif-icantly suppressed below a mass of 5 × 10⁷M. Sincehaloes of this mass range are not able to form stars (theirgravitational potentials are not deep enough to allow ef-ficient cooling of the gas), the scalar decay scenario isexpected to behave very similarly to CDM on astronom-ically relevant scales.
The situation is very different for the case of resonantproduction, where haloes below 109M are strongly sup-pressed. While this scenario is in tension with Ly-α data,it is expected to alleviate some of the small scale problemsof CDM structure formation [47]. In the non-resonantscenario, finally, the halo mass function is suppressedin the entire dwarf galaxy range. The suppression is sostrong that this scenario is not only ruled out by the Ly-α forest but also because it predicts far fewer Milky-Waysatellites than observed [48].
CONCLUSIONS
In this letter we have examined the assumption thatthe recently observed X-ray line in galaxy clusters stemsfrom decays of sterile neutrino DM. In order to check thevalidity of such a scenario, it is crucial to understandthe details of sterile neutrino production in the earlyUniverse. We compared the most prominent produc-tion mechanisms and showed that they exhibit consid-erable differences in the growth of perturbations, which

5
can be distinguished even with present-day astronomicalobservations. The Ly-α signal from high-redshift quasarsgives the most stringent constraints and seems to disfavorall but one of the most named sterile neutrino produc-tion mechanisms, namely the production via scalar de-cay, while (non-)resonant oscillations of active into sterileneutrinos seem to be in tension with the Ly-α measure-ment. Indeed, production via the decay of heavy scalarsinglets seems in perfect agreement with the data andcould remain as the only valid production mechanism ifthe 3.5 keV line observation is solidified.
Additionally, we showed that sterile neutrinos pro-duced from decays at rest have an unusually cold mo-mentum distribution. As a consequence, they are indis-tinguishable from cold DM at the relevant scales of dwarfgalaxies, and do not contribute towards a solution of thehighly contested small scale problems of ΛCDM.
ACKNOWLEDGEMENTS
We thank Kevork Abazajian for useful discussions.AM acknowledges support by a Marie Curie Intra-European Fellowship within the 7th European Commu-nity Framework Programme FP7-PEOPLE-2011-IEF,contract PIEF-GA-2011-297557, during his time inSouthampton and partial support from the EuropeanUnion FP7 ITN-INVISIBLES (Marie Curie Actions,PITN-GA-2011-289442). AS is supported by the earlyresearcher fellowship of the Swiss Science Foundation(P2ZHP2 151605).
APPENDIX: THE PHASE SPACEDISTRIBUTION FUNCTION
In this Appendix, we derive an analytical expressionfor the momentum (phase space) distribution functionfor a sterile neutrino DM particle νs produced by the2-body decay of a scalar S into a pair of νs, S → νsνs,which motivates the analytical distribution used inEq. (1).
The Boltzmann equation for the distribution functionfνs(q, t) in terms of the comoving momentum q is [49]:
dfνs(q, t)
dt= C[q], (4)
where C[q] is the collision term.The total number of sterile neutrinos, Nνs(t) =
R30nνs(t), within a normalized volume R3
0 can be ex-pressed in terms of the number density (which dependson the distribution function),
Nνs(t) = R30
gνs(2π)3
∫d3qfνs(q, t) ≡
∞∫q=0
dq Nqνs(t), (5)
where gνs = 2. In the last step we have introduced themomentum spectral function
Nqνs(t) =
gνsR30
2π2q2fνs(q, t), (6)
which yields the number of particles with momentum qat time t. The number of particles produced within givenmomentum ([q, q+ dq]) and time ([t′, t′+ dt′]) equals thenumber of DM particles produced per decay, times thenumber of daughter particles produced within the timeinterval under consideration (i.e., the negative decay rateof the parent particles times the length of the time in-terval), times the comoving momentum spectrum g(q) ofthese particles,
dNqνs(t′) = 2×
(−dNS(t′)
dt′dt′)× g(q), (7)
where NS(t′) = NS,ie−(t′−ti)/τ ' NS,ie
−t′/τ is the num-ber of parent particles S as a function of time t′. NS,i isthe initial number of particles at time ti t′, τ is thelifetime of S. In this step we implicitly assume that theparent particles are non-relativistic, since otherwise thelifetime would be modified.
In the rest frame of the parent particle S both ster-ile neutrinos have the center-of-mass momentum pcm =MS/2, where MS is the mass of S. This momentum isredshifted by the cosmological expansion, so that a parti-cle produced at time t′ will at a time t have the physicalmomentum pcma(t′)/a(t). To compute the correspond-ing comoving momentum, we should calculate the phys-ical momentum today, pcma(t′) = q. The correspondingcomoving momentum spectrum for a particle producedat time t′ is
g(q) = δ[q − pcma(t′)]. (8)
In order to transform this result from the particle rest-frame to the comoving cosmological frame, we need toassume a momentum distribution of the parent particles.An approximate way of doing this is to assume that allparent particles move with the the same momentum pS,leading to
g(q) = δ[q − ptota(t′)], ptot =√p2
cm + p2S , (9)
i.e a similar correction than the one used in Ref. [32].Using −dNS(t′)/dt′ ' NS,ie
−t′/τ/τ , we obtain the re-lation
dNqνs(t′)
dt′=
2NS,iτ
e−t′/τδ[q − ptota(t′)]. (10)
which can be integrated over the interval [ti ' 0, t] toobtain the momentum spectral function
Nqνs(t) =
2NS,iτ
∞∫t′=0
dt′ e−t′/τδ[q − ptota(t′)]. (11)

6
Since the DM production happens during the radiationdominated regime, one can make use of a(t) ∝ t1/2 toderive
Nqνs(t) =
4NS,iqt
τp2tota
2(t)× (12)
exp
[− q2
p2tota
2(t)
t
τ
]ΘH [ptota(t)− q].
For the limiting case of ptot = pcm (i.e. vanishing mo-menta of the parent particles), this result exactly coin-cides with what has been obtained in Refs. [31, 32].
The distribution function can now be obtained by com-bining the Eqs. (12) and (6). Let NS,i/R
30 ≡ nS,i be the
initial number density of parent particles S inside thecomoving volume [50]. This allows to write the physicaldistribution function as
fνs(p, t) =β
(p/TSD)e−p
2/T 2SD ΘH
[TSD
a(t)
a(τ)− p], (13)
where we have defined normalization and temperatureparameters:
β ≡ 2π2
gνs
ns,i[a(t)TSD]3
, TSD ≡ ptota(τ)
a(t). (14)
In order to fully recover the first part of Eq. (1) in themain text, we still have to connect TSD to the photontemperature T . This can be achieved by determiningptot and a(τ) in Eq. (14). Since every parent particledecays into 2 sterile neutrinos (i.e. pcm = MS/2) as soonas it becomes non-relativistic (i.e. pS = MS), the totalmomentum at decay is
ptot =√p2
cm + p2S '
√5/4 MS . (15)
Furthermore, entropy conservation (geff(Ta)3 = const.)yields
a(τ)
a(t)=
(geff,0
geff,τ
)1/3T (t)
T (τ)'(geff,0
geff,τ
)1/3T (t)
MS. (16)
Combining Eqs. (14), (15), and (16) with the valuesgeff,τ = 109.5 and geff,0 = 3.36 finally leads to the ra-tio
αSD =TSM
T' 0.35 (17)
used in the main text.
[1] P. A. R. Ade et al. [Planck Collaboration], Astron. As-trophys. (2014) [arXiv:1303.5076 [astro-ph.CO]].
[2] E. Aprile et al. [XENON100 Collaboration], Phys.Rev. Lett. 109, 181301 (2012) [arXiv:1207.5988 [astro-ph.CO]]; D. S. Akerib et al. [LUX Collaboration],
Phys. Rev. Lett. 112, 091303 (2014) [arXiv:1310.8214[astro-ph.CO]]; R. Agnese et al. [SuperCDMSSoudanCollaboration], Phys. Rev. Lett. 112, 041302 (2014)[arXiv:1309.3259 [physics.ins-det]]; S. Archambault,F. Aubin, M. Auger, E. Behnke, B. Beltran, K. Clark,X. Dai and A. Davour et al., Phys. Lett. B 682, 185(2009) [arXiv:0907.0307 [hep-ex]]; R. Agnese et al. [Su-perCDMS Collaboration], Phys. Rev. Lett. 112, 241302(2014) [arXiv:1402.7137 [hep-ex]]; E. Armengaud et al.[EDELWEISS Collaboration], Phys. Rev. D 86, 051701(2012) [arXiv:1207.1815 [astro-ph.CO]]; D. Y. .Akimov,H. M. Araujo, E. J. Barnes, V. A. Belov, A. Bewick,A. A. Burenkov, V. Chepel and A. Currie et al., Phys.Lett. B 709, 14 (2012) [arXiv:1110.4769 [astro-ph.CO]];Z. Ahmed et al. [CDMS-II Collaboration], Science 327,1619 (2010) [arXiv:0912.3592 [astro-ph.CO]]; S. Archam-bault et al. [PICASSO Collaboration], Phys. Lett. B711, 153 (2012) [arXiv:1202.1240 [hep-ex]]; M. Felizardo,T. A. Girard, T. Morlat, A. C. Fernandes, A. R. Ramos,J. G. Marques, A. Kling and J. Puibasset et al., Phys.Rev. Lett. 108, 201302 (2012) [arXiv:1106.3014 [astro-ph.CO]].
[3] G. Aad et al. [ATLAS Collaboration], JHEP 1304,075 (2013) [arXiv:1210.4491 [hep-ex]]; S. Chatrchyanet al. [CMS Collaboration], JHEP 1209, 094 (2012)[arXiv:1206.5663 [hep-ex]]; G. Aad et al. [ATLASCollaboration], Phys. Rev. Lett. 110, 011802 (2013)[arXiv:1209.4625 [hep-ex]]; S. Chatrchyan et al. [CMSCollaboration], Phys. Rev. Lett. 108, 261803 (2012)[arXiv:1204.0821 [hep-ex]].
[4] M. G. Aartsen et al. [IceCube Collaboration], Phys. Rev.D 88, no. 12, 122001 (2013) [arXiv:1307.3473 [astro-ph.HE]]; S. Adrian-Martinez et al. [ANTARES Col-laboration], JCAP 1311, 032 (2013) [arXiv:1302.6516[astro-ph.HE]]; R. Abbasi et al. [IceCube Collaboration],Phys. Rev. D 85, 042002 (2012) [arXiv:1112.1840 [astro-ph.HE]]; M. Aguilar et al. [AMS Collaboration], Phys.Rev. Lett. 110, 141102 (2013).
[5] E. Bulbul, M. Markevitch, A. Foster, R. K. Smith,M. Loewenstein and S. W. Randall, Astrophys. J. 789,13 (2014) [arXiv:1402.2301 [astro-ph.CO]].
[6] A. Boyarsky, O. Ruchayskiy, D. Iakubovskyi andJ. Franse, arXiv:1402.4119 [astro-ph.CO].
[7] B. W. Lee and S. Weinberg, Phys. Rev. Lett. 39, 165(1977); M. Srednicki, R. Watkins and K. A. Olive, Nucl.Phys. B 310, 693 (1988); P. Gondolo and G. Gelmini,Nucl. Phys. B 360, 145 (1991).
[8] J. McDonald, Phys. Rev. Lett. 88, 091304 (2002)[hep-ph/0106249]; L. J. Hall, K. Jedamzik, J. March-Russell and S. M. West, JHEP 1003, 080 (2010)[arXiv:0911.1120 [hep-ph]].
[9] S. Dodelson and L. M. Widrow, Phys. Rev. Lett. 72, 17(1994) [hep-ph/9303287].
[10] A. Boyarsky, J. Lesgourgues, O. Ruchayskiy and M. Viel,JCAP 0905, 012 (2009) [arXiv:0812.0010 [astro-ph]];
[11] L. Canetti, M. Drewes and M. Shaposhnikov, Phys. Rev.Lett. 110, no. 6, 061801 (2013) [arXiv:1204.3902 [hep-ph]].
[12] X. -D. Shi and G. M. Fuller, Phys. Rev. Lett. 82, 2832(1999) [astro-ph/9810076].
[13] L. Canetti, M. Drewes, T. Frossard and M. Sha-poshnikov, Phys. Rev. D 87, no. 9, 093006 (2013)[arXiv:1208.4607 [hep-ph]].
[14] K. N. Abazajian, Phys. Rev. Lett. 112 (2014) 161303

7
[arXiv:1403.0954 [astro-ph.CO]].[15] S. Riemer-Sorensen, arXiv:1405.7943 [astro-ph.CO].[16] T. E. Jeltema and S. Profumo, arXiv:1408.1699 [astro-
ph.HE].[17] M. E. Anderson, E. Churazov and J. N. Bregman,
arXiv:1408.4115 [astro-ph.HE].[18] A. Boyarsky, J. Franse, D. Iakubovskyi and
O. Ruchayskiy, arXiv:1408.2503 [astro-ph.CO].[19] A. Boyarsky, J. Franse, D. Iakubovskyi and
O. Ruchayskiy, arXiv:1408.4388 [astro-ph.CO].[20] E. Bulbul, M. Markevitch, A. R. Foster, R. K. Smith,
M. Loewenstein and S. W. Randall, arXiv:1409.4143[astro-ph.HE].
[21] D. Malyshev, A. Neronov and D. Eckert, arXiv:1408.3531[astro-ph.HE].
[22] S. Horiuchi, P. J. Humphrey, J. Onorbe, K. N. Abazajian,M. Kaplinghat, S. Garrison-Kimmel Phys. Rev. D 89025017 (2014) [arXiv:1311.0282].
[23] A. Merle, Int. J. Mod. Phys. D 22, 1330020 (2013)[arXiv:1302.2625 [hep-ph]].
[24] F. Bezrukov, H. Hettmansperger and M. Lindner, Phys.Rev. D 81, 085032 (2010) [arXiv:0912.4415 [hep-ph]];M. Nemevsek, G. Senjanovic and Y. Zhang, JCAP 1207,006 (2012) [arXiv:1205.0844 [hep-ph]]; S. Khalil andO. Seto, JCAP 0810 (2008) 024 [arXiv:0804.0336 [hep-ph]].
[25] S. F. King and A. Merle, JCAP 1208, 016 (2012)[arXiv:1205.0551 [hep-ph]].
[26] M. Shaposhnikov and I. Tkachev, Phys. Lett. B639 (2006) 414 [hep-ph/0604236]; F. Bezrukov andD. Gorbunov, JHEP 1005, 010 (2010) [arXiv:0912.0390[hep-ph]]; P. S. Bhupal Dev, A. Mazumdar andS. Qutub, Physics 2, 26 (2014) [arXiv:1311.5297 [hep-ph]]; F. Bezrukov and D. Gorbunov, Phys. Lett. B 736,494 (2014) [arXiv:1403.4638 [hep-ph]].
[27] A. Kusenko, Phys. Rev. Lett. 97, 241301 (2006) [hep-ph/0609081]; K. Petraki and A. Kusenko, Phys. Rev. D77, 065014 (2008) [arXiv:0711.4646 [hep-ph]]; A. Abada,G. Arcadi and M. Lucente, arXiv:1406.6556 [hep-ph];M. Frigerio and C. E. Yaguna, arXiv:1409.0659 [hep-ph].
[28] A. Merle, V. Niro and D. Schmidt, JCAP 1403, 028(2014) [arXiv:1306.3996 [hep-ph]]; A. Adulpravitchai andM. A. Schmidt, arXiv:1409.4330 [hep-ph].
[29] A. Merle, S. Schneider, and M. Totzauer, work inprogress.
[30] S. Colombi, S. Dodelson and L. M. Widrow, Astrophys.J. 458, 1 (1996) [astro-ph/9505029].
[31] M. Kaplinghat, Phys. Rev. D 72, 063510 (2005) [astro-ph/0507300].
[32] F. Bezrukov and D. Gorbunov, arXiv:1412.1341 [hep-ph].[33] K. Abazajian, Phys. Rev. D 73, 063506 (2006) [astro-
ph/0511630].[34] For the latter value we have taken the mean between the
1σ ranges of both MOS and PN instruments.[35] K. Petraki, Phys. Rev. D 77, 105004 (2008)
[arXiv:0801.3470 [hep-ph]]; D. Boyanovsky, Phys. Rev.D 78 (2008) 103505 [arXiv:0807.0646 [astro-ph]].
[36] D. Blas, J. Lesgourgues, T. Tram JCAP 1107, 034(2011) [arXiv:1104.2933 [astro-ph.CO]]; J. Lesgourgues,T. Tram JCAP 1109, 032 (2011) [arXiv:1104.2935 [astro-ph.CO]].
[37] M. Viel, G. D. Becker, J. S. Bolton, M. G. Haehnelt Phys.Rev. D. 88, 043502 (2013) [arXiv:1306.2314].
[38] The Ly-α constraint was derived using a renormalized
Fermi-Dirac distribution resulting from non-resonantproduction [9]. Technically, only models with the samedistribution can be compared to this constraint, whileother models would require an independent analysis ofthe nonlinear clustering. In practice, however, all modelswith transfer functions predominantly lying in the grayarea are expected to be excluded by Ly-α, independentof the exact shape of their spectra.
[39] This should not come as a surprise, since the scenario isequally at odds with Dwarf Galaxy observations from theMilky Way [48].
[40] M. Viel, J. Schaye, C. M. Booth MNRAS, 429, 1734V(2012) [arXiv:1207.6567]; Z. Luki?, C. Stark, P. Nu-gent, M. White, A. Meiksin, A. Almgren (2014)[arXiv:1406.6361].
[41] K. Markovic, M. Viel PASA, 32, 6M (2014)[arXiv:1311.5223].
[42] B. Moore et al. Ap. J. 524L, 19M (1999); M. Boylan-Kolchin, J. S. Bullock, M. Kaplinghat MNRAS 422,1203B (2012) [arXiv:1111.2048]; M. G. Walker, J. Pear-rubia Ap. J. 742, 20W (2011) [arXiv:1108.2404];A. Klypin, I. Karachentsev, D. Makarov, O. Na-sonova [arXiv:1405.4523]; E. Papastergis, R. Giovanelli,M. P. Haynes, F. Shankar [arXiv:1407.4665].
[43] T. Sawala, Q. Guo, C. Scannapieco, A. Jenkins, S. WhiteMNRAS 413, 659S (2011) [arXiv:1003.0671]; R. Teyssier,A. Pontzen,Y. Dubois, J. I. Read MNRAS 429., 3068T(2013) [arXiv:1206.4895]; A. M. Brooks, A. Zolotov Ap.J. 786, 87B (2014) [arXiv:1207.2468].
[44] M. R. Lovell, V. Eke, C. S. Frenk, L. Gao, A. Jenk-ins, T. Theuns, J. Wang, S. D. White, A. Bo-yarsky, O. Ruchayskiy MNRAS, 420, 2318L (2012)[arXiv:1104.2929]; M. Vogelsberger, J. Zavala, A. LoebMNRAS, 423, 3740V (2012) [arXiv:1201.5892]; D. An-derhalden, A. Schneider, A. V. Macci, J. Diemand,G. Bertone JCAP, 03, 014A (2013) [arXiv:1212.2967];D. J. E. Marsh, J. Silk MNRAS, 437, 2652M (2014)[arXiv:1307.1705].
[45] W. H. Press, P. Schechter ApJ, 187, 425 (1974);J. R. Bond, S. Cole, G. Efstathiou, N. Kaiser ApJ, 379,440 (1991); R. K. Sheth, G. Tormen MNRAS, 308, 119(1999) [arXiv:astro-ph/9901122].
[46] A. Schneider, R. E. Smith, D. Reed MNRAS. 433,1573S (2013) [arXiv:1303.0839]; A. Schneider (2014)[arXiv:1412.2133].
[47] A. Schneider, D. Anderhalden, A. V. Maccio, J. Die-mand MNRAS, 441L, 6S (2014) [arXiv:1309.5960];M. R. Lovell, C. S. Frenk, V. R. Eke, A. Jenkins, L. Gao,T. Theuns MNRAS 439, 300L (2014) [arXiv:1308.1399].F. Governato, et al. (2014) [arXiv:1407.0022].
[48] E. Polisensky, M. Ricotti MNRAS, 437, 2922P(2014) [arXiv:1310.0430]; R. Kennedy, C. Frenk,S. Cole, A. Benson MNRAS, 442, 2487K (2014)[arXiv:1310.7739].
[49] J. Bernstein, Kinetic Theory In The Expanding Universe,University Press, Cambridge, USA, 1988.
[50] The only change in the number density nS(t) of S withinthe comoving volume comes from decays, since the ex-pansion is mapped out. Because each S produces ex-actly two νs, the final comoving number density of ster-ile neutrino is twice that of the initial parent particles,nνs(t → ∞) = 2nS,i, as soon as the production of S isfinished.