Embed Size (px)
Citation preview

Accepted Manuscript
Production OF volatile fatty acids from wastewater screenings using A leach-bedreactor
Luz Stella Cadavid-Rodríguez , Nigel J. Horan
PII: S0043-1354(14)00343-1
DOI: 10.1016/j.watres.2014.05.001
Reference: WR 10652
To appear in: Water Research
Received Date: 16 October 2013
Revised Date: 18 March 2014
Accepted Date: 1 May 2014
Please cite this article as: Cadavid-Rodríguez, L.S., Horan, N.J., Production OF volatile fatty acidsfrom wastewater screenings using A leach-bed reactor, Water Research (2014), doi: 10.1016/j.watres.2014.05.001.
This is a PDF file of an unedited manuscript that has been accepted for publication. As a service toour customers we are providing this early version of the manuscript. The manuscript will undergocopyediting, typesetting, and review of the resulting proof before it is published in its final form. Pleasenote that during the production process errors may be discovered which could affect the content, and alllegal disclaimers that apply to the journal pertain.
MANUSCRIP
T
ACCEPTED
ACCEPTED MANUSCRIPT
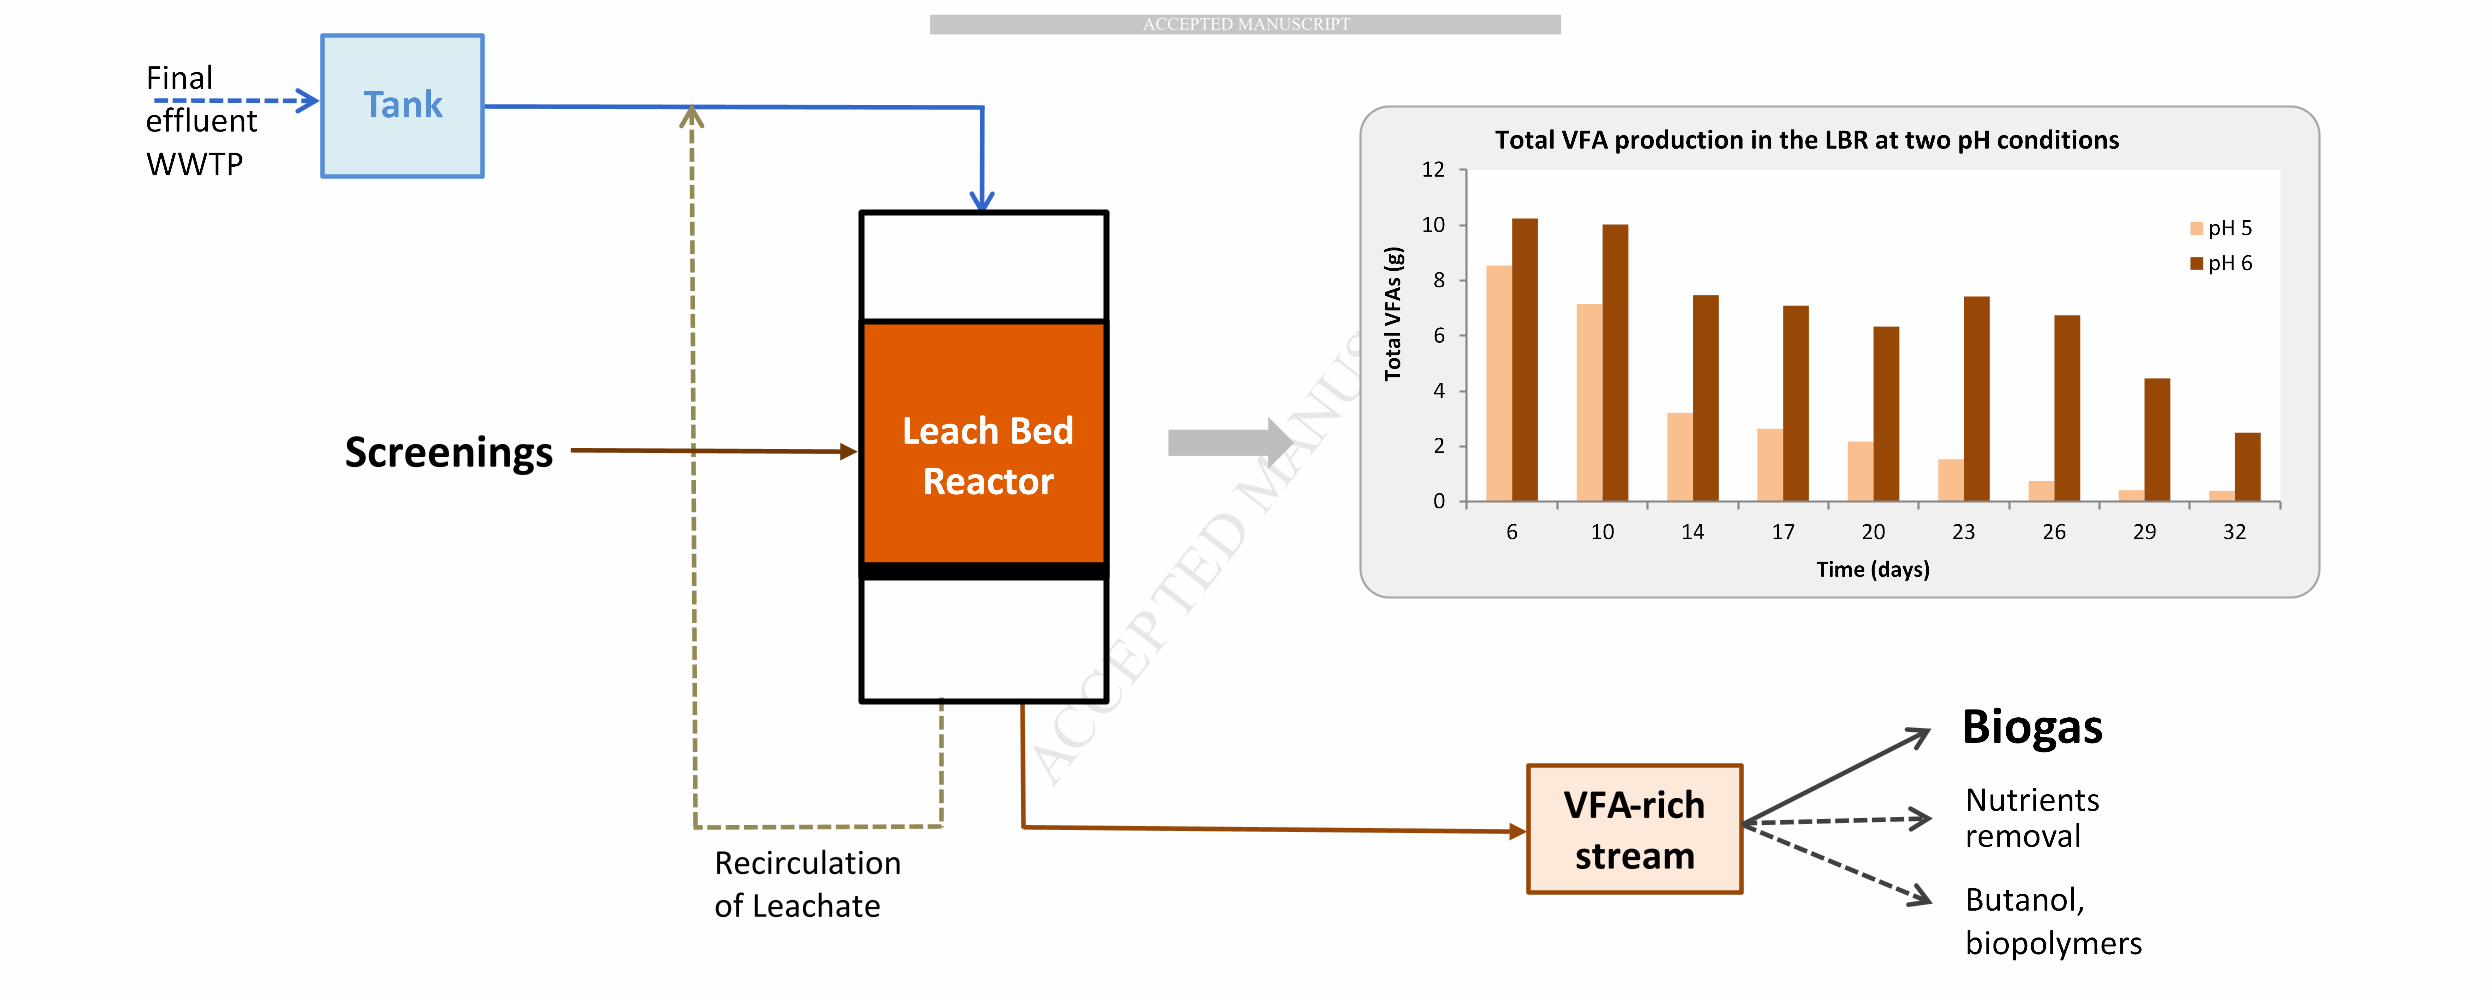
Recirculation of Leachate
Screenings
VFA-rich stream

MANUSCRIP
T
ACCEPTED
ACCEPTED MANUSCRIPT1
PRODUCTION OF VOLATILE FATTY ACIDS FROM WASTEWATER 1
SCREENINGS USING A LEACH-BED REACTOR 2
Luz Stella Cadavid-Rodrígueza,1 and Nigel J. Horanb 3
aNational University of Colombia, Engineering Department, Carrera 32 No 12-00 Palmira, Colombia 4 bUniversity of Leeds, School of Civil Engineering, Leeds LS2 9 JT, United kingdom 5 6
Abstract 7
Screenings recovered from the inlet works of wastewater treatment plants were 8
digested without pre-treatment or dilution using a lab-scale, leach-bed reactor. 9
Variations in recirculation ratio of the leachate of 4 and 8 L/Lreactor/day and pH 10
values of 5 and 6 were evaluated in order to determine the optimal operating 11
conditions for maximum total volatile fatty acids (VFA) production. By increasing 12
the recirculation ratio of the leachate from 4 to 8 L/Lreactor/day it was possible 13
to increase VFA production (11%) and soluble COD (17%) and thus generate 14
up to 264 g VFA/kg-dry screenings. These VFA were predominantly acetic acid 15
with some propionic and butyric acid. The optimum pH for VFA production was 16
6.0, when the methanogenic phase was inhibited. Below pH 5.0, acid-17
producing fermentation was inhibited and some alcohols were produced. 18
Ammonia release during the hydrolysis of screenings provided adequate 19
alkalinity; consequently, a digestion process without pH adjustment could be 20
recommended. The leach-bed reactor was able to achieve rapid rates of 21
screenings degradation with the production of valuable end-products that will 22
reduce the carbon footprint associated with current screenings disposal 23
techniques. 24
Keywords: wastewater screenings, anaerobic digestion, acidification, 25
hydrolysis, volatile fatty acids, pH 26
1 Corresponding author. Tel.: +57 2 2868888 Ext. 35709; fax: +57 2 2868808.
E-mail address: [email protected] (L.S. Cadavid-Rodríguez)

MANUSCRIP
T
ACCEPTED
ACCEPTED MANUSCRIPT2
1. Introduction 27
Screens are used in wastewater treatment plants (WWTP) to remove large 28
materials from the influent and thus protect downstream unit processes. In the 29
UK, 6 mm screens are commonly used prior to primary settlement, but smaller 30
screens as low as 1 mm may be used to protect other, more sensitive unit 31
processes, such as biological aerated filters or membrane bioreactors. The daily 32
production of screenings in the UK is between 488 and 1464 wet-tonnes and 33
the organic fraction is around 90% on a dry basis (Cadavid and Horan, 2012). 34
This material is unpleasant to handle and typically disposed of to landfill. 35
However, due to the high organic content, its GHG potential is high when 36
disposed of via this route. 37
Screenings will readily digest anaerobically with methane yields of around 0.3 38
m3 CH4/kg VSappied (Le Hyaric et al., 2010; Cadavid and Horan, 2012). 39
Nevertheless, given its heterogeneity and high content of sanitary items, it is an 40
unsuitable feedstock for conventional mesophilic anaerobic digestion (MAD), a 41
process commonly used at wastewater treatment plants, where it would cause 42
solids accumulation, stratification and foaming (Le Hyaric et al., 2010). 43
To make anaerobic treatment feasible, an alternative approach would be to 44
utilize an optimised and flexible two-stage process with the first-stage 45
generating a VFA rich stream. This could then be fed to existing on-site MAD 46
assets for methane production or alternatively utilized directly in the wastewater 47
treatment for biological phosphorus or nitrogen removal (Cadavid-Rodríguez 48
and Horan, 2013). A dry process in a leach bed reactor (LBR) appears to offer 49

MANUSCRIP
T
ACCEPTED
ACCEPTED MANUSCRIPT3
an attractive option as the first stage, since that would overcome the operational 50
problems associated with solids and reduce the need for pre-treatment. 51
The LBR has been employed to digest organic materials with a high solids 52
concentration and a large fraction of contaminants (Dogan, et al., 2008). It is 53
operated to optimize the reactions of hydrolysis in which particulate organic 54
matter is hydrolysed to smaller, soluble compounds. These are then reduced to 55
VFA by the reactions of acidogenesis and acetogenesis. The resultant VFA-56
rich liquid stream, largely free from particulate material, can then be passed 57
forward to a more conventional methanogenic reactor for the production of 58
methane. This technique has proven to be effective for the digestion of the 59
Organic Fraction of Municipal Solid Waste (OFMSW) (Chugh et al., 1999; 60
Vieitez et al., 2000), fruit and vegetables waste (Mtz-Viturtia et al., 1995), food 61
waste (Xu et al., 2011), animal manure (Demirer and Chen, 2008), as well as 62
biohydrogen production from food waste (Shin and Youn, 2005). 63
The real challenge for a successful operation of a LBR is to ensure optimum 64
hydrolysis by overcoming the mass transfer limitation which appears to be the 65
true rate-limiting process step (Martin et al., 2003). Hydrolysis is a complex 66
process that is function of pH, type of substrate, nature of the biomass, size of 67
particles and residual concentration of biodegradable matter (Elefsiniotis et al., 68
1996). It is driven by physico-chemical reactions and microbial metabolism 69
where solid-liquid mass transfer plays a key role. One parameter that can be 70
manipulated to increase the solid-liquid mass transfer in the LBR is the 71
recirculation ratio of the leachate. However, there are no clear criteria for 72

MANUSCRIP
T
ACCEPTED
ACCEPTED MANUSCRIPT4
selecting this parameter in the literature and therefore a wide range of values 73
(0.2-14.4 l/lreactor/day) can be found (Table 1). 74
Table 1 Recirculation ratio of leachate in LBR reported in literature 75
Reference Recirculation ratio of leachate (l/lreactor/day)
Cycle
O’Keefe and Chynoweth (2000) Rajeshwari et al. (2001) Babel et al. (2004) Cysneiros et al. (2008) Lehtomaki et al. (2008) Myint and Nirmalakhandan (2009) Nizami et al. (2010) Jagadabhi et al. (2011)
12* 7.2* and 14.4*
4* 0.5* 0.75 4**
1* and 2* 0.2* and 0.4*
continuously continuously
1-hour-on, 5-hours-off continuously
n.r. 30-min-on, 150-min-off
n.r. n.r.
*values calculated from the data reported 76 **l/day 77 78
But in addition, pH has also been reported as one of the major parameters 79
affecting the VFA production in anaerobic acidogenesis. This parameter plays 80
an important role in determining the type of anaerobic fermentation pathway in 81
the acidification process. Specifically, researchers have confirmed that 82
Clostridium sp. shifts its metabolism from the acid-producing to alcohol-83
producing by modifying pH value (Dong et al., 2010), although there are 84
contradictory reports for the optimum pH for acidification. Whereas some 85
authors report it in the range 5.0 to 6.0 (Ghosh, 1991) or even 4.0-5.0 (Chen et 86
al., 2007) when using activated sludge as substrate; others, using pineapple 87
waste (Babel et al., 2004) and kitchen waste (Dong et al., 2010), have found 88
that a pH below 6 is inhibitory for the acidification process and suggested a pH 89
between 6 and 7. It is, therefore, necessary to generate further information 90
about the role of pH on hydrolysis/acidogenesis processes. An LBR has the 91
potential to provide a simple, technological solution to harness the energy 92
potential of screenings and other similar waste types. So it was the aim of this 93
study to investigate the role of the leachate recirculation ratio and operating pH 94
in enhancing the production of VFAs from wastewater screenings and thus 95

MANUSCRIP
T
ACCEPTED
ACCEPTED MANUSCRIPT5
evaluate its potential as a full-scale process option when retrofitted upstream of 96
existing MAD assets. 97
98
2. Materials and methods 99
2.1 Feedstock 100
Screenings from a local WWTP in the Yorkshire region (UK), treating mainly 101
domestic wastewater, were collected regularly throughout the year with an 102
average of four samples each season, and stored at -20oC. Representative 103
samples were removed as required and characterised (Table 2). 104
Table 2 Characterisation of screenings used in this research 105
Parameter Value Standard deviation TS (%) VS (% TS) C (% dry) N (% dry) C:N Ash (%) P (% dry)
26.5 93.2 50.2 2.6 17.6 1.8 0.32
1.61 0.44 1.92 0.89 3.75 1.61 0.03
Values presented are average from triplicate analyses 106
107
2.2 Reactors and operation 108
Two lab-scale LBRs were used, each with a total volume of 5 L and a working 109
volume of 4 L. The reactors were primed with 1.2 kg of screenings and 110
inoculated with an acidogenic seed culture that had been taken from a reactor 111
operating for four months with a retention time of 4 days and a pH of 5.5. The 112
seed culture was well-mixed with the screenings at a ratio of 0.78 (w/w) 113
inoculum:screenings. A sufficient volume of water was then added to exceed 114
the field capacity of the waste (Vieitez et al., 2000) and reach a liquid to solids 115
ratio (L/S) of 10 (w/w). A stainless steel 1.5 mm mesh supported the solids and 116
prevented coarse solids entering the leachate. Finally, the LBRs were flushed 117
MANUSCRIP
T
ACCEPTED
ACCEPTED MANUSCRIPT6
with N2 gas to ensure anaerobic conditions, before being completely sealed and 118
then operated at 37(±2)°C using a heating tape. 119
The recycled leachate was homogeneously applied over the bed through a 120
sprinkler placed at the top of each reactor. The daily recirculation cycle was 121
intermittent with 5-hours-on and 19-hours-off, at the appropriate recirculation 122
rate. The VFA concentration in the leachate was allowed to increase until no 123
further VFA production was observed. Dilution was undertaken by removing 124
50% of the volume of leachate and replacing this with distilled water, as 125
described by Xu et al. (2011). In total nine dilutions were performed over a 126
period of 35 days. 127
Initially experiments were conducted using two leachate recirculation rates: a 128
low recirculation rate (LRR) of 4 l/lreactor/day and a high one (HRR) of 8 129
l/lreactor/day. The pH during this stage was uncontrolled. In a second set of 130
experiments pH values were controlled at 5 and 6 whilst the leachate 131
recirculation rate was maintained constant. 132
133
2.3 Analytical methods 134
Leachate samples were centrifuged in 50 ml tubes, at 4000 rpm for 20 min. 135
prior to analysis. Total VFA (mg acetic acid/l), ammonia (mg NH3-N/L), pH value, 136
COD, TS, VS, alkalinity (mg CaCO3/l), TKN and total phosphate were analysed 137
following the methods outlined in Standard Methods (APHA, 2005). 138
Individual volatile fatty acids and alcohols were analyzed using an Agilent gas 139
chromatograph equipped with a flame-ionization detector (FID) and an NB-351 140
NORDION column (25m X 0.32mm). Operating conditions were: injector 141

MANUSCRIP
T
ACCEPTED
ACCEPTED MANUSCRIPT7
temperature 150°C; FID temperature 240°C; oven temp erature program: 95-142
140°C (10°C/min), 140-200°C (40°C/min) held for 5 m inutes. Helium was used 143
as a carried gas. 144
A one-way ANOVA with blocks, being time the block, was used to determine 145
statistical differences between the recirculation ratios and pHs evaluated. 146
Additionally, in order to discern differences and rank treatments a t (LSD) test 147
was performed. P-values less than 0.05 were considered statistically significant. 148
149
3. Results and discussion 150
3.1 Effect of the recirculation rate of the leachate 151
3.1.1 Production of total VFAs 152
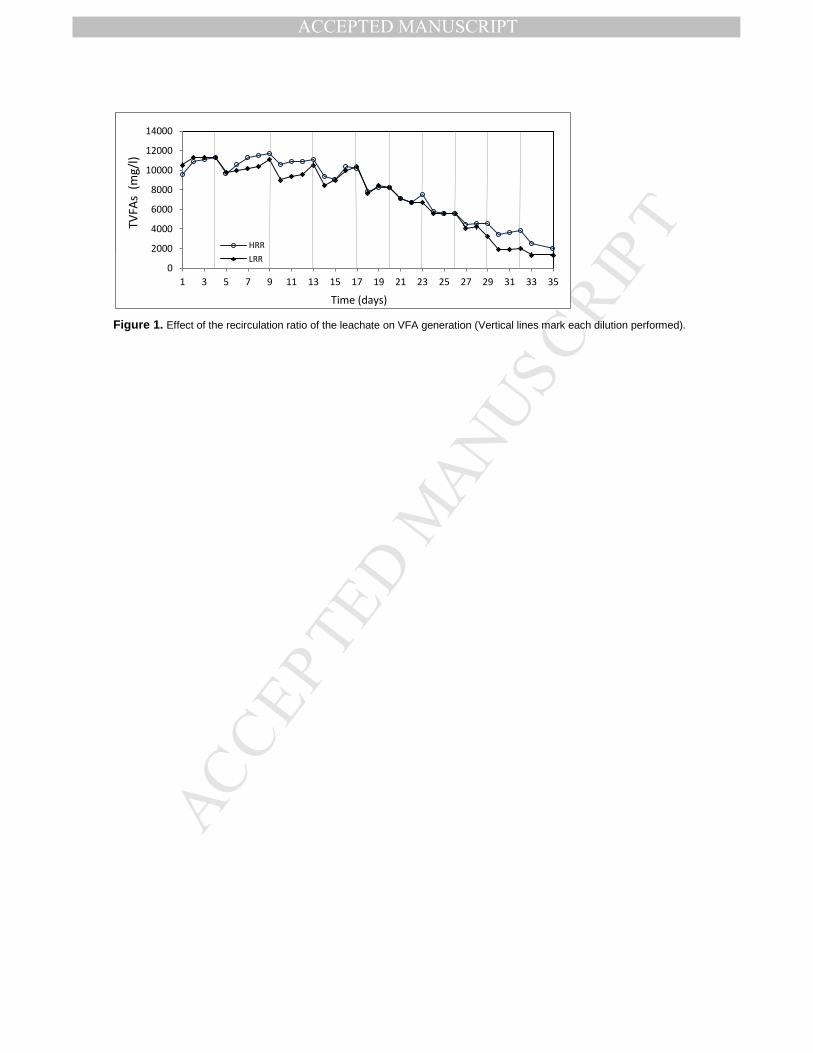
Volatile fatty acids were produced very rapidly following the onset of digestion 153
(Fig. 1). This increased to a concentration of 11,310 mg/L after 4 days when 154
production stopped. At this point half of the leachate was removed and replaced 155
with dilution water and VFA production recommenced. Again the production 156
reached a plateau on day 9 when the leachate was replaced. This procedure 157
continues until the end of the experiment. 158
By removing and performing dilutions of leachate it was possible to maintain a 159
high rate of VFA generation, ranging between 255 and 520 mg/L/day during the 160
first 17 days of the operation. This range is higher than the range 205-440 161
mg/L/day reported by Babel et al. (2004) for pineapple peel under similar 162
conditions (batch mode, performing dilutions of leachate, temperature 31-37°C 163
and 4 l/lreactor/day of recirculation ratio of the leachate). This higher value is 164
evidence of a successful hydrolysis/acidification process. As pointed out by 165

MANUSCRIP
T
ACCEPTED
ACCEPTED MANUSCRIPT8
Sandoval et al. (2009), the increase in VFA concentrations with high values in 166
the acidogenic reactor can be due to a balance of fermentative bacteria 167
followed by acetogenic bacteria. This in turn can be attributed to an adequate 168
inoculation of the system with an acidic inoculum, already acclimatised to 169
screenings. 170
In general, the rate of total VFA production was greater in the first two weeks of 171
the process for both recirculation ratios. This was also reported by Ghanem et 172
al. (2001) who found a maximum leaching rate on day 10, for kitchen solid 173
waste. After these initial two weeks the VFA production started to decrease until 174
the end of the process, when acid production was reduced by 60% for the 175
higher ratio (HRR) and 80% for the lower (LRR). The production of VFA was 176
higher in the experiment with the higher ratio, resulting in an 11% greater total 177
VFA production compared with the lower ratio. Correspondingly, a one-way 178
ANOVA yielded significant differences between the two recirculation ratios (P = 179
0.0001), as well as with the time (P < 0.0001). Post hoc comparisons using the t 180
(LSD) test revealed that HRR showed a significantly greater VFA production 181
than LRR (α = 0.05). 182
The total VFA generation, calculated from the amount of leachate withdrawn 183
and its concentration, was 264 and 240 g/kg-dry screenings for HRR and LRR, 184
respectively. These values are higher than the values reported for potato 185
wastes (34 and 53 g/kg), cattle manure (132-154 g/kg) and waste activated 186
sludge (210 g/kg), in similar studies (Parawira et al., 2004; Myint and 187
Nirmalakhandan, 2009; Chen et al., 2007). However, the values found here for 188
screenings are very similar to the values of 220 g/kg and 280 g/kg reported for 189

MANUSCRIP
T
ACCEPTED
ACCEPTED MANUSCRIPT9
pineapple peel at pH 5.0-6.0 and pH 6.0-7.0, respectively (calculated from the 190
data reported by Babel et al., 2004). This shows that screenings as VFA 191
producers compete well with other highly biodegradable organic waste such as 192
fruit waste. 193
194
3.1.2 pH, ammonia and alkalinity 195
The pH of the leachate was not adjusted and it was between 5.3 and 7.0 (Fig. 196
2), a range that is considered optimum for acid production (Khanal et al., 2008). 197
The pH values of leachate strongly decreased during periods of greater VFA 198
generation (Fig. 1). After that, there was a period of very little change until the 199
last 10 days of the process, when the pH increased above 6. Thus it appears 200
that the pH profile was a reflection of VFA production. However, since there was 201
no pH control, the system tended to buffer itself towards a constant pH (around 202
6), which has been also observed by Guerrero et al. (1999).The buffering 203
capacity exhibited by the system might be due to the buffering by ammonia 204
released from amino-acid fermentation (Eastman and Ferguson, 1981). There 205
was a significant release of ammonia together with the acid production and the 206
concentration of ammonia during the first 10 days ranged between 1,000 and 207
1,600 mg/l (Fig. 3a). Even though as the experiment progressed there was a 208
decrease in the ammonia concentration, the value still remained above 400 mg/l 209
until day 20. This ammonification provides a relatively high alkalinity and 210
sufficient to maintain the VFA/Alk ratio at around 2 for most of the experiment, 211
decreasing only when the production of VFA was exhausted (Fig. 3b). It is 212

MANUSCRIP
T
ACCEPTED
ACCEPTED MANUSCRIPT10
important to point out that the level of alkalinity was also slightly higher in the 213
HRR system. 214
215
3.1.3 Hydrolysis 216
During the leaching process, soluble substrates that are hydrolyzed from 217
insoluble substrate accumulate in the liquor. The concentration of this 218
hydrolyzed substrate is represented by the mass of COD in the liquid (Nizami et 219
al., 2010). When the COD yield was measured, values of 439 and 376 g 220
COD/kg-dry screenings were obtained for HRR and LRR, respectively. This 221
means there was a 17% higher COD production from HRR compared with LRR. 222
The higher concentration of COD in leachate with the higher recirculation ratio 223
means that more solubilisation took place and so a higher level of hydrolysis. 224
This, in turn, is evidence that a high recirculation ratio of leachate has a positive 225
impact on the solid-liquid mass transfer. 226
The values found in this research are higher than the range of 172-186 g 227
COD/kg-dry manure reported by Myint and Nirmalakhandan (2009) in a similar 228
leach bed reactor. The difference in the COD yield, apart from the different 229
nature of the substrates, might result from the replacement of leachate by 230
water, which prevents accumulation of organic substances and thus boosts 231
further hydrolysis and COD solubilisation (Jagadabhi et al., 2011). It means that 232
the mass transfer, from solid to liquid phase in the LBR, may be optimized by 233
removing VFA and diluting the leachate. 234
The efficiency of the hydrolysis process can be measured in terms of the 235
solubilisation of the particulate organic matter initially fed into the digester and 236

MANUSCRIP
T
ACCEPTED
ACCEPTED MANUSCRIPT11
expressed as the soluble COD (sCOD)/initial COD ratio. This parameter reflects 237
the development of the solubilisation of the particulate organic matter in the 238
feedstock and its conversion to VFA. In this case, the analysis for system HRR 239
(Fig. 4) is presented due to its better performance. Start-up of hydrolysis was 240
rapid and within the first 17 days, 18% of the initial COD mass of the organic 241
fraction of screenings was hydrolysed to sCOD. The hydrolysis process 242
continued, although at a slower rate, reaching a value of 30% by the end of the 243
operation. This percentage is known as the hydrolysis yield. 244
A similar result was reported by Lai et al. (2001), who found that the value of 245
hydrolysis yield was 30-36% in the LBRs fed with unsorted coarsely shredded 246
MSW, over a period of 53 days. The value observed in our research, over a 247
shorter time period, shows the potential of screenings to be digested if right 248
operating conditions are met. 249
250
3.1.4 Acidification and VFAs composition 251
The VFA/COD ratio is a measure of the degree of success of acidogenesis, 252
representing the amount of solubilised matter which has been converted to VFA 253
(Maharaj and Elefsiniotis, 2001). In this experiment, VFA (converted to COD 254
equivalent) accounted for most of the sCOD in both reactors, from an initial 50% 255
to over 70% by day 12, then varying between 70% and 80% until the last 10 256
days of the process. The profile of the main VFA produced also showed little 257
difference between the two recirculation ratios investigated and so only the 258
results for the HRR system are shown (Fig. 5). The total VFA concentration in 259
the leachate reached a maximum value of 11.7 g HAc/L in the first 9 days, after 260

MANUSCRIP
T
ACCEPTED
ACCEPTED MANUSCRIPT12
which it decreased, falling to below 2 g HAc/L at the end of 35 days. The 261
increase and decrease in acid production is supported by the variations in pH 262
(Fig. 2) and the hydrolysis efficiency in the LBR. The main VFAs produced were 263
acetic, propionic and butyric. The leachate generated during the period of 264
greater acid production also contained the highest concentration of acetic acid 265
(7.6 – 8.2 g HAc/l). Dilution of leachate appears to give the acetic, propionic and 266
butyric acid-producing bacteria an advantage over the rest of the acid-producing 267
bacteria leading to less acidification via proton removal, and thus resulting in an 268
extension of the period during which such bacteria are active. 269
Alcohols were only detected during the first four days of the process, up until 270
the first dilution. Although ethanol was the main alcohol it was found only during 271
the first 2 days, whereas methanol was observed for the first 4 days of the 272
process. The average concentration of these alcohols was 275 mg/l and 63 mg/l 273
for the HRR and 104 mg/l and 72 mg/l for the LRR, respectively. Only traces of 274
butanol (16 mg/l) were detected on the second day with the experiment at the 275
LRR. The poor production of alcohols is due to the pH of the process that 276
favoured acid production, since the optimum pH for alcohol production is 277
between 3.0 and 4.5 (Dogan et al., 2008; Grupe and Gottschalk, 1992). 278
The acidification yield is the ratio of cumulative total VFA produced during the 279
operation of the LBR and the initial COD of the feedstock, which in this study 280
was 18%. The difference between the percentage of hydrolysis and acidification 281
is due to the production of various alcohols (ethanol, methanol, butanol, 282
propanol, etc), ketones (glycerol, acetone, etc.), CO2 and H2 that are also taken 283
into account when hydrolysis yield is calculated. The extent of acidification 284

MANUSCRIP
T
ACCEPTED
ACCEPTED MANUSCRIPT13
found in this study is much higher than the value reported for the OFMSW by 285
Dogan et al. (2008), who found only 4.4% of acidification at the end of 80 days. 286
The degree of acidification was favoured in our study by performing 287
recirculation of leachate as well as by an optimum pH. That is, the degree of 288
acidification may be improved if pH is maintained in optimum values and if an 289
efficient recirculation of leachate is performed (Rajeshwari et al., 2001). 290
291
3.2 Effect of pH on acidogenesis in the LBR 292
In order to determine which pH value leads to more effective acid production, 293
the extent of acidification was measured in the leachate in terms of the ratio 294
VFA (converted to COD equivalent)/sCOD (Fig. 6a). At an operating pH value of 295
6.0, acidification increased with time, reaching 78% by day 26. By contrast at 296
pH 5, acidification was much lower and also decreased with time reaching a 297
minimum of 23.5% by day 26. VFA production was also significantly higher at 298
pH 6 with a reduction in acid production at pH 5.0 of 58% (Fig. 6b). This was 299
confirmed by the ANOVA which revealed significant statistical differences 300
between two operating pH values with regard to VFA production (P < 0.0001), 301
as well as with the time (P < 0.0001). Post hoc comparisons using the t (LSD) 302
test revealed that pH 6 showed significantly higher VFA levels compared with 303
pH 5 (α = 0.05). 304
Veeken et al. (2000) also observed that hydrolysis of biowaste was inhibited at 305
pH 5.0 and similarly Russell and Wilson (1996) reported that cellulose 306
degradation was inhibited at pH below 6.0. In general, the LBR operated at pH 307

MANUSCRIP
T
ACCEPTED
ACCEPTED MANUSCRIPT14
6.0 showed a better performance in all aspects (Table 3), including VS removal 308
(57%) and recovery of nutrients (60% of TKN and 36% of total phosphorus). 309
Both Dong et al. (2010) and Babel et al. (2004) found the optimal pH for 310
acidification was between 6 and 7 and stated that at lower pH values, 311
undissociated acids are inhibitory for the acidogenesis. However, these findings 312
contradict those reported by Ghosh (1991) and by Chen et al. (2007), who 313
claimed that the best pH for acid production was in the range 5-6, and 4-5, 314
respectively. The reason for this discrepancy may lie in the fact that different 315
substrates were studied. Kitchen waste (Dong et al., 2010) and fruit and 316
vegetables (Babel et al., 2004) are easily hydrolysed whereas activated sludge 317
(Ghosh, 1991 and Chen et al., 2007) is more difficult to hydrolyse. Thus 318
although a higher pH (6-7) might lead to a higher production of acids, it is also 319
likely that it would encourage production of methane through methanogenesis. 320
Table 3. Performance of the LBR process and composition of the resultant leachate 321
322 Parameter pH 5 pH 6 VFAs produced (g/kg VS) VS removal (%) Volume reduction (%) TKN recovery (%) Total phosphorus recovery (%)
90 25 16 48 54
213 57 40 60 36
Average composition of VFAs detected (%)
Acetic Propionic Butyric Isobutyric Valeric Isovaleric
63 11 12 2 6 6
67 12 10 2 4 5
323
When the total VFAs production at pH 6.0 was compared with that of 324
uncontrolled pH (5.3-6.5), no significant difference was found (P = 0.493). Thus 325
acid digestion of screenings in the LBR under uncontrolled pH, besides being 326
less expensive, presents an adequate equilibrium for the production of VFAs 327

MANUSCRIP
T
ACCEPTED
ACCEPTED MANUSCRIPT15
whilst inhibiting efficiently the methanogenic phase. It means that, for a cost-328
effective VFA production, the acid digestion of screenings without pH control 329
may be recommended. 330
Contrary to expectation the production of alcohols was no higher at pH 5 331
compared to either pH 6 or the uncontrolled pH, perhaps because this pH value 332
is still far from the optimum for alcohol production, which occurs between pH 3.0 333
and 4.5. However, it was observed that methanol was produced at pH 5, 334
although at a low concentration (45 mg/L, on average) and only until day 11 of 335
the experiment. 336
337
3.3 General discussion 338
The role of recirculation within the leach bed is to provide efficient mixing 339
between the substrate and biomass, promoting an effective solid-liquid mass 340
transfer, and thus leaching capacity. At the same time, recirculation will pose an 341
energy demand, so it is important to ensure the lowest rate compatible with 342
good performance. The leaching capacity depends on the size of the particles 343
and porosity of the bed and in this study the leaching characteristics were 344
excellent due to the heterogeneous composition of the screenings. As a result 345
bed blockage was not observed at any time, and it was not necessary either to 346
treat the screenings to reduce their size or to add a bulking agent to increase 347
porosity. In fact the leaching capacity of the bed was observed to improve over 348
time as hydrolysis of the solids fraction took place. 349
The better performance of the higher leachate recirculation ratio (8 L/Lreactor/day) 350
compared to the lower one (4 L/Lreactor/day) is explained by the fact that a higher 351
MANUSCRIP
T
ACCEPTED
ACCEPTED MANUSCRIPT16
recirculation ratio implies a more efficient solid-liquid mass transfer that, in turn, 352
should provide an improved hydrolysis process. It also confirms the important 353
role of solid-liquid mass transfer in the hydrolysis phase. However, the 354
recirculation ratio of leachate cannot be increased indefinitely since high ratios 355
cause serious reductions to the porosity of the solid bed, and may even 356
completely stop the flow of liquid. Thus it is likely that the optimum recirculation 357
ratio that gives the most effective hydrolysis will be also a function of the type of 358
substrate and its particle size. Nonetheless, in addition of taking into account 359
technical factors it is equally important to take into account economic factors in 360
order to select the more cost-efficient recirculation ratio. Therefore, despite its 361
better performance, it is not possible to suggest that the higher recirculation 362
ratio of the leachate studied in this research is the optimum for the process, 363
without an economic analysis that considers the additional energy requirements 364
for recirculation. 365
From the results it is clear that pH has a greater influence on the VFA 366
production than recirculation ratio. This is because the pH directly determines 367
the fermentation type, i.e. acid-producing or alcohol-producing (Babel et al., 368
2004) whereas the recirculation ratio of the leachate only influences the solid-369
liquid mass transfer and the biomass contact. 370
In addition to generating VFAs, the LBR also proved to be very effective in the 371
destruction of volatile solids and in the release and recovery of nutrients, 372
making this reactor a very effective at undertaking the hydrolysis/acidogenesis 373
processes. The leachate produced that is rich in VFAs, can be used not only to 374
produced methane in a second digestion stage but also may be used as an 375

MANUSCRIP
T
ACCEPTED
ACCEPTED MANUSCRIPT17
internal carbon source for the biological removal of nutrients in a WWTP 376
(Manyumba et al., 2009; Maharaj and Elefsiniotis, 2001) or even as a raw 377
material for the production of butanol or biopolymers. 378
379
4. Conclusions 380
This study demonstrated the effectiveness of the LBR system for the digestion 381
of screenings without pre-treatment, exhibiting a high efficiency of 382
hydrolysis/acidification processes. By increasing the recirculation ratio of the 383
leachate from 4 to 8 L/Lreactor/day it was possible to increase 11% the VFA 384
production, enhance 17% COD solubilisation and generate up to 264 g VFA/kg-385
dry screenings; however, the higher energy demand has to be taken into 386
account to select the more cost-effective recirculation ratio. On the other hand, 387
the acidogenesis was inhibited at pH 5 and an uncontrolled pH, ranging from 388
5.3 to 6.5, was found to be adequate for the production of VFA and the effective 389
inhibition of methanogenesis. The LBR can make feasible the recovery of 390
resources from screenings reducing its current carbon footprint. 391
392
Acknowledgements 393
The authors want to thank to COLCIENCIAS for giving financial support to the 394
first author, and to the Public Health Laboratory at Leeds University for all the 395
collaboration received from staff. 396
397
References 398
APHA, 2005. Standard Methods for the examination of water and wastewater. 399
Washington, D. C, American Public Health Association, Water Pollution Control 400

MANUSCRIP
T
ACCEPTED
ACCEPTED MANUSCRIPT18
Federation. 401
Babel, S., Fukushi, K. &Sitanrassamee, B., 2004. Effect of acid speciation on solid 402
waste liquefaction in an anaerobic acid digester.Water Research, 38, 2416-403
2422. 404
Cadavid, L. S., Horan, N.J., 2012. Reducing the environmental footprint of wastewater 405
screenings through anaerobic digestion with resource recovery. Water and 406
Environment Journal, 26 (3) 301-307. 407
Cadavid-Rodríguez, L. S., Horan, N.J., 2013. Methane production and hydrolysis 408
kinetics in the anaerobic degradation of wastewater screenings. Water Science 409
and Technology, 68 (2), 413-418. 410
Chen, Y., Jiang, S., Yuan, H., Zhou, Q. and Gu, G., 2007. Hydrolysis and acidification 411
of waste activated sludge at different pH', Water Research, 41(3), 683-689. 412
Chugh, S., Chynoweth, D. P., Clarke, W., Pullammanappallil, P. and Rudolph, V., 413
1999. Degradation of unsorted municipal solid waste by a leach-bed process, 414
Bioresource Technology, 69(2), 103-115. 415
Cysneiros, D., Banks, C. J. and Heaven, S., 2008. Anaerobic digestion of maize in 416
coupled leach-bed and anaerobic filter reactors, Water Science and 417
Technology, 58(7), 1505-1511. 418
Demirer, G. N. and Chen, S., 2008. Anaerobic biogasification of undiluted dairy manure 419
in leaching bed reactors, Waste Management, 28(1), 112-119. 420
Dinamarca, S., Aroca, G., Chamy, R. and Guerrero, L., 2003. The influence of pH in 421
the hydrolytic stage of anaerobic digestion of the organic fraction of urban solid 422
waste, Water Science and Technology, 48(6), 249-254. 423
Dogan, E., Dunaev, T., Erguder, T. H. &Demirer, G. N., 2008. Performance of leaching 424
bed reactor converting the organic fraction of municipal solid waste to organic 425
acids and alcohols. Chemosphere, 74, 797- 803. 426
Dong, L., Yongming, S., Xiaoying, K., Lianhua, L., Zhenhong, Y. and Longlong, M., 427
2010. Effect of pH on anaerobic fermentative products distribution for kitchen 428
waste, Proc. Int. Conference on Mechanic Automation and Control Engineering 429
(MACE), Wuhan, China, 26-28 June 2010 pp. 3935-3938. 430
Eastman, J. A. & Ferguson, J. F., 1981. Solubilization of particulate organic carbon 431
during the acid phase of anaerobic digestion.Journal of the Water Pollution 432
Control Federation, 53, 352-366. 433
Elefsiniotis, P., Wareham, D. G. and Oldham, W. K., 1996. Particulate organic carbon 434
solubilization in an acid-phase upflow anaerobic sludge blanket system. 435
Environmental Science & Technology, 30(5), 1508-1514. 436
Ghanem, III, Gu, G. W. and Zhu, J. F., 2001. Leachate production and disposal of 437
kitchen food solid waste by dry fermentation for biogas generation, Renewable 438
Energy, 23(3-4), 673-684. 439
Ghosh, S., 1991. Pilot-scale demonstration of 2-phase anaerobic-digestion of 440
activated-sludge. Water Science and Technology, 23(7-9), 1179- 1188. 441
Guerrero, L., Omil, F., Mendez, R. and Lema, J. M., 1999. Anaerobic hydrolysis and 442
acidogenesis of wastewaters from food industries with high content of organic 443
solids and protein, Water Research, 33(15), 3281-3290. 444
Grupe, H. and Gottschalk, G., 1992. Physiological events in clostridium-acetobutylicum 445
during the shift from acidogenesis to solventogenesis in continuous culture and 446
presentation of a model for shift induction, Applied and Environmental 447
Microbiology, 58(12), 3896-3902. 448
Jagadabhi, P. S., Kaparaju, P. and Rintala, J., 2011. Two-stage anaerobic digestion of 449
tomato, cucumber, common reed and grass silage in leach-bed reactors and 450
upflow anaerobic sludge blanket reactors, Bioresource Technology, 102, 4726-451
4733. 452
Khanal, S. K., Rasmussen, M., Shrestha, P., Van Leeuwen, H., Visvanathan, C. and 453

MANUSCRIP
T
ACCEPTED
ACCEPTED MANUSCRIPT19
Liu, H., 2008. Bioenergy and Biofuel Production from Wastes/Residues of 454
Emerging Biofuel Industries, Water Environment Research, 80(10), 1625-1647 455
Lai, T. E., Nopharatana, A., Pullammanappallil, P. C. and Clarke, W. P., 2001. 456
Cellulolytic activity in leachate during leach-bed anaerobic digestion of 457
municipal solid waste, Bioresource Technology, 80(3), 205-210. 458
Le Hyaric, R., Canler, J.P., Barillon, B., Naquin, P. and Gourdon, R., 2010. Pilot-scale 459
anaerobic digestion of screenings from wastewater treatment plants. 460
Bioresource Technology, 101(23), 9006 – 9011. 461
Lehtomaki, A., Huttunen, S., Lehtinen, T. M. & Rintala, J. A., 2008. Anaerobic digestion 462
of grass silage in batch leach bed processes for methane production. 463
Bioresource Technology, 99, 3267-3278. 464
Maharaj, I. and Elefsiniotis, P., 2001. The role of HRT and low temperature on the acid-465
phase anaerobic digestion of municipal and industrial wastewaters, Bioresource 466
Technology, 76(3), 191-197. 467
Manyumba, F., Wood, E. and Horan, N. (2009) Meeting the phosphorus consent with 468
biological nutrient removal under UK winter conditions, Water and Environment 469
Journal, 23(2), 83-90. 470
Martin, D. J., Potts, L. G. A. and Heslop, V. A., 2003. Reaction mechanisms in solid-471
state anaerobic digestion - I. The reaction front hypothesis, Process Safety and 472
Environmental Protection, 81(B3), 171-179. 473
Myint, M. T. & Nirmalakhandan, N., 2009. Enhancing anaerobic hydrolysis of cattle 474
manure in leachbed reactors. Bioresource Technology, 100, 1695-1699. 475
Mtz-Viturtia, A., Mata-Alvarez, J. and Cecchi, F., 1995. Two-phase continuous 476
anaerobic digestion of fruit and vegetable wastes. Resources, Conservation 477
and Recycling, 13(3–4). 257–267. 478
Nizami, A. S., Thamsiriroj, T., Singh, A. and Murphy, J. D., 2010. Role of Leaching and 479
Hydrolysis in a Two-Phase Grass Digestion System, Energy & Fuels, 24, 4549-480
4559. 481
O'Keefe, D. M. and Chynoweth, D. P., 2000. Influence of phase separation, leachate 482
recycle and aeration on treatment of municipal solid waste in simulated landfill 483
cells, Bioresource Technology, 72(1), 55-66. 484
Parawira, W., Murto, M., Read, J. S. and Mattiasson, B., 2004. Volatile fatty acid 485
production during anaerobic mesophilic digestion of solid potato waste, Journal 486
of Chemical Technology and Biotechnology, 79(7), 673-677. 487
Rajeshwari, K. V., Lata, K., Pant, D. C. and Kishore, V. V. N., 2001. A novel process 488
using enhanced acidification and a UASB reactor for biomethanation of 489
vegetable market waste, Waste Management & Research, 19(4), 292-300. 490
Russell, J. B. and Wilson, D. B., 1996. Why are ruminal cellulolytic bacteria unable to 491
digest cellulose at low pH?, Journal of Dairy Science, 79(8), 1503-1509. 492
Sandoval Lozano, C. J., Vergara Mendoza, M., Carreno de Arango, M. and Castillo 493
Monroy, E. F., 2009. Microbiological characterisation and specific 494
methanogenic activity of anaerobe sludges used in urban solid waste treatment, 495
Waste Management, 29(2), 704-711. 496
Shin, H.S. andYoun, J.,H., 2005. Conversion of food waste into hydrogen by 497
thermophilic acidogenesis. Biodegradation, 16, 33-44. 498
Veeken, A., Kalyuzhnyi, S., Scharff, H. & Hamelers, B., 2000. Effect of pH and VFA on 499
hydrolysis of organic solid waste. Journal of Environmental Engineering, 126, 500
1076-1081. 501
Vieitez, E. R., Mosquera, J. and Ghosh, S., 2000. Kinetics of accelerated solid-state 502
fermentation of organic-rich municipal solid waste, Water Science and 503
Technology, 41(3), 231-238. 504
Xu, S.Y., Lam, H.P, Karthikeyan, O. and Wong, J.C., 2011. Optimization of food waste 505
hydrolysis in leach bed coupled with methanogenic reactor: Effect of pH and 506

MANUSCRIP
T
ACCEPTED
ACCEPTED MANUSCRIPT20
bulking agent. Bioresource Technology,102(4), 3702–3708 507
Yoshino, M., Yao, M., Tsuno, H. and Somiya, I., 2003. Removal and recovery of 508
phosphate and ammonium as struvite from supernatant in anaerobic digestion 509
Water Science and Technology, 48(1), 171-178. 510
511
MANUSCRIP
T
ACCEPTED
ACCEPTED MANUSCRIPT
Figure 1. Effect of the recirculation ratio of the leachate on VFA generation (Vertical lines mark each dilution performed).
0
2000
4000
6000
8000
10000
12000
14000
1 3 5 7 9 11 13 15 17 19 21 23 25 27 29 31 33 35
HRR
LRR
Time (days)
TVFA
s (
mg/
l)

MANUSCRIP
T
ACCEPTED
ACCEPTED MANUSCRIPT
Figure 2. The effects of the recirculation ratio on the pH profile of the leachate
4
4,5
5
5,5
6
6,5
7
7,5
8
0 5 10 15 20 25 30 35
pH
Time (days)
HRR
LRR

MANUSCRIP
T
ACCEPTED
ACCEPTED MANUSCRIPT
(a)
(b)
Figure 3. Ammonia production (a) and VFA:Alk ratio (b) with two recirculation ratios of leachate
0
200
400
600
800
1000
1200
1400
1600
1800
1 3 5 7 9 11 13 15 17 19 21 23 25 27 29 31 33 35
HRR
LRR
Time (days)
Am
mo
nia
(m
g/L)
0,00
0,50
1,00
1,50
2,00
2,50
1 3 5 7 9 11 13 15 17 19 21 23 25 27 29 31 33 35
HRR
LRR
Time (days)
VFA
s:A
Lk r
atio

MANUSCRIP
T
ACCEPTED
ACCEPTED MANUSCRIPT
Figure 4. Cumulative sCOD/initial COD ratio values, system HRR.
0,00
0,05
0,10
0,15
0,20
0,25
0,30
0,35
0 5 10 15 20 25 30 35 40
sCO
D/t
CO
D
Time (days)

MANUSCRIP
T
ACCEPTED
ACCEPTED MANUSCRIPT
Figure 5. Quantitative and qualitative analysis of VFAs during operation of the LBR.
0
2000
4000
6000
8000
10000
12000
14000
1 4 9 13 17 20 23 26 29 32
Co
nce
ntr
atio
n (
mg/
l)
Time (days)
Acetic
Propionic
Butyric
Total VFAs

MANUSCRIP
T
ACCEPTED
ACCEPTED MANUSCRIPT
(a)
(b)
Figure 6. Grade of acidification (a) and total VFA production (b) at two pH conditions
0
20
40
60
80
100
1 3 5 7 9 11 13 15 17 19 21 23 25 27 29 31 33 35
[CO
D o
f V
FAs/
sC
OD
] (%
)
Time (days)
pH 5
pH 6
0
2
4
6
8
10
12
6 10 14 17 20 23 26 29 32
tVFA
s (g
)
Time (days)
pH 5pH 6

MANUSCRIP
T
ACCEPTED
ACCEPTED MANUSCRIPT
Highlights
• A leach bed reactor showed to be effective for the acid digestion of screenings. • VFA production was optimized to produce 264 g/kg-dry screenings. • At pH 5.0 acidogenesis was inhibited, the optimum pH found to VFA production
was 6. • Valuable end-products such as VFAs, alcohols and nutrients can be obtained. • The LBR might be an alternative for reducing the carbon footprint of screenings.