Embed Size (px)
Citation preview

PRODUCTION PLANNING:
A CASE STUDY ON VISIONS IDROP
MATTHEW TJAHJADI

1. SITUATION
Jeffrey and Abby Visi are owners of an eye drop manufacturing company called Visions. They are no longer able to operate their business and are seeking the most profitable option.
2. OUTLINE
● The company produces four types of product based on specific ingredients in batches of 1,200 and operates 7.5 hours/day (break included).
● The Visions company is seeking help to analyze the most profitable alternatives. ○ iDrop: Sell the company for $150,000. ○ Replenish: Run the business for one month using discounted bulk supplies from
Replenish. After the month, replenish will acquire the building and machinery. ○ Visions: Lease the firm to another company. ○ Visions: Hire a Board of Directors (BOD) to manage the operations of the facility. ○ Outsourcing: Outsource company to Asia
● For Replenishes offer, the IE team will adopt optimization to find the maximum profit proposed by Replenish based on the cost of ingredients, labor/overhead costs, scrap rate and available raw materials.
● The team will also perform process analysis on the current manufacturing process using process mapping and simulations to reduce the lead time to produce Vision’s products.
3. ANALYSIS
To analyze the current offers and all other recommendations, the team will first determine how much the company can produce. The team will also determine how much the labor and overhead costs are. Since the company is only left with machines and workers, the team must create a projection of the company. In this projection, the company will have infinite resources and the work will run at a continuous flow to produce the optimal numbers.

3.1 Production Process Analysis Of Current System
Vision’s manufacturing process of its eye products follows the same steps regardless of product type. Below is a process flow map illustrating the current process and its total lead time to produce a batch of product.
Figure 1: Process Flow Chart of Vision Current System
The current process requires 12.5 hours to produce one batch (1,200 bottles), with no information regarding the setup between operators to machines. Vision has ten workers that work 7.5 hours/day Monday through Friday. The line has a scrap rate of 15% with a worker efficiency of 90%. It should be noted that the scrap rate would require additional time to complete a batch since there would be a deficiency of 180 bottles.
3.2 Production Capacity Of Current Process
Assuming the workers work one shift, equation one will find the number of accepted bottles (not scrapped) produced in one month.
Equation 1: Production of Factory Per Day

3.3 Labor Cost and Overhead Cost Of Current Process
Labor cost is calculated by multiplying the worker’s hourly wage by the hours of day and number workers. An unpaid 30-minute lunch break will be assumed. The overhead cost is calculated by doubling the cost of labor. Equation 2 and three will show these costs per day.
Equation 2: Labor Costs
$12/hour/worker * 7.5 hours/day * 10 workers = $900/day for 10 workers
Equation 3: Overhead Costs
2 x labor costs = $1800/day for 10 workers
4. RESULTS
Table 1 describes the production that all ten lines can make per day, per week, and per month.
Table 1: Factory Production Capacity Per Timeline
Table 2 describes the total costs associated with the same timeline used in Table 1.
Table 2: Labor Cost and Overhead Cost Based Daily
Daily Weekly Monthly Yearly
Labor Costs $900 $4500 $19500 $234000
Overhead $1800 $9000 $39000 $468000
TOTAL $2700 $13500 $58500 $702000

Due to emergency reason, the owners can no longer be with the company. Since no reasons have been disclosed, assumptions will be made that the owners can no long run the company. It will also be assumed that the owners are not in dire need of money. They just no longer have the time/availability to run the company.
Currently, Visions have to offers for the company. iDrops, a distributor for Visions, heard that the owners of iDrops are leaving and are requesting to purchase their company for $150,000. Also, another distributor for Visions, Replenished, has an offer that involves the company being run for a one month in given conditions and rules. These two options, with a couple of other recommendations, will be compared and chosen. The recommendations will cover the analysis. Finally, the conclusion will compare the recommendations and pick which is best.
5. RECOMMENDATIONS
5.1 iDrop
In this offer, iDrop has offered $150,000 to take control of the company. For the analysis, the current state of Visions will be used. A way to look at this offer is the planning horizon. Because the population is increasing, and eye drops have an ocean of uses, the monetary value of the company is immense. Therefore, selling the company without any shares is something that the owners should steer away from.
5.2 Replenishes Offer
Replenish offered Vision raw materials at discounted to produce one more of production. Replenish required Vision to produce at least 15 batches of each product for the one-month period. The team used linear programming for optimizing the profit of the offer, and maximum batches can be produce using the raw materials. Linear programming is employed to solve a real-world problem for an eye-drop manufacturer namely Visions. Visions currently have the option to manufacture all their products with the raw materials that Replenished bought in bulk for a lower price. Linear programming will serve as a decision-making tool to help Visions if they should continue to manufacture their products for one more month. The measure will be purely quantitative, as profit will be used to gauge what the company should do in the future. The analysis tool used to tackle this situation is Microsoft Excel and Lingo; initially the problem is outlined in Microsoft Word then translated mathematically to Microsoft Excel. After solving the organization’s problem, the results are analyzed and a sensitivity analysis is conducted to find
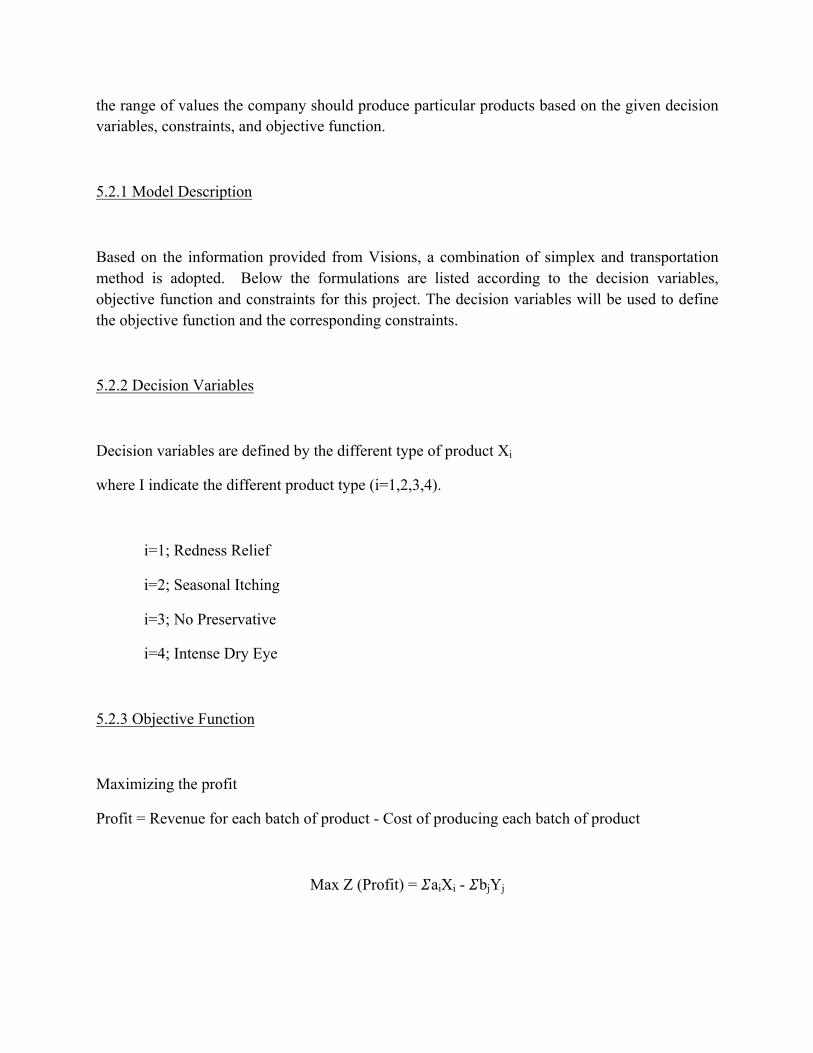
the range of values the company should produce particular products based on the given decision variables, constraints, and objective function.
5.2.1 Model Description
Based on the information provided from Visions, a combination of simplex and transportation method is adopted. Below the formulations are listed according to the decision variables, objective function and constraints for this project. The decision variables will be used to define the objective function and the corresponding constraints.
5.2.2 Decision Variables
Decision variables are defined by the different type of product Xi
where I indicate the different product type (i=1,2,3,4).
i=1; Redness Relief
i=2; Seasonal Itching
i=3; No Preservative
i=4; Intense Dry Eye
5.2.3 Objective Function
Maximizing the profit
Profit = Revenue for each batch of product - Cost of producing each batch of product
Max Z (Profit) = 𝛴aiXi - 𝛴bjYj

where:
ai = the revenue of the producing one batch per product type after applying scrap rate (i=1,2,3,4)
Xi= different product type (i=1,2,3,4)
bj = the cost of using raw materials to produce all the product type per batch (j=1,2,3,4,5)
Yj = the total amount of ingredients producing all product type per batch (j=1,2,3,4,5)
j=1 ; active ingredient 1
j=2 ; active ingredient 2
j=3 ; Benzalkonium Chloride
j=4 ; Edetate Disodium
j=5 ; Purified Water
5.2.4 Constraints
The constraints for this project include the raw material constraints and minimum production requirements.
Raw Material Constraints (Yj )
Replenished provided Visions a finite amount of resources for all the ingredients that are available for one month, the unused ingredients will be written off as scrap. The ingredient constraints are written as follows:
Active Ingredient 1: 425X1 + 215X2 + 310X3 + 250X4 < 60,000
Active Ingredient 2: 85X1 + 160X2 + 275X3 + 45X4 < 55,000
Benzalkonium Chloride: 70X1 + 50X2 + 60X3 + 45X4 < 20,000

Edetate Disodium: 68X1 + 42X2 + 80X3 +60X4 < 20,000
Purified Water: 1500X1 + 1550X2 +1500X3 + 1600X4 < 200,000
5.2.5 Minimum Production Requirements
Along with the raw material constraints, Replenished has also placed minimum production requirements for each type of product. Replenished require Visions to produce at least 15 batches of each product. Thus the formulation for the minimum production constraints is as follows:
Redness Relief
X1 > 15
Seasonal Itching
X2 > 15
No Preservatives
X3 > 15
Intense Dry Eyes
X4 > 15
Table 3: Cost for Each Ingredient
Ingredient Cost
Active Ingredient 1 $7.4000
Active Ingredient 2 $5.4200

Table 4: Revenue for each Batch including scrap rate (ai )
Above, table 4 illustrates the revenue after the 15% scrap rate. Subtracting the scrap rate from the production rate (100%), an accepted rate of 85% is left. As a result, the revenue for each batch of the product will decrease by 15%.
The actual revenue (revenue accounting the scrap rate) is calculated by multiplying the acceptance rate (85%) by the income made per that specific batch of product. For example, the revenue for each batch of Redness Relief is $7200. Taking into account the scrap rate, the actual revenue per batch is $7200*(0.85) = $6120.00.
Benzalkonium Chloride $0.9230
Edetate Disodium $0.2910
Purified Water $0.0173
Projected Revenue (per batch)
Accepted Rate (Production - Scrap Rate)
Actual Revenue (per batch)
Redness Relief $7,200.00 85% $6120.00
Seasonal Itching $4,800.00 85% $4080.00
No Preservatives $12,600.00 85% $10710.00
Intense Dry Eye $9,600.00 85% $8160.00

Table 5: Answer Report From Microsoft Excel
Presented in the Table 5 is the sensitivity report generated from the Excel Solver. The final value represents the optimal solution. Starting from the objective function, the final value is $426,620.00; this number represents the maximum profit the company can yield based on the ingredient combinations formulated earlier. Secondly, the final production value for the variables describes the optimal amount the company needs to produce to attain the potential profit. The final production values for Redness relief is 15 batches, for seasonal itching it is 15 batches as well, for No Preservatives it is 86 batches, yielding the highest value and finally for Intense Dry eyes is 15 batches as well which the optimal number batches that Vision can produce is 131 with the given amount of raw materials from Replenish. Thirdly, the cell value for each constraint represents the final value for each constraint.
The first five constraint values represent the amount of ingredients used. For instance, Replenished has provided Visions with 60,000 grams of active ingredient 1. On the other hand, Visions only require 40,628 grams of active ingredient 1 to yield the highest profit. Furthermore, the difference between the amount provided and amount used is represented as slack that yields a value of 19,731.66 grams. However, in the original problem statement, all the materials that are unused will be scrapped. Therefore, instead of incorporating 40,268 grams of ingredient 1 in the linear programming cost analysis, the whole sum of 60,000 grams of active ingredient 1 will be

used to calculate the cost of producing each batch of products. The only ingredient that does not have slack variable is purified water since this is the only ingredient that is entirely used up.
The next four constraints are related to the minimum production requirements for each product. Visions would benefit from producing the minimum requirement for each of type of product except No Preservatives since it yields the highest profit. The cost analysis will discuss which products are making a profit when labor and overhead costs are taken into account. The slacks for the last four rows of the answer report represent the difference between the optimum batches of products to manufacture and the minimum requirements.
Table 8: % Of Ingredients Used
Slack is only assigned to one product, No Preservatives. The reason this product receives all the slack is because it gains the most amount of net profit per bottle.

Table 7: Sensitivity Analysis Report From Microsoft Excel
The sensitivity analysis above illustrates the shadow price, final value, and the allowable increases/decreases. The shadow price of a given constraint can be interpreted as the rate of improvement in the optimal objective function value, in this case Z maximizing profit, as Right Hand Side of that constraint increases with all other data held fixed. "Rate of improvement" means "rate of increase" for a maximization model; and "rate of decrease" for a minimization model. If the Right Hand Side is decreased, the shadow price is the rate at which Z is impaired. The shadow price for purified water is 5.40726 that mean an increase in this raw material constraint would increase profit. The company would benefit from increasing the amount of water available since this is the only raw material that got used up. Furthermore, water is one of the cheapest of the resources. Thus, Replenished should provide Visions with more purified water so all the other active ingredients can be used to manufacture more products instead of scrapping them. The shadow price for redness relief, seasonal itching, and intense dry eye are invalidating because if more resources were allocated to these three eye drop products, the company would lose potential economic profit. As discussed earlier, the potential economic loss is because No Preservatives is most profitable compared to the other three eye drop products.
The opportunity/reduced cost of a given decision variable can be interpreted as the rate at which the value of the objective function (i.e. profit) will deteriorate for each unit change in the optimized value of the decision variable with all other data held fixed.

The allowable increase/decrease associated with the original coefficient of a decision variable tells us the range in which the coefficient of a given decision variable in the objective function may be increased/decreased without changing the optimal solution, where all other data are fixed.
Figure 2: Percent Of Product Type Manufactured
Costs Of The System
After calculating the gross profits for each product, Visions has to incorporate monthly labor and overhead costs. The labor cost is $12/hour, and the overhead cost is twice the labor cost. Thus the total cost per month can be calculated as follows:
Equation 4: Labor Cost
$12/hour (labor cost) * 7.50 hours/day * 22 days/month * 10 workers = $19800/month
Equation 5: Overhead Cost
$19800 (labor cost) *2 = $39,600/month

Thus, the total overhead and labor cost calculated in equation 4 and 5 for each month is $59,400. Thus, the final profit is calculated as follows in Equation 6.
Equation 6: Profit
Profit = $426,620 - $59,400 = $367,220
Using the current process time of Vision, it takes approximately 1.3 months to finished the 131 batches. Vision can satisfy the minimum requirements of Replenish offer that is 60 batches for one month. Since Replenish will take over the company after one month of production, it is not necessary to create a process improvement. Also, the new process will affect the workers learning curve and create more delays in one month rather than improving it. Replenish’s offer still better offer compare to iDrop’s offer because Vision makes a net profit of $367,220.00 from one-month production.
5.3 Lease Company
Since the owners are unable to run the company, but still own the idea and the company, a recommendation can be to lease out the company. If Jeffrey and Abby Visi decide to take this recommendation, they will not have to worry about any operations. The owners instead get an industry standard equity 7% of the company profits according to Nolo.com. (http://www.nolo.com/legal-encyclopedia/clb-percentage-rent.html).
Based on the linear program model used in the last recommendation, there is one product that the most profitable compared to the others. However, as a rule of economics, it is recommended to sell other products to be marketable in the industry. For this reason, the values obtained from the linear programming model will be employed to calculate the amount of profit that Visions could achieve with leasing out their business. Table 9 summarizes the following: net profits/product, labor cost and ultimately the net income with all variables included. They will all be in monthly values.
The quantity amount in the table takes account the production quantity percentage Replenished requested (65.64% for No Preservatives, and 11.45% for each the rest of the products). The percentage is multiplied by the monthly production rate found by:

Equation 7: Acceptable Bottles/Month
550.8 bottles/day * 10 lines * 21.667 working days in a month = 119341.8 bottles/month
In terms of the scrap rate, the calculation for the total cost are as follows:
Equation 8: Scrap Bottles/Month
(1200 bottles)*(0.15 scrap rate)*(0.476 batches/day)*(10 lines)*(21.667 days in a month) = 18,514 scrapped bottles/month
Multiplying the scrapped bottles into their respective percentages:
Table 8: Total Scrap Costs Per Month
Table 9: Owners Income
5.4 Hire Board of Directors (BOD)

Jeff and Abby Visi, founders of Visions have recently been encountered with an emergency situation that will prohibit them to be with the business. The engineering team recommends that Visions hire a Board of Directors (BOD) that would be responsible for managing the operations of the facility. By hiring the BOD, Visions will continue to operate in the same manner but the Board would be in charge of making decisions. It is also crucial to assure that everyone will be satisfied with this decision. Therefore, Jeff and Abby will continue supplying the raw materials from their financial account and will need to agree to split profits at 25% with the BOD.
Even though Jeff and Abby will not be operating the company, it is still vital to ensure an efficient production process. The current manufacturing process has not been altered since the company first opened. Therefore, it is an excellent opportunity to make process improvements. As mentioned previously the current process requires 12.5 hours to produce a batch and allows the system to produce ~550 bottles/month with the scrap rate factored in. Below illustrates a new process that tackles various aspects that the team noticed.
Figure 3: Future State Of The System
A major point of interest was reducing the scrap rate since it accounted for an enormous cost in the current system. The improve system adds a sub-operation that tackles the scrap, moreover, this operation will require a worker to perform the rework. Based on the teams engineering judgment and work experiences the rework operation will reduce the scrap rate from 15% to 7%.

Table 10: Net Profit Per Year
This process will include a rework station that will cut the scrap rate from 15% to 7%. The amount of bottles going to scrap are shown in equation 9.
Equation 9: Scrapped Bottles/Month
(1200 bottles)*(0.07 scrap)*(0.7105 batches/day)*(5 lines)*(21.667 days in a month) =6,465.65 scrapped bottles/month
The amount of bottles that are accepted are shown in equation 10.
Equation 10: Accepted Bottles/Month
792.95 bottles/day * 5 lines * 21.667 working days in a month = 85,901 bottles/month
The quantity amount in the table takes account the production quantity percentage Replenished requested (65.64% for No Preservatives, and 11.45% for each the rest of the products). Bottles into their respective rates are shown in equation 11.
Equation 11: Percentages
Redness Relief 11.45%: 9,836 x $2.91 = $26,622.76
Seasonal 11.45%: 9,836 x $1.88 = $18,491.68
No Preservatives 65.64%: 56,385 x $7.26 = $409,355.10

Intense Dry Eyes 11.45%: 9,836 x $4.35 = $42,786.60
Summing all the percentages together, the total revenue is $497,256.14/month. Net income is then found in equation 12.
Equation 12: Net Income
Net Income = $497,256.14 - ($58,500 + $27,128.11) = $411,628/month
The net income is split into the BOD and owners. The team has decided that 25% of the net income should be assigned to the BOD while the rest goes to the owners.
Equation 13: Splitting the money between the BOD and Owners
75%: Designated to the Owners ⇒ (0.75) ($411,628) = $308,721/month
= $3,704,652/year
25%: Designated to the BOD ⇒ (0.25) ($411,628) = $102,907/month
= $1,234,884/year
The BOD will consist of the CEO, CFO, COO, President, & the General Manager. The BOD will be financially compensated on a salary basis. Table 11 illustrates the breakdown of the salaries.
Table 11: BOD Salaries

5.5 Outsource Production
Drug reformulations, changing patient demographics, innovative dosing/delivery technologies, and new demand from newly opened markets are drivers for ophthalmic pharmaceuticals now and for the next five years. Estimates about the current annual size of the global ophthalmic pharmaceutical market are in the range of $16 to $17 billion per year with a steady growth of 6% per year for the next five years. The US market only accounts for little more than a third of that amount. Many of the small companies do not have the capacity or expertise themselves to manufacture, thus they do not have the capacity to take the next steps to carry their products eventually to market, which leads them to outsource most of their products. Several research experts have suggested these small companies into a market expansion into new geographic areas. These small companies have started to expand to the Asian market, especially India. There’s some skepticism about China, but India seems to be the new growth area. The other emerging countries that can be taken into consideration include China and Latin American countries. Thus, for this instance we will evaluate the pros/cons of outsourcing Visions’ production to India.
After careful research and analysis of the different countries, we have decided to outsource our production to India. When outsourcing production to India, the company will profit from cheaper labor and overhead. Thus, the company would benefit from hiring low-income or even minimum wage workers for the most part. These workers can be paid either on an hourly rate or a piece rate. Either way, the cost to produce an item per unit is significantly reduced, as labor cost in India is barely a fourth of what they pay workers in the US. To illustrate this, we will use the current hourly wage is $12.00/hour, and the average worker works 8 hours a day, working for 25 days a month. When we multiply all these components, the average factory worker earns $2400. To compare the situation in India, we would use the same working conditions in the same manufacturing sector and pay these workers $600/month. The reason these people are willing and able to work at such a low wage is because of the lower standard of living. In addition to the low labor costs, there are fewer worker unions in India that prevent wages from bubbling. Secondly, variable cost is also significantly reduced due to cheaper raw materials. The United States has been the leading eye drop supplier for the most time though they are losing ground to other countries namely Brazil, China and India.
Table 12: Global Leaders Table in Ophthalmic Products from 2007-2013
Country Year
2007 2008 2009 2010 2011 2012 2013

Figure 4: Global Leaders Graph in Ophthalmic Products from 2007-2013
Figure 4 above shows the current growth trend for the global leaders in ophthalmic products. The blue dotted line indicates the US share of world trade growth. The line shows a decreased growth from the years 2007-2013. On the other hand, the market share for India is growing exponentially from years 2010 onwards and is picking up its pace. The growth for India is marked in the green line. This growth spurt would increase the supply of ophthalmic products in India, thus reducing the prices of ophthalmic products and its ability to expand Visions’ market to India.
U.S.A. 33.23% 25.49% 21.13% 21.23% 20.57% 20.61% 20.64%
Argentina 8.21% 10.89% 12.73% 12.92% 14.44% 16.20% 16.65%
India 7.10% 6.89% 8.23% 11.00% 16.76% 22.30% 26.20%
China 14.23% 14.26% 12.35% 13.32% 13.89% 13.39% 13.35%

The third noticeable outcome is longer working hours. The standard working hours for the current eye drop-manufacturing warehouse is 7 in half hours plus we have to take into account PFD. While in India the working hours is usually 9-10 hours. With longer working hours and a flat wage system, the company could increase its daily output without increasing its salary expenses.
There are several implied adverse outcomes if the company decides to outsource its production as well. The first negative outcome is setup costs. For Visions to set up a plant in India, they need to allocate time to find a location and set up their facility. The company would have to seek new active ingredient and purified water suppliers and strategically find an area and build a new facility. The land will also have to either be bought or leased, which is another cost to take into account. Overall, this will require a big investment and would not be strategic if the company does is not in a cash cow state. The second conflicting outcome is the need to send existing managers and supervisors abroad. The company needs managers and supervisors with experience and expertise to train and inspect the new factory. They would have to leave their families and thus compensated to work in a country where they have never lived before. We also need to keep in mind the quality control since a new facility might yield higher scrap rates initially before it plateaus in the long. Thus, the products need to be carefully inspected before hitting the sales floor. The next negative outcome is in regards to the quality of labor. When outsourcing to the Southern East Asian countries like India and China, the company needs to take into account the quality of education. Most of the population is living in poverty, and the government is not subsidizing grants or providing any education that is accessible to these people. Therefore, it is safe to assume the academic level for these minimum wage workers is minuscule. Having a lower level of education might directly translate to their work ethics and the training required manufacturing these products. It is safe to assume that these people have very little machining, manufacturing, and chemical knowledge; thus training is one of the significant costs, and even with an intense training, the outcome might not be the same.

Figure 5: SWOT Chart
5.6 Conclusion
We recommend Jeff and Abby to keep the business and to hire a board of directors. This option will yield a maximum of 3.9 million dollars a year by only being the capital investors of the company. Outsourcing is good option, but not for their current state. This is because there are too many variables associated with it, so no monetary value can be put. It is therefore a risk at the moment. After the BOD has been established, then outsourcing to maximize profits can be assessed.