Embed Size (px)
Citation preview

Production Practices for Major Crops in U.S. Agriculture, 1990-97. By Merritt Padgitt,Doris Newton, Renata Penn, and Carmen Sandretto. Resource Economics Division, EconomicResearch Service, U.S. Department of Agriculture. Statistical Bulletin No. 969.
AbstractThis report presents information on nutrient and pest management practices, crop residue man-agement, and other general crop management practices in use on U.S. farms. The public hasexpressed concerns about the possible undesirable effects of contemporary agricultural prac-tices on human health and natural resources. Partly as a response to these concerns, the U.S.Department of Agriculture began collecting information from farmers on their agricultural pro-duction practices in 1964. In 1990, through the President’s Water Quality Initiative, the USDAexpanded its data collection efforts. The information presented in this report is largely for the1990’s. Although the information cannot contribute to the science underlying the debate aboutthe effects of agriculture on human health and environmental risk, it can provide informationon the use of relevant inputs and production practices that are likely to abate, or to exacerbate,undesirable effects.
Keywords: Crop rotation, nutrient management, pest management, pesticide use, tillage systems.
AcknowledgmentsThe authors thank the following persons for their thoughtful reviews and constructive com-ments: Mohinder Gill, Cathy Greene, Wen Huang, Stan Daberkow, Van Johnson, CharlesLander, Dave Schertz, Arnold Aspelin, Art Grube, Steve Nako, Al Halvorson, Ken Baum, HarryVroomen, Bob Reinsel, Kevin Ingram, and Hisham El-Osta. Thanks also to Dave Shank,George Silva, and Vince Breneman for support in developing charts and maps for this report.Special thanks also to ERS’s Information Services Division for their editing and design. Theauthors also acknowledge the Resource Economics Division’s management staff, includingMary Ahearn, Carol Kramer-LeBlanc, Margot Anderson, John Reilly, and William Anderson,for their constructive input and comments.
Washington, DC 20036-5831 August 2000

ii � Production Practices for Major Crops in U.S. Agriculture, 1990-97 Economic Research Service/USDA
Contents
Highlights . . . . . . . . . . . . . . . . . . . . . . . . . . . . . . . . . . . . . . . . . . . . . . . . . . . . . . . . . . . . . . . . . . . . . . . . .iii
I. Introduction . . . . . . . . . . . . . . . . . . . . . . . . . . . . . . . . . . . . . . . . . . . . . . . . . . . . . . . . . . . . . . . . . . . . . .1
Historical Trends in Farming Practices . . . . . . . . . . . . . . . . . . . . . . . . . . . . . . . . . . . . . . . . .1
Organization of Report . . . . . . . . . . . . . . . . . . . . . . . . . . . . . . . . . . . . . . . . . . . . . . . . . . . . .4
II. Soil Nutrient Management Practices . . . . . . . . . . . . . . . . . . . . . . . . . . . . . . . . . . . . . . . . . . . . . . . . . .5
Primary Nutrient Consumption . . . . . . . . . . . . . . . . . . . . . . . . . . . . . . . . . . . . . . . . . . . . . . .6
Nutrient Management Practices . . . . . . . . . . . . . . . . . . . . . . . . . . . . . . . . . . . . . . . . . . . . . .12
Acres Treated with Livestock Manure . . . . . . . . . . . . . . . . . . . . . . . . . . . . . . . . . . . . . . . . .15
Use of Nitrogen Stabilizers for Corn . . . . . . . . . . . . . . . . . . . . . . . . . . . . . . . . . . . . . . . . . .16
III. Pest Management Practices in Crop Production . . . . . . . . . . . . . . . . . . . . . . . . . . . . . . . . . . . . . . .17
Pesticide Use . . . . . . . . . . . . . . . . . . . . . . . . . . . . . . . . . . . . . . . . . . . . . . . . . . . . . . . . . . . .19
Primary Target Insects . . . . . . . . . . . . . . . . . . . . . . . . . . . . . . . . . . . . . . . . . . . . . . . . . . . . .31
Pest Monitoring Practices . . . . . . . . . . . . . . . . . . . . . . . . . . . . . . . . . . . . . . . . . . . . . . . . . .32
Practices to Reduce Pest Infestations . . . . . . . . . . . . . . . . . . . . . . . . . . . . . . . . . . . . . . . . . .36
Pesticide Application Decision Factors . . . . . . . . . . . . . . . . . . . . . . . . . . . . . . . . . . . . . . . .43
Information Sources for Making Pest Management Decisions . . . . . . . . . . . . . . . . . . . . . . .46
Pesticide Application Methods . . . . . . . . . . . . . . . . . . . . . . . . . . . . . . . . . . . . . . . . . . . . . . .47
IV. General Crop Management Practices . . . . . . . . . . . . . . . . . . . . . . . . . . . . . . . . . . . . . . . . . . . . . . . .53
Crop Rotations . . . . . . . . . . . . . . . . . . . . . . . . . . . . . . . . . . . . . . . . . . . . . . . . . . . . . . . . . .53
Average Annual Nitrogen Use with Alternative Crop Rotations . . . . . . . . . . . . . . . . . . . . . .60
Crop Area with Winter Cover Crops . . . . . . . . . . . . . . . . . . . . . . . . . . . . . . . . . . . . . . . . . .61
Drilled and Narrow-Row Soybeans . . . . . . . . . . . . . . . . . . . . . . . . . . . . . . . . . . . . . . . . . . .62
Organic Production Practices . . . . . . . . . . . . . . . . . . . . . . . . . . . . . . . . . . . . . . . . . . . . . . . .63
V. Crop Residue Management Practices . . . . . . . . . . . . . . . . . . . . . . . . . . . . . . . . . . . . . . . . . . . . . . . . .65
Crop Residue Management in the United States, 1997 . . . . . . . . . . . . . . . . . . . . . . . . . . . . .68
Crop Residue Levels on Planted Acreage by Regions, 1997 . . . . . . . . . . . . . . . . . . . . . . . . .69
Applied Conservation Tillage Practices, 1997 . . . . . . . . . . . . . . . . . . . . . . . . . . . . . . . . . . .71
Trends in Conservation Tillage Use, 1990-97 . . . . . . . . . . . . . . . . . . . . . . . . . . . . . . . . . . . .73
Pesticide Use by Tillage System, 1997 . . . . . . . . . . . . . . . . . . . . . . . . . . . . . . . . . . . . . . . .74
Herbicide Application Rate Variation between Fields, by Tillage Systems . . . . . . . . . . . . . .75
Cultivation of Row Crops . . . . . . . . . . . . . . . . . . . . . . . . . . . . . . . . . . . . . . . . . . . . . . . . . .75
Herbicide Application Rate Variation between Fields,by Number of Cultivations . . . . . . . . . . . . . . . . . . . . . . . . . . . . . . . . . . . . . . . . . . . . . . . .76
Bibliography . . . . . . . . . . . . . . . . . . . . . . . . . . . . . . . . . . . . . . . . . . . . . . . . . . . . . . . . . . . . . . . . . . . . . .77
Appendix A . . . . . . . . . . . . . . . . . . . . . . . . . . . . . . . . . . . . . . . . . . . . . . . . . . . . . . . . . . . . . . . . . . . . . . .82
Appendix B . . . . . . . . . . . . . . . . . . . . . . . . . . . . . . . . . . . . . . . . . . . . . . . . . . . . . . . . . . . . . . . . . . . . . . .88
Electronic Data Files . . . . . . . . . . . . . . . . . . . . . . . . . . . . . . . . . . . . . . . . . . . . . . . . . . . . . . . . . . . . . . .104

This report presents information on nutrient and pest man-agement practices, crop residue management, and other gen-eral crop management practices in use on U.S. farms.Farmers are the primary decisionmakers on how they com-bine their production resources and management skills toproduce food and fiber. Changes in farmer practices overtime, but especially since the end of World War II, havegreatly increased agricultural productivity. However, thepublic has expressed concerns about the possible undesir-able effects of contemporary agricultural practices that relyheavily on commercial fertilizers and chemical pesticides.Partly as a response to these concerns, the U.S. Departmentof Agriculture (USDA) began collecting information fromfarmers on their chemical inputs and agricultural productionpractices in 1964. In 1990, through the President’s WaterQuality Initiative, the USDA expanded its data collectionefforts. The information presented in this report is largelyfor the 1990’s. Although the information cannot contributeto the science underlying the debate about the effects ofagriculture on human health and environmental risk, it canprovide information on the use of relevant inputs and pro-duction practices that are likely to abate, or to exacerbate,undesirable effects.
Nutrient ManagementIn the 1996 National Water Quality Inventory, the U.S.Environmental Protection Agency reported that agricultureranks first as the leading source of water quality problemsfor lakes and rivers and ranks fifth for contributing to thedegradation of estuaries. More than 20 million tons of com-mercial fertilizer nutrients are used in the United Statesannually, and most of it is applied to agricultural land.Different nutrient management practices can affect both thequantity of commercial fertilizer needed for crop productionand any potential movement of applied nutrients by leach-ing, runoff, or volatilization. The USDA survey findingsabout nutrient management practices are highlighted below:
• Three-fourths of the cropland acres represented by thesurveys were treated with commercial fertilizers (the sur-veys represented approximately 60 percent of U.S. crop-land used for crops). Nitrogen, the most widely usednutrient, was applied to 71 percent of the area andaccounted for half of the total quantity of all primarynutrients applied. Phosphate was applied to 60 percent ofthe area and potash to 44 percent.
• Corn, with 99 percent of its planted area treated, account-ed for 45 percent of the total area of the surveyed cropsreceiving fertilizer. The average application rate across allcorn acres receiving nitrogen fertilizer was 132 poundsper acre. Vegetable crops and potatoes had the mostintensive use of nitrogen fertilizer. Although averageapplication rates for vegetables and potatoes often
exceeded 200 pounds per acre, the nitrogen applied tothese crops accounted for only 1 percent of the total useof nitrogen.
• Nutrient application rates vary widely among fields plant-ed to the same crop depending on yield expectations andgrowing conditions. For corn, the lowest 20 percent of theacreage (14 million acres) received nitrogen applicationsof 80 pounds or less per acre while the highest 20 percentreceived applications of more than 180 pounds per acre.
• Timing fertilizer applications to coincide with the crop’sbiological nutrient needs or to reduce potential nutrientlosses from leaching, runoff, or volatilization can reduceseasonal application rates. About three-fourths of thenitrogen fertilizer was applied before or at planting time.About 28 percent of all nitrogen was applied in the fall,and most of that was for crops to be planted in the fol-lowing spring. The fall applications reduce peak springlabor demands when weather can limit available workingdays, but fall-applied nitrogen has a greater potential forloss.
• Laboratory tests of soil samples can help farmers deter-mine their need for commercial fertilizers. Soil tests wereconducted for about one-fifth of the represented cropland.The practice was most common on land planted to fruits,vegetables, and cotton. About half of the corn acreagehaving soil tests included a test for nitrogen.
• Livestock manure is a source of plant nutrients, but itsuse is mostly limited to farms that have both crop andlivestock enterprises. About 8 percent of the representedcropland, mostly planted to corn, had manure applied.The manure was analyzed for its nutrient content onabout 10 percent of the area receiving manure.
Pest ManagementThe use of pest-resistant crops as well as various kinds ofcultural practices can reduce farmers’ reliance on pesticides.About 900 million pounds of pesticides are used annuallyby U.S. agriculture to control weeds, insects, diseases, andother pests. Their use has raised concerns about their poten-tial risk to human health and the possible environmentalimpacts on wildlife species and their habitats. The surveyfindings about pest management practices are highlightedbelow:
• Pest management on most cropland includes both culturalpractices and the use of pesticides. At least some pesti-cides—herbicides, insecticides, fungicides, growth regu-lators, defoliants, or desiccants—were applied to 90 per-cent of the represented cropland.
• Corn, with 98 percent of the area treated with some pesti-cide, accounted for 39 percent of the total pounds of pes-
Economic Research Service/USDA Production Practices for Major Crops in U.S. Agriculture, 1990-97 ❖ iii
Highlights

ticides applied to all surveyed commodities. All but 7 per-cent of the quantity applied to corn was for weed control.
• Cotton farmers were the largest users of insecticides.Representing only 7 percent of the surveyed commodityarea, cotton accounted for 32 percent of the total poundsof insecticides.
• Fruits, vegetables, and potatoes accounted for 98 percentof all pesticides applied to control diseases (fungicides).
• Between 1990 and 1997, planted crop area and totalpounds of pesticides applied remained relativelyunchanged. However, the share of acres treated with pes-ticides increased as did the number of treatments appliedper acre. The amount of pesticide applied with each treat-ment declined with the adoption of products applied atultra-low rates, band treatments, and reduction in theapplication rates for some ingredients.
• The boll weevil and boll worm were the leading targetpests for cotton insecticide treatments, while corn root-worm and corn borers were the leading target pests forcorn insecticide treatments. Bt-transgenic corn and cottonseeds, crop rotations, and other pest management prac-tices are used to reduce the reliance on pesticides to con-trol these major pests.
• Pest-monitoring practices include field scouting, soil andplant tissue testing, traps baited with attractants, and fieldmapping for weeds. Nearly 80 percent of the surveyedcrop acres were scouted; pheromone traps were used onnearly one-fourth of the cotton, fruit, and vegetable acres,and weed mapping was used on about one-fifth of thefield crop acres. Soil and tissue testing for pests was usedon about 4 percent of the surveyed crop acres. Pest moni-toring was prevalent on crops receiving the most intensivetreatments with insecticides and fungicides.
• Many insecticide application decisions are made by com-paring the insect infestation level to a calculated thresh-old where the economic losses, if left untreated, areexpected to exceed the cost of treatment (economicthreshold). For nearly 45 percent of the surveyed cropacres receiving insecticides, a threshold concept was usedto make the treatment decision. For most of the remainingacreage, treatment decisions were based on historic infor-mation or preventive schedules.
• Pest preventive practices, such as crop rotation, plantingdisease-resistant seeds/rootstocks, or adjusting plantingdates to avoid certain pests, were widely applied. Over 80percent of the row crop acreage (corn, soybeans, cotton,and potatoes) was in some type of crop rotation, and halfof the represented acreage used resistant varieties/root-stocks and about 35 percent adjusted planting dates.
Crop RotationCrop rotation is used to reduce soil erosion, increase soilproductivity, break pest cycles, and reduce the developmentof pesticide-resistant pests. The survey findings about theuse of crop rotations are highlighted below:
• Eighty-two percent of the represented acreage of majorfield crops (corn, soybeans, wheat, and cotton) was in acrop rotation. Cotton was the only field crop where thesame crop was planted for at least 3 consecutive years(monoculture) on a large share of the acres. A monocul-ture system was used on 60 percent of the land planted tocotton.
• About three-fourths of the wheat acres were in a croprotation. A wheat-fallow system is commonly used in theNorthwestern growing regions. The monoculture systemfor growing wheat was most common in the SouthernPlains.
• About 85 percent of the corn acreage was in a crop rota-tion. Until the recent development of resistant species,rotating corn with just about any other crop preventeddamaging infestations by corn rootworm—the majortarget pest for corn insecticide treatments. Continuouscorn production was most common in Nebraska andKansas, States where corn rootworm treatments weremost prevalent.
• Rotations that include hay, meadow, or pasture provideprotection against soil erosion, and those that include alegume crop can reduce nitrogen fertilizer needs. Onlyabout 3 percent of the surveyed crop area had a meadowor pasture crop in either of the preceding 2 years.
Crop Residue ManagementCrop residue management (CRM) systems use fewer and/orless intensive tillage operations, often combined with covercrops and other conservation practices, to provide sufficientresidue cover to help protect soil from wind and water ero-sion. CRM is generally a cost-effective method of erosioncontrol (requiring fewer resources than intensive structuralmeasures such as terraces) that can be implemented in atimely manner to meet conservation requirements and envi-ronmental goals. Decreasing the intensity of tillage or reduc-ing the number of operations with CRM can potentiallyresult in cost savings to farmers through reduced fuel, labor,machinery, and time requirements. However, any potentialcost savings may be offset somewhat by increases in chemi-cal costs, depending on the herbicides selected for weedcontrol and the fertilizers required to attain optimal yields.Surveys conducted by the Conservation TechnologyInformation Center and USDA’s surveys of field crops foundthat:
• Conservation tillage (no-till, ridge-till, and mulch-till)was used on almost 110 million acres in 1997, more than
iv ❖ Production Practices for Major Crops in U.S. Agriculture, 1990-97 Economic Research Service/USDA

37 percent of U.S. planted cropland area. Most of thegrowth in conservation tillage since 1990 came fromexpanded no-till and a concurrent decline in conventionaltillage.
• Conservation tillage was used mainly on corn, soybeans,small grains, and sorghum in 1997. More than 47 percentof the total acreage planted to corn and soybeans wasconservation-tilled. Expanded use of no-till has been sig-nificant on all major crops since 1990, but no-till use con-tinues to be greater for corn and soybeans than for smallgrains or sorghum.
• Cultivation of row crops is primarily used to kill weedsand thereby reduce the need for herbicide treatments, butcultivations are also used to shape the surface for furrowirrigation or to maintain ridges in ridge-till systems.Nearly two-thirds of the corn area, 40 percent of the soy-beans, and nearly all cotton received at least one cultiva-tion. Fields receiving three or more cultivations used lessherbicide for weed control than fields receiving fewer orno cultivations.
Economic Research Service/USDA Production Practices for Major Crops in U.S. Agriculture, 1990-97 ❖ v


Introduction
Changes in U.S. farming practices since the end of WorldWar II have brought large increases in agricultural produc-tivity. However, soil erosion, sedimentation in streams andreservoirs, pollution of surface waters, contamination ofground water, and degradation of wildlife habitats have, atleast partially, been attributed to the use of agriculturalchemicals and changes in crop production practices [NRC,1989]. The potential exposure to agricultural chemicalsposes a health risk to farmers and farmworkers [Litovitz,Schmitz, Bailey, 1990; Ciesielski, Looms, Miss, and Amer,1994], while the possibility of chemical residues in drinkingwater or food is a concern of consumers [Alavanja, Blair,McMaster, and Sandler, 1996; van Ravenswaay, 1995;Buzby and Skees, 1994; Collins, 1992; NRC, 1993].Farmers are the primary decisionmakers on how they com-bine their production resources and management skills toproduce food and fiber, but increasingly they face pressuresto use production systems that are friendlier to the environ-ment and pose fewer potential health risks.
This bulletin reports the results of farm commodity surveysconducted between 1990 and 1997 by USDA. The surveysprovide information on chemical inputs in agriculture andthe use of farming practices that may affect the intensitywith which fertilizers and pesticides are used or their poten-tial cost to the environment. How agricultural chemicals andpractices ultimately affect human health or the environmentis a complex process and requires research beyond the scopeof this report. Data in this report, however, can help answerquestions about how intensively agricultural chemicals areused and what practices are used that may abate (or exacer-bate) undesirable effects. Besides supporting research onsuch environmental and social issues, the data can also helpprivate industry to assess potential markets for biotechnolo-gy or other production inputs that may offer both environ-mental and health benefits.
Historical Trends in Farming PracticesFarming practices have evolved considerably throughoutU.S. history. In the last 200 years, U.S. farming technologyhas evolved from an individual, labor-intensive process intoa capital-intensive and highly skilled but labor-efficient one.Changes in mechanical, chemical, and biological technolo-gies are often cited as responsible for the changes in agricul-tural production practices. Each period has brought newtechnologies and practices that have unleashed large gains inagricultural productivity, but sometimes at the cost ofincreased stresses on natural resources.
In the precolonial and colonial periods, agriculture waslabor-intensive and conducted with crude tools and limiteduse of draft animals [Edwards, 1940]. Labor was scarce andnew land was plentiful, so farmers made little effort to pro-tect their soil from erosion or to replenish soil nutrients. Themoldboard plow became widely used to till the soil and pre-pare weed-free seedbeds for good early plant growth. Thepractice, however, disturbed the soil structure and removedvegetative cover, leaving the land more susceptible to soilerosion and a potential source of water quality problems.
The mechanical revolution (mid-1800’s to the beginning ofWorld War II) brought rapid changes in farm power sources,farm implements, and transportation [Hambidge, 1940].Tractors replaced draft animals, and many other labor-sav-ing machines allowed farmers to farm more land with lesslabor. Improved transportation and storage allowed farmproducts to be transported longer distances to growing mar-kets. Mechanized agriculture allowed more intensive use ofcropland and often brought more fragile land into produc-tion that had greater potential for soil erosion. The stress onthe land and the need for natural resource protection becameapparent from abandoned cropland, gullies dissecting fields,the high volume of silt in streams and rivers, and the 1930’s“dust bowls” [Bennett, 1939]. Voluntarily, either at theirown expense or with Federal subsidies, many farmers adopt-ed contour and strip farming practices, installed terraces and
Economic Research Service/USDA Production Practices for Major Crops in U.S. Agriculture, 1990-97 ❖ 1
Production Practices for Major Crops in U.S. Agriculture, 1990-97
Merritt PadgittDoris NewtonRenata Penn
Carmen Sandretto

grassed waterways, or used crop rotations and other meansto protect their land [Parks, 1952].
Advances in chemical manufacturing following World WarII introduced many new products to agriculture to supple-ment soil nutrients and to control pests [NRC, 1989;Blackman, 1997]. High-analysis chemical fertilizers such assuper phosphate, urea, and anhydrous ammonia came to besubstituted for manure, bloodmeal, and other organic mate-rials previously used to supply plant nutrients. Commercialfertilizers restored nutrient-deficient soils and gave farmersthe option for continued intensive production of crops.Synthetic pesticides greatly expanded pest managementoptions and crop production choices. The ability to chemi-cally control weeds significantly reduced the need for capi-tal- and labor-intensive tillage methods and allowed farmersto further expand the size of their operations. Reducing therisk of damages from insects or disease with pesticides alsohelped to stabilize yields and prices. Pesticides that stimulat-ed uniform growth patterns, defoliated plants, or causedsimultaneous fruit ripening made machine harvesting feasi-ble or more efficient and replaced agricultural laborers.
Other major innovations during this period includedimprovements in plant breeding and genetics. New seedsthat were higher yielding, superior in grain quality, resistantto diseases, tolerant of a wide range of weather conditions,or uniform in size and maturity contributed to increased pro-ductivity [Gresshoff, 1997]. With these improvements camethe need for additional fertilizer to support the higher yields.Genetic engineering, which develops seeds that can producetheir own toxins against insect pests or that are resistant tothe application of broad-based herbicides, now providesfarmers with additional options for pest control that maylead to changes in pesticide use.
Growth in Productivity, Output,and Inputs, 1948-96The effect of agricultural technologies is reflected in theindicators of growth in agricultural productivity (fig. 1A).Agricultural productivity is measured by comparing totaloutputs to total inputs in the agricultural sector for a givenperiod. Productivity grows when real output increases fasterthan the growth in the use of combined inputs. Agriculturalproductivity rose more than 230 percent between 1948 and1996, an annual rate of 1.9 percent [Ahearn, Yee, Ball, andNehring, 1998]. The input indicator, an aggregate measureof all inputs, fell during this period, largely as a result ofdeclines in labor input. The declines in labor use were offsetby increases in other inputs such as farm machinery,improved seeds, fertilizers, and pesticides.
Trends in Use of Fertilizer and PesticideWhile the aggregate of all inputs in agriculture has dropped,the use of chemicals has increased (fig. 1B). The quantity ofactive ingredients in both nutrients and pesticides showed acontinuous upward trend until the early 1980’s. During thistime, fertilizers and pesticides were applied to more acres,and application rates increased. Since about 1982, total agri-cultural chemical use has varied, mainly with changes inplanted acreage, government set-aside requirements, weath-er, and levels of pest infestation.
Pesticide use, as conventionally reported in pounds of activeingredients, does not account for the many changes in pesti-cide products over the last several decades. Many newerproducts are more selective in the pests they control and lesspersistent in the environment. Newer products are frequentlyapplied at lower application rates with equal or improvedefficacy. When adjustments were made for such changes inquality and potency over time, the upward trend in the pesti-cide indicator continued after 1982 [Ahearn, Yee, Ball, andNehring, 1998].
Environmental Effects from Agricultural ProductionAgriculture affects the environment through many complexphysical/biological relationships, not all of which are fullyunderstood. The physical attributes, application methods,episodic weather events, and timing of chemical inputsalong with soil and water management practices can have amajor effect on the transport and risk exposure of agricultur-al chemicals to humans or wildlife species.
2 ❖ Production Practices for Major Crops in U.S. Agriculture, 1990-97 Economic Research Service/USDA
1948 58 68 78 88 9675
125
175
225
1948 = 100
Figure 1A
Growth in productivity, outputs, and inputs,1948-96
Productivity
OutputsInputs
Source: Ahearn, Yee, Ball, and Nehring, 1998

Even though major strides have been made in recent yearsto reduce surface water pollution from nonagriculturalsources, surface water pollution continues to dominate waterquality issues. In the National Water Quality Inventory(1996), the U.S. Environmental Protection Agency (EPA)reported that agriculture ranks first as the leading source ofwater quality problems for lakes and rivers, and ranks fifthfor contributing to the degradation of estuaries. The com-bined effects of agricultural activities, including livestockfacilities, were reported to have contributed to the impair-ment of 25 percent of the river miles, 19 percent of the lakeareas, and 10 percent of estuary areas surveyed in theNational Water Quality Inventory [EPA, 1999]. The surveyrepresented approximately 19 percent of the rivers, 40 per-
cent of the lakes, and 72 percent of the estuaries in theNation. The results do not represent unsurveyed portions ofthese U.S. water resources. Of the impaired rivers, 18 per-cent were impaired by siltation, 14 percent by nutrients, and7 percent by pesticides. Siltation and nutrients were alsomajor contributors to the impairment of lakes and estuaries.
Ground water quality has also been affected by agriculturalresiduals. The contamination of ground water is particularlyimportant because ground water provides drinking water forhalf of the U.S. population and removing chemical residuesis extremely difficult and costly. Because of the slow-mov-ing nature of ground water, the concentration of contami-nants can increase over time and persist for many years.Tumors (malignant or nonmalignant), reproductive disor-ders, and neurological problems are among the potentialhealth concerns when threshold levels of certain pesticidesare reached [Blair, 1992].
The National Survey of Drinking Water Wells conducted in1988-90 provides some indication of agriculture’s impact onground water [EPA, 1995]. Nitrates were the most frequent-ly detected chemicals in ground water used as a source fordrinking water. The EPA reported that about 4.5 millionpeople using water from community well water systems orrural domestic wells were exposed to nitrates exceedingmaximum contaminant levels set by the EPA. Excessnitrates in drinking water have been linked to methemoglo-binemia, a condition that impairs the ability of an infant’sblood to carry oxygen, and have been suggested to increasecancer risk [National Research Council, 1995]. The U.S.Geological Survey’s ground water monitoring found thatwells in agricultural areas more often exceeded the maxi-mum contaminant levels for nitrogen than wells in otherareas [Mueller and Helsel, 1996]. The EPA survey estimatedthat less than 1 percent of the rural domestic wells or wellsused for community water systems had any pesticide con-centrations exceeding the lifetime health advisory levels.The most frequently detected pesticide in ground water sup-plied to public water systems was atrazine [EPA, 1995]. Theuses of agricultural chemicals have also harmed wildlifethrough direct contact, destruction of food supplies, or alter-ation of habitats. Wetlands and aquatic ecosystems in agri-cultural watersheds are most vulnerable. Agriculture hasbeen identified as a source of pollutants that caused fishkills [EPA, 1995]. In 1,454 fish kills reported in 32 Statesand other U.S. jurisdictions in 1992-93, pollution was thecause about one-third of the time. Toxic pollutants, whichwere most often agricultural pesticides, were the cause forabout 5 percent of the kills.
Economic Research Service/USDA Production Practices for Major Crops in U.S. Agriculture, 1990-97 ❖ 3
1964 70 80 90 960
100
200
300
400
500
1964 70 80 90 968
10
12
14
16
18
20
22
24
26
Million nutrient tons
Commercial fertilizeruse in the United States
Adjusted pesticide input inagriculture, 1964-94
1964=100
Source: USDA, ERS, 1997.
Quality-adjusted index1
Total pounds ofactive ingredients
Figure 1B
Trends in use of fertilizer and pesticide
Adjusted for changes in the mix of pesticide ingredients and theirability to kill selected target pests and in their effects on theenvironment.
Source: Ahearn, Yee, Ball, and Nehring, 1998
1

Organization of ReportThe estimates of cropping practices and chemical use pre-sented in the following chapters are based on several inde-pendent commodity surveys. Estimates from these surveyshave been consolidated to represent nearly 60 percent of theU.S. cropland used for crops. The commodities includemajor field crops (corn, soybeans, wheat, cotton, and fallpotatoes) and 24 fruit and 21 vegetable crops. While thecommodities included in the surveys represent a large shareof cropland and chemical inputs in agriculture, other agri-cultural commodities also use significant quantities of com-mercial fertilizers and pesticides and may have environmen-tal impacts. Crops not represented include both those thathave relatively intensive use of inputs, such as rice, tobacco,
and horticultural crops, as well as those that have lowerinput use, such as hay and fallow.
Chapters II and III present information on the use of fertiliz-er and nutrient management practices and pesticides andpest management practices. The next chapter discusses theuse of general crop management practices such as crop rota-tions and cover crops and associated chemical usage. Thelast chapter presents information on tillage systems andother practices related to soil management and the chemicaluse associated with these practices. In addition to the appen-dix tables in this report, an electronic data product is avail-able that provides State-level estimates and additional detailabout the cropping practices reported in this bulletin.
4 ❖ Production Practices for Major Crops in U.S. Agriculture, 1990-97 Economic Research Service/USDA

This chapter presents information about fertilizer andnutrient management practices used in the production of
major field crops, fruits, and vegetables. The estimates aredeveloped from producer surveys in the major productionStates for the selected crops and from other informationsources. See appendix A for a description of the surveys.
Managing soil fertility is essential for obtaining and sustain-ing high yields and making crop production profitable.While fertilizer expenditures account for a relatively smallshare of the total production cost for crops, commercial fer-tilizer is the largest cash expenditure in corn production aswell as a significant share of the cash expenditures for othercommodities [USDA, ERS, 1999]. Determining soil nutrientneeds, selecting the right fertilizer material, and decidingwhen and how to apply commercial fertilizer are importantdecisions for profitable crop production. Yield expectations,soil characteristics, previous crops, the use of livestockmanure or other waste materials, or other cultural practicesare other factors that can affect the quantity of commercialfertilizer applied. Timely applications that make nutrientsavailable at the time needed by the plants are important notonly for high yields, but also to prevent nutrient losses fromleaching, volatilization, runoff, and soil erosion. Excessiverainfall, drought, and other weather conditions also affectsoil nutrient levels, nutrient use by crops, and losses to theenvironment.
Marginal productivity estimates of fertilizer inputs havebeen estimated both from field trials using incremental
changes in application rates and at aggregate levels usingeconometric models. Early econometric studies [Griliches,1963; Padgitt, 1969; and Headley, 1972] show a marginalvalue return of $3 to $5 for each additional dollar of fertiliz-er expenditure. In 1975, Miranowski reported lower returnsfor cotton and provided some empirical evidence that theremay be some overuse of nitrogen by corn producers in someareas [Miranowski, 1975]. Field-level experiments for cornon highly productive, irrigated, silt loam soils in Kansas in1991 estimated a maximum profit nitrogen application atabout 160-170 pounds per acre [Schlegel and Havlin, 1995].Maximum profit fertilization levels, however, can varywidely from this estimate depending on other inputs, pro-duction practices, and climatic conditions.
Fertilizer use and nutrient management practices potentiallycan harm the environment [Mueller and Helsel, 1996].Concentration of nitrogen and phosphate in surface waterstimulates the growth of plants in lakes, streams, and estuar-ies and reduces their potential for recreational or other eco-nomic uses. High concentrations of nitrates in drinkingwater can also be a human health concern. Materials con-taining nitrogen or phosphate are the most widely used fer-tilizers and may contribute to these water quality problems.The U.S. Environmental Protection Agency reported thatnutrient loadings were the leading cause of water qualityimpairment in both lakes and estuaries, and the third andsixth leading causes of impairment in rivers and wetlandsystems [EPA, 1995].
Economic Research Service/USDA Production Practices for Major Crops in U.S. Agriculture, 1990-97 ❖ 5
Chapter II
Soil Nutrient Management Practices

Primary Nutrient ConsumptionNitrogen and phosphate fertilizers are the nutrients appliedto the largest share of acreage, according to USDA surveys.Nitrogen accounted for over half of fertilizer consumption,with some nitrogen fertilizer being applied to more than 70percent of the cropland in the surveys. Nearly 60 percent ofthe cropland in the surveys received phosphate fertilizer andabout 44 percent received potash (fig. 2A1). The total ton-nage of potash, however, exceeded phosphate because of itshigher application rates. Potash is a primary nutrient neededfor plant growth, but it is less mobile and does not presentthe environmental concerns of nitrogen or phosphate. Manysoils also contain sufficient levels of potash and require littleor no supplemental application, at least on an annual basis.
Nitrogen and phosphate application intensities varied widelyamong crop production regions. High nitrogen and phos-phate application rates corresponded closely to regionswhere there was a large acreage of corn or specialty crops.The highest application rates were in production regionswhere a high proportion of the cropland was used to growpotatoes, vegetables, or citrus fruit. However, some cornproduction areas in Illinois, Iowa, and Nebraska alsoreceived high application rates.
6 ❖ Production Practices for Major Crops in U.S. Agriculture, 1990-97 Economic Research Service/USDA
1990 91 92 93 94 95 96 970
5
10
15
20
25
1/ Constructed to represent 244 million acres of 1997 U.S. croplandplanted to corn, soybeans, wheat, cotton, potatoes, vegetables, and fruit.See appendix table B1.
Figure 2A1
Primary nutrients applied remains stable
Phosphate
Nitrogen
Potash
Nitrogen
Source: Association of American Plant Food Control Officials, 1998.
Area treated with primary nutrients 1/
Potash
Nitrogen Phosphate
147 million acres,60%
97 million acres,40%
173 million acres,71%
71 million acres,29%
Treated area
Area not treated
107 million acres,44%
137 million acres,56%
Million nutrient tons

Fertilizer Use Greatest for CornCorn, which accounted for one-third of all acres surveyed,was the leading crop in plant nutrient use (fig. 2A2). Almostall corn acres were treated. Fertilizer applied to cornaccounted for 61 percent of all nitrogen, 53 percent of allphosphate, and 54 percent of all potash applied to the sur-veyed crops. Like corn, most of the acreage planted towheat, cotton, potatoes, fruits, and vegetables was also treat-ed with fertilizer, but due to their smaller acreage, fertilizerconsumption by these other crops was less. Wheat, cotton,potatoes, and other crops are often grown in rotation with
corn and can benefit from the residual fertilizer nutrientsfrom corn. [See the Crop Rotation section, Chapter IV, forinformation about the difference in fertilizer use from croprotations.] Less than 40 percent of the soybean acreagereceived any commercial fertilizer. Soybeans, like otherlegumes, process atmospheric nitrogen to meet most nitro-gen needs. Most specialty crops (potatoes, vegetables, andfruits) received fertilizer at relatively high rates, butaccounted for less than 10 percent of the total commercialfertilizer tonnage, due to the small acreage.
Economic Research Service/USDA Production Practices for Major Crops in U.S. Agriculture, 1990-97 ❖ 7
100 80 60 40 20 0
4,000 3,000 2,000 1,000 0
Treated
Not treated
0 200 400 600 800 1,000 1,200
0 5,000 10,000 15,000 20,000
Nitrogen
Phosphate
Potash
Area treated
Million acres
Thousand acres
2,056
2,388
18,814
3,500
5,882
Thousand pounds
Quantity applied
Thousand pounds
39
351
185
756
1,056
1/ Constructed to represent 244 million acres of 1997 U.S. cropland planted to corn, soybeans, wheat, cotton, potatoes, vegetables, and fruit.See appendix table B1. 2/ Treated area includes only the area treated with nitrogen. 3 / Includes most other deciduous fruits and berries (except apples and citrus).
Source: USDA, ERS and NASS, 1996c.
874 79,353
8,973 62,016
26,69644,154
12,679
7,133834
1,129
216
494
20 1,130
1,260
1,362
3,032
0
104 349
Figure 2A2
Fertilizer use greatest for corn 1/
Vegetables 2/
Potatoes
Other fruit 2/3/
Citrus 2/
Apples 2/
Corn
Wheat
Soybeans
Cotton
Other crops(listed below)

Nutrient Application Rates Highest on VegetablesFertilizer needs of crops vary widely (figs. 2A3, 2A4, and2A5). Average nitrogen and phosphate application rateswere generally highest for nonlegume vegetable crops andpotatoes and lowest for noncitrus fruit and legume crops.For the field crops, nitrogen and phosphate application rateswere highest for corn and lowest for soybeans. Althoughcommercial fertilizer was not applied to most soybeans,when it was applied, potash was the ingredient applied mostoften and generally at rates higher than for other field crops.
8 ❖ Production Practices for Major Crops in U.S. Agriculture, 1990-97 Economic Research Service/USDA
28
3062
646567
68
7272
747781
8283
84
858687
9294
9596
99100
103104
109114
115120
122124
125126128
128
129133
135149149
153
157159163
164167
170
182186194
206221
230
239240
262Lettuce, headCelery
Bell peppersCauliflower
PotatoesBroccoli
Lettuce, otherOnionsCarrots
TangelosCabbage, fresh
OrangesTomatoes, processed
TangerinesTemples
StrawberriesSpinach, fresh
LimesSweet corn, processed
EggplantCorn
GrapefruitLemons
Cabbage, processedSweet corn, fresh
AvocadoesPrunes
WatermelonsCucumbers, Fresh
NectarinesPears
CantaloupeSpinach, processed
AsparagusDates
CottonPlums
Cucumbers, processedApricots
RaspberriesBlackberries
Snap beans, freshPeaches
HoneydewCherries, sweet
FigsKiwifruit
Cherries, tartBlueberries
OlivesBeans, lima
GrapesWheat
Snap beans, processedApples
PeasSoybeans
0 100 200 300
Nitrogen application rates for selected crops
Pounds per treated acre
Sources: USDA, NASS and ERS, 1996b, 1996a, and 1995a.
Figure 2A3

Economic Research Service/USDA Production Practices for Major Crops in U.S. Agriculture, 1990-97 ❖ 9
263038
41495151
545555
5656
58586162
68697171
737474
7676
7779
8588
9296100
102103107110
110115
115116
119137
139140146
149160163170
172172177185
198263
292408Tomatoes, fresh
CeleryBell peppers
Cabbage, processedTangerines
OrangesTemplesTangelosPotatoes
Cabbage, freshLimes
PrunesGrapefruitEggplant
OnionsSweet corn, fresh
WatermelonsStrawberries
Snap beans, freshCucumbers, fresh
AsparagusCarrotsGrapes
RaspberriesKiwifruit
Cucumbers, processedApricots
NectarinesSoybeans
Sweet corn, processedSpinach, freshLettuce, head
PeachesBlackberriesCherries, tart
AvocadoesPeas
Lettuce, otherBeans, limaCauliflower
Snap beans, processedBroccoli
Cherries, sweetPears
HoneydewPlums
CornBlueberries
FigsApplesCottonOlives
Tomatoes, processedCantaloupe
WheatSpinach, processed
Lemons
0 100 200 300 400 500
Pounds per treated acre
Sources: USDA, NASS and ERS, 1996a, 1996b, and 1995a.
Potash application rates for selected cropsFigure 2A5
283334343538404041414243434446
54555555565757575960616163646571
7881
88899293949495969797101103106106109
121130134137
166171174
189190195Celery
Lettuce, headBell peppers
Tomatoes, freshPotatoes
CarrotsOnions
Lettuce, otherEggplant
CauliflowerBroccoli
RaspberriesCabbage, fresh
Tomatoes, processedApricots
Spinach, processedSpinach, fresh
HoneydewStrawberries
Cabbage, processedWatermelons
CantaloupeDates
Cucumbers, freshSnap beans, freshSweet corn, fresh
BlackberriesAvocadoes
TangelosSnap beans, processedSweet corn, processed
Beans, limaLimes
Cucumbers, processedPrunes
AsparagusKiwifruit
CornGrapefruit
GrapesPeas
SoybeansNectarines
FigsOlivesCotton
OrangesBlueberries
PearsLemonsTemples
Cherries, tartPeaches
Cherries, sweetApples
TangerinesWheatPlums
0 50 100 150 200 250Pounds per treated acre
Sources: USDA, NASS and ERS, 1996a, 1996b, and 1995a.
Phosphate application rates for selected cropsFigure 2A4

Crop Nutrient Application Rates Remain Stable,1990-97Between 1990 and 1997, nutrient application rates remainedrelatively stable for field crops (fig. 2A6). Annual changesin fertilizer prices, commodity prices, expected yields,weather, and participation in Federal farm programs are fac-
tors that can affect fertilizer use decisions. Nitrogen applica-tion rates on corn dropped slightly between 1990 and 1993,but were up in the following years. For cotton, nitrogenrates were up between 1990 and 1994, but decreased in1994-97. For soybeans, wheat, and potatoes, the trend wasgenerally up between 1990 and 1997.
10 ❖ Production Practices for Major Crops in U.S. Agriculture, 1990-97 Economic Research Service/USDA
1990 91 92 93 94 95 96 970
50
100
150
200
250
300
Crop nutrient application rates remain stable during 1990-97
1990 91 92 93 94 95 96 970
50
100
150Lbs/acre
Corn
1990 91 92 93 94 95 96 970
20
40
60
80
100
Lbs/acre
1990 91 92 93 94 95 96 970
20
40
60
80
100Lbs/acre
Lbs/acre
1990 91 92 93 94 95 96 970
50
100
150Lbs/acre
Soybeans
Wheat Potatoes
Cotton
Nitrogen
Phosphate
Potash
Phosphate
Potash
Nitrogen
Nitrogen
Phosphate
Potash
Potash
Nitrogen
Phosphate
Nitrogen
Phosphate
Potash
Figure 2A6
Sources: USDA, NASS and ERS, 1998b. See appendix table B2 for States represented.

Variation in Nutrient Application Rates HighestAcross Potato FieldsBesides the variation in application rates between crops,there was also wide variation in the application ratesbetween fields of the same crop (fig. 2A7). Soil characteris-tics, yield expectations, previous crops, cultural practicessuch as irrigation, weather, and other factors can cause fer-tilizer rates to vary among fields. While some fields receivedno fertilizer, other fields were intensively treated. For exam-ple, the 5 percent of the potato area having the lowest appli-cation rates (5th percentile) received 31 pounds or less ofnitrogen per acre, while the 5 percent of the area having thehighest application rates (95th percentile) received 450pounds or more of nitrogen per acre. For corn, the highest 5percent received 208 pounds or more per acre of nitrogenand 110 pounds or more of phosphate. At the median (50thpercentile), half of the acres receive more than that rate andhalf receive less. The mean is the average rate for all acrestreated, but excludes untreated acres. Because some acresare not treated and because the rate on the the treated acresdoes not necessarily follow a normal statistical distribution,the mean rate is often higher than the median rate.
Economic Research Service/USDA Production Practices for Major Crops in U.S. Agriculture, 1990-97 ❖ 11
Nutrient application rates vary between fieldsFigure 2A7
Source: USDA, NASS and ERS, 1996b
Pounds per acre
Potatoes
Soybeans
Wheat
Cotton
Corn
Potatoes
Soybeans
Wheat
Cotton
Corn
Potatoes
Soybeans
Wheat
Cotton
Corn
0 100 200 300 400 500
Nitrogen:
Phosphate:
Potash:
Each bar represents the range in application rates for the 5th percentile(area with no pesticide applied or lowest rates) to the 95th percentile (areawith the highest rates). The bar segments represent ranges in application rates at 15-percentile intervals. At the 50th percentile (median), half of the area received less than the identified rate and half received more. The double arrow indicates the average (mean) rate for the treated area.
Percentiles

Nutrient Management Practices
Most Nitrogen Fertilizer Applied Before or At PlantingTiming fertilizer applications to the plant’s biological needshelps to reduce nutrient losses from leaching, runoff, orvolatilization [Aldrich, 1984] (fig. 2B1). Nitrogen, in a formthat can be used by plants, is mobile and can quickly be lostthrough leaching and runoff. The longer the nutrients are inthe soil before they can be used by the crop, the more likelythat they may be lost. Applications made during the growingseason when the nutrient is most needed by the plant canreduce some of these losses. However, because of the costof additional treatments and other factors, many farmerschose to apply their nutrients before or at planting time.Delaying fertilizer application until later in the growing sea-son poses an additional risk that wet fields or other condi-tions may prevent timely treatment and result in yield loss-es. To free labor for the peak spring planting periods, somefarmers apply their nutrients in the fall or at other off-peaktimes.
About three-fourths of all nitrogen used on the surveyedfield crops (corn, soybeans, wheat, cotton, and potatoes) wasapplied before or at the time the crop was planted. An esti-mated 28 percent of the total nitrogen was applied in thefall, including that applied to winter wheat at or beforeplanting. Winter wheat accounts for about one-third of thefall applications while the remainder was applied to cropsplanted the following spring. Nitrogen applications madeafter planting, which better coincides with plant needs,accounted for about one-fourth of the total quantity. About22 percent of the area treated with nitrogen was treated withonly fall applications. Fifty-nine percent of the area receivedall of the nitrogen treatments in the spring or later in thegrowing season. Split treatments, with part of the nitrogenapplied in the fall and part the following spring or summer,occurred on about 19 percent of the area.
12 ❖ Production Practices for Major Crops in U.S. Agriculture, 1990-97 Economic Research Service/USDA
Most nitrogen fertilizer applied before or at planting
Quantity applied
Area treated
Represents fertilizer applied to 194 million acres of corn, soybeans, wheat, cotton, and potatoes.
Source: USDA, NASS and ERS, 1996c.
Figure 2B1
Spring applicationsbefore or at planting
6,092 million lbs,47%
Fall applications3,703 million lbs,
28%
Spring or summer applicationsafter planting
3,197 million lbs,25%
Fall applications only30.2 million acres,
22%
Spring applications only80.8 million acres,
59%
Split applicationsbetween fall andspring or summer25.9 million acres,
19%

Fall Nitrogen Applications Common for Corn and WheatExcept for winter wheat, other crops received most of theirnitrogen applications in the spring (fig. 2B2). For winterwheat or other fall-planted crops, split applications betweenfall and spring can better time the treatment with plantneeds. For corn and other spring-planted crops in northern
regions, nitrogen can normally be applied late in the fallwithout loss of nitrogen so long as the soil remains cold.About 27 percent of the corn area received fall nitrogen fer-tilizer applications and for about 13 percent of the area noother nitrogen was applied. Nitrogen applications were splitbetween the fall and following spring or summer on 14 per-cent of the corn area.
Economic Research Service/USDA Production Practices for Major Crops in U.S. Agriculture, 1990-97 ❖ 13
Fall nitrogen applications used mostly for corn and wheat, 1997Figure 2B2
Treated area 1/ Quantity applied
1/ The first value at the end of each bar is the percentage of area treated, and the second value is million acres treated.
Source: USDA, ERS and NASS, 1996c.
Potatoes
Cotton
Wheat
Soybeans
Corn
Split applications
Potatoes
Cotton
Wheat
Soybeans
Corn
Spring applications
Potatoes
Cotton
Wheat
Soybeans
Corn
Fall applications
50 40 30 20 10 0 0 2,000 4,000 6,000 8,000
Fall treatment
Spring treatment
Million pounds appliedMillion acres
13%, 7.9
6%, 3.7
30%, 16.8
14%, 1.9
4% > 0.1
72%, 44.7
9%, 9.1
32%, 18.0
64%, 8.3
69%, 0.7
14%, 9.0
<1%, 0.5
13%, 14.5
13%, 1.7
27%, 0.2
1,083
97
997
119
8
5,722
181
1,125
707
156
1,318
58
1,177
184
60

Annual Soil Nutrient Test Not Widely UsedSoil tests help farmers monitor soil nutrient levels in theirfields to make more informed fertilizer application decisions(fig. 2C1). Analysis of soil samples in laboratories can helpscientists and farmers more precisely develop fertilizer treat-ment plans that are cost effective and that do not result inexcess nutrient levels. Laboratory tests of soil samples ofteninclude analysis of soil pH, organic matter content, amountof phosphate, potash, nitrate, and micronutrients along withrecommendations for fertilizer treatments. The amount ofnutrient actually available to plants depends on many factorsand changes over time as some nutrients are lost or tem-porarily tied up in the soil.
Less than a third of the represented crop acreage in the sur-veys had soil nutrient testing, at least on an annual basis.Soil nutrient testing was more often reported on crops thatrequire large quantities of commercial fertilizer, such aspotatoes and vegetables, than for crops that require less fer-tilizer, such as soybeans. About two-thirds of the areareporting soil tests also reported that the tests included onefor nitrogen.
14 ❖ Production Practices for Major Crops in U.S. Agriculture, 1990-97 Economic Research Service/USDA
Figure 2C 1
Not tested137 million acres
70%
Tested (excluding nitrogen test)22 million acres
11%
Soil nutrient tests by crop 1/
Corn
Soybeans
Wheat
Cotton
Other crops
0 10 20 30
(listed below)
26.5, 43%
15.2, 25%
12.6, 23%
3.2, 24%
1.8, 58%
Million acres tested
Potatoes
Oranges
Grapes
Apples
Peaches 2/
Tomatoes
Strawberries
0 300 600 900 1,200
Tested (including nitrogen)
Tested (excluding nitrogen)
Thousand acres tested
23, 50%
52, 50%
51, 35%
945, 96%
381, 57%
119, 36%
184, 25%
Source: USDA, NASS and ERS, 1994, 1995c, 1995d.
Tested (including nitrogen test)
37 million acres19%
1/ The first value at the end of each bar is total area tested, and the secondvalue is the percent of the planted area tested.2/ Information regarding nitrogen tests was unavailable.
Annual soil nutrient tests used on 30 percentof surveyed acres, 1994-95
Represents 196 million acres of corn, wheat, cotton, soybeans, potatoes, oranges, grapes, peaches, fresh market tomatoes, and strawberries.

Acres Treated with Livestock ManureLivestock manure is a source of plant nutrients, but it canalso contribute to water quality problems (fig. 2C2). Thenutrient content of manure can differ significantly dependingon the livestock species and the storage and application meth-ods. For more accurate crediting of nutrient content, farmerscan pay for a laboratory analysis of the manure’s nutrientcontent. Only about 8 percent of the area surveyed had anymanure applied and very little of the manure was analyzedfor its nutrient content. Most of the area treated with manurewas planted to corn. The manure discussed here excludes anyprepared and sold as a commercial fertilizer.
Economic Research Service/USDA Production Practices for Major Crops in U.S. Agriculture, 1990-97 ❖ 15
Corn
Soybeans
Wheat
Cotton
Other crops
0 3 6 9 12
(listed below)
Grapes 2/
Oranges 2/
Potatoes
Peaches
Apples 2/
Straw-berries 2/
Tomatoes,
0 20 40 60 80
Not analyzed
Analyzed
Figure 2C2
Approximately 8% of the manure applied was analyzed for nutrient content
Crop area treated with livestock manure 1/
3.6, 6%
0.3, 3%
0.2, 6%
12.0, 10%
41.0, 6%
25.0, 2%
10.0, 3%
9.0, 20%
2.0, 2%
73.0 10%
Million acres
Thousand acres
Source: USDA, NASS and ERS, 1994, 1995d, 1996d.
Few acres treated with livestock manure andanalyzed for nutrient content
1/ The first value at the end of each bar is total area tested and the secondvalue is the percent of crop area treated.2/ Information was not available on manure analysis for nutrient content.
No manure applied180.7 million acres
92%
Manure applied15.7 million acres
8%
10.3,17%
1.2, 2%
fresh 2/

Use of Nitrogen Stabilizers for CornWithout a stabilizing material, many nitrogen fertilizersquickly dissolve in water and move easily through the soil(fig. 2D1). Stabilizing materials have been developed thattemporarily immobilize the fertilizer material and help pre-vent it from leaching below the crop root zone or being lostin runoff. The nutrient is then more slowly released duringthe growing season as the plant develops and requires thenitrogen. The use of nitrogen stabilizers allows earlier appli-cation of nitrogen and reduces potential losses. The stabiliz-ers were most commonly used on corn and in areas subjectto potential losses from high precipitation or irrigation.About 6 million acres (10 percent) of the surveyed corn areain 1997 used a nitrogen stabilizer. Extremely wet soils in1993 delayed normal fertilizer applications, and use of nitro-gen stabilizers was much lower that year.
16 ❖ Production Practices for Major Crops in U.S. Agriculture, 1990-97 Economic Research Service/USDA
1990 91 92 93 94 95 960
2
4
6
8
10
12
0
2
4
6
8
10
Figure 2D1
Percent Million acres
Represents 61.5 million acres of corn in IL, IN, IA, MI, MN, MO, NE, OH, SD, and WI in 1996.
Source: USDA, NASS and ERS, 1995c, 1996c.
Limited use of nitrogen stabilizers for corn in 1996
Corn area receiving nitrogen fertilizer without stabilizers,
53.4 million acres, 87%
Corn area treated with nitrogen fertilizer
and nitrogen stabilizers,6.4 million acres, 10%
Corn area with no nitrogen fertilizer
applied,1.7 million acres, 3%
Corn area receiving nitrogen stabilizers, 1990-96

Throughout history farmers have relied mostly on physi-cal and cultural practices to manage and control the
pests that damaged their crops [Smith, Apple, and Bottrell,1976]. Weeds were controlled with tillage implements,mowing, site selection, planting seeds free of weedseeds,and often even with the use of hands and hand tools.Attempts to reduce losses from insects and disease alsoincluded practices such as crop rotations, planting trapcrops, adjusting planting dates, and seed selection. Prior tothe 1940’s, the use of chemicals was limited to a few inor-ganic chemicals and some natural or organic materials.These controls were for a limited spectrum of pests andoften were ineffective. The development of synthetic pesti-cides following World War II, along with improvements inseed genetics, mechanization, and other production prac-tices, brought about many changes in the way farmers manage pests. Before the development of synthetic chemicalpesticides, weed control was primarily limited to mechanicalpractices. The purpose of this chapter is to report estimatesof various kinds of chemical, cultural, and biological practices that are now used to combat the damages causedby pests.
Agricultural pesticide expenditures have grown from $44million in 1940 to over $8 billion in 1997, a 15-foldincrease in constant dollars [Aspelin, 1999]. Many studieson the productivity of pesticides give economic justificationfor increased farm use, but the studies do not account forpossible health costs or environmental damages. Studies ofagricultural productivity report marginal returns to pesticideuse in the range of $1 to $3 for each dollar spent on pesti-cides [Headly, 1968; Padgitt, 1969; Carlson, 1977; Duffyand Hanthorn, 1984; Fernandez-Cornejo and Jans, 1995].Estimates of marginal returns varied between pesticidetypes, crops, and regions. Miranowski found higher returnsfor corn insecticides ($2.02) than corn herbicides ($1.23).Campbell (1976) estimates a $12 return per dollar of appleinsecticides while Lee and Langham (1973) reported mar-ginal returns of less than $1 on citrus. Some evidence hasbeen reported that the model specification of some of theearlier studies tends to overestimate the marginal productivi-ty of pesticides [Lichtenberg and Zilberman, 1986]. Teagueand Brorsen (1995) estimated declines in the marginalreturns from pesticides between 1949 and 1991, but margin-al returns were still above marginal costs. Estimates of mar-ginal productivity are also an indirect measure of the for-gone production that might occur should farmers berequired to constrain pesticide use to protect human healthor the environment.
Economic Research Service/USDA Production Practices for Major Crops in U.S. Agriculture, 1990-97 ❖ 17
Chapter III
Pest Management Practices in Crop Production
A pesticide, according to the Federal Insecticide,Fungicide, and Rodenticide Act (FIFRA) [7 USC 136] is“... any substance or mixture of substances intended forpreventing, destroying, repelling, or mitigating any insects,rodents, nematodes, fungi, or weeds, or any other forms oflife declared to be pests; and any substance or mixture ofsubstances intended for use as a plant regulator, defoliant,or desiccant.” Types or classes of pesticides used in thisreport are:
• Fungicides control plant diseases and molds thateither kill plants by invading plant tissues or cause rotting and other damage to the crop both before andafter harvesting.
• Herbicides control weeds that compete for water, nutri-ents, and sunlight and reduce crop yields. Herbicides thatare applied before weeds emerge are preemergence her-bicides. Preemergence herbicides have been the founda-tion of row crop weed control for the past 30 years.Herbicides applied after weeds emerge are postemer-gence herbicides. Postemergence herbicides normallyhave less residual activity and do not persist in the envi-ronment as long as preemergence herbicides. Treatmentsapplied prior to any tillage or planting to kill existingvegetation are referred to as “burndown” applications.Burndown applications are often a part of no-till systems.
• Insecticides control insects that damage crops. For thisreport, pesticides used to control mites and nematodesare classified as insecticides. Products used as soilfumigants, with a broad range of target pests includinginsects, mites, and nematodes, are not classified asinsecticides in this report.
• Other Pesticides include soil fumigants, growth regula-tors, desiccants, and other pesticide materials not other-wise classified. Sulfuric acid, when used as a desiccanton potatoes, is included in this class, but petroleum oilsused as adjuvants are excluded.
A Restricted-Use Pesticide is a pesticide product whoseuse requires special handling because of the toxicity of theproduct’s active ingredients. Restricted-use pesticides maybe applied only by trained, certified applicators or personsunder their direct supervision. All labeled uses of an activeingredient may not be restricted. In some cases, only cer-tain formulations, concentrations, or uses are restricted.Private and commercial applicators are required to keeprecords of applications of restricted-use pesticides [SubtitleH, 1990 Federal Agricultural Conservation and Trade Act].

The USDA surveys of pesticide use document recentchanges in the quantity of pesticides and selected pesticideingredients applied as well as differences in pesticide usebetween crops, geographic areas, and cultural and otherpest-management practices [USDA, NASS and ERS,1996c]. The commodity acreage represented in the USDAsurveys accounts for approximately 60 percent of the U.S.cropland planted to crops. Pesticide use and pest manage-ment practices on the remaining cropland, pasture, range,forest, or other agricultural activities, including livestock,are not included. Estimates of total agricultural pesticide
use, as well as nonagricultural uses, are reported by theEnvironmental Protection Agency [Aspelin, 1999]. [Seeappendix A for a description of USDA pesticide surveys andthe commodities and States represented.] Besides pesticideuse, the USDA survey data provide estimates of farmers’ useof biological and cultural pest prevention practices, scoutingand other pest-monitoring activities, and the informationsources used to make pest-management decisions.
18 ❖ Production Practices for Major Crops in U.S. Agriculture, 1990-97 Economic Research Service/USDA

Pesticide UseThe estimates of pesticide use reported in this section arebased on annual surveys since 1990 for five field crops(corn, soybeans, wheat, cotton, and fall potatoes) and bien-nial surveys that include 24 fruit and 21 vegetable crops.(See appendix A in this report for specific crops and Statesincluded in the surveys.) These States and surveyed com-modities accounted for about 60 percent of the U.S. crop-land planted to crops and about 75 percent of all agriculturalpesticides. In all, more than 250 different pesticide activeingredients were reported on these agricultural crops andclassified as herbicides, insecticides, fungicides, or otherpesticides. Aggregate pesticide use is reported by the weightof the active ingredients and the number of acres treated oneor more times. The intensity of pesticide use is reported byapplication rates (pounds of active ingredient per treatedacre) and number of acre-treatments per acre (total numberof different pesticide ingredients applied and number ofrepeat applications of the same ingredient).
Weed Control Accounts for Most Pesticide UseHerbicide ingredients accounted for 62 percent of the 588million pounds of pesticides applied to the surveyed crops in1997 (fig. 3A1). About 210 million acres or 86 percent ofthe surveyed crop area in 1997 received some herbicidetreatments. Pesticides in the “other pesticides” categorywere the second largest in terms of pounds but were appliedto only 6 percent of the area. Some ingredients in the“other” category are applied at several hundred pounds peracre compared with herbicides, insecticides, and fungicides,which are normally applied at only a few pounds or even afew ounces per acre. About 18 percent of the crop acreswere treated with insecticides. The use of fungicides wasprimarily limited to potatoes, vegetables, and fruits and rep-resented the smallest use in both total acres treated and totalpounds applied.
Total quantities of pesticide use increased about 18 percentbetween 1990 and 1997 on the surveyed crops, but fluctuat-ed annually with changes in crop acres and other factors.Although the total use increased, the trends varied amongpesticide types. Most of the increase in pesticide useoccurred in “other pesticides” and largely was a result of achange in products rather than any change in the number ofacres treated. There was little change in the pounds of herbi-cides used between 1990 and 1997, but the share of acrestreated edged up while average application rates declined.The use of both insecticides and fungicides increased, withmost of the insecticide increase on cotton and the fungicideincrease on potatoes and other vegetables.
Economic Research Service/USDA Production Practices for Major Crops in U.S. Agriculture, 1990-97 ❖ 19
1990 91 92 93 94 95 96 970
100
200
300
400
500
600
Other pesticide
Fungicides
Insecticides
Herbicides
Herbicides
Insecticides
Fungicides
Other pesticides
0 50 100 150 200 250Million acres
Figure 3A1
Weed control accounts for most pesticide use
Quantity of pesticide active ingredients applied to selected crops 1/
Million pounds of active ingredient
209.5, 86%
45.1, 18%
7.0, 3%
15.6, 6%
Sources: Lin, Padgitt, Bull, Delvo, Shank, and Taylor, 1995; USDA, NASSand ERS, 1994, 1995d, 1996c, and 1996d.
1/ The constructed estimates of pesticide quanitity and treated area represent 244 million acres of corn, soybeans, wheat, cotton, potatoes,other vegetables, and fruit. See appendix table B5.2/ The first value at the end of the bar is acreage treated, and the second value is the percentage of the total crop area treated.
Total acres treated one or more times with a pesticide ingredient 2/

Corn Received Largest Quantities of Pesticides Most crops included in the USDA surveys received somepesticide treatments, but the seasonal rate of application andtypes of pesticides applied differed among crops (fig. 3A2).Corn had the largest crop acreage in 1997 with 81 millionacres planted and exceeded all other surveyed crops in termsof quantity of pesticides applied and acreage treated. Nearlyall corn acres were treated with some pesticides, and herbi-cides accounted for most of the use. Although wheat acreageis only slightly less than that of corn, significantly less pesti-cide was applied to wheat. Many winter wheat acresreceived no pesticide treatments, and the intensity of treat-ments on the treated acres was much less than for corn.Soybean acres were treated mostly for weeds and were thesecond largest users of herbicides.
Although cotton acreage was much smaller than that ofcorn, wheat, or soybeans, the seasonal rate of aggregateapplications was higher. Cotton was the largest user ofinsecticides and accounted for 32 percent of the total quanti-ty of insecticides. Potatoes, with only 1.4 million acresplanted in 1997, were the second largest users of pesticidesamong the surveyed crops. Nearly 75 percent of all potatopesticides were classified as “other pesticides”—mostly soilfumigants and vine killers. Most fruit acres received severaltreatments per year for insects and diseases, but because oftheir relatively small acreage and low application rates, fruitaccounted for only 7 percent of the total pesticide use.
20 ❖ Production Practices for Major Crops in U.S. Agriculture, 1990-97 Economic Research Service/USDA
Figure 3A2
Treated and not treated acres
(listed below)
104 349
Million acres
0 50 100 150 200 250 300
Insecticide
Herbicide
Fungicide
Other67.9
180.2
229.3
84.5
25.7
Quantity applied
0 20 40 60 80 100
Million pounds of active ingredient
10.3
15.0
15.9
58.5
80.7
1/ The constructed estimates represent 244 million acres. See appendix table B6 for specific crops and area. The pesticide use for vegetables is basedon the 1994 use rates. The estimates for pesticide use for fruits are based on 1995 use rates, and the estimates for field crops are based on 1997 use rates.2/ Includes fresh and processed vegetables and strawberries from the 1994 crop year.
Source: USDA, ERS and NASS, 1995a, 1996b, and 1998b.
Other crops
Cotton
Soybeans
Wheat
Corn
100 80 60 40 20 0
Treated
Not treated
81
71
8
14
71
Apples
Citrus
Fruit 2/
Potatoes
Vegetables 1/
4 3 2 1 0
1.5
3.5
1.2
1.4
0.5
Largest quantities of pesticides used for corn production, 1997

Variation in Pesticide Application Rates Across FieldsThe intensity of pesticide applications varies widely notonly between crops and pesticide types but also betweenfields of the same crop (fig. 3A3). Many factors contributeto differences in pesticide application rates between fields.The target pest species, infestation levels, weather, use ofcultural practices, application methods and timing, andprices can all affect the selection and the amount of pesti-cide material applied [Lin, 1995]. Differences in the potencyand persistence of ingredients are additional factors affect-ing the quantity applied. Some pesticide ingredients areapplied at several pounds per acre, but alternative pesticidesthat provide similar kinds of pest control are applied at onlya few ounces per acre. Some ingredients, especially insecti-cides and fungicides, require several treatments during thegrowing season because they soon lose their effectivenesswhen exposed to weather and other environmental forces.These factors and the length of the growing season can allaffect the accumulated quantities applied and total numberof acre-treatments.
The most intensively treated land can account for a dispropor-tionately large share of pesticide use on any crop. For cornherbicides, the application rates ranged from zero at the 5thacreage percentile to 5 pounds per acre at the 95th acreagepercentile. At the median (50th acreage percentile), half of thecorn acreage received 2.8 pounds or more per acre while theother half received less than 2.8 pounds per acre.
Although the majority of potato acres received less than 2.5pounds of herbicide or insecticide ingredients, some fieldsreceived higher rates of fungicide and other pesticide ingre-dients. Twenty percent (80th acreage percentile and higher)of the potatoes received at least 12 pounds of fungicides andat least 140 pounds of “other” pesticides. At the 95thacreage percentile, the rates exceeded 16 pounds for fungi-cides and 300 pounds for “other” pesticides. Treatmentsaccounting for such high levels of use include several repeatapplication of fungicides, the use of sulfuric acid as a vinekiller, or treatment with a soil fumigant. A single treatmentwith sulfuric acid or a soil fumigant can be at a rate of sev-eral hundred pounds per acre.
Economic Research Service/USDA Production Practices for Major Crops in U.S. Agriculture, 1990-97 ❖ 21
Pesticide application rates vary among fields, 1997Figure 3A3
1/ This bar extends to 11 pounds per acre at the 80th acreage percentile and 17 pounds per acre at the 95th.2/ This bar extends to 155 pounds at the 80th acreage percentile and over 400 pounds at the 95th, reflecting the use of sulfuric acid as a potatovine killer. The mean rate for other pesticides was 104 pounds per treated acre.
Source: USDA, ERS and NASS, 1996c.
1/
2/
None reported at 95 percentile
PotatoesSoybeans
WheatCotton
CornOther pesticide rates:
PotatoesSoybeans
WheatCotton
CornFungicide rates:
PotatoesSoybeans
WheatCotton
CornInsecticide rates:
PotatoesSoybeans
WheatCotton
CornHerbicides rates:
0 2 4 6 8 10
None reported at 95 percentile
None reported at 95 percentile
None reported at 95 percentile
None reported at 95 percentile
None reported at 95 percentile
Each bar represents the range in application rates from the 5th percentile (area with no pesticide applied or lowest rates) to the 95th percentile (area with the highest rates). The bar segments represent ranges in application rates at 15-percentile intervals. At the 50th percentile (median), half of the area received less than the identified rate and half received more. The double arrow indicates the average (mean) rate for the treated area.
Percentiles
Pounds of active ingredients per acre

Atrazine was the Leading Herbicide IngredientAlthough many herbicide ingredients are used in agriculture,a relative few account for most of the use (total pounds oracres treated, fig. 3A4a). Only 23 herbicide ingredients wereapplied to more than 5 million (3 percent) of the 188 millionacres surveyed. Atrazine, 2,4-D, dicamba, and metolachlorwere among the five leading herbicides, and all have beenwidely used for more than 30 years. These ingredients areapplied both as a single ingredient or in combination withother ingredients to improve their efficacy and cost effec-tiveness. Atrazine is almost exclusively used on corn andgrain sorghum, while dicamba and 2,4-D are also used onwheat and other crops. Glyphosate was the second mostused herbicide in acres treated. It is frequently used onorchards and vineyards and widely used with no-till systemson corn, soybeans, and wheat. Imazethapyr, first registeredfor use in the late 1980’s, is the leading ingredient used onsoybeans. Trifluralin, another ingredient available 30 yearsago, is the leading herbicide used on cotton and also iswidely used on soybeans and vegetables. Three of the 25leading herbicide ingredients are labeled as “restricted-use”pesticides—atrazine, cyanazine, and acetachlor. (All formu-lations of an ingredient, however, may not be labeled forrestricted use). Restricted-use products are only to beapplied by applicators who are trained and certified.
22 ❖ Production Practices for Major Crops in U.S. Agriculture, 1990-97 Economic Research Service/USDA
(r) Atrazine
Glyphosate
2,4-D
Metolachlor
Dicamba
Imazethapyr
Trifluralin
Pendimethalin
(r) Acetochlor
Thifensulfuron
(r) Cyanazine
MCPA
Fenoxaprop-ethyl
Bentazon
Imazaquin
Chlorminuron-ethyl
Metribuzin
Acifluorfen
Bromoxymil
Tribenuron-methyl
Nicosulfuron
Metasulfuron-methyl
Fluazifop-p-butyl
Alachlor
Chlorsulfuron
0 10 20 30 40 50
Corn
Soybeans
Wheat
Cotton
Other crops
Figure 3A4a
Atrazine was the leading herbicide appliedto the surveyed area, 1996-97 1/
Million acres
5, 2%
6, 3%
6, 3%
6, 3%
6, 3%
7, 3%
7, 3%
8, 4%
8, 4%
9, 4%
9, 4%
9, 4%
10, 5%
10, 5%
11, 5%
11, 5%
15, 7%
22, 11%
24, 12%
26, 13%
26, 13%
28, 14%
31, 15%
32, 16%
43, 21%
Sources: USDA, NASS and ERS, 1998a, 1998b, and 1997a.
1/ The letter "r" in the parentheses identifies ingredients that are restricted-use products. Not all formulations of the ingredient may be restricted. The first value at the end of each bar is the area treated, and the secondvalue is the percent of total surveyed area receiving the ingredient.

Chlorpyrifos was the Leading InsecticideIngredientMore than 60 different insecticide ingredients were reportedused on the surveyed crops, but only a few accounted formost of the acres treated (fig. 3A4b). Only eight ingredientswere applied to more than 2 million of the 188 million acressurveyed. Chlorpyrifos and methyl parathion, the two mostwidely used insecticidal ingredients, were applied to severaldifferent crops, with corn and cotton accounting for thelargest treated area. Unlike herbicides, most of the leadinginsecticide ingredients are labeled as “restricted-use” pesti-cides and require application by licensed applicators.Chlorpyrifos and methyl parathion are among theorganophosphate compounds which have been assigned toppriority by the Environmental Protection Agency for toler-ance re-assessment using the 1996 Food Quality ProtectionAct guidelines [EPA, 1998]. (See box, p.26, on the use oforganophosphate pesticides.)
Economic Research Service/USDA Production Practices for Major Crops in U.S. Agriculture, 1990-97 ❖ 23
(r)Chlorpyrifos
(r)Methyl parathion
(r)Tefluthrin
(r)Permethrin
(r)Aldicarb
(r)Lamdacyhalothrin
(r)Cyfluthrin
(r)Terbufos
(r)Carbofuran
(r)Oxamyl
Dimethoate
(r)Malathion
Phorate
Acephate
(r)Imidacloprid
Bt
(r)Chlorethoxyfos
(r)Azinophos-methyl
(r)Abamectin
(r)Dicrotophos
0 2 4 6 8
Corn
Soybeans
Wheat
Cotton
Other crops
Million acres
Sources: USDA, NASS and ERS, 1998a, 1998b, and 1997a.
Figure 3A4b
6, 3%
5, 2%
4, 2%
4, 2%
4, 2%
3, 1%
2, 1%
2, 1%
2, 1%
2, 1%
2, 1%
2, 1%
2, 1%
1, 1%
1, 1%
1, 1%
1, 1%
1, 1%
1, 1%
1, 1%
Chlorpyrifos was the leading insecticide appliedto surveyed area, 1996-97 1/
1/ Represents 188 million acres of field crops, fruits, and vegetables. See appendix table B.5. The letter "r" in the parentheses identifies ingredients that are restricted-use products. Not all formulations of the ingredient may be restricted. The first value at the end of each bar is the area treated and the secondvalue is the percent of total surveyed area receiving the ingredient.
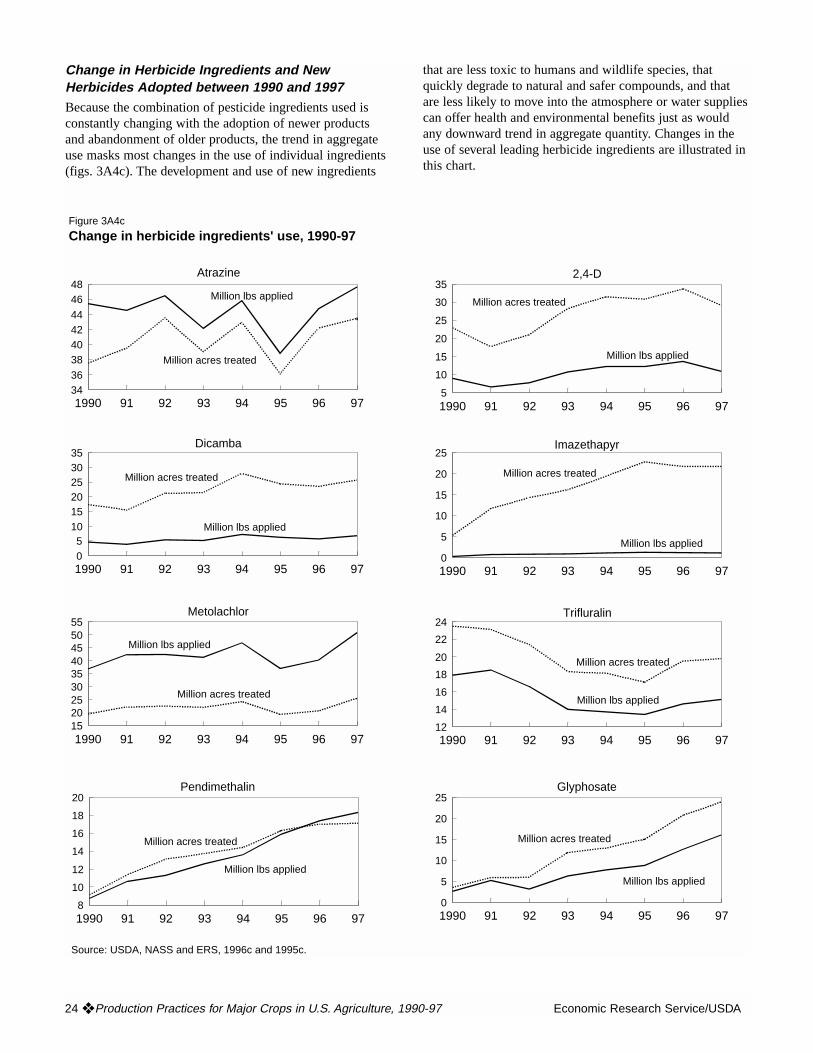
Change in Herbicide Ingredients and NewHerbicides Adopted between 1990 and 1997Because the combination of pesticide ingredients used isconstantly changing with the adoption of newer productsand abandonment of older products, the trend in aggregateuse masks most changes in the use of individual ingredients(figs. 3A4c). The development and use of new ingredients
that are less toxic to humans and wildlife species, thatquickly degrade to natural and safer compounds, and thatare less likely to move into the atmosphere or water suppliescan offer health and environmental benefits just as wouldany downward trend in aggregate quantity. Changes in theuse of several leading herbicide ingredients are illustrated inthis chart.
24 ❖ Production Practices for Major Crops in U.S. Agriculture, 1990-97 Economic Research Service/USDA
1990 91 92 93 94 95 96 973436
38404244
4648
Atrazine
1990 91 92 93 94 95 96 9705
101520253035
1990 91 92 93 94 95 96 97152025303540455055
1990 91 92 93 94 95 96 978
10
12
14
16
18
20
1990 91 92 93 94 95 96 975
10
15
20
25
30
35
1990 91 92 93 94 95 96 970
5
10
15
20
25
1990 91 92 93 94 95 96 9712
14
16
18
20
22
24
1990 91 92 93 94 95 96 970
5
10
15
20
25
Dicamba
Metolachlor
Pendimethalin
2,4-D
Trifluralin
Glyphosate
Million acres treated
Million lbs applied
Million acres treated
Million lbs applied
Million lbs applied
Million acres treated
Million lbs applied
Million acres treated
Million lbs applied
Million acres treated
Million acres treated
Million lbs applied
Million acres treated
Million lbs applied
Million lbs applied
Million acres treated
Source: USDA, NASS and ERS, 1996c and 1995c.
Imazethapyr
Figure 3A4c
Change in herbicide ingredients' use, 1990-97

Acetochlor is a herbicide that was granted conditional regis-tration by EPA in 1994 for use on corn. Its use climbedfrom 7 percent to 24 percent of the corn acreage between1994 and 1997, while acreage treated with alachlor, a prod-uct that provides similar kinds of weed control on corn,dropped from 25 percent to 7 percent of the acreage.Acreage treated with glyphosate and imazethapyr more thanquadrupled during the 5 years. Glyphosate use increasedwith the adoption of soybean seeds resistant to the herbi-
cide. Imazethapyr is a relatively new ingredient used forsoybeans and apparently a cost-effective substitute for olderingredients, like trifluralin. The area treated with atrazinefluctuated between 64 and 69 percent of the planted cornacreage between 1990 and 1997 which is not significantlydifferent from the 68 percent reported in a 1976 survey[Eichers, Andrilenas, and Anderson, 1978]. While the shareof acres treated with atrazine has been stable, total quantitieshave declined some from reductions in application rates.
Economic Research Service/USDA Production Practices for Major Crops in U.S. Agriculture, 1990-97 ❖ 25
1990 91 92 93 94 95 96 9710
15
20
25
30
35
1990 91 92 93 94 95 96 970
2
4
6
8
10
1990 91 92 93 94 95 96 973
4
5
6
7
8
9
1990 91 92 93 94 95 96 970
2
4
6
8
10
12
1990 91 92 93 94 95 96 970
5
10
15
20
25
30
1990 91 92 93 94 95 96 970
2
4
6
8
10
1990 91 92 93 94 95 96 970
10
20
30
40
50
1990 91 92 93 94 95 96 970
5
10
15
20
25
30
Million acres treated
Million lbs applied
Million acres treated
Million lbs applied
Million lbs applied
Million acres treated
Million lbs appliedMillion acres treated
Million lbs appliedMillion acres treated
Million acres treated
Million lbs applied
Million acres treated
Million lbs applied
Million lbs applied
Million acres treated
Source: USDA, NASS and ERS, 1996c and 1995c.
Cyanazine
MCPA
Acetochlor
Chlorimuron-ethlyl
Bentazon Alachlor
Butylate EPTC
Figure 3A4c--Continued
Change in herbicide ingredients' use, 1990-97

26 ❖ Production Practices for Major Crops in U.S. Agriculture, 1990-97 Economic Research Service/USDA
Organophosphate Pesticides are used in the Production of Many Agricultural Crops
The Food Quality Protection Act of 1996 [PL 104-170] stipulates that risk assessments for pesticide use consider theaggregate exposure from all sources, including food, drinking water, and household uses and that an extra tenfold safetymargin be made for food items common in the diets of infants and children (apples, peaches, pears, potatoes, carrots,sweet corn, green beans, peas, and tomatoes). Organophosphate pesticides have been identified by the U.S.Environmental Protection Agency to be the first family of pesticides to be reviewed under the new guidelines [EPA,1998]. Some current uses of organophosphate pesticides on crops could be prohibited under these new assessment proce-dures.
Organophosphate pesticides can affect the enzyme (acetylcholinesterase) which controls the nervous system.Organophosphate pesticides can be absorbed by inhalation, skin absorption, and ingestion, and certain organophos-phates are prone to storage in fat tissues [EXTOXNET, web site]. The most common symptoms from overexposure areheadaches, nausea, and dizziness, but they can cause sensory and behavior disturbances, lack of coordination, anddepressed motor functions, and at high concentrations organophosphates can cause respiratory and pulmonary failure.The long-term effects of these chemicals, especially when the exposure is during early growth and developmental peri-ods, are not fully known. Concern about those long-term effects is one reason for their re-assessment priority.
Farmers have used organophosphate pesticides for many years to reduce pest damages on many different crops. Thesepesticides can kill a broad spectrum of insect pests and have a longer persistence than some alternatives. A large shareof the fruit and vegetable acreage is treated with organophosphate insecticides, but the major field crops of corn, cot-ton, and wheat account for most of the cropland area treated with these pesticides. Organophosphates were applied toover half the acreage of apples, peaches, pears, and potatoes, all of which are identified as most common in the dietsof infants and children.
USDA’s Agricultural Marketing Service collects data on pesticide residues in food, including fresh and processed fruitsand vegetables [USDA, Agricultural Marketing Service, 1998]. In 1996, 4,856 fruit and vegetable samples were ana-lyzed for residues of 78 different pesticide ingredients, including organophosphates that are most widely used in fruitand vegetable production. About 12 percent of the samples represented imported produce. Organophosphate pesticideresidues were detected on many of the samples, but only three samples exceeded the established tolerance level for thecommodity. Presumptive violations occurred on 90 samples where no tolerance has been set, but an organophosphateresidue was detected.
Apples
Lettuce, head
Cotton
Other fruit
Potatoes
Strawberries
Tomatoes
Other vegetables
Oranges
Sweet corn
Peas
Grapes
Corn
Wheat 9
17
19
23
26
36
38
41
47
52
53
57
67
94
0 20 40 60 80 100
Share of crop area receiving organophospate insecticides
Crop area treatedwith pesticides 1/
Figure A
Organophosphate pesticides were applied to 14% of major field crops, potatoes, fruits, and vegetables, 1995-96
Non-organophosphateinsecticides applied14.9 million acres
Herbicides, fungicides,& other pesticides applied
126.3 million acres
No pesticides applied20.0 million acres
Corn
Cotton
WheatPotatoes & veg.Fruit
Soybeans
Million acres
12.1
6.8
4.2
1.5
1.2
0.4
26.2Total
Area receiving one or moreorganophosphate insecticides
1/ Represents 188 million surveyed acres
Sources, NASS, and ERS, 1996c, 1995d, and 1996d.

Change in Insecticide Ingredients, 1991-97The use of some insecticide ingredients increased while oth-ers decreased or remained relatively unchanged between1991 and 1997 (fig. 3A4d). Among the leading ingredientsthat decreased in use (chlorpyrifos, terbufos, and phorate)
were those most commonly used to treat corn pests whilethose that increased (methyl parathion and aldicarb) werewidely used to treat cotton pests. The use of methylparathion more than doubled between 1991 and 1997.
Economic Research Service/USDA Production Practices for Major Crops in U.S. Agriculture, 1990-97 ❖ 27
1991 92 93 94 95 96 975.6
6.0
6.4
6.8
7.2
1991 92 93 94 95 96 972.0
3.0
4.0
5.0
6.0
1991 92 93 94 95 96 970.4
0.8
1.2
1.6
2.0
1991 92 93 94 95 96 972.0
3.0
4.0
5.0
6.0
7.0
8.0
1991 92 93 94 95 96 970.5
1.0
1.5
2.0
2.5
1991 92 93 94 95 96 971.0
1.4
1.8
2.2
2.6
Million lbs applied
Million acres treated
Million lbs applied
Million lbs applied
Million acres treated
Million lbs applied
Million acres treated
Million lbs applied
Million acres treated
Million acres treated
Million lbs applied
Million acres treated
Million lbs applied
Million lbs applied
Million acres treated
Source: USDA, NASS and ERS, 1996c and 1995c.
Chlorpyrifos Methyl parathion
Terbufos
1991 92 93 94 95 96 970.00.51.01.52.02.53.03.5
Permethrin
Carbofuran Aldicarb
1991 92 93 94 95 96 970.0
0.5
1.0
1.5
2.0
2.5Profenofos Phorate
Figure 3A4d
Change in insecticide ingredients' use, 1991-97
Million acres treated

Bt (Bacillus Thuringiensis) Widely Applied onVegetable CropsBacillus thuringiensis or Bt is a microbial pesticide that cankill certain insect pests (fig. 3A4e). It is the most widelyused microbial pesticide and is used to treat Colorado potatobeetle, cotton budworm, and several other insects on fruitand vegetable crops [Meister, 1996]. Because Bt is a naturalbacterial organism, it offers several health and environmen-tal safety advantages over synthetic pesticides, but may notbe as cost effective as conventional insecticides. Bt was usedon only 4 percent of the total surveyed crop acreage treatedwith an insecticide, but it was used on more than 25 percentof the acreage of several vegetables (cabbage, celery,cucumbers, eggplant, head lettuce, peppers, processedspinach, fresh market tomatoes, strawberries, and raspber-ries). Corn and cotton, however, account for most of the areatreated with Bt. Besides the pesticide ingredient, bioengi-neered seeds with Bt have been developed and are nowbeing marketed for cotton, corn, and potatoes.
28 ❖ Production Practices for Major Crops in U.S. Agriculture, 1990-97 Economic Research Service/USDA
Bt applied to 4 percent of area treated with insecticides, 1996-97 1/
Crops treated with Bt 2/
Field crops
Vegetables
Fruit
0 400 800 1,200 1,600
1,000 acres
Sources: USDA, NASS and ERS, 1996b, 1997a, and 1997b.
796, 4%
323, 16%
261, 11%
Figure 3A4e
2/ The first value at the end of the bar is the area treated with Bt,and the second value is the percent of insecticide-treated area that was treated with Bt.
Area treated with insecticidesother than Bt35.0 million acres, 96%
Area receiving Bt(Bacillus thuringiensis)1.4 million acres, 4% of total area treatedwith insecticide
1/ Represents 36.4 million acres treated with an insecticide out of the 244million acres that were represented by the surveys.

Pesticide Use Trends by Pesticide Type: TotalQuantities, Treated Area, Acre-Treatments, andApplication RatesThe trends in pesticide use were quite different for each pes-ticide type (fig. 3A5). The change in intensity of pesticideuse can be divided into three components: (1) share of areareceiving any pesticide treatments, (2) number of ingredienttreatments per treated acre (acre-treatments), and (3) appli-cation rate per acre-treatment. The total quantity of pesticideused over a full production season is the product of thesethree intensity measurements and planted acreage. Becauseplanted acreage remained relatively stable for the majorfield crops between 1990 and 1997, most of the changes inpesticide use were the result of various changes in intensity.
The share of acres treated gradually increased for herbicidesand fungicides, but remained relatively unchanged for insec-ticides and other pesticides. The largest changes in theintensity of pesticide use occurred with the average numberof acre-treatments and the application rates. For herbicides,
the number of acre-treatments per acre increased while theapplication rates decreased. The net result was a slightdecline in total herbicide use between 1990 and 1997. Thesetrends in herbicide use can partially be attributed to a shiftto ingredients applied at ultra-low rates and the increaseduse of several narrow-spectrum ingredients rather than a sin-gle broad-spectrum ingredient.
The trends for insecticides were somewhat similar but thenet result was a slight upward trend for the total quantitiesof insecticides. For fungicides, the change was from anincrease in both the share of acres treated and the number ofacre-treatments. Fungicide application rates per treatmentdid not change substantially. The large increase in the use of“other pesticide” types was largely a result of increasedapplication rates. The increase in application rates between1991 and 1997 primarily results from a shift to sulfuric acidto kill potato vines prior to harvest. When used, sulfuric acidis applied at several hundred pounds per acre and can substi-tute for other desiccants applied at only a few pounds orounces per acre.
Economic Research Service/USDA Production Practices for Major Crops in U.S. Agriculture, 1990-97 ❖ 29
Figure 3A5
Pesticide use trends by pesticide type, 1990-97
1990 91 92 93 94 95 96 9760
70
80
90
100
110
120
130
1991 92 93 94 95 96 9760
80
100
120
140
160
180
200Index 1990=100
Herbicides
Index 1990=100
1991 92 93 94 95 96 9780
110
140
170
200
230
260
Total quantity applied
Planted area
Percent of area treated
Number of acre-treatments/per acre
Application rate/acre-treatment
1991 92 93 94 95 96 9760
90
120
150
180
210
240
Index 1990=100 Index 1990=100
Fungicides Other pesticides
Source: USDA, NASS and ERS, 1995c and 1996c.
Insecticides

Pesticide Use Trends by Crop: Total Quantities,Treated Area, Acre-Treatments, and ApplicationRatesChanges in the intensity of pesticide use were also quite dif-ferent among the surveyed crops (fig. 3A6). For corn andsoybeans, the number of acre-treatments increased between1990 and 1997, while the application rates decreased.Although slightly larger shares of both crops were treated,most of the increases in acre-treatments result from moreacres treated with a combination of two or more ingredientsrather than with a single ingredient. The decline in applica-tion rates came from the adoption of ultra-low application
rate ingredients and from reductions in the rates of someindividual ingredients, e.g., atrazine on corn. The net resultfrom these changes was a slight decline in the total quantityof pesticides applied to both corn and soybeans. For wheat,similar trends in acre-treatments and application ratesoccurred, but the share of acres treated with pesticidesincreased. Pesticide use on wheat increased from 59 percentof the planted area in 1990 to 75 percent in 1995, thendropped back to 66 percent in 1997. For cotton and pota-toes, the changes were mostly increases in the number ofacre-treatments on the treated area. For cotton, the increasewas due to additional treatments for insect control; for pota-toes, it was for disease control.
30 ❖ Production Practices for Major Crops in U.S. Agriculture, 1990-97 Economic Research Service/USDA
Figure 3A6
Pesticide use trends by crop, 1990-97
1990 91 92 93 94 95 96 9760708090
100110120130
1990 91 92 93 94 95 96 9760708090
100110120130
Index 1990=100 Index 1990=100
1991 92 93 94 95 96 9780
100
120
140
160
180
1990 91 92 93 94 95 96 97708090
100110120130140150
Index 1990=100
Source: USDA, NASS and ERS, 1995c and 1996c.
1990 91 92 93 94 95 96 9750
100150200250300350400
Total quantity applied
Planted area
Percent of area treated
Number of acre-treatments/acre
Application rate/acre-treatment
Index 1990=100
Corn Soybeans
Cotton Wheat
Potatoes
Index 1991=100

Primary Target InsectsResearch to develop biological pest control products, pesteradication programs, and integrated pest management havethe potential to reduce pesticide treatments for several spe-cific pests (fig. 3B). Many of these products and programshave been directed toward specific insects that account forthe major share of the total pesticide treatments. The bollweevil and bollworm together were the primary targetspecies for about two-thirds of all insecticide acre-treat-ments applied to cotton in 1994. The boll weevil eradicationprogram has succeeded in eliminating the pest on nearly 3million acres in North and South Carolina, Georgia, Florida,Arizona, and California [APHIS, 1998].
The emerging technology of Bt-transgenic seeds also holdsa promise for reduced pesticide needs on corn, cotton, andpossibly other crops. These transgenic crops produce a pro-tein toxin in the plants that has been successful in control-ling cotton bollworms, corn borers, and some other insectpests in these and other crops. Bollworms were the primarytarget species for 17.5 million (32 percent) insecticide acre-treatments on cotton in 1994, and the corn borer was the tar-get pest for 2.6 million acre-treatments (13 percent) of allcorn treatments in 1995. The Bt-transgenic corn and cottonseeds were first marketed for widespread use in 1996 andhave the potential to reduce the amount of pesticide used forthese target pests.
Most insecticide acre-treatments on corn are for corn root-worm control. Corn rootworm can usually be controlled byplanting another crop in rotation with corn that does notserve as a host to the pest. Corn rootworm treatments aremost common in the Plains regions and other areas where anonhost crop is often less profitable than continuous corn.Corn rootworms have developed resistant species to severalconventional insecticides in the past and since 1993 there isevidence that some rootworm species survive in corn-soybean rotations.
Most insecticide acre-treatments on wheat are for greenbugsand on potatoes for potato beetles. Both pests have devel-oped biotypes resistant to several kinds of insecticide prod-ucts prompting farmers to seek integrated pest managementpractices to reduce reliance on chemical control methods.
Economic Research Service/USDA Production Practices for Major Crops in U.S. Agriculture, 1990-97 ❖ 31
0.80.7
1.8
0.30.3
1.6
9.42.6
8.6
7.54.2
8.117.317.5Boll weevil
BollwormThrips, aphids, and mitesCutworm and armyworm
Other insects
Corn rootwormCorn borers
Other insects
GreenbugsWheat aphidsOther insects
Potato beetleAphids
Other insects
0 5 10 15 20 25
Figure 3B
Cotton boll weevil and bollworm and corn rootworm were primary target insects, 1994-95
Cotton insects (1994):
Corn insects (1995):
Wheat insects (1995):
Potato insects (1994):
Million acre-treatments forselected insect pests
Sources: USDA, NASS and ERS, 1995c.

32 ❖ Production Practices for Major Crops in U.S. Agriculture, 1990-97 Economic Research Service/USDA
Pest Monitoring PracticesMost definitions and applications of integrated pest manage-ment include pest-monitoring activities as a major element.Information about the presence and infestation levels of dif-ferent pest species or beneficial organisms is essential formaking sound economic decisions concerning the use of pestprevention or intervention practices. Treatment decisions thatare based on economic decision rules or thresholds requirespecific measurements of pest infestation. An economicthreshold, in general, is the pest infestation level at which theexpected crop damages exceed the cost of treatment neces-sary to prevent those damages [Headly, 1972]. Economicthresholds have been developed for major insect pests usingresearch that accounts for (1) the crop yield damage causedby pests at a known level of infestation, (2) the revenue lossfrom pest damage, and (3) the treatment costs. When thisinformation is available, farmers can monitor pests in a fieldand apply the threshold pest number to decide whether atreatment is needed.
Even though scientifically developed thresholds are notavailable for all crop-pest situations, pest monitoring is still avaluable practice for making informed decisions. Some pestsquickly reproduce to damaging infestation levels and justtheir presence can warrant preventive or intervention treat-ments. Knowledge of particular pest species, of changes ininfestation levels, or of developmental stages also helpsfarmers select the appropriate pesticide ingredients, time ofapplication, or treatment method. Monitoring for the purposeof making timely and appropriate treatments can preventfuture spreading of the pest, development of pesticide-resis-tant species, or harm to beneficial organisms.
Professional Scouting Most Common on Cottonand Specialty CropsScouting fields for insects, weeds, and diseases is a commonform of pest monitoring (fig. 3C1). In general the processinvolves examining several small sections of a field or differ-ent plants to identify the presence of a pest species, to mea-sure their population or infestation, or assess their develop-mental stage. The rigor by which the scouting process isapplied can vary widely between regions, crops, and pestspecies. Some weed species can be monitored by rather casu-al observations while small insects, mites, or disease organ-isms require close examination or dissection of plant tissues.
USDA’s Cropping Practices and Chemical Use Surveys in1994 and 1995 collected general information about pestscouting on several crops [USDA, NASS and ERS, 1994;USDA, NASS and ERS, 1995c; USDA, NASS and ERS,1995d]. Producers were asked if their fields were scouted forweeds, insects, or diseases and who did the scouting.
For most crops, either the operator, family member, or farmemployee was most often reported as the person doing the
scouting. Approximately 8 percent of the surveyed crop areawas scouted by a professional scouting service or crop con-sultant. An additional 8 percent was scouted by representa-tives of chemical dealers. Some scouting was also done byrepresentatives of food processors or others.
Professional scouting services, crop consultants, representa-tives of chemical dealers and processors, or other profession-als scouted over half of the cotton, potato, peach, and tomatoacres.
Corn
Soybeans
Wheat
Cotton
Other crops
0 10 20 30 40 50 60(listed below)
PotatoesOrangesGrapesApples
PeachesTomatoes
Strawberries
0 200 400 600 800
Professional service
Chemical dealer
Operator/other
Pest scouting by crop 2/
Million acres
Thousand acres
Source: USDA, NASS and ERS, 1995c, 1995d, and 1994.
39, 74%
39, 76%
12, 89%
51,74%
603, 90%572, 86%
509, 69%277, 84%
102, 71%
96, 92%45, 98%
Chemical dealers9 million acres, 5%
3, 82%
Not scouted43 million acres, 23%
Professional service15 million acres, 8%
(Fresh market)
1/ Represents 188 million acres of surveyed crops.2/ The first value at the end of each bar is the total acreage scouted and thesecond value is the percentage of crop area scouted.
Scouted by operator, employee, or other
121 million acres, 65%
Figure 3C1
Professional scouting most common on cotton and specialty crops, 1994-95 1/

Soil and Tissue Testing for the Presence of PestsMost Common on Specialty CropsSoil and tissue testing are sometimes used to determine thepresence or population of pests that cannot be effectivelymonitored by scouting or casual observations (fig. 3C2).Early detection and treatment during dormant or early devel-opmental stages are often the most cost-effective way totreat several kinds of pests. Soil or tissue testing can detectthe presence of egg masses, weed seeds, or other micro-organisms, and the information can be used to determine ifthe pests are likely to cause economic losses if left uncon-trolled.
Soil or tissue testing was applied to about 4 percent of thesurveyed crop acres. While most of the tested acres weremajor field crops, the practice was used on a larger share ofpotatoes, vegetables, and fruit crops. Soil and tissue testingwere reported on over half of the potato acres in the foursurveyed States. Soil tests in soybeans are often for cystnematodes while those for corn are for corn rootworm.
Economic Research Service/USDA Production Practices for Major Crops in U.S. Agriculture, 1990-97 ❖ 33
Corn
Soybeans
Wheat
Cotton
Potatoes
Oranges
Grapes
Apples
Tomatoes
Peaches
Strawberries
0 500 1,000 1,500 2,000 2,500
1,000 acres
1/ Represents 188 million acres of surveyed crops.
1,034, 9%361, 54%
173, 26%
151, 20%
37, 31%
32, 31%
12, 8%
9, 20%
1,498, 3%
2,052, 3%
1,101, 2%
Sources: USDA, NASS and ERS, 1994, 1995c, and 1995d.
Soil and tissue testing for the presence of pests, by crop 2/
2/ The first value at the end of the bar is the acreage tested, and the second value is the percentage of crop area tested.
(Fresh market)
Area with soil or tissue tests for the presence of pests7 million acres, 4%
Area with no soil or tissuetests for the presence of pests181 million acres, 96%
Figure 3C2
Soil and tissue testing for the presence of pestsmost common on specialty crops, 1994-95 1/

Monitoring Insect Pests with PheromonesPheromones are semio-chemicals (behavior-modifyingchemicals) produced by pests and emitted to attract a mate(fig. 3C3). Pheromones have been synthetically producedfor some insects and are used to lure specific insect pestsinto traps for the purpose of monitoring infestation levelsand their developmental stages. Pheromones can also beused to control insect populations by disruption of mating.(See p. 39.) The number of insects found in traps over aperiod of time can be compared with thresholds to deter-mine whether a treatment is needed. Also, the developmen-tal stage of trapped insects is useful to determine appropri-ate timing of pest treatments. Such traps are widely used tomonitor pests on cotton and in fruit orchards. Pheromonetraps were reported to have been used on over two-thirds ofthe apple acres.
34 ❖ Production Practices for Major Crops in U.S. Agriculture, 1990-97 Economic Research Service/USDA
Cotton
Apples
Oranges
Grapes
Peaches
Tomatoes
Strawberries
0 1,000 2,000 3,000 4,0001,000 acres
Monitoring with pheromones by commodity 2/
1/ Represents 13.6 million acres of cotton, apples, oranges, grapes, peaches, tomatoes, and strawberries.
2,854, 25%
227, 69%
107, 16%
92, 12%
47, 32%
16, 15%
2, 5%
Sources: USDA, NASS and ERS, 1994, 1995c, and 1995d.
2/ The first value at the end of the bar is the acreage monitored, and the second value is the percentage of crop area monitored.
Area using pheromonetraps to monitor insect pests3.3 million acres, 24%
Area not using pheromonetraps to monitor insect pests10.3 million acres, 76%
(Fresh market)
Figure 3C3
Monitoring insect pests with pheromones, 1994-95 1/

Weed Mapping to Aid Herbicide TreatmentDecisionsThe use of preemergence herbicides, which are applied earlyin the growing season to kill weeds as they germinate, is themost common form of weed treatment on field crops. Fieldmapping is a practice that identifies the location, species,and infestation of weeds in fields for the purpose of makingdecisions about future preventive treatments. Mappingweeds helps producers select appropriate herbicide ingredi-ents and application rates and also helps detect the presenceof any herbicide-resistant species. Precision farming, a tech-nology that varies pesticide treatments according to chang-ing field conditions, also requires mapping information toprogram equipment or to apply spot treatments within thefield. The practice was reported on about 11 percent of thearea (fig. 3C4).
Economic Research Service/USDA Production Practices for Major Crops in U.S. Agriculture, 1990-97 ❖ 35
Corn
Soybeans
Cotton
Wheat
0 2,000 4,000 6,000 8,000 10,000 12,0001,000 acres
Area with no weed mapping,165 million acres, 89%
Area with weed mapping,21 million acres, 11%
1/ Represents 186 million acres of corn, soybeans, wheat, and cotton.
Weed mapping on field crops 2/
7,197, 14%
2,432, 14%
1,563, 3%
Sources: USDA, NASS and ERS, 1995c.
9,294, 13%
2/ The first value at the end of each bar is the acreage mapped, and thesecond value is the percentage of crop area mapped.
Figure 3C4
Weed mapping to aid herbicide treatment decisions,1994-95 1/

Practices to Reduce Pest Infestations Growers use several practices to reduce pest infestations andto eliminate or reduce the need for pesticides. They includeseveral cultural and biological practices that are often com-ponents of integrated pest management.
Planting Pest-Resistant Varieties or RootstocksPlanting pest-resistant varieties of crops or using pest-resis-tant rootstock in fruit orchards is an available alternative tocontrol certain crop diseases and pests (fig. 3D1). Plantbreeding programs have been successful in developing moredisease-resistant varieties of wheat, corn, cotton, potatoes,and apples. The cost to growers is generally less than costsassociated with using pesticides. Resistant varieties wereused on a large share of the wheat (54 percent) and peach(44 percent) acreage.
36 ❖ Production Practices for Major Crops in U.S. Agriculture, 1990-97 Economic Research Service/USDA
Wheat
Cotton
Other crops
0 5 10 15 20 25 30 35
(listed below)
Grapes
Oranges
Peaches
Tomatoes
Apples
Strawberries
0 20 40 60 80 100 120
Million acres
Thousand acres
29, 54%
4, 36%
0.3, 16%
86, 12%
85, 13%
63, 44%
39, 37%
31, 10%
17, 37%
Source: USDA, NASS and ERS, 1994, 1995c, and 1995d.
Crops with resistant varieties or rootstocks 2/
Area not using resistantvarieties or rootstocks33 million acres, 50%
Area using resistantvarieties or rootstocks33 million acres, 50%
(Fresh market)
1/ Represents 67 million acres of wheat, cotton, oranges, apples, grapes, peaches, tomatoes, and strawberries.2/ The first value at the end of each bar is the acreage planted with pest-resistant varieties or rootstock, and the second value is the percentage of crop area with this characteristic.
Figure 3D1
Planting pest-resistant varieties or rootstocks, 1994-95 1/

Protecting Beneficial Insect PopulationsBeneficial insects are those that are natural predators of otherpests. They may already be present in the crop fields or theymay be purchased and released. Examples include lady bee-tles and green lacewings for treating fruit mites and naturallyoccurring parasites that are harmful to alfalfa weevils andcereal leaf beetles. This biological method provides success-ful control for some crop-pest situations and reduces theneed for pesticide intervention.
Beneficial insect populations were protected on approxi-mately one-third of the surveyed acreage (fig. 3D2). Specialprecautions to protect beneficial insects were most commonon commodities that have high use of insecticides—cotton,fruits, and vegetables.
Economic Research Service/USDA Production Practices for Major Crops in U.S. Agriculture, 1990-97 ❖ 37
Wheat
Cotton
Other crops
0 4 8 12 16
(listed below)
Oranges
Apples
Grapes
Potatoes
Tomatoes
Peaches
Strawberries
0 100 200 300 400 500
Million acres
Thousand acres
Source: USDA, NASS and ERS, 1994, 1995c, and 1995d.
13, 25%
9, 77%
1, 45%
407,61%
264, 80%
231, 31%
149, 22%
66, 64%
59, 41%
27, 59%
Crops where beneficial insect populations were protected 2/
(Fresh market)
Area not protectingbeneficial insect populations
44 million acres, 65%
Area protecting beneficialinsect populations
23 million acres, 35%
1/ Represents 67 million acres.2/ The first value at the end of each bar is the acreage receiving protection, and the second value is the percentage of crop area receiving protection.
Figure 3D2
Protecting beneficial insect populations, 1994-95 1/

Purchasing and Releasing Beneficial InsectsWhen not naturally present, beneficial insects are sometimespurchased and released into crop fields for the purpose ofsuppressing pests and averting crop damage (fig. 3D3). Forsome crop-pest situations, beneficials can control pests with-out pesticide applications. When the level of infestation istoo high, producers may first destroy pests with a pesticideand then introduce beneficials following the pesticide treat-ments to control subsequent generations.
Less than 1 percent of the surveyed crops were affected bythe release of beneficial insects in the field or surroundingarea. The practice was most common on strawberries.
Adjusting Planting Dates to Avoid PestsPest populations mature and reach peak concentrations atspecific times. Adjusting planting dates can help avoid pestpopulations being in the fields at critical times to cause cropdamage (fig. 3D4). A notable example is the Hessian-flysafe dates for planting winter wheat. Delaying wheat planti-ng until after these “safe” dates assures less damage byinsects than earlier plantings. Planting dates are also plannedto avoid weather conditions that are conducive to plant dis-eases. Pest avoidance was considered in planting decisionson approximately one-third of the surveyed acres.
38 ❖ Production Practices for Major Crops in U.S. Agriculture, 1990-97 Economic Research Service/USDA
Wheat
Cotton
Oranges
Grapes
Strawberries
Potatoes
Apples
Tomatoes, fresh
Peaches
0 100 200 300 400
Crops where beneficial insects were purchased and released 2/
108, *
53, 8%
39, 5%
16, 35%
3, *
3, 3%
1, *
326, *
8, 1%
1,000 acres
Sources: USDA, NASS and ERS, 1994, 1995c and 1995d.
Area where beneficialinsects were not released,66.8 million acres, 99%
Area where beneficialinsects were released555,000 acres, less than 1%
2/ The first value at the end of each bar represents the acreage usingbeneficial insects and the second value is the percentage of crop area using them. An " * " indicates that beneficial insects were used on less than 1 percent of area.
Figure 3D3
Purchasing and releasing beneficial insects, 1994-95 1/
1/ Represents 67 million acres of surveyed crops.
Wheat
Cotton
0 5 10 15 20 25
Tomatoes,
Strawberries
0 2 4 6 8 10 12 14
Million acres
Thousand acres
Crops where planting dates were adjusted to avoid pests 2/
4, 32%
19, 35%
11, 11%
7, 15%
1/ Represents 65 million acres .2/ The first value at the end bar is the acreage where planting date was adjusted to avoid pests and the second value is the percentage of croparea for which the planting date was adjusted.
fresh market
Area where planting datewas adjusted
22. 6 million acres, 35%
Area where plantingdate was not adjusted42.2 million acres, 65%
Sources: USDA, NASS and ERS, 1994, 1995c, and 1995d.
Figure 3D4
Adjusting planting dates to avoid pests, 1994-95 1/

Controlling Insect Pests with PheromonesBesides monitoring, pheromones are also used as a stimulusto disrupt the mating process, thus controlling and suppress-ing the pest population (fig. 3D5). Kits that slowly releasethe pheromone into the air are placed throughout crop fields.Usually males of the particular insect species are lured bythe pheromone and few are able to find females and matesuccessfully. Synthetic pheromones continue to be devel-oped for additional species and are now available for severalcommon insect pests including pink bollworm, oriental fruitmoth, and codling moth. Some benefits of usingpheromones are long-term reduction in pest population forthe treated areas, little or no mammalian toxicity, and com-patibility with cultural practices and natural control agents.
Pheromones were used for controlling pest populations on10 percent of the surveyed area. Pheromones often costmore than insecticide treatments. Also, the treatment doesnot provide 100-percent control as some females are stillable to mate successfully and others can migrate into sur-rounding areas to lay eggs.
Economic Research Service/USDA Production Practices for Major Crops in U.S. Agriculture, 1990-97 ❖ 39
Cotton
Other crops
0 200 400 600 800 1,000 1,200 1,400
Apples
Grapes
Peaches
Tomatoes, fresh market
Oranges
Strawberries
0 10 20 30 40 50 60Thousand acres
Crops where pheromones were used to control insects 2/
(listed below)
Thousand acres
1,141, 10%
158, 8%
*
50, 15%
36, 5%
30, 21%
21, 20%
20, 3%
Sources: USDA, NASS and ERS, 1994, 1995c, and 1995d.
Area not using pheromones12.3 million acres, 90%
Area using pheromones
1.3 million acres,10%
1/ Represents 13.6 million acres of cotton, fruits, and vegetables.2/ The first value at the end of each bar is the acreage using pheromones, and the second value is the percentage of crop area using pheromones.*=Less than 1 percent.
Figure 3D5
Controlling insect pests with pheromones, 1994-95 1/

40 ❖ Production Practices for Major Crops in U.S. Agriculture, 1990-97 Economic Research Service/USDA
Treating Seeds with PesticidesTreating seeds with pesticides protects the seeds from dis-eases or pests while in storage as well as preventing lossesfrom pests after planting (fig. 3D6). Seed-borne diseases, likeseptoria seedling blight in wheat, can be avoided by seedtreatments. Seed treatments or seed coating can also preventdamage from soil insects before the seed germinates.
For the major field crops surveyed—wheat, soybeans, cot-ton, and potatoes—39 percent of total acres used treatedseeds. Most noted were cotton (81 percent) and potatoes (80percent). Treated seedcorn was not included in the survey asnearly all hybrid seedcorn receives pesticide treatments.
Planting Herbicide-Resistant SeedcornRecently, seeds have been developed that allow treatmentwith herbicides that previously damaged the crop (fig. 3D7).Specifically, seedcorn is now marketed with resistance ortolerance to imidazoline herbicides. Imidazoline herbicidesinhibit the synthesis of certain amino acids as the mode ofaction (ALS inhibitors) and can be alternated with herbi-cides, such as triazines, that have a different mode of actionto reduce the development of resistant weed species. Also,the broader choice of herbicides offers greater flexibility forcontrolling difficult weed species. For no-till systems thatmay eliminate the need for soil-incorporated herbicides, thenew seeds offer a post-emergence treatment for grassyweeds. Soybeans are also being developed and marketedthat are resistant to additional herbicides, includingglyphosate (sold as Roundup Ready).
Wheat
Soybeans
Cotton
Potatoes
0 5 10 15 20 25 30
1/ Represents 116 million acres.
9.4, 81%
0.6, 80%
Million acres
Sources: USDA, NASS and ERS, 1995c.
22.8, 43%
12.2, 24%
Area with treated seeds45 million acres, 39%
Seeds treated with pesticides 2/
2/ The first value at the end of each bar is the acreage with seed treatments,and the second value is the percentage of crop area with seed treatments.
Area not using treated seeds71 million acres, 61%
Figure 3D6
Treating seeds with pesticides, 1995 1/Figure 3D7
Corn planted with resistance to ALS-inhibitorherbicides, 1995
Area planted with conventionalseed corn hybrids59.3 million acres, 93%
Area planted with resistance to ALS herbicides4.8 million acres, 7%
Sources: USDA, NASS and ERS, 1995c.

Economic Research Service/USDA Production Practices for Major Crops in U.S. Agriculture, 1990-97 ❖ 41
Alternating Pesticides to Slow Development of Resistant SpeciesPest populations can develop resistance to a particular pesti-cide or pesticide family over time. A few individuals from apest population can inherit genetic characteristics that with-stand the pesticide. These surviving species are the geneticpool for future generations, which are also likely to have theresistant trait. Repeated applications with the same pesticidecan result in a population dominated by resistant species thatrequire alternative means of control. Resistance has been iden-tified as a problem in treating many crop pests, but has beenmost notable for insect pests of cotton and potatoes.Accounting for yield losses, alternative treatments, and envi-ronmental damages, pesticide-resistance costs have been esti-mated at more than $1 billion (Meister, 1995).
Rotating pesticides from year to year is a practice that slowsthe development of resistant strains of insects or weeds (fig.3D8). Approximately half of the surveyed acres were treatedby alternating pesticides for the purpose of slowing resis-tance. Of the field crops surveyed, potatoes and soybeanswere the crops that most used this practice. Of the fruit andvegetable crops, apples, fresh tomatoes, and strawberrieswere highest users. Corn
Soybeans
Wheat
Cotton
Other crops
0 10 20 30 40 50
Potatoes
Oranges
Grapes
Apples
Peaches
Tomatoes,
Strawberries
0 100 200 300 400 500 600Thousand acres
(listed below)
Sources: USDA, NASS and ERS, 1994, 1995c, and 1995d.
Million acres
42, 60%
34, 66%
21, 39%
6, 54%
2, 61%
509, 77%
409, 61%
269, 36%
248, 76%
96, 67%
77, 74%
33, 72%
Area alternating pesticides to slow development of
resistant species104 million acres, 55%
Area where same pesticideingredients are consistently
used for pest control84 million acres, 45%
Crops for which pheromones were used to control insects 2/
1/ Represents 188 million acres of surveyed crops.2/ The first value at the end of each bar is the acreage on which pesticides were alternated, and the second value is the percentage of crop area onwhich pesticides were alternated.
fresh market
Figure 3D8
Alternating pesticides to slow developmentof resistant species, 1994-95 1/

Triazine-Resistant Weeds in Corn, 1996Repeated applications of triazine herbicides (atrazine,simizine, cyanazine, metribuzin, and others) can result inweeds resistant to the chemical. Weeds that are resistant totriazine herbicides are among the more common resistantbiotypes found in corn fields. In 1996, farmers in major pro-duction States reported the presence of some triazine-resis-tant weeds on 10 percent of their planted corn area. Theshare of area with triazine-resistant weeds ranged from 3percent in South Dakota to 37 percent in Michigan (fig.3D8a). Some of the practices used by farmers to retard thedevelopment of resistance to triazines or other herbicidesinclude alternating herbicides with different modes ofaction, crop rotations, and field cultivations.
42 ❖ Production Practices for Major Crops in U.S. Agriculture, 1990-97 Economic Research Service/USDA
3
17
74
37
10
9
8 7 11
Figure 3D8a
Triazine-resistant weeds in corn acreage, 1996Percentage of planted corn area with triazine-resistant weeds
Sources: USDA, NASS and ERS, 1996c.

Pesticide Application Decision FactorsSeveral factors are used by growers to determine whether ornot to apply pesticides. Economic thresholds, contractrequirements, preventive schedules, previous infestation lev-els, and information sources such as agricultural magazinesand journals are examples. The surveys asked farmers aboutthe decision strategy used to determine whether or not toapply a pesticide.
Use of Thresholds as a Decision Factor to ApplyInsecticidesGrowers use different methods to determine when pestinfestations reach or are expected to reach levels that requiretreatment (fig. 3E1). Some use professional scouts to mea-sure the infestation in their fields and apply pesticides onlywhen the infestation reaches the threshold as prescribed bythe Extension Service or other research-based sources. Farmoperators or their employees may al47so do the scoutingand similarly apply research-based thresholds. Analyticallyderived thresholds are not available for all crop-pest combi-nations or may not apply to all situations. Based on theirown experience and knowledge, farmers may have their own“experience-based” thresholds that help them decidewhether or not to apply pesticides. The surveys asked farm-ers if their decision strategy was based on threshold levels,either provided by an outside source or determined by thefarm operator. Most insecticide treatments for cotton, wheat,and specialty crops were based on some threshold concept.Thresholds were less widely used for corn insecticides.Insecticide treatments on corn are often for soil insect peststhat are difficult to monitor, and decisions are often basedon previous problems and crop sequence.
Economic Research Service/USDA Production Practices for Major Crops in U.S. Agriculture, 1990-97 ❖ 43
Wheat
Corn
Soybeans
Cotton
Other crops
0 10 20 30 40 50
Potatoes
Oranges
Grapes
Apples
Tomatoes,
Strawberries
0 100 200 300 400 500 600Thousand acres
(listed below)
Sources: USDA, NASS and ERS, 1994, 1995c, and 1995d.
Million acres
Figure 3E1
1.6, 63%
11, 92%
14, 28%
16, 23%
40, 75%
34, 74%
73, 70%
183, 56%
304, 41%
489, 73%
Use of thresholds83 million acres, 44%
Use of other decision factors105 million acres, 56%
Use of economic thresholds as a decision factorto apply insecticides, 1994-95 1/
Crops for which economic thresholds were used as a decision factor to apply insecticides 2/
1/ Represents 188 million acres of surveyed crops.2/ The first value at the end of each bar is the acreage on which economic thresholds were applied, and the second value is the percentage of crop area on which they were applied.
fresh market
517, 78%

Sale Contracts That Require Treatments withPrescribed PesticidesTo maintain consistent product quality or for food safetyreasons, some buyers restrict or prescribe the use of certainkinds of pesticides (fig. 3E2). Such buyers may include,among others, processors of infant foods, distributors of cer-tified organic produce, or processors and retailers who useenvironmental labels. Processors who desire a uniform prod-uct quality or appearance may also stipulate the type andtiming of pesticide treatments.
44 ❖ Production Practices for Major Crops in U.S. Agriculture, 1990-97 Economic Research Service/USDA
Figure 3E2
Sale contracts that required treatmentwith prescribed pesticides, 1995 1/
Area for which prescribed pesticideswere not a contract requirement,1.7 million acres, 98%
1/ Represents 1.74 million acres of oranges, apples, and grapes.
Sources: USDA, NASS and ERS, 1995d.
Area required to applyprescribed pesticides by contract, 32,000 acres, 2%

Use of Preventive Schedules or HistoricInformation for Pesticide Application DecisionsProducers who do not scout or use thresholds to make theirdecisions about whether treatments are necessary often relyon preventive schedules and historic information about thepest (fig. 3E3). Where pest infestations vary widely betweenyears, the use of such preventive schedules can result inunnecessary treatments when threshold levels do not occur.Regularly scheduled pesticide applications were most com-mon on apples—40 percent of area—where large economicdamages can occur with very low infestations of pests thataffect fruit quality.
Economic Research Service/USDA Production Practices for Major Crops in U.S. Agriculture, 1990-97 ❖ 45
Corn
Soybeans
Wheat
Cotton
Other crops
0 5 10 15 20 25 30
Grapes
Apples
Oranges
Tomatoes,
Peaches
Strawberries
0 50 100 150 200 250Thousand acres
(listed below)
Sources: USDA, NASS and ERS, 1994, 1995c, and 1995d.
Million acres
Figure 3E3
25, 38%
14, 28%
8, 14%
1, 7%
0.5, 19%
183, 25%
133, 40%
108, 16%
26, 25%
13, 9%
9, 20%
Use of preventive schedule and historic information for pesticide application decisions,1994-95 1/
Area for which pesticide treatmentdecision was based on other factors,
138 million acres, 74%
Crops for which preventive schedules and historic information were used to make pesticide application decisions 2/
Area for which the pesticide treatmentdecision was based on a preventive
schedule or historic information,50 million acres, 26%
1/ Represents 188 million acres of surveyed crops.2/ The first value at the end of each bar is the acreage on which preventive schedules were used, and the second value is the percentage of crop areausing preventive schedules to make pesticide application decisions.
fresh market

Information Sources for Making PestManagement DecisionsGrowers obtain pest control information from a variety ofsources including extension advisors, extension publica-tions, chemical dealers, and scouting services (fig. 3E4).The source of producers’ pest management information, aswell as its currency and accuracy, can be important inimplementing new pest management policies. Providers ofprofessional pest management information, such as paidcrop consultants, may recommend treatment options thathave an established record for effectiveness, while chemicaldealers may desire to expand sales of their newer or moreprofitable product lines.
46 ❖ Production Practices for Major Crops in U.S. Agriculture, 1990-97 Economic Research Service/USDA
Wheat
Cotton
Other crops
0 10 20 30 40 50 60
Grapes
Oranges
Apples
Peaches
Tomatoes,
Strawberries
0 200 400 600 800 1,000
Extension Service
Prof. services
Chemical dealer
Other sources
Thousand acres
(listed below)
Sources: USDA, NASS and ERS, 1994, 1995c, and 1995d.
Figure 3E4
Information sources for making pest managementdecisions, 1994-95 1/
Information sources for making pest management decisions,by crop 2/
Million acres
53
12
2
744
671
329
144
104
46
1/ Represents 67 million acres of surveyed crops.2/ The value at the end of each bar is the crop acreage relying on differentinformation sources for pest management decisions.
Professional scouting serviceor crop consultant,
11 million acres, 16%
Extension Service,10 million acres, 15%
Media, demonstrations, and other sources,
11 million acres, 16%
Chemical dealer,35 million acres, 53%
fresh market

Pesticide Application MethodsDifferent pesticide application practices can affect the treat-ment efficacy, reduce the quantity of pesticide applied, orhave different potential health and environmental risks (fig.3F1). Alternative treatment methods require different kindsof equipment and have different labor and equipment costs.To reduce risks, Federal and State laws, regulations, andpermit systems dictate many safety precautions to be usedwhen applying pesticides, as well as for storing, transport-ing, and disposing of unused pesticide materials. Additionalsafety precautions include restricting entry to the fields for anumber of days following applications, forbidding applica-tions within a certain number of days before harvest, speci-fying maximum application rates, requiring protective cloth-ing, respirators, and special equipment, and specifying thecrop development stages when applications can be made.Although these safety standards eliminate most risk tohealth and the environment, the quantity of material appliedand the risk can vary by method of application.
Application methods can affect the amount of pesticide thatmoves off cropland either by atmospheric drift, leaching, orrunoff. Pesticide applications made by aircraft or groundequipment that creates a mist, fog, or dust require specialprecautions to prevent drift by wind to nontarget areas or toprevent skin contact and inhalation. Pesticides incorporatedor placed directly into the soil have a greater probability ofleaching to ground water, while those applied to the surfaceare subject to both runoff and leaching. Pesticides applied tofoliage have risk of atmospheric loss as well as risk to thehealth of applicators or farmworkers who enter the field fol-lowing applications. Reduced coverage practices are some-times used in lieu of full broadcast coverage and they usual-ly require a smaller quantity of pesticide materials.
USDA surveys have estimated that ground broadcast applica-tions were the most widely used means of applying all typesof pesticides to crops. Nearly three-fourths of all pesticideacre-treatments on the surveyed fruits, vegetables, and fieldcrops used this application method. Another 14 percent ofthe acre-treatments were broadcast by aircraft. While manybroadcast pesticides must be incorporated into the soil to beeffective, only a small share of the quantity of pesticideswere applied directly to or injected into the soil. Applicationpractices that provided less than 100 percent soil or canopycoverage accounted for about 10 percent of the total acre-treatments. Applying pesticides through irrigation systems(chemigation) is another broadcast method but it accountedfor a very small share of the total acre-treatments.
Economic Research Service/USDA Production Practices for Major Crops in U.S. Agriculture, 1990-97 ❖ 47
1/ Represents 188 million acres of surveyed crops, of which 165 millionreceived at least one pesticide acre-treatment.
Sources: USDA, NASS and ERS, 1994, 1995c, and 1995d.
Broadcast by aircraft,80 mil. acre-treatments, 14%
Direct soil placement, 15 mil. acre-treatments, 3%
Chemigation,2.5 mil. acre-treatments, <1%
Reduced coverage methods, 57 mil. acre-treatments, 10%
Ground broadcast,412 million acre-treatments, 73%
Figure 3F1
Pesticide application methods, 1994-95 1/

Reduced-Coverage Application MethodsSpot treatments, band application, and alternate-row spray-ing can reduce pesticide use and costs and still control cer-tain pests (fig. 3F2). Spot treatment, which selectively treatssmall infested areas in a field, is effective when the pests areconcentrated in a particular section of a field or when pestscan be treated before spreading or migrating throughout afield. Another form of spot treatment is the selective treat-ment of each target pest, such as with a wick-type applicatorused for shattercane or other tall weeds in soybeans.Banding pesticide application over the rows and not treatingthe middle of the rows is another reduced coverage practicethat can reduce the quantity of pesticide applied. Bandedherbicide applications are sometimes used to control weedsbetween plants within rows, then mechanical cultivations areused to control the weeds between the rows. Banded treat-ments are also used for certain soil insects that attack plant-ed seeds or plant roots. Alternate-row spraying is a practicesometimes used in orchards. With this practice only one sideof the fruit trees is sprayed with each treatment, with theopposite side sprayed with the following treatment. Somepesticide material will drift and provide partial protection tothe opposite side of the tree until it receives a full treatmentat the next application.
About 10 percent of all pesticide acre-treatments are one ofthe above types of reduced-coverage practices. Corn, cotton,and soybeans accounted for most of the acre-treatmentsusing these practices, but the reduced-coverage practicesaccounted for only a small share of the total acre-treatmentson these crops (corn, 12 percent; soybeans, 7 percent; cot-ton, 15 percent). In contrast, most pesticide treatments onfresh market tomatoes (86 percent) and strawberries (66 per-cent) were a reduced-coverage practice. Alternate-rowspraying or other reduced-coverage practices accounted formore than 20 percent of the acre-treatments on apples andpeaches. Reduced-coverage applications on field crops werechiefly of herbicides, while reduced-coverage applicationson fruits and vegetables were most commonly insecticidesand fungicides.
48 ❖ Production Practices for Major Crops in U.S. Agriculture, 1990-97 Economic Research Service/USDA
Corn
Cotton
Soybeans
Other crops
Wheat
0 10 20 30
Tomatoes,
Peaches
Apples
Potatoes
Grapes
Oranges
Strawberries
0 500 1,000 1,500 2,000 2,500 3,000
Figure 3F2
0.5, 1%
10, 7%
19, 15%
22,12%
Million acre-treatments
(Listed below)
Thousand acre-treatments
2,200, 86%
1,200, 27%
1,204, 21%
425, 3%
401, 13%
311, 6%
301, 66%
Sources: USDA, NASS and ERS, 1994, 1995c, and 1995d.
6, 17%
fresh market
Reduced-coverage applications methods by crop 2/
Reduced-coverage application methods (band applications, spot treatments, and alternaterow spraying, 1994-95 1/)
Pesticide types applied using reduced-coverage methods
1/ Represents 56 million acre-treatments using a reduced-coverageapplication method.2/ The first value at the end of each bar is the number of acre-treatments,
the second value is the percentage of the total crop acre-treatments.
Other pesticides,1 million acre-treatments, 2%
Fungicides,3 million acre-treatments, 6%
Insecticides,14 million acre-treatments, 24%
Hebicides,38 million acre-treatments, 68%
and

Pesticide Applications by AircraftPotential drift or “chemical trespass” is most likely when pes-ticides are applied as a fine mist, fog, or dust and applied inthe presence of wind (fig. 3F3). Pesticides applied by eitheraircraft or ground broadcast methods can drift to nontargetsites with wind gusts or thermal inversions during and shortlyfollowing the application. Some pesticide materials will evencontinue to volatilize into the atmosphere for several daysafter application. While wind, particle size, spray pressure,and equipment calibration are important factors and requiresafety precautions, some application equipment and methodsare better at targeting and preventing drift than others.
Pesticide applications made by aircraft usually are less pre-cisely targeted than ground application equipment. Aircraftare often used to apply pesticides when crops reach agrowth stage such that ground equipment would harm thecrop or when soils are too wet to support ground equipment.Pesticide applications by aircraft were most common on cot-ton and wheat. About 38 percent of the cotton and 21 per-cent of the wheat pesticide acre-treatments were applied byaircraft. For cotton, these applications were mostly forinsect control, while for wheat they were for weeds.
Economic Research Service/USDA Production Practices for Major Crops in U.S. Agriculture, 1990-97 ❖ 49
Cotton
Wheat
Corn
Other crops
Soybeans
0 10 20 30 40 50 60
Potatoes
Tomatoes,
Apples
Peaches
Grapes
Oranges
Strawberries
0 1,000 2,000 3,000 4,000 5,000
Million acre-treatments
(Listed below)
Thousand acre-treatments
Sources: USDA, NASS and ERS, 1994, 1995c, and 1995d.
6, 17%
7, 2%
72,1%
90, 3%
94, 2%
103, 2%
124, 5%4, 636, 36%
1/ Represents 80 million acre-treatments applied by aircraft.2/ The first value at the end of each bar is the number of acre-treatmentsapplied by aircraft, and the second value is the percentage of total cropacre-treatments applied by aircraft.
3, 2%
6, 3%
18, 21%
48, 38%
Aircraft applications by crop 2/
Figure 3F3
Pesticide types applied by aircraft
Pesticide applications made by aircraft, 1994-95 1/
Herbicides,23 million acre-treatments, 28%
Other pesticides,10 million acre-treatments, 12%
Fungicides,4 million acre-treatments, 5%
Insecticides,44 million acre-treatments, 55%
fresh market

Ground Broadcast ApplicationsWhether applied to the plant canopy or to the soil surface,the use of ground broadcast equipment accounted for mostpesticide applications (fig. 3F4). Ground broadcast applica-tions accounted for 87 percent of the herbicide acre-treat-ments, but less than half of the acre-treatments of all otherpesticide classes (insecticides, 9 percent; fungicides, 2 per-cent; other pesticides, 2 percent). More than 75 percent ofall pesticide acre-treatments on wheat, soybeans, corn, andsurveyed fruit used a ground broadcast application method,compared with less than 50 percent of cotton and vegetableacre-treatments.
50 ❖ Production Practices for Major Crops in U.S. Agriculture, 1990-97 Economic Research Service/USDA
Corn
Soybeans
Wheat
Cotton
Other crops
0 20 40 60 80 100 120 140 160
Potatoes
Oranges
Apples
Peaches
Grapes
Tomatoes,
Strawberries
0 1 2 3 4 5 6 7
Million acre-treatments
(Listed below)
Thousand acre-treatments
Sources: USDA, NASS and ERS, 1994, 1995c, and 1995d.
Ground broadcast applications by crop 2/
140, 80%
132, 91%
65, 77%
53, 43%
21, 59%
5.6, 44%
4.6, 91%
4.3, 77%
3.2, 71%
2.5, 83%
0.2, 7%
0.1, 27%
1/ Represents 412 million acre-treatments made with ground equipment toeither the plant follage or the soil surface.2/ The first value at the end of each bar is the number of acre-treatments
Figure 3F4
Pesticide types applied by ground broadcast
Pesticide applications made by ground broadcast methods, 1994-95 1/
Fungicides,9 million acre-treatments, 2%
Insecticides,38 million acre-treatments, 9%
Other pesticides,8 million acre-treatments, 2%
Herbicides,356 million acre-treatments, 87%
fresh market
applied by ground broadcast methods, and the second value is the percentage of crop acre-treatments applied by ground methods.

Direct Soil Placement MethodsGround application equipment that applies the pesticidematerials directly into the soil by injection or into a furrowmade by a planter or tillage equipment can have some safetyadvantages over surface application methods (fig. 3F5).There is less risk of direct contact by humans or wildlifewhen the pesticide is placed in the soil, and the soil covercan reduce potential losses to the atmosphere or runoff fromprecipitation. Some States even exempt direct soil placementmethods from obtaining spray permits when applying cer-tain pesticide materials. A common use of direct soil place-ment is the treatment for corn rootworm in corn and severalsoil insects in cotton. Soil fumigation for strawberries, freshmarket tomatoes, potatoes, and some other crops is anotheruse of the practice, but accounts for a relatively small shareof the total acres using direct soil placement methods.
Economic Research Service/USDA Production Practices for Major Crops in U.S. Agriculture, 1990-97 ❖ 51
Corn
Cotton
Soybeans
Wheat
Vegetables
0 2 4 6 8 10Million acre-treatments
Sources: USDA, NASS and ERS, 1994, 1995c, and 1995d.
Figure 3F5
Pesticides applied by direct soil placementmethods, 1994-95 1/
Pesticide types applied by direct soil placement methods
& fruit 3/
7.2, 4%
5.5, 4%
1.0, *
0.4, *
0.6, *
Crops treated by direct application methods 2/
1/ Represents 14.7 million acre-treatments of pesticides applied directly intothe soil.2/ The first value at the end of the bar is the number of pesticide acre-treatments applied by direct soil placement, and the second value is the percentage of total pesticide acre-treatments that used this applicationmethod. An "*" indicates that less than 1 percent used this method.3/ Includes potatoes, tomatoes, lettuce, strawberries, apples, grapes, peaches, and oranges in surveyed States.
Insecticides,8 million acre-treatments, 55%
Other pesticides,0.4 million acre-treatments,
3%
Fungicides,9 million acre-treatments, 2%
Herbicides,5 million acre-treatments, 34%

Irrigated Area and ChemigationSome pesticide materials are applied through sprinkler anddrip irrigation systems—a practice called chemigation (fig.3F6). While a practical and cost-saving application technol-ogy for some pesticides, it requires special precautions toprevent water contamination from runoff, leaching, or back-siphoning into wells.
Chemigation was not a widely used practice for applyingpesticides to any of the surveyed crops, except for potatoes.Approximately 80 percent of the potatoes were irrigated,and chemigation was used to apply some pesticides onabout 40 percent of the irrigated acres (32 percent of totalacres). On the potato area treated by chemigation, an aver-age of five different pesticide applications, mostly fungi-cides, were made during the growing season.
52 ❖ Production Practices for Major Crops in U.S. Agriculture, 1990-97 Economic Research Service/USDA
Corn
Potatoes
Cotton
Other crops
0 100 200 300 400 500
Sources: USDA, NASS and ERS, 1994, 1995c, and 1995d.
Figure 3F6
Irrigated area and chemigation, 1993-94
Irrigated area treated by chemigation Pesticide types applied by chemigation 1/
Thousand acres
365, 40% (5.1)
423, 4% (1.0)
54, 1% (2.2)
61, * (1.0)
Crop area treated and average number of chemigation treatments 2/
1/ Chemigation is the application of pesticides through an irrigation system. Represents 861,000 surveyed acres of irrigated corn, soybeans, cotton, potatoes,apples, oranges, and grapes and applied pesticides by chemigation.2/ The first value at the end of each bar is the number of acres treated by chemigation; the second value is the percentage of irrigated area treated bychemigation; and the third value is the average number of chemigation acre-treatments applied during the year. An "*" indicates that less than 1 percent used this method.
Irrigated area without chemigation,23 million acres, 96%
Fungicides,1.1 million acre-treatments, 42%
Chemigation area,903,000 acres, 4%
Insecticides,0.7 million acre-treatments,
28%
Herbicides,0.6 million acre-treatments,
25%
Other pesticides,0.1 million acre-
treatments, 5%

Crop RotationsCrop rotations can help control pests, supplement soil nutri-ents, improve soil tilth, and reduce soil erosion, but produc-ers may have to forgo some income when the rotationincludes low-profit crops [NRC, 1989]. Alternatively, pro-ducing the highest profit crop on the same land year afteryear (monoculture) is feasible on many soils with goodmanagement of the soil, nutrients, and pests. Besides farmprofits, crop rotations may also affect the environment.Environmental effects from crops grown in one year that areerosive or require high levels of chemical input may be miti-gated by crops grown in other years in the rotation that areless erosive or use fewer chemicals. For example, soil-con-serving crops can be grown in rotation with erosive rowcrops to keep average soil loss under the tolerance levels.Another way crop rotation affects the environment is whencrops grown in a specific sequence have a beneficial effecton the following crop. For example, a legume crop canlower the fertilizer needs for a following crop. Also, therotation of different crops often breaks the pest reproductioncycle and lowers the need for pesticides.
Federal farm policy changes could encourage greater use ofcrop rotation. Early Federal Government price support pro-gram payments were calculated using a farm base acreageand yield concept that encouraged producers to plant programcrops in order to maintain maximum eligibility. The Food,Agriculture, Conservation, and Trade Act of 1990 and the
Federal Agricultural Improvement and Reform Act of 1996provided options to grow alternative crops and could encour-age crop rotation when alternative crops are a profitableoption to program crops [USDA, ERS, 1996]. The 1990 Actcontained a flex-acre provision that allowed farmers to plantup to 15 percent of their contract acreage to certain alternativecrops. The 1996 Act basically eliminated all acreage restric-tions and allows farmers to respond to market signals withoutregard to future program eligibility. With these changes, farm-ers can select alternative rotations and not lose base acreageand eligibility for Federal support payments.
The information about preceding crops from USDA’sAgricultural Resource Management Study was used to esti-mate acreage in alternative rotations or acreage where thesame crop was produced for 3 consecutive years (monocul-ture) [USDA, ERS, 1996c]. Because some rotation systemslast more than 3 years, the 3-year crop sequence availablefrom the survey may not accurately reflect longer term rota-tion systems. Also, the constructed rotations represent onlyland where the 1997 planted crop was corn, soybeans, wheat,cotton, or potatoes. Additional area may be in some of theconstructed rotations if crops other than those previously list-ed were planted or produced in 1997, for example, hay, othersmall grains, or other row crops. Estimates of winter covercrops were also constructed from the survey data. Any fall-planted small grain, hay, or meadow crops were assumed tobe cover crops. (See box on Cover Crop Benefits, p. 62.)
Economic Research Service/USDA Production Practices for Major Crops in U.S. Agriculture, 1990-97 ❖ 53
Chapter IV
General Crop Management Practices

Most Cotton Grown with Monoculture, but CropRotation is Common with Other Field CropsOne-fifth of the total area planted to corn, soybeans, wheat,cotton, and fall potatoes in 1997 were also planted to thesame crop in the preceding 2 years (monoculture practice)(fig. 4A). On the remaining area, a rotation with at least
one other crop or any idle year occurred in one or both ofthe 2 preceding years. Monoculture production practiceswere most widely used for cotton. Wheat and corn, how-ever, accounted for the largest acreage of crops using amonoculture system. Monoculture was least used for soy-beans and potatoes.
54 ❖ Production Practices for Major Crops in U.S. Agriculture, 1990-97 Economic Research Service/USDA
Sources: USDA, NASS and ERS, 1994, 1995c, and 1995d.
Figure 4A
Most cotton grown with monoculture, but crop rotation is common with other field crops, 1997 1/
Wheat Corn
Cotton Soybeans Fall potatoes
1/ Represents 198 million acres of total U.S. cropland.
Area in rotation system,162 million acres, 82%
Area in a monoculture system,37 million acres, 18%:
Wheat (14 million acres)
Corn (9 million acres)
Cotton (8 million acres)
Soybeans (6 million acres)
In rotation, 42 million acres, 75%
In monoculture, 14 million acres, 25%
In monoculture,9 million acres,15%
In rotation,53 million acres, 85%
In rotation, 5 million acres, 40%
In monoculture, 8 million acres, 60%
In monoculture, 6 million acres, 8%
In rotation, 0.9 million acres, 99%
In monoculture, 0.01 million acres, 1%
In rotation, 61million acres, 92%

Monoculture PracticesMonoculture systems for wheat, corn, and cotton were con-centrated in a few regions, mostly because of the uniquenessof soil and water resources (fig. 4B). Continuous wheat wasmore common in Texas and Oklahoma—States whichreceive sufficient annual rainfall for wheat but frequentlytoo little rainfall to support row crops without supplementalirrigation. Most cotton produced in the Delta Region wasgrown with a monoculture practice. Cotton production reliesheavily on insecticides to control damaging pests in thisregion. Continuous corn occurred throughout most of thecorn-producing region. However, continuous corn was mostcommon in Kansas and Nebraska—States that extensivelyuse groundwater for irrigating corn.
Economic Research Service/USDA Production Practices for Major Crops in U.S. Agriculture, 1990-97 ❖ 55
Figure 4B
Monoculture's share of planted area by crop and State, 1997 1/
Sources: USDA, NASS and ERS, 1996c.
Corn
Wheat
Cotton
* = Less than 1 percent.1/ Monoculture area includes 9 million acres of corn, 8 million acres of cotton,and 14 million acres of wheat.
7
51
6
50 7
3
1727
5109
23
612
3
4
*13
6
492
86
60
29
60
41
61
77
92
7587 52 37
384990

56 ❖ Production Practices for Major Crops in U.S. Agriculture, 1990-97 Economic Research Service/USDA
Crop Rotation Benefits
Rotating crops can provide several kinds of economic and environmental benefits [NRC, 1989; Brust and Stinner,1991; and Heichel, 1987]. Crop rotations are used to increase soil productivity and reduce the need for commercialfertilizers. Legume crops, especially small-seed legumes such as alfalfa, sweet clover, or lespedeza can supply largequantities of nitrogen to the soil over time and significantly reduce commercial nitrogen fertilizer needs for cropsthat follow [Power, 1987]. Soybeans, dry beans, and other large-seed legume crops provide most of their own nitro-gen needs and also reduce commercial fertilizer needs for following crops. In regions with longer growing seasons,winter legume crops are also used to supply nitrogen and other soil nutrients for following crops. The organic mattersupplied by previous crops, especially the roots of legumes and sod, supports soil micro-organisms that add othercrop nutrients to the soil.
Crop rotation influences the length of time and the degree to which soils are exposed to the erosive forces of windand water, critical factors affecting soil erosion rates on cropland [USDA, SEA, 1978]. Land planted to corn, soy-beans, cotton, and other row crops is more prone to erosion than that planted to small grains, hay or meadow crops,because it lacks vegetative cover, especially during critical erosion periods. Crop rotations that include small grains,hay, or other closely grown crops quickly establish a vegetative cover and root structure that helps protect soils fromerosion. When closely grown crops are grown in rotation with row crops, the average erosion rate of the full rotationsequence is reduced. Closely grown crops also provide crop residues that, depending on the residue managementsystem, can help reduce the erosion rate of the following crop. Some soil conservation plans for highly erodible landuse conservation crops in rotation with row crops to meet compliance erosion rates.
In semi-arid or other regions where soil moisture is a limiting production factor, rotations are commonly used toconserve soil moisture [Cook, 1986; NRC, 1989]. The practice of fallow is leaving land idle 1 year to accumulateadditional moisture for the following crop. Soil management practices designed to increase rainfall infiltration,decrease transpiration, and decrease evaporation of accumulated soil moisture are used. Fallow is most common inwheat production areas in the Plains, Mountain States, and Northwest, but may also be used in other areas havinglow precipitation or soils with low water-holding capacity. Besides fallow, other crops in a rotation affect soil mois-ture. Deep-rooted forage crops, such as alfalfa, are often not grown prior to wheat or other crops highly dependenton topsoil moisture. Crops that are harvested early in the summer, such as winter wheat, oats, or rye, allow moresoil moisture accumulation after harvest to benefit the following crop.
Crop rotations are effective in controlling many kinds of pests and can reduce the need for intervention with pesti-cides [NRC, 1989]. Rotations affect pest infestation in many different ways. Perennial grasses and legumes oftenprovide good weed control because they compete with many weed species and when pastured or cut for forage theannual weeds are unable to produce seeds to infest future crops. Fallow tends to encourage weed germination duringthe idle year when there are many chemical and nonchemical options for their control. Weed infestations arereduced when fall-planted crops such as winter wheat or rye develop a vegetative cover before the spring germina-tion of many weed species. Insect and disease pests, such as corn rootworm, often require the host crop to survivedormant periods. By planting alternate crops, many producers can eliminate or significantly reduce pesticide treat-ments for corn rootworm. Crop rotation can also be a critical component in reducing species resistant to a pesticide.Planting different crops usually allows the use of pesticides with different control mechanisms, helping to preventthe buildup of resistant pest populations.
Crop rotations that increase the diversity of commodities produced on a farm may reduce the peak labor require-ments or income risk. Peak planting and harvesting dates usually differ between crops. A more even distribution offieldwork through the year gives operators an opportunity to make more efficient use of the available fixed laborsupply. Because adverse weather or low product prices usually do not affect all commodities equally, the morediverse outputs from crop rotation help to stabilize and reduce the risk of low income in years with abnormal weather or low market prices for one or more major products.

Corn-Soybean RotationAlternating corn and soybeans is the most common croprotation and can provide several kinds of environmental andcost-saving benefits (fig. 4C). The corn-soybean rotationaccounts for most of the acreage planted to both of thesecrops in the Corn Belt region. Although the practice is usedoutside the Corn Belt, other crops are often planted witheither corn or soybeans in the other regions. Small grainsare commonly grown with corn in areas north and west ofthe Corn Belt, and cotton, sorghum, or other crops aregrown with soybeans in the southern production regions. InIllinois and Iowa, the two largest corn-producing States, thecorn-soybean rotation accounted for 72 percent and 84 per-cent, respectively, of the total corn and soybean acreage inthese States.
Fallow-Wheat RotationThe fallow-wheat rotation is primarily used to conserve soilmoisture over a 2-year period for 1 year of production (fig.4D). The rotation was widely used in the Northwest wheat-growing region and certain parts of the Northern PlainsStates. In regions with higher annual rainfall and regionswhere low soil moisture is not a normal production con-straint, the wheat-fallow rotation was less common.
Economic Research Service/USDA Production Practices for Major Crops in U.S. Agriculture, 1990-97 ❖ 57
Figure 4C
Corn-soybean rotation, 1997 1/
Monoculture and other rotations,
Annually alternating corn and soybeans,
Percent of total area planted to corn andsoybeans in a corn-soybean rotation
1/ Represents 128 million acres of corn and soybeans planted in 1997.Source: USDA, NASS and ERS, 1996c.
(60 million acres, 47%)
(69 million acres, 53%)
47
35
18
69
84
31
1
65
1512
29
7072 40
2231
36
Figure 4D
Fallow-wheat rotation, 1997 1/
Fallow-wheat rotation,
Wheat in monoculture and other rotations,
Percent of total wheat area in a fallow-wheat rotation
* Less than 1 percent.1/ Represents 56 million acres of winter, durum, and other spring wheat.
Source: USDA, NASS and ERS, 1996c.
(43 million acres, 78%)
(12 million acres, 22%)
48
7556
6
74 18
5
*
*
* *38
21
125

Row Crops and Small Grains in RotationSmall grains grown in rotation with row crops offer impor-tant environmental and conservation benefits over continu-ous row crops (including row crops grown with a monocul-ture system) (fig. 4E). Small grains help reduce averageannual soil loss and are also helpful in controlling weedsand reducing herbicide needs. Crop rotations that included acombination of small grains and row crops contained manydifferent specific crop sequences. Some of the more com-mon sequences reported in the surveys were corn-wheat-corn, corn-wheat-soybeans, soybeans-rice, corn-oats-corn,potatoes-wheat-potatoes. Growing small grains and rowcrops in rotation with each other was most common in theNorthern Plains. Some crop rotation was used for nearly allpotatoes, and the crop in rotation with potatoes was mostoften a small grain.
Rotations with Hay or Pasture CropsAlthough not widely used, hay and pasture crops in rotationwith row crops or small grains can provide many environ-mental benefits (fig. 4F). Most hay and pasture crops areperennials and have year-round vegetative cover, which pro-vides protection against soil erosion.
Rotations with hay or pasture crops were most common inWisconsin, California, and Pennsylvania—States with manylivestock operations, especially dairy. Without livestockoperations or local markets for forages, meadow crops oftenhave a high opportunity cost. The cost for special machin-ery, labor, transportation, and storage of hay crops can sig-nificantly reduce the advantages of including them in rota-tion with major field crops.
58 ❖ Production Practices for Major Crops in U.S. Agriculture, 1990-97 Economic Research Service/USDA
Figure 4E
Row crops and small grains in rotation, 1997 1/
Monoculture and other rotations,(179 million acres, 90%)
Row crop-small grains,(20 million acres, 10%)
Percent of major field crop area where both row cropsand small grains are in rotation
* Less than 1 percent.1/ Represents 198 million acres of corn, cotton, potatoes, and wheat. The rotation includes any combination of row crops and small grains planted between 1995 and 1997. Double-cropped soybeans or small grains planted as wintercover crops are not included.
Source: USDA, NASS and ERS, 1996c.
4
11
14
43
22
15
13
5 31
810 7
*
16
5
24
5*
**
*1
13291
10*
30
Figure 4F
Rotations with hay or pasture crops, 1997 1/
Monoculture or other rotations,(192 million acres, 97%)
Meadow or pasturein rotation,
(6 million acres, 3%)
Percent of major field crop area where hay or pasture was a previous crop
* Less than 1 percent.1/ Represents 198 million acres of corn, cotton, potatoes, and wheat. The rotation includes only acreage where alfalfa, other hay, or pasture was grown ineither of the two preceding years. Areas in hay or pasture in 1997 are excluded.
Source: USDA, NASS and ERS, 1996c.
1
1
1
22
222
2 2
2
5
53
3
15
44
310
** **
*
10
2
31

Double-Cropped Winter Wheat-SoybeansIn regions with longer growing seasons and sufficient rain-fall, soybeans can be planted immediately after winter wheator barley and allow the production and economic returns fortwo crops in one growing season (fig. 4G). Where feasibleto use, this rotation also offers some environmental benefits.The winter wheat or rye provides the nutrient and soil ero-sion benefits of a cover crop as well as providing cropresidue to reduce soil erosion during the soybean productionperiod. The total annual applications of fertilizer and pesti-cide ingredients for both crops, however, are usually higherthan for a single crop.
Economic Research Service/USDA Production Practices for Major Crops in U.S. Agriculture, 1990-97 ❖ 59
Figure 4G
Double-cropped winter wheat-soybeans, 1997 1/
Monoculture and other soybean rotations,61 million acres, 93%
Double-cropped soybeans,5 million acres, 7%
Share of double-cropped soybean area
* Less than 1 percent.1/ Represents 67 million acres of soybeans planted in 1997. It does not includewinter wheat harvested in 1997 when soybeans were planted in the springof 1996.Source: USDA, NASS and ERS, 1996c.
4242
716
23
13 12
17
3 7 *
*
*
*
34

Average Annual Nitrogen Use with AlternativeCrop RotationsCrop rotations affect the amount of nutrients and pesticidesapplied to crops in two different ways—one is the offset-ting effects of crops with different nutrient needs and pestproblems and the other is the effect one crop has on a fol-lowing crop (fig. 4H). The survey data were used to con-struct average annual estimates of nitrogen use to illustrate
differences in input levels for several commonly used croprotations. Estimates of usage rates for individual crops arealso reported to illustrate the effect that one crop has onanother when grown in a crop rotation. In a corn-soybeanrotation, the average annual nitrogen application rate was68 pounds compared with 134 pounds for corn in a mono-culture system.
60 ❖ Production Practices for Major Crops in U.S. Agriculture, 1990-97 Economic Research Service/USDA
Average annual nitrogen use with alternative crop rotations, 1995Figure 4H
Area in rotation
(wheat/soybeans)67.9
180.2
229.3
84.5
Annual nitrogen application rate
Source: USDA, ERS and NASS, 1995c.
Continuous soybeans
Fallow-wheat
Corn-soybeans-soybeans
Continuous wheat
Rice-soybeans
Corn-soybeans
Sorghum-cotton
Corn-soybeans-wheat
Double-cropped
Continuous cotton
Corn-corn-soybeans
Corn-cotton
Continuous corn
70 60 50 40 30 20 10 0
13.6
4.3
1.2
3.9
1.1
7.9
4.2
0.7
59.8
17.8
5.7
10.7
5.1
0 20 40 60 80 100 120 140 160
134
95
93
79
77
73
73
68
64
55
49
18
6
Million acres Pounds per acre per year

Crop Area with Winter Cover CropsCover crops can be used to protect soil and water resourcesand improve soil productivity (fig. 4I). However, unless aharvestable grain or forage is produced, they may offer littleeconomic gain to producers. The previous crop informationfrom USDA’s Agricultural Resource Management Studyprovides an estimate of the use of winter cover crops. Theuse of cover crops with corn, cotton, and soybeans wassmall compared with the total crop acreage, and its use var-
ied widely between the crops and production regions. Themost prominent use of cover crops was with soybeans inSouthern States. The cover crop was usually winter wheat orrye and was usually harvested (double-cropping). Covercrops are less common with corn and cotton, partiallybecause they have longer growing seasons and there is lessopportunity for the cover crop to mature and be harvested.Because winter wheat is planted in the fall, the total acreageprovides cover crop benefits, even when a crop is not plant-ed in the following spring or summer.
Economic Research Service/USDA Production Practices for Major Crops in U.S. Agriculture, 1990-97 ❖ 61
0 2 4 6 8 10Million acres
Corn Cotton
Soybeans
Percent of crop area with a cover crop planted
* Less than 1 percent or none reported.1/ The first value at the end of the bar is the number of acres with a preceding winter cover crop, and the second value is the percentageof crop area with a winter cover crop.
Source: USDA, NASS and ERS, 1996c.
8.0, 5%
0.9, 7%
0.8, 1%
0.1, 8%
Crop area with winter cover crop, 1997 1/
Soybeans
Cotton
Corn
Potatoes
Figure 4I
2
*
*
1
1 12*
*
9
7
4
4
6 3
*
2* 20 11
81438
**
** *
13 12
23
716
4335
3 7
175
43
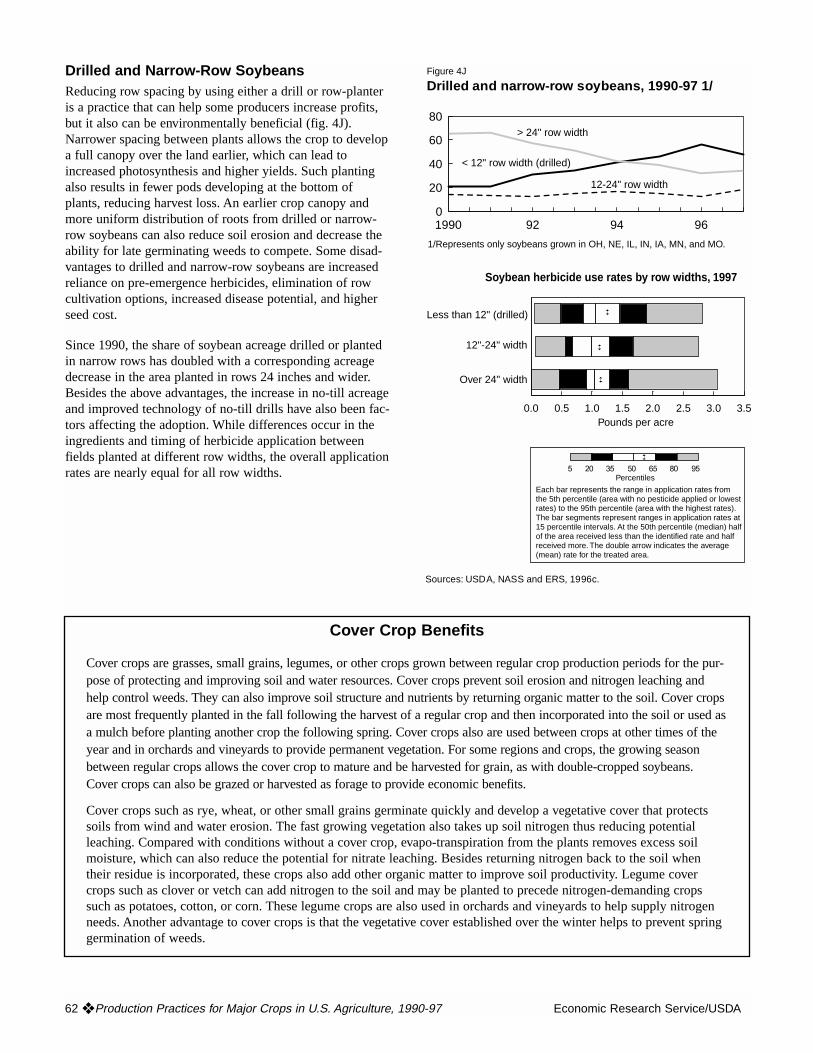
Drilled and Narrow-Row SoybeansReducing row spacing by using either a drill or row-planteris a practice that can help some producers increase profits,but it also can be environmentally beneficial (fig. 4J).Narrower spacing between plants allows the crop to developa full canopy over the land earlier, which can lead toincreased photosynthesis and higher yields. Such plantingalso results in fewer pods developing at the bottom ofplants, reducing harvest loss. An earlier crop canopy andmore uniform distribution of roots from drilled or narrow-row soybeans can also reduce soil erosion and decrease theability for late germinating weeds to compete. Some disad-vantages to drilled and narrow-row soybeans are increasedreliance on pre-emergence herbicides, elimination of rowcultivation options, increased disease potential, and higherseed cost.
Since 1990, the share of soybean acreage drilled or plantedin narrow rows has doubled with a corresponding acreagedecrease in the area planted in rows 24 inches and wider.Besides the above advantages, the increase in no-till acreageand improved technology of no-till drills have also been fac-tors affecting the adoption. While differences occur in theingredients and timing of herbicide application betweenfields planted at different row widths, the overall applicationrates are nearly equal for all row widths.
62 ❖ Production Practices for Major Crops in U.S. Agriculture, 1990-97 Economic Research Service/USDA
0.0 0.5 1.0 1.5 2.0 2.5 3.0 3.5
Less than 12" (drilled)
12"-24" width
Over 24" width
1990 92 94 960
20
40
60
80
Drilled and narrow-row soybeans, 1990-97 1/
1/Represents only soybeans grown in OH, NE, IL, IN, IA, MN, and MO.
> 24" row width
< 12" row width (drilled)
12-24" row width
Soybean herbicide use rates by row widths, 1997
Pounds per acre
Sources: USDA, NASS and ERS, 1996c.
Figure 4J
Each bar represents the range in application rates from the 5th percentile (area with no pesticide applied or lowest rates) to the 95th percentile (area with the highest rates). The bar segments represent ranges in application rates at 15 percentile intervals. At the 50th percentile (median) half of the area received less than the identified rate and half received more. The double arrow indicates the average (mean) rate for the treated area.
Percentiles
Cover Crop Benefits
Cover crops are grasses, small grains, legumes, or other crops grown between regular crop production periods for the pur-pose of protecting and improving soil and water resources. Cover crops prevent soil erosion and nitrogen leaching andhelp control weeds. They can also improve soil structure and nutrients by returning organic matter to the soil. Cover cropsare most frequently planted in the fall following the harvest of a regular crop and then incorporated into the soil or used asa mulch before planting another crop the following spring. Cover crops also are used between crops at other times of theyear and in orchards and vineyards to provide permanent vegetation. For some regions and crops, the growing seasonbetween regular crops allows the cover crop to mature and be harvested for grain, as with double-cropped soybeans.Cover crops can also be grazed or harvested as forage to provide economic benefits.
Cover crops such as rye, wheat, or other small grains germinate quickly and develop a vegetative cover that protectssoils from wind and water erosion. The fast growing vegetation also takes up soil nitrogen thus reducing potentialleaching. Compared with conditions without a cover crop, evapo-transpiration from the plants removes excess soilmoisture, which can also reduce the potential for nitrate leaching. Besides returning nitrogen back to the soil whentheir residue is incorporated, these crops also add other organic matter to improve soil productivity. Legume covercrops such as clover or vetch can add nitrogen to the soil and may be planted to precede nitrogen-demanding cropssuch as potatoes, cotton, or corn. These legume crops are also used in orchards and vineyards to help supply nitrogenneeds. Another advantage to cover crops is that the vegetative cover established over the winter helps to prevent springgermination of weeds.

Organic Production PracticesOrganic production practices were implemented on 0.2 per-cent of the 435 million acres of U.S. cropland and on over 1percent of U.S. fruit and vegetable acreage in 1994, accord-ing to USDA’s Agricultural Marketing Service (AMS)[Dunn, 1995] (figs. 4K1, 4K2, and 4K3). Fifty-nine percentof all organic acreage was devoted to cropland (669,000acres). The majority of organic acres was for food crops,and fruits and vegetables represented 6 and 7 percent of theacreage, respectively. Other food crops included grain, drybeans, coffee, and other produce such as nuts, mushrooms,aloe vera, and herbs. The number of certified organic farm-ers grew by over 70 percent between 1991 and 1995 toapproximately 5,000, according to USDA and private-sectorreports [Fernandez-Cornejo, 1998].
Though organic acreage is small, there is interest in organicproduction practices as an alternative technology to reducechemical use and to maintain soil productivity. There is nonational standard for certifying that a product is “organic,”although USDA is in the process of developing uniformstandards for all organic production. These standards willprovide a national definition of “organic” that will betterinform customers about organic products and may encour-age organic production. Over 43 States have private and/orState organic certification programs that handle organic cer-tification of production, but the standards differ betweenStates. According to AMS, 73 percent of these organizationshandle fruit and vegetable production.
USDA’s Vegetable and Fruit Chemical Usage Surveysincluded questions about organic production and practices.In general, questions covered pest and nutrient management,operator characteristics, bearing or planted and harvestedacreage, and other characteristics.
The sample of organic vegetable growers in 1994 (close toone-fifth of all certified organic growers of vegetables)showed that most of the growers used crop rotation andresistant varieties for disease and insect control [Fernandez-Cornejo, 1998]. Fruit growers were sampled in 1995 (15percent of all certified organic fruit growers), and the analy-sis showed that most growers scouted their fields and usedmechanical tillage for weed control. These growers alsooften planted legume crops and applied manure to providenutrients to their cropland.
Economic Research Service/USDA Production Practices for Major Crops in U.S. Agriculture, 1990-97 ❖ 63
Sources: Dunn, 1995.
Figure 4K1
Certified organic acreage, 1994 1/
Acres where certified organic practices
were used,669,000 acres, 0.2%
Other U.S. cropland,435 million acres, 99.8%
Food grains
Feed grains
Fallow
Vegetables
Fruits
Cotton
Other
0 50 100 150 200 250 300 350
Crop acreage using certified organic production practices
294.1
174.5
91.1
47.8
39.2
17.5
.5
1/ Reflects private and State organic certification programs. Cropland totalincludes cropland harvested, pastured, idle, and other.2/ Includes food grains, dry beans, coffee, and other produce such as nuts, mushrooms, aloe vera, and herbs.
Thousand acres
& other crops 2/

64 ❖ Production Practices for Major Crops in U.S. Agriculture, 1990-97 Economic Research Service/USDA
General practices:
Beneficial organisms
Legume crops
Manure
Compost
Disease control practices:
Beneficial organisms
Mulch
Crop rotation
Biological testing
Resistant varieties
Water management
Adjustment of planting date
Insect control practices:
Beneficial organisms
Mulch
Crop rotation
Biological testing
Resistant varieties
Water management
Adjustment of planting date
Weed control practices:
Beneficial organisms
Mulch
Crop rotation
Resistant varieties
Water management
0 20 40 60 80 100Percent answering
affirmatively
43
44
62
82
35
18
54
33
62
16
78
54
5
44
44
75
17
38
26
78
61
58
77
Figure 4K2
Pest management practices used by organicfarmers to produce vegetables, 1994
86
Sources: USDA, NASS and ERS, 1994
Adjustment of planting date
Fallow Fruit Cotton Other0
10
20
30
40
50
60
Feed grains
Vege-tables
44
26
14
7 62.6
0.4
Source: Dunn, 1995.
1/ Crop area is reported as a percentage of the total organic croplandacres (668,690).2/ Other food crops include grains, dry beans, coffee, and other producesuch as nuts, mushrooms, aloe vera, and herbs.
Figure 4K3
Proportion of organic cropland, by crop, 1994 1/
Other foodcrops 2/
Percent

Crop residue management (CRM), a cultural practice thatinvolves fewer and/or less intensive tillage operations
and preserves more residue from the previous crop, isdesigned to help protect soil and water resources and pro-vide additional environmental benefits. CRM is generallycost effective in meeting conservation requirements andreducing fuel, machinery, and labor costs while maintainingor increasing crop yields. However, improved managerialskills are often needed to capture the full economic benefitsof CRM. [See box, “Benefits from Crop ResidueManagement” on next page.]
Crop residue management practices include reduced tillageor conservation tillage, such as no-till, ridge-till, and mulch-till, as well as the use of cover crops and other conservationpractices that provide sufficient residue cover to significant-ly reduce the erosive effects of wind and water. These prac-tices can benefit society through an improved environmentand can benefit farmers through enhanced farm economicreturns. However, adoption of CRM may not lead to clearenvironmental benefits in all regions and, similarly, may notbe economically profitable on all farms.
With fewer trips over the fields, equipment lasts longerand/or can cover more acres. In either case, machinery own-
ership costs per acre are reduced (Monson and Wollenhaupt,1995). In addition, the size and number of machinesrequired decline as the intensity of tillage or the number ofoperations is reduced. This can result in significant savingsin operation and maintenance costs. Fewer trips alone cansave an estimated $5 per acre on machinery wear and main-tenance costs (CTIC, 1996). While new or retrofittedmachinery may be required to adopt conservation tillagepractices, machinery costs usually decline in the long runbecause a smaller complement of machinery is needed forhigh-residue no-till systems. Conservation tillage equipmentdesigns have improved over the last decade and theseimprovements enhance the opportunity for successful con-version to a CRM system. Farm equipment manufacturersare now producing a wide range of conservation tillageequipment suitable for use under a variety of field condi-tions (Sandretto and Bull, 1996).
Reducing the intensity or number of tillage operations alsoresults in lower fuel and maintenance costs. Fuel costs, likelabor costs, can drop nearly 60 percent per acre by someestimates (Monson and Wollenhaupt, 1995; Weersink andothers, 1992). If fuel prices increase, conservation tillagepractices become relatively more profitable.
Economic Research Service/USDA Production Practices for Major Crops in U.S. Agriculture, 1990-97 ❖ 65
Chapter V
Crop Residue Management Practices

66 ❖ Production Practices for Major Crops in U.S. Agriculture, 1990-97 Economic Research Service/USDA
Benefits from Crop Residue Management
Crop residue management practices, when appropriately applied, have been shown to provide the following soil, water quali-ty, and economic benefits:
Soil Benefits: Tillage practices that leave substantial amounts of crop residue evenly distributed over the soil surface provideseveral soil benefits that increase crop yields. These practices reduce soil erosion, increase soil organic matter, improve soiltilth, increase soil moisture, and minimize soil compaction. These changes can maintain or increase the productivity of manysoils, especially those that are fragile and subject to damage from soil erosion or compaction (CTIC, 1996).
Water Quality and Environmental Benefits: CRM practices keep more nutrients and pesticides in the soil where they canbe used by crops and help to prevent their movement into surface or ground water. Surface residues intercept nutrients andchemicals and hold them in place until they are used by the crop or degrade into harmless components (Dick and Daniel,1987; Helling, 1987; Wagenet, 1987). In addition, the filtering action of increased organic matter in the top layer of soilresults in cleaner runoff by reducing contaminants such as sediment and adsorbed or dissolved chemicals (Onstad andVoorhees, 1987; CTIC, 1996). Studies under field conditions indicate that the quantity of water runoff from no-till fields var-ied depending on the frequency and intensity of rainfall events. However, runoff from no-till and mulch-till fields averagedabout 30 and 40 percent, respectively, of the amounts from moldboard-plowed fields (Baker and Johnson, 1979; Glenn andAngle, 1987; Hall and others, 1984; Sander and others, 1989). Herbicide contaminants in the runoff were similarly reducedby no-till and mulch-till systems (Fawcett and others, 1994; Fawcett, 1987).
Intensive tillage contributes to the conversion of soil carbon to carbon dioxide, which, in the atmosphere, can combine withother gases to affect global warming. Increased crop residue and reduced tillage enhance the level of naturally occurring car-bon in the soil and contribute to lower carbon dioxide emissions. In addition, CRM involves fewer trips across the field andless horsepower, reducing fossil fuel emissions. Crop residues reduce wind erosion and the generation of dust-caused airpollution (CTIC, 1996).
Farm Economic Benefits: Higher economic returns with CRM result primarily from some combination of increased or sta-ble crop yields and an overall reduction in input costs. The changes in both input costs and yields depend heavily on charac-teristics of the resource base and management (Clark and others, 1994). Yield response with soil-conserving tillage systemsvaries with location, site-specific soil characteristics, local climate, cropping patterns, and level of management skills. Theeffects of increased organic matter, improved moisture retention and permeability, and reduced nutrient losses from erosionhave beneficial impacts on crop yields. In general, long-term field trials on well-drained to moderately well-drained soils oron sloping land show slightly higher no-till yields, particularly with crop rotations, compared with conventional tillage(Hudson and Bradley, 1995; CTIC, 1996).
Choice of tillage system affects machinery, chemical, fuel, and labor costs. Decreasing the intensity of tillage or reducing thenumber of operations generally reduces machinery, fuel, and labor costs. These cost savings may be offset somewhat bypotential increases in chemical costs depending on the herbicides selected for weed control and the fertilizers required toattain optimal yields (Siemens and Doster, 1992). The cost of pesticides with alternative tillage systems is not simply relatedto the total quantity used. Alternative pesticides (active ingredients) and/or different quantities of the same or similar pesti-cides are often used with different tillage systems. Newer pesticides are often used at a much lower rate but are quite oftenmore expensive. This complicates the prediction of cost relationships between tillage systems. When one compares tillagesystems, the cost calculation must be based on the specific quantity and price of each pesticide used.
The reduction in labor requirements per acre for higher residue tillage systems can be significant and can result in immedi-ate cost savings. Less hired labor results in direct savings, while less operator or family labor leaves more time to generateadditional income by expanding farm operations or working at off-farm jobs. However, the benefits from tillage systems thatreduce labor and time requirements may be greater than perceived from just the cost savings per acre. Consideration must begiven to the opportunity cost of the labor and time saved. Farmers who spend less time in the field have more time for otheraspects of the farm business, such as financial management, improved marketing, or other activities to improve farm prof-itability (Sandretto and Bull, 1996).
Economic Research Service/USDA Production Practices for Major Crops in U.S. Agriculture, 1990-97 ❖ 67
Crop Residue Management in the UnitedStates, 1997Conservation tillage (no-till, ridge-till, and mulch-till), themajor form of CRM, was used on almost 110 million acresin 1997, over 37 percent of U.S. planted cropland area (fig.5A). [See box, “Crop Residue Management and TillageDefinitions,” p. 72.] Most of the growth in conservationtillage since 1990 has come from expanded adoption of no-till, which can leave as much as 70 percent of the soil sur-face covered with crop residues. Use of no-till practicesincreased as farmers implemented conservation complianceplans during 1990-95 as required under the Food SecurityAct and subsequent farm legislation.
U.S. crop area planted with no-till expanded 2½ times toover 46 million acres between 1990 and 1997, while thearea planted with clean tillage systems (less than 15 percentresidue cover) declined by about one-fourth. Since 1990, no-till’s share of conservation tillage acreage has increased,while the share with mulch-till and ridge-till has remainedfairly stable.
Figure 5A
Crop residue management in the United States,1997
Mulch-till,60.0 million acres, 20.4%
Reduced-till,77.3 million
acres, 26.2%
Conventional-till,107.6 million acres, 36.5%
No-till,46.0 million acres,
15.6%
Trend in crop residue management use, 1990-97
Represents 294.7 million acres planted to crops in 1997.
1990 91 92 93 94 95 96 970
50
100
150
200
250
300
350
No-till
Ridge-till
Mulch-till
Reduced-till
Conventional-till
Source: USDA, ERS, based on Conservation Technology Information Center data.
Acres planted (million)
Ridge-till,3.8 million
acres, 1.3%

68 ❖ Production Practices for Major Crops in U.S. Agriculture, 1990-97 Economic Research Service/USDA
Crop Residue Levels on Planted Acreage byRegions, 1997The Corn Belt and Northern Plains, with 51 percent of theNation’s planted cropland, account for three-fifths of totalconservation tillage acres (map A and fig. 5B). Theseregions, plus the Lake States, Mountain Region, andSouthern Plains, have substantial acreage with 15-30 percentresidue cover which, with improved crop residue manage-
ment, has the potential to qualify for conservation tillagestatus (which requires 30 percent or more surface residuecover). Over half of the planted crop acreage in many coun-ties in major agricultural regions used conservation tillagepractices. The adoption of the practice is particularly high(exceeding 70 percent of the cropland) in the more erodiblecounties in Kentucky, Tennessee, Missouri, Iowa, andNebraska.
Figure 5B
Crop residue levels on planted acreage by region, 1997 1/
Source: USDA, ERS based on Conservation Technology Information Center data.
Pacific7
33
Mountain
97
6
Northern Plains29
23
20
Southern Plains
9
14
7
Corn Belt16
23
39
Delta
9
43
Lake States
8
14
11
Northeast
43
1
10
Appalachian
7
1
6
Southeast
22
6
Greater than 30% residue (conservation tillage)
15-30% residue (reduced tillage)
Less than 15% residue (conventional tillage)
1/ The value at the top of the bar is million acres with the crop residue characteristics.

Economic Research Service/USDA Production Practices for Major Crops in U.S. Agriculture, 1990-97 ❖ 69
Map A. Adoption of conservation tillage practices, 1995
Percent of planted acresin conservation tillage
0-15
15-30
30-50
50-70
>70
Source: USDA, ERS based on Conservation Technology Information Center data.
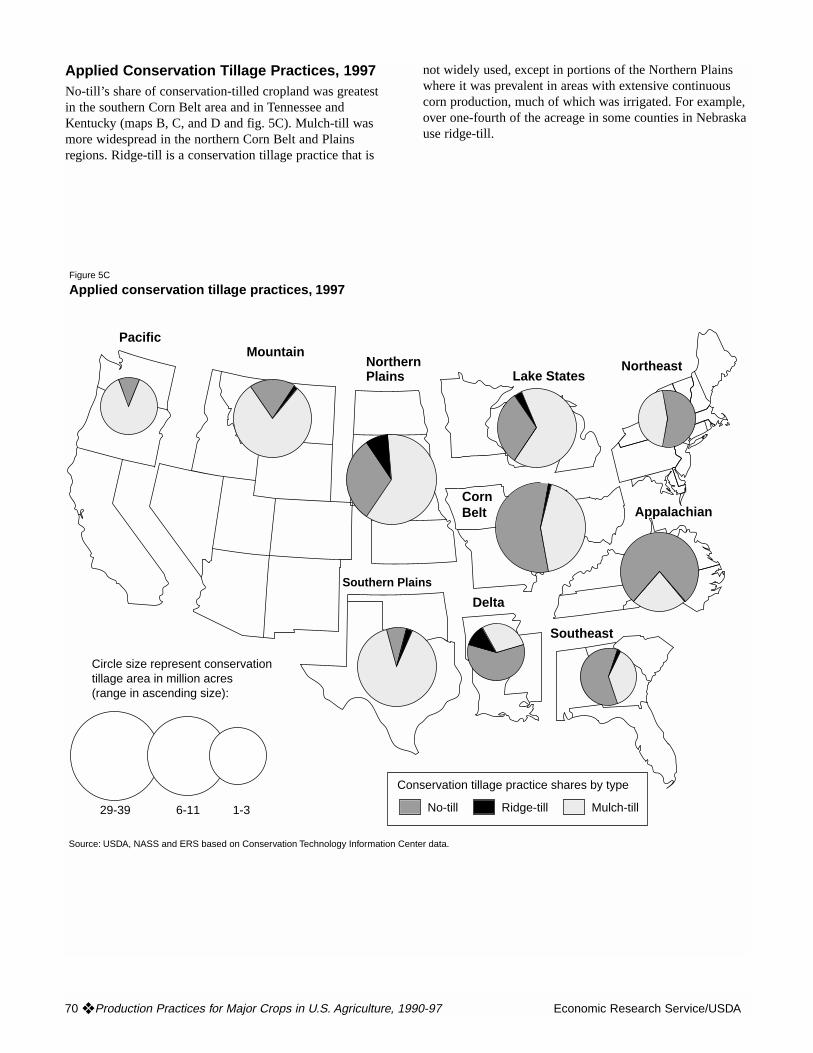
Applied Conservation Tillage Practices, 1997No-till’s share of conservation-tilled cropland was greatestin the southern Corn Belt area and in Tennessee andKentucky (maps B, C, and D and fig. 5C). Mulch-till wasmore widespread in the northern Corn Belt and Plainsregions. Ridge-till is a conservation tillage practice that is
not widely used, except in portions of the Northern Plainswhere it was prevalent in areas with extensive continuouscorn production, much of which was irrigated. For example,over one-fourth of the acreage in some counties in Nebraskause ridge-till.
70 ❖ Production Practices for Major Crops in U.S. Agriculture, 1990-97 Economic Research Service/USDA
Figure 5C
Applied conservation tillage practices, 1997
Source: USDA, NASS and ERS based on Conservation Technology Information Center data.
PacificMountain
Southern Plains
Lake States
Delta
Southeast
Appalachian
Northeast
Corn Belt
No-till Ridge-till Mulch-till
NorthernPlains
Conservation tillage practice shares by type
Circle size represent conservation tillage area in million acres (range in ascending size):
29-39 6-11 1-3

Economic Research Service/USDA Production Practices for Major Crops in U.S. Agriculture, 1990-97 ❖ 71
Map D. Use of ridge-till, 1995
Percent of planted acresin ridge-till
0 - 2%3 - 5%6 - 12%13 - 26%> 26%
Percent of planted acresin mulch-till
0 - 10%10 -20%20 - 40%40 - 60%> 60%
Map C. Use of mulch-till, 1995
Map B. Use of no-till, 1995
Percent of planted acresin no-till
0 - 10%10 -20%20 - 35%35 - 55%> 55%
Source: USDA, ERS based on Conservation Technology Information Center data.

72 ❖ Production Practices for Major Crops in U.S. Agriculture, 1990-97 Economic Research Service/USDA
Crop Residue Management and Tillage Definitions
Crop Residue Management (CRM) is a year-round conservation system that usually involves a reduction in the number ofpasses over the field with tillage implements and/or in the intensity of tillage operations, including the elimination of plow-ing (inversion of the surface layer of soil). CRM begins with the selection of crops that produce sufficient quantities ofresidue to reduce wind and water erosion and may include the use of cover crops after low residue-producing crops. CRMincludes all field operations that affect residue amounts, orientation, and distribution throughout the period requiring protec-tion. Site specific residue cover amounts needed are usually expressed in percentage but may also be in pounds. Tillage sys-tems included under CRM are conservation tillage (no-till, ridge-till, and mulch-till) and reduced tillage.
Conservation tillage describes any tillage and planting system that covers 30 percent or more of the soil surface with cropresidue after planting, to reduce soil erosion by water. Where soil erosion by wind is the primary concern, conservationtillage is any system that maintains at least 1,000 pounds per acre of flat, small-grain residue equivalent on the surfacethroughout the critical wind erosion period. Two key factors influencing crop residue are (1) the type of crop, which estab-lishes the initial residue amount and its fragility, and (2) the type of tillage operations prior to and including planting.
Conservation Tillage Systems include:No-till—The soil is left undisturbed from harvest to planting except for nutrient injection. Planting or drilling is accom-plished in a narrow seedbed or slot created by coulters, row cleaners, disk openers, in-row chisels, or roto-tillers. Weedcontrol is accomplished primarily with herbicides. Cultivation may be used for emergency weed control.
Ridge-till—The soil is left undisturbed from harvest to planting except for nutrient injection. Planting is completed in aseedbed prepared on ridges with sweeps, disk openers, coulters, or row cleaners. Residue is left on the surface betweenridges. Weed control is accomplished with herbicides and/or cultivation. Ridges are rebuilt during cultivation.
Mulch-till—The soil is disturbed prior to planting. Tillage tools such as chisels, field cultivators, disks, sweeps, or bladesare used. Weed control is accomplished with herbicides and/or cultivation.
Reduced tillage (15-30% residue)—Tillage types that leave 15-30 percent residue cover after planting, or 500-1,000pounds per acre of small grain residue equivalent throughout the critical wind erosion period. Weed control is accomplishedwith herbicides and/or cultivation.
Conventional tillage (less than 15% residue)—Tillage types that leave less than 15 percent residue cover after planting, orless than 500 pounds per acre of small grain residue equivalent throughout the critical wind erosion period. Generallyincludes plowing or other intensive tillage. Weed control is accomplished with herbicides and/or cultivation.
Conventional tillage systems (as defined in the Cropping Practices Survey):
Conventional tillage with moldboard plow—Any tillage system that includes the use of a moldboard plow.
Conventional tillage without moldboard plow—Any tillage system that has less than 30 percent remaining residue coverand does not use a moldboard plow.
Sources: Bull, 1993, and Conservation Tillage Information Center, 1996.
Conventional tillage Reduced tillage Conservation tillage
Mulch-till Ridge-till No-tillMoldboard plow or intensive No use of moldboard Further decrease Only ridges are No tillage performedtillage used plow and intensity in tillage (see below) tilled (see below) (see below)
of tillage reduced< 15% residue cover remaining 15-30% residue - - - - - 30% or greater residue cover remaining - - -
cover remaining

Trends in Conservation Tillage Use, 1990-97Conservation tillage was used mainly on corn, soybeans,and small grains in 1997. More than 47 percent of the totalacreage planted to corn and soybeans was conservation-tilled (fig. 5D). Expanded use of no-till has been greater forcorn and soybeans than for small grains or cotton. Fieldsplanted to row crops tend to be more susceptible to erosionbecause these crops provide less vegetative cover, especiallyearlier in the growing season. On double-cropped fields,conservation tillage was used on more than two-thirds ofsoybean acreage, slightly less than half of corn acreage, andabout one-third of sorghum acreage. The use of no-till withdouble-cropping facilitates getting the second crop plantedquickly and limits potential moisture losses from the germi-nation zone in the seedbed, allowing greater flexibility incropping sequence or rotation.
Economic Research Service/USDA Production Practices for Major Crops in U.S. Agriculture, 1990-97 ❖ 73
1990
1991
1992
1993
1994
1995
1996
1997
0 20 40 60 80 100 120
No-till Ridge-till Mulch-till
Million acres
Figure 5D
Trends in conservation tillage use, 1990-97
Total cropland
Major field cropsCorn:1990
91929394959697
Soybeans:1990
91929394959697
Small grain:1990
91929394959697
Cotton:1990
91929394959697
0 10 20 30 40
No-till
Ridge-till
Mulch-till
Million acres
Source: USDA, ERS, based on Conservation Technology Information Center data.

Pesticide Use by Tillage System, 1997Pesticide use on major crops differs between tillage systems,but it is difficult to distinguish the effects related to tillagesystems from differences in pest populations between areasand from one year to the next, and from use of other pestcontrol practices (fig. 5E). Factors other than tillage thataffect pest populations may have greater impact on pesticideuse than type of tillage. The 1997 Agricultural ResourceManagement Study data for major field crops (USDA,NASS and ERS, 1996c) also illustrate that differencesamong tillage systems tend to be more in the combinationsof active ingredients applied rather than in the overall pro-portion of acres treated, the number of pesticide applicationsper acre treated, or the amount applied per treated acre.
Nearly all corn and soybean acres under all tillage systemswere treated with herbicides in 1997. The average numberof corn and soybean herbicide acre-treatments was highestfor no-till and lowest for conventional tillage with the mold-board plow. The reported higher level of herbicide acre-treatments with no-till is mostly due to the inclusion of anadditional “burndown” herbicide treatment prior to plantingas a substitute for mechanical weed control. Seventy percentof ridge-tilled corn acres were treated with insecticideswhile no-till had the lowest share of acres treated and thelowest average number of insecticide acre-treatments. Fewsoybean or wheat acres were treated with insecticides orfungicides.
74 ❖ Production Practices for Major Crops in U.S. Agriculture, 1990-97 Economic Research Service/USDA
Herbicide use by tillage system, 1997Figure 5E
Treated area by tillage system 1/Average number of herbicideacre-treatments by tillage systems 2/
1/ The value at the end of each bar is the percentage treated.2/ The value at the end of the bar is the average number of herbicide acre-treatments per treated acre.
40 30 20 10 0
Treated
Untreated
Average number of herbicide acre-treatmentsMillion acres
0 1 2 3 4
2.4
2.7
2.9
3.0
2.9
1.1
1.3
1.3
1.1
1.7
2.6
2.8
2.6
3.4
2.9
2.6
2.5
2.8
2.6
Source: 1997 Agricultural Resource Management Study
No-till
Mulch-till
Conventional without plow
Conventional with plowWheat herbicide:
Ridge-till
No-till
Mulch-till
Conventional without plow
Conventional with plowSoybean herbicide:
Ridge-till
No-till
Mulch- till
Conventional without plow
Conventional with plow
Corn insecticide:
Ridge-till
No-till
Mulch-till
Conventional without plow
Conventional with plowCorn herbicide:
94%
95%97%
99%
100%
14%
32%
33%
20%
71%
93%
97%97%
98%
100%
53%
63%
66%71%

Herbicide Application Rate Variation betweenFields, by Tillage Systems Many factors other than tillage affect the quantity of herbi-cide applied per acre (fig. 5E1). The variation in herbicideapplication rates between fields is much greater than the vari-ation that may result from the type of tillage system used. Forcorn and soybeans, the median (50th acreage percentile) andmean application rates were slightly higher for no-till, but thevariability in rates between fields was similar for all tillagetypes.
Cultivation of Row CropsThe purpose of cultivating row crops is primarily to killweeds, but it also loosens the soil (fig. 5F1). Farmers alsocultivate to shape the surface for furrow irrigation or tomaintain ridges in ridge-till systems. The 1995 CroppingPractices Survey data (USDA, NASS and ERS, 1995c) indi-cate that nearly all cotton is cultivated, and most cottonacreage is cultivated three or more times during the growingseason. About two-thirds of the corn is cultivated, but gener-ally only once or twice during the season.
Cultivation of row crops occurs with all tillage types, but thehigh level of residue left on the surface with no-till andmulch-till can make the practice difficult without causingsome injury to the plants. Most of the acreage in all tillagetypes, except no-till, was cultivated at least once. Only 22percent of the no-till acres received any cultivations.
Economic Research Service/USDA Production Practices for Major Crops in U.S. Agriculture, 1990-97 ❖ 75
Herbicide application rate variation betweenfields, by tillage class, 1997
Figure 5E1
Source: 1997 Agricultural Resource Management Study.
Pounds of active ingredients per acre
Mulch-till
Other conventional
Moldboard plow
Cotton
No till
Mulch-till
Other conventional
Moldboard plow
Soybeans
No-till
Mulch-till
Other conventional
Moldboard plow
Corn
No-till
Mulch-till
Other conventional
Moldboard plow Wheat
0 2 4 6 8 10
Each bar represents the range in application rates from the 5th percentile (area with no pesticide applied or lowest rates) to the 95th percentile (area with the highest rates). The bar segments represent ranges in application rates at 15 percentile intervals. At the 50th percentile (median) half of the area received less than the identified rate and half received more. The double arrow indicates the average (mean) rate for the treated area.
Percentiles
Corn
Soybeans
Cotton
Conventional
Conventional
Mulch-tillage
No-till
Ridge-till
0 10 20 30 40 50
1 Cultivation
2 Cultivations
3 or more
Row crop cultivation
without plow
with plow
Million acres
Cultivations used withalternative tillage systems
Source: 1994 Cropping Practices Survey
Figure 5F1
Cultivation of row crops, 1994
41.4, 64%
20.7, 40%
11.4, 98%
43.5, 67%
7.4, 71%
14.9, 63%
5.9, 22%
2.0, 94%
Represents 128 million acres of corn, soybeans, and cotton.1/ The first value at the end of the bar is the area cultivated one or more times, and the second value is the percentage of area cultivated one or more times.

Herbicide Application Rate Variation betweenFields, by Number of CultivationsIncreased use of row crop cultivation can control manyweeds and reduce the need for herbicide treatments (fig.5F2). Corn, soybean, and cotton acreage showed only smalldifferences in the intensity and variation in herbicide use forfields that received two or fewer cultivations, but less herbi-cide use occurred on fields receiving three or more cultiva-tions. For fields cultivated three or more times, a largershare of the acres received no herbicide treatments and themean rate on the treated acres was lower.
76 ❖ Production Practices for Major Crops in U.S. Agriculture, 1990-97 Economic Research Service/USDA
Herbicide application rate variation betweenfields, by number of cultivations, 1994
Figure 5F2
Source: 1994 Cropping Practices Survey.
Pounds of active ingredients per acre
3+ cultivations
2 cultivations
1 cultivation
No cultivation
Cotton
3+ cultivations
2 cultivations
1 cultivation
No cultivation
Soybeans
3+ cultivations
2 cultivations
1 cultivation
No cultivation
Corn
0 2 4 6 8 10
Each bar represents the range in application rates from the 5th percentile (area with no pesticide applied or lowest rates) to the 95th percentile (area with the highest rates). The bar segments represent ranges in application rates at 15 percentile intervals. At the 50th percentile (median) half of the area received less than the identified rate and half received more. The double arrow indicates the average (mean) rate for the treated area.
Percentiles

Bibliography
Ahearn, M., J. Yee, E. Ball, and R. Nehring, 1998.Agricultural Productivity in the United States, AIB-740,U.S. Dept. Agr., Econ. Res. Serv.
Alavanja, M. C .R., A. Blair, S.B. McMaster, and D. P.Sandler, 1993. Agricultural Health Study: AProspective Study of Cancer and Other DiseasesAmong Men and Women in Agriculture, U.S.Department of Health and Human Services, NationalInstitutes of Health, National Cancer Institute; U.S.Environmental Protection Agency; and the NationalInstitute of Environmental Health Sciences.
Aldrich, S. R., 1984. “Nitrogen Management to MinimizeAdverse Effects on the Environment,” Nitrogen in CropProduction, Madison, WI: Soil Science Society ofAmerica.
Aspelin, Arnold, 1999. Pesticide Industry Sales and Usage:1996 and 1997 Market Estimates, U.S. EnvironmentalProtection Agency, Office of Pesticide Programs, 733-R-99-001.
Association of American Plant Food Control Officials,1998. Commercial Fertilizers, 1997, Lexington, KY:University of Kentucky.
Baker, J. L., and H. P. Johnson, 1979. “The Effect of TillageSystem on Pesticides in Runoff from SmallWatersheds,” Transactions of American Society ofAgricultural Engineers, Vol. 22, pp. 554-59.
Barnard, C., S. Daberkow, M. Padgitt, M. E. Smith, andN.D. Uri, 1997. “Alternative Measures of PesticideUse,” in The Science of the Total Environment, Vol.203, pp. 229-44.
Bennett, Hugh Hammond, 1939. Soil Conservation, NewYork: McGraw Hill Book Co.
Blackman, Paul A. 1997. “Pesticide Inputs Now and into theTwenty-first Century,” in Crop and LivestockTechnologies, Burton C. English, R. L. White, L.Chuang (eds). Ames, IA: Iowa State University Press.
Blair, Aaron, 1992. “An Overview of Potential HealthHazards among Farmers’ Use of Pesticides,” presentedat the Surgeon General’s Conference on AgriculturalSafety and Health, convened by the National Institutefor Occupational Safety and Health, April 30-May 3,1991. U.S. Department of Health and Human Services,National Institute for Occupational Safety and Health,Publication No. 92105.
Brust, G. E., and B. R. Stinner, 1991. “Crop Rotation forInsect, Plant Pathogen, and Weed Control,” CRPHandbook for Pest Management in Agriculture, DavidPimentel (ed.), 2nd Edition, Vol. 1. Boca Raton, FL:CRC Press Inc., pp. 217-30.
Bull, Len, 1993. “Residue and Tillage Systems for FieldCrops.” AGES-9310, Resources and TechnologyDivision, U.S. Dept. Agr., Econ. Res. Serv.
Buzby, Jean, and Jerry Skees, 1994. “Consumers WantReduced Exposure to Pesticides on Food,” FoodReview. U.S. Dept. Agr., Econ. Res. Serv., pp. 19-26(May-Aug).
Campbell, H. F., 1976. “Estimating the MarginalProductivity of Agricultural Pesticides: The Case ofTree Fruit Farms in the Okangan Valley,” CanadianJournal of Agricultural Economics, Vol. 24, pp. 23-30.
Carlson, G. A., 1977, “Long-run Productivity of Pesticides,”American Journal of Agricultural Economics, Vol. 59,pp. 543-48.
Caswell, Margriet F., K. Fuglie, and C. Klotz. 1994.Agricultural Biotechnology: An Economic Perspective.AER-687, U.S. Dept. Agr., Econ. Res. Serv.
Ciesielski, S., D. Looms, S. Miss, and A. Amer, 1994.“Pesticide Exposures, Chloinesterase Depression, andSymptoms among North Carolina MigrantFarmworkers,” American Journal of Public Health,Vol. 84, No. 3, pp. 446-51.
Clark, Richard T., James B. Johnson, and JenniferBrundson. 1994. “Economics of Residue Management,Northern Great Plains Region,” in Crop ResidueManagement to Reduce Erosion and Improve SoilQuality: Northern Great Plains Region, CPR-38, U.S.Dept. Agr., Agricultural Research Service.
Collins, J., 1992. “Consumer Attitudes on PesticideTreatment Histories of Fresh Produce,” Journal ofSustainable Agriculture, Vol. 3, No. 2, pp. 81-98.
Conservation Technology Information Center, 1996. AChecklist for U.S. Farmers. West Lafayette, IN.
Cook, R., 1986. “Wheat Management Systems in the PacificNorthwest,”in Plant Diseases, Vol. 70, pp. 894-98.
Dick, W. A., and T. C. Daniel, 1987. “Soil Chemical andBiological Properties as Affected by ConservationTillage: Environmental Implications,” in T. J. Logan, J.M. Davidson, J. L. Baker, and M. R. Overcash (eds.),Effects of Conservation Tillage on Groundwater
Economic Research Service/USDA Production Practices for Major Crops in U.S. Agriculture, 1990-97 ❖ 77

Quality: Nitrates and Pesticides. Chelsea, MI: LewisPub., pp. 125-47.
Duffy, M., and M. Hanthorn, 1984. Returns to Corn andSoybean Tillage Practices. AER-508, U.S. Dept. Agr.,Econ. Res. Serv.
Dunn, Julie A., 1995. Organic Food and Fiber: An Analysisof 1994 Certified Production in the United States. U.S.Dept. Agr., Agr. Mktg. Serv.
Edwards, Everett E., 1940. “American Agriculture: The First300 Years,” in 1940 Yearbook of Agriculture, U.S. Dept.Agr.
Eichers, T., A. Andrilenas, and T. Anderson, 1978. Farmers’Use of Pesticides in 1976. AER-418, U.S. Dept. Agr.,Econ. Res. Serv.
Eleveld, Bart, 1989. “Partial Budgeting: Looking at theSmall Picture,” in 1989 Yearbook of Agriculture: FarmManagement. U.S. Dept. Agr.
EXTOXNET (Extension Toxicology Network) website.<www.ace.orst.edu/info/extoxnet>.
Fawcett, Richard S., Dennis P. Tierney, Brian R.Christensen, 1994. “Impact of Conservation Tillage onReducing Runoff of Pesticides into Surface Waters,”Journal of Soil and Water Conservation, Vol. 49, No. 2.
Fawcett, Richard S., 1987. “Overview of Pest Managementfor Conservation Tillage Systems,” in T. J. Logan, J. M.Davidson, J. L. Baker, and M. R. Overcash (eds.),Effects of Conservation Tillage on GroundwaterQuality: Nitrates and Pesticides. Chelsea, MI: LewisPub., pp. 125-47.
Fernandez-Cornejo, J., and S. Jans, 1995. “PesticideProductivity: Empirical Evidence in U.S. Agriculture.”Working Paper, U.S. Dept. Agr., Econ. Res. Serv.
Fernandez-Cornejo, Catherine Greene, Renata Penn, andDoris Newton, 1998. “Organic Vegetable Production inthe U.S.: Certified Growers and Their Practices,”American Journal of Alternative Agriculture, Vol. 13,No. 2.
Glenn, S., and J. S. Angle, 1987. “Atrazine and Simazine inRunoff from Conventional and No-Till CornWatersheds,” Agricultural Ecosystems andEnvironment, Vol. 18, pp. 273-80.
Gresshoff, Peter M., 1997. “An Estimate of the Impact ofGenetic Improvement and Biotechnology on FutureCrop Productivity,” in Crop and Livestock
Technologies, Burton C. English, R. L. White, and L.Chuang (eds). Ames, IA: Iowa State University Press.
Griliches, Z, 1963. “Estimates of Aggregate AgriculturalProduction Functions from Cross-sectional Data,”Journal of Farm Economics, Vol. 41, pp. 90-100.
Gruhn, Christine, 1992. “Consumer Food Safety Concernsand Interest in Pesticide-Related Information,” Journalof Food Safety, Vol. 12, pp. 253-62.
Hall, J. K., N. L. Hartwig, and L. D. Hoffman, 1984.“Cyanazine Losses in Runoff from No-Tillage Corn in‘Living’ and Dead Mulches vs. Unmulched,Conventional Tillage,” Journal of EnvironmentalQuality, Vol. 13, pp. 105-10.
Hambidge, Gove. 1940. “Farmers in a Changing World(Summary),” in 1940 Yearbook of Agriculture. U.S.Dept. Agr.
Hanthorn, M., and M. Duffy, 1983. Return to Corn PestManagement Practices. AER-501, U.S. Dept. Agr.,Econ. Res. Serv.
Headly, J. C., 1968. “Estimating the Productivity ofAgricultural Pesticides,” American Journal ofAgricultural Economics, Vol. 50, pp. 13-23.
Headly, J. C., 1972. “Defining the Economic Threshold,” inPest Control Strategies for the Future. Washington, DC:National Academy of Sciences, pp. 100-8.
Heichel, G. H., 1987. “Legumes as a Source of Nitrogen inConservation Tillage Systems,” in J.F. Power (ed.), TheRole of Legumes in Conservation Tillage Systems.Ankeny, IA: Soil Conservation Society of America, pp.29-35.
Helling, C. S., 1987. “Effect of Conservation Tillage onPesticide Dissipation,” in T. J. Logan, J. M. Davidson,J. L. Baker, and M. R. Overcash (eds.) Effects ofConservation Tillage on Groundwater Quality: Nitratesand Pesticides. Chelsea, MI: Lewis Pub., pp. 179-87.
Huang, Wen-Yuan. 1993. “Nitrogen Fertilizer ApplicationTiming: A Decision Theoretic Approach for UnitedStates Cotton,” Oxford Agrarian Studies, Vol. 21, No. 1.
Hudson, E. H., and J. F. Bradley, 1995. “Economics ofSurface-Residue Management, Southeast Region,” CropResidue Management to Reduce Erosion and ImproveSoil Quality: Southeast Region. CRR-39, U.S. Dept.Agr., Agr. Res. Serv.
78 ❖ Production Practices for Major Crops in U.S. Agriculture, 1990-97 Economic Research Service/USDA

Kansas Cooperative Extension Service, 1976. Soil TestInterpretations and Fertilizer Recommendations,Manhattan, KS.
Kanwar, R. S., J. L. Baker, and D. G. Baker, 1988. “Tillageand Split N-Fertilizer Effects on Subsurface DrainageWater Quality and Crops Yields,” Transactions of theAmerican Society of Agricultural Engineers, Vol. 31.
Klonsky, Karen, 1989. “Enterprise Budgeting,” in 1989Yearbook of Agriculture: Farm Management. U.S.Dept. Agr.
Lee, J. Y., and M. Langham, 1973. “A SimultaneousEquations Model of the Economic-Ecologic System inCitrus Groves,” Southern Journal of AgriculturalEconomics, Vol. 5, pp. 175-80.
Lichtenberg, E., and D. Zilberman, 1986. “TheEconometrics of Damage Control: Why SpecificationMatters,” American Journal of Agricultural Economics,Vol. 68, pp. 261-73.
Lin, Biing-Hwan, M. Padgitt, L. Bull, H. Delvo, D. Shank,H. Taylor, 1995. Pesticide and Fertilizer Use andTrends in U.S. Agriculture. AER-717, U.S. Dept. Agr.,Econ. Res. Serv.
Litovitz, T. L., B. F. Schmitz, and K. M. Bailey, 1990.“1989 Annual Report of the American Association ofPoison Control Centers National Data CollectionSystem,” American Journal of Emerging Medicine, Vol.8, pp. 394-442.
Meister Publishing Company, 1995. Insect Control Guide,Vol. 8, Willoughby, OH.
Meister Publishing Company, 1996. Farm ChemicalHandbook ‘96, Vol. 82, Willoughby, OH.
Miranowski, J. A., 1975. “The Demand for AgriculturalCrop Chemicals Under Alternative Farm Program andPollution Control Solutions,” Ph. D. thesis, HarvardUniversity, Cambridge, MA.
Monson, Mike, and Nyle Wollenhaupt, 1995. “ResidueManagement: Does It Pay? North Central Region,” inCrop Residue Management to Reduce Erosion andImprove Soil Quality: North Central Region. CRR-42,U.S. Dept. Agr., Agr. Res. Serv.
Mueller, David K., and Dennis R. Helsel, 1996. “Nutrientsin the Nation’s Waters: Too Much of a Good Thing?”Circular 1136, U.S. Dept. Interior, Geological Survey.
National Research Council, 1989. Alternative Agriculture.Washington, DC: National Academy Press.
National Research Council, 1993. Pesticides in the Diets ofInfants and Children. Washington, DC: NationalAcademy Press.
National Research Council, 1995. Nitrate and Nitrite inDrinking Water. Washington, DC: National AcademyPress.
Office of Technology Assessment, 1995. Report to Congresson Boll Weevil Eradication.
Onstad, C. A., and W. B. Voorhees, 1987. “Hydrologic SoilParameters Affected by Tillage,” in T. J. Logan, J. M.Davidson, J. L. Baker, and M. R. Overcash (eds.),Effects of Conservation Tillage on GroundwaterQuality: Nitrates and Pesticides. Chelsea, MI: LewisPub., pp. 95-112.
Padgitt, Merritt M., 1969. Resource Productivity in theCornbelt, 1964, M. S. thesis, University of Missouri.
Parks, W. Robert, 1952. Soil Conservation Districts inAction. Ames, IA: Iowa State University Press.
Power, J. F., 1987. “Legumes: Their Potential in AgriculturalProduction,” American Journal of AlternativeAgriculture, Vol. 2, No. 2, pp. 69-73.
Ribaudo, M. O., 1986. Reducing Soil Erosion: OffsiteBenefits. AER-561, U.S. Dept. Agr., Econ. Res. Serv.
Roberts, D., 1991. “Using Nonchemical Methods to ControlDiseases of Plants,” in D. Pimentel (ed.), Handbook ofPest Management in Agriculture, 2nd ed., Vol. 2. BocaRaton, FL: CRC Press Inc.
Ruttan, Vernon W., 1982. Agricultural Research Policy.Minneapolis, MN: University of Minnesota Press.
Sander, K. W., W. W. Witt, and M. Barrett, 1989.“Movement of Triazine Herbicides in Conventional andConservation Tillage Systems,” in D. L. Weigmann(ed.), Pesticides in Terrestrial and AquaticEnvironments. Virginia Water Resources Center andVirginia Polytechnic Institute and State University,Blacksburg, VA, pp. 378-82.
Sandretto, Carmen, and Len Bull, 1996. “ConservationTillage Gaining Ground,” Agricultural Outlook, AO-232, U.S. Dept. Agr., Econ. Res. Serv.
Economic Research Service/USDA Production Practices for Major Crops in U.S. Agriculture, 1990-97 ❖ 79

Schlegel, A. J., and J. L. Havlin, 1995. “Corn Response toLong-Term Nitrogen and Phosphorus Fertilization,”Journal of Production Agriculture, Vol. 8, pp. 181-85.
Schwab, Gerald, G. A. Barnaby, and J. Roy Black, 1989.“Strategies for Risk Management,” in 1989 Yearbook ofAgriculture: Farm Management. U.S. Dept. Agr.
Siemens, John C., and D. Howard Doster, 1992. “Costs andReturns,” in Conservation Tillage Systems andManagement, Crop Residue Management with No-till,Ridge-till, Mulch-till. Midwest Plan Service, MWPS-45(1st ed.). Ames, IA: Agricultural and BiosystemsEngineering Department, Iowa State Univ., pp. 34-41.
Smith, R., J. Apple, and D. Bottrell, 1976. “The Origins ofIntegrated Pest Management,” in J. Apple and R. Smith(eds.), Integrated Pest Management. New York: PlenumPress.
Teague, M. L., and B. W. Brorsen, 1995. “PesticideProductivity: What Are the Trends?” Journal ofAgricultural and Applied Economics, Vol. 27.
Terry, D. L., and B. L. Kirby, 1997. Commercial Fertilizer,1997. Lexington, KY: Division of Regulatory Services,Association of American Plant Food Control Officials,University of Kentucky.
U.S. Congress, Office of Technology Assessment, 1990.Beneath the Bottom Line: Agricultural Approaches toReduce Agrichemical Contamination of Groundwater,OTA-F-418.
U.S. Department of Agriculture, Agricultural MarketingService, 1998. Pesticide Data Program: AnnualSummary Calendar Year 1996.
U.S. Department of Agriculture, Animal Plant HealthInspection Service (APHIS), 1998. “Boll WeevilEradication: Current Status,”<www.aphis.usda.gov/oa/pubs/fsbwqa.html>.
U.S. Department of Agriculture, Economic ResearchService, 1996. Provisions of the Federal AgricultureImprovement and Reform Act of 1996, Frederick J.Nelson and Lyle P. Schertz, (eds.). AIB-729.
U.S. Department of Agriculture, Economic ResearchService, 1997. Agricultural Resources andEnvironmental Indicators, AH-712.
U.S. Department of Agriculture, Economic ResearchService, 1999. “Corn production cash costs andreturns” <www.ers.usda.gov/briefing/farmincome/car/com2.html>.
U.S. Department of Agriculture, National AgriculturalStatistics Service and Economic Research Service,1994. 1994 Vegetable Agricultural Chemical UseSurvey.
U.S. Department of Agriculture, National AgriculturalStatistics Service and Economic Research Service,1995a. Agricultural Chemical Usage: 1994 VegetablesSummary. AgCh 1(95).
U.S. Department of Agriculture, National AgriculturalStatistics Service and Economic Research Service,1995b. Agricultural Chemical Usage: 1994 Field CropsSummary. AgCh 1(95).
U.S. Department of Agriculture, National AgriculturalStatistics Service and Economic Research Service,1995c. The Cropping Practices Surveys were annualcommodity surveys between 1990 and 1995 of farmoperators to collect chemical use and production prac-tices data.
U.S. Department of Agriculture, National AgriculturalStatistics Service and Economic Research Service,1995d. 1995 Fruit Agricultural Chemical Use Survey.
U.S. Department of Agriculture, National AgriculturalStatistics Service and Economic Research Service,1996a. Agricultural Chemical Usage: 1995 Field CropsSummary. AgCh 1(96).
U.S. Department of Agriculture, National AgriculturalStatistics Service and Economic Research Service,1996b. Agricultural Chemical Usage: 1995 FruitsSummary. AgCh 1(96).
U.S. Department of Agriculture, National AgriculturalStatistics Service and Economic Research Service,1996c. The Agricultural Resource Management Study(ARMS) is a series of annual commodity surveys offarm operators begun in 1996 to collect information onchemical use, production practices, and farm inputcosts and returns.
U.S. Department of Agriculture, National AgriculturalStatistics Service and Economic Research Service,1996d. 1996 Vegetable Agricultural Chemical UseSurvey.
U.S. Department of Agriculture, National AgriculturalStatistics Service and Economic Research Service,1997a. Agricultural Chemical Usage: 1996 VegetablesSummary. AgCh 1(97).
U.S. Department of Agriculture, National AgriculturalStatistics Service and Economic Research Service,
80 ❖ Production Practices for Major Crops in U.S. Agriculture, 1990-97 Economic Research Service/USDA

1997b. Agricultural Chemical Usage: 1996 Field CropsSummary. AgCh 1(97).
U.S. Department of Agriculture, National AgriculturalStatistics Service and Economic Research Service,1998a. Agricultural Chemical Usage: 1997 FruitsSummary. AgCh 1(98).
U.S. Department of Agriculture, National AgriculturalStatistics Service and Economic Research Service,1998b. Agricultural Chemical Usage: 1997 Field CropsSummary. AgCh 1(98).
U.S. Department of Agriculture, National AgriculturalStatistics Service and Economic Research Service,1999. Agricultural Chemical Usage: 1998 Field CropsSummary. AgCh 1(99).
U.S. Department of Agriculture, Science and EducationAdministration, 1978. Predicting Rainfall ErosionRates. AH-537.
U.S. Department of Interior, Geological Survey, 1995.Pesticides in the Atmosphere. Fact Sheet FS-152-95.
U.S. Environmental Protection Agency, 1995. The NationalWater Quality Inventory: 1994 Report to Congress.EPA-841-R-95.
U.S. Environmental Protection Agency, 1998. A CommonMechanism of Action: The OrganophosphatePesticides: A Report to the Science Advisory Panel.
U.S. Environmental Protection Agency, 1999. The Quality ofOur Nation’s Water, <www.epa.gov/305b>.
van Ravenswaay, Eileen, 1995. Public Perceptions ofAgrichemicals. Task Force Report No. 123. Washing-ton, DC: Council for Agricultural Science andTechnology.
Wagenet, R. J., 1987. “Processes Influencing Pesticide Losswith Water under Conservation Tillage,” in J. M.Davidson, J. L. Baker, T. J. Logan, and M. R. Overcash(eds.), Effects of Conservation Tillage on GroundwaterQuality: Nitrates and Pesticides. Chelsea MI: LewisPub., pp. 190-204.
Weersink, A., M. Walker, C. Swanton, and F. E. Shaw, 1992.“Costs of Conventional and Conservation TillageSystems,” Journal of Soil and Water Conservation, Vol.47, No. 4.
Economic Research Service/USDA Production Practices for Major Crops in U.S. Agriculture, 1990-97 ❖ 81

Appendix A
Description of Surveys
Agricultural Resource Management Study (ARMS)The ARMS, developed from combining the formerCropping Practices Survey and the Farm Costs and ReturnsSurvey, was first conducted in 1996. A multiframe, stratifiedsampling procedure is used to select farms and crop fields tocollect detailed information on production inputs, practices,costs, and returns. The inputs include detailed measurementsof fertilizer and pesticide use and the time and methods oftheir application. The survey also obtains information onother nutrient and pest management practices applied by theproducer. The results are weighted and aggregated to devel-op State, regional, and national estimates. Table A.1 reportsthe 1996 and 1997 sample size, by crop, for this survey.
Cropping Practices Surveys, 1990-95The Cropping Practices Surveys were commodity surveysthat collected data on fertilizer and pesticide use, tillageoperations, crop sequence, and other inputs and culturalpractices. The 1995 survey gathered data for corn, cotton,soybeans, wheat, and potatoes and represented about 182million acres. The represented area included the acreage inmajor producing States for each commodity and accountedfor 70-90 percent of the total U.S. acreage for each of thesecrops. See the following table for the States included in thesurvey and the number of fields sampled to develop esti-mates.
The Cropping Practices Surveys used a stratified samplingprocedure to gather data about a randomly selected acre ofthe crop. Because the random acre within a field was not
identified, respondents (farm operators) were asked to pro-vide field-level information on all fertilizer and nutrienttreatments, all tillage operations prior to planting, cropsplanted in the previous 2 years, and data on other inputs andcultural practices. The operator also identified whether thefield had been designated as highly erodible land (HEL) bythe Natural Resources Conservation Service and whether thefarm unit participated in a Federal commodity price orincome support program.
The Cropping Practices Surveys were annual surveys,although the commodities and States surveyed changed fromyear to year because of priority data needs and regionalshifts in crop production. Consistent data for selected Stateswere collected between 1990 and 1995 and were used todevelop the time series data in this report. The sample num-ber and statistical reliability of estimates for preceding yearsis generally similar to that for 1995.
Chemical Use SurveysThe Chemical Use Surveys collect nutrient and pesticide useand other production data on fruit and vegetable crops.Since 1990, data on vegetable crops were collected for evennumbered years (1990, 1992, and 1994), while data for fruitcrops were collected in odd numbered years (1991, 1993,and 1995). Besides gathering chemical use data, these sur-veys also focused on data related to integrated pest manage-ment, the use of organic production practices, and farmenterprise and operator characteristics. Specific field-levelinformation on nutrient and pest management was collectedfor apples, oranges, grapes, peaches, fresh market tomatoes,and strawberries. The surveys were a stratified systematicsample of growers who produce at least an acre of the tar-geted crop.
82 ❖ Production Practices for Major Crops in U.S. Agriculture, 1990-97 Economic Research Service/USDA

Economic Research Service/USDA Production Practices for Major Crops in U.S. Agriculture, 1990-97 ❖ 83
Table A.1—Completed sample sizes for the 1996 and 1997 Agricultural Resource Management Study
Upland Winter Durum Spring Fall State Corn Soybeans cotton wheat wheat wheat potatoes Total
1996 sample number
AZ . . 76 . . . . 76
AR . 171 95 . . . . 266
CA . . 137 . . . . 137
CO . . . 72 . . . 72
DE . . . 76 . . . 76
GA . . 106 . . . . 106
ID . . . 66 . . 226 292
IL 271 247 . . . . . 518
IN 236 182 . . . . . 418
IA 1,009 948 . . . . . 1,957
KS 217 . . 174 . . . 391
KY 73 . . . . . . 73
LA . 122 78 . . . . 200
ME . . . . . . 118 118
MI 152 . . . . . . 152
MN 222 242 . . . 64 . 528
MS . 147 158 . . . . 305
MO 156 171 . . . . . 327
MT . . . 49 . 85 . 134
NE 275 152 . 40 . . . 467
NC 73 . . . . . . 73
ND . . . . 99 99 . 198
OH 173 163 . . . . . 336
OK . . . 83 . . . 83
OR . . . 76 . . . 76
PA 93 . . . . . . 93
SC 55 . . . . . . 55
SD 178 . . 56 . . . 234
TN . 150 111 . . . . 261
TX 58 . 388 103 . . . 549
WA . . . 108 . . 61 169
WI 700 154 . . . . . 854
MN/ND 1/ . . . . . . 69 69
Total 3,941 2,849 1,149 903 99 248 474 9,663See notes at end of table. —Continued

84 ❖ Production Practices for Major Crops in U.S. Agriculture, 1990-97 Economic Research Service/USDA
Table A.1—Completed sample sizes for the 1996 and 1997 Agricultural Resource Management Study—continued
Upland Winter Spring Durum Fall State Corn Soybeans cotton wheat wheat wheat potatoes Total
1997 sample number
AL . . 75 . . . . 75
AZ . . 55 . . . . 55
AR . 83 49 . . . . 132
CA . . 54 . . . . 54
CO . . . 81 . . . 81
DE . 159 . . . . . 159
GA . . 95 . . . . 95
ID . . . 83 . . 185 268
IL 226 217 . 65 . . . 508
IN 150 154 . . . . . 304
IA 205 209 . . . . . 414
KS . 136 . 229 . . . 365
KY . 108 . . . . . 108
LA . 126 84 . . . . 210
ME . . . . . . 122 122
MI 146 61 . . . . . 207
MN 144 174 . . 48 . 49 415
MS . 167 126 . . . . 293
MO 144 138 53 67 . . . 402
MT . . . 75 90 . . 165
NE 192 177 . 81 . . . 450
NC . 75 74 . . . . 149
ND . . . . 92 119 47 258
OH 157 134 . 67 . . . 358
OK . . . 149 . . . 149
OR . . . 82 . . 91 173
PA . 162 . 158 . . . 320
SC . . 56 . . . . 56
SD 171 116 . 62 69 . . 418
TN . 102 102 . . . . 204
TX . . 308 135 . . . 443
WA . . . 101 . . 71 172
WI 159 56 . . . . 71 286
Total 1,694 2,554 1,131 1,435 299 119 636 7,868. = No survey conducted in State.
1/ Includes only counties along the Red River Valley in Minnesota and North Dakota.Source: USDA, National Agricultural Statistics Service and Economic Research Service, 1996c.

Economic Research Service/USDA Production Practices for Major Crops in U.S. Agriculture, 1990-97 ❖ 85
Table A.2—Completed sample sizes for the 1995 Cropping Practices Survey
Upland Fall Winter Spring DurumState Soybeans cotton Corn potatoes wheat wheat wheat
Number of fields
AZ . 69 . . . . .
AR 1/ 125 117 . . . . .
CA . 160 . . . . .
CO . . . 72 82 . .
DE . . 76 . . . .
GA 122 . 115 . . . .
ID . . . 262 85 . .
IL 1/ 206 . 265 . 76 . .
IN 1/ 138 . 164 . . . .
IA 1/ 209 . 624 . . . .
KS . . 69 . 391 . .
KY 158 . 153 . . . .
LA 160 93 . . . . .
ME . . . 146 . . .
MI 1/ . . 84 83 . . .
MN 1/ 98 . 171 94 . 61 .
MS 179 149 . . . . .
MO 1/ 122 . 119 . 64 . .
MT . . . . 94 82 .
NE 1/ 83 . 199 . 93 . .
NY . . . 57 . . .
NC 153 . 132 . . . .
ND . . . 133 . 102 116
OH 1/ 126 . 133 . 72 . .
OK . . . . 478 . .
OR . . . 143 93 . .
PA . . 82 56 . . .
SD 1/ . . 104 . 56 58 .
TN 157 . . . . . .
TX . 439 69 . 153 . .
WA . . . 144 135 . .
WI 1/ . . 136 130 . . .
Total 2,036 1,027 2,695 1,320 1,872 303 116. = No survey conducted in the State.1/ For corn and soybeans, no pest management information was collected in this State. However pest management data were collected in
1994 on a similar size of sample and used to calculate estimates for this report.Source: USDA, National Agricultural Statistics Service and Economic Research Service, 1995c.

86 ❖ Production Practices for Major Crops in U.S. Agriculture, 1990-97 Economic Research Service/USDA
Table A.3—Completed sample sizes for the 1995 Fruit Chemical Use Survey
Item Total CA FL GA MI NJ NY OR PA SC WA
Number of growers
Apples 1,120 91 . 34 175 68 182 141 139 39 251
Apricots 78 78 . . . . . . . . .
Avocados 101 51 50 . . . . . . . .
Blackberries 110 . . . . . . 110 . . .
Blueberries 322 . . 55 131 64 . 72 . . .
Dates 33 33 . . . . . . . . .
Figs 14 14 . . . . . . . . .
Grapes 704 255 . . 99 . 81 104 83 . 82
Kiwifruit 48 48 . . . . . . . . .
Nectarines 98 98 . . . . . . . . .
Olives 65 65 . . . . . . . . .
Peaches 684 169 . 41 93 77 55 . 107 75 67
Pears 390 78 . . . . 74 111 . . 127
Plums 116 116 . . . . . . . . .
Prunes 150 150 . . . . . . . . .
Grapefruit 258 75 183 . . . . . . . .
Lemons 87 87 . . . . . . . . .
Limes 16 . 16 . . . . . . . .
Oranges 454 183 271 . . . . . . . .
Tangelos 126 . 126 . . . . . . . .
Tangerines 193 59 134 . . . . . . . .
Raspberries 162 . . . . . . 81 . . 81
Cherries, sweet 449 98 . . 100 . . 112 . . 139
Cherries, tart 298 . . . 139 . 51 45 63 . .
Temples 97 . 97 . . . . . . . .
Total 6,551 1,924 892 178 746 228 450 843 396 118 776. = No survey conducted in the State.Source: USDA, National Agricultural Statistics Service and Economic Research Service, 1995d.

Econom
ic Research S
ervice/US
DA
Production P
ractices for Major C
rops in U.S
.Agriculture, 1990-97
❖ 87
Table A.4—Completed sample sizes for the 1994 Vegetable Chemical Use Survey
Item ALL AZ CA FL GA IL MI MN NJ NY NC OR TX WA WI
Number of growers
Watermelons 798 35 76 101 222 . . . . . 142 . 222 . .
Other melons 457 21 93 . 94 . 88 . . . . . 161 . .
Strawberries 623 . 90 49 . . 87 . 59 72 65 91 . 32 78
Asparagus 398 . 27 . . 80 119 . 61 . . 18 . 93 .
Broccoli 230 15 130 . . . . . . . . 48 37 . .
Carrots 337 7 95 7 . . 52 . . 30 . 43 45 26 32
Cauliflower 221 8 65 . . . 38 . . 47 . 50 13 . .
Celery 72 . 36 5 . . 28 . . . . . 3 . .
Eggplant 197 . . 35 . . . . 162 . . . . . .
Lettuce, head 164 19 65 3 . . . . 51 26 . . . . .
Onions 787 19 136 . 112 . 64 . . 107 . 129 134 54 32
Peppers, bell 647 . 100 53 . . 106 . 241 . 78 . 69 . .
Lettuce, other 141 13 122 6 . . . . . . . . . . .
Cabbage, fresh 718 . 55 25 64 . 72 . 113 124 129 . 79 . 57
Sweet corn, fresh 1,447 . 93 87 126 106 152 . 228 182 170 84 64 63 92
Cucumbers, fresh 663 . 79 40 57 . 77 . 160 69 96 . 85 . .
Beans, lima, fresh 78 . . . 78 . . . . . . . . . .
Beans, snap, fresh 619 . 82 77 109 . 65 . 108 69 109 . . . .
Spinach, fresh 158 . 53 . . . . . 66 . . . 39 . .
Tomatoes, fresh 974 . 168 53 42 . 118 . 270 127 93 . 103 . .
Cabbage, processed 57 . . . . . 6 . . 30 . . . . 21
Sweet corn, processed 792 . . . . 140 12 99 . 73 . 150 . 87 231
Cucumbers, processed 319 . 13 4 5 . 104 . . . 105 17 33 15 23
Beans, lima, processed 165 . 31 . . 37 . . 32 . . 4 . 43 18
Peas, processed 564 . . . . 102 . 94 . 56 . 55 . 87 170
Beans, snap, processed 471 . 6 . . 68 71 . 22 34 8 125 . 4 133
Spinach, processed 21 . 10 . . . . . . . . . 11 . .
Tomatoes, processed 166 . 139 . . . 27 . . . . . . . .
Total 12,284 137 1,764 545 909 533 1,286 193 1,573 1,046 995 814 1,098 504 887.= No survey conducted in State.Source: USDA, National Agricultural Statistics Service and Economic Research Service, 1994.

88 ❖ Production Practices for Major Crops in U.S. Agriculture, 1990-97 Economic Research Service/USDA
Table B.1—Fertilizer use on crops 1/
Area Area Area receiving— Quantities appliedCrop not treated treated Nitrogen Phosphate Potash Nitrogen Phosphate Potash
1,000 acres 1,000 pounds
Corn 874 79,353 79,425 67,391 47,763 10,335 3,823 4.656
Cotton 1,129 12,679 12,427 9,251 8,009 1,051 434 571
Wheat 8,973 62,016 61,831 45,149 12,707 3,957 1,404 521
Soybeans 44,154 26,696 14,170 19,838 23,381 368 1,001 2,131
Subtotal for following 834 7,133 5,200 5,239 5,237 1,112 589 687
Potatoes - 1,362 1,362 1,335 1,239 322 240 194
Vegetables 2/ 494 3,032 1,099 2,705 2,320 489 292 275
Citrus 2/ 20 1,130 1,130 579 860 177 26 148
Apples 2/ 104 349 349 167 200 22 6 11
Other fruit 2/, 3/ 216 1,260 1,260 453 618 102 24 59
Total 55,964 187,877 173,053 146,868 107,097 16,823 7,250 8,566
- = None reported or insufficient data available to make an estimate.1Constructed to represent 244 million acres of 1997 U.S. cropland. Estimates were constructed using 1997 planted crop acres for all crops andfertilizer use rates from the 1997 Agricultural Resource Management Study (corn, cotton, wheat, soybeans, and potatoes), the 1995 FruitChemical Use Survey, and the 1994 Vegetable Chemical Use Survey.2Treated area includes only the area treated with nitrogen.3Excludes citrus and apples, but includes other deciduous fruits and berries.
Source: USDA, National Agricultural Statistics Service and Economic Research Service, 1998b; USDA National Agricultural Statistics Serviceand Economic Research Service, 1996b; and USDA, National Agricultural Statistics Service and Economic Research Service, 1995a.
Table B.2—Nutrient application rates on field crops, 1990-97
Nutrient/crop 1990 1991 1992 1993 1994 1995 1996 1997
Pounds/acre
Nitrogen:Corn 132 128 127 123 129 129 133 132
Cotton 86 91 88 90 110 96 98 83
Wheat 59 62 63 64 67 59 57 59
Soybeans 23 24 20 20 24 28 24 21
Potatoes 231 230 242 271 240 251 220 268
Phosphate:
Corn 61 60 57 56 57 56 59 57
Cotton 44 46 48 47 43 43 44 43
Wheat 36 36 34 34 35 30 29 29
Soybeans 48 48 46 46 47 55 49 54
Potatoes 184 187 192 210 176 199 196 218
Potash:
Corn 84 81 79 79 81 81 82 81
Cotton 47 49 56 58 55 51 58 52
Wheat 44 43 39 35 38 20 28 19
Soybeans 85 78 76 81 81 88 86 93
Potatoes 139 137 148 168 170 163 147 153Source: USDA, National Agricultural Statistics Service and Economic Research Service, 1995c, 1996a, and 1997b. Represents planted cornarea in IL, IN, IA, MI, MN, MO, NE, OH, SD, and WI; cotton area in AZ, AR, CA, LA, MS, and TX; wheat area in CO, KS, MT, NE, OK, SD, TX,and WA; soybean area in AR, IL, IN, IA, MN, MO, NE, and OH; and potato area in ID, ME, and WA.

Econom
ic Research S
ervice/US
DA
Production P
ractices for Major C
rops in U.S
.Agriculture, 1990-97
❖ 89
Table B.3—Nutrient management practices
Item (unit) Total Corn Soybeans Wheat Cotton Potatoes Oranges Apples Grapes Peaches Tomatoes Strawberries
Represented crop area (000 acres) 196,337 62,150 62,215 55,865 13,080 990 671 329 743 144 104 46
Time of nitrogen applications:Amount applied in Fall (000 lbs) 3,703 1,694 109 1,684 187 29 na na na na na naAmount applied in
Spring before planting (000 lbs) 6,092 4,572 193 946 286 95 na na na na na naAmount applied in
Spring after planting (000 lbs) 3,226 1,857 33 669 567 100 na na na na na naTotal 12,991 8,123 335 3,299 1,010 224 na na na na na na
Area with only fall application (000 acres) 30,231 7,851 3,699 16,759 1,880 42 na na na na na naAmount applied (000 lbs) 2,304 1,083 97 997 119 8 na na na na na na
Area with only springapplications (000 acres) 80,758 44,677 9,085 17,984 8,324 688 na na na na na naAmount applied (000 lbs) 7,891 5,722 181 1,125 707 156 na na na na na na
Area with split applications betweenfall and spring (000 acres) 25,908 8,980 505 14,467 1,747 209 na na na na na naAmount Fall applied (000 lbs) 1,400 611 12 687 69 21 na na na na na naAmount Spring applied (000 lbs) 1,398 707 46 491 115 39 na na na na na na
Livestock manure usage:1
Area receiving (000 acres) 15,675 10,325 3,607 1,234 337 25 41 10 73 12 2 9Manure analyzed for
nutrients (000 acres) 1,122 800 193 107 108 12 na na na 2 na naSoil nutrient testing:1
Tested for pH or nutrientstatus (000 acres) 59,221 26,459 15,226 12,610 3,171 945 381 119 184 51 52 23
Tested for nitrogen content (000 acres) 37,278 14,603 6,450 11,607 2,998 888 369 115 183 na 44 21
Area treated with nitrogenstabilizer (000 acres)1 na 6,366 na na na na na na na na na na
na = No data available to make estimate.1Estimates for livestock manure usage and soil nutrient testing for corn, soybeans, wheat, cotton, and potatoes are from the 1995 Cropping Practices Survey representing 64.1, 51.8, 53.0,11.7, 1.1 million acres, respectively. Estimates for area treated with nitrogen stabilizers are from the 1996 Cropping Practices Survey representing 61.5 million acres of corn.Source: USDA, National Agricultural Statistics Service and Economic Research Service, 1996c, 1996d, and 1994.

90❖
Production P
ractices for Major C
rops in U.S
.Agriculture, 1990-97
Econom
ic Research S
ervice/US
DA
Table B.4—Pest management practices on selected crops
Item (unit) Total Corn Soybeans Wheat Cotton Potatoes Oranges Apples Grapes Peaches Tomatoes Strawberries
1,000 acres
Planted crop area 187,738 69,755 50,665 52,965 11,650 666 671 329 743 144 104 46Scouting for pests 144,895 51,283 38,705 42,488 10,216 572 602 277 509 102 96 45
Scouted by operator or employee 116,469 42,031 34,428 35,364 3,723 133 327 108 262 27 39 27Scouted by chemical dealer 9,020 3,240 2,290 1,898 833 259 162 100 165 53 15 5Scouted by a professional service 9,958 1,780 432 1,817 5,504 144 79 53 77 21 39 12
Dollars
Average cost per acre 3.46 4.52 3.28 2.78 6.00 na na na na na na na
1,000 acres
Scouted by other 9,448 4,232 1,555 3,409 156 36 34 16 5 1 3 1
Soil and plant tissue testing for pests 6,460 2,052 1,498 1,101 1,034 361 173 37 151 12 32 9Pheromone traps to monitor pests 3,453 na na 108 2,854 na 107 227 92 47 16 2Weed mapping for
preventive treatments 20,486 9,294 7,197 1,563 2,432 na na na na na na naPlanting resistant varieties/rootstock 33,271 na na 28,745 4,204 na 85 32 86 63 39 17
Protection of beneficial insects 23,376 na na 13,252 8,921 149 407 264 231 59 66 27Purchasing/releasing beneficial insects 557 na na 326 108 8 53 3 39 1 3 16Adjustment of planting dates 22,551 na na 18,789 3,751 na na na na na 11 0
Pheromone use for pest control 1,389 na na 92 1,140 na 20 50 36 30 21 0Seed treatments with pesticides 93,827 49,382 12,247 22,761 9,437 na na na na na na na
Alternating pesticides to reduceoccurrence of pesticide-resistant species 103,712 41,896 33,457 20,492 6,227 509 409 248 269 96 76 33
Decision strategies for pesticide application decisions:
Use of pest thresholds 82,689 16,280 14,219 39,857 10,729 517 489 183 304 4 73 34Preventive or routine
schedule treatments 48,078 24,999 14,253 7,512 794 48 108 133 183 13 26 9Requirement of processor
and/or sales contract 32 na na na na na 3 1 16 0 6 6
Information sources used for pest management:
Extension Service 10,061 na na 8,362 1,302 na 119 63 160 32 15 8Chemical dealer 35,235 na na 30,501 3,805 na 359 160 306 47 38 19Professional scouting service 10,653 na na 4,457 5,763 na 133 75 120 44 45 16Media or demonstration events 2,947 na na 2,559 331 na 31 7 11 6 1 1Other information sources 6,417 na na 5,806 425 na 28 21 123 9 2 3
Produced using organic system 2,718 950 573 886 264 15 1 6 22 1 0 0na = No data available to make estimate.Source: USDA, National Agricultural Statistics Service and Economic Research Service, 1995c, 1995d, and 1994

Economic Research Service/USDA Production Practices for Major Crops in U.S. Agriculture, 1990-97 ❖ 91
Table B.5—Overall pesticide use on selected U.S. crops by pesticide type, 1990-97 1/
Item 1990 1991 1992 1993 1994 1995 1996 1997
Million pounds of active ingredients
Herbicides 344.6 335.2 350.5 323.5 350.6 324.9 365.7 366.4Insecticides 57.4 52.8 60.0 58.1 68.2 69.9 59.2 60.5Fungicides 27.8 29.4 34.9 36.6 43.6 47.5 46.8 50.5Other pesticides 67.9 60.1 72.7 80.0 101.1 101.0 104.0 110.2
Total 497.7 477.5 518.2 498.2 563.4 543.3 575.8 587.6
Million cropland acres
Area represented 228.5 226.0 231.5 226.6 232.8 228.0 242.1 243.8Total cropland used
for crops 341.0 337.0 337.0 330.0 339.0 332.0 346.0 353.0
Pounds of active ingredient per planted acre
Herbicides 1.508 1.483 1.514 1.428 1.505 1.425 1.5111 1.502Insecticides .251 .234 .259 .256 .293 .306 .245 .248Fungicides .121 .130 .151 .161 .187 .208 .193 .207Other pesticides .297 .266 .314 .353 .434 .443 .430 .452
Total 2.178 2.113 2.238 2.199 2.419 2.383 2.379 2.410
Percent
Share of croplandrepresented 2/ 67 67 69 69 69 69 70 691/ Estimates include corn, soybeans, wheat, cotton, potatoes, other vegetables, citrus fruit, apples, and other fruit.2/ Share of total for the selected crops to total cropland used for crops.Source: Lin, Biing, M. Padgitt, L., Bull, H. Delvo, D. Shank, and H. Taylor 1995 (prior to 1993); unpublished USDA survey data (following 1993).

92 ❖ Production Practices for Major Crops in U.S. Agriculture, 1990-97 Economic Research Service/USDA
Table B.6—Estimated quantity of pesticide active ingredient applied to selected U.S. crops, 1990-97 1/
Item/commodity 1990 1991 1992 1993 1994 1995 1996 1997
Million pounds of herbicides
Herbicides 344.6 335.2 350.5 323.5 350.6 324.9 365.7 366.4Corn 217.5 210.2 224.4 202.0 215.6 186.3 211.6 211.8Cotton 21.1 26.0 25.8 23.6 28.6 32.9 27.7 29.2Wheat 16.6 13.6 17.4 18.3 20.7 20.0 30.5 24.3Soybeans 74.4 69.9 67.4 64.1 69.3 68.1 77.8 83.7Potatoes 2.4 2.5 2.2 2.5 2.9 2.9 2.9 2.4Other vegetables 4.9 4.7 5.8 5.7 6.2 7.2 7.7 7.5Citrus 5.7 6.1 5.5 5.1 4.8 4.7 4.6 4.5Apples .4 .4 .4 .4 .6 .8 .8 .9Other deciduous 1.7 1.7 1.7 1.8 2.0 2.0 2.1 2.1
Million pounds of insecticides
Corn 23.2 23.0 20.9 18.5 17.3 15.0 16.1 17.5Cotton 13.6 8.2 15.3 15.4 23.9 30.0 18.7 19.3Wheat 1.0 .2 1.2 .2 2.0 .9 2.3 1.2Soybeans . .4 .4 .3 .2 .5 .4 .8Potatoes 3.6 3.6 3.5 3.9 4.4 3.1 2.5 3.3Other vegetables 4.7 4.5 5.5 5.3 5.7 5.7 5.4 5.3Citrus 2.8 4.0 4.5 5.3 5.1 5.2 5.3 5.5Apples 3.7 4.0 3.9 4.1 3.8 3.5 3.4 3.3Other deciduous 4.8 4.9 4.9 5.0 5.6 6.0 5.2 4.4
Million pounds of fungicides
Corn . . . . . . . .Cotton 1.0 0.7 0.8 0.7 1.1 1.0 0.5 0.9Wheat .2 .1 1.2 .7 1.0 .5 .2 .1Soybeans . . .1 . . . . .Potatoes 2.8 3.2 3.6 4.4 6.3 8.0 7.2 10.8Other Vegetables 12.9 13.1 17.3 18.7 22.3 24.4 25.0 24.4Citrus 2.6 3.6 3.4 3.3 3.6 4.0 4.0 4.0Apples 4.2 4.5 4.4 4.6 4.6 4.6 5.3 6.0Other deciduous 4.1 4.2 4.2 4.2 4.7 4.9 4.6 4.4
Million pounds of other pesticides
Corn . . . . . . . .Cotton 15.2 15.5 15.8 12.7 15.6 19.7 18.7 18.5Wheat . . . . . . . .Soybeans . . . . . . . .Potatoes 35.1 26.2 32.3 39.7 50.6 39.1 36.9 42.0Other vegetables 17.3 18.0 24.2 27.5 34.0 40.6 44.7 43.5Citrus . . . . .1 .2 .6 1.1Apples .1 .1 .1 .1 .1 .1 .1 .1Other deciduous .3 .3 .3 . .7 1.3 3.1 5.0
Million pounds of all pesticide types
Corn 240.7 233.2 245.2 220.5 233.0 201.3 227.7 229.3Cotton 50.9 50.3 57.6 52.3 69.1 83.7 65.6 68.0Wheat 17.8 13.8 19.7 19.1 23.8 21.5 32.9 25.7Soybeans 74.4 70.4 67.8 64.4 69.5 68.7 78.1 84.5Potatoes 43.8 35.6 41.6 50.5 64.2 53.1 49.5 58.5Other vegetables 39.8 40.3 52.8 57.3 68.2 78.0 82.8 80.7Citrus 11.0 13.7 13.5 13.7 13.6 14.0 14.5 15.0Apples 8.3 9.1 8.8 9.3 9.1 9.0 9.7 10.3Other deciduous 10.9 11.1 11.1 11.0 12.9 14.1 14.9 15.9
. = None reported or too little reported to make an estimate.1/ Estimates are constructed for the total U.S. acreage of the selected commodities. In years when the surveys did not include all States pro-ducing the crop, the estimates assume similar use rates for those States.Source: Lin, Biing, M. Padgitt, L., Bull, H. Delvo, D. Shank, and H. Taylor 1995 (prior to 1993); unpublished USDA survey data (following 1993).

Economic Research Service/USDA Production Practices for Major Crops in U.S. Agriculture, 1990-97 ❖ 93
Table B.7—Acres treated with leading pesticide ingredients
All Fall Selected SelectedItem Total Corn Soybean wheat Cotton potatoes vegetables fruit
1,000 acres 2/
Planted area 204,285 62,150 66,215 55,865 13,075 944 2,748 3,001
Herbicides: 1/Atrazine (r) 43,232 42,809 4 100 0 0 319 0Glyphosate 31,634 2,982 18,688 4,632 3,451 46 231 1,6052,4-D 31,438 5,747 5,397 20,113 53 1 28 99Metolachlor 27,659 21,855 4,818 0 622 77 277 0Dicamba 25,872 18,119 6 7,634 112 0 1 0Imazethapyr 25,492 667 24,823 0 0 0 61 2Trifluralin 24,279 336 13,805 2,586 7,104 46 393 9Pendimethalin 21,928 1,564 16,382 0 3,612 246 124 0Acetochlor (r) 14,839 14,839 0 0 0 0 0 0Thifensulfuron 10,907 985 5,658 4,264 0 0 0 0Cyanazine (r) 10,827 8,469 0 1 2,303 0 54 0MCPA 10,108 0 0 10,108 0 0 0 0Fenoxaprop-ethyl 10,051 0 4,144 5895 12 0 0 0Bentazon 9,360 2,110 7,130 0 0 0 120 0Chlorminuron-ethyl 8,882 0 8,882 0 0 0 0 0Imazaquin 8,761 0 8,761 0 0 0 0 0Metribuzin 8,335 356 6,594 663 0 620 102 0Acifluorfen 7,831 0 7,831 0 0 0 0 0Bromoxymil 7,265 4,022 0 3,089 107 0 47 0Tribenuron-methyl 7,166 0 53 7,113 0 0 0 0Nicosulfuron 6,209 6,197 0 0 0 0 12 0Metsulfuron-methyl 6,115 0 0 6,115 0 0 0 0Fluzaifop-butyl 6,043 0 5,272 0 739 0 31 1Alachlor (r) 4,552 2,549 1,890 0 0 0 113 0Chlorsulfuron 3,825 0 0 3,825 0 0 0 0
Insecticides: 1/Chlorpyrifos (r) 6,362 4,356 130 548 551 1 205 572Methyl parathion (r) 5,262 2,316 413 595 1,633 4 85 216Tefluthrin (r) 4,243 4,239 0 0 0 0 4 0Permethrin (r) 3,676 2,932 33 0 30 37 58 62Aldicarb (r) 3,661 0 0 0 3,522 86 0 53Lamdacyhalothrin (r) 3,384 532 204 79 2,380 0 189 0Cyfluthrin (r) 2,690 884 0 0 1,695 0 3 108Terbufos (r) 2,375 2,359 0 0 0 0 16 0Dimethoate 2,064 123 148 1,007 316 101 304 64Carbofuran (r) 2,128 1,451 13 47 351 204 27 36Oxamyl (r) 2,071 0 0 0 1,925 1 82 63Malathion (r) 1,689 0 6 99 1,459 0 33 92Phorate (r) 1,528 368 0 44 899 217 0 0Bt 1,380 515 7 0 274 0 323 261Imidacloprid 1,431 0 0 0 830 159 256 186Acephate 1,509 0 60 0 1,240 0 209 0Chlorethoxyfos (r) 1,178 1,178 0 0 0 0 0 0Azinophos-methyl (r) 1,154 0 0 0 636 75 17 426Dicrotophos (r) 1,060 0 0 0 1,060 0 0 0Abamectin (r) 1,085 0 0 0 481 0 132 4721/ The letter ‘r’ in parentheses identifies ingredients that are restricted-use products. Restrictions may apply to only some formulations of the
ingredient.2/ Area treated one or more times with the ingredient.Sources: USDA, National Agricultural Statistics Service and Economic Research Service, 1996c, 1995d, and 1994.

94 ❖ Production Practices for Major Crops in U.S. Agriculture, 1990-97 Economic Research Service/USDA
Table B.8—Change in pesticide use indicators, by crop and pesticide type, 1990-97
Item Planted Share Avg. treat- Rate Planted Percent No. acres Ratearea treated ments area treated per acre
1,000 ac. Percent No. Lbs/acre —————Index: 1990=100————
Corn (total pesticides):1990 58,800 96.5 2.5 1.42 100 100 100 1001991 60,350 96.8 2.5 1.30 103 100 99 911992 62,850 97.9 2.6 1.21 107 101 103 851993 57,350 98.0 2.7 1.22 98 101 106 861994 62,500 98.4 2.8 1.06 106 102 112 751995 55,850 98.1 2.8 1.04 95 102 112 741996 61,500 98.2 3.0 1.00 105 102 119 711997 62,150 97.4 3.2 .93 106 101 126 66
Soybeans (total pesticides):1990 39,500 96.0 2.3 .61 100 100 100 1001991 42,062 96.9 2.3 .58 107 101 100 941992 41,350 98.3 2.4 .48 105 102 104 781993 42,500 97.6 2.5 .44 108 102 109 721994 43,750 98.5 2.8 .42 111 103 121 691995 45,150 97.7 2.8 .39 114 102 123 631996 45,950 97.5 2.9 .43 116 102 128 691997 49,250 97.7 2.9 .43 125 102 126 71
Cotton (total pesticides):1991 10,860 97.6 6.7 .55 100 100 100 1001992 10,200 98.1 8.2 .52 94 100 123 941993 10,360 98.7 8.8 .50 95 101 133 911994 10,023 98.9 10.7 .49 92 101 161 881995 11,650 99.6 11.0 .48 107 102 165 871996 10,025 96.5 9.2 .51 92 99 138 921997 9,265 99.8 9.1 .53 85 102 136 95
Wheat (total pesticides):1990 52,500 58.7 1.8 .27 100 100 100 1001991 43,450 56.3 2.0 .24 82 96 109 881992 49,950 58.6 1.9 .23 95 100 107 871993 50,450 64.5 2.1 .21 96 110 118 781994 49,450 72.7 2.1 .23 94 124 116 861995 47,540 74.8 2.2 .20 91 127 122 741996 46,160 73.5 2.5 .25 88 125 139 931997 50,700 66.1 2.6 .23 97 113 143 87
Potatoes (total pesticides):1990 605 99.3 5.6 6.85 100 100 100 1001991 620 99.6 5.9 7.35 103 100 104 1071992 586 99.8 6.5 8.44 97 101 115 1231993 616 100.0 6.6 10.32 102 101 116 1511994 640 99.0 8.1 11.99 106 100 144 1751995 625 99.0 9.6 8.91 103 100 170 1301996 641 98.9 9.4 13.37 106 99 167 1951997 609 96.8 12.6 7.9 101 98 223 115
—Continued

Economic Research Service/USDA Production Practices for Major Crops in U.S. Agriculture, 1990-97 ❖ 95
Table B.8—Change in pesticide use indicators, by crop and pesticide type, 1990-97—Continued
Item Planted Share Avg. treat- Percent No. acres Ratearea treated ments Rate Planted area treated per acre
1,000 ac. Percent No. Lbs/acre —————Index: 1990=100————
Herbicides:1990 161,135 82.7 2.2 .92 100 100 100 1001991 157,330 84.7 2.2 .88 98 102 103 951992 164,936 84.5 2.3 .80 102 102 107 861993 161,276 86.6 2.4 .73 100 105 112 791994 166,363 88.8 2.6 .69 103 107 119 741995 160,815 9035 2.6 .63 100 109 120 691996 164,276 89.4 2.7 .66 102 108 127 711997 171,974 87.3 2.8 .63 107 106 130 68
Insecticides:1991 157,330 18.7 1.8 .57 100 100 100 1001992 164,936 16.5 2.3 .48 105 88 131 851993 161,276 15.1 2.6 .47 103 81 148 831994 166,363 17.0 2.8 .44 106 91 158 781995 160,815 16.3 3.5 .38 102 87 197 661996 164,276 19.5 2.2 .43 104 104 123 761997 171,974 17.0 2.3 .48 109 91 129 85
Fungicides:1991 157,330 1.0 1.8 .65 100 100 100 1001992 164,936 1.4 1.8 .64 105 140 100 991993 161,276 1.2 2.0 .67 103 120 114 1041994 166,363 1.1 2.8 .72 106 110 155 1121995 160,815 1.5 2.6 .65 102 150 144 1001996 164,276 1.1 2.7 .65 104 110 154 1001997 171,974 0.9 3.9 .75 109 90 218 115
Other pesticides:1991 157,330 4.1 2.4 2.15 100 100 100 1001992 164,936 3.1 2.3 3.40 105 76 98 1581993 161,276 4.2 2.1 3.36 103 102 90 1561994 166,363 4.2 2.6 3.69 106 102 109 1721995 160,815 4.3 2.6 3.40 102 105 112 1581996 164,276 3.9 2.7 4.98 104 95 115 2311997 171,974 3.9 2.4 3.79 109 95 103 176Source: USDA, National Agricultural Statistics Service and Economic Research Service, 1995c.

96 ❖ Production Practices for Major Crops in U.S. Agriculture, 1990-97 Economic Research Service/USDA
Table B.9—Pesticide application methods used on major field crops, and selected fruits and vegetables, bypesticide type
Ground Aerial Band or Injected AlternateItem broadcast broadcast Chemigation spot treatment into soil row spraying Total
1,000 acre-treatmentsAll pesticide types:
Wheat 64,733 17,906 . 499 603 . 83,741Soybeans 132,492 2,534 37 9,603 1,016 . 145,681Cotton 53,292 47,596 120 18,590 5,513 . 125,112Corn 140,434 6,046 423 21,551 7,196 . 175,651Potatoes 5,586 4,636 1,881 425 309 . 12,837Tomatoes 177 124 0 2,220 65 . 2,586Lettuce 485 1,054 17 100 7 . 1,664Strawberries 125 7 1 301 25 . 459Apples 4,330 103 3 49 . 1,155 5,639Grapes 2,480 90 25 83 . 318 2,996Peaches 3,217 94 0 224 . 987 4,521Oranges 4,582 72 46 303 . 8 5,011Total 411,933 80,261 2,555 53,948 14,735 2,468 565,900
Percent
Share of total 72.8 14.2 .4 9.5 2.6 .4 100
1,000 acre-treatmentsHerbicides:
Wheat 63,286 16,133 . 454 603 . 80,476Soybeans 131,831 2,112 . 9,564 1,016 . 144,523Cotton 20,550 2,015 79 13,053 1,386 . 37,083Corn 136,603 2,083 . 14,582 1,977 . 155,245Potatoes 1,168 201 508 26 27 . 1,931Tomatoes 18 0 . 77 . . 96Lettuce 72 47 . 13 . . 132Strawberries 15 1 . 12 0 . 28Apples 233 3 . 14 . 8 257Grapes 284 1 . 65 . 20 371Peaches 300 7 . 90 . 16 412Oranges 1,937 19 46 231 . 4 2,237Total 356,297 22,621 634 38,182 5,010 48 422,792
Insecticides:Wheat 934 1,137 . 45 . . 2,116Soybeans 583 391 37 39 . . 1,050Cotton 25,735 36,156 41 4,190 2,624 . 68,746Corn 3,725 3,964 423 6,969 5,219 . 20,300Potatoes 998 1,047 168 191 232 . 2,637Tomatoes 72 66 0 873 0 . 1,011Lettuce 353 994 17 64 7 . 1,436Strawberries 57 4 0 94 0 . 155Apples 2,249 35 . 19 . 588 2,891Grapes 212 2 25 15 . 13 267Peaches 1,463 43 0 88 . 483 2,078Oranges 1,845 35 0 21 . . 1,901Total 38,226 43,874 713 12,608 8,083 1,085 104,589
Fungicides:Wheat 513 636 . . . . 1,149Soybeans 77 31 . . . . 108Cotton 42 24 . 542 1,233 . 1,842Corn 106 . . . . . 106Potatoes 2,779 3,227 1,075 168 2 . 7,251Tomatoes 87 58 0 1,267 . . 1,412Lettuce 60 13 . 23 . . 95Strawberries 52 1 1 191 0 . 245See note at end of table —Continued

Economic Research Service/USDA Production Practices for Major Crops in U.S. Agriculture, 1990-97 ❖ 97
Table B.9—Pesticide application methods used on major field crops, and selected fruits and vegetables, bypesticide type–Continued
Ground Aerial Band or Injected AlternateItem broadcast broadcast Chemigation spot treatment into soil row spraying Total
1,000 acre-treatments
Apples 1,466 26 3 11 . 549 2,055Grapes 1,967 78 . 1 . 285 2,332Peaches 1,426 44 . 46 . 486 2,002Oranges 692 14 . 5 . . 710Total 9,267 4,151 1,079 2,254 1,235 1,320 19,307
Other pesticides:Cotton 6,965 9,401 . 805 270 . 17,442Potatoes 641 162 129 39 48 . 1,019Tomatoes 0 . . 2 65 . 67Strawberries 1 1 . 4 25 . 31Apples 382 39 . 6 . 9 436Grapes 17 8 . 1 . . 26Peaches 28 . . 0 . 2 30Oranges 108 4 . 46 . 4 162Total 8,143 9,615 129 903 408 15 19,213. = None reported or insufficient data to develop an estimate.Source: USDA, National Agricultural Statistics Service and Economic Research Service, 1996c, 1995d, and 1994.

98 ❖ Production Practices for Major Crops in U.S. Agriculture, 1990-97 Economic Research Service/USDA
Table B.10—Monoculture and crop rotation systems used in the production of major field crops, 1997
State Area in monoculture system Area in crop rotation
Wheat Soybeans Cotton Corn Potatoes Wheat Soybeans Cotton Corn Potatoes
1,000 acres
AL . . 277 . . . . 258 . .AZ . . 191 . . . . 121 . .AR . 1,348 814 . . . 2,252 74 . .CA . . 359 . . . . 521 . .CO 50 . . . . 2,798 . . . .DE . 1 . . . . 153 . . .GA . . 536 . . . . 904 . .ID 100 . . . 3 770 . . . 384IL 25 112 . 1,151 . 1,122 9,854 . 9,987 .IN . 203 . 317 . . 5,226 . 5,508 .IA . . . 867 . . 10,058 . 11,027 .KS 5,351 446 . . . 5,649 2,004 . . .KY . 96 . . . . 1,177 . . .LA . 347 472 . . . 1,053 158 . .ME . . . . 6 . . . . 62MI . 43 . 709 . . 1,857 . 1,891 .MN . . . 519 1 2,450 6,730 . 6,468 73MS . 1,113 858 . . . 987 127 . .MO 92 876 292 74 . 932 3,988 88 2,849 .MT 178 . . . . 5,622 . . . .NE 105 14 . 4,471 . 1,795 3,455 . 4,451 .NC . 27 323 . . . 1,373 334 . .ND . . . . . 10,231 . . . 120OH 3 343 . 340 . 1,087 4,157 . 3,260 .OK 4,632 . . . . 705 . . . .OR 48 . . . 0 791 . . . 54PA 1 9 . . . 174 356 . . .SC . . 110 . . . . 180 . .SD 154 313 . 219 . 3,394 3,187 . 3,578 .TN . 293 435 . . . 964 49 . .TX 2,468 . 3,213 . . 1,632 . 2,145 . .WA 491 . . . 2 1,609 . . . 116WI . . . 634 . . 1,000 . 3,166 69Total 13,698 5,586 7,882 9,301 12 42,167 60,404 5,198 52,849 932
Percent in monoculture Percent in crop rotations
AL . . 52 . . . . 48 . .AZ . . 61 . . . . 39 . .AR . 37 92 . . . 63 8 . .CA . . 41 . . . . 59 . .CO 2 . . . . 98 . . . .DE . 1 . . . . 99 . . .GA . . 37 . . . . 63 . .ID 12 . . . 1 88 . . . 99IL 2 1 . 10 . 98 99 . 90 .IN . 4 . 5 . . 96 . 95 .IA . . . 7 . . 100 . 93 .KS 49 18 . . . 51 82 . . .See note at end of table —Continued
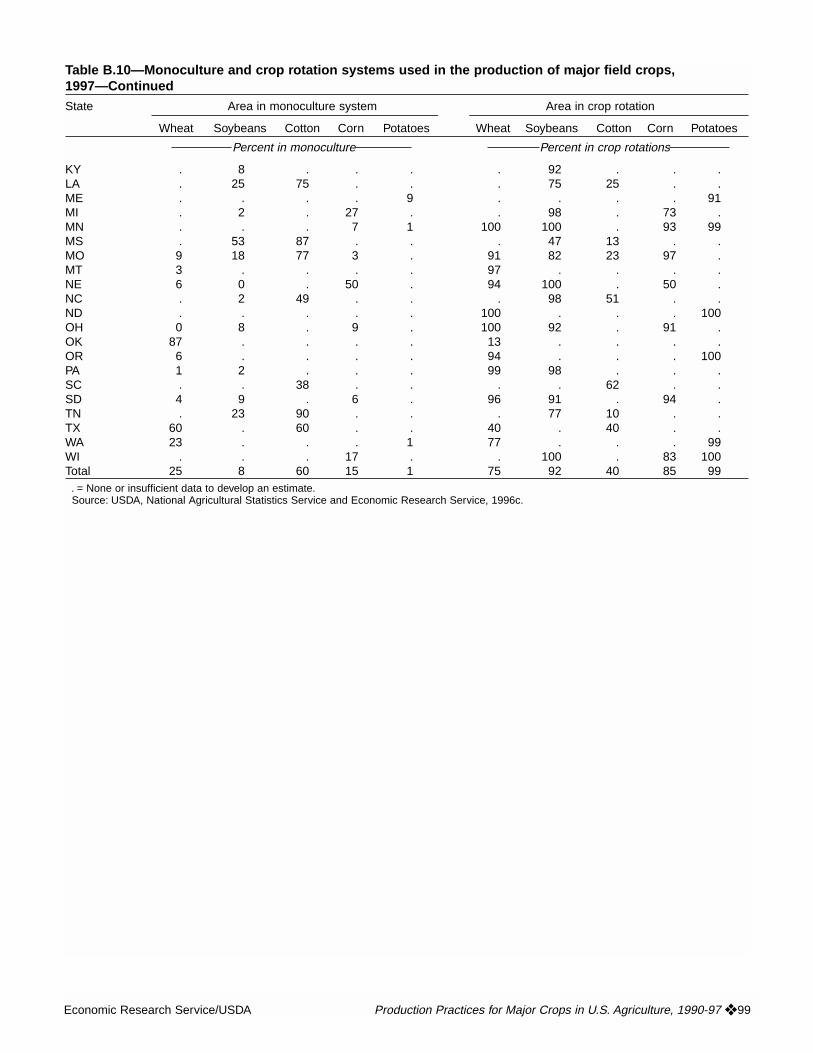
Economic Research Service/USDA Production Practices for Major Crops in U.S. Agriculture, 1990-97 ❖ 99
Table B.10—Monoculture and crop rotation systems used in the production of major field crops,1997—Continued
State Area in monoculture system Area in crop rotation
Wheat Soybeans Cotton Corn Potatoes Wheat Soybeans Cotton Corn Potatoes
Percent in monoculture Percent in crop rotations
KY . 8 . . . . 92 . . .LA . 25 75 . . . 75 25 . .ME . . . . 9 . . . . 91MI . 2 . 27 . . 98 . 73 .MN . . . 7 1 100 100 . 93 99MS . 53 87 . . . 47 13 . .MO 9 18 77 3 . 91 82 23 97 .MT 3 . . . . 97 . . . .NE 6 0 . 50 . 94 100 . 50 .NC . 2 49 . . . 98 51 . .ND . . . . . 100 . . . 100OH 0 8 . 9 . 100 92 . 91 .OK 87 . . . . 13 . . . .OR 6 . . . . 94 . . . 100PA 1 2 . . . 99 98 . . .SC . . 38 . . . . 62 . .SD 4 9 . 6 . 96 91 . 94 .TN . 23 90 . . . 77 10 . .TX 60 . 60 . . 40 . 40 . .WA 23 . . . 1 77 . . . 99WI . . . 17 . . 100 . 83 100Total 25 8 60 15 1 75 92 40 85 99
. = None or insufficient data to develop an estimate.Source: USDA, National Agricultural Statistics Service and Economic Research Service, 1996c.

100 ❖ Production Practices for Major Crops in U.S. Agriculture, 1990-97 Economic Research Service/USDA
Table B.11—Crop rotation systems used in the production of major field crops, 1997
Wheat rotation systems
Continuous Mix of row With WithState Continuous Wheat- small crop and meadow idle Double-
wheat fallow grains small grain crops land cropped Total
1,000 acres
CO 50 2,099 . 614 2 84 . 2,848ID 100 54 275 337 104 . . 870IL 25 5 7 1,053 . . 57 1,147KS 5,351 1,972 1,062 2,158 229 . 228 11,000MN . 121 1,294 1,036 . . . 2,450MO 92 6 . 688 9 . 228 1,024MT 178 3,239 1,658 72 125 527 . 5,800NE 105 727 126 811 131 . . 1,900ND . 1,191 5,456 2,899 184 502 . 10,231OH 3 . 7 995 5 1 79 1,090OK 4,632 58 304 279 3 . 61 5,337OR 48 626 55 86 23 . . 840PA 1 . 6 155 6 1 6 175SD 154 749 583 1,556 295 201 9 3,548TX 2,468 187 135 1,261 45 . 5 4,100WA 491 1,007 202 327 3 70 . 2,100Total 13,698 12,041 11,169 14,326 1,166 1,386 673 54,460
Percent in each rotation
CO 2 74 . 22 0 3 . 100ID 12 6 32 39 12 . . 100IL 2 0 1 92 . . 5 100KS 49 18 10 20 2 . 2 100MN . 5 53 42 . . . 100MO 9 1 . 67 1 . 22 100MT 3 56 29 1 2 9 . 100NE 6 38 7 43 7 . . 100ND . 12 53 28 2 5 . 100OH 0 . 1 91 0 0 7 100OK 87 1 6 5 0 . 1 100OR 6 75 7 10 3 . . 100PA 1 . 3 89 3 1 3 100SD 4 21 16 44 8 6 0 100TX 60 5 3 31 1 . 0 100WA 23 48 10 16 0 3 . 100Total 25 22 21 26 2 3 1 100
See note at end of table —Continued

Economic Research Service/USDA Production Practices for Major Crops in U.S. Agriculture, 1990-97 ❖ 101
Table B.11—Crop rotation systems used in the production of major field crops, 1997–Continued
Soybean rotation systems
Continuous Mix of row With WithContinuous Corn- row crop and meadow idle Double-
State soybeans soybeans crops small grain crops land cropped Total
1,000 acres
CO 50 2,099 . 614 2 84 . 2,848AR 1,348 49 7 1,373 . . 822 3,600DE 1 10 50 . . 3 90 155IL 112 7,755 1,064 . 420 293 322 9,966IN 203 3,854 740 10 86 171 364 5,429IA . 9,126 770 22 100 40 . 10,058KS 446 452 651 16 58 514 313 2,450KY 96 366 237 . 5 119 449 1,273LA 347 90 685 162 . 21 94 1,400MI 43 503 549 12 . 463 329 1,900MN . 4,735 1,135 655 184 21 . 6,730MS 1,113 110 148 321 60 18 330 2,100MO 876 1,420 652 341 64 936 575 4,865NE 14 1,899 1,156 14 42 345 . 3,470NC 27 172 375 3 22 218 582 1,400OH 343 1,441 1,955 5 56 699 . 4,500PA 9 133 131 7 50 25 11 365SD 313 1,627 204 472 18 854 12 3,500TN 293 194 173 . 6 28 564 1,258WI . 411 492 34 56 8 . 1,000Total 5,586 34,347 11,176 3,448 1,226 4,776 4,859 65,418
Percent in each rotation
AR 37 1 0 38 . . 23 100DE 1 7 33 . . 2 58 100IL 1 78 11 . 4 3 3 100IN 4 71 14 0 2 3 7 100IA . 91 8 0 1 0 . 100KS 18 18 27 1 2 21 13 100KY 8 29 19 . 0 9 35 100LA 25 6 49 12 . 1 7 100MI 2 26 29 1 . 24 17 100MN . 70 17 10 3 0 . 100MS 53 5 7 15 3 1 16 100MO 18 29 13 7 1 19 12 100NE 0 55 33 0 1 10 . 100NC 2 12 27 0 2 16 42 100OH 8 32 43 0 1 16 . 100PA 2 36 36 2 14 7 3 100SD 9 46 6 13 1 24 0 100TN 23 15 14 . 0 2 45 100WI . 41 49 3 6 1 . 100Total 9 53 17 5 2 7 7 100See note at end of table. —Continued

102 ❖ Production Practices for Major Crops in U.S. Agriculture, 1990-97 Economic Research Service/USDA
Table B.11—Crop rotation systems used in the production of major field crops, 1997–Continued
Cotton rotation systems
Continuous Mix of row With WithContinuous row crop and meadow idle
State cotton crops small grain crops land Total
1,000 acres
AL 277 207 37 9 6 535AZ 191 26 49 16 30 312AR 814 40 34 . . 888CA 359 219 36 129 136 880GA 536 756 . . 148 1,440LA 472 158 . . 0 630MS 858 106 . . 20 985MO 292 88 . . . 380NC 323 325 5 . 4 657SC 110 130 . 2 48 290TN 435 49 . . . 484TX 3,213 1,820 . 55 270 5,358Total 7,882 3,923 162 210 662 12,839
Percent in each rotation
AL 52 39 7 2 1 100AZ 61 8 16 5 10 100AR 92 5 4 . . 100CA 41 25 4 15 15 100GA 37 53 . . 10 100LA 75 25 . . 0 100MS 87 11 . . 2 100MO 77 23 . . . 100NC 49 49 1 . 1 100SC 38 45 . 1 17 100TN 90 10 . . . 100TX 60 34 . 1 5 100Total 61 31 1 2 5 100
See note at end of table —Continued

Economic Research Service/USDA Production Practices for Major Crops in U.S. Agriculture, 1990-97 ❖ 103
Table B.11—Crop rotation systems used in the production of major field crops, 1997–Continued
Cotton rotation systems
Continuous Mix of row With WithContinuous Corn- row crop and meadow idle
State corn soybeans crops small grain crops land Total
1,000 acres
IL 1,151 7,515 2,182 12 99 178 11,138IN 317 4,031 1,148 1 94 233 5,825IA 867 9,277 884 112 507 246 11,894MI 709 509 645 26 101 610 2,600MN 519 4,712 577 382 554 244 6,988MO 74 987 1,457 12 123 270 2,923NE 4,471 2,414 1,287 10 234 505 8,922OH 340 1,761 623 . 193 682 3,600SD 219 1,807 768 584 90 328 3,797WI 634 1,098 434 19 1,441 173 3,800Total 9,301 34,113 10,006 1,160 3,437 3,470 61,486
Percent in each rotationIL 10 67 20 0 1 2 100IN 5 69 20 0 2 4 100IA 7 78 7 1 4 2 100MI 27 20 25 1 4 23 100MN 7 67 8 5 8 3 100MO 3 34 50 0 4 9 100NE 50 27 14 0 3 6 100OH 9 49 17 . 5 19 100SD 6 48 20 15 2 9 100WI 17 29 11 1 38 5 100Total 15 55 16 2 6 6 100
Potato rotation systems
Continuous Mix of row With WithContinuous row crop and meadow idle
State potatoes crops small grain crops land Total
1,000 acres
ID 3 6 204 21 154 387ME 6 3 49 4 5 68MN 1 10 58 2 3 74ND . 10 70 16 24 120OR 0 6 15 9 25 54WA 2 67 5 19 26 118WI . 48 11 8 3 69Total 12 151 410 79 239 891
Percent in each rotationID 1 1 53 5 40 100ME 9 5 73 6 7 100MN 1 14 78 3 4 100ND . 9 58 13 20 100OR 0 11 27 16 46 100WA 1 57 4 16 22 100WI . 70 15 11 4 100Total 1 17 46 9 27 100
. = None reported or insufficient data available to make an estimate.Source: USDA, National Agricultural Statistics Service and Economic Research Service, 1996c.

104 ❖ Production Practices for Major Crops in U.S. Agriculture, 1990-97 Economic Research Service/USDA
Electronic Data FilesThe production practices for major crops have also been tabulated for the major productionStates. The tables for State estimates are available from the ERS home page: “http://www.ers.usda.gov.”
E1a . . . . . . . . . . . . . . . . . . . . . . . Winter wheat fertilizer statistics and nutrient management, by State, 1995
E1b . . . . . . . . . . . . . . . . . . . . . . . . . . . Soybean fertilizer statistics and nutrient management, by State, 1995
E1c . . . . . . . . . . . . . . . . . . . . . . . . . . . . Cotton fertilizer statistics and nutrient management, by State, 1995
E1d . . . . . . . . . . . . . . . . . . . . . . . . . . . . . Corn fertilizer statistics and nutrient management, by State, 1995
E1e . . . . . . . . . . . . . . Spring and durum wheat fertilizer statistics and nutrient management, by State, 1995
E1f . . . . . . . . . . . . . . . . . . . . . . . . . Fall potato fertilizer statistics and nutrient management, by State, 1995
E2a . . . . . . . . . . . . . . . . . . . . . . . . . . . . . . . . . . . . . . . . . .Wheat pest management practices, by State, 1995
E2b . . . . . . . . . . . . . . . . . . . . . . . . . . . . . . . . . . . . . . . . Soybean pest management practices, by State, 1995
E2c . . . . . . . . . . . . . . . . . . . . . . . . . . . . . . . . . . . . . . . . . Cotton pest management practices, by State, 1995
E2d . . . . . . . . . . . . . . . . . . . . . . . . . . . . . . . . . . . . . . . . . . Corn pest management practices, by State, 1995
E2e . . . . . . . . . . . . . . . . . . . . . . . . . . . . . . . . . . . . . . Fall potato pest management practices, by State, 1995
E2f . . . . . . . . . . . . . . . . . . . . . . . . . . . . . . . . . . . . . . . . . . Apple pest management practices, by State, 1993
E2g . . . . . . . . . . . . . . . . . . . . . . . . . . . . . . . . . . . . . . . . . Grape pest management practices, by State, 1993
E2h . . . . . . . . . . . . . . . . . . . . . . . . . . . . . . . . . . . . . . . . . . Peach pest management practices, by State, 1995
E2i . . . . . . . . . . . . . . . . . . . . . . . . . . . . . . . . . . . . . . . . . Lettuce pest management practices, by State, 1994
E2j . . . . . . . . . . . . . . . . . . . . . . . . . . . . . . . . . . . . . . . . .Tomato pest management practices, by State, 1994
E2l . . . . . . . . . . . . . . . . . . . . . . . . . . . . . . . . . . . . . . Strawberry pest management practices, by State, 1994
E2l . . . . . . . . . . . . . . . . . . . . . . . . . . . . . . . . . . . . . . . . . Orange pest management practices, by State, 1993
E3a . . . . . . . . . . . . . . . . . . . . . . . . . . . . . . . . . . . . . . . . . . . . . Wheat pesticide use statistics, by State, 1995
E3a . . . . . . . . . . . . . . . . . . . . . . . . . . . . . . . . . . . . . . . . . . . Soybean pesticide use statistics, by State, 1995
E3a . . . . . . . . . . . . . . . . . . . . . . . . . . . . . . . . . . . . . . . . . . . . . Cotton pesticide use statistics, by State, 1995
E3a . . . . . . . . . . . . . . . . . . . . . . . . . . . . . . . . . . . . . . . . . . . . . . Corn pesticide use statistics, by State, 1995
E3a . . . . . . . . . . . . . . . . . . . . . . . . . . . . . . . . . . . . . . . . . . Fall potato pesticide use statistics, by State, 1995
E4a . . . . . . . . . . . . . . . . . . . . . . . . Chemical use and cropping practices on wheat, by tillage systems, 1995
E4b . . . . . . . . . . . . . . . . . . . . . . Chemical use and cropping practices on soybeans, by tillage systems, 1995
E4c . . . . . . . . . . . . . . . . . . . . . . . . Chemical use and cropping practices on cotton, by tillage systems, 1995
E4d . . . . . . . . . . . . . . . . . . . . . . . . . Chemical use and cropping practices on corn, by tillage systems, 1995
E5a . . . . . . . . . . . . . . . . . . . . . . . . . . Chemical use and cropping practices on wheat, by crop rotation, 1995
E5b . . . . . . . . . . . . . . . . . . . . . . . Chemical use and cropping practices on soybeans, by crop rotation, 1995
E5c . . . . . . . . . . . . . . . . . . . . . . . . . Chemical use and cropping practices on cotton, by crop rotation, 1995
E5d . . . . . . . . . . . . . . . . . . . . . . . . . . . Chemical use and cropping practices on corn, by crop rotation, 1995