Embed Size (px)
Citation preview
United States Department of Agriculture
Forest Service
Pacific Southwest Forest and Range Experiment Station
General Technical Report PSW-62
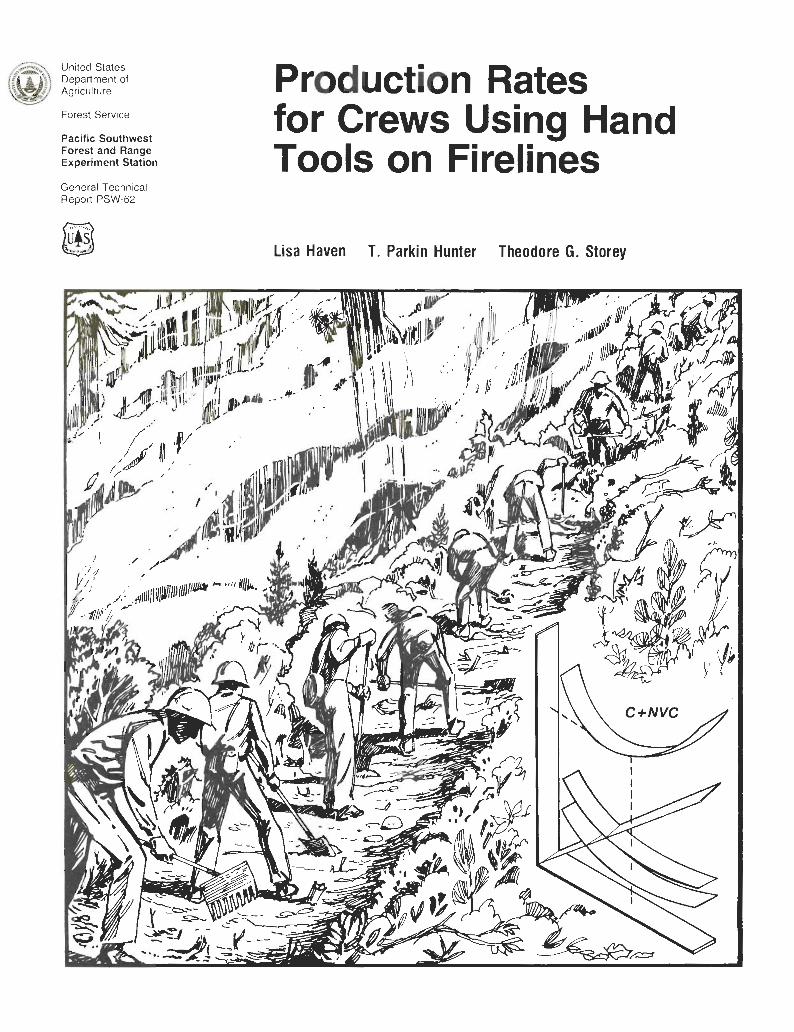
Production Rates for Crews Using Hand Tools on Firelines
Lisa Haven T. Parkin Hunter Theodore G. Storey
The Authors
at the time of the study reported herein were assigned to the Station's f i e management planning and economics research unit, headquartered at the Forest Fire Laboratory, River- side, Calif. LISA HAVEN, a forester with the unit, attended Colorado State University, where she received a bachelor's degree in natural resources management (1978) and a master's degree in forest economics (1981). T. PARKIN HUNTER, a forest economist with the unit, earned bachelor's degrees in economics at the University of the South (1973) and in forestry at North Carolina State University (1975). where he also received a doctorate in forestry and economics (1980). THEODORE G. STOREY, until his retirement in 1980, was a research forester with the unit. Heis aforestry graduate (1948)of the University of California, Berkeley.
Haven, Lisa; Hunter, T. Parkin; Storey, Theodore G. Production rates for crews using hand toolson firelines. Gen. Tech. Rep. PSW-62. Berkeley, CA: Pacific Southwest Forest and Range Experiment Station, Forest Service, U.S. Department of Agriculture; 1982. 8 p. Reported rates at which hand crews construct fmlines can vary widely because of differences in
fuels, fire and measurement conditions, and fuel resistance-to-control classification schemes. Real-time fire dispatching and f i e simulation planning models, however, require accurate esti- mates of hand crew productivity. Errors in estimating rate of fireline production affect estimates of fire size in simulation models predicting fire suppression effectiveness. Productivity rates, there- fore, are crucial for such models and the high variability makes choices difficult. Studies of crews using hand tools to build firelines were compared. Wide variations in construction rates were found. The results suggest the need for future productivity studies to standardize procedures and to develop resistance-to-control classifications that can be identified with field measurements. Approaches showing the most promise are those that measure probability distributions of productivity. Retrieval Terms: hand crews, initial attack simulation, fireline, resistance-to-control, fuels
Publisher:
Pacific Southwest Forest and Range Experiment Station P.O. Box 245, Berkeley, California 94701 Publisher:
December 1982
Production Rates for Crews Using Hand Tools on Firelines Lisa Haven T. Parkin Hunter Theodore G. Storey
CONTENTS
Introduction
Methods . . . . . . .
Data Collection . . . . . . . . . . . . . . . .
Fuel Resistance-to-control Classes . . .
Data Standardization . . . . . . . . . . .
Results . . . . . . . . . . . . . . . . . . . . Rates of Fireline Construction . . . . . . . . . . Fire Size and Line Construction Rates . . .
Summary and Conclusions . . . . . . . . . .
Appendix . . . . . . . . . . . . . . .
References . .

Table I-Production rates of handcrews in building firelines, by fuel type, and crew experience
Region
Rate of line construction
(RLC)'
Low resistance-to-control fuels 2 0.15 to 1.50 6
1.96 to 3.30 4 2 .63 to .72 2
1.00 to 2.70 5 1 3.00 to 7.00 2
1.14 to 6.00 2 .40 1
3.75 to 4.97 2 4.35 1
Northern (I) 0.77 Many 2.44 N.D.
.66 Many 1.63 Many 5.00 N.D. 3.57 N.D. .40 Many
4.36 N.D. 4.35 N.D.
Samples
Rocky Mountain (2)
Southwestern (3) Intermountain (4) Pacific
Southwest (5) Pacific
Northwest (6) Southern (8) Eastern (9) Alaska (10)
Classes2
3.01 N.D. 3.90 Few1N.D. 4.00 N.D.
Class range
Medium resistance-to-control fuels 2 0.15 to 0.80 6
1.00 to 2.00 5 .20 to 0.35 4
2.00 1 4.00 1
.20 to 3.00 2
.28 to 0.83 5 3.18 1
.32 to 0.55 3 3.15 1
1 1.51t03.00 2 1 2.10t02.70 2 1 1.30 1
Class mean
Samples in each class
0.51 Many 1.40 N.D. .28 Many
2.00 N.D. 4.00 N.D. 1.60 N.D. .52 Many
3.18 N.D. .44 Many
3.15 N.D. 2.26 N.D. 2.40 N.D./few 1.30 N.D.
High resistance-to-control fuels 2 0.05 to .39 7
.45 to 3 0 4
.I5 to .30 4 1.00 to 2.70 5
.20 1 1.40 1
.I4 to 1.20 2
.I2 to .23 3
.51 to 1.26 4 .23 1
1.20 1 .76 to 1.50 2
1.30 to 1.40 2 .70 1
Observations in each sample)
0.25 Many .59 N.D. .23 Many
1.92 Many .20 N.D.
1.40 N.D. .67 N.D. .I8 Many .86 N.D. .23 Many
1.20 Few 1.13 N.D. 1.35 Few1N.D. .70 N.D.
Fireline exper- type4 - 1 ience* crew
Extreme resistance-to-control fuels 2 0.02to0.19 6
.20 to .25 3 2 .05 to .20 4
.60 to 1.30 4 1 .08 1 2 .20 to .35 3
.52 to .55 2 1 .25 to .46 2 1 .75 1 1 .68 to 1.00 2
0.10 Many .23 N.D. .I3 Many .95 Many .08 N.D. .26 Many .54 N.D. .36 N.D./many .75 N.D. 3 4 Few1N.D.
1 1 .40 1 .40 N.D. C 1 'Rate of fireline construction (RLC) was measured in lineal chains of fireline per person per hour. *The classes refer to the number of distinct line construction rate changes classified by different studies under the same overall
resistance-to-control class. 3RLC study results were based on few-many observations, where few = 1-9; many = 10-100. Often, however, the observations in
each sample were not designated (N.D.). 4Fireline was either constructed (C) or constructed and held (CH). 5IE = Inexperienced fireline crews; E =experienced crews that may include smokejumpers.
I ncreasing costs of fire suppression have intensified the need to reevaluate all fire management practices to ensure that
they are economically effective. One suppression activity, that of surrounding and containing a fire by building a fireline, has been studied in terms of rate of construction.
Estimates of fieline construction rates are used for real-time fire dispatching and in f i e simulation planning models. The accuracy required for construction rate estimates depends on the purposes for which they are used. But because of differ- ences in fuels, fire and management conditions, and fuel resistance-to-control classes, construction rate accuracy is dif- ficult to obtain. And, because errors in construction rate esti- mates greatly affect estimates of fire size for simulation mod- els of fire suppression effectiveness, accurate construction rates are crucial.
Fireline construction rates, however, have been found to vary by as much as 500 percent (Hanson and Abell 1941; Matthews 1940; Pirsko 1966; Stevenson 1951; U.S. Dep. Agric., Forest Serv. 1957, 1961, 1962, 1963, 1965a, 1965b, 1966a, 1966b, 1972a, 1972b, 1973, 1974). Such variability confounds even basic assessments and comparisons of sup- pression resource capabilities (Murphy and Quintilio 1978, Rarnberg 1974, Storey 1969). The problem is accentuated when alternative suppression strategies are intensively analyzed by mathematical models.(Davis and Irwin 1976; McMasters 1963, 1966; Parks and Jewel1 1962; Quintilio and Anderson 1976; Simard and others 1978; Swersey 1963). Consequently, management decisions and justifications for fire suppression budgets are severely hindered at a time of increasing concern that costs of some suppressi~n efforts may outweigh resultant benefits. Before current information on fireline construction rates from different studies can be reliably integrated into any mathematical analysis, additional informa- tion is needed as to what factors affect the high variability of construction rates.
This paper reports a comparison analysis of data on con- struction rates of crews using hand tools on firelines, and addresses the need for accurate production rates with a simple model for sensitivity analysis.
METHODS
Data Collection
Our compilation of line production rate data relied on the bibliography of Storey (1969) (table 1) and a current literature
survey for studies after 1969. Although some works may have been overlooked, it is unlikely that additional studies would reduce the uncertainties involved with use of existing rate-of- line construction (RLC) estimates.
Fuel Resistance-to-control Classes
All production studies reviewed noted the general type of fuels in which firelines were constructed. Because certain fuels impede fireline construction more than others, fireline production rates vary among fuels. Grouping fuels into resistance-to-control classes (RTCC) has been the traditional means of classifying and comparing line construction rates. The RTCC broadly assesses the fuel size and structure so that the fireline construction job can be stratified by level of diffi- culty. Although the concept of resistance-to-control is the same in all Forest Service regions, standards for applying the classification system are needed.
A fuel's resistance-to-control rating-low, medium, high, or extreme-is determined by the rate at which fireline can be built in the fuel type. Specifically, RTCC is determined by dividing the relevant range of fireline production rates into four intervals and then classifying fuels by the interval into which they fall. Although this classification scheme is used by most Forest Service regions, it is inconsistently applied be- cause of the lack of production rate range standardization between fireline production studies and throughout Forest Service regions. Much of the production range variability results from differences in fuels within each RTCC.
U. S. Department of Agriculture Forest Service Fireline Notebooks (U.S. Dep. Agric., Forest Serv. 1957,1961,1962, 1963, 1965a, 1965b, 1966a, 1966b, 1972a, 1972b, 1973, 1974) classify fuel type information by RTCC's for all Forest Service regions, except the Pacific Southwest and Pacific Northwest Regions. These two regions do not delineate RTCC's; they simply record fireline production information for each fuel type. Storey (1969) and Lindquist (1970) extrapo- lated on information from the Fireline Handbook by categoriz- ing production rates given by fuel type into resistance-to- control classes.
To consistently interpret production rates for each RTCC, a description of fuel types within each RTCC must be known. Fuel type information rated by resistance-to-control class is listed in table 3 (Appendix) for all Forest Service regions, except the Pacific Northwest and Pacific Southwest. Prod- uctivity rates for specific fuel types in these Regions are summarized in table 4 (Appendix).
An exception to the ad hoc determination of resistance-to- control is the procedure developed by Murphy and Quintilio
(1978). They quantitatively developed a fuel resistance-to- control classification by measuring the relative difficulty of clearing trees, clearing small trees and brush, building line through deadfall and slash, trenching, and building on slopes. Fuel can be given relative resistance-to-control rankings by measuring different associated stand variables.
Data Standardization
Production information from all sources was compared. Standard analysis of variance techniques could not be applied to the data because of the relatively small information base and wide range of possible influential variables. Instead, a classifi- cation scheme was developed to isolate and reduce possible sources of variability. Conclusions were drawn on the basis of simplified comparisons of point estimates. The data were inadequate for any further forms of analysis.
The data were grouped according to Forest Service region and RTCC. This grouping eliminated much of the variability resulting from different RTCC fuel classification schemes among regions. When only one production rate was given, it was recorded in the medium RTCC, unless otherwise specified. If three fuel classes were delineated, the production information was tallied in the low, medium, and high RTCC's.
All production information was standardized into similar units of production and conditions of measurement. Most studies recorded fireline production rates in lineal chains of fireline constructed per hour per person. When production rates were not recorded in these units, the rates reported in the studies were converted back to a per person and per chain basis. If, for example, a production rate was recorded as 165 ft per hour per person, it was converted to 2.5 chains per hour per person. If a production rate was recorded as 5 chains per 10 hours per person, it was converted to 0.5 chains per hour per person. If a production rate was recorded as 3 chains per hour per 3-person crew, it was converted into 1 chain per hour per person. The conversions ignore the possibility that the work produced by many individuals together is different from the total work of each individual working separately. The rate in these situations is the average rate per person for an interacting crew.
Some studies recorded production for a long period of time (Lindquist 1970; U.S. Dep. Agric., Forest Serv. 1980) to account for diminishing productivity as the work shift pro; gressed; that is, fatigue allowance. When fatigue factors were given, their influence was incorporated as the average produc- tion rate for the time period reported.
Some studies measured production as a forward rate of progress with a stated or assumed fireline width (Hanson and Abell 1941; Pirsko 1966; Steele 1961; U.S. Dep. Agric., Forest Serv. 1957, 1961, 1962, 1963, 1965a, 1965b, 1966a, 1966b, 1972a, 1972b, 1973, 1974). Other studies measured production in areal units of fireline constructed (Lindquist 1970). To make production rates comparable, author- specified conversions were used to convert fireline area mea- surements to lineal measurements. If no width was recorded in
the study, the standard U.S. Department of Agriculture Forest Service fieline widths were used (Lindquist 1970).
The widths used to convert lineal-to area measures were 2.5 ft for light fuels, 3.5 ft for medium brush, 5.0 ft for heavy brush, and 6.0 ft for heaviest brush. The four categories listed were assumed to conform to low, medium, high, and extreme resistance-to-control classes.
For each region, the production data within each RTCC was ordinally ranked and inspected for trends by type of fireline, worker characteristics, and conditions of measurement. The resulting production rates were grouped according to study characteristics (table I). Characteristics common to most studies were experience of the crew, number of observations used to estimate production, and quality of fireline production.
Crew experience was normally denoted by smokechasers and smokejumpers, high proficiency crew, medium profi- ciency crew, low proficiency crew, general crew, pickup firefighters, and trained or untrained woodsworkers. Charac- terizations classed as inexperienced were pickup firefighters, untrained woodsworkers, general crew, and low proficiency crew. Characterizations classed as experienced were smokechasers, smokejumpers, high proficiency crew, medium proficiency crew, and trained woodsworkers. Forest Service silviculture or inventory crews are sometimes called upon to assist in initial attack operations. Such crews are often classified as general handcrews. Although these crews have been instructed in fifefighting techniques, their on-fire experi- ence is infrequent. Because the term "general crew" has many interpretations, it was included in the inexperienced category.
RESULTS
Rates of Fireline Construction
The RLC estimates included in this report are based on many observations (10 to loo), few observations (1 to 9), or a nondesignated number of observations. Low production rates frequently resulted from studies that used large sample sizes; high production rates resulted from studies that used small or undesignated sample sizes.
Production rates should logically be greater for experienced as opposed to inexperienced hand crews. No consistent ten- dencies were found, however, when production rate was com- pared to level of crew experience.
The production rate results were not an obvious function of quality of fireline production. Some production rates only described constructed fireline (Biddison 1980; Buck 1938; Matthews 1940; Stevenson 1951; U.S. Dep. Agric., Forest Serv. 1966b); others described fireline constructed and held (Hanson and Abell 1941; U.S. Dep. Agric., Forest Serv. 1964, 1965a). No differences in rates of fireline constructed as against fireline constructed and held were apparent. A better indicator of fireline quality might be the width of fireline;
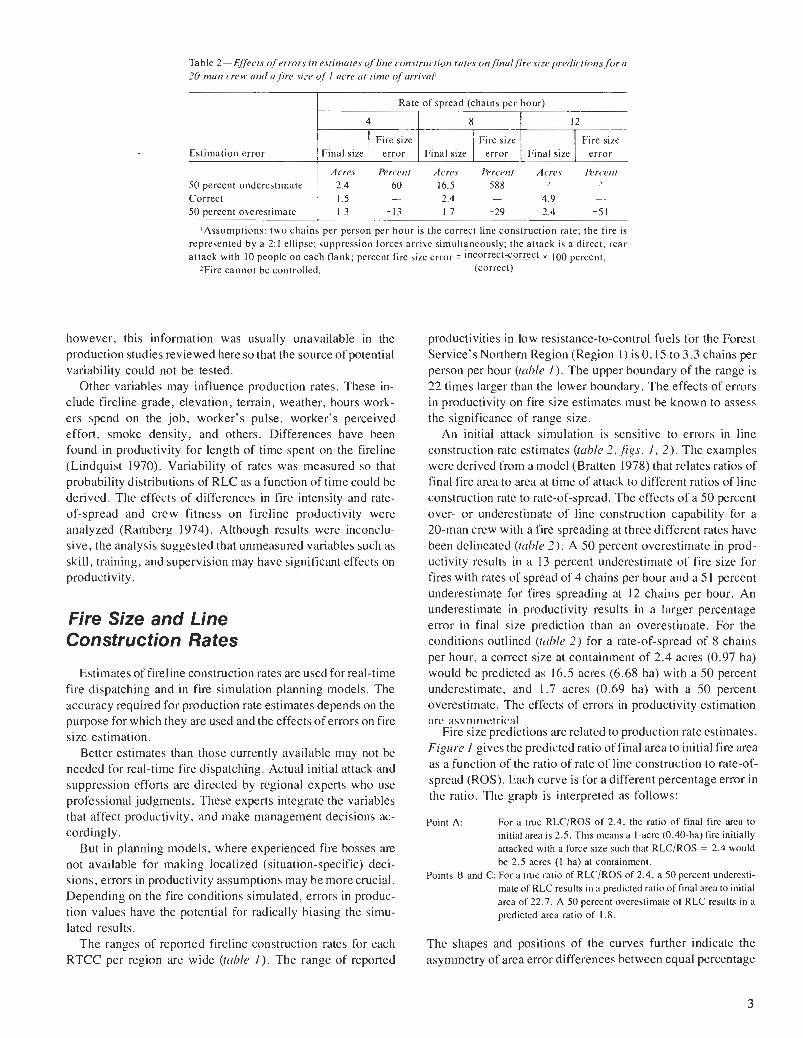
Table 2-Effects of errors in estimates of line construction rates onfinalfire size predictions for a 20-man crew and afire size of I acre at time of arrival'
Rate of spread (chains per hour)
4
( Fire size
however, this information was usually unavailable in the production studies reviewed here so that the source of potential variability could not be tested.
Other variables may influence production rates. These in- clude fireline grade, elevation, terrain, weather, hours work- ers spend on the job, worker's pulse, worker's perceived effort, smoke density, and others. Differences have been found in productivity for length of time spent on the fireline (Lindquist 1970). Variability of rates was measured so that probability distributions of RLC as a function of time could be derived. The effects of differences in fire intensity and rate- of-spread and crew fitness on fireline productivity were analyzed (Ramberg 1974). Although results were inconclu- sive, the analysis suggested that unmeasured variables such as skill, training, and supervision may have significant effects on productivity.
Estimation error
50 percent underestimate Correct 50 percent overestimate
Fire Size and Line Construction Rates
8
Fire size
Estimates of fireline construction rates are used for real-time fire dispatching and in fire simulation planning models. The accuracy required for production rate estimates depends on the purpose for which they are used and the effects of errors on fire size estimation.
Better estimates than those currently available may not be needed for real-time fire dispatching. Actual initial attack and suppression efforts are directed by regional experts who use professional judgments. These experts integrate the variables that affect productivity, and make management decisions ac- cordingly.
But in planning models, where experienced fire bosses are not available for making localized (situation-specific) deci- sions, errors in productivity assumptions may be more crucial. Depending on the fire conditions simulated, errors in produc- tion values have the potential for radically biasing the simu- lated results.
The ranges of reported fireline construction rates for each RTCC per region are wide (table I). The range of reported
12
Fire size
lAssumptions: two chains per person per hour is the correct line construction rate; the fire is represented by a 2:1 ellipse; suppression forces arrive simultaneously; the attack is a direct, rear attack with 10 people on each flank; percent fire size error = inco"ect-correct x 100 percent.
2Fire cannot be controlled. (correct)
Final size 1 error 1 Final size 1 error 1 Final size
productivities in low resistance-to-control fuels for the Forest Service's Northern Region (Region 1) is 0.15 to 3.3 chains per person per hour (table 1). The upper boundary of the range is 22 times larger than the lower boundary. The effects of errors in productivity on f i e size estimates must be known to assess the significance of range size.
An initial attack simulation is sensitive to errors in line construction rate estimates (table 2, figs. 1, 2). The examples were derived from a model (Bratten 1978) that relates ratios of final fire area to area at time of attack to different ratios of line construction rate to rate-of-spread. The effects of a 50 percent over- or underestimate of line construction capability for a 20-man crew with a fire spreading at three different rates have been delineated (table 2). A 50 percent overestimate in prod- uctivity results in a 13 percent underestimate of fire size for fires with rates of spread of 4 chains per hour and a 5 1 percent underestimate for f ies spreading at 12 chains per hour. An underestimate in productivity results in a larger percentage error in final size prediction than an overestimate. For the conditions outlined (table 2) for a rate-of-spread of 8 chains per hour, a correct size at containment of 2.4 acres (0.97 ha) would be predicted as 16.5 acres (6.68 ha) with a 50 percent underestimate, and 1.7 acres (0.69 ha) with a 50 percent overestimate. The effects of errors in productivity estimation are asvmmetrical
Fire size predictions are related to production rate estimates. Figure 1 gives the predicted ratio of final area to initial fire area as a function of the ratio of rate of line construction to rate-of- spread (ROS). Each curve is for a different percentage error in the ratio. The graph is interpreted as follows:
error
Point A:
Acres Percent Acres Percenr Acres Percent 2.4 60 16.5 588 2 2
1.5 - 2.4 - 4.9 -
1.3 -13 1.7 -29 2.4 -5 1
For a true RLCIROS of 2.4, the ratio of final f i e area to initial area is 2.5. This means a 1-acre (0.40-ha) fire initially attacked with a force size such that RLClROS = 2.4 would be 2.5 acres (1 ha) at containment.
Points B and C: For a true ratio of RLClROS of 2.4, a 50 percent underesti- mate of RLC results in a predicted ratio of final area to initial area of 22.7. A 50 percent overestimate of RLC results in a predicted area ratio of 1.8.
The shapes and positions of the curves further indicate the asymmetry of area error differences between equal percentage
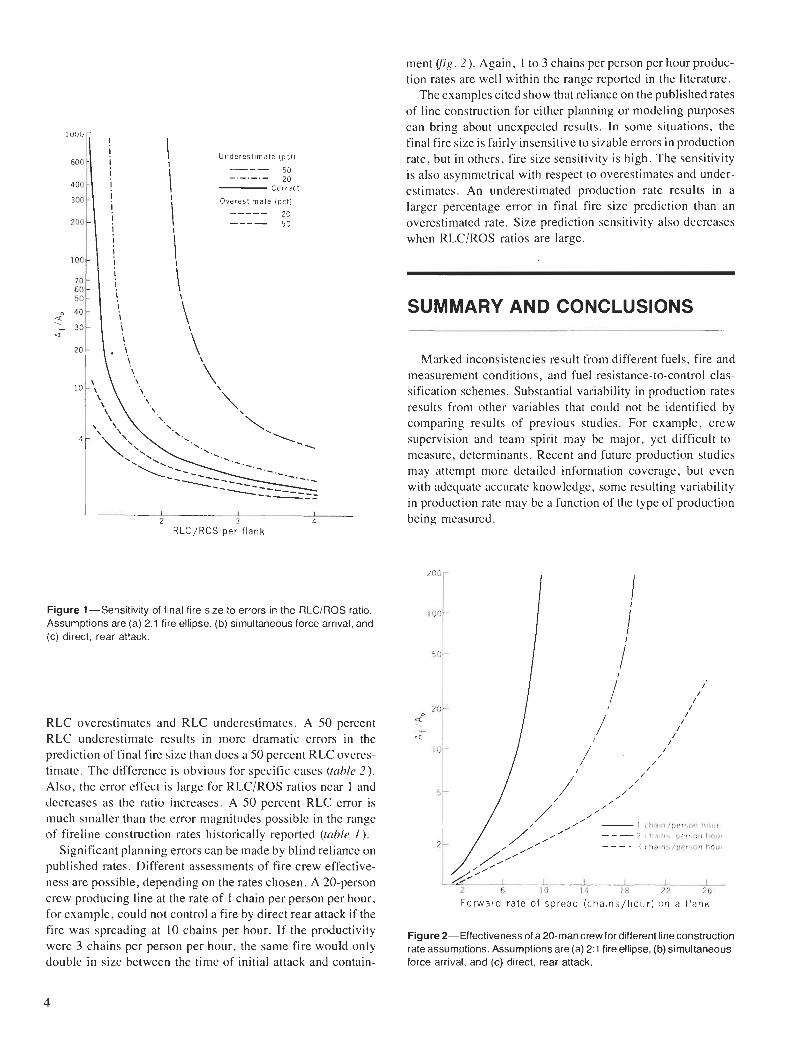
Underestimate (pct)
- . - . - . - 50 20
Correct
Overestimate (pct) ----- 20 ---- 5'
I I I I
2 3 4 RLC/ROS per flank
Figure 1-Sensitivity of final fire size to errors in the RLCIROS ratio. Assumptions are (a) 2:l fire ellipse, (b) simultaneous force arrival, and (c) direct, rear attack.
RLC overestimates and RLC underestimates. A 50 percent RLC underestimate results in more dramatic errors in the prediction of final fire size than does a 50 percent RLC overes- timate. The difference is obvious for specific cases (table 2). Also, the error effect is large for RLC/ROS ratios near 1 and decreases as the ratio increases. A 50 percent RLC error is much smaller than the error magnitudes possible in the range of fireline construction rates historically reported (table 1 ).
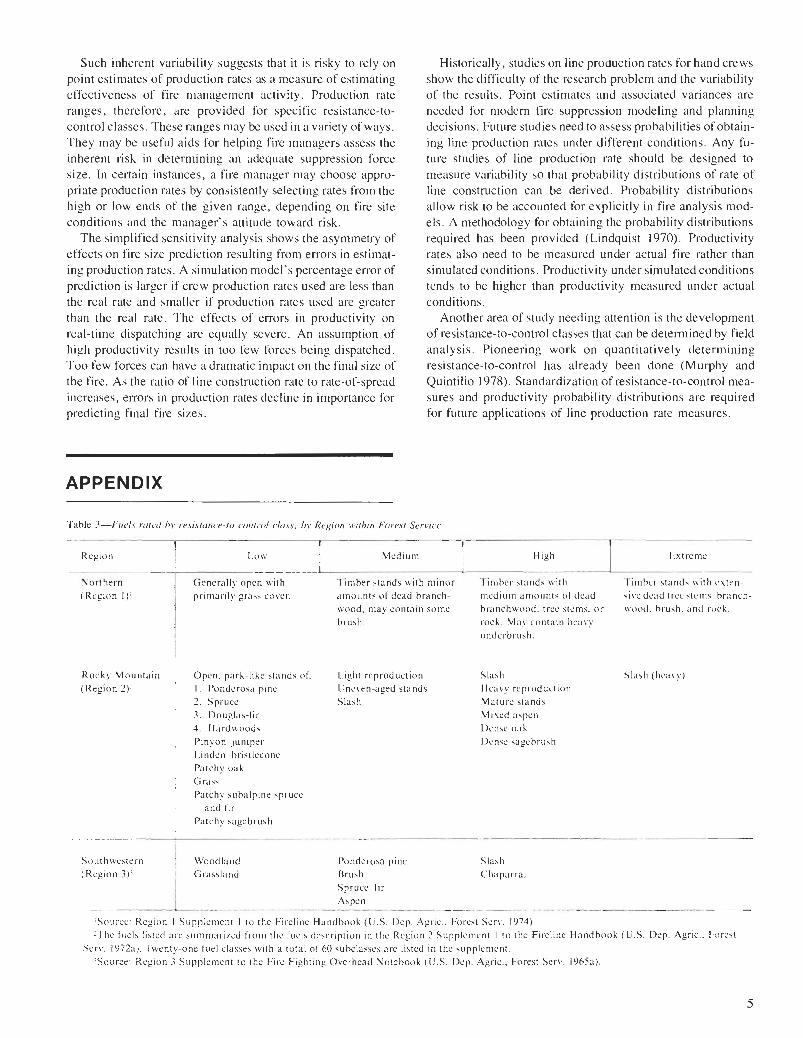
Significant planning errors can be made by blind reliance on published rates. Different assessments of fire crew effective- ness are possible, depending on the rates chosen. A 20-person crew producing line at the rate of 1 chain per person per hour, for example, could not control a fire by direct rear attack if the fire was spreading at 10 chains per hour. If the productivity were 3 chains per person per hour, the same fire would only double in size between the time of initial attack and contain-
ment fig. 2). Again, 1 to 3 chains per person per hour produc- tion rates are well within the range reported in the literature.
The examples cited show that reliance on the published rates of line construction for either planning or modeling purposes can bring about unexpected results. In some situations, the final fire size is fairly insensitive to sizable errors in production rate, but in others, fire size sensitivity is high. The sensitivity is also asymmetrical with respect to overestimates and under- estimates. An underestimated production rate results in a larger percentage error in final fire size prediction than an overestimated rate. Size prediction sensitivity also decreases when RLCIROS ratios are large.
SUMMARY AND CONCLUSIONS
Marked inconsistencies result from different fuels, fire and measurement conditions, and fuel resistance-to-control clas- sification schemes. Substantial variability in production rates results from other variables that could not be identified by comparing results of previous studies. For example, crew supervision and team spirit may be major, yet difficult-to- measure, determinants. Recent and future production studies may attempt more detailed information coverage, but even with adequate accurate knowledge, some resulting variability in production rate may be a function of the type of production being measured.
/' - 1 chaln/person hour 2 cha~ns /pe rson hou r
---- 3 cha~ns /pe rson hou r
I I I 2 6 10 1 4 18 2 2 2 6
Forward rate o f spread (chains/hour) on a flank
Figure 2-Effectiveness of a 20-man crew for different line construction rate assumptions. Assumptions are (a) 2:1 fire ellipse, (b) simultaneous force arrival, and (c) direct, rear attack.
Such inherent variability suggests that it is risky to rely on point estimates of production rates as a measure of estimating effectiveness of fire management activity. Production rate ranges, therefore, are provided for specific resistance-to- control classes. These ranges may be used in a variety of ways. They may be useful aids for helping fire managers assess the inherent risk in determining an adequate suppression force size. In certain instances, a fire manager may choose appro- priate production rates by consistently selecting rates from the high or low ends of the given range, depending on fire site conditions and the manager's attitude toward risk.
The simplified sensitivity analysis shows the asymmetry of effects on fire size prediction resulting from errors in estimat- ing production rates. A simulation model's percentage error of prediction is larger if crew production rates used are less than the real rate and smaller if production rates used are greater than the real rate. The effects of errors in productivity on real-time dispatching are equally severe. An assumption of high productivity results in too few forces being dispatched. Too few forces can have a dramatic impact on the final size of the fire. As the ratio of line construction rate to rate-of-spread increases, errors in production rates decline in importance for predicting final fire sizes.
Historically, studies on line production rates for hand crews show the difficulty of the research problem and the variability of the results. Point estimates and associated variances are needed for modem fire suppression modeling and planning decisions. Future studies need to assess probabilities of obtain- ing line production rates under different conditions. Any fu- ture studies of line production rate should be designed to measure variability so that probability distributions of rate of line construction can be derived. Probability distributions allow risk to be accounted for explicitly in fire analysis mod- els. A methodology for obtaining the probability distributions required has been provided (Lindquist 1970). Productivity rates also need to be measured under actual fire rather than simulated conditions. Productivity under simulated conditions tends to be higher than productivity measured under actual conditions.
Another area of study needing attention is the development of resistance-to-control classes that can be determined by field analysis. Pioneering work on quantitatively determining resistance-to-control has already been done (Murphy and Quintilio 1978). Standardization of resistance-to-control mea- sures and productivity probability distributions are required for future applications of line production rate measures.
APPENDIX
Northern (Region I)'
I i 1
Table 3-Fuels rated by rec~~tance-to-control class, by Region withrn Forest Service
Rocky Mountain (Region 2)*
Reglon Low
Generally open with primarily grass cover.
Open, park-like stands of: I. Ponderosa pine 2. Spruce 3. Douglas-fir 4. Hardwoods Pinyon-juniper Linden-bristlecone Patchy oak Grass Patchy subalpine spruce
and fir Patchy sagebrush
-
M e d ~ u m Hlgh
I
Southwestern I Woodland (Region 3)3
i Grassland
Extreme
Timber stands with minor Timber stands with Timber stands with exten- amounts of dead branch- medium amounts of dead sive dead tree stems. branch- wood, may contain some branchwood, tree stems, or wood. brush, and rock. brush. rock. May contain heavy
underbrush.
Light reproduction Uneven-aged stands Slash
Slash Heavy reproduction Mature stands Mixed aspen Dense oak Dense sagebrush
Slash (heavy)
Ponderosa pine Slash Brush Chaparral Spruce-fir Aspen _ _ _ I _ . . p
'Source: Region 1 Supplement I t o the Fireline Handbook (U.S. Dep. Agric., Forest Serv. 1974). 'The fuels listed are summarized from the fuels description in the Region 2 Supplement 1 to the Fireline Handbook (U.S. Dep. Agric.. Forest
Serv. 1972a). Twenty-one fuel classes with a total of 60 subclasses are listed in the supplement. 'Source: Region 3 Supplement to the Fire Fighting Overhead Notebook (U.S. Dep. Agric., Forest Serv. 1965a).
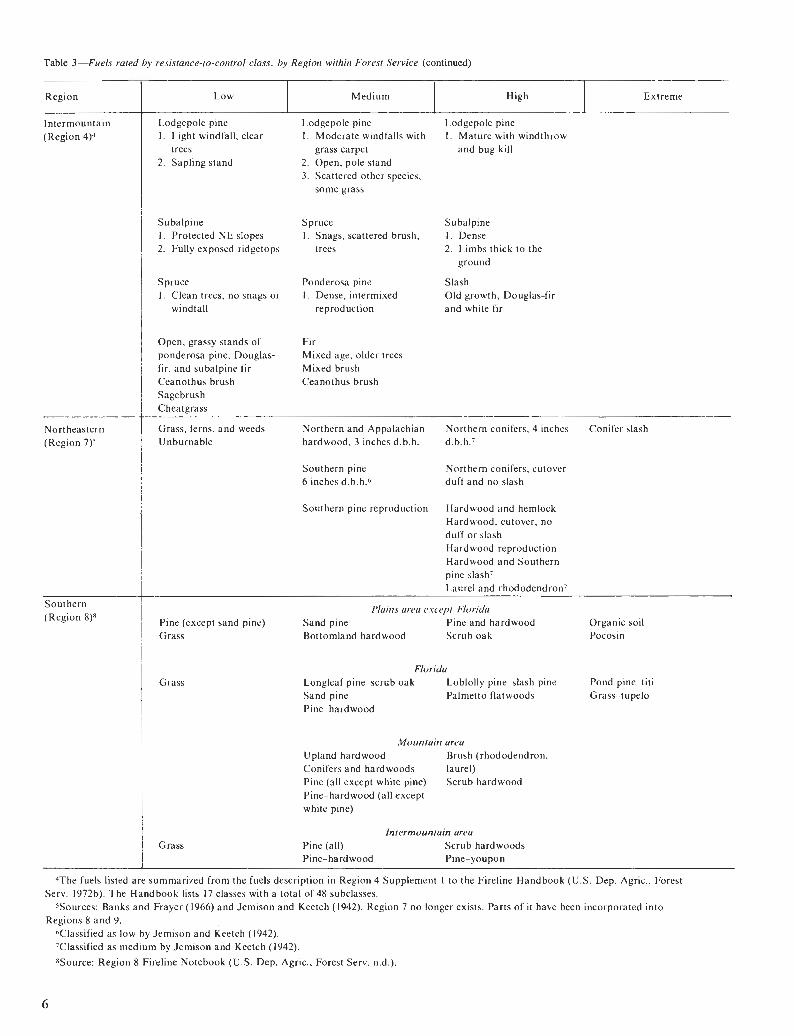
Table 3-Fuels rated by resistance-to-control class, by Region within Forest Service (continued)
Region
Intermountain (Region 4)4
Northeastern (Region 7)5
Southern (Region 8)s
Lodgepole pine 1. Light windfall, clear
trees 2. Sapling stand
Low
Lodgepole pine 1. Moderate windfalls with
grass carpet 2. Open, pole stand 3. Scattered other species,
Lodgepole pine 1. Mature with windthrow
and bug kill
Medium High I
some grass
Extreme
Subalpine I . Protected NE slopes 2. Fully exposed ridgetops
Spruce 1. Clean trees, no snags or
windfall
Open, grassy stands of ponderosa pine, Douglas- fir, and subalpine fir Ceanothus brush Sagebrush
Spruce 1. Snags, scattered brush,
trees
Ponderosa pine I. Dense, intermixed
reproduction
Fir Mixed age, older trees Mixed brush Ceanothus brush
Subalpine I. Dense 2. Limbs thick to the
ground
Slash Old growth, Douglas-fir and white fir
Cheatgrass
Grass, ferns, and weeds Northern and Appalachian Northern conifers, 4 inches Conifer slash Unburnable hardwood, 3 inches d.b.h. d.b.h.7
Southern pine 6 inches d.b.h.6
Northern conifers, cutover duff and no slash
Southern pine reproduction Hardwood and hemlock Hardwood, cutover, no duff or slash Hardwood reproduction Hardwood and Southern pine slash7 Laurel and rhododendron'
Plains area except Florida Pine (except sand pine) Sand pine Pine and hardwood Organic soil Grass Bottomland hardwood Scrub oak Pocosin
Grass
Grass
Florida Longleaf pine-scrub oak Loblolly pine-slash pine Pond pine-titi Sand pine Palmetto flatwoods Grass-tupelo Pine-hardwood
Mountain area Upland hardwood Brush (rhododendron, Conifers and hardwoods laurel) Pine (all except white pine) Scrub hardwood Pine-hardwood (all except white pine)
Intermountain area Pine (all) Scrub hardwoods Pine-hardwood Pine-youpon
4The fuels listed are summarized from the fuels description in Region 4 Supplement 1 to the Fireline Handbook (U.S. Dep. Agric., Forest Serv. 1972b). The Handbook lists 17 classes with a total of 48 subclasses.
5Sources: Banks and Frayer (1966) and Jemison and Keetch (1942). Region 7 no longer exists. Parts of it have been incorporated into Regions 8 and 9.
Classified as low by Jemison and Keetch (1942). 7Classified as medium by Jemison and Keetch (1942).
8Source: Region 8 Fireline Notebook (U.S. Dep. Agric., Forest Serv. n.d.).
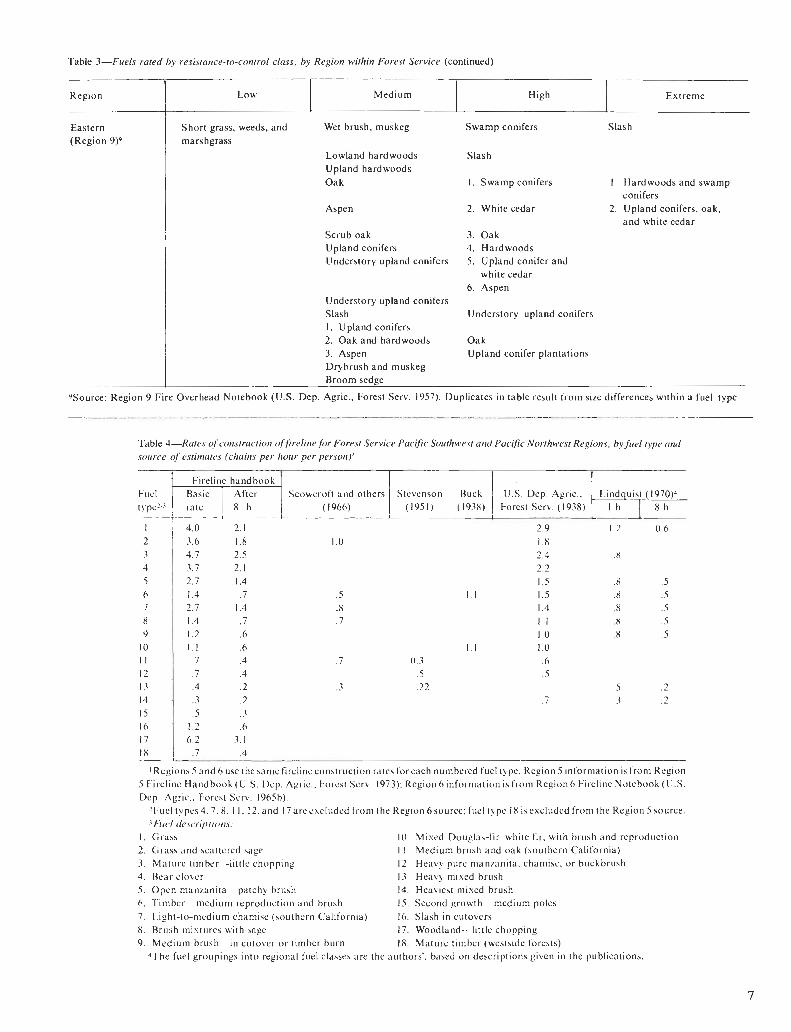
Table 3-Fuels rated by resistance-to-control class, by Region within Forest Service (continued)
Region
Eastern (Region 9)9
Aspen
Low
Scrub oak Upland conifers Understory upland conifers
Understory upland conifers Slash I. Upland conifers 2. Oak and hardwoods 3. Aspen Drybrush and muskeg Broom sedge
Short grass, weeds, and Wet brush, muskeg Swamp conifers Slash marshgrass
Lowland hardwoods Slash Upland hardwoods Oak 1. Swamp conifers
Medium
2. White cedar
3. Oak 4. Hardwoods 5. Upland conifer and
white cedar 6. Aspen
High
Understory-upland conifers
Extreme
Oak Upland conifer plantations
1. Hardwoods and swamp conifers
2. Upland conifers, oak, and white cedar
9Source: Region 9 Fire Overhead Notebook (U.S. Dep. Agric., Forest Serv. 1957). Duplicates in table result from size differences within a fuel type
- -- - - -- --- -. -
Table 4-Rates of construction offireline for Forest Service Pacific Southwest and Pacific Northwest Regions, by fuel type and source of estimates (chains per hour per person)'
Fuel type2,z
Fireline handbook Scowcroft and others Stevenson Buck I U.S. Dep. Agric.. Lindquist (1970)J
rate 1 8 h I (1966) 1 (1951) (1938) 1 Forest ~ k r v . (-1938) [r
I Regions 5 and 6 use the same fireline construction rates for each numbered fuel type. Region 5 information is from Region 5 Fireline Handbook (U.S. Dep. Agric.. Forest Serv. 1973); Region 6 information is from Region 6 Fireline Notebook (U.S. Dep. Agric.. Forest Serv. 1965b).
?Fuel types 4.7.8. 1 I . 12. and 17 are excluded from the Region 6 source; fuel type 18 is excluded from the Region 5 source. ' Fuel descriptions:
I. Grass 10. Mixed Douglas-fir-white fir. with brush and reproduction 2. Grass and scattered sage I I. Medium brush and oak (southern California) 3. Mature timber-little chopping 12. Heavy pure manzanita, chamise, or buckbrush 4. Bear clover 13. Heavy mixed brush 5. Open manzanita-patchy brush 14. Heaviest mixed brush 6. Timber-medium reproduction and brush 15. Second growth-medium poles 7. Light-to-medium chamise (southern California) 16. Slash in cutovers 8. Brush mixtures with sage 17. Woodland-.little chopping 9. Medium brush--in cutover or timber burn 18. Mature timber (westside forests)
4The fuel groupings into regional fuel classes are the authors', based on descriptions given in the publications.
REFERENCES
Banks, W.G.; Frayer, H.C. Rate of forest fire spread and resistance-to- control in the fuel types of the eastern region. Fire Control Notes 27(2):1-13; 1966.
Biddison, L.R. [Letter to Parkin Hunter]. 1980, April. Forest Fire Laboratory, Forest Service, U.S. Department of Agriculture, Riverside, CA.
Bratten, F.W. Containment tables for initial attack on forest fiues. Fire Technol. 14(4):297-303; 1978.
Buck, C.C. Progress report on resistance-to-control study-1937. Ber- keley, CA: California Forest and Range Experiment Station, Forest Ser- vice, U.S. Department of Agriculture; 1938. 28 p.
Davis, J.B.; Irwin, R.L. FOCUS: A computerized approach to fire man- agement planning. J. For. 74:615-618; 1976.
Hanson, P.D.; Abell, C.A. Determining the desirable size of suppression crews for the national forests of northern California. Fire Control Notes 5(3):56- 160; 1941.
Jemison, G.M.; Keetch, J.J. Progress report. Tech. Note 53. Asheville, NC: Appalachian Forest Experiment Station, Forest Service, U.S. Department of Agriculture; 1942. 15 p.
Lindquist, J.L. Building firelines-how fast do crews work? Fire Technol. 6(2):126-134; 1970.
Matthews, D.N. Crew size affects firefighting efficiency-a progress re- port on time studies of the firefighting job. Res. Note 29. Portland, OR: Pacific Northwest Forest and Range Experiment Station, Forest Service, U.S. Department of Agriculture; 1940. 10 p.
McMasters, A.W. Preliminary analysis of the influence of handcrews on fire growth. Oper. Res. Cent. Rep. ORC-63-7 (RR). Berkeley, CA: Univ. Calif. Inst. Eng. Res.; 1963. 29 p.
McMasters, A.W. Wildland fire control with limited suppression forces. Oper. Res. Cent. Rep. ORC-66-5 (RR). Berkeley, CA: Univ. Calif. Inst. Eng. Res.; 1966. 141 p.
Murphy, P.J.; Quintilio, D. Handcrew fueline construction: a method of estimating production rates. Inf. Rep. NOR-X-197. Edmonton, Alberta: North. For. Res. Cent., For. Serv., Environ. Canada; 1978. 28 p.
Parks, G.M.; Jewell, W.S. Preliminary model for initial attack. Oper. Res. Cent. Rep. F-1. Berkeley, CA: Univ. Calif., Inst. Eng. Res.; 1962. 29 p.
Pirsko, A.R. How good are fiue line construction rates? 1966. Unpublished draft supplied to authors.
Quintilio, D.; Anderson, A.W. Simulation study of initial'attack fire operations in the Whitecourt Forest, Alberta. Inf. Rep. NOR-X-166. Edmonton, Alberta: North. For. Res. Cent., For. Serv., Environ. Canada; 1976. 34 p.
Ramherg, R.G. Firefighters physiological study-project record ED&T 2003-firefighting efficiency of man-the machine. Missoula, MT: Equipment Development Center, Forest Service, U.S. Department of Ag- riculture; 1974. 33 p.
Scowcroft, P.G.; Murphy, J.C.; Pirsko, R. How good are fireline produc- tion rates? 1966. Unpublished draft supplied to authors.
Simard, A.J.; Young, A,; Redmond, R. AIRPRO: An airtanker pro- ductivity computer simulator model. Inf. Rep. FF-X-67. Ottawa, On- tario, Canada: Forest Fire Research Institute; 1978. 38 p.
ateele, R.W. Use of bulldozers for fireline construction. Missoula, MT: Montana State Univ. Bull. 19; 196 1. 11 p.
Stevenson, S. "Hot shot" crews. Fire Control Notes 12(2):29-31; 1951. Storey, T.G. Productivity and rates of substitution of line building forces
in fire suppression-a sumary of existing data. 1969. Unpublished draft supplied to authors.
Swersey, F.S. Parametric and dynamic programming in forest fue con- trolmethods. Oper. Res. Cent. Rep. ORC 63-8 (RR); Berkeley, CA: Univ. Calif. Inst. Eng. Res.; 1963. 24 p.
U.S. Department of Agriculture, Forest Service. Resistance to line construc- tion 1938 tests, Region 5. San Francisco, CA: Forest Service, U.S. Department of Agriculture; 1938. 20 p.
U.S. Department of Agriculture, Forest Service. Fire overhead notebook. Milwaukee, WI; Northcentral Region (R-5), Forest Service, U.S. Depart- ment of Agriculture; 1957. 92 p.
U.S. Department of Agriculture, Forest Service. Fireline notebook. FSH 2, 5135.7. Lakewood, CO: Rocky Mountain Region (R-2), Forest Service, U.S. Department of Agriculture; 1961. 108 p.
U.S. Department of Agriculture, Forest Service. Firefighting overhead notebook. FSH 2. Ogden, UT: Intermountain Region (R-4); Forest Ser- vice, U.S. Department of Agriculture; 1962. 216 p.
U.S. Department of Agriculture, Forest Service. Fireline notebook. FSH 2, 5135.7. San Francisco, CA: California Region (R-5), Forest Service, U.S. Department of Agriculture; 1963. 121 p.
U.S. Department of Agriculture, Forest Service. Title 5100-fire control manual supplement 146. Eastern Region (R-7), Forest Service, U.S. Department of Agriculture; 1964. 3 p.
U.S. Department of Agriculture, Forest Service. Firefighting overhead notebook. Albuquerque, NM: Southwestern Region (R-3), Forest Service, U.S. Department of Agriculture; 1965a. 187 p.
U.S. Department of Agriculture, Forest Service. Fireline notebook. FSH 4134.4 Portland, OR: Pacific Northwest Region (R-6), Forest Service, U.S. Department of Agriculture; 1965b. 200 p.
U.S. Department of Agriculture, Forest Service. Fireline notebook. FSM 5 134.5 and FSH 5132.5 1. Missoula, MT: Northern Region (R- 1), Forest Service, U.S. Department of Agriculture; 1966a. 160 p.
U.S. Department of Agriculture, Forest Service. Fireline notebook. Juneau, AK: Alaska Region (R-lo), Forest Service, U.S. Department of Agricul- ture; 1966b. 150 p.
U.S. Department of Agriculture, Forest Service. Fireline handbook, Supp. 1. Lakewood, CO; Rocky Mountain Region (R-2), Forest Service, U.S. Department of Agriculture; 1972a. 5 p.
U.S. Department of Agriculture, Forest Service. Fireline handbook. R-4 Supplement No. 1. Ogden, UT: Intermountain Region (R-4), Forest Ser- vice, U.S. Department of Agriculture; 1972b. 9 p.
U.S. Department of Agriculture, Forest Service. Forest Service Handbook. FSH 5109.17. Region 5 Supplement No. 1. San Francisco, CA: California Region (R-5), Forest Service, U.S. Department of Agriculture; 1973.39 p.
U.S. Department of Agriculture, Forest Service. Fireline handbook. Region 1 Supplement No. 1. Missoula, MT: Intermountain Region (R-1), Forest Service, U.S. Department of Agriculture; 1974. p. 23.4-1 to 23.4-2.
U.S. Department of Agriculture, Forest Service. Fire management analysis for forest planning-Rocky Mountain Region (R-2) (Rev. 9/79). Washington, DC: Forest Service, U.S. Department of Agriculture; 1980.
U.S. Department of Agriculture, Forest Service. Fireline handbook. At- lanta, GA: Southern Region (R-8), Forest Service, U.S. Department of Agriculture; n.d. 90 p.