Embed Size (px)
Citation preview
HU ISSN 1785-1270
PRODUCTION SYSTEMS AND
INFORMATION ENGINEERING
A Publication of the University of Miskolc
VOLUME 9 (2020)
MISKOLC UNIVERSITY PRESS


HU ISSN 1785-1270
PRODUCTION SYSTEMS AND
INFORMATION ENGINEERING
A Publication of the University of Miskolc
VOLUME 9 (2020)
MISKOLC UNIVERSITY PRESS

University of MiskolcResponsible for publication:Responsible for layout and editing: Dr. Attila Karoly VargaPublished by the Miskolc University Pressunder the leadership of Attila SzendiResponsible for duplication: Erzsebet PasztorNumber of copies printed:Put to the Press onNumber of permission:HU ISSN 1785-1270

EDITORAL BOARD
TIBOR TOTH
Editor in Chief
Department of Information EngineeringUniversity of MiskolcH-3515 Miskolc-Egyetemvaros, Hungarye-mail: [email protected]
BELA ILLES
Secretary
Department of Materials Handling and LogisticsUniversity of MiskolcH-3515 Miskolc-Egyetemvaros, Hungarye-mail: [email protected]
LASZLO KOVACS
Secretary
Institute of Information Science and TechnologiesUniversity of MiskolcH-3515 Miskolc-Egyetemvaros, Hungarye-mail: [email protected]
CALIN ENACHESCUDepartment of InformaticsPetru Maior University of Tirgu MuresStrada Nicolae Iorga 1, Tirgu Mures 540088, Romaniae-mail: [email protected]
IMRE HORVATHFaculty of Design, Engineering and ProductionDelft University of Technology,Landbergstraat 15, 2628, CE Delft, The Netherlandse-mail: [email protected]
JOZSEF VANCZAComputer and Automation Research Institute of theHungarian Academy of SciencesH-1111 Budapest, Kende u, 13–17., Hungarye-mail: [email protected]
LASZLO DUDASDepartment of Information EngineeringUniversity of MiskolcH-3515 Miskolc-Egyetemvaros, Hungarye-mail: [email protected]
PETER SINCAKDepartment of Cybernetics and Artificial IntelligenceTechnical University of KosiceLetna 9, Kosice, 04200, Slovakiae-mail: [email protected]
S. ENGIN KILICMechanical Engineering DepartmentMiddle East Technical University06531 Ankara, Turkeye-mail: [email protected]
SANDOR RADELECZKI
Institute of MathematicsUniversity of MiskolcH-3515 Miskolc-Egyetemvaros, Hungarye-mail: [email protected]


Production Systems and Information EngineeringVolume 9 (2020), pp. 5-18 5
EFFICIENCY ANALYSIS OF NNS METHODS
Balazs BolykiUniversity of Miskolc, Hungary
Student of Computer Science Engineering
David PolonkaiUniversity of Miskolc, Hungary
Student of Computer Science Engineering
Dr. Laszlo KovacsUniversity of Miskolc, Hungary
Department of Information Technology
[Received . . . and accepted . . . ]
Abstract. Nearest Neighbor Search is a key operation in multiple in-formation technologies fields, for example, string matching, plagiarismdetection, natural language processing, image clustering, etc. It is cru-cial, that we have cost efficient methods and structures for retrievingdata based on similarity. We conducted a survey of two popular – Van-tage Point tree and Locality Sensitive hashing –, and one more recent –Prefix tree with clustering – NNS methods. In order to perform a widerange of tests on these algorithms, we adapted each to Python language,and developed multiple tests. In this paper we present the descriptionof the three algorithms and the results of our tests. We aim to providean informative comparison of the three major Nearest Neighbor Searchstructures.
Keywords: NNS, VP-tree, LSH, Prefix tree, Nearest Neighbor, search,comparison
1. Introduction
The search for similar objects is a key operation in general information man-agement. When we retrieve information based on the high level of similarity –or in other words, the smallest distance – between known and unknown data,

6 B. Bolyki, D. Polonkai and Dr. L. Kovacs
we execute Nearest Neighbor Search (NNS). The applications of NNS are nu-merous and also are the methods invented to make it faster, more effective.The query for nearest neighbor elements is used, among others in autocompleteand spell checking [1], plagiarism detection [2, 3, 4, 5, 6], natural language pro-cessing [7], image clustering [8], and medical databases [9]. The time efficiencyof NNS operations is a crucial cost factor in the whole information system.Similarity and distance are two measures approaching the same problem fromthe opposite directions. The more similar two objects are to each other, theless the distance is between them, while the greater the distance between them,the less similar they are. Therefore we use both measures in this essay.This work focuses on an important application area, the search in a wordrepository. This paper’s main purpose is twofold, first to analyze the costefficiency of the known NNS methods and to adapt them to the investigatedproblem domain, namely the similarity search in word repositories. The workanalyzes two popular methods, VP- tree and LSH algorithms and comparesthem with a recent approach, the prefix-tree NNS structure. The performedtests cover both time efficiency and search accuracy analyses. Our goal is tolist, explain and evaluate these methods and to give the readers an insight intothe strengths and weaknesses of each.
Nearest Neighbor Search. Nearest Neighbor Search (NNS) is the opera-tion, which retrieves a data object, from a given dataset, based on its distancefrom a query object. Formally, if U is the universe and S ⊆ U is the dataset, inwhich we search, and q ∈ U is the query object, we can define NNS as follows.
d : U2 → {x ∈ R | x ≥ 0} (1.1)
N1 (q) = {y ∈ S | ∀z ∈ S, d (q, y) ≤ d (q, z)}|N1 (q)| = 1
(1.2)
Nk(q) = {∀x ∈ Nk(q), y ∈ S : d(q, y) < d(q, x)⇒ y ∈ Nk(q)}and |Nk(q)| = k
where k ∈ N+ and k ≤ |S|(1.3)
Formula 1.1 defines a distance function d , which we use in the Nearest Neigh-bor Search definition in the Formula 1.2. In Formula 1.3 we also define thegeneralization of NNS to k-NNS, where we retrieve the k nearest neigbors ofthe query q, from the dataset S.
2. Description of evaluated algorithms
The three evaluated approaches, Vantage Point tree (VP-tree), LocalitySensitive Hashing, and Prefix tree with clustering (prefix tree) each realizean efficient way to execute nearest neighbor search operation, however, their

Efficiency analysis of NNS methods 7
Figure 1. Representation of VP-tree concept
approach is quite different. In this section we will describe the approach ofeach algorithm generally.
2.1. Vantage Point tree
VP-tree realizes NNS operation based on the concept of general metricspaces. It requires the dataset containing the data objects and the distancefunction d to build the indexing structure. Here, the distance function mustsatisfy the properties of a metric (positivity, identity of the same objects,symmetry, and triangle inequality), because the VP-tree can use the triangleinequality to prune branches, when searching.Our main reference for the VP-tree is the paper [10]. The main concept of theVP-tree algorithm to solve the NNS problem is to build an indexing structurein such a way that the data objects get distributed according to their distancefrom vantage points, which are chosen from the dataset, one at each non-leaf node. At the building stage if the current dataset Si does not fit into aleaf, we apply Formula 2.1, where we denoted the base dataset as S0 and thecreated subsets are S1, S2 and Si in further nodes, while m is the median ofthe distances from the vantage point (the distance between the vantage pointand the elements of Si is calculated for each element during the partitioningat each node). This partitioning scheme would be recursively repeated at each

8 B. Bolyki, D. Polonkai and Dr. L. Kovacs
node, until all created subsets are allocated into leaves.
S1 = {s ∈ S0 | d(s, vp0) < m}S2 = {s ∈ S0 | d(s, vp0) ≥ m}
(2.1)
The algorithm for searching in the tree is presented in the paper [10]. It usesa recursive strategy to traverse the tree and prunes branches of it based onthe triangle inequality.
2.2. Locality Sensitive Hashing
The Locality Sensitive Hashing is based on hash functions. The hash func-tions map a key into a hash value. The hash function represents the samevalue for the same input. It is possible, that two different keys mapped intothe same hash value. This is hash collision. [11]The LSH uses hash collision to find similar keys. This method hashes dataobjects by multiple hash functions and stores the hash value and key pairs.Therefore if more collisions are found in different hash functions, it is moreprobable that keys are similar. To find similarities the algorithm hashes thequery point and returns the elements from the buckets that contain that point.[12] This method also uses minhash. It is a special hash function, that we ex-ecute multiple times to receive the same hash values for similar keys. In ourcase it is used to map the keys into hash values, which we add to the LSHfunction. For better understanding we have to declare shingling, which is amethod, that can divide its input into k lenght sequences. After shingling thehash value, the method puts them into the buckets of the LSH function. Theidea of the LSH algorithm is represented in Figure 2. In our case the algorithm
Figure 2. Representation of Locality Sensitive Hashing concept
we use is a library based on the [13].
Efficiency analysis of NNS methods 9
2.3. Prefix-tree with clustering
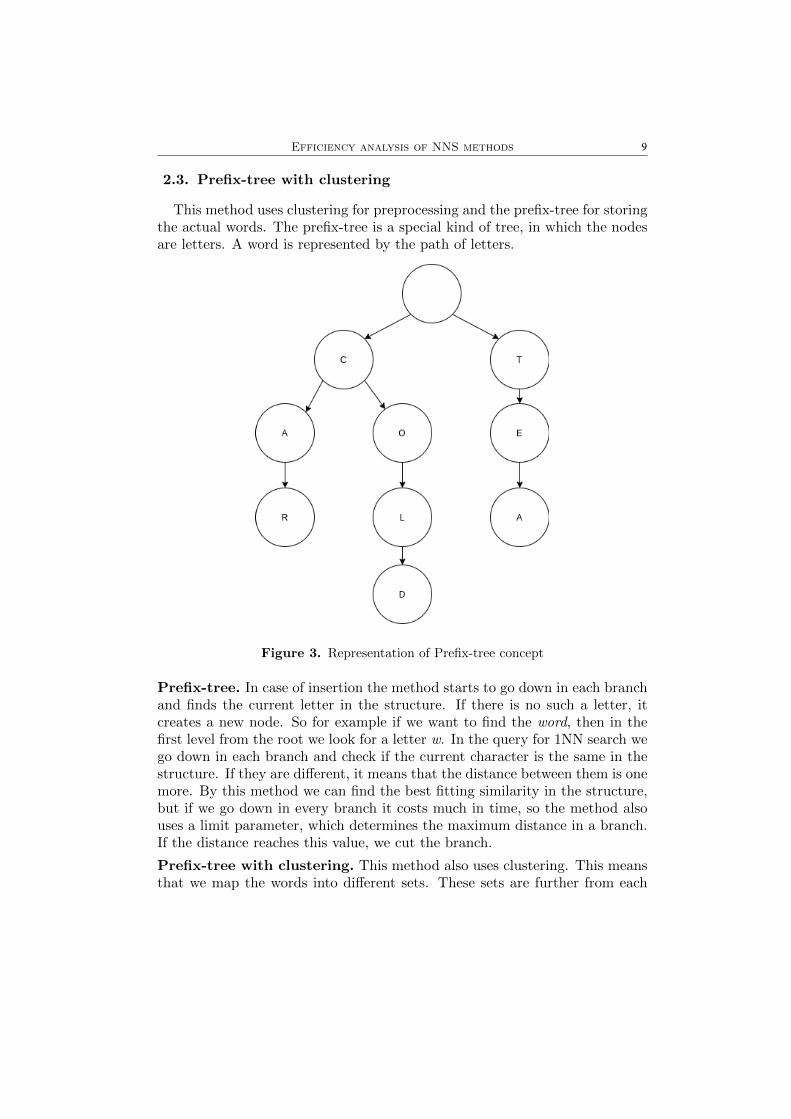
This method uses clustering for preprocessing and the prefix-tree for storingthe actual words. The prefix-tree is a special kind of tree, in which the nodesare letters. A word is represented by the path of letters.
Figure 3. Representation of Prefix-tree concept
Prefix-tree. In case of insertion the method starts to go down in each branchand finds the current letter in the structure. If there is no such a letter, itcreates a new node. So for example if we want to find the word, then in thefirst level from the root we look for a letter w. In the query for 1NN search wego down in each branch and check if the current character is the same in thestructure. If they are different, it means that the distance between them is onemore. By this method we can find the best fitting similarity in the structure,but if we go down in every branch it costs much in time, so the method alsouses a limit parameter, which determines the maximum distance in a branch.If the distance reaches this value, we cut the branch.
Prefix-tree with clustering. This method also uses clustering. This meansthat we map the words into different sets. These sets are further from each

10 B. Bolyki, D. Polonkai and Dr. L. Kovacs
other and does not overlap. In each cluster there is a tree and the wordsare stored there. The stucture building starts with calculating the centralpoints of the clusters. After this we build all the prefix trees. In case ofinsertion the algorithm calculates the nearest cluster and builds the word intothe tree. For calculation the method represent the words into vectors and runsa minimum search on the cluster distance from the word in order to find thenearest cluster. The query method works the same, so it finds the cluster,then goes down in the tree and searches for the word as described above. Thebase implementation of the method is presented in [14].
3. Adaptation of investigated methods
In order to test the methods, we adapted them to a common implementationframework. We chose the Python programming language, because it provideslibraries and partial implementation of the used methods, and it hides mostof the lower level operations, so we could focus on the unique parts of thealgorithms.The parameters of the computer in which the tests have run are the following:
• cpu: Intel®Core™i7-8550U @ 1.80GHz• ram: 7.7 GiB @2400 MHz and 7.5 GiB of swap memory• swap device: M.2 Solid state drive with 600 MB/s data transfer rate• operating system: Ubuntu 18.04.3 LTS 64-bit
3.1. Vantage Point tree
Our VP-tree implementation is based on the paper [10]. We should alsoreference [15] for the implementation of the Autosorting list and as a structuralexample. However, due to our different platforms and emphasis – namely ususing mainly Python language and our tests focusing on speed rather thanpage access rates – we diverged from [10] in multiple aspects. We followed theproposition of the paper for
• building the tree and• executing k-NNS in the tree.
We performed the following extensions of the base model:
• We set the leaf size based on the quantity and not the size of the dataobjects, that would be contained within. This is more advantagous in ahigher level programming language, since it provides more information,than does the data object size.• We designed our own insertion algorithm. This looks up the leaf, in
which the data object to be inserted should be placed, and allocates it
Efficiency analysis of NNS methods 11
in the leaf, it still has space. If does not have space, then the algorithmstarts to go up the tree, and checks if the subtree marked my the checkednode (its descendants are its subtree) has space. If it has, the algorithmretrieves the data stored in that subtree, then rebuilds it. If the entiretree is full, then the entire tree is rebuilt.
3.2. Locality Sensitive Hashing
The algorithm originally used for similarity search in big texts like para-graphs. So we have to tweak the parameters to work with word similaritysearch. One of the most important parameters is the permutations, whichdetermines the number of permutations by the minhash function. If this pa-rameter is big, then the memory consumpsion and building time of this methodincrease, but the query time will be less. We determined that the ideal numberfor this parameter is 60. The other parameter is n_gram, which determinesthe shingle size for minhash. We choose this to be 2, because by this we canenter bigger than 2 lenght words. To make sure that the words contain morethan 2 characters we built a function, which fills the words, which are lessthan 4 characters with characters. Later in the query we also run this onthe searched word, to make sure that the right results are returned. We alsochanged the no_of_bands parameter, which defines the number to break theminhash signature before hashing into the buckets. The accuracy is affectedby this parameter. We set the sensitivity to 2 which means the number ofbuckets texts must share to be declared as similar. Moreover we implementedthe k-NNS methods, which calculates the k nearest from the result set.
3.3. Prefix-tree with clustering
In case of this method we also modified the parameters. The most impor-tant parameter for this method is the limit, which determines the maximumdistance that we want to search in the tree. As is mentioned this parame-ter determines how deep the search can go down to find the best match ina branch. The parameter has to be larger than the distance of the searchedword and its nearest neighbour, otherwise the algorithm does not return aword. But if the limit is much larger than the nearest neighbor, then thesearch time increases dramatically. In most of our tests we declared the limitparameter as 3, in some of them we used also 3 and 6. The other crutialparameter is the number of clusters. Because the word cluster determinationis a step with high costs we have to choose it properly. our wordlists use 50000to 2.4 million words, therefore we choose a rather big clusternumber, whichis 100. In addition to the parameter settings we created methods for k-NNS
12 B. Bolyki, D. Polonkai and Dr. L. Kovacs
search and for the insertion. The k-NNS search method goes through the treeuntil k number of results are found or the limit distance reached.
4. Performed tests
To test the algorithms on similar word searching, we have to create wordlists.These wordlists contain Hungarian and English words. The building wordlistconsists of 2.4 million Hungarian words. In order to build structures with lesswords we take a sublist from this. The searchlist is a Hungarian and mostlyEnglish wordlist. These words are not in the building list.We created several tests:
• build time tests for different wordlists,• search time tests for different wordlists and different percentage of known-
unknown words,• k-NNS tests: scaling depending on the k value;• accuracy tests,• insert time tests.
Most of the tests measure time required to do the task, except for accuracytests, which measure that the returned word is the real nearest neighbour.
Build test. The building time test is, where we tested the required time tobuild up the structure from zero. We ran this test on different wordlists,from 200000 to 2.4 million in each cycle we increased the number of words by200000. The results of the test is represented in Figure 4.
Accuracy comparison. We measured the accuracy of each algorithm by firstbuilding a structure from a wordlist of 50000 words, then executing nearestneighbor search in two ways. We retrieved the nearest neighbor using theevaluated algorithm, and also using a linear search algorithm, that we wrote forthis purpose. We accepted the result returned by the linear search algorithmas the real nearest neighbor, and compared it to the result returned by theevaluated structure. If the two returned objects were of the same distancefrom the query point, then we considered the search accurate, otherwise weconsidered it inaccurate. We looked up the nearest neighbor of 20 words, andcalculated the percentage of accuracy. We also executed this test for differentproportions of known-unknown words in the wordlist (for example, 20% of thesearch list was also in the structre). The results are presented in Figure 5.
Search test. The search time tests measure the time required to run thequery method. We used 20 words size wordlists, and measured the time eachalgorithm takes to look up the nearest neighbor of the 20 words, then divided

Efficiency analysis of NNS methods 13
the result by 20 to receive the average search time per word value for each algo-rithm. The results for the 20 unknown words (words not inside the structure)are represented in Figure 6.
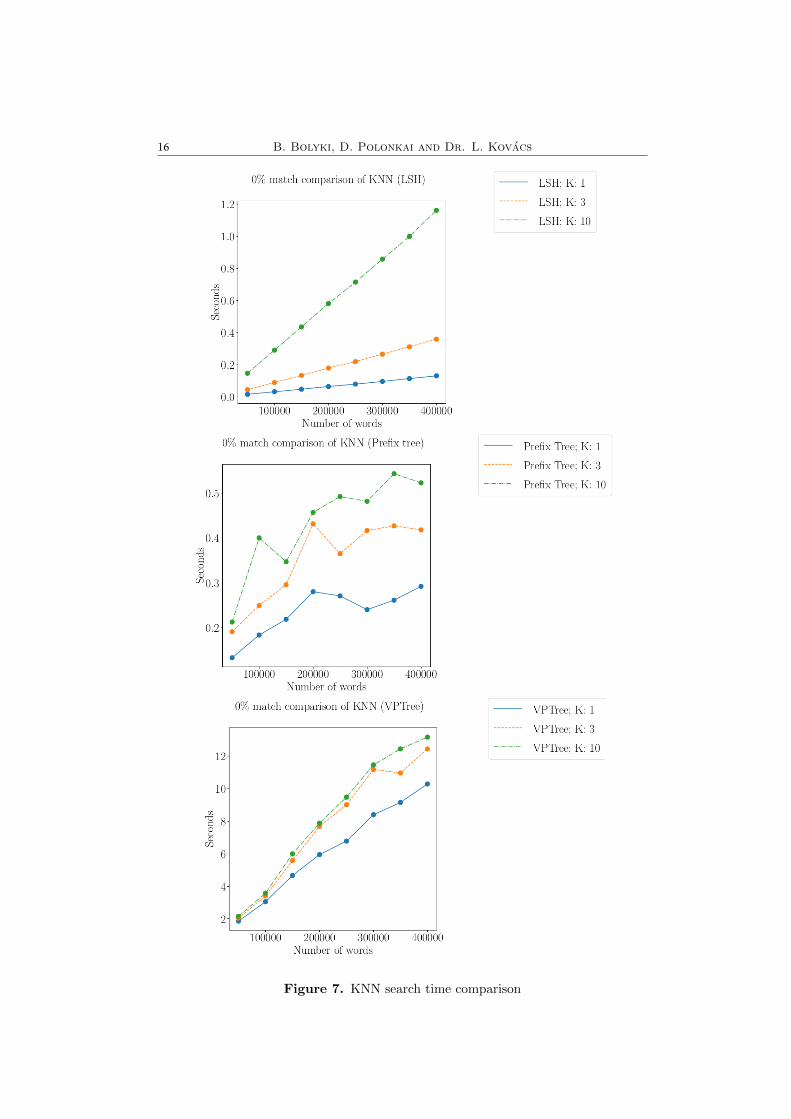
K-NNS test. We tested the algorithms for their scaling given multiple kvalues, when we execute k-NNS operation. To do so, we built the structuresfrom 50000, 100000, . . . , 400000 words size wordlists, then executed k-NNS,with the above mentioned 20 words search list (none of the 20 words wereinside the structure), with the k values of 1, 3, 10. As before, we present theaverage search time per query word in Figure 7.
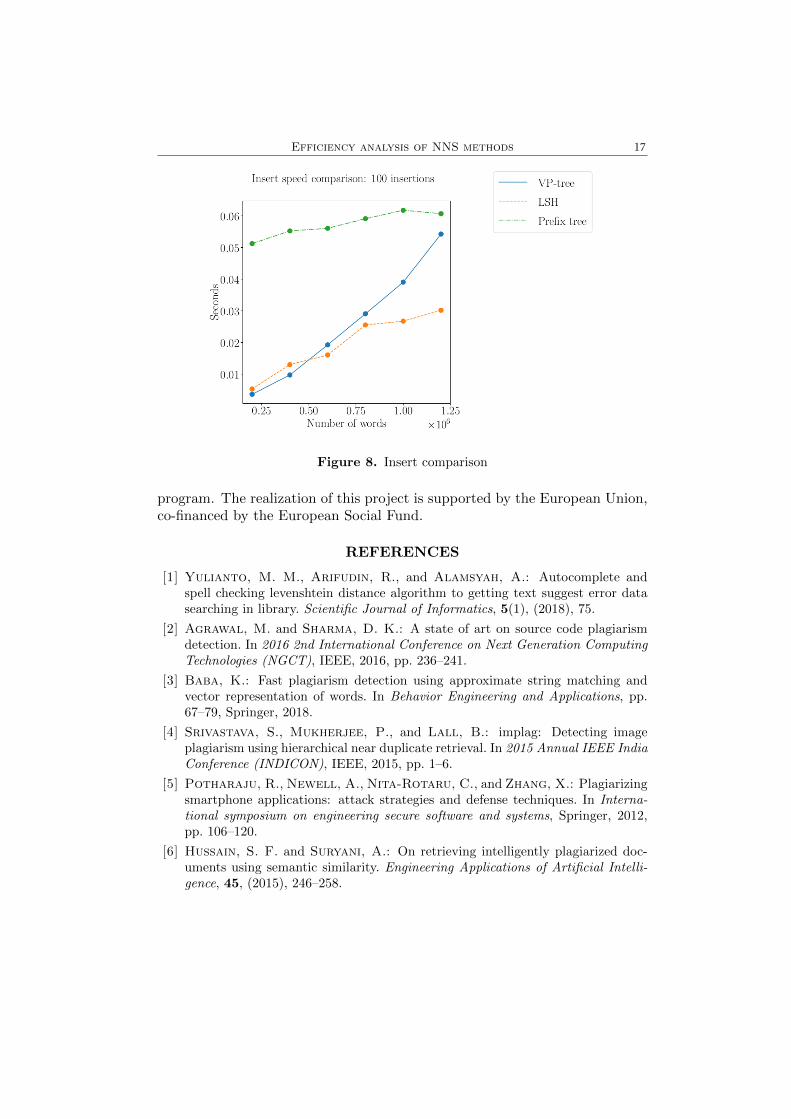
Insert time test. The insert time test is a test, in which we measure thetime needed to insert 100 words into the different structures. We executed thisinsertion on structures built from 200000 to 1.2 million words size wordlists.The results of the test are represented in Figure 8.
Figure 4. Building time comparison
5. Conclusion
In this article we have listed a few application areas of Nearest NeighborSearch, described a few import Nearest Neighbor Search algorithms, namely:
• Vantage Point tree (VP-tree)• Locality Sensitive hashing (LSH)• Prefix tree with clusterng (Prefix-tree)

14 B. Bolyki, D. Polonkai and Dr. L. Kovacs
Figure 5. Accuracy comparison
VP-tree and LSH are more conventional and widely known methods, whilePrefix-tree is a more recent approach. We adapted each algorithm to a uniformframework to perform a range of tests. From the results of our tests we canconclude the following:
• LSH takes the less time to build up.• VP-tree is the most accurate of the three methods.• Prefix-tree and LSH clearly outperform VP-tree in regards of search
time.• The speed comparison between Prefix-tree and LSH is not one-sided,
but Prefix-tree scales better, while LSH is less affected by whether thesearched word is inside the structure or not.• Each algorithm scales reasonably depending on the k value at k-NNS
operation.• The difference between insertion speed of the three algorithms is rather
small, Prefix-tree being slightly slower on the evaluated interval.
6. Acknowledgements
The described article was carried out as part of the EFOP-3.6.1-16-2016-00011 “Younger and Renewing University – Innovative Knowledge City –institutional development of the University of Miskolc aiming at intelligentspecialisation” project implemented in the framework of the Szechenyi 2020

Efficiency analysis of NNS methods 15
Figure 6. KNN search time comparison
16 B. Bolyki, D. Polonkai and Dr. L. Kovacs
Figure 7. KNN search time comparison
Efficiency analysis of NNS methods 17
Figure 8. Insert comparison
program. The realization of this project is supported by the European Union,co-financed by the European Social Fund.
REFERENCES
[1] Yulianto, M. M., Arifudin, R., and Alamsyah, A.: Autocomplete andspell checking levenshtein distance algorithm to getting text suggest error datasearching in library. Scientific Journal of Informatics, 5(1), (2018), 75.
[2] Agrawal, M. and Sharma, D. K.: A state of art on source code plagiarismdetection. In 2016 2nd International Conference on Next Generation ComputingTechnologies (NGCT), IEEE, 2016, pp. 236–241.
[3] Baba, K.: Fast plagiarism detection using approximate string matching andvector representation of words. In Behavior Engineering and Applications, pp.67–79, Springer, 2018.
[4] Srivastava, S., Mukherjee, P., and Lall, B.: implag: Detecting imageplagiarism using hierarchical near duplicate retrieval. In 2015 Annual IEEE IndiaConference (INDICON), IEEE, 2015, pp. 1–6.
[5] Potharaju, R., Newell, A., Nita-Rotaru, C., and Zhang, X.: Plagiarizingsmartphone applications: attack strategies and defense techniques. In Interna-tional symposium on engineering secure software and systems, Springer, 2012,pp. 106–120.
[6] Hussain, S. F. and Suryani, A.: On retrieving intelligently plagiarized doc-uments using semantic similarity. Engineering Applications of Artificial Intelli-gence, 45, (2015), 246–258.

18 B. Bolyki, D. Polonkai and Dr. L. Kovacs
[7] Goyal, A., Daume III, H., and Guerra, R.: Fast large-scale approximategraph construction for nlp. In Proceedings of the 2012 Joint Conference on Em-pirical Methods in Natural Language Processing and Computational Natural Lan-guage Learning, 2012, pp. 1069–1080.
[8] Liu, T., Rosenberg, C., and Rowley, H. A.: Clustering billions of imageswith large scale nearest neighbor search. In 2007 IEEE workshop on applicationsof computer vision (WACV’07), IEEE, 2007, pp. 28–28.
[9] Korn, F., Sidiropoulos, N., Faloutsos, C., Siegel, E., and Protopapas,Z.: Fast nearest neighbor search in medical image databases. Tech. rep., 1998.
[10] Fu, A. W.-c., Chan, P. M.-s., Cheung, Y.-L., and Moon,Y. S.: Dynamic vp-tree indexing for n-nearest neighbor search givenpair-wise distances. The VLDB Journal, 9(2), (2000), 154–173, URLhttps://doi.org/10.1007/PL00010672.
[11] Carter, J. L. and Wegman, M. N.: Universal classes of hash functions.Journal of computer and system sciences, 18(2), (1979), 143–154.
[12] Gionis, A., Indyk, P., Motwani, R., et al.: Similarity search in high di-mensions via hashing. In Vldb, vol. 99, 1999, pp. 518–529.
[13] Rajaraman, A. and Ullman, J. D.: Mining of massive datasets. CambridgeUniversity Press, 2011.
[14] Kovacs, L. and Szabo, G.: Automated learning of the morphological charac-teristics of the Hungarian language for inflection and morphological analysis.
[15] Sjogren, R.: VP-Tree. URL https://github.com/RickardSjogren/vptree.Undefined: undefined Copyright 2017 Rickard Sjogren Permission is herebygranted, free of charge, to any person obtaining a copy of this software andassociated documentation files (the ”Software”), to deal in the Software withoutrestriction, including without limitation the rights to use, copy, modify, merge,publish, distribute, sublicense, and/or sell copies of the Software, and to per-mit persons to whom the Software is furnished to do so, subject to the fol-lowing conditions: The above copyright notice and this permission notice shallbe included in all copies or substantial portions of the Software. THE SOFT-WARE IS PROVIDED ”AS IS”, WITHOUT WARRANTY OF ANY KIND,EXPRESS OR IMPLIED, INCLUDING BUT NOT LIMITED TO THE WAR-RANTIES OF MERCHANTABILITY, FITNESS FOR A PARTICULAR PUR-POSE AND NONINFRINGEMENT. IN NO EVENT SHALL THE AUTHORSOR COPYRIGHT HOLDERS BE LIABLE FOR ANY CLAIM, DAMAGES OROTHER LIABILITY, WHETHER IN AN ACTION OF CONTRACT, TORTOR OTHERWISE, ARISING FROM, OUT OF OR IN CONNECTION WITHTHE SOFTWARE OR THE USE OR OTHER DEALINGS IN THE SOFT-WARE.

Production Systems and Information EngineeringVolume 9 (2020), pp. 19–35 19
AN EXTENDED PRODUCTION PLANNING MODELBASED ON THE SIMULATION OF HUMAN
CAPABILITIES
Norbert TothBay Zoltan Nonprofit Ltd., Hungary
Division for SMART Systems
Gyula KulcsarUniversity of Miskolc, Hungary
Department of Information Engineering
[Received . . . and accepted . . . ]
Abstract. Digital mapping and modelling of the real systems in digi-tization solutions of Industry 4.0 are increasingly contributing to risingof the efficiency of production processes. The complexity of productionand logistics systems is further increased by human resources, whose pro-duction capacity greatly influences the production process. This paperpresents a flexible manufacturing system where employee skills affect sys-tem productivity. The values of performance indicators can be changedin a favourable direction using a discrete event-driven simulation model.This model uses an integrated, self-developed module that supports pro-duction scheduling and takes the production capabilities of workers intoaccount for better use of the resources in the production system.
Keywords: simulation, production scheduling, human capabilities, digi-tal model
1. Introduction
The common feature of the production companies – both multinational com-panies and SMEs – is that management aims to serve the customer needs tothe highest possible standard, while fulfilling orders with short lead times andensuring appropriate quality conditions [1]. The large number of orders re-sults in a drastic increase in the number of finished product types. This has animpact both on the design of production systems and the operation of produc-tion and logistics processes. On one hand large-scale production is replaced

20 N. Toth, Gy. Kulcsar
by small and medium-sized series, on the other hand systems supporting pro-duction for individual needs are becoming more and more important, wherethe ”one-piece” material flow will be dominating [2]. Meeting these needs canonly be achieved with a high degree of flexibility and coordinated operation ofthe production and the logistics system. Opportunities offered by the Industry4.0 solutions highly support this through the extensive cooperation of infor-mation and communication technologies (ICT), digitization and virtualizationtechnologies [3]. Digital mapping of production and logistics processes of realproduction systems and the corresponding simulation based studies supportthe detection of bottlenecks [4]. Mapping of real processes is realized in thedigital model at an abstraction level where evaluation of indicators character-izing the operation of the system and examination of influencing parametervalues becomes possible [5]. Experiments by changing input parameter valuescan be performed in digital models, while leaving the smooth operation of realprocesses intact.
The importance of using simulation studies is increasing: a general modeldesigned to solve a real problem contains several parameters which can beused to examine different operational strategies or to redesign system pro-cesses. The examined systems typically consist of discrete production andrelated logistics processes. Special softwares are available for modelling ofthese systems digitally. One of these is Tecnomatix Plant Simulation fromSiemens, Plant Simulation is a general discrete-event-driven simulation de-velopment environment. It supports modelling and simulation of production,manufacturing and logistics processes with a wide set of objects [6], [7]. Us-ing the SimTalk programming language, own algorithms, control proceduresand functions may be created to support more realistic, detailed mapping ofprocesses [8].
A common feature of most discrete manufacturing processes is that theoperations must be performed on certain machines or workstations in a pre-defined order on the workpieces. One typical basic manufacturing scheme isthe so-called ”flow shop” (one-way) model, in which the same operations mustbe performed on the workpiece sets (jobs) in the same order on the same re-sources. There may be additional subcategories to this like the passing andno-passing versions. In the no-passing version, the execution sequences of jobsfor machines can be different. In the passing version, only one execution se-quence is given for all machines [9], [10], [11]. Another typical scheme is the”job shop” model, where each job can have a unique sequence of operationsto be performed [12]. Both models may be flexible. If a group of machinesis able to carry out an operation, then a machine-assigning process is alsoneeded beside the job-sequencing task [13], [14], [15]. Even with a small num-ber of machines, creating an optimal schedule with a polynomial runtime is

Production planning with human resources 21
not possible due to the complexity of the problem: the vast majority of mod-els fall into the NP-hard problem class. In such cases, it is advisable to usefast heuristic, metaheuristic and search algorithms that give near-optimal so-lutions in a short runtime [16]. Development of complex models is necessaryto support the production scheduling of real production systems, where theparameters, influencing factors and stochastic effects related to the logisticsprocesses are also considered in addition to the parameters occurring in theproduction process.
Our research work summarized in this paper was induced by a real prob-lem of a flexible assembly system. The following sections present a simulationmodel and a new heuristic scheduling algorithm for preparing daily produc-tion plans with the highest possible performance. The specialty of the sys-tem is that the model includes the individual assembly capabilities of humanresources (persons). This extension further increases the complexity of theproblem. The efficiency of our extended decision-making algorithm is verifiedby simulation running results.
2. Problem description
2.1. Operations and workplaces
Nowadays, increasing the competitiveness of companies plays a top priorityin fulfilling customer orders in time. Besides, maximizing the performance ofproduction processes, minimizing non-productive logistics processes, and re-ducing losses are also important. One of the losses in the production process isthe changeover time related to switching between product types. Productionscheduling can reduce the number and time of changeover and setup activitiesif the schedule is near to the optimal product sequence. As a result of changingcustomer needs, flexible production structures come to the fore, where pro-duction process involves the manufacturing of different product types at thesame time. In additional, the unique process plan is given for each producttype and they can differ in number or in type of operations. Each operationis linked to a machine or a group of equivalent machines where the necessaryoperations can be performed.
As a result of the application of Industry 4.0 technologies, individual devicescan operate autonomously and communicate to each other on the network. Asboth the machines and the workpieces are identified, each machine can sendmessages to the next machine in the process flow to get prepared for theworkpiece and reduce changeover time. Due to the different product typesmoves in the system at the same time, complex material flow relations arecreated. Fig. 1 illustrates the ”job shop” problem in the form of a directed

22 N. Toth, Gy. Kulcsar
graph for 4 products and 5 machines as an example. Table 1 shows the uniquesequence of operations for the product types.
Figure 1. Job shop production model
Table 1. Order of operations by product type
M1 M2 M3 M4 M5P1 O2,t1 O2,t2 O3,t3 O4,t4P2 O1,t5 O3,t6 O2,t7P3 O2,t7 O1,t8 O3,t8P4 O1,t8 O3,t9 O4,t10 O2,t11;O4,t12
Each operation (Oi) has a processing time (tj) that is required for a givenoperation of a given product type on a given machine.
2.2. Human resources
Several material flow relations exist for each machine as indicated on Fig. 1Instead of using costly automated material handling, this task is performed byhuman labor: skilled workers select the next workpiece from the input buffer(source) and move the workpiece between the individual assembly stations(machines) according to the specified order of operations of the product type.The operations are performed at the stations. One worker at a time canperform one operation on a suitable assembly station; thus, if an assemblystation is busy, the worker waits until it is released. After finishing the lastoperation, the assembled product is placed in the finished product container(drain). The cycle then starts again.
Consequently, the workers implement the ”one-piece” material flow in theinvestigated system. The assembly process on workstations cannot be inter-rupted: workers take breaks only after the product has been placed in thefinished product container (at the end of the running cycle). However, themany advantages of using human resources, the negative effects also appear in

Production planning with human resources 23
the production processes: the fulfilment of shift-level / daily / weekly produc-tion plans depends on the stochastic effects in the system, which stem mostlyfrom the uniqueness of people. Each operation has a predefined norm timethat serves as the basis for the preparation of production plans. From theseplans shift-level production plans are generated, typically evenly distributedover the shifts for a given period. Although workers are expected to adhereto the standard time, some differences can be discovered due to the worker’smanufacturing and assembly skills. While a rookie is usually not able to ad-here to the norm times, more experienced ones perform the operations withinthe norm time. There may also be differences between those working nightand day shifts. Thus, working skills can be interpreted as a percentage of thenorm time (average time) of performing a given operation. The complexityof the production process further increased with the involvement of workingskills, which also affects production planning, scheduling models and algo-rithms. This complexity justifies the use of simulation models and methods,with which the indicators of the productivity and efficiency can be evaluateddepending on the different production plans and employee skills.
3. Digital model of the production system
3.1. Model objects
A new digital model had been developed before the examination of the pre-sented production system. Real production and logistics processes are mappedin the model as follows:
• Modelling of production equipment (workstations, machines): Thereare 50 production equipment (A1-A50) with a fixed location in the pro-duction system. The cooperation of the production equipment and theworker results in the elementary operation of the manufacturing pro-cess on the workpiece, where an essential property of the workpiecechanges. A controlled series of property changes make up the manufac-turing process, which transforms the workpiece from the initial state tothe finished state. The most important parameter of the operation isthe processing time depending on the skills of the worker, which can bederived from the standard time for the execution of a specified operationof a fixed product on a given workstation (machine) (1).
t = tAjpik + t
Ajpik(1 −BOperatorl
pik/100) (3.1)
where:– Aj : a j machine;
– pik: operation k of product type i ;

24 N. Toth, Gy. Kulcsar
– tAjpik : standard time of operation k of product type i on machine
Aj ;
– Operatorl: operator l ;
– B : production skill of operator;
– BOperatorlpik : describes skills in percent of standard time of oper-
ation k of product type:– If the operator can maintain 100% of the norm time for the
given operation, then the operation time of the operationis the same as the norm time.
– If the operator is less than 100% able to meet the normtime of the given operation, the operation time increasesas the operator works slower, so the time of the operationwill be longer than the norm time.
– If the operator can carry out the operation shorter thanthe norm time of the given operation (more than 100%),the operation time of will be shorter than the norm time.
• Employee modelling: Workers travel between workstations (machines)on a predefined route at a specified average speed. The worker selectsthe workpiece on the input storage object (”Start”) and then visits theworkstations one by one according to the sequence of operations as-sociated with the product type. After the last operation, the finishedproduct is placed on the finished product storage object (”End”). Em-ployees have breaks of predetermined lengths, which they use on deci-sion. Breaks can used only after the finished product has been delivered.As multiple operators work at the same time, queues can form in case ofshared access workstations. The operator remains at the station untilthe current operation is performed. The processing time depends onthe actual operator capabilities. Operations are non-interruptible pro-cesses. There are equivalent machines that form a group with the sameproperties (certain operations can be performed on all equivalent ma-chines). In the model, 23 operators (Operator1, ..., Operator23) wereimplemented for the simulated production environment, with different(very, medium, less efficient) capabilities.
• Product modelling: There are 15 product families and 100 product typesin the model. Operation sequences are predefined for product families.The number and order of operations performed on the product types arethe same as on product families as types are specialized representationof families. However, norm time of operations may be individuallydefined.

Production planning with human resources 25
• ”Start” object (source): Functions as an input container, it stores theworkpieces awaiting production, from which the operator chooses one.
• ”End” object (drain): An object that implements the storage of finishedproducts. The finished product is placed here by the operators.
The Plant Simulation model of the production system is shown in Fig. 2along with the production equipment, workers, and product types currentlymanufactured. Workers travel on a dedicated route. Paths appear where thereis material flow between two workstations. Sankey diagram for two producttypes is also shown as an example. The thickness of the lines illustrates thesize of the volume produced from the product types and indicates the work-stations belonging to the technological process of the product type. Largeamount of basic data is required for the operation of the model and the exam-ination of the processes in the system, which is stored in a structured form inan external database. In addition to the properties of the basic objects of themodel (products, machines, workers), the basic data also include the materialflow relations and logical relationships between them. During the implemen-tation of the model, following the previously developed concept model [4],quick adaption of the structure by modifying the basic data is possible. Thestructure of the model changes automatically, according to the modified basicdata. Workstations, workers, products are created or deleted, the propertiesand data members of the model objects are dynamically updated.
Figure 2. Simulation model
The following consistent data and data structures are required for the op-eration of the outlined dynamic behaviour digital model:
• Lists of employees are assigned to the shifts. This data structure rep-resents an individual shift schedule of employees.
• List of product families, product types.

26 N. Toth, Gy. Kulcsar
• Shift schedule: Cyclic change of 8-hour or 12-hour shifts in daily fre-quency. In a given shift, a given team of workers with different abilitiesis available.
• Sequence of production operations of product families, assigning oper-ations to workstations where the given operation can be performed.
• Standard (norm) time for product type operations, which represents theexpected operation time.
• Matrix of standard time per operation of product types and capabilitiesof operators: an element of the matrix shows the percentage of the givenoperator’s ability to comply with the operation time (norm time) of thespecific operation.
• Average capability matrix of operators for each product family: anelement of the matrix specifies the percentage by which an operator cankeep norm time of any operation belonging to a given product family.
• List of production plans:– Number of products per product type to be produced during the
period.
– Number of products per product type in shifts to be produced dur-ing the period.
The efficiency of the production process and the fulfilment of the productionplan are greatly influenced by the order and number of different types of shiftsin the examined period, as well as the workers and their production capabilitiesassigned to shifts.
3.2. Simulation study of the production system
The purpose of our simulation study is to analyse the efficiency and perfor-mance of the production system under changing conditions. The first step inthe test is to set the current value of input parameters of the model. Currently,two main input parameter sets can be specified:
• The period under review, which defines the order and number of shifts,the operators working in each shift type and their capabilities.
• Production plan for the period considered. This is possible in two ways:– The quantity to be produced refers to the entire period under inves-
tigation, from which the production plans for each shift are auto-matically generated by distributing the products evenly dependingon the number of shifts.
– The quantity to be produced can also be specified directly per shift.
Based on the simulation results, statements are made on the performanceof the production system, the utilization of the employees, and the number
Production planning with human resources 27
of products produced. One of the most important aspects is the fulfilmentof the production plan, therefore one of the main indicators is the numberof products produced. The other indicator is the free capacity of the pro-duction system over time. The following conclusions can be drawn from therelationship between these two indicators:
1. If the production plan is not fulfilled (there are unmanufactured pieces)and there is significant free time left, then not all batches were man-ufactured in some shifts due to the workers production capabilities orinadequate management decisions.
2. If the production plan is not fulfilled (there are unmanufactured pieces)and there is no significant free time left, then the production plan isover-planned, i.e., the planned quantity cannot be produced in a givenperiod.
3. If the production plan is fulfilled and there is significant free time left,then the production is under-planned; there are free worker capacitiesand further pieces can be produced.
4. If the production plan is fulfilled and there is no significant free timeleft, the production plan adequately loads the system resources and thedistribution of workloads is close to the optimum.
However, not only the distribution of the workloads by shift influences theperformance of the system and the number of products produced. The man-agement and decision-making strategy that determines the operation of theemployees also plays a crucial role. Two events have been implemented in themodel that affect employee activity and production system performance:
1. Assigning the product types to be manufactured and the operators tothe ”Start” object, where the product types to be manufactured in ashift form a queue. The operator selects one of the waiting workpiecesin the queue. As there are product families that he is unable to produceat all due to his skills, the operator’s default selection strategy is to se-lect the first workpiece from the queue that he can produce. Despitethis is a very simple binding, it can have several effects on the produc-tion process. The production system is highly sensitive for the orderof the production queue. If the jobs behind each other belong to thesame product family and the workers can produce them, then the work-ers follow the same technological path, visiting the same workstationsin a row. This may result worker queues at workstations, increasingturnaround time and reducing efficiency.
2. Choice between equivalent machines: in certain cases (such as finishingoperations), more than one machine is usable to perform the same typeof operation. In such cases, the workers decision strategy is based on a

28 N. Toth, Gy. Kulcsar
penalty function, calculated for the available machines. This functionalso considers the number of products produced.
Simulation studies proved that productivity of the examined productionsystem and adequate utilisation of resources depend on the sequence of jobs inthe queue due to the binding of the workers and the workpieces to be produced,in addition to the many influencing parameters and decision strategies.
3.3. Simulation results
The simulation model is suitable for examining the fulfilment of the productionplan. The study covers 7 days with 14 shifts, where one shift is 12 hours length.The assignment of workers to shifts and their abilities were predefined. Theinput parameters of the model are as follows:
• Production plan for the period is indicated in Table 2:
Table 2. Production plan
Product type Quantity [pcs]1607 9100601 140159A 2381626 42006A8 12615A7 701257 714
• Time period of the study, sequence of shifts. The production plan isevenly distributed among the shifts based on the number of shifts (withrounding).
• Type and usage of employee skills:– using theoretical operator skills: disregarding the production capa-
bilities of the operators, each operator can produce each producttype within 100% of standard time.
– using average operator skills: the operating time can be calculatedfrom the norm time and the average ability of the worker.
• KPIs in the system:– number of products produced
– remaining free production capacity in time (remaining time is thesum of the remaining times at the end of the shifts when new prod-ucts are not produced).

Production planning with human resources 29
Results for the two investigated scenarios (theoretical and average operatorskills) are summarized in Table 3.
Table 3. Comparison of simulation run results
Theoretical skills Average skills
Planned quantity [pcs] 2618 2618
Produced quantity[pcs] 2562 2525
Remaining time [min] 835 339
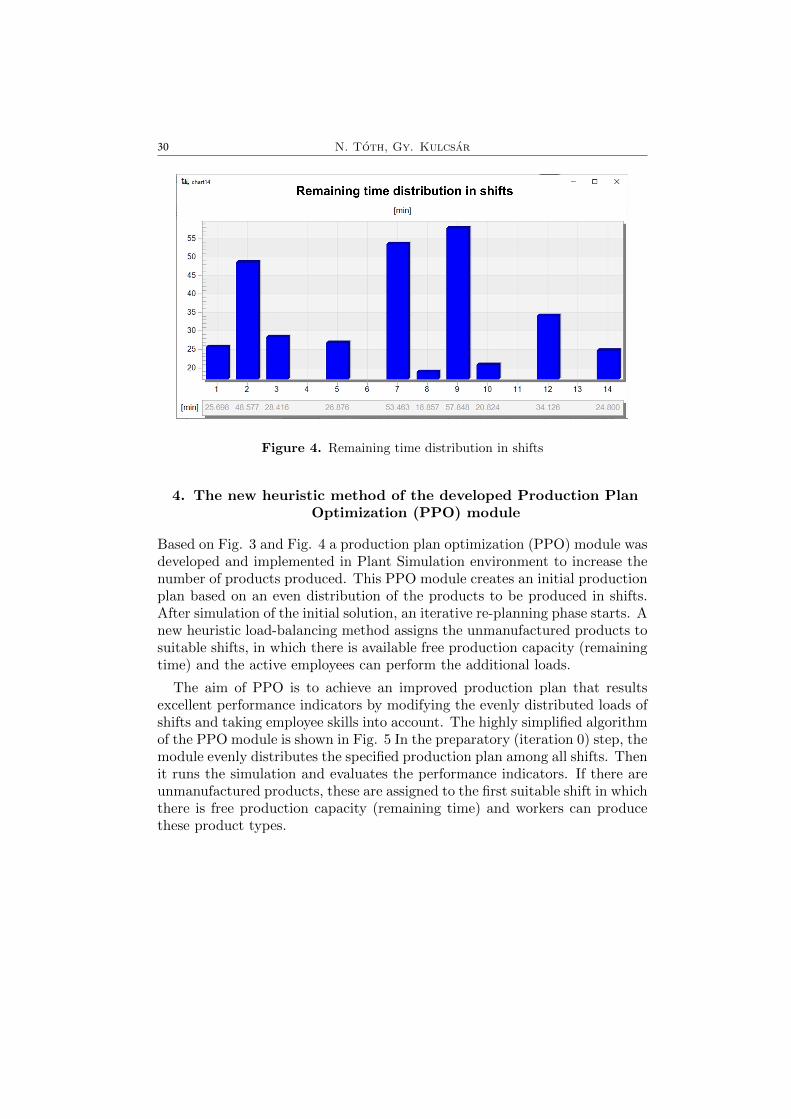
Table 3 indicates that the produced quantity is less than the planned quan-tity even if the workers perform with the maximum theoretical productionperformance. If the simulation runs with average capabilities, the amountproduced is decreased because workers are unable to perform operations dur-ing norm time. Although this increases the turnaround time of the products,the system has time reserves in both cases. In some cases, the production planfor a shift was fulfilled before the end of the shift. Operators are waiting untilthe end of the shift in such cases. The time reserve of a shift is defined as theamount of time remaining (free production capacity in time): the difference inthe useable time of the shift and the time required to complete the productionplan. Analysing quantities produced per shifts (Fig. 3) and free capacities intime (Fig. 4) show that some shifts are overloaded (4, 6, 11, 13), its workersare unable to meet the requirements in the production plan.
Figure 3. Quantities produced in shifts
30 N. Toth, Gy. Kulcsar
Figure 4. Remaining time distribution in shifts
4. The new heuristic method of the developed Production PlanOptimization (PPO) module
Based on Fig. 3 and Fig. 4 a production plan optimization (PPO) module wasdeveloped and implemented in Plant Simulation environment to increase thenumber of products produced. This PPO module creates an initial productionplan based on an even distribution of the products to be produced in shifts.After simulation of the initial solution, an iterative re-planning phase starts. Anew heuristic load-balancing method assigns the unmanufactured products tosuitable shifts, in which there is available free production capacity (remainingtime) and the active employees can perform the additional loads.
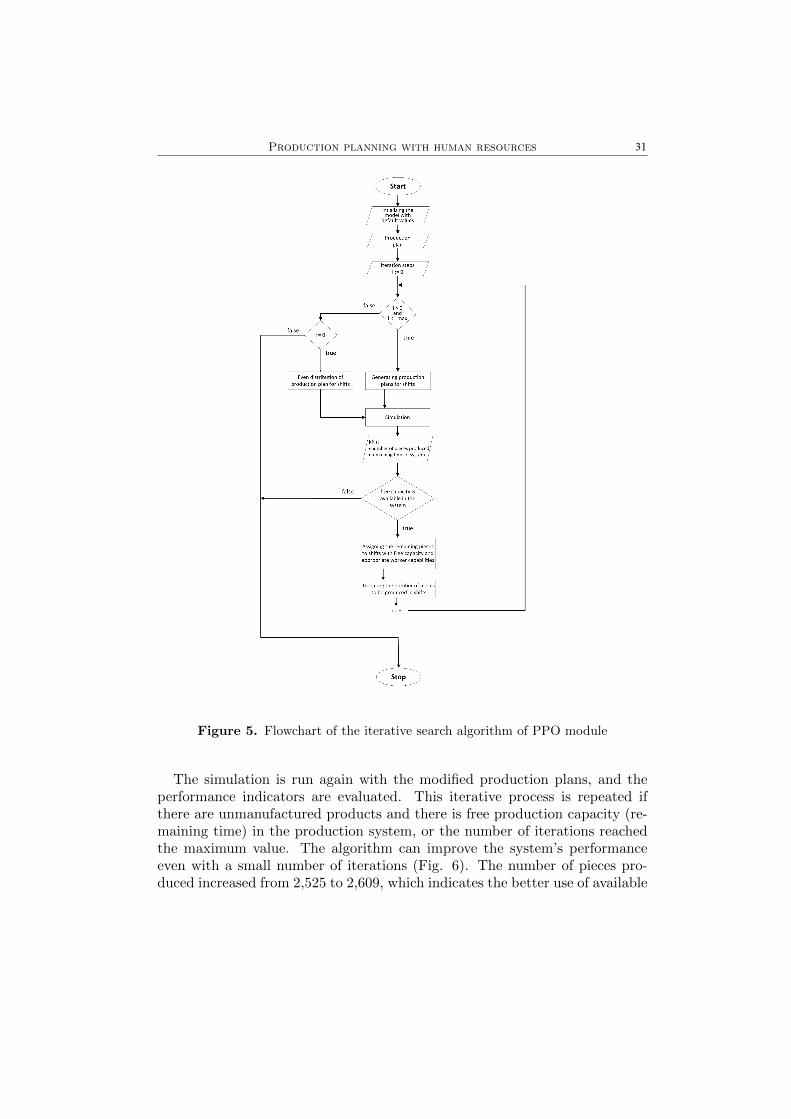
The aim of PPO is to achieve an improved production plan that resultsexcellent performance indicators by modifying the evenly distributed loads ofshifts and taking employee skills into account. The highly simplified algorithmof the PPO module is shown in Fig. 5 In the preparatory (iteration 0) step, themodule evenly distributes the specified production plan among all shifts. Thenit runs the simulation and evaluates the performance indicators. If there areunmanufactured products, these are assigned to the first suitable shift in whichthere is free production capacity (remaining time) and workers can producethese product types.
Production planning with human resources 31
Figure 5. Flowchart of the iterative search algorithm of PPO module
The simulation is run again with the modified production plans, and theperformance indicators are evaluated. This iterative process is repeated ifthere are unmanufactured products and there is free production capacity (re-maining time) in the production system, or the number of iterations reachedthe maximum value. The algorithm can improve the system’s performanceeven with a small number of iterations (Fig. 6). The number of pieces pro-duced increased from 2,525 to 2,609, which indicates the better use of available

32 N. Toth, Gy. Kulcsar
time base of the production system. This is also shown by the decrease in thefree time capacity of the system: from 393 minutes to 85 minutes.
Figure 6. PPO module iteration steps
The result of the iterative improving (re-planning) algorithm is a detailedproduction plan that specifies the numbers of pieces of the product types tobe produced in each shift. As an illustrative example for the investigated casestudy, the detailed production plan is indicated in Table 4.
Table 4. Number of pieces produced in shifts
Shift types 1.A 2.B 3.D 4.C 5.D 6.C 7.B 8.A 9.B 10.A 11.C 12.D 13.C 14.D
1607 69 68 67 56 68 56 70 68 70 66 57 68 56 71
0601 10 11 11 9 10 9 10 10 11 10 9 11 9 10
159A 18 19 17 15 18 15 18 17 18 18 15 17 15 18
1626 30 33 32 26 31 27 32 30 32 31 27 30 27 32
06A8 9 10 10 8 9 8 10 9 9 9 8 10 8 9
15A7 6 5 5 4 5 4 6 6 5 5 4 5 4 6
1257 53 54 53 44 54 43 55 54 55 52 43 54 44 56
Even distri-bution
187 187 187 187 187 187 187 187 187 187 187 187 187 187
PPO module 195 200 195 162 195 162 201 194 200 191 163 195 163 202
The implemented heuristic algorithm reduced the number of pieces to beproduced in some shifts, while it was increased in other shifts. Type C shiftworkers appeared in the system as bottlenecks. Their low production capabil-ity worsened the productivity of the shift.

Production planning with human resources 33
5. Summary and further development
In this paper, a special model of a flexible production system was presented,where human resources, production efficiency and employee skills play keyroles to achieve the maximum productivity that can be expected from theproduction system. This direction of modelling and development is necessarybecause the human factor also has a strong influence on the performance ofthe flexible production process. In conclusion, the human factor must be inte-grated into the models and methods of organization, planning and schedulingof production to achieve the desired effect of the planned changes that aimedto increase the efficiency.
For this purpose, a digital simulation model was developed, which is suit-able for considering the impact of the human factor at the levels of productionplanning, scheduling and control. A new heuristic algorithm was used, whichincreases the performance of the production system by improving the produc-tion plan for each shift. Even better results may be reached with optimizingthe production sequence by using a novel strategy to assign dynamically theworkpieces to the workers. This strategy can be put into practice if the con-trol system supports each worker to select the workpiece that best suits hisproduction ability and takes the product types already in production into ac-count to reduce waiting times at workstations. This concept can be ensuredby maximizing the heterogeneity of the product types produced at same time.It is recommended that the worker should choose a product type that fewworkers can produce. It is preferred that the control system also considers theproduction capability of all the other workers in order to effectively managethe dynamic manufacturing processes.
This proposed approach ensures the continuous work of the workers andincreases the number of pieces produced.
In the future, several additional considerations must be taken in order to de-termine automatically quasi-optimal shift-level production sequences. We aredeveloping a multi-objective priority-based rescheduling algorithm to extendthe presented simulation model and solutions.
REFERENCES
[1] Szakal, F., Jozsa, L.: A 21. szazad fogyasztoja, avagy mi a fontosa fogyasztonak a modern vilagban, ”Kulturalis gazdasag” Kautz GyulaEmlekkonferencia elektronikus formaban megjeleno kotete, Szechenyi IstvanEgyetem, Gyor, 2019, ISBN 978-615-5837-34-0.
[2] Toth, N., Ladanyi, R., Garamvolgyi, E.: Elaborating Industry 4.0 compat-ible DSS for enhancing production system effectiveness, IOP Conf. Ser.: Mater.
34 N. Toth, Gy. Kulcsar
Sci. Eng., Vol. 448 012040, Kecskemet, Hungary, 2018, https://10.1088/1757-899X/448/1/012040.
[3] Russmann, M., Lorenz, P., Gerbert, P., Waldner, M., Jastuss, J., Hen-gel, P., Harnisch, M.: Industry 4.0: the future of productivity and growth inmanufacturing industries, The Boston Consultin Group report, 2015.
[4] Toth, N.: Termelesi folyamatok intenzifikalasat celzo uj modszer bemutatasa az
Ipar 4.0 lehetosegei alapjan, Muszaki Tudomany az Eszak-kelet MagyarorszagiRegioban, Konferencia Kiadvany, Debrecen, 2019, pp. 396-399., ISBN978-963-7064-38-8.
[5] VDI-Richtlinie 3633 Blatt 1.: Simulation von Logistik-, Materialfluss- undProduktionssystemen-Grundlagen, Dusseldorf, VDI-Verlag, 1993.
[6] Siderska, J.: Application of Tecnomatix Plant Simulation for modeling produc-tion and logistics processes. Business, Management and Education, 14(1), 2016,pp. 64-73., https://doi.org/10.3846/bme.2016.316.
[7] Tamas, P., Illes, B., Tollar, S.: Simulation Of A Flexible ManufacturingSystem, Advanced Logistic systems, University of Miskolc, Department of Ma-terial Handling and Logistics, Vol. 6(1), December, 2012, pp. 25-32., HU ISSN1789-2198.
[8] SIEMENS AG.: Tecnomatix Plant Simulation Help, 2017.
[9] Kulcsar, Gy., Erdelyi, F.: A New Approach to Solve Multi-Objective Schedul-ing and Rescheduling Tasks, International Journal of Computational IntelligenceResearch, 3 (4), 2007, pp. 343-351., DOI: 10.5019/j.ijcir.2007.115.
[10] Kulcsar, Gy.: Utemezesi modell es heurisztikus modszerek az igeny szerintitomeg-gyartas finomprogramozasanak tamogatasara, Doktori (PhD) ertekezes,Miskolci Egyetem, Miskolc-Egyetemvaros, 2007.
[11] Kulcsarne, F. M.: Kiterjesztett modellek es modszerek eroforras-korlatostermelesutemezesi feladatok megoldasara, Doktori (PhD) ertekezes, MiskolciEgyetem, Miskolc-Egyetemvaros, 2017.
[12] Kulcsar, Gy., Kulcsarne, F. M.: Kiterjesztett termelesprogramozasi mod-ell eroforras-korlatos utemezesi feladatok megoldasara, Multidiszciplinaris tu-domanyok, 4. 1. sz., 2014, pp. 19-30.
[13] Botta-Genoulaz, V.: Hybrid flow shop scheduling with precedence constraintsand time lags to minimize maximum lateness. International Journal of Produc-tion Economics, Vol. 64, 2000., pp. 101–111., https://doi.org/10.1016/S0925-5273(99)00048-1.
[14] Low, C.: Simulated annealing heuristic for flow shop scheduling problems withunrelated parallel machines, Com-puters and Operations Research, Vol. 32, 2005.,pp. 2013–2025., https://doi.org/10.1016/j.cor.2004.01.003.
[15] Demir, Y., Isleyen, S. K.:Evaluation of mathematical models for flexible job-shop scheduling problems, Applied Mathematical Modelling, Volume 37, Issue 3,2013, pp. 977-988., ISSN 0307-904X, https://doi.org/10.1016/j.apm.2012.03.020.

Production planning with human resources 35
[16] Fogarasi, G., Tuu-Szabo, B., Foldesi, P.: Az Utazo Ugynok Problemaraalkalmazhato diszkret memetikus evolucios metaheurisztikak osszehasonlıtasa,Logisztika-Informatika-Menedzsment Vol. 4, number 1, 2019., pp. 15-30., doi:10.29177/LIM.2019.1.15.

Production Systems and Information Engineering Volume 9 (2020), pp. 36–53 36
STUDENT ACADEMIC PERFORMANCE PREDICTION
Jawad AlshboulUniversity of Miskolc, Hungary
Department of Information Technology
Erika Baksa-VargaUniversity of Miskolc, Hungary
Department of Information Technology
[Received . . . and accepted . . . ]
Abstract. Given the increasing number of students who attend tradi-tional and non-traditional classes that deploy internet-based educationalresources and environments, large volumes of data are being generatedon a daily basis. As a result, more researchers are now working withEducational Data Mining (EDM) methods to understand learning pro-cesses and behaviors of learners. The problem that led to this researchis the need to make use of unused data that is collected during educationand learning processes by gaining insights in order to support students inregards to their academic performance and in taking actions to preventor warn students from failure. The main focus of this research is on howEDM can support student learning in regards to student academic per-formance, engagement, and intervention. The research mainly addressesthe appropriate EDM methods used to predict student academic perfor-mance. Modeling and evaluation of several classifiers were conducted.As a result, Random Forest classifier has been chosen as the best modelto be deployed in an interactive R Shiny application.
Keywords: educational data mining, academic performance prediction,classification
1. Introduction
Due to the growing use of educational resources and technologies, educationaldata are being generated in huge amounts on a daily basis. Data-driven deci-sion making (DDDM) refers to the systematic processes of collection, analysis,and interpretation of data to help in decision making [1]. Educational data

37 J. Alshboul and E. Baksa-Varga
can be used in DDDM at different educational levels to achieve effective edu-cational data decision making. DDDM for educational data can be related toeducational resources, and human resources decisions.
Data-Driven Education enables institutions to leverage educational data to getinsights about teaching-learning process and to make data-driven educationaldecisions based on student needs [2]. DDDM includes exploiting availabledata, such as the kind offered in virtual learning environments or LearningManagement Systems (LMS), to make teaching decisions [3, 4]. Values un-derlying educational data mining are to analyze student learning data and itscontexts in order to better understand and personalize student learning expe-riences [5, 6].
According to [7], Data Mining (DM) is a computerized information systemdedicated to handle large amounts of data, produce information, and discoverhidden patterns. The demand on using DM in educational settings led to theestablishment of Educational Data Mining (EDM) as a new field of knowledgeand line of research [8]. The growing acceptance of the emergent field, EDM,is due to its ability to elicit valuable insights from data for either studentsor staff [9]. The authors in [10] define EDM as a multidisciplinary field ofstudy that combines skills and knowledge from machine learning, statistics,DM, psychology, information retrieval, cognitive science, and recommendersystems techniques to support resolving issues related to education.
The main reason for the late emergence of data mining in education, comparedto all other fields, was that the availability of large educational datasets inmachine readable formats emerged later in education [11].
2. Educational Data Mining Methods and Applications
2.1. Regression Techniques
There is a number of regression algorithms such as: Single Linear Regression,and Multiple Linear Regression. The regression technique is used to predictvalues and it has been applied in education domain to: predict students’grades [12], and predict academic GPA of graduated student [13].
2.2. Classification Techniques
There is a number of classification algorithms such as: Decision Trees, Neu-ral Networks, Logistic Regression, and Nave Bayes classifiers. Classification

Student Academic Performance Prediction 38
techniques have been applied in education domain to: analyze the academicperformance of undergraduate students [14], assess how effective EDM tech-niques are for students early prediction failure [15], and develop a model toprevent academic dropout [16].
2.3. Clustering Techniques
There are different clustering algorithms such as: K-Means and ExpectationMaximization. Clustering techniques have been applied in education domainto: generate a model for student dropout by exploring student categories andcharacteristics [17], group university students into careers by analyzing theirperformance and outcomes of the self-evaluation test beginning from their firstyear [18], associate students and teachers [19], and group competent studentsof an educational institution in regards to their skills and abilities [20].
2.4. Association Rules Techniques
The association rule mining techniques are applied to identify associations ordependencies between attributes in the datasets [21]. Association Rules havebeen applied in education domain to: propose a quantifiable measure thatshows degradation in regard to students expected performance [22], analyzestudents’ performance based on real time patterns in students’ data [23], in-vestigate on association between self-esteem and performance of students [24],and discover the impact of teaching on improving how student performs [9].
2.5. Social Network Analysis and Visualization Techniques
Social Network Analysis (SNA) and Visualization can reduce the size of thedatasets and their complexity in case they are multidimensional datasets. SNAand visualization have been applied in education domain to: introduce a modelbased on visual analytics, and learning analytics, in addition to a tool, to per-form confirmatory and exploratory data analysis through interaction betweeninformation gathered [25], process the interaction networks of students in aforum [26], and check the progress of online collaborative learning and provideinformed interventions when needed [27].
2.6. Process Mining Techniques
Process Mining techniques are used to deal with log files and events and theyhave been applied in education domain to: analyze events flow logs in an adap-tive learning model [28, 29], and provide feedback on the basis of behavioraldata [30].

39 J. Alshboul and E. Baksa-Varga
2.7. Text Mining Techniques
Text Mining techniques are used to deal with unstructured data by capturingkey terms and uncover hidden patterns. Text Mining techniques have been ap-plied in education domain to: analyze students’ online interaction via onlinequestions and chat messages [31], extract knowledge from students’ evalua-tion comments that help instructors and administrators obtain understandingof student sentiments and views [32], and rate educational institute facultymembers based on the feedback submitted by students [33].
2.8. Outlier Detection Techniques
Outlier Detection is used to check whether there is any deviation in any obser-vation away from all other observations using data mining algorithms basedon association, classification, clustering, visualization, or statistics-based ap-proach. It has been used in education domain to: discover any anomaly orabnormal observations [34, 35], and predict dropouts by clustering outlier datawith unsupervised learning [36].
2.9. Student Academic Performance Prediction
Student academic performance prediction has been an important researchtopic for years since students and institutions can benefit from discoveringpatterns and insights hidden within learning data. Institutions can benefitfrom it by improving the effectiveness of academic facilities available to theirstudents in order to increase the rates of students who are successful in com-pleting their programs or courses of study. Furthermore, findings can be usedto deliver solutions, suggestions, or advices to students to enhance how theyperform in the future.
A review of literature on the methods used for student academic performanceprediction was conducted. The search focused on Scopus, IEEE, GoogleScholar, and ACM for years 2009 to 2019. The number of relevant articlesused for the synthesis, after excluding the articles that did not describe thedata sets attributes or methods used, is 157 articles.
Table 1 shows some statistics related to the modeling techniques that havebeen used in the studies related to performance prediction. It is shown that themostly used classification modeling techniques are: Decision Trees, Bayesian-Based, Neural Networks, Support Vector Machines, Ensemble Methods, K-Nearest Neighbor, and Logistic Regression, respectively.

Student Academic Performance Prediction 40
Table 1. Statistics of modeling techniques used
Modeling Technique Count PercentageDecision Trees 79 50.3 %Bayesian-based 65 41.4 %Neural Networks 43 27.4 %Support Vector Machines 34 21.7 %Linear Regression 34 21.7 %Ensemble Methods 29 18.5 %K-Nearest Neighbor 24 15.3 %Logistic Regression 22 14.0 %Others (Hybrid, optimization, statistical, ..etc.) 12 7.6 %Rule Induction 9 5.7 %
3. Research Methodology
3.1. Research Objectives and Research Questions
The research question (RQ) for each research objective (RO) is explained asfollows:RO1. To investigate the appropriate educational data mining methods usedin predicting student academic performance.RQ1. What are the appropriate techniques that are used to predict studentacademic performance?RO2. To apply educational data mining methods to support academic inter-vention.RQ2. How can educational data mining be used to support academic inter-vention?
3.2. Data Collection and Preparation
A quantitative dataset [37] has been chosen based on the literature review con-ducted to get answers for research questions. The significance of this datasetis due to adopting student behavioral features with academic data during thelearning process.
The dataset used was collected from a multi-agent Learning Management Sys-tem (LMS) called Kalboard 360 using Experience API (xAPI) web service [37].
An activity tracker tool called experience API (xAPI) was used to track learn-ers. The dataset shown in Table 2 consists of 480 student records and 16
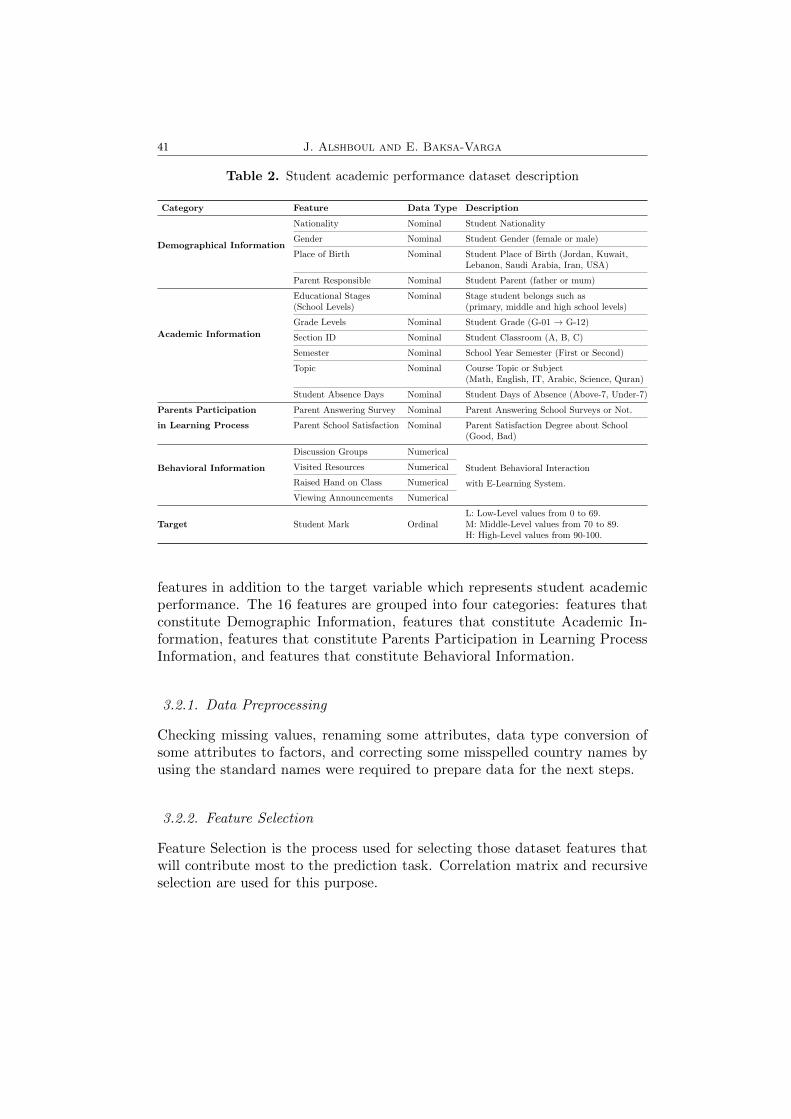
41 J. Alshboul and E. Baksa-Varga
Table 2. Student academic performance dataset description
Category Feature Data Type Description
Demographical Information
Nationality Nominal Student Nationality
Gender Nominal Student Gender (female or male)
Place of Birth Nominal Student Place of Birth (Jordan, Kuwait,Lebanon, Saudi Arabia, Iran, USA)
Parent Responsible Nominal Student Parent (father or mum)
Academic Information
Educational Stages Nominal Stage student belongs such as(School Levels) (primary, middle and high school levels)
Grade Levels Nominal Student Grade (G-01 → G-12)
Section ID Nominal Student Classroom (A, B, C)
Semester Nominal School Year Semester (First or Second)
Topic Nominal Course Topic or Subject(Math, English, IT, Arabic, Science, Quran)
Student Absence Days Nominal Student Days of Absence (Above-7, Under-7)
Parents Participation Parent Answering Survey Nominal Parent Answering School Surveys or Not.
in Learning Process Parent School Satisfaction Nominal Parent Satisfaction Degree about School(Good, Bad)
Behavioral Information
Discussion Groups Numerical
Student Behavioral InteractionVisited Resources Numerical
with E-Learning System.Raised Hand on Class Numerical
Viewing Announcements Numerical
Target Student Mark OrdinalL: Low-Level values from 0 to 69.M: Middle-Level values from 70 to 89.H: High-Level values from 90-100.
features in addition to the target variable which represents student academicperformance. The 16 features are grouped into four categories: features thatconstitute Demographic Information, features that constitute Academic In-formation, features that constitute Parents Participation in Learning ProcessInformation, and features that constitute Behavioral Information.
3.2.1. Data Preprocessing
Checking missing values, renaming some attributes, data type conversion ofsome attributes to factors, and correcting some misspelled country names byusing the standard names were required to prepare data for the next steps.
3.2.2. Feature Selection
Feature Selection is the process used for selecting those dataset features thatwill contribute most to the prediction task. Correlation matrix and recursiveselection are used for this purpose.
Student Academic Performance Prediction 42
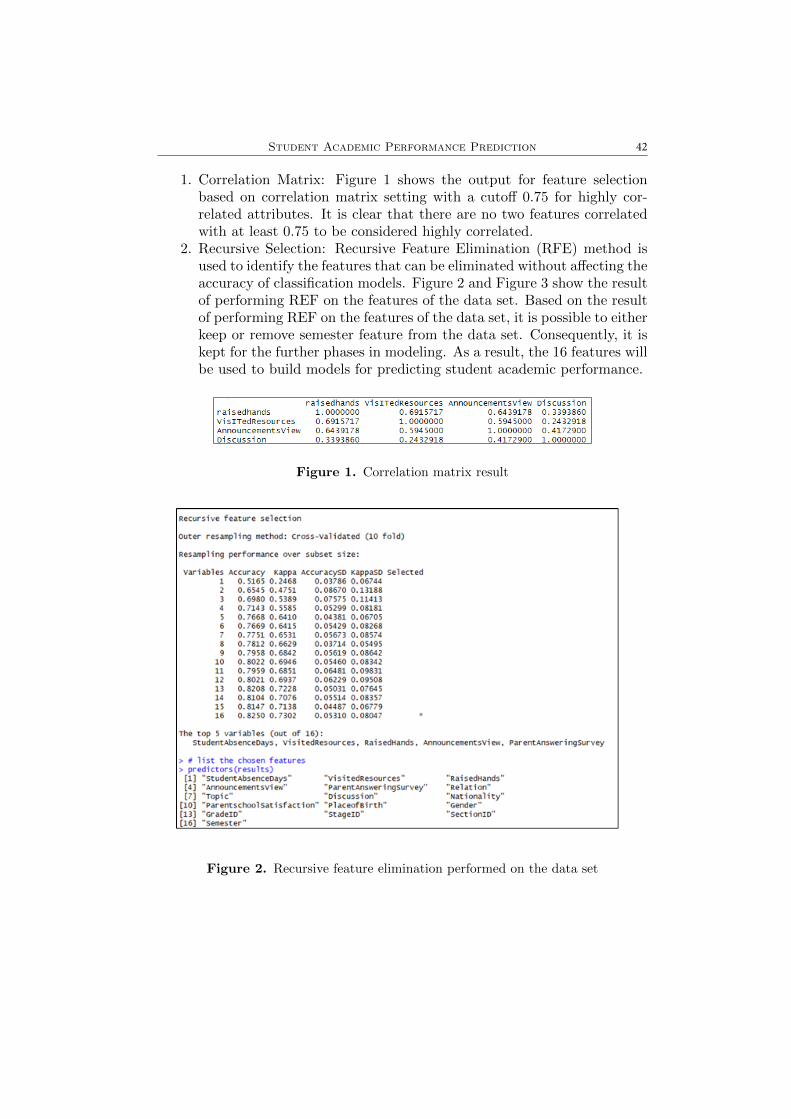
1. Correlation Matrix: Figure 1 shows the output for feature selectionbased on correlation matrix setting with a cutoff 0.75 for highly cor-related attributes. It is clear that there are no two features correlatedwith at least 0.75 to be considered highly correlated.
2. Recursive Selection: Recursive Feature Elimination (RFE) method isused to identify the features that can be eliminated without affecting theaccuracy of classification models. Figure 2 and Figure 3 show the resultof performing REF on the features of the data set. Based on the resultof performing REF on the features of the data set, it is possible to eitherkeep or remove semester feature from the data set. Consequently, it iskept for the further phases in modeling. As a result, the 16 features willbe used to build models for predicting student academic performance.
Figure 1. Correlation matrix result
Figure 2. Recursive feature elimination performed on the data set

43 J. Alshboul and E. Baksa-Varga
Figure 3. Accuracy based on importance of features in modeling classifiers
3.3. Modeling
The classification techniques used are: Decision Trees, Naive Bayes, K-NearestNeighbors, Support Vector Machines, Logistic Regression, Ensemble Methods(Random Forest), and Neural Networks.
3.3.1. K-Nearest Neighbor (KNN)
It is a non-parametric, instance-based supervised learning algorithm, and easyto implement and understand but computationally expensive. KNN algorithmworks as follows:
1. Choose K as the number of neighbors.2. Select the K nearest neighbors of the unknown data point based on
their Euclidean distances (Or other distance measure if the points arecategories) from that unknown data point.
3. From the selected K neighbors, compute the number of data points ineach category.
4. Allocate the new data to the category that has the largest count ofneighbors among other categories.
3.3.2. Decision Tree (DT)
It is a supervised learning algorithm and It works for both continuous andcategorical data. It splits the nodes based on all features then selects the

Student Academic Performance Prediction 44
appropriate split using some criteria such as Gini index, Information Gain,and Variance. DT algorithm works as follows:
1. Place all training examples at the root node.2. Categorize the data set attributes.3. Split examples based on specific selected attributes.4. Select test attributes based on a specific measure like statistics or heuris-
tic.5. Stop when: all examples being members of the same class, no attributes
left for partitioning, or no examples left for classification.
3.3.3. Support Vector Machines (SVM)
They are supervised learning algorithms that can be used for both classificationand regression problems. SVM algorithm works in the following steps:
1. Plot each data point in an m-dimensional space where m represents thenumber of attributes in the dataset.
2. Perform classification by trying to find the suitable hyperplane thatseparates the classes.
3.3.4. Logistic Regression (LR)
It is a supervised learning algorithm that can be used for binary classificationbut can deal with multi-class classification problems as well by using one-vs-all principle. A logistic function called sigmoid function is used to map theoutputs to probabilities. One-vs-all classification is performed by training Mdistinct binary classifiers in which each trained binary classifier can recognizea particular class. Consequently, those M classifiers are combined together tobe used for multi-class classification.
3.3.5. Random Forest (RF)
It is an ensemble decision tree that creates and combines many decision trees.Creating and combining many decision trees allow weak decision trees on theirown to be used in order to create a stronger decision tree with better accuracy.It is called random because the attributes are chosen randomly during modelbuilding and training. Furthermore, it is called forest because it takes outputsof many decision trees to create a better decision tree. RF algorithm works inthe following steps:
1. Choose n samples randomly from the training set.2. Grow a decision tree from the chosen sample by selecting a number of
features randomly.

45 J. Alshboul and E. Baksa-Varga
3. Split the node based on a chosen feature which has the highest infor-mation gain.
4. Repeat the previous steps K times (K represents the number of trees tobe created).
5. Aggregate the trees and then choose the majority class based on voting.
3.3.6. Nave Bayes (NB)
It is a Bayes theorem-based supervised learning algorithm. It is called navebecause it assumes that an attribute is independent in terms of probability tohappen from all other features. NB formula is shown as follows:
P (C|f) =P (f |C)P (C)
P (f)= P (f1|C)× P (f2|C)× ...× P (fn|C)× P (C) (3.1)
Where C is the class and fi is any feature.
3.3.7. Neural Networks (NN)
They are machine learning algorithms that are built based on the humanbrain. They can be used for multi-class classification problems by consideringone-vs-all principle. An activation function is used to take a number of inputsto produce an output. Assume there are M classes, one-vs-all classification isperformed by training M distinct binary classifiers in which each trained binaryclassifier can recognize a specific class. Consequently, those M classifiers worktogether to be used for multi-class classification.
3.4. Evaluation
A decision on the adoption of the EDM outcomes should be delivered basedon the evaluation phase. The Confusion matrix will be used for calculatingthe correctness and accuracy of the model.
Since target variable classes are nearly balanced, accuracy will be used as aperformance metric to compare the models. The Confusion matrix is an easyand intuitive metric used for finding the correctness and accuracy of the model.It is used for classification problems where the output would be of two or moretypes of classes. Some Terminology and derivations from a confusion matrixare shown as follow:
1. True Positive (TP): Cases that are TRUE and predicted correctly asTRUE.

Student Academic Performance Prediction 46
2. True Negative (TN): Cases that are FALSE and predicted correctly asFALSE.
3. False Positive (FP): Cases that are FALSE but predicted incorrectly asTRUE (known as ”Type I error”).
4. False Negative (FN): Cases that are TRUE but predicted incorrectly asFALSE (known as ”Type II error”)
Accuracy is a metric for evaluating classification models and it refers to thepercentage of predictions that happen to be right. Based on the contents ofthe confusion matrix it is possible to extract the accuracy of the model asshown in following formula:
Accuracy =TP + TN
TP + FN + FP + TN(3.2)
The research tools need to verify the reliability and validity. In quantitativeresearch, enhancing and verifying of experiments are achieved through mea-surement of the validity and reliability [38]. To make sure that the study isreliable and valid, the experiments conducted using 10-fold cross validationrepeated for 10 times.
Figure 4 shows the final result as a comparison based on the accuracy of eachclassifier. Random Forest (RF) implemented using the Caret package showsthe best performance with 85% accuracy.
Figure 4. Accuracy measure of each classifier
4. Discussion
4.1. Deployment
Deployment phase includes the outputs of the experiments as explained inModeling and it shows a deployment of the best model, found during modeling
47 J. Alshboul and E. Baksa-Varga
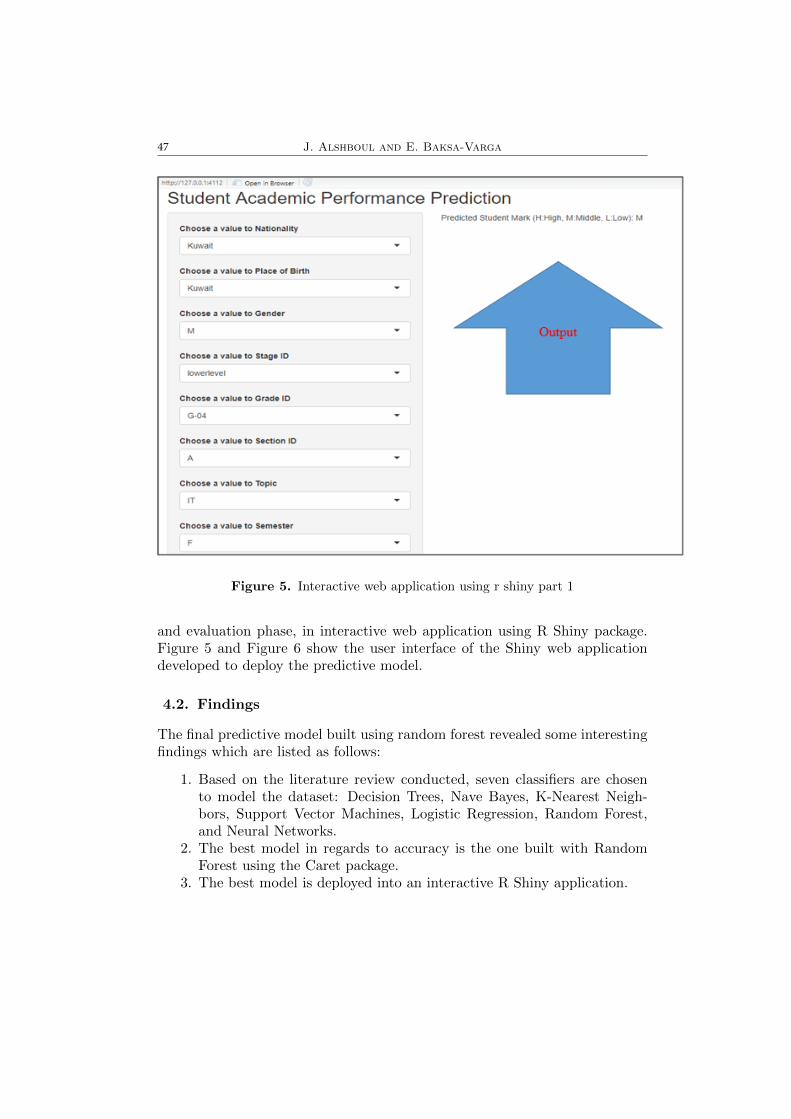
Figure 5. Interactive web application using r shiny part 1
and evaluation phase, in interactive web application using R Shiny package.Figure 5 and Figure 6 show the user interface of the Shiny web applicationdeveloped to deploy the predictive model.
4.2. Findings
The final predictive model built using random forest revealed some interestingfindings which are listed as follows:
1. Based on the literature review conducted, seven classifiers are chosento model the dataset: Decision Trees, Nave Bayes, K-Nearest Neigh-bors, Support Vector Machines, Logistic Regression, Random Forest,and Neural Networks.
2. The best model in regards to accuracy is the one built with RandomForest using the Caret package.
3. The best model is deployed into an interactive R Shiny application.

Student Academic Performance Prediction 48
4.3. Fulfilment of Research Objectives
RO1. Investigating the appropriate educational data mining methods usedin predicting student academic performance has been achieved by describingthe techniques of educational data mining first, then exploring educationaldata mining techniques used in predicting student academic performance indepth as discussed in Section 2. Educational Data Mining techniques exploredare regression, classification, clustering, association rules, social network anal-ysis and visualization, process mining, text mining, and outlier detection.A synthesis of literature related to the appropriate educational data miningtechniques relevant to student academic performance prediction shows thatthere are two relevant educational data mining techniques which are regres-sion (Linear Regression) and classification (Decision Trees, Bayesian-Based,Neural Networks, Support Vector Machines, Ensemble Methods, K-NearestNeighbor, and Logistic Regression).
Figure 6. Interactive web application using r shiny part 2

49 J. Alshboul and E. Baksa-Varga
RO2. To apply educational data mining methods to support academic inter-vention by applying the relevant educational data mining classification tech-niques explained in the synthesis of the literature review performed in Section 2on an appropriate dataset and building a model using R Shiny to gain insightsfrom learning data in order to support students in regards to their academicperformance and in taking actions to prevent or warn students from failurewhich leads to grade improvement that in turn will drive the overall degreesuccess as discussed in Sections 3.2, 3.3, 3.4, and 4.1.
5. Conclusion
5.1. Summary
Mining educational data is far from conclusive, yet it has been evolving andgrowing continuously. Using the appropriate tools and the research lines inthis area are not only going to help students and instructors but also theother stakeholders/users and that impact has been extended to parents, soci-ety, and the public in general. The main focus of this research is on how EDMcan support student learning in regards to student academic performance, en-gagement, and intervention through predicting the academic performance ofstudents.
Student academic performance prediction has been a research topic of a signif-icant value for many years because students and institutions can gain findingsand insights uncovered from learning data. Institutions can gain from it bytrying to enhance the quality of academic services and resources made availableto their students in order to increase the rates of students who can progresswith their study and be successful in completing their programs or courses ofstudy. In addition, findings or insights can be deployed to deliver solutions,suggestions, or advices to students in order to improve their performance inthe future.
5.2. Future Work
Since random forest has been the best model implemented and it gave anaccuracy of 85%, it would be advisable to try adopting advanced methods forclassification models like genetic algorithms and see if they can further improvethe accuracy/performance of the model. Furthermore, with new data added,models can be tested again and see if there is any improvement in accuracy.Once a model has shown better performance, it is easy to adopt and use it fordeployment on Shiny and Azure Machine Learning Studio.

Student Academic Performance Prediction 50
REFERENCES
[1] Mandinach, E. B.: A perfect time for data use: Using data-driven decisionmaking to inform practice. Educational Psychologist, 47(2), (2012), 71–85.
[2] Slade, S. and Prinsloo, P.: Learning analytics: Ethical issues and dilem-mas. American Behavioral Scientist, 57(10), (2013), 1510–1529, URL <Go to
ISI>://WOS:000324103200009.
[3] Picciano, A.: The evolution of big data and learning analytics in americanhigher education. Journal of Asynchronous Learning Network, 16.
[4] Zeide, E.: The structural consequences of big data-driven education. Big Data,5(2), (2017), 164–172, URL <Go to ISI>://WOS:000403939100008.
[5] Patwa, N., Seetharaman, A., Sreekumar, K., and Phani, S.: Learninganalytics: Enhancing the quality of higher education. Research Journal of Eco-nomics, 2(2).
[6] Roberts, L. D., Howell, J. A., Seaman, K., and Gibson, D. C.: Studentattitudes toward learning analytics in higher education: ”the fitbit version of thelearning world”. Frontiers in psychology, 7, (2016), 1959–1959.
[7] Pena-Ayala, A.: Educational data mining: A survey and a data mining-basedanalysis of recent works. Expert Systems with Applications, 41(4), (2014), 1432–1462, URL <Go to ISI>://WOS:000330158700045.
[8] Romero, C. and Ventura, S.: Educational data mining: A reviewof the state of the art. Ieee Transactions on Systems Man and Cybernet-ics Part C-Applications and Reviews, 40(6), (2010), 601–618, URL <Go to
ISI>://WOS:000283447800001.
[9] Khan, A. and Ghosh, S. K.: Data mining based analysis to explore the effectof teaching on student performance. Education and Information Technologies,23(4), (2018), 1677–1697.
[10] Dutt, A., Ismail, M. A., and Herawan, T.: A systematic review on educa-tional data mining. IEEE Access, 5, (2017), 15991–16005.
[11] Baker, R. S.: Educational data mining: An advance for intelligent systemsin education. IEEE Intelligent Systems, 29(3), (2014), 78–82, URL <Go to
ISI>://WOS:000341575700014.
[12] Lopez, S. L. S., Redondo, R. P. D., and Vilas, A. F.: Predict-ing students’ grade based on social and content interactions. InternationalJournal of Engineering Education, 34(3), (2018), 940–952, URL <Go to
ISI>://WOS:000443168300010.
[13] Nasiri, M., Minaei, B., and Vafaei, F.: Predicting gpa and academic dis-missal in lms using educational data mining: A case mining. In 3rd Interna-tional Conference on E-Learning and E-Teaching (ICELET), IEEE InternationalConference on E-Learning and E-Teaching, IEEE Computer Soc, LOS ALAMI-TOS, ISBN 978-1-4673-0958-5; 978-1-4673-0956-1, 2012, pp. 53–58, URL <Go to
ISI>://WOS:000310432500008.

51 J. Alshboul and E. Baksa-Varga
[14] Asif, R., Merceron, A., Ali, S. A., and Haider, N. G.: Analyzing under-graduate students’ performance using educational data mining. Computers andEducation, 113, (2017), 177–194, URL <Go to ISI>://WOS:000406728400013.
[15] Costa, E. B., Fonseca, B., Santana, M. A., de Araujo, F. F., andRego, J.: Evaluating the effectiveness of educational data mining techniquesfor early prediction of students’ academic failure in introductory programmingcourses. Computers in Human Behavior, 73, (2017), 247–256, URL <Go to
ISI>://WOS:000403625400025.
[16] Burgos, C., Campanario, M. L., de la Pena, D., Lara, J. A., Lizcano,D., and Martinez, M. A.: Data mining for modeling students’ performance:A tutoring action plan to prevent academic dropout. Computers and ElectricalEngineering, 66, (2018), 541–556, URL <Go to ISI>://WOS:000429760300041.
[17] Iam-On, N. and Boongoen, T.: Generating descriptive model for studentdropout: a review of clustering approach. Human-Centric Computing and Infor-mation Sciences, 7, (2017), 24, URL <Go to ISI>://WOS:000396492500001.
[18] Campagni, R., Merlini, D., and Verri, M. C.: University student pro-gressions and first year behaviour. Proceedings of the 9th International Confer-ence on Computer Supported Education (Csedu), Vol 2, pp. 46–56, URL <Go to
ISI>://WOS:000444908800004.
[19] Najera, A. B. U., de la Calleja, J., and Medina, M. A.: Associatingstudents and teachers for tutoring in higher education using clustering and datamining. Computer Applications in Engineering Education, 25(5), (2017), 823–832, URL <Go to ISI>://WOS:000410722900013.
[20] Ashok, M. V. and Apoorva, A.: Clustering proficient students using datamining approach. Advances in Computing and Data Sciences, Icacds 2016, 721,(2017), 70–80, URL <Go to ISI>://WOS:000434872100008.
[21] Alharbi, Z., Cornford, J., Dolder, L., and Iglesia, B. D. L.: Using datamining techniques to predict students at risk of poor performance. In 2016 SAIComputing Conference (SAI), pp. 523–531.
[22] Khan, A. and Ghosh, S. K.: Analysing the impact of poor teaching on studentperformance. Proceedings of 2016 Ieee International Conference on Teaching,Assessment, and Learning for Engineering (Tale), pp. 169–175, URL <Go to
ISI>://WOS:000400475400029.
[23] Parkavi, A. and Lakshmi, K.: Pattern analysis of blooms knowledge levelstudents performance using association rule mining. 2017 Ieee InternationalConference on Smart Technologies and Management for Computing, Commu-nication, Controls, Energy and Materials (Icstm), pp. 90–93, URL <Go to
ISI>://WOS:000426986800016.
[24] Jayanthi, M. A., Kumar, R. L., and Swathi, S.: Investigation on asso-ciation of self-esteem and students’ performance in academics. InternationalJournal of Grid and Utility Computing, 9(3), (2018), 211–219, URL <Go to
ISI>://WOS:000441309900001.

Student Academic Performance Prediction 52
[25] Gomez-Aguilar, D. A., Garcia-Penalvo, F. J., and Theron, R.: Visualanalytics in e-learning. Profesional De La Informacion, 23(3), (2014), 236–245,URL <Go to ISI>://WOS:000339037000003.
[26] Lotsari, E., Verykios, V. S., Panagiotakopoulos, C., and Kalles,D.: A learning analytics methodology for student profiling. Artificial In-telligence: Methods and Applications, 8445, (2014), 300–312, URL <Go to
ISI>://WOS:000352632400024.
[27] Saqr, M., Fors, U., Tedre, M., and Nouri, J.: How social net-work analysis can be used to monitor online collaborative learning andguide an informed intervention. Plos One, 13(3), (2018), 22, URL <Go to
ISI>://WOS:000428093900105.
[28] Okoye, K., Tawil, A. R. H., Naeem, U., Bashroush, R., and Lamine,E.: A semantic rule-based approach supported by process mining for per-sonalised adaptive learning. 5th International Conference on Emerging Ubiq-uitous Systems and Pervasive Networks / the 4th International Conferenceon Current and Future Trends of Information and Communication Technolo-gies in Healthcare / Affiliated Workshops, 37, (2014), 203–+, URL <Go to
ISI>://WOS:000349985800025.
[29] Smirnova, E. V., Samarev, R. S., and Willmot, P.: New technology forprogramming teaching: Process mining usage. In 7th International Conferenceon Education and New Learning Technologies (EDULEARN), EDULEARN Pro-ceedings, IATED, VALENICA, ISBN 978-84-606-8243-1, 2015, pp. 7330–7335,URL <Go to ISI>://WOS:000376685707055.
[30] Sedrakyan, G., De Weerdt, J., and Snoeck, M.: Process-mining en-abled feedback: ”tell me what i did wrong” vs. ”tell me how to do itright”. Computers in Human Behavior, 57, (2016), 352–376, URL <Go to
ISI>://WOS:000370457800041.
[31] He, W.: Examining students’ online interaction in a live video streaming en-vironment using data mining and text mining. Computers in Human Behavior,29(1), (2013), 90–102, URL <Go to ISI>://WOS:000312684400013.
[32] Koufakou, A., Gosselin, J., and Guo, D. H.: Using data mining to extractknowledge from student evaluation comments in undergraduate courses. In In-ternational Joint Conference on Neural Networks (IJCNN), IEEE InternationalJoint Conference on Neural Networks (IJCNN), IEEE, NEW YORK, ISBN 978-1-5090-0619-9, 2016, pp. 3138–3142, URL <Go to ISI>://WOS:000399925503046.
[33] Krishnaveni, K. S., Pai, R. R., and Iyer, V.: Faculty rating system basedon student feedbacks using sentimental analysis. 2017 International Conferenceon Advances in Computing, Communications and Informatics (Icacci), pp. 1648–1653, URL <Go to ISI>://WOS:000427645500273.
[34] Rajeswari, A. M., Sridevi, M. R., and Deisy, C.: Outliers detection oneducational data using fuzzy association rule mining. In Int. Conf. on Adv. inComp., Comm., and Inf. Sci. (ACCIS-14).

53 J. Alshboul and E. Baksa-Varga
[35] Weng, C.-H.: Mining fuzzy specific rare itemsets for education data. Knowl.-Based Syst., 24, (2011), 697–708.
[36] Oeda, S. and Hashimoto, G.: Log-data clustering analysis for dropout predic-tion in beginner programming classes. In Procedia Computer Science, vol. 112,pp. 614–621.
[37] Amrieh, E., Hamtini, T., and Aljarah, I.: Mining educational data topredict student’s academic performance using ensemble methods. InternationalJournal of Database Theory and Application, 9, (2016), 119–136.
[38] Heale, R. and Twycross, A.: Validity and reliability in quantitative studies.Evidence Based Nursing, 18(3), (2015), 66.

Production Systems and Information EngineeringVolume 9 (2020), pp. 54–66 54
EVALUATION OF PYTHON BASED NLP FRAMEWORKSFOR TEMPLATE BASED AUTOMATIC QUESTION
GENERATION
Walelign Tewabe SewunetieUniversity of Miskolc, Hungary
Department of Information Engineering
Laszlo KovacsUniversity of Miskolc, Hungary
Department of Information Engineering
[Received . . . and accepted . . . ]
Abstract. Automatic question generation techniques emerged as a so-lution to the challenges facing test developers in the development ofsmart e-tutoring systems. The current challenge in selecting the avail-able developer tools is depend on several aspects, including the kind andsource of text, where the level, formal or informal, may influence theperformance of such tools. This tool, popular packages for NLP: NLTK,spaCy, TextBlob, and CoreNLP.Our experiences show that spaCy is several times faster than others intokenization, tagging and parsing. It has also the best feature set ofneural network models and of entity recognition methods. Based on ourtest results spaCy would be an optimal choice for the implementation oftemplate based automatic question generation. The downside of spaCyis the limited number of supported languages. The choice which NLPpackage to choose depends on the specific problem you have to solve.
Keywords: Python, NLP Frameworks, Template Based Question Gen-eration, spaCy, NLP
1. Introduction
Natural Language Processing (NLP) is a subfield of linguistics, computer sci-ence, and artificial intelligence concerned with the interactions between com-puters and human, in particular how to program computers to process andanalyze large amounts of natural language data. It mainly concerns about

55 Walelign Tewabe Sewunetie and Laszlo Kovacs
teaching machines how to understand human languages and extract meaningfrom text [1].
Natural language processing is a computer process that requires superiorknowledge of mathematics, machine learning, and linguistics. Now, devel-opers can use ready-made tools that simplify text preprocessing so that theycan concentrate on building machine learning models [1]. Google, Amazon, orFacebook are pouring millions of dollars into NLP line of research to powertheir chatbots, virtual assistants, recommendation engines, and other solu-tions powered by machine learning. NLP relies on advanced computationalskills, developers would like to use the best available tools for creating servicesthat can handle natural languages.
There are many things about Python that make it a really good programminglanguage choice for an NLP projects. The simple syntax and transparent se-mantics of this language make it an excellent choice for complex projects likeNLP tasks. Moreover, developers can enjoy excellent support for integrationwith other languages and tools that come in handy for techniques like machinelearning.
Python provides developers with an extensive collection of NLP tools and li-braries that enable developers to handle a great number of NLP-related taskssuch as document classification, topic modeling, part-of-speech (POS) tag-ging, word vectors, and sentiment analysis. AQG is characterized as the taskof generating syntactically sound, semantically correct, and appropriate ques-tions from multiple input formats such as text, a structured database, or aknowledge base.
Asking assessment questions is an essential feature of advanced learning tech-nologies such as smart tutoring systems, game-based learning environmentsand inquiry-based environments [2]. A general human technique for generat-ing questions is to thoroughly read the article setting up an internal modelof information and then generating questions accordingly. In the case of au-tomated question generation (AQG) the engine generates the questions auto-matically from the available text documents. Many AQG systems are used ineducational applications, such as skill development assessment and knowledgeassessment. In the Extended ITS Architecture [3] the question generationmodule is using intuitionistic logic for evaluation of the generated questions.The field of AQG is an important research area that can be useful in intelligenttutoring systems, dialog systems, educational technology, educational games,

Evaluation of Python Based NLP Frameworks for Template BasedAutomatic Question Generation
e.t.c [4].
The main goal of the study is to compare, to test and to analyze differentavailable Python based NLP frameworks for template based question gener-ation. Template-based QG is a baseline which utilizes templates created byexperts of human extracted from training set and then generates questions byfilling the particular templates with certain topic entities.
2. Extensions of the article Evaluation of Python-based NLPFrameworks
2.1. Question Generation from Databases
One approach for AQG is to use a database, like relational database for theinput source. The relational database [6] has the benefit that it contains astrict structure to store information and data. This structure enables to de-termine the meaning, semantic role of the different data items. In this case,the schema may refer to the different semantic components using referencesto the column names. On the other hand, to generate the NL sentences, theframework requires an NLP module to transform the lemma forms into thecorresponding inflected forms.
The formal model of the database oriented AQG system can be given as fol-lows.
• D : {T1, T1, ..., Tn}: input database• Ti : Ti(mi1,mi2, ....,mim) : table schema containing columns• S : {(Si, Qi)} : set of QA schemas• Si = w1, w2, ..., wm : query schema, where wi denotes either a NL word
or a reference to a table column of the form Ti.mj
• Qi : select ...from ...where ..., the SQL query to yield the answer, wherethe SQL query can contain references to the symbol parameters used inthe query schema.
For the tests, we have implemented a background database in sqlite. Thedatabase schema contains the following tables.
In Table 1, we can find examples for the generated QA schema with referencesto the implemented database. To implement this system we have used SQLitetools to create a relational database and python for template-based questionanswering systems.
56
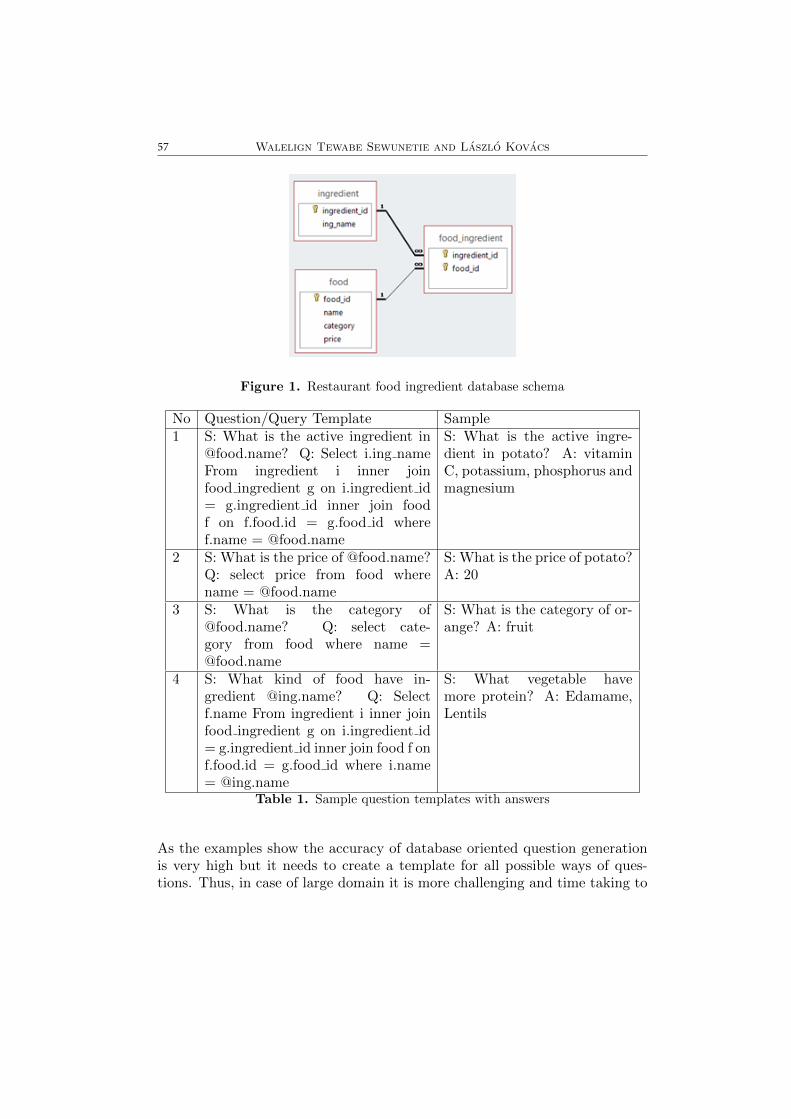
57 Walelign Tewabe Sewunetie and Laszlo Kovacs
Figure 1. Restaurant food ingredient database schema
No Question/Query Template Sample1 S: What is the active ingredient in
@food.name? Q: Select i.ing nameFrom ingredient i inner joinfood ingredient g on i.ingredient id= g.ingredient id inner join foodf on f.food.id = g.food id wheref.name = @food.name
S: What is the active ingre-dient in potato? A: vitaminC, potassium, phosphorus andmagnesium
2 S: What is the price of @food.name?Q: select price from food wherename = @food.name
S: What is the price of potato?A: 20
3 S: What is the category [email protected]? Q: select cate-gory from food where name [email protected]
S: What is the category of or-ange? A: fruit
4 S: What kind of food have in-gredient @ing.name? Q: Selectf.name From ingredient i inner joinfood ingredient g on i.ingredient id= g.ingredient id inner join food f onf.food.id = g.food id where i.name= @ing.name
S: What vegetable havemore protein? A: Edamame,Lentils
Table 1. Sample question templates with answers
As the examples show the accuracy of database oriented question generationis very high but it needs to create a template for all possible ways of ques-tions. Thus, in case of large domain it is more challenging and time taking to

Evaluation of Python Based NLP Frameworks for Template BasedAutomatic Question Generation
construct all the required templates. In future, we will extend this work forautomatized schema generation for databases. Here below is a sample pythoncode that we have used for a template-based question answering system withdatabase support.
Rules = [("What is the active ingredient in @food.name",
"Select i.ing_name From ingredient i inner join
food_ingredient g on i.ingredient_id = g.ingredient_id
inner join food f on f.food.id = g.food_id where f.name
= @food.name"),
("What is the price of @food.name","select price from
food where name = ’@food.name’")
]
def qa_process (qid):
conn = sqlite3.connect(’../Python_Cube/aqgtest’)
cur = conn.cursor()
qid = 1
qry = Rules[qid][0]
qrys = qry.split("@")
qrys2 = qrys[1].split(" ")[0]
qryss = qrys2.split(".")
sql = "select " + qryss[1] + " from " + qryss[0]
result = conn.execute(sql);
for rec in result:
break
qtext = qry.replace("@"+qrys2,rec[0])+"?"
#print ("Q:", qtext)
qry = Rules[qid][1]
sql = qry.replace ("@"+qrys2,rec[0])
#print (sql)
result = conn.execute(sql);
for rec in result:
break
atext = str(rec[0])
#print ("A:", atext)
return (qtext,atext)
58

59 Walelign Tewabe Sewunetie and Laszlo Kovacs
2.2. Question Generation from Free Text
NLP plays a critical role in many intelligent applications such as automatedchat bots, article summarizers, multi-lingual translation and opinion iden-tification from data. Every industry which exploits NLP to make sense ofunstructured text data, not just demands accuracy, but also swiftness in ob-taining results [11]. Some of the tasks in NLP are text classification, entitydetection, machine translation, question answering, and concept identification.Python is a top developing software that can handle natural languages in thecontext of artificial intelligence. For the implementation of Template BasedQuestion Generation the researchers’ analyzed different python based NLPframeworks.
In a research work Nguyen-thinh le et al [6] use extracted key concepts to gen-erate questions and determine the types of questions to be generated. They usethe domains of energy and economy topic to select the sentences and question.The author presents nouns and noun phrases first extracted from a discussiontopic and replace by X placeholder. The template displayed in Table 1 showsthat question templates are filled with the noun phrase “nuclear energy” andresult in some questions. As we have seen on the template below questionsare more dependent on domain and topic.
The authors used an improved NER spaCy which is capable of labeling moreentity types, including money, dates/times, etc to generate questions contain-ing the question word Why, How much, to what extent etc, [8].
In the work [8] the template creation focuses on the events (actions, happen-ings) and existents (characters, settings). The questions in the templates askabout the subject, the predicate, and the object of the events and existents.After removal the errors, they created 19 improved templates under 6 cate-gories that are included in the system [8].
In David’s [9] thesis report he explored semantics-based templates that usesSemantic Role Labeling (SRL) in conjunction with generic and domain-specificscope for self-directed learning. According to his report the questions that aregenerated are not answerable from the original sentence, they were judged an-swerable from the source document in our evaluation. The ability to generatequestions that require the learner to consult other parts of the text is due tothe flexibility of the templates.
In this study the authors have used spaCy libraries for POS tagging andthis information is used to identify the potential content for the template of

Evaluation of Python Based NLP Frameworks for Template BasedAutomatic Question Generation
Type QuestionDefinition What is @X? What do you have in mind when
you think about @X? What does @X remind youof?
Feature/Property What are the properties of @X? What are the(opposite)-problems of @X? What features does@X have?
Example What is an example of @XVerification Is there any problem with the arguments about
@X?Judgment What do you like when you think of or hear
about @XInterpretation How can @X be used today?Expectation How will @X be in the future, based on the way
it is now?Quantification How many sub-topics did you partners talk
about? Which sub-topics do you partners focuson?
Concept Comparison What is the difference or relations between thesesub-topics?
Table 2. Question Templates Proposed for AQG [6]
As recently as 12,500 years ago, the Earth was in the midst of a glacialage referred to as the Last Ice Age.T: How would you describe [A2-Ipp misc]?Q: How would you describe the Last Ice Age?T: Summarize the influence of [A1-lp !comma !nv] on the environment.Q: Summarize the influence of a glacial age on the environment.T: What caused [A2-Ipp nv misc]? ## [A0 null]Q: What caused the Last Ice Age?
Table 3. Sample templates and questions [9]
questions [10]. A part of the speech tagger are used to encode necessary infor-mation. In order to decide the type of questions that can be produced fromthis sentence, verb, object and preposition will be categorized on the basis ofthe subject.
60

61 Walelign Tewabe Sewunetie and Laszlo Kovacs
3. Comparative analysis of NLP Libraries in Python for TemplateBased Question Generation
The most common tools and libraries that created to solve NLP problemsare Natural Language Toolkit (NLTK), spaCy, TextBlob, and CoreNLP. TheNLTK , for English written in the Python programming language, is a suiteof libraries and programs for symbolic and statistical NLP [13]. It can includevarious datasets in multiple languages that can be deployed depending on thefeatures you need. Stanford CoreNLP is a community that created core NLPcomponents such as Tokenization, Sentence Recognition, POS Tagging, NER,Entity Linking and Training Annotation, etc [14]. The most distinctive char-acteristic of the Stanford NLP Group is its successful integration of advancedand deep linguistic modeling and data processing with innovative probabilis-tic approaches to NLP, machine learning, and deep learning. The comparisonof the features offered by spaCy, NLTK, TextBlob and Stanford CoreNLP intable 4 shows that spaCy is an advanced modern NLP library. spaCy havepre-trained NLP models capable of performing the most common NLP tasks,such as tokenization, POS tagging, NER recognition, lemmatization and wordvector transformation [15]. TextBlob is a Python library which offers a simpleAPI for accessing its methods and carrying out basic NLP tasks. It offers asimple API for diving into specific NLP tasks such as part-of - speech tag-ging, extraction of the noun phrase, interpretation of emotions, classification,translation and more [16].
Table 5 shows the comparison of per-document processing time of variousspaCy functionalities against other NLP libraries. We show both absolutetimings (ms) and relative performance (normalized) to spaCy [17].
Reviewed papers confirmed that spaCy offers the fastest syntactic parser inthe world and that its accuracy is within 1% of the best available. The fewsystems that are more accurate are 20x slower or more [17].
Spacy is very powerful and industrial strength package for almost all naturallanguage processing tasks. The following figure shows the comparison of spaCywith CoreNLP and NLTK based on accuracy for entity extraction.Spacy consists of a fast entity recognition model which is capable of identifyingentity phrases from the document. Entities can be of different types, such asperson, location, organization, dates, numerals, etc. These entities can beaccessed through “.ents” property. According to the research work [18] andwe have also observe that spaCy is easy to use, provides the best overallperformance compared to Stanford CoreNLP Suite, Google’s SyntaxNet, andNLTK Python library.
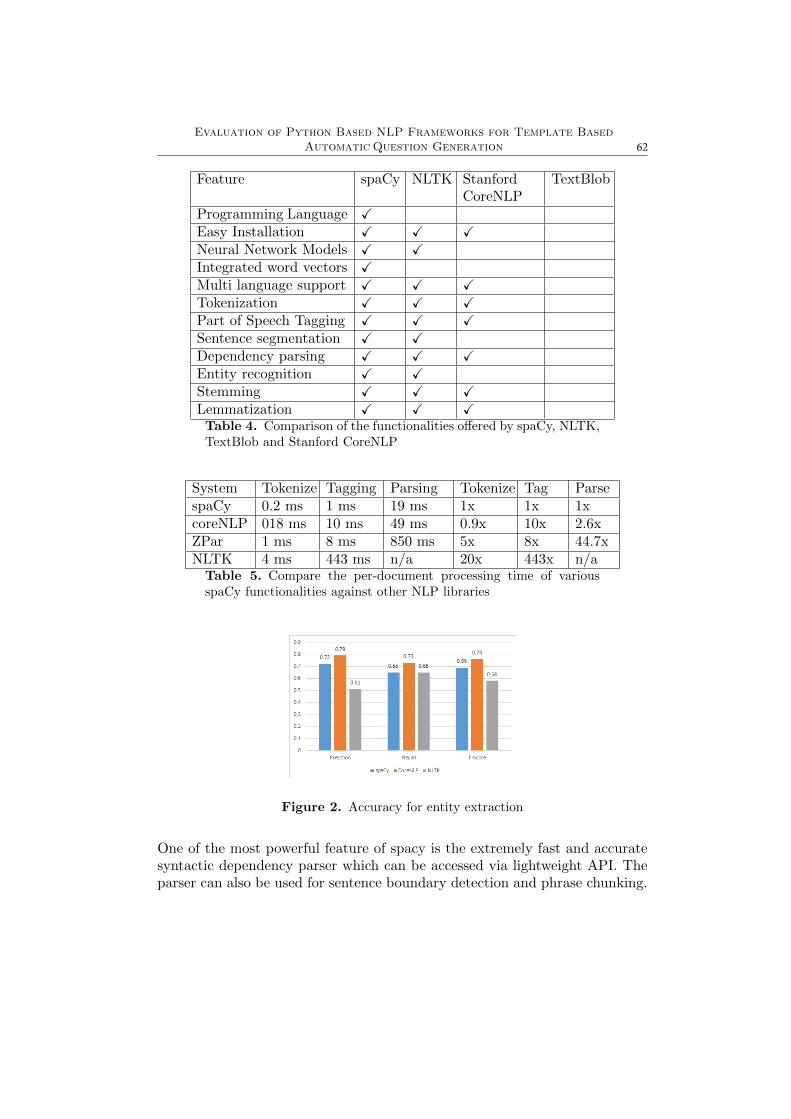
Evaluation of Python Based NLP Frameworks for Template BasedAutomatic Question Generation
Feature spaCy NLTK StanfordCoreNLP
TextBlob
Programming Language XEasy Installation X X XNeural Network Models X XIntegrated word vectors XMulti language support X X XTokenization X X XPart of Speech Tagging X X XSentence segmentation X XDependency parsing X X XEntity recognition X XStemming X X XLemmatization X X XTable 4. Comparison of the functionalities offered by spaCy, NLTK,TextBlob and Stanford CoreNLP
System Tokenize Tagging Parsing Tokenize Tag ParsespaCy 0.2 ms 1 ms 19 ms 1x 1x 1xcoreNLP 018 ms 10 ms 49 ms 0.9x 10x 2.6xZPar 1 ms 8 ms 850 ms 5x 8x 44.7xNLTK 4 ms 443 ms n/a 20x 443x n/aTable 5. Compare the per-document processing time of variousspaCy functionalities against other NLP libraries
Figure 2. Accuracy for entity extraction
One of the most powerful feature of spacy is the extremely fast and accuratesyntactic dependency parser which can be accessed via lightweight API. Theparser can also be used for sentence boundary detection and phrase chunking.
62

63 Walelign Tewabe Sewunetie and Laszlo Kovacs
The relations can be accessed by the properties “.children”, “.root”, “.ances-tor” etc[12].
4. Feature Level Comparison
The two significant libraries used in NLP are NLTK and spaCy. There aresubstantial differences between them, which are as follows: NLTK provides aplethora of algorithms to choose from for a particular problem which is boonfor a researcher but a bane for a developer. Whereas, spaCy keeps the bestalgorithm for a problem in its toolkit and keep it updated as state of the artimproves.
NLTK is a string processing library and it takes strings as input and returnsstrings or lists of strings as output. Whereas, spaCy uses object-orientedapproach. When we parse a text, spaCy returns document object whose wordsand sentences are objects themselves. spaCy has support for word vectorswhereas NLTK does not. As spaCy uses the latest and best algorithms, itsperformance is usually good as compared to NLTK. As we can see below, inword tokenization and POS-tagging spaCy performs better, but in sentencetokenization, NLTK outperforms spaCy. Its poor performance in sentencetokenization is a result of differing approaches: NLTK attempts to split thetext into sentences. In contrast, spaCy constructs a syntactic tree for eachsentence, a more robust method that yields much more information about thetext.
Figure 3. Number of features offered by spaCy, NLTK, StanfordCoreNLP and TextBlob
The most popular NLP tools available in Python, spaCy supports 9 featuresout of 10. In our observation spaCy have fast processing speed in 3 major keyfunctionalities Tokenization, POS Tagging, Entity Extraction.
SpaCy, on the other hand, is the way to go for app developers. While NLTKprovides access to many algorithms to get something done, spaCy provides
Evaluation of Python Based NLP Frameworks for Template BasedAutomatic Question Generation
the best way to do it. It provides the fastest and most accurate syntacticanalysis of any NLP library released to date. It also offers access to largerword vectors that are easier to customize. For an app builder mindset thatprioritizes getting features done, spaCy would be the better choice. BothNLTK and spaCy offer great options when you need to build an NLP system.As we have seen, however, spaCy is the right tool to use in a productionenvironment.
5. Conclusion
In this article, we compared some features of several popular NLP libraries.While most of them provide tools for overlapping tasks, some use unique ap-proaches for specific problems. Definitely, the most popular packages for NLPtoday are NLTK and spaCy. In our opinion, the difference between them liesin the general philosophy of the approach to solving problems.
You can use it to try different methods and algorithms, combine them, etc.spaCy, instead, provides one out-of-box solution for each problem. Also, spaCyis several times faster than NLTK. Despite the popularity of these two libraries,there are many different options, and the choice which NLP package to choosedepends on the specific problem you have to solve. spaCy would be an optimalchoice for template based question generation.
Acknowledgements
The research reported here was carried out as part of the EFOP-3.6.1-16-2016-00011 “Younger and Renewing University – Innovative Knowledge City– Institutional development of the University of Miskolc aiming at intelligentspecialization” project implemented in the framework of the Szechenyi 2020program. The realization of this project is supported by the European Union,co-financed by the European Social Fund.
REFERENCES
[1] Dominik Kozaczko, Best python natural language processing nlp libraries, [On-line]. Available: https://sunscrapers.com/blog/8-best-python-natural-language-processing-nlp-libraries/,2018.
[2] K. E. a. P. P. e. Boyer: Proceedings of QG2010. The Third Workshop onQuestion Generation, in Pittsburgh, questiongeneration.org, 2010.
[3] Walelign T.S et al: The development and analysis of extended of architecturemodel for intelligent tutoring systems, Gradus ISSN 2064-8014 , vol. 6, no. 4, pp.128-138, 2019.
64

65 Walelign Tewabe Sewunetie and Laszlo Kovacs
[4] J. P. a. I. S. Dhaval Swali:, Automatic Question Generation from Paragraph,International Journal of Advance Engineering and Research Development, vol.3, no. 12, pp. 73-78, 2016.
[5] M. H. N. A. Smith:, Good Question! Statistical Ranking for Question Gen-eration, in Human Language Technologies: Conference of the North AmericanChapter of the Association of Computational Linguistics, Proceedings, , Los An-geles, California, USA, June 2-4, 2010.
[6] N.-T. Le and N. Pinkwart, Evaluation of a question generation approach us-ing semantic web for supporting argumentation, Research and Practice in Tech-nology Enhanced Learning , vol. 10, no. 3, p. 19, June 2015.
[7] , G. Keswani,AutoQuest (An Intelligent Automatic Question Paper GeneratorSystem), Abdul Kalam Technology University, Lucknow, 2018-19.
[8] K. Mhartre, Question Generation using NLP, International Journal of Scien-tific Research & Engineering Trends, vol. 5, no. 2, pp. 394-397, 2019.
[9] E. L. Fasya, Automatic question generation for virtual humans,Enschede, TheNetherlands, August 2017.
[10] D. Lindberg, Automatic question generation from text for self directed learn-ing,Simon Fraser university, Canada, 2013.
[11] Mandasari Yani: Follow-up question generation, University of Twente M.ScThesis, 2019.
[12] S BANSAL, Natural Language Processing Made Easy using spaCy (inPython),[Online]. Available: https: //www.analyticsvidhya. com/blog/2017/04/natural-language-processing-made-easy-using-spacy- [Accessed 19 10 2020].
[13] Awesome Python, Natural Language Processing packages and projects, https://python.libhunt.com/categories/169-natural-language-processing,[Accessed 1910 2020].
[14] Manning and Christopher D. at al, The Stanford CoreNLP Natural Lan-guage Processing Toolkit, In Proceedings of the 52nd Annual Meeting of theAssociation for Computational Linguistics: System Demonstrations, pp. 55-60,2014.
[15] Online,Python PoS Tagging and Lemmatization using spaCy, Avail-able: https://www.geeksforgeeks.org/python-pos-tagging-and-lemmatization-using-spacy/,[Accessed 19 10 2020].
[16] S. Loria, TextBlob: Simplified Text Processing, [Online]. Available:https://textblob.readthedocs.io/en/dev/. [Accessed 25 07 2020 ].
[17] spaCy, Facts & Figures, [Online]. Available: https://spacy.io/usage/facts-figures. [Accessed 16 4 2020].
[18] F. N. A. Al Omran and C. Treude, Choosing an NLP Library for An-alyzing Software Documentation A Systematic Literature Review and a Seriesof Experiments,IEEE/ACM 14th International Conference on Mining SoftwareRepositories (MSR) DOI: 10.1109/MSR.2017.42, pp. 187 - 197, 20-21 May 2017.

Evaluation of Python Based NLP Frameworks for Template BasedAutomatic Question Generation
[19] M. H. N. A. Smith, Good Question! Statistical Ranking for Question Gen-eration, in Human Language Technologies: Conference of the North AmericanChapter of the Association of Computational Linguistics, Proceedings, , Los An-geles, California, USA, June 2-4, 2010.
66

Notes for Contributorsrelated to the papers to be submitted
for Production Systems and Information Engineering
Aims and scope
The aim of the journal is to publish high quality research papers connected
with both production systems and information engineering at the same time.
Special emphasis is given to articles on the theoretical models and methods,
as well as practical applications of discrete production processes including new
(or partially new) software tools. Using a new term proposed in special litera-
ture in the nineties, the main profile of this journal is Production Information
Engineering.
Frequency of the journal
One volume a year (80–200 pages per volume) is planned.
Submission of manuscript
Submission of a manuscript implies that the paper has not been published, nor
is being considered for publication elsewhere. All papers should be written in
English. Two copies of the manuscript should be submitted on pages of A4
size.
Each manuscript should be provided with an English Abstract of about 50–
100 words, reporting concisely on the objective and the results of the paper.
The English Abstract is to be followed by the keywords.
References should be grouped at the end of the paper in numerical order of
appearance. Author’s name(s) and initials, paper titles, journal name, vol-
ume, issue, year and page numbers should be given for all journals referenced.
For the purpose of refereeing, papers should initially be submitted in hard-
copy (twofold) to the secretaries. The eventual supply of an accepted-for-
publication paper in its final camera-ready form will ensure more rapid publi-
cation. As regards the detailed format requirements, please consider the next
homepage: http://ait.iit.uni-miskolc.hu/˜psaie.

A Short History of the Publications of the University of Miskolc
The University of Miskolc (Hungary) is an important centre of research in
Central Europe. Its parent university was founded by the Empress Maria Tere-
sia in Selmecbanya (today Banska Stiavnica, Slovakia) in 1735. After the First
World War the legal predecessor of the University of Miskolc moved to Sopron
(Hungary) where, in 1929, it started the series of university publications with
the title Publications of the Mining and Metallurgical Division of the Hungar-
ian Academy of Mining and Forestry Engineering (Volumes I–VI). From 1934
to 1947 the Institution bad the name Faculty of Mining, Metallurgical and
Forestry Engineering of the Jozsef Nador University of Technology and Eco-
nomics Sciences at Sopron. Accordingly, the publications were given the title
Publications of the Mining and Metallurgical Engineering Division (Volumes
VII–XVI). For the last volume before 1950 due to a further change in the name
of the Institution Technical University, Faculties of Mining, Metallurgical and
Forestry Engineering, Publications of the Mining and Metallurgical Divisions
was the title. For some years after 1950 the Publications were temporarily
suspended.
After the foundation of the Faculty of Mechanical Engineering in Miskolc
in 1949 and the movement of the Sopron Mining and Metallurgical Faculties
to Miskolc the Publications restarted with the general title Publications of the
Technical University of Heavy industry in 1955. Four new series Series A
(Mining), Series B (Metallurgy), Series C (Machinery) and Series D (Natural
Sciences) were founded in 1976. These came out both in foreign languages
(English, German and Russian) and in Hungarian.
After the foundation of the Faculty of Mechanical Engineering in Miskolc
in 1949 and the movement of the Sopron Mining and Metallurgical Faculties
to Miskolc the Publications restarted with the general title Publications of the
Technical University of Heavy industry in 1955. Four new series Series A
(Mining), Series B (Metallurgy), Series C (Machinery) and Series D (Natural
Sciences) were founded in 1976. These came out both in foreign languages
(English, German and Russian) and in Hungarian. In 1990, right after the
foundation of some new faculties, the university was renamed the University
of Miskolc. At the same time the structure of the Publications was reorganized
so that it could follow the faculty structure. Accordingly, three new series were
established: Series E (Legal Sciences), Series F (Economic Sciences), and Se-
ries G (Humanities and Social Sciences). The seven series are constituted by
some periodicals and publications, which come out with various frequencies.


PRODUCTION SYSTEMS AND INFORMATION ENGINEERING
Volume 9 (2020)
CONTENTS
BALÁZS BOLYKI, DÁVID POLONKAI, LÁSZLÓ KOVÁCSEfficiency Analysis of NNS Methods . . . . . . . . . . . . . . . . . . . . . . . . . . . . . . . . . . . . . . 5
NORBERT TÓTH, GYULA KULCSÁRAn Extended Production Planning Model Based on the Simulation of Human Capabilities . . . . . . . . . . . . . . . . . . . . . . . . . . . . . . . . . . . . . . . . . . . . . . . . . . . . . . . . . . . . . . . . . . . . . . . . . . 19
JAWAD ALSHBOUL, ERIKA BAKSA-VARGAStudent Academic Performance Prediction . . . . . . . . . . . . . . . . . . . . . . . . . . . . . . . . . . . 36
WALELIGN TEWABE SEWUNETIE, LÁSZLÓ KOVÁCSEvaluation of Python Based NLP Frameworks for Template Based Automatic Question Generation . . . . . . . . . . . . . . . . . . . . . . 54