Embed Size (px)
Citation preview

Film production in Europe Production volume, co-production and worldwide circulation

© European Audiovisual Observatory (Council of Europe) 2017
Page 3
Film production in Europe – Production volume, co-production and worldwide circulation European Audiovisual Observatory (Council of Europe), Strasbourg, 2017
Director of publication – Susanne Nikoltchev, Executive Director European Audiovisual Observatory Editorial supervision – Gilles Fontaine, Head of Department for Market Information European Audiovisual Observatory Author – Julio Talavera, Analyst, [email protected] European Audiovisual Observatory Press and public relations – Alison Hindhaugh, Press officer, [email protected] European Audiovisual Observatory Publisher European Audiovisual Observatory 76 Allée de la Robertsau, 67000 Strasbourg, France Tel.: +33 (0)3 90 21 60 00 Fax: +33 (0)3 90 21 60 19 [email protected] http://www.obs.coe.int Cover layout – ALTRAN, Neuilly-sur-Seine, France Please quote this publication as Film production in Europe – Production volume, co-production and worldwide circulation, European Audiovisual Observatory, Strasbourg, 2017 © European Audiovisual Observatory (Council of Europe), Strasbourg, November 2017 Please note that all tables and graphs contained in this publication are sourced from the European Audiovisual Observatory. If you wish to reproduce tables or graphs, please contact the European Audiovisual Observatory for prior approval. Opinions expressed in this publication are personal and do not necessarily represent the view of the European Audiovisual Observatory, its members or the Council of Europe.*

Film production in Europe Production volume, co-production and worldwide circulation
Julio Talavera Milla

Table of contents
1. Executive summary ........................................................................................................... 1
2. Synthèse ............................................................................................................................. 4
3. Zusammenfassung ............................................................................................................. 7
4. Introduction ..................................................................................................................... 10
5. Scope and methodology ................................................................................................. 11
5.1. Two different sets of figures .................................................................................................................................................................. 11
5.2. Scope ............................................................................................................................................................................................................... 11
5.3. Data sources ................................................................................................................................................................................................. 12
5.4. Year and country of production ............................................................................................................................................................. 12
5.5. Majority and minority co-productions ................................................................................................................................................ 13
5.6. Inward production ...................................................................................................................................................................................... 14
5.7. Incoming investment productions........................................................................................................................................................ 14
5.8. Comparisons between 2007-2008 and 2015-2016 ....................................................................................................................... 14
6. Production volume .......................................................................................................... 15
6.1. Overall production volume in Europe ................................................................................................................................................. 15
6.2. Producing countries and growth ........................................................................................................................................................... 16
6.3. Feature fiction films .................................................................................................................................................................................. 18
6.4. Documentary ................................................................................................................................................................................................ 19
7. Focus on co-production .................................................................................................. 23
7.1. Majority co-productions ........................................................................................................................................................................... 23
7.2. Minority co-production ............................................................................................................................................................................. 26
7.3. Co-production partners ............................................................................................................................................................................ 27
7.4. Most frequent bilateral interactions .................................................................................................................................................... 33
7.5. Number of co-producers .......................................................................................................................................................................... 40
8. (Co)-production: Admissions and circulation ................................................................ 43
8.1. Admissions .................................................................................................................................................................................................... 43
8.2. Circulation ..................................................................................................................................................................................................... 51

Figures Figure 1. Top co-producing countries, 2007-2016................................................................................................................................... 1 Figure 2. European countries by number of co-productions broken down into majority and minority co-
productions, 2007-2016 .................................................................................................................................................................. 2 Figure 3. Average number of co-production partners by main country of production, 2010-2015 ..................................... 3 Figure 4. Evolution of production volume in Europe by type of production (total, 100% national and majority
co-production), 2007-2016 ........................................................................................................................................................... 15 Figure 5. Feature film production volume in Europe by country and type of production (100% national and
majority co-production), 2007-2016 ......................................................................................................................................... 16 Figure 6. Top producing countries, 2007-2016 ....................................................................................................................................... 17 Figure 7. Top producing countries, 2015-2016 ....................................................................................................................................... 17 Figure 8. Production growth by country, comparing the first two and last two years of the series analysed
(countries with more than an average of five films a year). ............................................................................................ 17 Figure 9. Evolution of production volume of feature fiction films in Europe by type of production (total, 100%
national and majority co-production), 2007-2016 .............................................................................................................. 18 Figure 10. Evolution of production volume of feature fiction films in the EU by type of production (total, 100%
national and majority co-production), 2007-2016 .............................................................................................................. 18 Figure 11. Top producing countries for feature films, 2007-2016 ..................................................................................................... 19 Figure 12. Evolution of production volume of feature documentary films in Europe by type of production (total,
100% national and majority co-production), 2007-2016 ................................................................................................. 19 Figure 13. Evolution of the production volume of feature documentary films in the EU, 2007-2016 ................................ 20 Figure 14. Top documentary producing countries, 2007-2016 ........................................................................................................... 20 Figure 15. Feature documentaries by country and type of production, 2007-2016 ................................................................... 21 Figure 16. Majority co-production share of documentaries, by country, 2007-2016 ................................................................. 21 Figure 17. Countries by share of documentary production, 2007-2016 .......................................................................................... 22 Figure 18. Top co-producing countries, 2007-2016................................................................................................................................. 23 Figure 19. European countries by share of majority co-productions out of the total number of national
productions, 2007-2016 ................................................................................................................................................................ 24 Figure 20. European countries by number of majority co-productions, 2007-2016 ................................................................... 24 Figure 21. Countries by share of fiction and documentary co-production (out of overall production within each
format), 2007-2016 .......................................................................................................................................................................... 25 Figure 22. European countries by number of co-productions broken down into majority and minority co-
productions, 2007-2016 ................................................................................................................................................................ 26 Figure 23. European countries by number of productions broken down into fully national, majority and minority
co-productions, 2007-2016 .......................................................................................................................................................... 26 Figure 24. Share of minority co-productions out of the total number of co-productions, 2007-2016 ............................... 27 Figure 25. Breakdown of the sample of films with European participation by type of production, 2010-2015 ............. 28 Figure 26. Most common co-productions with EUR countries a majority co-producer, 2010-2015 .................................... 29 Figure 27. Share of partners outside Europe (in majority co-productions of the countries listed), 2010-2015 .............. 29 Figure 28. European countries by number of countries with which they co-produced as majority co-producers
(broken down into European countries and non-European countries), 2010-2015............................................... 30 Figure 29. Most frequent co-producers (as minority co-producer) of European majority co-productions, 2010-
2015 ....................................................................................................................................................................................................... 30 Figure 30. Most frequent non-European co-producers of European majority co-productions, 2010-2015....................... 31 Figure 31. Top minority co-producers in European films by number of countries with which they co-produced,
2010-2015 ........................................................................................................................................................................................... 31 Figure 32. Share of co-productions (European and non-European) participated in by European minority co-
production countries ....................................................................................................................................................................... 32 Figure 33. Share of co-productions (with and without European partners) by majority co-production country ............. 32 Figure 34. Share of interactions (with and without European partners) by majority co-production country ................... 33 Figure 35. French interactions, by main partner, broken down into maj. and min.co-productions, 2010-2015 ............. 35 Figure 36. Share of French interactions, by main partner and overall, broken down into maj. and min. co-
productions, 2010-2015 ................................................................................................................................................................ 35 Figure 37. British interactions, by main partner, broken down into maj.and min.co-productions, 2010-2015 ............... 35 Figure 38. Share of British interactions, by main partner and overall, broken down into maj. and min. co-
productions, 2010-2015 ................................................................................................................................................................ 35 Figure 39. Spanish interactions, by main partner, broken down into maj. and min.co-productions, 2010-2015 ........... 35 Figure 40. Share of Spanish interactions, by main partner and overall, broken down into maj. and min. co-
productions, 2010-2015 ................................................................................................................................................................ 35 Figure 41. German interactions, by main partner, broken down into maj. and min. co-productions, 2010-2015 .......... 36 Figure 42. Share of German interactions, by main partner and overall, broken down into maj. and min. co-
productions, 2010-2015 ................................................................................................................................................................ 36

Figure 43. Italian interactions, by main partner, broken down into maj. and min. co-productions, 2010-2015 ............. 36 Figure 44. Share of Italian interactions, by main partner and overall, broken down into maj. and min. co-
productions, 2010-2015 ................................................................................................................................................................ 36 Figure 45. Belgian interactions by main partner, broken down into maj. and min.co-productions, 2010-2015 ............. 36 Figure 46. Share of Belgian interactions, by main partner and overall, broken down into maj. and min. co-
productions, 2010-2015 ................................................................................................................................................................ 36 Figure 47. Swedish interactions, by main partner, broken down into maj. and min.co-productions, 2010-2015 .......... 37 Figure 48. Share of Swedish interactions, by main partner and overall, broken down into maj. and min. co-
productions, 2010-2015 ................................................................................................................................................................ 37 Figure 49. Danish interactions, by main partner, broken down into maj. and min.co-productions, 2010-2015 ............. 37 Figure 50. Share of Danish interactions, by main partner and overall, broken down into maj. and min. co-
productions, 2010-2015 ................................................................................................................................................................ 37 Figure 51. Dutch interactions, by main partner, broken down into maj. and min.co-productions, 2010-2015 ............... 37 Figure 52. Share of Dutch interactions, by main partner and overall, broken down into maj. and min. co-
productions, 2010-2015 ................................................................................................................................................................ 37 Figure 53. Swiss interactions, by main partner, broken down into maj. and min.co-productions, 2010-2015 ................ 38 Figure 54. Share of Swiss interactions, by main partner and overall, broken down into maj. and min. co-
productions, 2010-2015 ................................................................................................................................................................ 38 Figure 55. Number of countries involved in co-productions with the top 10 European co-producing countries as
majority or minority co-production partner, 2010-2015 .................................................................................................. 38 Figure 56. Share of interactions with the top 10 co-production partners of each of the top co-producing
countries in Europe, 2010-2015 ................................................................................................................................................. 39 Figure 57. Share of interactions in majority and minority co-productions of each of the top co-producing
countries in Europe, 2010-2015 ................................................................................................................................................. 40 Figure 58. Average number of co-production partners by main country of production, 2010-2015 ................................... 40 Figure 59. Evolution of the average number of co-production countries, 2010-2015 .............................................................. 41 Figure 60. Growth of the number of co-production partners by country over the period 2010-2015, comparing
2010-2011 and 2014-2015 .......................................................................................................................................................... 42 Figure 61. Worldwide admissions to EUR films by type of production, 2010-2015.................................................................... 43 Figure 62. Share of admissions broken down by country of production (GB inc vs others) and release territory,
2010-2015 ........................................................................................................................................................................................... 44 Figure 63. Worldwide admissions to EUR films by type of production (excluding GB inc productions), 2010-2015 .... 44 Figure 64. Overall share of admissions by type of production and territory of release, 2010-2015 .................................... 45 Figure 65. Share of admissions by type of production and territory of release, by country of production, 2010-
2015 ....................................................................................................................................................................................................... 47 Figure 66. Average admissions to purely national films and co-productions in selected territories, 2010-2015 .......... 48 Figure 67. Average admissions to co-productions in top countries, the EU and Europe, 2010-2015.................................. 49 Figure 68. Average admissions to co-productions in top countries, the EU and Europe, excluding GB inc
productions, 2010-2015 ................................................................................................................................................................ 49 Figure 69. Average share of co-productions vs average share of admissions to co-productions, by country and
overall, 2010-2015 .......................................................................................................................................................................... 50 Figure 70. Share of circulation for purely national films and co-productions, by country, 2010-2015 .............................. 51 Figure 71. Average number of foreign release countries for purely national films and co-productions, by country
of production, 2010-2015 ............................................................................................................................................................. 53
Tables Table 1. Interactions between the most frequent co-producing countries, 2010-2015 .................................... 34

Film production in Europe
© European Audiovisual Observatory (Council of Europe) 2017
Page 1
1. Executive summary
Film production boomed in Europe by 47% over the past 10 years
More than 18 000 films were produced in Europe between 2007 and 2016, with overall production on the continent growing by 47%, from 1 444 feature films in 2007 to 2 124 in 2016. An upward trend for most of the period was recorded for both purely national productions and co-productions. Majority co-productions accounted for 20.4% of the overall production volume on the continent over the said period. The volume of documentaries boomed, almost doubling, to 698 films in 2016, while production of feature fiction also rose significantly, by 33%.
Top 10 production countries accounted for 73% of total volume
The top five producing European countries – the UK, France, Germany, Spain and Italy - accounted for 53.6% of overall production in the 36 countries covered in the analysis and the top 10 producing countries accounted for 73% of the films shot between 2007 and 2016. A total of 18 countries produced fewer than the average 25 films a year during that period. Only five of the 36 countries covered showed a decline in production between 2007-2008 and 2015-2016 (the UK, Belgium, Norway, Estonia and Hungary). Moreover, 10 countries more than doubled their production volume, with most of the producing countries registering the fastest growth located in Eastern Europe.
Majority co-production in Europe
Only Belgium (56%) and Luxembourg (53%) produced more films as majority co-producer than as fully national producer. In fact, the share of co-production was below European levels in just 13 countries.
In absolute terms, the top producing countries in Europe were also the main co-producer countries: France topped the list, with 566 co-productions from 2007-2016, followed by Spain (460), Germany (411) and Switzerland (221); only 11 countries co-produced more than a yearly average of 10 films.
Figure 1. Top co-producing countries, 2007-2016
FR 15%
ES 12%
DE 11%
CH 6% GB
5% IT
5%
BE 5%
NL 4%
DK 4%
SE 3%
Others 30%
Film production in Europe
© European Audiovisual Observatory (Council of Europe) 2017
Page 2
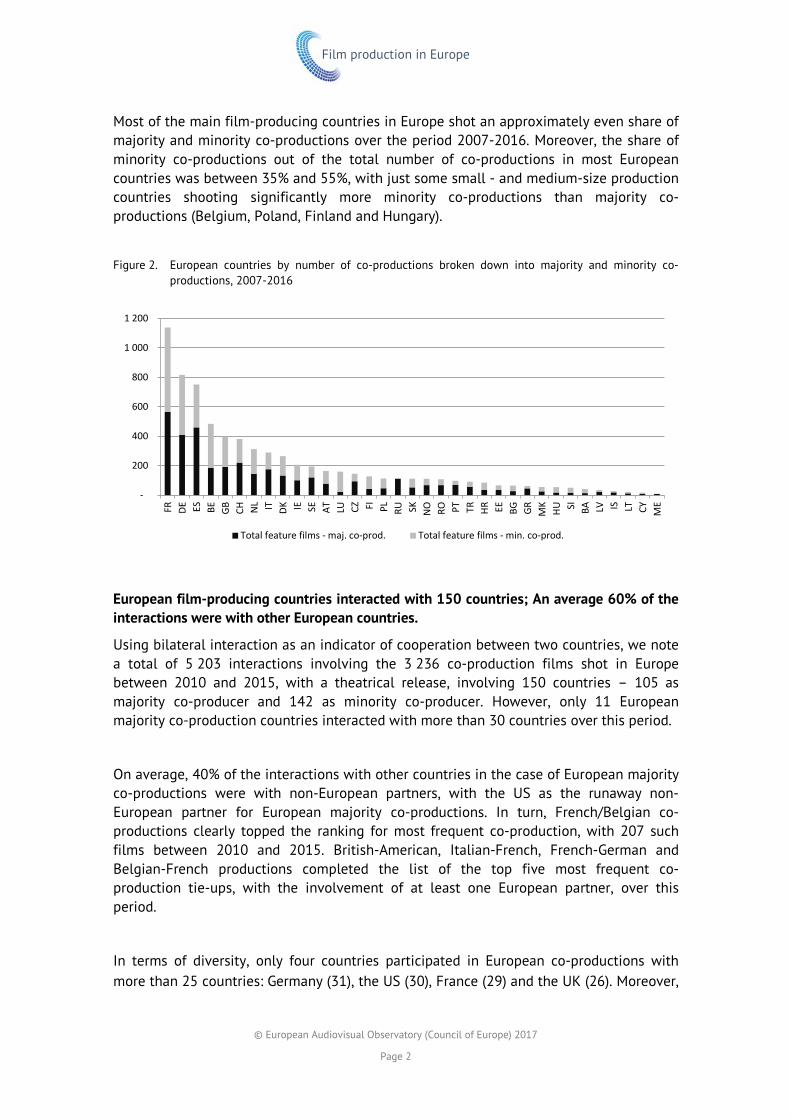
Most of the main film-producing countries in Europe shot an approximately even share of majority and minority co-productions over the period 2007-2016. Moreover, the share of minority co-productions out of the total number of co-productions in most European countries was between 35% and 55%, with just some small - and medium-size production countries shooting significantly more minority co-productions than majority co-productions (Belgium, Poland, Finland and Hungary).
Figure 2. European countries by number of co-productions broken down into majority and minority co-productions, 2007-2016
European film-producing countries interacted with 150 countries; An average 60% of the interactions were with other European countries.
Using bilateral interaction as an indicator of cooperation between two countries, we note a total of 5 203 interactions involving the 3 236 co-production films shot in Europe between 2010 and 2015, with a theatrical release, involving 150 countries – 105 as majority co-producer and 142 as minority co-producer. However, only 11 European majority co-production countries interacted with more than 30 countries over this period.
On average, 40% of the interactions with other countries in the case of European majority co-productions were with non-European partners, with the US as the runaway non-European partner for European majority co-productions. In turn, French/Belgian co-productions clearly topped the ranking for most frequent co-production, with 207 such films between 2010 and 2015. British-American, Italian-French, French-German and Belgian-French productions completed the list of the top five most frequent co-production tie-ups, with the involvement of at least one European partner, over this period.
In terms of diversity, only four countries participated in European co-productions with more than 25 countries: Germany (31), the US (30), France (29) and the UK (26). Moreover,
-
200
400
600
800
1 000
1 200
FR DE ES BE GB CH NL IT DK IE SE AT LU CZ FI PL RU SK N
O RO PT TR HR EE BG GR MK
HU SI BA LV IS LT CY ME
Total feature films - maj. co-prod. Total feature films - min. co-prod.

Film production in Europe
© European Audiovisual Observatory (Council of Europe) 2017
Page 3
only 36 of the 142 countries involved in a European production as minority co-producer were involved in projects in 10 or more countries over the period 2010-2015.
The average number of co-production partners increased over the period covered; in the EU, it rose from an average 1.48 co-production partners in 2010, to 1.65 in 2015. A total of 27 countries were within a bracket of 1.45-two co-production partners on average, per co-production. The figure rose above two in only four countries.
Figure 3. Average number of co-production partners by main country of production, 2010-2015
24.2% of European co-productions accounted for 50.3% of overall admissions to European films
Co-productions accounted for 24.2% of overall film production volume in Europe over the period 2010-2015 (23.8% when excluding GBinc productions); however, they generated 1 576 million admissions, i.e. 50.3% of overall attendance for European films during the period examined (34.9% when excluding GBinc films).In addition, European co-productions generated three times as many admissions as purely European national films.
A total of 39.5% of the films produced in Europe between 2010 and 2015 received a theatrical release in a country other than the main production country; for majority co-productions the figure rises to 62.9%, i.e. 1 464 films over the period analysed. On average, European co-productions circulate almost twice as widely as purely national productions (32.1%). The overall foreign release territories average for European co-productions was 6.43.
-
0.50
1.00
1.50
2.00
2.50
3.00
3.50
BA IS DK MK IE GR LU FI SI HR HU BE DE NO BG AT SE
Non
-EU
EUR GB N
LRO RU EU
R CH EU ES EE PT LT LV ITGB
[Inc] FR PL TR CZ SK CY
Film production in Europe
© European Audiovisual Observatory (Council of Europe) 2017
Page 4
2. Synthèse
La production de films a augmenté de 47 % en Europe en dix ans
Plus de 18 000 films ont été produits en Europe entre 2007 et 2016, et la production globale sur le continent s’est accrue de 47 %, passant de 1 444 longs métrages en 2007 à 2 124 en 2016. Cette tendance à la hausse a été enregistrée pour la plupart de cette période tant pour les productions purement nationales que pour les coproductions. Les coproductions majoritaires ont représenté 20,4 % du volume de production total sur le continent pour cette période. Le volume de documentaires a quasiment doublé, atteignant 698 films en 2016, tandis que la production de films de fiction a également connu un essor important de 33 %.
Les 10 premiers pays producteurs représentaient 73 % du volume total
Les cinq premiers pays producteurs d’Europe – le Royaume-Uni, la France, l’Allemagne, l’Espagne et l’Italie – ont représenté 53,6 % de la production globale des 36 pays couverts par l’étude tandis que les 10 premiers pays producteurs ont été à l’origine de 73 % des films tournés entre 2007 et 2016. 18 pays au total ont produit moins que la moyenne de 25 films annuels durant cette période. Un déclin de la production entre 2007-2008 et 2015-2016 a été enregistré dans seulement cinq des 36 pays couverts (le Royaume-Uni, la Belgique, la Norvège, l’Estonie et la Hongrie). En outre, 10 pays ont plus que doublé leur volume de production. La majorité des pays de production ayant enregistré la croissance la plus rapide était des pays d’Europe de l’est.
Les coproductions majoritaires en Europe
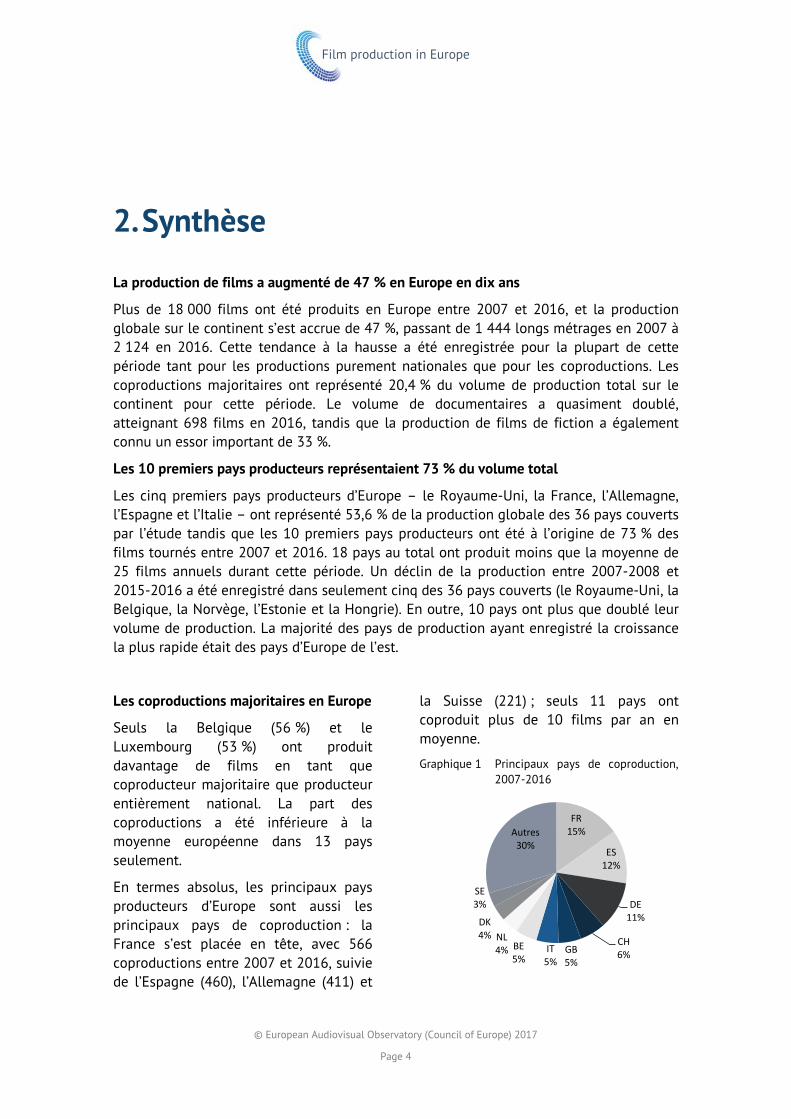
Seuls la Belgique (56 %) et le Luxembourg (53 %) ont produit davantage de films en tant que coproducteur majoritaire que producteur entièrement national. La part des coproductions a été inférieure à la moyenne européenne dans 13 pays seulement.
En termes absolus, les principaux pays producteurs d’Europe sont aussi les principaux pays de coproduction : la France s’est placée en tête, avec 566 coproductions entre 2007 et 2016, suivie de l’Espagne (460), l’Allemagne (411) et
la Suisse (221) ; seuls 11 pays ont coproduit plus de 10 films par an en moyenne.
Graphique 1 Principaux pays de coproduction, 2007-2016
FR 15%
ES 12%
DE 11%
CH 6% GB
5% IT
5% BE 5%
NL 4%
DK 4%
SE 3%
Autres 30%

Film production in Europe
© European Audiovisual Observatory (Council of Europe) 2017
Page 5
La majorité des principaux pays producteurs de films en Europe ont produit environ la même proportion de coproductions majoritaires que minoritaires sur la période 2007-2016. En outre, la part de coproductions minoritaires dans le nombre total de coproductions s’est située entre 35 % et 55 % dans la plupart des pays d’Europe. Dans un nombre limité de pays de production de taille petite ou moyenne, la part des coproductions minoritaires était toutefois bien plus élevée que celle des coproductions majoritaires (Belgique, Pologne, Finlande, Hongrie, Luxembourg).
Graphique 2 Pays européens par nombre de coproductions, réparti entre coproductions majoritaires et minoritaires, 2007-2016
Les pays européens producteurs de films ont collaboré avec 150 pays ; en moyenne, 60 % de ces collaborations se sont faites avec d’autres pays européens
En utilisant la collaboration bilatérale comme indicateur de coopération entre deux pays, on relève un total de 5 203 collaborations, portant sur les 3 236 coproductions tournées en Europe entre 2010 et 2015 et sorties en salle, ayant impliqué 150 pays – 105 en tant que coproducteurs majoritaires et 142 en tant que coproducteurs minoritaires. Néanmoins, seuls 11 pays de coproductions majoritaires ont collaboré avec plus de 30 pays sur cette période.
En moyenne, 40 % des interactions avec d’autres pays dans le cas des coproductions majoritaires européennes ont impliqué des partenaires non européens, les Etats-Unis étant de loin le principal partenaire non européen dans les coproductions majoritaires européennes. Ensuite, les coproductions France-Belgique étaient clairement en tête du classement des coproductions les plus fréquentes, avec 207 films entre 2010 et 2015. Les productions Royaume-Uni-États-Unis, Italie-France, France-Allemagne et Belgique-France complétaient la liste des cinq modèles de coproduction les plus fréquents, associant au moins un partenaire européen, sur cette période.
En termes de diversité, seuls quatre pays ont participé à des coproductions européennes avec plus de 25 pays : l’Allemagne (31), les États-Unis (30), la France (29) et le Royaume-Uni (26). De plus, seuls 36 des 142 pays ayant participé à une production européenne en tant que coproducteur minoritaire ont pris part à des projets dans 10 pays ou plus durant la période 2010-2015.
-
200
400
600
800
1 000
1 200
FR DE ES BE GB CH NL IT DK IE SE AT LU CZ FI PL RU SK N
O RO PT TR HR EE BG GR MK
HU SI BA LV IS LT CY ME
Total feature films - maj. co-prod. Total feature films - min. co-prod.

Film production in Europe
© European Audiovisual Observatory (Council of Europe) 2017
Page 6
Le nombre moyen de partenaires de coproduction a augmenté sur la période : dans l’UE, il est passé de 1,48 partenaires en moyenne en 2010 à 1.65 à 2015. 27 pays au total se sont situés dans une fourchette allant de 1.45 à deux partenaires de coproduction en moyenne par coproduction. Ce chiffre était supérieur à deux dans quatre pays seulement.
Graphique 3 Nombre moyen de partenaires de coproduction par principal pays de production, 2010-2015
24,2 % de coproductions européennes ont généré 50,3 % du total des entrées en salle des films européens
Les coproductions ont représenté 24,2 % du volume global de production de films en Europe sur la période 2010-2015 (23,8 % si l’on exclut les productions GBinc) ; elles ont cependant généré 1 576 millions d’entrées, soit 50,3 % des entrées totales des films européens sur la période examinée (34,9 % sans les films GBinc). De plus, les coproductions européennes ont généré trois fois plus d’entrées que les films européens uniquement nationaux.
39,5 % des films produits en Europe entre 2010 et 2015 sont sortis en salle dans un pays autre que leur pays de production principal ; pour les coproductions majoritaires, ce chiffre monte à 62,9 %, soit 1 464 films sur la période considérée. En moyenne, les coproductions européennes circulent près de deux fois plus que les productions purement nationales (32,1 %). En moyenne, les co-productions européens sont sortis dans 6,43 territoires étrangers.
-
0.50
1.00
1.50
2.00
2.50
3.00
3.50
BA IS DK MK IE GR LU FI SI HR HU BE DE NO BG AT SE
Non
-EU
EUR GB N
LRO RU EU
R CH EU ES EE PT LT LV ITGB
[Inc] FR PL TR CZ SK CY

Film production in Europe
© European Audiovisual Observatory (Council of Europe) 2017
Page 7
3. Zusammenfassung
Filmproduktion in Europa boomt: 47% Wachstum in den letzten 10 Jahren
Von 2007 bis 2016 wurden in Europa mehr als 18 000 Filme produziert; die Produktion stieg insgesamt von 1 444 auf 2 124 Spielfilme, was einer Zunahme von 47% entspricht. Fast im gesamten Zeitraum war ein Aufwärtstrend bei rein nationalen Produktionen sowie bei Koproduktionen festzustellen. Im genannten Zeitraum entfielen in Europa 20,4% des gesamten Produktionsvolumens auf Mehrheitskoproduktionen. Das Volumen der produzierten Dokumentarfilme hat sich nahezu verdoppelt und lag 2016 bei 698 Filmen, doch auch bei der Produktion von Spielfilmen gab es signifikante Zuwächse (33%).
Die 10 größten Produktionsländer erbringen 73% des gesamten Produktionsvolumens
Auf die fünf größten europäischen Produktionsländer - das Vereinigte Königreich, Frankreich, Deutschland, Spanien und Italien - entfielen 53,6% der Gesamtproduktion in den von der Untersuchung erfassten Ländern; und auf die zehn größten Produktions-länder entfallen 73% der von 2007 bis 2016 gedrehten Filme. Insgesamt 18 Länder lagen im genannten Zeitraum unter dem Durchschnitt von 25 Filmen pro Jahr. In lediglich fünf der erfassten 36 Länder war von 2007 bis 2008 und von 2015 bis 2016 ein Rückgang der Produktion zu verzeichnen (im Vereinigten Königreich, in Belgien, Norwegen, Estland und Ungarn). Darüber hinaus hat sich in 10 Ländern das Produktionsvolumen mehr als verdoppelt, wobei die Länder mit dem größten Produktionswachstum in Osteuropa liegen.
Mehrheitskoproduktionen in Europa
Nur Belgien (56%) und Luxemburg (53%) waren häufiger Mehrheitsproduzent von Koproduktionen als Produzent von rein nationalen Produktionen. Der Koproduk-tionsanteil lag lediglich in 13 Ländern unter dem europäischen Durchschnitt.
Absolut gesehen waren in Europa die größten Produktionsländer auch die wichtigsten Koproduktionsländer: Frank-reich liegt mit 566 Koproduktionen auf dem ersten Platz, gefolgt von Spanien (460), Deutschland (411) und der Schweiz (221); nur 11 Länder haben im
Durchschnitt mehr als 10 Filme pro Jahr koproduziert.
Graphik 1. Die größten Koproduktionsländer, 2007-2016
FR 15%
ES 12%
DE 11%
CH 6% GB
5% IT
5%
BE 5%
NL 4%
DK 4%
SE 3%
Others 30%

Film production in Europe
© European Audiovisual Observatory (Council of Europe) 2017
Page 8
In den meisten wichtigen Produktionsländern in Europa wurden im Zeitraum von 2007 bis 2016 ungefähr gleich viel Mehrheits- und Minderheitsproduktionen hergestellt. Der Anteil der Minderheitsproduktionen an der Gesamtzahl der Koproduktionen lag dabei in den meisten europäischen Ländern zwischen 35% und 55%, wobei in einigen kleineren und mittelgroßen Produktionsländern signifikant mehr Minderheits- als Mehrheitsproduktionen entstanden (Belgien, Polen, Finnland und Ungarn).
Graphik 2. Europäische Länder nach Anzahl der Koproduktionen: Minderheits- und Mehrheitsproduktionen, 2007 - 2016
Die europäischen Produktionsländer hatten Kontakte zu 150 Ländern; in durchschnittlich 60% der Fälle handelte es sich um Kontakte zu anderen europäischen Ländern
Betrachtet man bilaterale Kontakte als einen Indikator für Zusammenarbeit zwischen zwei Ländern, so lässt sich feststellen, dass es im Zeitraum von 2010 bis 2015 im Zusammenhang mit den 3 236 europäischen Koproduktionen, die im Kino gezeigt wurden und an denen 150 Länder beteiligt waren — 105 als Mehrheitsproduzent und 142 als Minderheitsproduzent —, insgesamt 5 203 Kontakte gab. Doch nur 11 europäische Länder, die als Mehrheitsproduzent fungierten, hatten in dieser Zeit Kontakte zu mehr als 30 Ländern.
Im Falle von europäischen Mehrheitsproduktionen waren im Durchschnitt 40% dieser Kontakte Beziehungen zu nichteuropäischen Partnern, wobei die USA der bevorzugte nichteuropäische Partner für europäische Mehrheitsproduktionen waren. Andererseits lagen französisch-belgische Koproduktionen mit 207 Gemeinschaftsproduktionen in der Zeit von 2010 bis 2015 ganz eindeutig an der Spitze. Zu den fünf häufigsten Koproduktionsformationen mit mindestens einem europäischen Partner in diesem Zeitraum zählten daneben noch englisch-amerikanische, italienisch-französische, französisch-deutsche und belgisch-französische Koproduktionen.
In Bezug auf Aspekte der Vielfalt lässt sich sagen, dass nur vier Länder an europäischen Koproduktionen mit mehr als 25 Ländern beteiligt waren: Deutschland (31), die USA (30), Frankreich (29) und das Vereinigte Königreich (26). Ferner waren von 2010 bis 2015 nur 36 der 142 Länder, die als Minderheitsproduzent europäischer Produktionen auftraten, an Projekten in 10 oder mehr Ländern beteiligt.
-
200
400
600
800
1 000
1 200
FR DE ES BE GB CH NL IT DK IE SE AT LU CZ FI PL RU SK N
O RO PT TR HR EE BG GR MK
HU SI BA LV IS LT CY ME
Total feature films - maj. co-prod. Total feature films - min. co-prod.

Film production in Europe
© European Audiovisual Observatory (Council of Europe) 2017
Page 9
Die durchschnittliche Anzahl der Koproduktionspartner hat im betrachteten Zeitraum zugenommen; in der EU stieg sie von 2010 bis 2015 von durchschnittlich 1,48 auf 1,65. Insgesamt 27 Länder lagen im Bereich von durchschnittlich 1,45 bis 2 Koproduktionspartnern pro Koproduktion. In nur vier Ländern lag dieser Wert über 2.
Graphik 3. Anzahl der Koproduktionspartner im Durchschnitt nach Hauptproduktionsland, 2010 - 2015
24,2% der europäischen Koproduktionen erreichen 50,3% aller Besucher europäischer Filme
Im Zeitraum 2010 bis 2015 machten Koproduktionen 24,2% des gesamten Produktions-volumens in Europa aus (ohne GBinc Produktionen 23,8%); diese Filme wurden jedoch von 1 576 Mio. Besuchern gesehen — das sind 50,3% sämtlicher Besucher europäischer Filme im Betrachtungszeitraum (ohne GBinc Filme 34,9%). Darüber hinaus erreichten europäische Koproduktionen dreimal so viele Besucher als rein europäische nationale Filme.
Insgesamt wurden 39,5% der in Europa von 2010 bis 2015 produzierten Filme in einem anderen Land als dem Land des Hauptproduzenten im Kino gezeigt; bei Mehrheitsproduktionen erhöht sich dieser Wert auf 62,9% bzw. 1 464 Filme im Betrachtungszeitraum. Die Verbreitung europäischer Koproduktionen ist nahezu zweimal besser als die rein nationaler Produktionen (32,1%). Im Durchschnitt wurden europäische Koproduktionen im Ausland in 6,43 Ländern verbreitet.
-
0.50
1.00
1.50
2.00
2.50
3.00
3.50
BA IS DK MK IE GR LU FI SI HR HU BE DE NO BG AT SE
Non
-EU
EUR GB N
LRO RU EU
R CH EU ES EE PT LT LV ITGB
[Inc] FR PL TR CZ SK CY

Film production in Europe
© European Audiovisual Observatory (Council of Europe) 2017
Page 10
4. Introduction
The European Audiovisual Observatory covers closely any trend related to feature film production volume in Europe. Thanks to the data provided mostly by the national film or statistical centers in most European countries, we are able to produce pan-European statistics on a yearly basis on the evolution of production. Beginning with Focus. World Film Market Trends1, published by the Cannes Film Market, the Observatory provides an estimate of the film production levels not only in the EU, but also across the world, region by region, as well as in the main production countries. Later in the year, production figures for each European country are published in our electronic Yearbook.2
This report goes several steps further, beyond the usual reporting of national and overall figures.
First, the different angles involved in film production (nationality and type of production – purely national, majority co-production and minority co-production) have been analysed. This answers questions related to for example the weight of co-production in Europe, and allows identification of the main co-production countries in absolute and relative terms.
Second, when it comes to international co-productions, the interactions between countries and their frequency have been studied. How many countries do European countries co-produce with on average? What are the more frequent interactions between production countries? What portion of co-production partners for European films are non-European countries? These are some of the questions answered in this part of the analysis.
Last, the circulation and admissions of European productions and co-productions have been assessed; not only in the European markets, but also in a selection of the main non-European markets for which data was available (including the USA, Canada, Brazil, South Korea and Australia, among others). This permits an unveiling of the average number of countries of release for European films, as well as the breakdown of admissions across domestic, non-national European and non-European markets.
1 http://www.obs.coe.int/en/industry/film/-/asset_publisher/rylJnLWiFD0p/content/focus-world-film-market-
trends?_ 2 http://yearbook.obs.coe.int/

Film production in Europe
© European Audiovisual Observatory (Council of Europe) 2017
Page 11
5. Scope and methodology
5.1. Two different sets of figures
Two different sets of figures were used for the analysis. On the one hand, the data provided by the national film centers/statistical centers of each country were used to determine production volume within each country, in the EU and in Europe. The second set of figures was produced using Lumière3, the European Audiovisual Observatory’s database for theatrical admissions. It was used to carry out the analysis of the interaction between countries for majority and minority co-productions, as well as to establish links between production and market share.
The first set of figures is closer to real production, since it takes into account the actual production volume in most countries, regardless of whether or not the films were released, and the number of productions released in some others; however, it does not offer a breakdown of co-production by nationality of the co-producing partners. In turn, the second set of figures, based on title-by-title information, allows for the analysis of nationality of the producers involved but does not take into account films produced without a theatrical release.
In addition, occasionally the nationality of a film as stated by a national film center differs from the nationality allocated by the Observatory in the Lumière database. Therefore, even if we restricted our analysis to films produced and released, there could be a discrepancy between the data provided by the national film centers and those calculated using Lumière.
5.2. Scope
The analysis of production volume was carried out taking into account 36 European producing countries4. Moreover, attendance and circulation figures for 47 markets, including key non-European ones, were taken into account5.
3 www.lumiere.obs.coe.int 4 The 28 EU countries plus Bosnia and Herzegovina, Iceland, "The former Yugoslav Republic of Macedonia",
Montenegro, Norway, Russia, Turkey and Switzerland. 5 All 36 European countries covered for production volume except for Malta plus Argentina, Australia, Brazil,
Canada, Chile, China, Colombia, Mexico, New Zealand, South Korea, the United States of America and Venezuela.

Film production in Europe
© European Audiovisual Observatory (Council of Europe) 2017
Page 12
The period 2007-2016 was used for the analysis of production volume, while the period 2011-2015 was scrutinised for the second part of the analysis, focused on circulation and admissions. There are two reasons for this: first, the coverage rate in the Lumière database has improved over time, so the same level of accuracy could not have been ensured for the entire 2007-2016 period with regard to related indicators. Second, a significant portion of the films produced in 2016 had not been released by the end of that year, so films produced in 2016 were not included.
5.3. Data sources
Data on production volume was provided by the corresponding national institution in charge of film statistics (national film center, national film fund, statistical office, ministry of culture, etc.). Data on film admissions came from the European Audiovisual Observatory’s Lumière database, the data of which is drawn from a wide variety of sources, including national film agencies and statistics offices, inter-industry bodies, distributors’ and exhibitors’ associations, the trade press and a small number of private tracking bodies. This is supplemented by data from the European Union’s MEDIA Programme, on the basis of declarations made by distributors to its Automatic Distribution Support scheme. The admissions data for the 11 non-European markets covered in this report have been licensed by private tracking body ComScore.
5.4. Year and country of production
The methodology used to determine the year of production varies from country to country. Some take into account the date of principal photography, others consider the date of registration or certification. In some cases, when this information is not available, the year of release is taken into account.
As indicated above, two sets of figures were used to produce this report. With respect to production volume, we relied on the data provided by the national institutions in charge of film statistics and we accepted the information they provided regarding year of production and nationality of the films produced and co-produced. It is therefore possible that the same film was considered a majority co-production by more than one country depending on the methodological criteria employed.
However, in considering circulation and admissions, we rely on the European Audiovisual Observatory’s Lumière database, in which each film is allocated a unique country of origin. Defining the nationality of a film is a complex task. There are no widely accepted international or even European definitions of the criteria to be used to determine the country of origin of a film. This is both a legal and a statistical problem. Different national records - and the statistics on which they are based - can show the same film as having a whole range of nationalities. For a general pan-European database such as Lumière, we have had to adopt a pragmatic approach. We try to list all co-producing countries in the

Film production in Europe
© European Audiovisual Observatory (Council of Europe) 2017
Page 13
database in a standard way, and we attempt to classify them by level of financial investment in the film (whether known or assumed), with the country having provided the majority financial investment in the production in first place. This, for e.g., a FR / DE co-production is considered a French film in the Lumière database. In the case of international co-productions, the film is assigned to the country that provided the majority share of production financing.
Please note that the allocation of a country of origin in the Lumière database may differ from the allocation applied by national film agencies or other organisations, and so may thus any statistics related to country of origin.
5.5. Majority and minority co-productions
Again, different methodologies were used for the two sets of data subjected to analysis. With regard to production volume, the number of majority and minority co-productions for each country was extrapolated directly from the figures reported by the statistical unit within the national film center or equivalent institution in each country; it is therefore possible that, exceptionally, the same production was considered a majority production by more than one of the co-producing countries, notably in cases in which there was equal or comparable financial involvement on the part of the two main producing countries.
With respect to the number of admissions and circulation, Lumière data were used in the analysis. Designation of majority and minority co-production status in the Lumière database is approached as follows: A co-production is defined as a film for which the production budget was financed by sources from two or more countries. The country providing the majority of the financing, i.e. the majority co-production country, is considered to be the country of origin. In the case of equal co-production, the nationality of the director and subsidiarily the cultural content of the film are used to determine the country to which the film is allocated, on a case-by-case basis.
The Observatory identifies co-productions on the basis of information provided by various sources. When a new film is created the system will, by default, import the countries of origin as indicated in the Internet Movie Database (IMDb). These data are consequently checked and adjusted through the use of information provided by national film agencies and / or the trade press. As a consequence, the qualification of a film as a co-production and its allocation to a specific country of origin by the Observatory may differ from co-production listings published by other sources.
There is an important distinction between the quantification of majority and minority co-productions because the majority co-producing country is a univocal variable; that is, there is only one main co-producing country.However, several countries can participate in a film as minority co-producers. So, the sum of minority co-productions participated in by each country will be significantly higher than the actual number of minority co-productions.

Film production in Europe
© European Audiovisual Observatory (Council of Europe) 2017
Page 14
5.6. Inward production
The analysis did not take into account inward production - feature films produced by companies established outside the country in which they are fully or partially shot without the involvement of a local producer in the financing of the film. This type of production involves the receiving country as a shooting location for diverse reasons (infrastructure, low production costs, set and location needs, fiscal incentives, etc.), but there is no involvement of a local partner in the financing of the film.
5.7. Incoming investment productions
The 'inc' marker is a contraction of 'incoming investment'. An 'incoming investment' film is defined as one for which the main producer is a company established in a country but under the ownership and/or control of a company registered in another country. Thus, a film categorised as GB inc / US is a film produced in the United Kingdom (GB), for which the main producer is a United Kingdom-registered company which may be wholly or partially owned or controlled by a US company. A FR inc / US film is a work produced in France (FR) for which the main producer is French-registered company wholly or partially owned or controlled by a US company. A film categorised as US / GB inc is a work produced entirely or partly in the United Kingdom for which the main producer is a US-registered company acting through a UK-registered company established specifically for the production of the work.
5.8. Comparisons between 2007-2008 and 2015-2016
Since production volume, especially in some countries, is an indicator subjet to high fluctuation, biennia, instead of individual years, have been used to calculate the comparison between the beginning and the end of the time period analysed. Thus, instead of a comparison between 2007 and 2016, the average for the years 2007 and 2008 was contrasted with the average for the years 2015 and 2016, in several sections of the analysis.

Film production in Europe
© European Audiovisual Observatory (Council of Europe) 2017
Page 15
6. Production volume
6.1. Overall production volume in Europe
Production boomed in Europe, by 47%, over 10years
More than 18 000 films were produced in Europe between 2007 and 2016, with overall production on the continent going from 1 422 feature films in 2007 to 2 123 in 20166 -a 49% hike. The volume of documentaries boomed over that period, almost doubling to 698 films in 2016, while production of feature fiction also rose significantly, by 33%, to 1 426 films in 2016. In fact, the documentaries share of overall production increased from 25% in 2007 to 33% in 2016. By contrast, the majority co-production share of the total production volume in Europe remained relatively constant over the 10-year period, between a low 19.2% in 2008 and a 22.1% high in 2015 (20% in 2016).
Figure 4. Evolution of production volume in Europe by type of production (total, 100% national and majority co-production), 2007-2016
In number of films
The overall number of national productions for a country can be broken down into fully national productions (14,505 between 2007 and 2016) and majority co-productions (3,724 over the same period) – i.e. 20.4% of total national production in Europe. Minority co-
6 These sets of figures may include some double counts, as different countries may consider a same film as a
majority co-production in their countries.
0
500
1 000
1 500
2 000
2 500
2007 2008 2009 2010 2011 2012 2013 2014 2015 2016
Total featurefilms - 100%national
Total featurefilms - maj. co-prod.
Total nationalfeature films

Film production in Europe
© European Audiovisual Observatory (Council of Europe) 2017
Page 16
productions participated in by European countries were not taken into account for the calculation of the overall production volume in Europe for two reasons first and foremost, to avoid double counts - any minority co-production of one country is simultaneouslya majority co-production of another country;second, while the country of the majority co-producer is a univocal indicator, several countries may be involved in a co-production as minority co-producers.
6.2. Producing countries and growth
The top 5 countries account for 53.6% of overall production in Europe
The top five European producing countries –the UK, France, Germany, Spain and Italy - accounted for 53.6% of overall production in the 36 countries covered in the analysis. These same countries were also the only ones with production figures above 1 500 films between 2007 and 2016. Moreover, the top 10 producing countries accounted for 73% of films shot between 2007 and 2016. A total of 18 countries produced fewer than an average of 25 films a year during that period.
Figure 5. Feature film production volume in Europe by country and type of production (100% national and majority co-production), 2007-2016
In number of films
As can be seen in the two pie charts below, Spain and Turkey improved their position at the top, while the relative weight of British and Swiss production decreased over time. In overall terms, the concentration at the top remained the same, with the 26 countries outside the top 10 accounting for between 27% and 28% of overall production.
0
500
1000
1500
2000
2500
3000
GB FR DE ES IT RU CH TR NL
DK CZ SE PL AT BE RO GR FI HU NO IE PT EE BG LV SK HR SI LT IS
MK BA LU ME CY
Total feature films - 100% national Total feature films - maj. co-prod.

Film production in Europe
© European Audiovisual Observatory (Council of Europe) 2017
Page 17
Figure 6. Top producing countries, 2007-2016
Figure 7. Top producing countries, 2015-2016
Only five of the 36 countries covered indicated a decline in production between 2007-2008 and 2015-2016 (the UK, Belgium, Norway, Estonia and Hungary). Moreover, 10 countries more than doubled their production volume over that period, with most of the fastest-growing producing countries located in Eastern Europe. At the pan-European level, there was 39% growth – 35% within the EU, 60% outside the EU, with Russia (40%) and, notably, Turkey (180%) at above e average overall levels. In turn, all top producing countries in the EU, with the exception of Spain (89%) and Denmark (35.6%), showed growth below EU levels.
Figure 8. Production growth by country, comparing the first two and last two years of the series analysed (countries with more than an average of five films a year).
GB 14.3%
FR 11.2%
DE 9.7%
ES 9.5% IT
9.0% RU
5.6%
CH 4.6%
TR 4.4%
NL 2.9%
DK 2.4%
Others 26.5%
ES 11.3%
FR 10.8%
GB 10.2%
IT 9.4% DE
9.0% RU
6.2%
TR 6.0%
CH 4.1%
NL 2.7%
CZ 2.6%
Others 27.6%
-50%
0%
50%
100%
150%
200%
250%
300%
RO BG LV BA TR LT SK IS FIM
K ES GR PT CZN
on-E
U E
URO
PE SE RUEU
R 36 DK
EUR
28 SI PL NL IT DE AT HR FR CH IE GB BE N
O EE HU(2015+2016) vs (2006+2007)

Film production in Europe
© European Audiovisual Observatory (Council of Europe) 2017
Page 18
6.3. Feature fiction films
Fiction: Two-thirds of all feature films produced
Except for a small decrease in 2012, European production of feature fiction films rose, constantly,over the 10-year period covered, with growth of majority co-productions since 2007 well above the overall 33% feature fiction film figure, at 52.5%, up to 324 in 2016.
Figure 9. Evolution of production volume of feature fiction films in Europe by type of production (total, 100% national and majority co-production), 2007-2016
In number of films
Despite a rather flat trend for feature film production in the EU for several years, starting in 2010, overall European feature fiction figures kept growing because of a hike in non-EU countries, notably Russia, Turkey and Switzerland. However, this trend was reversed in 2016, with the EU production volume of feature films up again, compensating for stagnation in the two big non-EU markets (Russian and Turkey) and therefore consolidating the European upward trend. Moreover, another EU trend change occurred in 2016: the number of fully national productions grew significantly for the first time since 2010, while majority co-productions went down for the first time during the period analysed.
Figure 10. Evolution of production volume of feature fiction films in the EU by type of production (total, 100% national and majority co-production), 2007-2016
0
200
400
600
800
1 000
1 200
1 400
1 600
2007 2008 2009 2010 2011 2012 2013 2014 2015 2016
Fiction - 100%national
Fiction - maj. co-prod.
Total nationalfiction films
0
200
400
600
800
1 000
1 200
2007 2008 2009 2010 2011 2012 2013 2014 2015 2016
Fiction - 100%national
Fiction - maj. co-prod.
Total nationalfiction films

Film production in Europe
© European Audiovisual Observatory (Council of Europe) 2017
Page 19
Most of the top 10 producers in Europe were also the top producers of feature fiction. In fact, countries’ shares of overall production volume did not differ too much from shares of feature fiction production, with the exception of countries with well-above-average documentary production, such as Switzerland or Spain.
In addition, the concentration of production for the top 10 was slightly higher for feature fiction (76.5%), compared to overall production (73.5%).
Figure 11. Top producing countries for feature films, 2007-2016
6.4. Documentary
The volume of documentaries increased significantly more than fiction, driven by 100% national films
The increase in documentary production volume was even sharper than that for feature fiction, with figures almost doubling over the period 2007-2016, up to 698 films in 2016. Although the 57.8% 10-year growth figure for majority documentary co-productions was relatively similar to that for feature fiction production (52.5%), fully national documentary productions boomed over the period, from 287 in 2007 to 597 in 2016.
Figure 12. Evolution of production volume of feature documentary films in Europe by type of production (total, 100% national and majority co-production), 2007-2016
In number of films
GB 15.3%
FR 13.3%
IT 10.4%
DE 8.2% ES
7.9%
RU 7.8%
TR 6.1%
NL 2.8%
PL 2.6%
CH 2.2%
Others 23.5%
0
100
200
300
400
500
600
700
800
2007 2008 2009 2010 2011 2012 2013 2014 2015 2016
Featuredocumentaries -100% national
Featuredocumentaries - maj.co-prod.
Total nationalfeaturedocumentaries

Film production in Europe
© European Audiovisual Observatory (Council of Europe) 2017
Page 20
The trend was even more pronounced at the EU level, applicable to all of the top documentary producers, with overall documentary production growing by 107.3% over the 10-year period. Notably, as well, 14 EU countries displayed growth well above the EU average – especially relevant were some of the main production makets, such as Poland (up 700% between 2007 and 2016), Sweden (360%), the Czech Republic (286%), Italy (277%) and Spain (264%). Only seven EU countries experienced a decrease in documentaries.
Figure 13. Evolution of the production volume of feature documentary films in the EU, 2007-2016
As mentioned above, documentary films accounted for 33% of the overall production volume in Europe in 2016 – and for 29% over the full 10-year period.
Most of the top producing countries in Europe in overall terms were also at the top of the list of countries by documentary production volume; Russia and Turkey – clearly specialised in feature fiction - did not make it into the top of the list. Other countries significantly improved their documentaries production position, notably Austria, Denmark and, in particular, Switzerland.
Figure 14. Top documentary producing countries, 2007-2016
0
100
200
300
400
500
600
700
2007 2008 2009 2010 2011 2012 2013 2014 2015 2016
Featuredocumentaries -100% national
Featuredocumentaries -maj. co-prod.
Total nationalfeaturedocumentaries
ES 13%
DE 13%
GB 12% CH
11% FR 6%
IT 5%
DK 4%
AT 4%
NL 3%
CZ 3%
Others 26%
Film production in Europe
© European Audiovisual Observatory (Council of Europe) 2017
Page 21
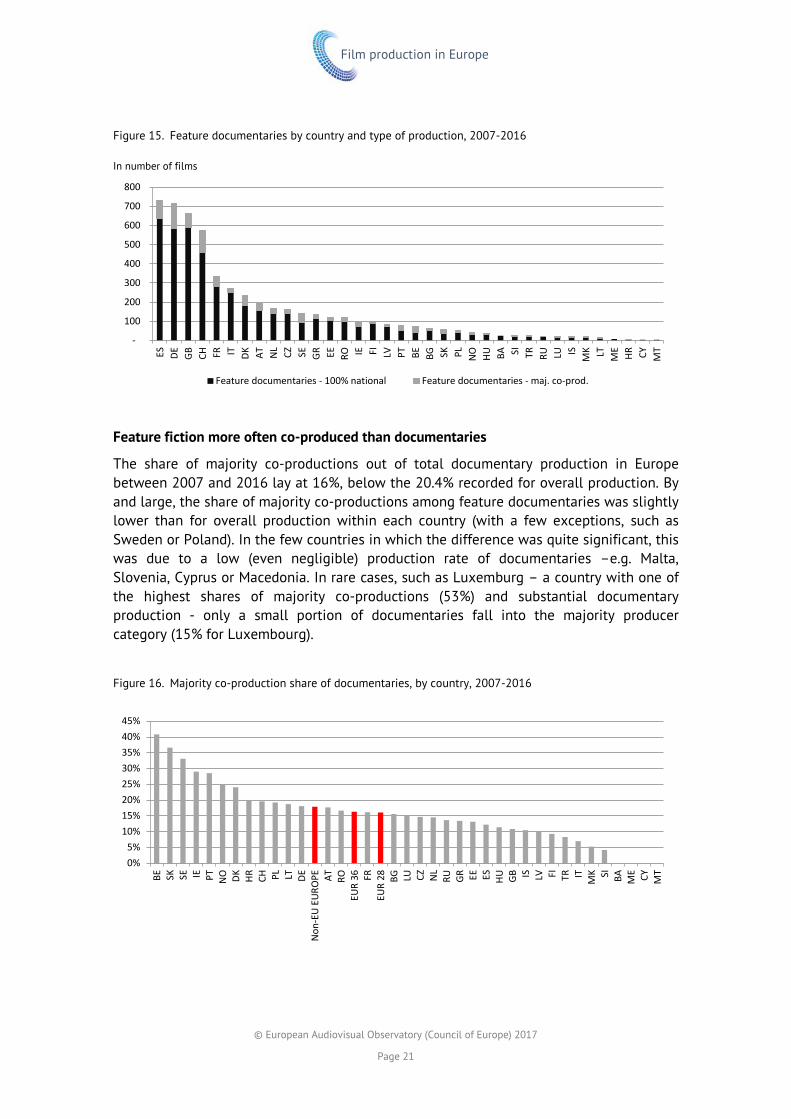
Figure 15. Feature documentaries by country and type of production, 2007-2016
In number of films
Feature fiction more often co-produced than documentaries
The share of majority co-productions out of total documentary production in Europe between 2007 and 2016 lay at 16%, below the 20.4% recorded for overall production. By and large, the share of majority co-productions among feature documentaries was slightly lower than for overall production within each country (with a few exceptions, such as Sweden or Poland). In the few countries in which the difference was quite significant, this was due to a low (even negligible) production rate of documentaries –e.g. Malta, Slovenia, Cyprus or Macedonia. In rare cases, such as Luxemburg – a country with one of the highest shares of majority co-productions (53%) and substantial documentary production - only a small portion of documentaries fall into the majority producer category (15% for Luxembourg).
Figure 16. Majority co-production share of documentaries, by country, 2007-2016
-
100
200
300
400
500
600
700
800
ES DE GB CH FR IT DK AT NL CZ SE GR EE RO IE FI LV PT BE BG SK PL N
O HU BA SI TR RU LU ISM
K LT ME
HR CY MT
Feature documentaries - 100% national Feature documentaries - maj. co-prod.
0%5%
10%15%20%25%30%35%40%45%
BE SK SE IE PT NO DK HR CH PL LT DE
Non
-EU
EUR
OPE AT RO
EUR
36 FREU
R 28 BG LU CZ N
LRU GR EE ES HU GB IS LV FI TR IT M
K SI BA ME CY MT

Film production in Europe
© European Audiovisual Observatory (Council of Europe) 2017
Page 22
A total of 30% of European productions between 2007 and 2016 were feature documentary films, with only five countries shooting more documentaries than feature fiction films (Denmark, Austria, Latvia, Switzerland and Estonia). Moreover, two of the top five producing countries – Spain (42%) and Germany(40%) - came inwell above the European average share of documentaries. In addition, most territories with an average share of feature documentary production above 40% were countries with a medium or low overall production volume.
Figure 17. Countries by share of documentary production, 2007-2016
0%10%20%30%40%50%60%70%80%
EE CH LV AT DK SK BA BG IE LU GR PT ES DE RO CZ FI SE NL
EUR
28EU
R 36 M
K IS MT SI ME
GB CYN
on-E
U E
URO
PE LT BE NO IT FR PL HU HR TR RU

Film production in Europe
© European Audiovisual Observatory (Council of Europe) 2017
Page 23
7. Focus on co-production
7.1. Majority co-productions
Most countries produce more national films than majority co-production ones
Only two European countries produced more films as majority co-producer than as fully national producer: Belgium (56%) and Luxembourg (53%). In turn, the share of co-production was below European levels (20%) in just 13 countries, with only one of the top co-producers - the UK - among them.
Three types of co-producer were distinguishable: 1) countries with few production resources (usually due to the size of the country and/or the production industry) which need a foreign partner for productions (Luxembourg, Cyprus, Slovakia, Montenegro, Iceland, etc.); 2) medium-sized production countries which try to maximise their production potential by seeking co-production with foreign partners (Belgium, Ireland, Portugal, Croatia, Denmark, Sweden, etc.); 3) Top producing countries which aim to maximise their production potential but with an industry and market that allow for a vast majority of fully national films. Not surprisingly, the share of co-production out of the total production volume in the top eight co-producing countries in Europe was below 30%, and in some cases, such as Turkey, (7%), the UK (7%), Russia (11%) and Italy
(12%), well below the European average of 20%.
Top producing countries are also the top co-producting countries
In terms of concentration, the top 10 co-producing countries in Europe accounted for 70% of overall co-production, slightly below the overall average of 27%, over the 2007-2016 period.
Figure 18. Top co-producing countries, 2007-2016
FR 15%
ES 12%
DE 11%
CH 6% GB
5%
IT 5%
BE 5%
NL 4%
DK 4%
SE 3%
Others 30%

Film production in Europe
© European Audiovisual Observatory (Council of Europe) 2017
Page 24
Figure 19. European countries by share of majority co-productions out of the total number of national productions, 2007-2016
In absolute terms, the top producing countries in Europe were, as expected, also the main co-producers, with France topping the list with 566 co-productions over the 2007-2016 period, followed by Spain (460), Germany (411) and Switzerland (221). Only 11 countries co-produced more than a yearly average of 10 films.
Figure 20. European countries by number of majority co-productions, 2007-2016
More co-production in feature fiction than in feature documentary
Most countries more often co-produced feature fiction than documentaries. At the European level, 22% of the feature fiction films were co-productions between different countries, compared to 16% in the case of feature documentaries. The most likely explanation is that feature fiction films are more expensive than documentaries and have a higher export potential – notably within the same linguistic area; therefore, international co-production becomes the perfect way to maximise revenues and close the financing plan. Moreover, in the few countries in which co-production of documentaries
0%
10%
20%
30%
40%
50%
60%
BE LU CY IE SK MK PT HR DK SE IS NL FR BA N
O ES CH ME DE AT CZ RO
EUR
28 BGEU
R 36 EE LV SI LT
Non
-EU
EUR
OPE FI GR PL IT RU GB TR HU M
T
-
100
200
300
400
500
600
FR ES DE CH GB IT BE NL
DK SE RU IE CZ AT PT NO RO TR SK PL GR FI HR EE BG MK LU LV IS HU SI BA LT CY ME
MT

Film production in Europe
© European Audiovisual Observatory (Council of Europe) 2017
Page 25
was higher than that of fiction films, the difference was relatively small (Hungary, Lithuania, Poland, Russia, Sweden, the UK and Turkey).
Figure 21. Countries by share of fiction and documentary co-production (out of overall production within each format), 2007-2016
-60% -40% -20% 0% 20% 40% 60% 80% 100%
EUR 36
EUR 28
FR
Non-EU EUROPE
ES
DE
CH
GB
IT
BE
NL
DK
SE
RU
IE
CZ
AT
PT
NO
RO
TR
SK
PL
GR
FI
HR
EE
BG
MK
LU
LV
IS
HU
SI
BA
LT
CY
ME
MT
Documentaries Fiction

Film production in Europe
© European Audiovisual Observatory (Council of Europe) 2017
Page 26
7.2. Minority co-production
As mentioned in previous sections, minority co-productions were not taken into account in the calculation of the total number of productions of a country. However, this indicator is relevant in the definition of the production pattern of each country and was analysed for this section in connection to overall production and overall co-production (including majority and minority co-production). As already indicated, it was to be expected that the main producers would also emerge as the main co-producers, and also that the main co-producers as majority co-producers would populate the top of the list of production countries of minority co-productions.
Figure 22. European countries by number of co-productions broken down into majority and minority co-productions, 2007-2016
Figure 23. European countries by number of productions broken down into fully national, majority and minority co-productions, 2007-2016
-
200
400
600
800
1 000
1 200
FR DE ES BE GB CH NL IT DK IE SE AT LU CZ FI PL RU SK N
O RO PT TR HR EE BG GR MK
HU SI BA LV IS LT CY ME
Total feature films - maj. co-prod. Total feature films - min. co-prod.
0
500
1 000
1 500
2 000
2 500
3 000
GB FR DE ES IT RU CH TR NL BE DK SE CZ PL AT RO FI GR IE HU N
O PT EE LU SK BG HR LV SIM
K BA LT IS ME CY MT
Total feature films - 100% national Total feature films - maj. co-prod. Total feature films - min. co-prod.

Film production in Europe
© European Audiovisual Observatory (Council of Europe) 2017
Page 27
An even share of majority and minority co-productions
Most of the main producers in Europe shot a roughly even share of majority and minority co-productions over the 2007-2016 period. Moreover, the share of minority co-productions out of the total number of co-productions in most European countries was between 35% and 55%, with just some small- and medium-sized production countries shooting significantly more minority co-productions than majority co-productions – and only four of them produced, overall (including 100% national, majority and minority co-productions), more than an average of 30 films a year; namely, Belgium, Poland, Finland and Hungary.
In addition, very few countries with a minimum relevant yearly production volume could be considered specialised in foreign projects as a minority partner (co-production accounting for more than half of overall production and minority co-production for more than half of overall co-production); only Luxembourg, Belgium, Slovakia, Ireland and Croatia could be included in this group of countries with noteworthy participation in minority co-productions in relative terms.
Figure 24. Share of minority co-productions out of the total number of co-productions, 2007-2016
7.3. Co-production partners
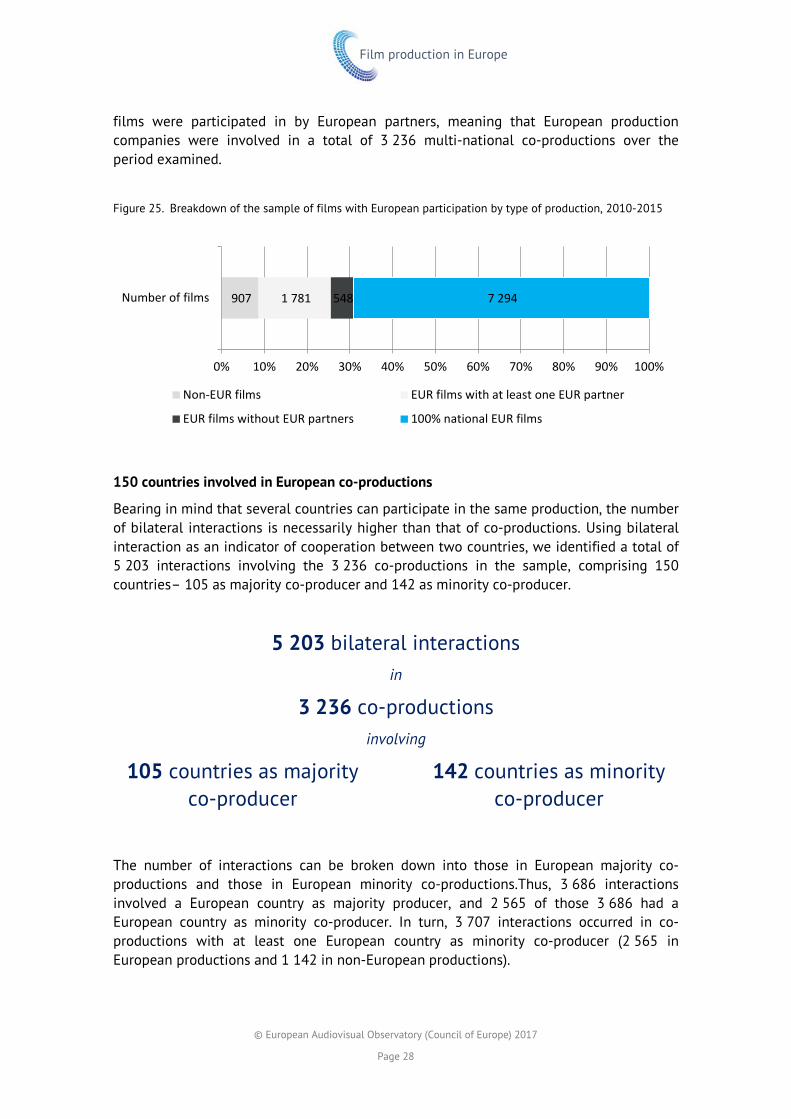
Over 3 200 multi-national co-productions between 2007 and 2016
As a reminder, analysis in the following sections rested upon a set of figures drawn from the European Audiovisual Observatory’s Lumière database, and different from the set used in the previous sections. Lumière data are based on the actual number of productions released in at least one of the territories covered by the database, and the nationality of films may differ from that stated by the different national film centers. The sample comprised 10 530 films produced with European involvement between 2010 and 2015, with a theatrical release in at least one territory. A total of 9 623 were European productions, while the rest were non-European productions with European involvement as minority co-producer. Most European productions (7 294) were fully national films, while the remaining 2 329 films were majority co-productions. In addition, 907 non-European
0%10%20%30%40%50%60%70%80%90%
100%
MT LU HU SI BA FI BE PL BG HR NL
MK SK CY AT GB IE FR DE DK EE CH IT ES NO LT TR SE RO CZ LV IS PT GR ME
RU
Film production in Europe
© European Audiovisual Observatory (Council of Europe) 2017
Page 28
films were participated in by European partners, meaning that European production companies were involved in a total of 3 236 multi-national co-productions over the period examined.
Figure 25. Breakdown of the sample of films with European participation by type of production, 2010-2015
150 countries involved in European co-productions
Bearing in mind that several countries can participate in the same production, the number of bilateral interactions is necessarily higher than that of co-productions. Using bilateral interaction as an indicator of cooperation between two countries, we identified a total of 5 203 interactions involving the 3 236 co-productions in the sample, comprising 150 countries– 105 as majority co-producer and 142 as minority co-producer.
5 203 bilateral interactions in
3 236 co-productions involving
105 countries as majority co-producer
142 countries as minority co-producer
The number of interactions can be broken down into those in European majority co-productions and those in European minority co-productions.Thus, 3 686 interactions involved a European country as majority producer, and 2 565 of those 3 686 had a European country as minority co-producer. In turn, 3 707 interactions occurred in co-productions with at least one European country as minority co-producer (2 565 in European productions and 1 142 in non-European productions).
907 1 781 548 7 294
0% 10% 20% 30% 40% 50% 60% 70% 80% 90% 100%
Number of films
Non-EUR films EUR films with at least one EUR partner
EUR films without EUR partners 100% national EUR films

Film production in Europe
© European Audiovisual Observatory (Council of Europe) 2017
Page 29
Although the 5 203 bi-national interactions took place in ,1 066 combinations between two of the 150 countries involved, most were relatively recurrent, with French/Belgian co-productions emphatically topping the ranking of most frequent bi-national co-production tie-ups, with 207 such films between 2010 and 2015. British-American, Italian-French, French-German and Belgian-French productions completed the list of the top five more frequent bi-national co-production tie-ups with the involvement of at least one European partner over this period.
Figure 26. Most common co-productions with EUR countries a majority co-producer, 2010-2015
A significant number of interactions with non-European partners
On average, 40% of the interactions with other countries in European majority co-productions were with non-European partners. In the case of GB inc productions, a full 78% of the interactions were with non-European co-producers, notably the US – a reflection of the fact that theconcept of GB inc production was designed mainly to break down British production into those films with, and those without, support from American majors. In addition, only Russian, Spanish, Portuguese, Estonian, British non-inc and German films involved more interactions with non-European partners than with European ones.
Figure 27. Share of partners outside Europe (in majority co-productions of the countries listed), 2010-2015
0
50
100
150
200
250
FR/BE GB/US IT/FR FR/DE BE/FR GB/FR GB inc/US DE/FR ES/FR DE/AT CH/DE
0%
10%
20%
30%
40%
50%
60%
70%
80%
GB[In
c] RU ES PT EE GB DE HR CH AT EU EUR
Non
-EU
EUR SE FR BG IT DK LV N
O NL FI
MK
GR RO PL HU SI IS IE TR BE CZ LT LU BA SK CY
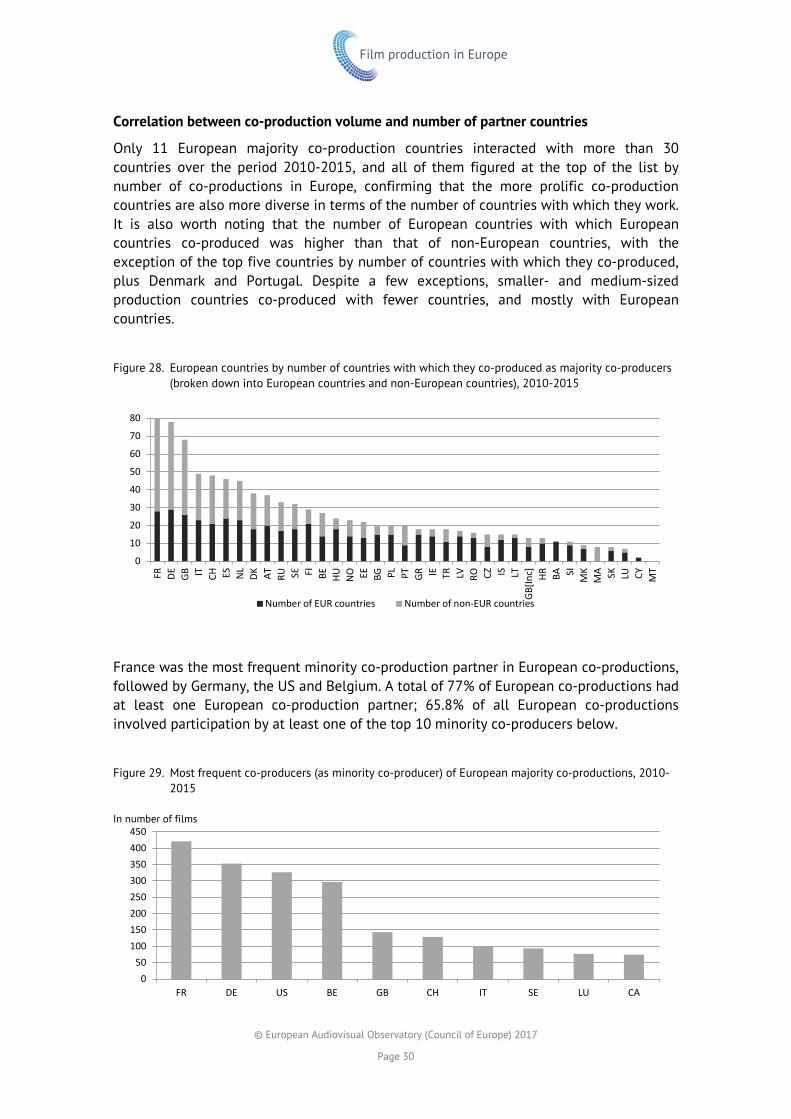
Film production in Europe
© European Audiovisual Observatory (Council of Europe) 2017
Page 30
Correlation between co-production volume and number of partner countries
Only 11 European majority co-production countries interacted with more than 30 countries over the period 2010-2015, and all of them figured at the top of the list by number of co-productions in Europe, confirming that the more prolific co-production countries are also more diverse in terms of the number of countries with which they work. It is also worth noting that the number of European countries with which European countries co-produced was higher than that of non-European countries, with the exception of the top five countries by number of countries with which they co-produced, plus Denmark and Portugal. Despite a few exceptions, smaller- and medium-sized production countries co-produced with fewer countries, and mostly with European countries.
Figure 28. European countries by number of countries with which they co-produced as majority co-producers (broken down into European countries and non-European countries), 2010-2015
France was the most frequent minority co-production partner in European co-productions, followed by Germany, the US and Belgium. A total of 77% of European co-productions had at least one European co-production partner; 65.8% of all European co-productions involved participation by at least one of the top 10 minority co-producers below.
Figure 29. Most frequent co-producers (as minority co-producer) of European majority co-productions, 2010-2015
In number of films
0
10
20
30
40
50
60
70
80
FR DE GB IT CH ES NL
DK AT RU SE FI BE HU NO EE BG PL PT GR IE TR LV RO CZ IS LT
GB[In
c] HR BA SIM
KM
A SK LU CY MT
Number of EUR countries Number of non-EUR countries
050
100150200250300350400450
FR DE US BE GB CH IT SE LU CA

Film production in Europe
© European Audiovisual Observatory (Council of Europe) 2017
Page 31
In addition, 38.3% of the European co-productions involved at least one of 115 non-European partners identified over the period 2010-2015; however, most of the interactions with non-European partners (67.5%) were with one of the top 10 countries listed below. Moreover, the list leader – the US, with participation in 327 European productions - was involved in more projects than the next eight non-European co-producers combined,–which is to say that the US was involved in around one third of the European majority co-productions with non-European partners.
Figure 30. Most frequent non-European co-producers of European majority co-productions, 2010-2015
In number of films
Regarding diversity, only four countries participated in European majority co-productions with more than 25 countries; namely, Germany (31), the US (30), France (29) and the UK(26). Furthermore, only 36 of the 142 countries participating in a European production as minority co-producer were involved in projects in 10 or more countries over the period 2010-2015. A total of 86 countries were involved in co-productions in five or fewer European countries. Overall, minority co-producers in European co-productions participated in projects in an average of 6.65 countries and a median of four.
Figure 31. Top minority co-producers in European films by number of countries with which they co-produced, 2010-2015
In number of countries
0
50
100
150
200
250
300
350
US CA AR BR IN IL CN UA CS MA
0
5
10
15
20
25
30
35
DE US FR GB CH NL RU BE IT PL

Film production in Europe
© European Audiovisual Observatory (Council of Europe) 2017
Page 32
Co-production with non-European countries more common among leading producers
It is evident from the two graphs below that the leading producers in Europe opted for high levels of co-production with non-EUR countries, both as majority and minority co-producer. Although there are other producing countries with figures similar to those of the UK, France, Germany, Spain, Italy or Russia, these are also small producting countries with no relevant production volume from which to draw conclusions about the the share of co-production involving European and non-European countries.
Figure 32. Share of co-productions (European and non-European) participated in by European minority co-production countries
Figure 33. Share of co-productions (with and without European partners) by majority co-production country
0%
20%
40%
60%
80%
100%
GB[In
c] ME ES GB IS BA FR PT NL
HR IT GR RU DE CY SI HU PL IE DK BG TR LV AT NO LT RO CZ CH MK SE FI EE BE LU SK MT
Minority co-producer in EUR films Minority co-producer in non-EUR films
0%10%20%30%40%50%60%70%80%90%
100%
GB[In
c] RU ES PT MK
GB CH NO FR DE AT LV IT NL
GR RO DK LT TR EE HU SE HR LU PL SK CZ IE BG FI BE BA CY IS SI
Majority co-productions with at least one EUR country Majority co-productions with no EUR countries

Film production in Europe
© European Audiovisual Observatory (Council of Europe) 2017
Page 33
7.4. Most frequent bilateral interactions
The concept of interaction refers to each instance of binational cooperation in a multilateral co-production. This can be better understood with an example. For instance, if we have a Spanish-Canadian-Romanian-Swiss co-production, it could be variously defined, depending on perspective, as follows:
- A Spanish majority co-production
- A Canadian minority co-production - A Romanian minority co-production - A Swiss minority co-production
- An interaction between Spain and Canada - An interaction between Spain and Romania - An interaction between Spain and Switzerland - An interaction between Canada and Romania - An interaction between Canada and Switzerland - An interaction between Romania and Switzerland
Therefore, we have one film, three co-producers and six bilateral interactions. In the analysis of cooperation between countries, the number of interactions is the most accurate indicator. It is important to bear in mind that interactions refer to the frequency with which a given country co-produces with another; thus, the number of overall interactions of a given country will be higher than the number of majority and minority co-productions of that country, since several interactions can take place within the same production (as in the example above).
Most European countries interacted mostly with other European countries, with only UK and Russia having more interactions with non-EUR countries.
Figure 34. Share of interactions (with and without European partners) by majority co-production country
0%
20%
40%
60%
80%
100%
GB[In
c] RU GB ES PT CH DE AT MK EE NO FR NL
DK HR IT RO BG HU SE TR FI PL GR IE CZ LV BE LU IS SI LT SK BA CY
Majority co-productions with EUR countries Majority co-productions with non-EUR countries

Film production in Europe
© European Audiovisual Observatory (Council of Europe) 2017
Page 34
The most frequent interaction at the European level between 2010 and 2015 was between France as majority co-producer and Belgium as minority co-producer (207), followed by US-British (112), British-American (80), US-French (76), Italian-French (63) and French-German (61).
Table 1. Interactions between countries that most frequently co-produce, 2010-2015
In number of interactions
MAIN PRODUCER
GB(inc) US FR GB CA ES DE IT BE AR SE DK NL CH AT
MIN
ORI
TY P
RODU
CER
GB(inc) - - -
-
-
-
-
-
-
-
-
-
-
-
US 50 - 34
80
10
19
27
13
3
4
4
7
7
12
10
FR 5 76 -
53
24
46
47
63
60
22
9
9
6
21
6
GB - 112 19
-
12
9
13
10
2
1
8
12
7
3
5
CA 1 27 25
10
-
3
11
3
3
1
2
1
-
3
-
ES - 27 19
12
4
-
7
10
1
36
-
2
2
1
2
DE 3 45 61
28
5
12
-
11
13
9
14
16
11
40
25
IT - 25 32
13
4
6
17
-
7
5
-
4
3
2
2
BE 2 12 207
10
2
1
12
4
-
-
-
-
33
6
1
AR - 4 6
3
-
20
7
5
-
-
2
-
1
2
1
SE 3 8 6
3
-
2
6
3
-
-
-
25
5
1
-
DK - 9 1
7
3
-
1
-
-
2
21
-
2
-
-
NL - 11 5
5
2
2
9
2
18
8
1
2
-
2
1
CH 2 8 37
5
2
3
33
17
6
1
1
-
1
-
6
AT - 7 8
3
-
1
40
-
2
3
1
2
1
4
-
The interactions – as majority or minority co-producer - of each of the top 10 European co-producing countries were analysed below. In seven of them, the US ranked among the top three co-producing partners. In six, France appeared in the top three. The top co-production partners of each country enjoyed this status primarily because of two variables: language and proximity. At least one of the official languages in five of the 10 countries analysed was also an official language in the country of the main co-production partner. In addition, the main partner in all 10 countries, with the exception of the UK (whose main co-production partner was the US), was a neighbouring country. Spain aside, the vast majority of the main partners of Europe’s top co-producing countries were other European countries.
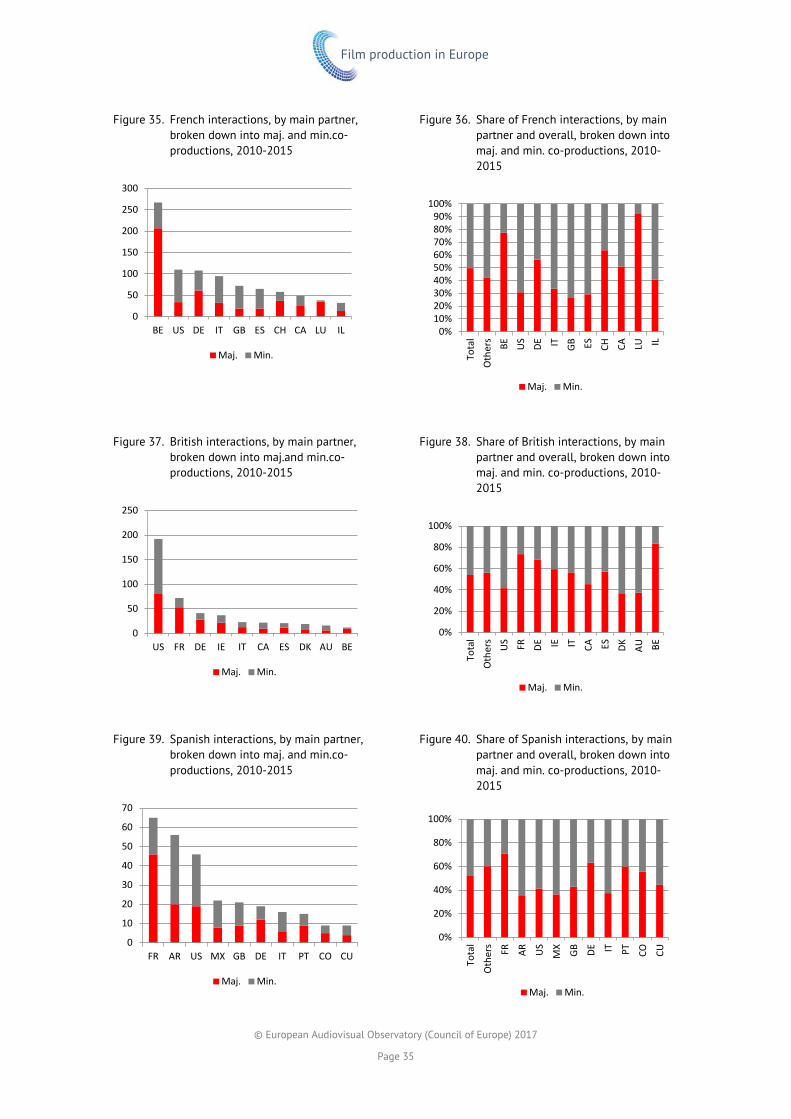
Film production in Europe
© European Audiovisual Observatory (Council of Europe) 2017
Page 35
0%
20%
40%
60%
80%
100%
Tota
l
Oth
ers FR AR US
MX
GB DE IT PT CO CU
Maj. Min.
Figure 35. French interactions, by main partner, broken down into maj. and min.co-productions, 2010-2015
Figure 36. Share of French interactions, by main partner and overall, broken down into maj. and min. co-productions, 2010-2015
Figure 37. British interactions, by main partner, broken down into maj.and min.co-productions, 2010-2015
Figure 38. Share of British interactions, by main partner and overall, broken down into maj. and min. co-productions, 2010-2015
Figure 39. Spanish interactions, by main partner, broken down into maj. and min.co-productions, 2010-2015
Figure 40. Share of Spanish interactions, by main partner and overall, broken down into maj. and min. co-productions, 2010-2015
0
50
100
150
200
250
300
BE US DE IT GB ES CH CA LU IL
Maj. Min.
0%10%20%30%40%50%60%70%80%90%
100%
Tota
lO
ther
sBE U
SDE IT GB ES CH CA LU IL
Maj. Min.
0
50
100
150
200
250
US FR DE IE IT CA ES DK AU BE
Maj. Min.
0%
20%
40%
60%
80%
100%
Tota
lO
ther
sU
S FR DE IE IT CA ES DK AU BE
Maj. Min.
0
10
20
30
40
50
60
70
FR AR US MX GB DE IT PT CO CU
Maj. Min.

Film production in Europe
© European Audiovisual Observatory (Council of Europe) 2017
Page 36
0%
20%
40%
60%
80%
100%
Tota
lO
ther
s FR NL
DE LU US
CH GB ITM
A IL
Maj. Min.
Figure 41. German interactions, by main partner, broken down into maj. and min. co-productions, 2010-2015
Figure 42. Share of German interactions, by main partner and overall, broken down into maj. and min. co-productions, 2010-2015
Figure 43. Italian interactions, by main partner, broken down into maj. and min. co-productions, 2010-2015
Figure 44. Share of Italian interactions, by main partner and overall, broken down into maj. and min. co-productions, 2010-2015
Figure 45. Belgian interactions by main partner, broken down into maj. and min.co-productions, 2010-2015
Figure 46. Share of Belgian interactions, by main partner and overall, broken down into maj. and min. co-productions, 2010-2015
0
20
40
60
80
100
120
FR CH US AT GB IL TR IT BE RU
Maj. Min.0%
20%
40%
60%
80%
100%
Tota
lO
ther
s FR CH US AT GB IL TR IT BE RU
Maj. Min.
0
20
40
60
80
100
FR US DE GB CH ES BE AR CA AL
Maj. Min.
0%
20%
40%
60%
80%
100%
Tota
lO
ther
s FR US
DE GB CH ES BE AR CA AL
Maj. Min.
0
50
100
150
200
250
300
FR NL DE LU US CH GB IT MA IL
Maj. Min.

Film production in Europe
© European Audiovisual Observatory (Council of Europe) 2017
Page 37
0%
20%
40%
60%
80%
100%
Tota
lO
ther
sBE DE U
SGB FR AR IE M
X SE HU IT
Maj. Min.
Figure 47. Swedish interactions, by main partner, broken down into maj. and min.co-productions, 2010-2015
Figure 48. Share of Swedish interactions, by main partner and overall, broken down into maj. and min. co-productions, 2010-2015
Figure 49. Danish interactions, by main partner, broken down into maj. and min.co-productions, 2010-2015
Figure 50. Share of Danish interactions, by main partner and overall, broken down into maj. and min. co-productions, 2010-2015
Figure 51. Dutch interactions, by main partner, broken down into maj. and min.co-productions, 2010-2015
Figure 52. Share of Dutch interactions, by main partner and overall, broken down into maj. and min. co-productions, 2010-2015
0
10
20
30
40
50
DK NO FI DE FR US GB NL PL BG RO
Maj. Min.0%
20%
40%
60%
80%
100%
Tota
lO
ther
sDK N
O FI DE FR US
GB NL PL BG RO
Maj. Min.
0
10
20
30
40
50
SE GB DE US NO FR FI IS CA GL
Maj. Min.
0%
20%
40%
60%
80%
100%
Tota
lO
ther
s SE GB DE US
NO FR FI IS CA GL
Maj. Min.
0
10
20
30
40
50
60
BE DE US GB FR AR IE MX SE HU IT
Maj. Min.

Film production in Europe
© European Audiovisual Observatory (Council of Europe) 2017
Page 38
Figure 53. Swiss interactions, by main partner, broken down into maj. and min.co-productions, 2010-2015
Figure 54. Share of Swiss interactions, by main partner and overall, broken down into maj. and min. co-productions, 2010-2015
Other indicators define quantitatively and qualitatively the interactions of a country. One is diversity, expressed in terms of how many countries a given country co-produces with and whether or not there is a relevant difference in the pattern displayed by majority and minority co-productions. As can be seen in the figure below, all countries tracked interacted with more countries on majority co-productions than minority co-productions, with only France and Belgium showing almost equal levels for both categories. In countries such as Denmark, Italy and the UK, the difference was quite remarkable. It is also worth noting that only seven of the 36 European countries covered interacted with more than 50 countries –and only three (France, Germany and the UK) of the seven interacted with more than 60 countries.
Figure 55. Number of countries involved in co-productions with the top 10 European co-producing countries as majority or minority co-production partner, 2010-2015
Concentration at the top was defined by the share of interactions with the top 10 co-production partners of a given country. In most cases, as evident in the figure below,
0
20
40
60
80
DE FR US IT BE AT CN GB CA PT RU
Maj. Min.0%
20%
40%
60%
80%
100%
Tota
lO
ther
sDE FR U
S IT BE AT CN GB CA PT RU
Maj. Min.
0
10
20
30
40
50
60
70
80
90
FR DE GB CH IT NL ES DK SE BE GB[Inc]
Maj. Min.

Film production in Europe
© European Audiovisual Observatory (Council of Europe) 2017
Page 39
concentration at the top was higher for minority co-productions.
Figure 56. Share of interactions with the top 10 co-production partners of each of the top co-producing countries in Europe, 2010-2015
If we combine the results of the last two figures, we may conclude that the main co-producers in Europe tended to co-produce with fewer countries on minority co-productions and, in addition, most of the interactions at this level were more concentrated among the main partners of each country than at the majority co-production level.
Lastly, if we compare the interactions of the main co-producers in Europe with other countries on majority co-productions and minority co-productions, most countries fell within a bracket of 45% to 55%, for interactions in majority co-productions, with Belgium’s 68% figure for interactions in minority co-productions an exception, and underscoring the country’s specialisation in minority co-production (due to its size, shooting infrastructure, languages and, most importantly, subsidies and fiscal incentives).
0% 10% 20% 30% 40% 50% 60% 70% 80% 90% 100%
GB[Inc]BESEITESDKCHGBFRNLDE
Min. Maj.
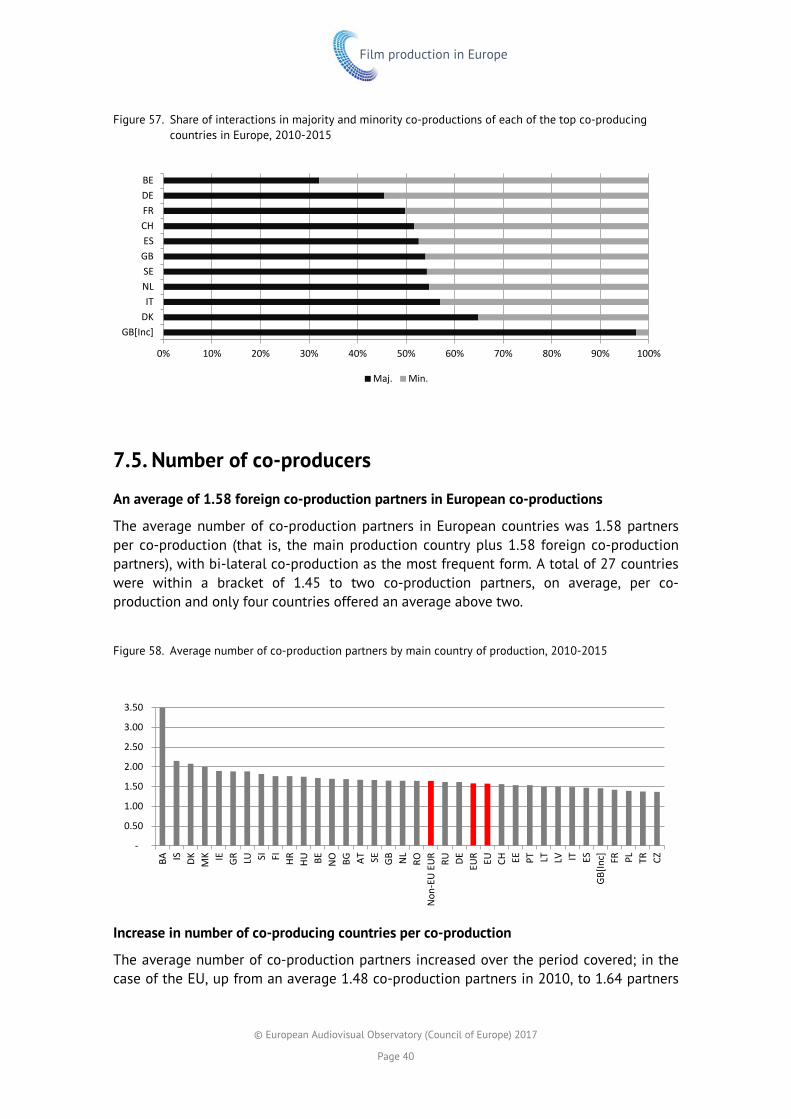
Film production in Europe
© European Audiovisual Observatory (Council of Europe) 2017
Page 40
Figure 57. Share of interactions in majority and minority co-productions of each of the top co-producing countries in Europe, 2010-2015
7.5. Number of co-producers
An average of 1.58 foreign co-production partners in European co-productions
The average number of co-production partners in European countries was 1.58 partners per co-production (that is, the main production country plus 1.58 foreign co-production partners), with bi-lateral co-production as the most frequent form. A total of 27 countries were within a bracket of 1.45 to two co-production partners, on average, per co-production and only four countries offered an average above two.
Figure 58. Average number of co-production partners by main country of production, 2010-2015
Increase in number of co-producing countries per co-production
The average number of co-production partners increased over the period covered; in the case of the EU, up from an average 1.48 co-production partners in 2010, to 1.64 partners
0% 10% 20% 30% 40% 50% 60% 70% 80% 90% 100%
GB[Inc]DKIT
NLSEGBESCHFRDEBE
Maj. Min.
-
0.50
1.00
1.50
2.00
2.50
3.00
3.50
BA IS DK MK IE GR LU SI FI HR HU BE NO BG AT SE GB NL
RON
on-E
U E
UR RU DE EUR EU CH EE PT LT LV IT ES
GB[In
c] FR PL TR CZ

Film production in Europe
© European Audiovisual Observatory (Council of Europe) 2017
Page 41
in 2015. In contrast, non-EU European countries revealed a less constant pattern, with ups and downs; although the overall average number of co-production partners in non-EU European countries was usually higher than in EU countries (an average high of 1.81 in 2014), the number dropped to 1.43 in 2015 (below EU levels), primarily due to a sharp decrease in Russia, Turkey and Switzerland.
Figure 59. Evolution of the average number of co-production countries, 2010-2015
The average number of co-production partners grew by 8% in Europe between 2010-2011 and 2014-2015, a period during which most countries experienced growth, especially Greece (110%) and Latvia (58%). The most notable exceptions were Estonia (-38%) and Poland (-53%). A clear trend relating to the increase or decrease in the number of co-production partners over this period could not be inferred; in the case of countries with a low production volume, changes may have been be due to a few co-productions with an unusual number of co-producers.
Those countries (Greece, Italy, Ireland, Spain) most heavily affected by the financial crisis saw an increase in the number of co-production partners, suggesting that scarcity of sources of financing prompted local producers to look for partners abroad. However, the increase in other countries (such as Germany, Turkey, Sweden or Luxembourg) can be explained by changes in film policy and public funding. In addition, most Eastern European EU countries experienced a decrease (Poland, Estonia, Hungary, Romania and Slovakia) or only a very mild increase (Bulgaria and the Czech Republic), with the exception of two Baltic countries (Lithuania and Latvia), in which growth was registered at more than 40%.
1.30
1.40
1.50
1.60
1.70
1.80
1.90
2010 2011 2012 2013 2014 2015
Non-EU EUR
EUR
EU
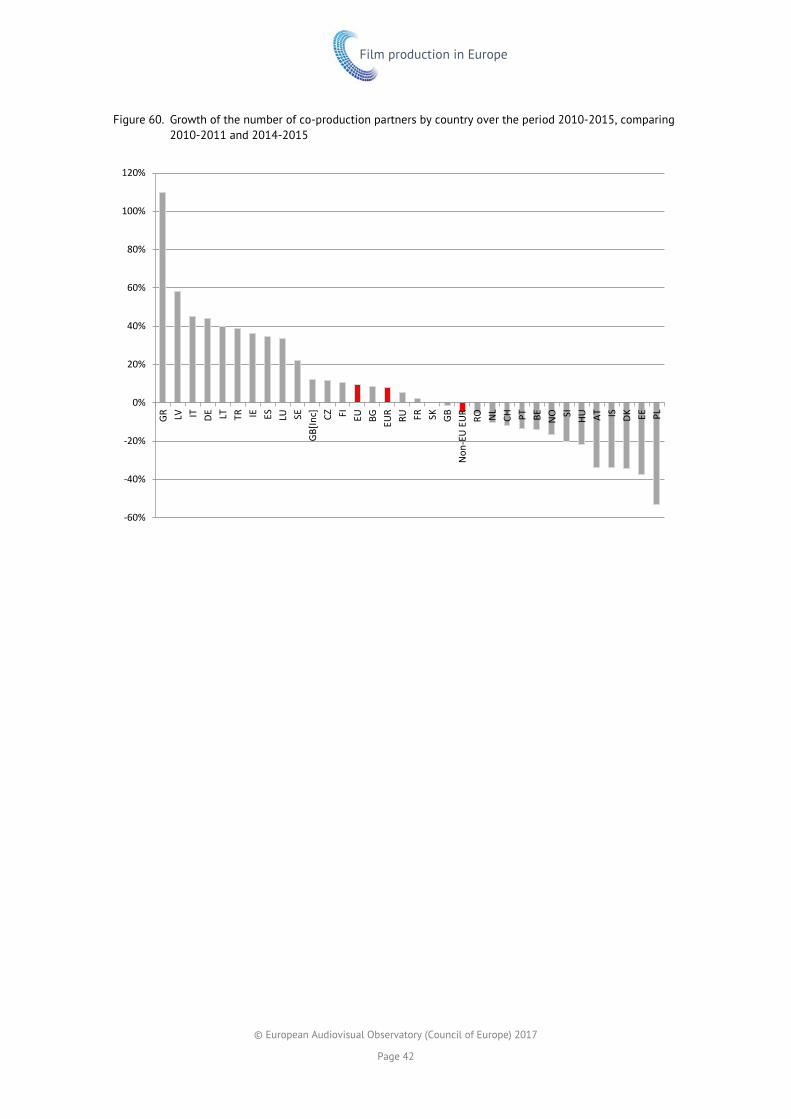
Film production in Europe
© European Audiovisual Observatory (Council of Europe) 2017
Page 42
Figure 60. Growth of the number of co-production partners by country over the period 2010-2015, comparing 2010-2011 and 2014-2015
-60%
-40%
-20%
0%
20%
40%
60%
80%
100%
120%GR LV IT DE LT TR IE ES LU SE
GB[In
c] CZ FI EU BG EUR
RU FR SK GBN
on-E
U E
UR RO NL
CH PT BE NO SI HU AT IS DK EE PL
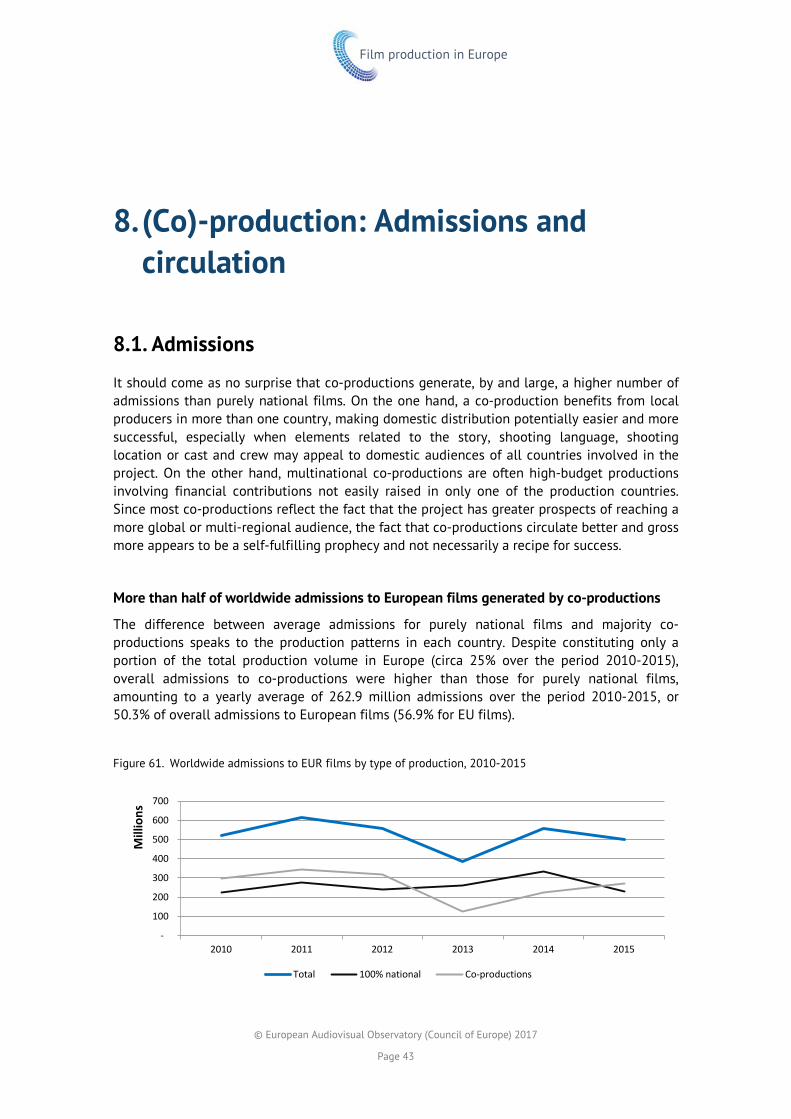
Film production in Europe
© European Audiovisual Observatory (Council of Europe) 2017
Page 43
8. (Co)-production: Admissions and circulation
8.1. Admissions
It should come as no surprise that co-productions generate, by and large, a higher number of admissions than purely national films. On the one hand, a co-production benefits from local producers in more than one country, making domestic distribution potentially easier and more successful, especially when elements related to the story, shooting language, shooting location or cast and crew may appeal to domestic audiences of all countries involved in the project. On the other hand, multinational co-productions are often high-budget productions involving financial contributions not easily raised in only one of the production countries. Since most co-productions reflect the fact that the project has greater prospects of reaching a more global or multi-regional audience, the fact that co-productions circulate better and gross more appears to be a self-fulfilling prophecy and not necessarily a recipe for success.
More than half of worldwide admissions to European films generated by co-productions
The difference between average admissions for purely national films and majority co-productions speaks to the production patterns in each country. Despite constituting only a portion of the total production volume in Europe (circa 25% over the period 2010-2015), overall admissions to co-productions were higher than those for purely national films, amounting to a yearly average of 262.9 million admissions over the period 2010-2015, or 50.3% of overall admissions to European films (56.9% for EU films).
Figure 61. Worldwide admissions to EUR films by type of production, 2010-2015
-
100
200
300
400
500
600
700
2010 2011 2012 2013 2014 2015
Mill
ions
Total 100% national Co-productions

Film production in Europe
© European Audiovisual Observatory (Council of Europe) 2017
Page 44
Purely national films accouted for a yearly average of 259.9 million admissions over the same period, despite a sharp decline in admissions for European co-productions in 2013, which reversed the previous trend, until 2015.
British productions with support from American majors represented an important outlier, especially – as illustrated by the graph below - for non-European admissions.
Figure 62. Share of admissions broken down by country of production (GB inc vs others) and release territory, 2010-2015
Pan-European figures excluding those for GB inc productions therefore provide a more accurate perspective. Although the overall aggregate trend is the same with and without said productions, the adjusted aggregate (excluding GB inc films) shows that purely national films generated more admissions than co-productions, which accounted for a yearly average of 34.9% of overall admissions to European films between 2010 and 2015.
Figure 63. Worldwide admissions to EUR films by type of production (excluding GB inc productions), 2010-2015
0%
20%
40%
60%
80%
100%
Total admissions
Non-EU admissions (others)
Non-EU admissions (GB inc)
EU Non-national admissions (others)
EU Non-national admissions (GB inc)
National admissions (others)
National admissions (GB inc)
-
100
200
300
400
500
600
2010 2011 2012 2013 2014 2015
Mill
ions
Total 100% national Co-productions
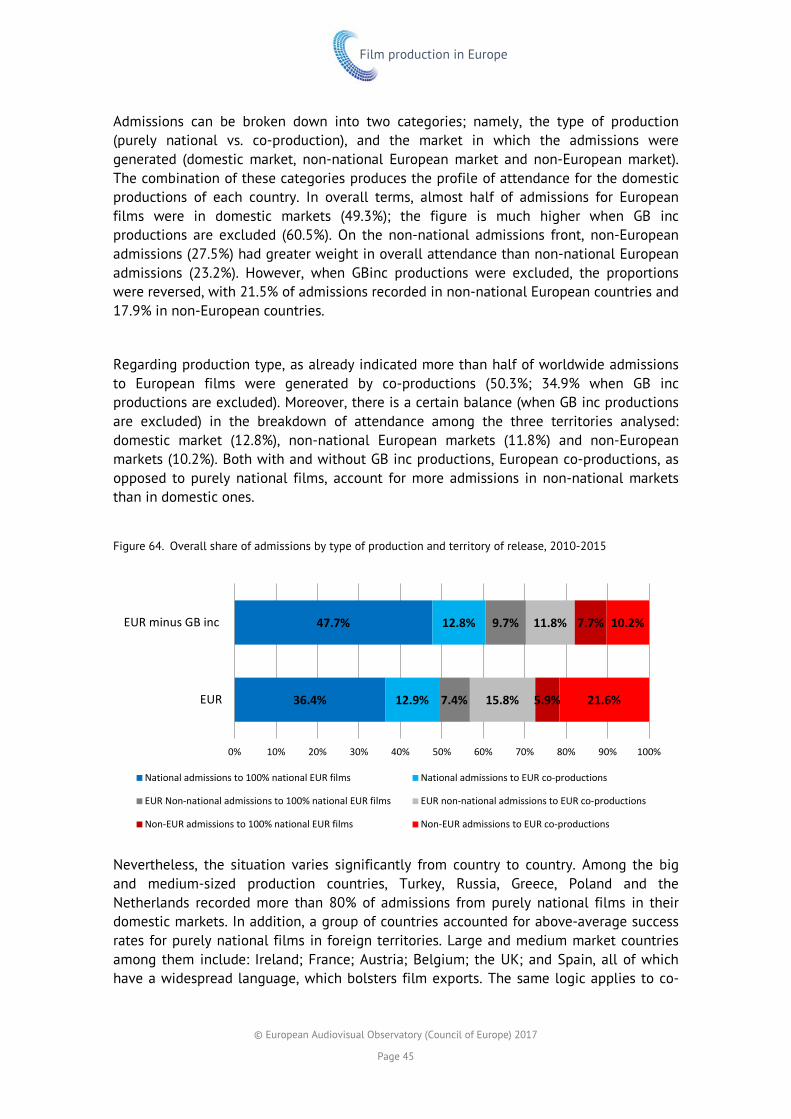
Film production in Europe
© European Audiovisual Observatory (Council of Europe) 2017
Page 45
Admissions can be broken down into two categories; namely, the type of production (purely national vs. co-production), and the market in which the admissions were generated (domestic market, non-national European market and non-European market). The combination of these categories produces the profile of attendance for the domestic productions of each country. In overall terms, almost half of admissions for European films were in domestic markets (49.3%); the figure is much higher when GB inc productions are excluded (60.5%). On the non-national admissions front, non-European admissions (27.5%) had greater weight in overall attendance than non-national European admissions (23.2%). However, when GBinc productions were excluded, the proportions were reversed, with 21.5% of admissions recorded in non-national European countries and 17.9% in non-European countries.
Regarding production type, as already indicated more than half of worldwide admissions to European films were generated by co-productions (50.3%; 34.9% when GB inc productions are excluded). Moreover, there is a certain balance (when GB inc productions are excluded) in the breakdown of attendance among the three territories analysed: domestic market (12.8%), non-national European markets (11.8%) and non-European markets (10.2%). Both with and without GB inc productions, European co-productions, as opposed to purely national films, account for more admissions in non-national markets than in domestic ones.
Figure 64. Overall share of admissions by type of production and territory of release, 2010-2015
Nevertheless, the situation varies significantly from country to country. Among the big and medium-sized production countries, Turkey, Russia, Greece, Poland and the Netherlands recorded more than 80% of admissions from purely national films in their domestic markets. In addition, a group of countries accounted for above-average success rates for purely national films in foreign territories. Large and medium market countries among them include: Ireland; France; Austria; Belgium; the UK; and Spain, all of which have a widespread language, which bolsters film exports. The same logic applies to co-
36.4%
47.7%
12.9%
12.8%
7.4%
9.7%
15.8%
11.8%
5.9%
7.7%
21.6%
10.2%
0% 10% 20% 30% 40% 50% 60% 70% 80% 90% 100%
EUR
EUR minus GB inc
National admissions to 100% national EUR films National admissions to EUR co-productions
EUR Non-national admissions to 100% national EUR films EUR non-national admissions to EUR co-productions
Non-EUR admissions to 100% national EUR films Non-EUR admissions to EUR co-productions

Film production in Europe
© European Audiovisual Observatory (Council of Europe) 2017
Page 46
productions, although in this case, some additional countries, such as Luxembourg, Hungary, Bulgaria Finland and Denmark, also made it to the top of the list because of their prolific roles as co-producers ,or due tothe circulation and success of their films in neighbouring countries

Film production in Europe
© European Audiovisual Observatory (Council of Europe) 2017
Page 47
Figure 65. Share of admissions by type of production and territory of release, by country of production, 2010-2015
Co-productions generate 3 times more admissions than purely national films
As already indicated, co-productions accounted for 24.2% of the overall production volume in Europe over the period 2010-2015 (23.8% when GB inc productions are
0% 10% 20% 30% 40% 50% 60% 70% 80% 90% 100%
AT
BG
CZ
DK
ES
FR
GB inc
HR
IE
LT
LV
NL
PT
SE
SK
EU-GB inc
CH
ME
NO
TR
EUR
National admissions to 100% national EUR films National admissions to EUR co-productions
EUR Non-national admissions to 100% national EUR films EUR non-national admissions to EUR co-productions
Non-EUR admissions to 100% national EUR films Non-EUR admissions to EUR co-productions

Film production in Europe
© European Audiovisual Observatory (Council of Europe) 2017
Page 48
excluded); however, they generated 1.576 million admissions – that is, 50.3% of overall attendance for European films during those years (34.9% when GB inc films are excluded).
European co-productions 2010-2015 account for
24.2% of production volume
and 50.3% of admissions
with a
yearly average of 676,758 admissions meaning that
they generate 3 times more admissions than purely national films
The 676,758 average admissions figure for European co-productions is more than three times higher (317%) than that for purely national films, with 213,810 admissions on average over the period 2010-2015; in other words, European co-productions generate three admissions for each ticket sold for a purely European national film (a ratio of 3:1). The gap closes significantly when GB inc productions are excluded: average admissions to co-productions then represent 171% of average admissions to purely national films. Thus, once outlying GB inc productions are excluded, the ratio of admissions for co-productions vs. purely national films goes down to 5:3.
Figure 66. Average admissions to purely national films and co-productions in selected territories, 2010-2015
As can be seen in the graph above, average admissions per film are higher for purely national films only in non-EU European countries, mainly due to Turkey and marginally to Russia. Among relevant production countries in terms of volume in Europe, average admissions to GB inc and GB films were the only ones recorded at above-Europe levels.
204 095
213 810
204 095
213 810
253 409
748 657
676 758
398 215
366 256
128 459
0% 10% 20% 30% 40% 50% 60% 70% 80% 90% 100%
EU
EUR
EU-GB inc
EUR-GB inc
Non-EU EUR
100% national Co-productions

Film production in Europe
© European Audiovisual Observatory (Council of Europe) 2017
Page 49
Figure 67. Average admissions to co-productions in top countries, the EU and Europe, 2010-2015
As can be better appreciated with the exclusion of outlying GB inc productions, most of the countries with the highest average number of admissions to co-productions are also among the top producing countries in Europe.
Figure 68. Average admissions to co-productions in top countries, the EU and Europe, excluding GB inc productions, 2010-2015
Nevertheless, there are also some relevant differences from country to country, both in terms of the share of co-productions out of the total production volume and the relative weight of such films at the box office. However, in only very few production countries is the share of co-production higher than the share of admissions to co-productions - Greece, the Netherlands and Turkey, among the big and medium-sized producers.
- 2 4 6 8
10 12 14 16
Mill
ions
-
200 000
400 000
600 000
800 000
1 000 000
1 200 000

Film production in Europe
© European Audiovisual Observatory (Council of Europe) 2017
Page 50
Figure 69. Average share of co-productions vs average share of admissions to co-productions, by country and overall, 2010-2015
-100.0% -80.0% -60.0% -40.0% -20.0% 0.0% 20.0% 40.0% 60.0% 80.0% 100.0%
ATBEBGCYCZDEDKEEESFI
FRGB
GB incGRHRHU
IEITLTLULVNLPLPTROSESI
SKEU
EU-GB incBACHIS
MKNORUTR
Non-EU EUREUR
EUR-GB inc
Share of co-productions Share of admissions to co-productions

Film production in Europe
© European Audiovisual Observatory (Council of Europe) 2017
Page 51
8.2. Circulation
European co-productions circulate almost twice as much as purely national productions
A total of 39.5% of the films produced in Europe between 2010 and 2015 received a theatrical release in a country other than the main production country. For majority co-productions, this figure rises to 62.9%, or 1 464 films over the period analysed. On average, European co-productions circulate almost twice as much as purely national productions (32.1%).
Figure 70. Share of circulation for purely national films and co-productions, by country, 2010-2015
-80.0% -60.0% -40.0% -20.0% 0.0% 20.0% 40.0% 60.0% 80.0% 100.0%
GB incIS
BAROBEFRFI
CZSK
NOGBLUIE
EUSI
EU-GB incES
EUREUR-GB inc
DKDEPLITLT
Non-EU EURTRHRCHATBGGRHUSENLEE
MKRUPTLV
100% national productions Co-productions

Film production in Europe
© European Audiovisual Observatory (Council of Europe) 2017
Page 52
Unsurprisingly, GB inc majority co-productions circulate better (96% received a release outside the UK). Romania (77.4%), Belgium (73%), France (72.7%) and Finland (72.5%) are the next big and medium-sized producers on the list. Non-EU European co-productions had much lower circulation levels, with just 54.4% of films produced in those territories receiving a theatrical release abroad (this was mainly due to the low levels in Russia (40%). However, most non-European former-USSR markets are not included in the analysis). Moreover, all countries analysed had higher circulation for their co-productions than for their purely national films.
In view of the figures presented in the previous paragraph on non-national admissions to co-productions, one might expect purely domestic films to have a very low number of admissions in foreign markets. Although it is true that co-productions account for more admissions than purely domestic films, when we look at the figures for films with more than 20,000 admissions in foreign markets, we see that 76% of purely national films were above that threshold, compared to only 69% of co-productions. While the share of purely domestic films that are successful abroad is significantly lower than that of co-productions, and overall they gross less abroad and are released in fewer countries, this does not mean that they generate only a marginal number of admissions. By and large, once a purely domestic film is released in a foreign market, a minimum performance is to be expected.
Another relevant indicator is that of the average number of foreign territories in which a film is released. GB inc productions aside (they areconceived to travel around the globe), British, Danish, French and Irish co-productions travelled the most over the period 2010-2015, coming in above the EU averagefor foreign release countries (6.74). The overall European average was 6.43 territories (six, when GB inc productions are excluded). There appears to be a divide between EU countries and non-EU European ones with regard to the circulation of co-productions, with Russia (2.35), Switzerland (2.64) and Turkey (3.33) well below the European average. Nevertheless, in all cases, the average number of foreign release territories is higher for co-productions than for purely national films.

Film production in Europe
© European Audiovisual Observatory (Council of Europe) 2017
Page 53
Figure 71. Average number of foreign release countries for purely national films and co-productions, by country of production, 2010-2015
(5.00) - 5.00 10.00 15.00 20.00 25.00 30.00
GB[Inc]
BA
GB
IS
DK
FR
NO
IE
EU
EUR
IT
PL
EUR-Gbinc
HU
BE
SE
FI
RO
DE
ES
Non-EU EUR
HR
BG
AT
TR
PT
LT
EE
CH
CZ
GR
EU-GB(inc)
LU
RU
NL
SK
SI
MK
LV
100% national Coproductions

Film production in Europe
© European Audiovisual Observatory (Council of Europe) 2017
Page 54