Embed Size (px)
Citation preview

Productional Biology: Kinetic Imaging of Plant Chlorophyll Fluorescence
Ladislav Nedbalmodified by M. Bartak

Early Fluorescence Imaging ExperimentKautsky and Hirsch (1931) irradiated a dark-adapted leaf with a blue light
and observed it visually through a dark-red glass. Here is a high-tech presentation of what they saw:
Bio-Sphere2, Tuscon AZ, Nov.29, 2001

Chlorophyll a fluorescence competes with photosynthesis for excitation energy
S0
S1
S2
Chla
hblue
photosynthesis
Fluorescence hNIR
Heat

Role #1 of light in plant fluorescence experiments – measuring light
S0
S1
S2
Chla
photosynthesis
Fluorescence hNIR
Aim: Excite the fluorescence-emitting pigment molecules without changing the experimental photo-chemically active object. Fluorescence should be distinguishable from background of the same color.
Achieved by MEASURING light:Typically 10-30s long flashes repeated with a low frequency that
= max
F0=Fmin
Role #2 of light in plant fluorescence experiments – actinic light
S0
S1
S2
Chla
photosynthesis
Fluorescence hNIR
Aim: Excite the fluorescence-emitting pigment molecules without changing the experimental photo-chemically active object. Fluorescence should be distinguishable from background of the same color.
Achieved by MEASURING light:Typically 10-30s long flashes repeated with a low frequency that
= (t)
F =F(t)

Role #3 of light in plant fluorescence experiments – saturating light
S0
S1
S2
Chla
photosynthesis
Fluorescence hNIR
Aim: Excite the fluorescence-emitting pigment molecules without changing the experimental photo-chemically active object. Fluorescence should be distinguishable from background of the same color.
Achieved by MEASURING light:Typically 10-30s long flashes repeated with a low frequency that
= F =Fmax

Fluorescence
QA-
750 LED’s are on for 10-200 s
Only few PSII RC’s are excited
Yet, sufficient fluorescence emission is produced to capture an image
Measuring flashes have little actinic effects

QA- QA
- QA- QA
- QA- QA
-
During the actinic light exposure, the continuous excitation keeps some of the PSII RC’s closed
LEDs are on for seconds to minutes
Actinic light is causing fluorescence induction

F0
FPEAK
from F0 with open PSII RC’s
to FPEAK with mostly closed PSII RC’s
In fluorescence, the actinic light elicits in plants the Kautsky
effect of fluorescence induction.
QA- QA
- QA- QA
- QA- QA
-
Actinic light is causing fluorescence induction

OPEN RC:
QA is oxidized - is LOW
QA PQ=QB
Fe
Pheo
P680YZ
PQPQ
2H2O 4H+
H+
0
0.2
0.4
0.6
0.8
1
1.2
1.4
0 0.2 0.4 0.6 0.8
TIME, s
Fluo
resc
enc
e, r
el.u
nit
Induction in a diuron-inhibited leaf
QA-
Pheo
P680YZ
PQH2
2H2O4H+
CLOSED RC:
QA is reduced - is HIGH
PQH2
Fe
DCMU

Before the pulse
During the pulse, PSII RC’s are closed by a transient reduction of the plastoquinone pool.
The shutter of the halogen lamp is open typically for 1s
QA-
QA-
QA-QA
-QA
- QA-
QA-
QA-
QA-
QA-
QA-QA
-QA
- QA-
QA-
QA-
PQ-reducing super pulse
Bio-Sphere2, Tuscon AZ, Nov.29, 2001

Fluorescence before the pulse
F0
Open PSII reaction centersThe closure of all PS RC’s is reflected by a transient
from F0 to FM.
Fluorescence at the end of the pulseFM
QA-
QA-
QA-QA
-QA
- QA-
QA-
QA-
Fluorescence in PQ-reducing saturation pulse.

0
50
100
150
200
250
-10 0 10 20 30 40 50 60 70 80
TIME, seconds
FLU
OR
ES
CE
NC
E, r
.u.
F0
FM
FV
FS
FM’
Pixel-to-pixel arithmetic image operations

„Cyanobacterial“ Chl fluorescence kinetics
• Source: http://www.sciencedirect.com/science/article/pii/S0014579304014991

Campbell D et al. Microbiol. Mol. Biol. Rev. 1998;62:667-683
Fluorescence emission trace for cyanobacterial quenching analysis.
0
50
100
150
200
250
-10 0 10 20 30 40 50 60 70 80
TIME, seconds
FLU
OR
ES
CE
NC
E, r.
u.
F0
FM
FV
FS
FM’
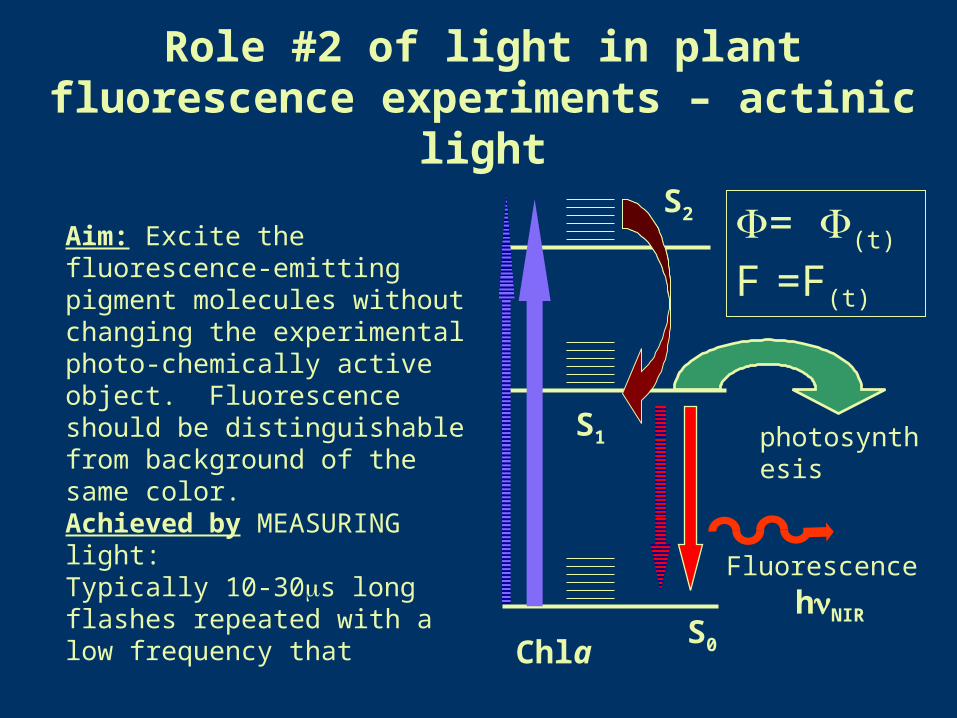
Color photograph
Fluorescence FM image
Chlorophyll fluorescence from ripe lemon fruits

Color photograph
Fluorescence images
F0 FV FM FV/FM
Heterogeneous lemon pigmentation

Color photograph
Fluorescence images
F0 FM FV/FMFV
Post-harvest lemon damage

Phytotoxin response visualized by fluorescence
Sinapis alba60 h, 2000 mg/l destruxin
Brassica oleracea60 h, 0-500 mg/l destruxin
0.05 mg/l
0 mg/l
0.5mg/l50mg/l
500mg/l

TIME, s0 5 20 30 40
PLA
NT
FLU
OR
ES
CE
NC
E, F
(t) / F
o
0
2
4
6
8
10Hcf mutant
WT
Saturating Pulses:
ONActinic Light: OFF
A B
Mutant selection

High-light stress sensitivity
FV/FM
2

T I M E , s
0 5 1 0 1 5 2 0 2 5
SIG
NA
L, r
el.u
nits
5 0
5 5
6 0
6 5
7 0
I R R A D I A N C E , m o l ( p h o t o n ) . m - 2 . s - 1
0 2 5 0 5 0 0 7 5 0 1 0 0 0 1 2 5 0 1 5 0 0
FL
UO
RE
SC
EN
CE
F(t
), F
M',
rel.u
nits
2
4
6
8
1 0
1 2
1 4
1 6
1 8
A
C
BA
O NA c t i n i c L i g h t : O F F
Field operation

0 100 110 120 130 140 1500
20
40
60
80
100 Elodea cell diatom
rela
tive
fluor
esce
nce
time / s
50 m
FV / FM FS
FS – F0
Microscopic kinetic fluorescence imaging
diatoms
Elodea chloroplasts
Average
Bio-Sphere2, Tuscon AZ, Nov.29, 2001