Embed Size (px)
Citation preview
I.J.E.M.S., VOL.6 (3) 2015: 124 - 148 ISSN 2229-600X
124
PRODUCTIVITY AND PROFITABILITY ANALYSIS OF BANKING SECTORIN INDIA: IN THE POST RE-FORM PERIOD
Jena Rupak KumarDepartment of Accounting and Finance, Ministry of Education Ethiopia, Mettu University
Corresponding Authors Email: [email protected]
ABSTRACTThe present study is an attempt to examine the total productivity and profitability growth in Indian banking sector during 1991-1992 to 2010-2011. The data of four bank groups (SBI group, nationalized bank group, private sector bank group and foreignbank group) for twenty years has been collected from the official website of reserve bank of India, financial analysis of banks,performance high lights of different category of banks, IBA etc.. The productivity index data analyses are being used to measurethe productivity and profitability in four sectors banks over the years.
The empirical result show that the profitability analysis of the four sample bank groups have been undertaken by dividingthe twenty year period under study into two distinct phases; the first phase covering ten years and second phase comprising thelatter ten years. The analysis has been done through an analytical framework so as to find out the factors affecting profitability.This framework splits the income and expenditure statement to find out the relation between different components of incomeand expenditure and its impact on profitability. Basically, spread, difference between interests earned and interest paid andburden play major role in determining the profitability of a commercial bank. Both spread and burden are treated as primary onfirst associate factor. Factors which determine this primary factor are treated as secondary factor. Factors which determine theirsecondary factors are known as tertiary factor. The factors which influence this tertiary factor are termed as fourth associatefactors. The framework adopted for the purpose of analysis have spread, burden and its components are to be related to acommon denominator, volume of business (V) and to convert these into ratio. Establishment ratio is derived by dividing payoutper employee (M1) by volume of business per employee (M2).
Analysis of total sample (average of all four sample groups) during second phase reveals that fall in establishment expenses,fall in other expenses and rise in other income ratio are the major determinant and main contributors to profitability. However,fall in spread ratio had a negative impact on profitability. So, increase in volume of business, control over other expenses andincrease in fee-based business of banking sector have a positive impact on the profitability of the banking sector during the postreform era. Sample group wise, S.B.I. bank group has improved profitability ratio due to fall in establishment ratio, fall in otherexpenses ratio. In this case, spread and other income have made negative contribution to the profitability ratio. Here the key toprofitability is volume of business, check on other expenses and increase in commission based income. Analysis of nationalizedbank group indicates that both establishment ratio and other expenses ratio declined in the second phase. Over the same periodother income ratio also increased. Contrary to expectations, spread influenced negatively to the profitability ratio. Profitabilityof nationalized bank group improved in the second phase only due to positive contribution by burden ratio. So, increased volumeof business, check on other expenses and increase non-fund based business are the main contributors to the profitability ratio ofnationalized bank group.
Analysis undertaken for sample private sector bank group depicts that decrease in establishment ratio and increase in otherincome ratio made it possible to improve profitability for this group in the second phase despite negative support by spread andother expenses ratio. So, volume of business and fee-based income are main determinants of profitability in case of sampleprivate sector banks. Perusal of framework for analysis of foreign bank group indicates that spread and establishment expensescontributed negatively to the profitability in the second phase. But decrease in other expenses and increase in other income ratioare the main factors which improved profitability ratio of foreign bank group in the second phase of our study. Despite negativecontribution by establishment expenses ratio, burden ratio decreased in the second phase due to support of other expenses andincome ratio and profitability improved in a situation where spread, the interest income, went down to create negativecontribution on profitability. So, key to profitability in case of foreign bank group is proper handling of burden ratio.
Comparative study of all four groups reveals that in- spite of fall in spread ratio in the entire sample four bank groups in thesecond decade of the study period, profitability had improved in the second phase. None of the four sample bank groupsdeepened on spread ratio which is widely considered as the main determinant of profitability ratio of a bank. All the samplebank groups, alternatively stressed on the proper management of burden to increase profitability. Thus it is revealed that whencompulsive reasons does not allow enhancement of the spread volume by the banks, profitability can be improved with proper
Productivity and profitability analysis of banking sector in India
125
handling and managing of burden. So under Indian financial environment burden management seems to be an important strategyfor enhancing profitability along with successful discharge of social responsibility.
Keywords: Productivity and Profitability, Private and Public Sector Bank.
INTRODUCTIONA sound financial infrastructure is a pre-requisite for economicdevelopment. Commercial banks are the most importantsegment of the financial system. Financial sector plays a verycrucial role in the economic growth of a country. Theimportance of this sector’s contribution is more in a developingeconomy like India. Indian banking sector is like fuel providerto the Indian economy and is contributing so much towardsoverall growth of the economy. This sector has envisagedtremendous growth overtimes and gets a completely differentand advanced look in present times. International access,increased no. of banks, improved technology like e-banking,m-banking and t-banking itself tells the changing story ofIndian banking sector. At present, different kind of banks likepublic sector banks, private sector banks and foreign banks areoperating efficiently in the country. The era of globalizationhas also altered the structure and functioning of banking sectorin India. Soundness of the banking sector is synonymous withefficiency, productivity, profitability, stability and a shock freeenvironment of economy. According to RBI, Banks lubricatethe wheels of the real economy, are the conduits of monetarypolicy transmission and constitute the economy’s payment andsettlement system.
After Independence, the banking sector in India was not ina very good position. There was need to revive the wholeeconomy and it was not possible without a strong andcompetent banking sector. The banking sector has passedthrough different phases in India. 1969 was the era ofNationalization when major banks of India were nationalized.The Government also faced the balance of payment crisisin 1991 – 92 following which a stabilisation programmewas initiated with the help of International Monetary Fund(IMF) which specially included reform of the IndianFinancial System (IFS). After that, Government of Indiaset up a Committee under the Chairmanship of M.Narashimham popularly known as Narashimham Committeewho submitted its report in 1992. The report primarily aimedat enhancing the productivity, efficiency and profitabilityof the banking system in the country. Hence the committeerecommended far-reaching reforms in both structural andfunctional approach of the Indian banking system in orderto enhance their efficiency, productivity and profitability.The Narashimham Committee recommendations ware aimedat ensuring a degree of operational flexibility, internalautonomy for the public sector banks in their decision makingprocess and greater degree of professionalism in bankingoperations. Accordingly, the overall functioning of the bankingindustry, administrative, asset management, investment humanresources and so on has been undergoing in metamorphosis inrecent years. In the emerging financial scenario, competition,productivity, profits are no longer a taboo for the commercialbanks in India.
Further, the second phase of reform introduced in 1998was based on the recommendation of the Committee on theBanking Sector Reform and, Shri M. Narasimham was the
Chairman of this Committee. This phase of reform focusedmainly on structural measure and improvement of disclosurestandard and level of transparency so as to align Indianstandards with the internationally recognized best practices.All the above changes have added significantly to theperformance of Indian banking sector. Both the committeereports have been accepted and are being implement in aphased manner, the main thrust being strengthening the Indianbanking sector and make it globally competitive.. Presentlynew and improved techniques and research are used and thesame has entirely changed the functioning of Indian BankingSector.
PRODUCTIVITY IN BANKING SECTORProductivity is one of the very important indicators to assessthe economic performance of an economy. In simple termsproductivity is the ratio of output to input which means outputper unit produced for every unit of input used. Productivity isthe relationship between physical outputs of one or morephysical inputs used in production (Kopleman).
Productivity = total output / total input
When productivity is studied related to one factor is termed asfactor productivity. Like labour productivity or capitalproductivity. When all the factors are together studied it istermed as total factor productivity. Inputs and Outputs aredifferent in banking sector as compared to other sectorsbecause banks are mainly service providers. The products inthe banking sector are different than other sectors and includedeposits, borrowings, Interest etc. So study of productivity inbanking sector is different as it is studied in other sectors of theeconomy.
REVIEW OF LITERATUREThe present research is an attempt to analyse the comparativeefficiency and competitiveness of Indian commercial banks.As a matter a matter of fact, the efficiency of the banking sectoris one of the important economic agenda for governments allover the world. The main impulsion for this study has been therecommendation and implementation of the NarashimhamCommittee reports of 1991 and 1998 by the Government ofIndia in the banking sector reforms so as to strengthen theIndian banking system and make it globally competitive. Thisclearly requires that the relative efficiency of the bankingsector in India is examined. The present study thereforeexamines that efficiency of the banking sector by using thepopular productivity and profitability analysis of commercialbanks on India covering the post-reform period of twenty yearsspanning over 1991-92 to 2010-11. This study aims to examinethe relative efficiency of various commercial bank groups likeState Bank of India Group, (SBI Group) Nationalised BankGroup, Private Sector Bank Group (PB Group) and ForeignBank Group (FB Group) which are operating in India. Thereason that the period 1991-92 to 2010-11 is chosen for this
I.J.E.M.S., VOL.6 (3) 2015: 124 - 148 ISSN 2229-600X
126
study is that the current banking sector reforms were initiatedin 1991 and being continuously pursued in a phased manner.Thus the sample period of twenty years which is furtherdivided in to two phases of ten years each is good enough toprovide sufficient insight regarding the impact of reforms onIndian banking sector. In this study, the productivity andprofitability parameters for the two phases; namely first phasecovering 1991-92 to 2000-01 and second phase spanning 2001-2002 to 2010-11 have been calculated, analysed, compared andcontrasted in evaluating the relative efficiency of commercialbanks in India; both in aggregate and in groups.
RESEARCH METHODOLOGYA) Research objectives
i) To assess the overall profitability and productivity ofthe banking sector in the post reform period.
ii) To examine the relative profitability performanceof each bank group – State Bank of India group,Nationalized Bank group, Private Sector Bank groupand Foreign Bank group.
iii) To evaluate the relative productivity performance ofeach bank group during the study period.
iv) To study the influence of different factors contributingto the productivity and profitability trends of thebanking sector.
v) To indicate the extent to which reforms in thefinancial sector have contributed to improve theproductivity and profitability of the banking sector.
B) Research HypothesisI. The operational productivity of Indian banking sector
has increased during the post reform period.
II. Bank productivity is the cornerstone of profitability.
III. Ownership and management of commercial banks is amajor determinant of productivity.
IV. ‘Spread’ continues to be the major determinant ofcommercial bank productivity.
V. ‘Burden’ being an ‘outgo’ is a negative determinant ofbank profitability.
VI. In the changing financial environment, diversificationof bank business is the key to bank profitability.
VII. Volume of business is the contributing factor to the bankprofitability.
C) Selection of input and outputProductivity and profitability of different banks group aremeasured by relevant parameters such as deposit,advances, income, expenditure , profit to working fund, etc.
D) Research MethodologyThe commercial banking sector in India which includesthe State Bank of India and its associated banks, nationalisedbanks, major private sector banks and foreign banksoperating in India. Thus, the Indian banking sector havebeen broadly divided into four groups for the analysis ofprofitability and productivity during the post – reformperiod. More specifically the period of 20 years beginningfrom the year 1991- 92 to 2010 – 11 has been coveredunder this study. The study period has been divided intotwo distinct phases. The reform process started with theimplementation of Narashimham Committee reported in 1991.Thus the first phase covered the initial ten years covering 1991-92 to 2000-2001. Further intensification of reforms took placeafter the implementation of second report of NarashimhamCommittee in 1998. Thus, the second phase of the study coversthe second decade of the reform period i.e. 2001-02 to 2010-11. Thus, the study encompasses the whole of the reformperiod. Performance of banks can be measured by a number ofindicators. Productivity and profitability are the mostimportant and reliable indicator of the banking performance.For the purpose of the present study, both the performanceparameters have been used.
Banking profitability has been examined through thefollowing indicators:i) Interest earned as percentage of working fundii) Interest paid as percentage of working fundiii) Ratio of total income to working fundiv) Ratio of spread to working fundv) Ratio of non – interest expenditure to working fundvi) Other income as percentage of working fundvii) Ratio of burden to working fund
Banking productivity has been examined through thefollowing indicators:i) Cost of depositii) Business per employeeiii) Interest income to working fundiv) Non-interest income to working fundv) Spread as percentage of working fund
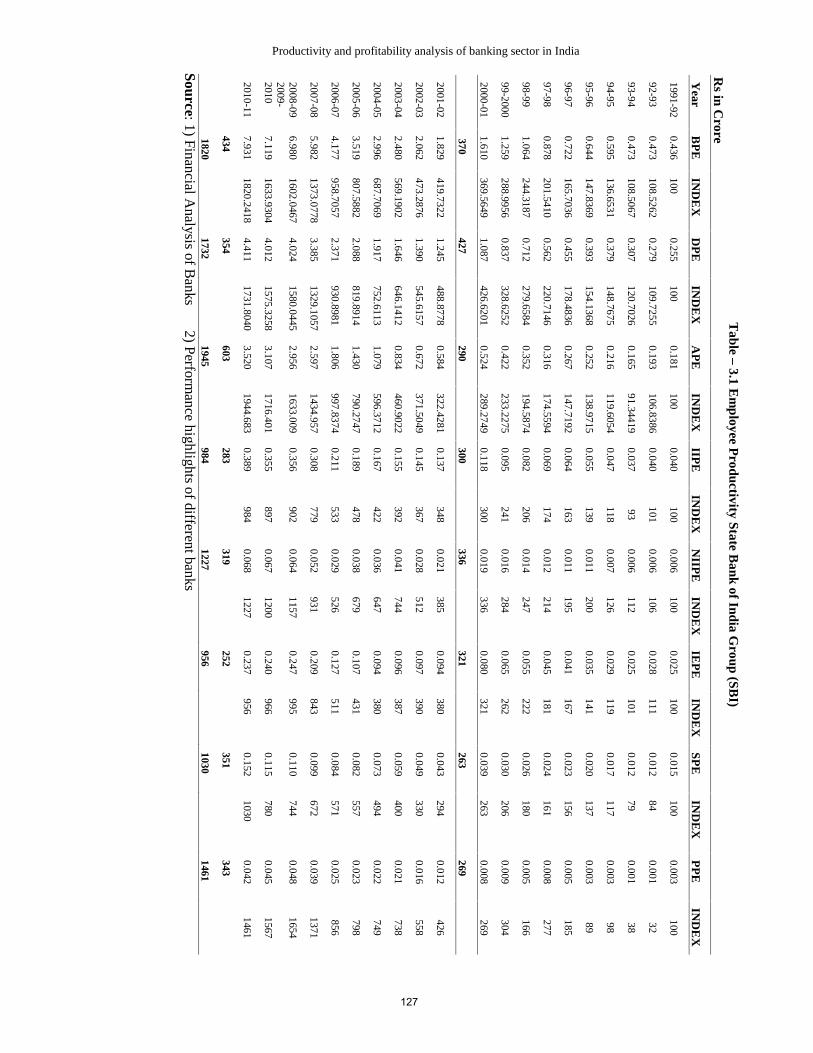
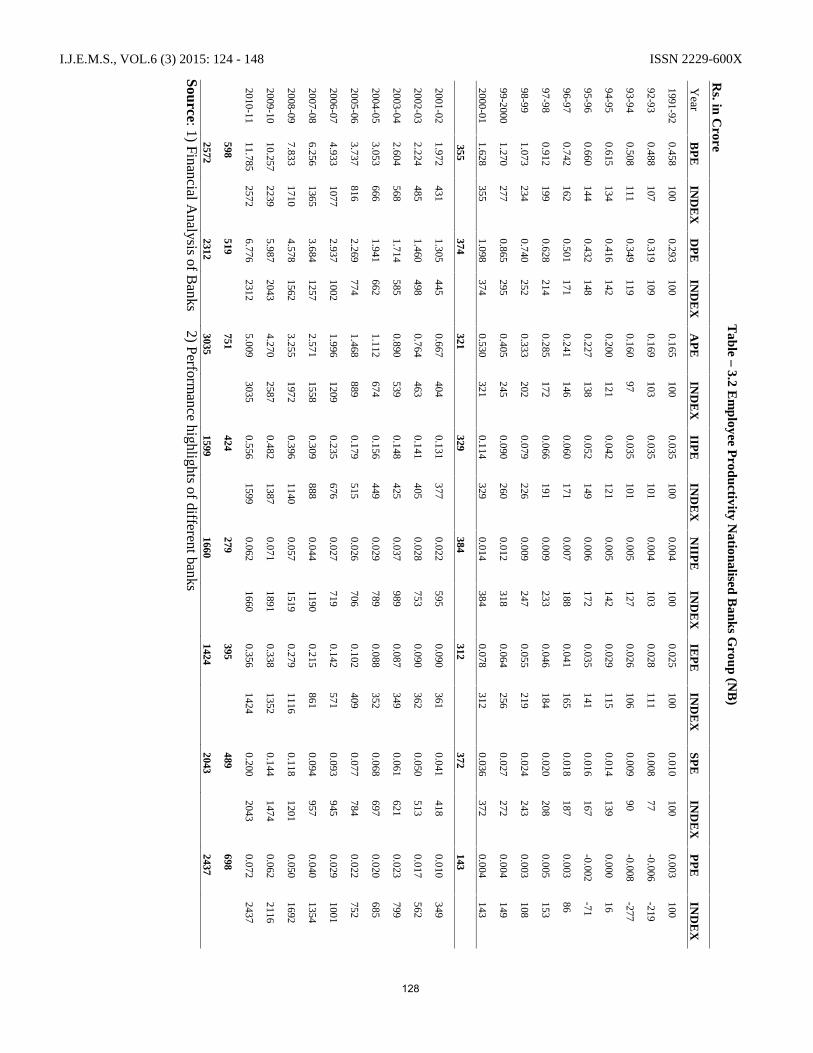
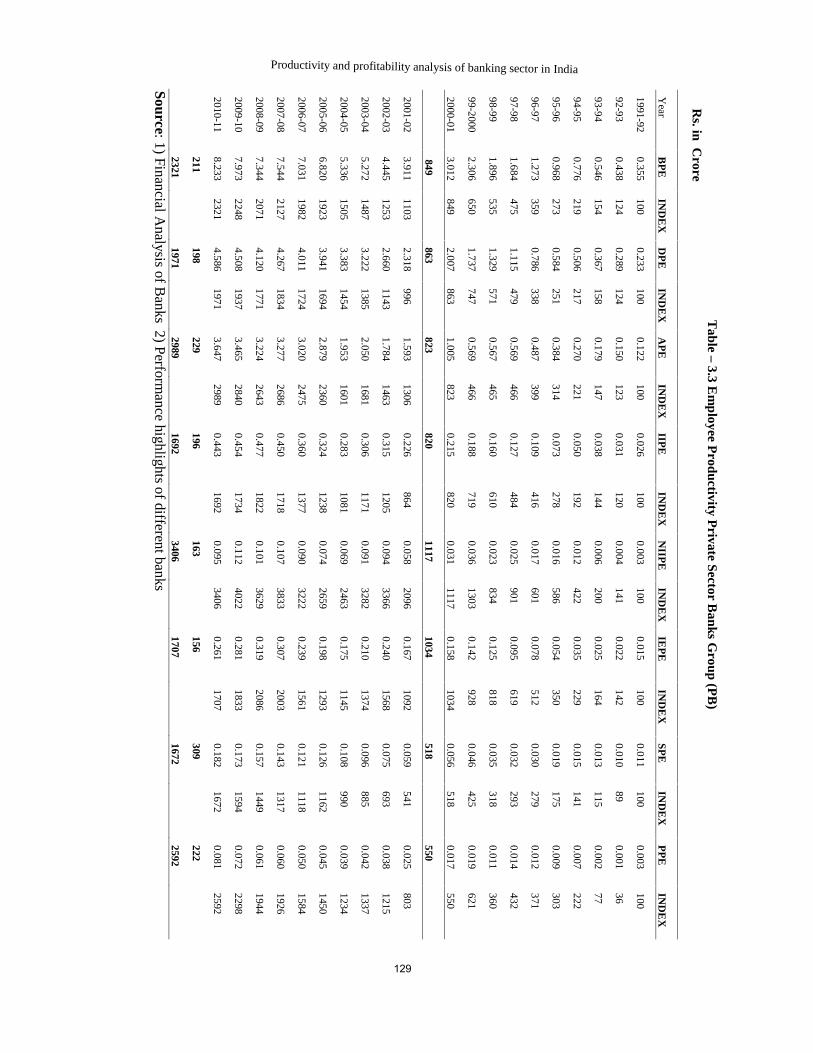
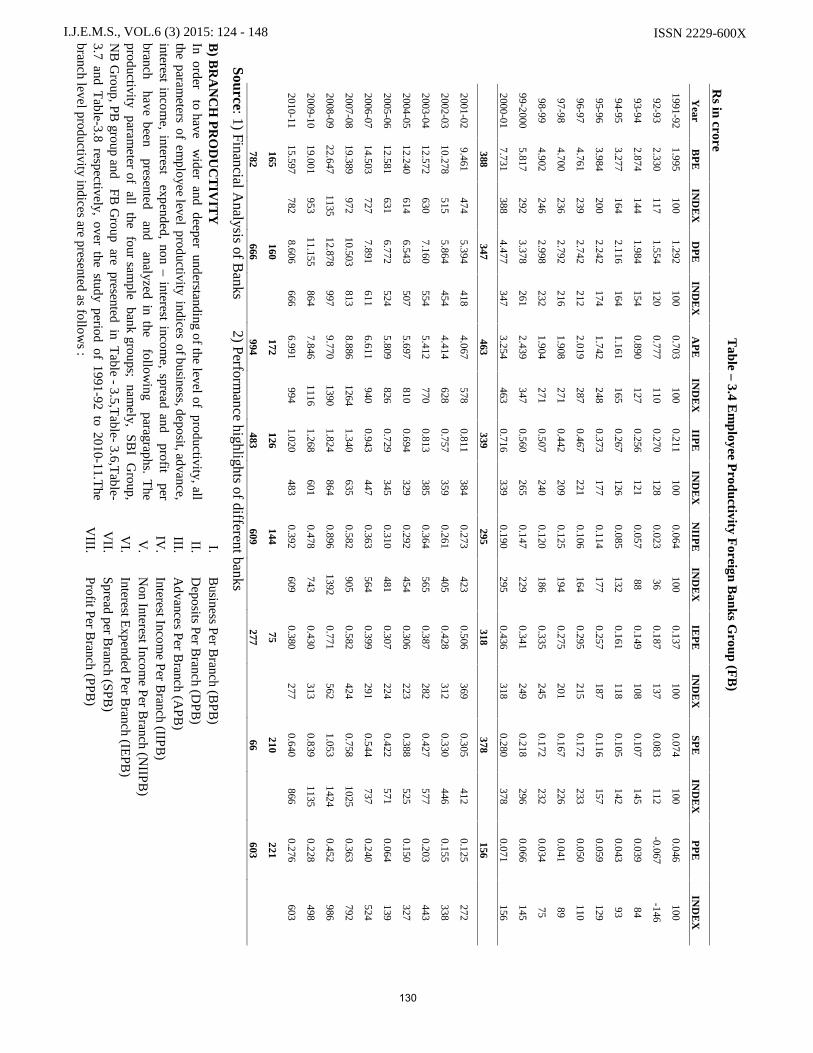
EMPIRICAL ANALYSIS (productivity)A) EMPLOYEE PRODUCTIVITYTable-3.1, Table-3.2, Table-3.3, and Table-3.4 present theemployee productivity indices (year wise) of SBI group,nationalised bank group, private sector bank group and foreignbank group respectively for the study period, covering 1991-92 to 2010-11. The employee productivity parameters arerepresented by eight indices which are as follows.I. Business Per Employee (BPE)II. Deposit Per Employee (DPE)III. Advance Per Employee (APE)IV. Interest Income Per Employee (IIPE)V. Non Interest Income Per Employee (NIIPE)VI. Interest Expended Per Employee (IEPE)VII. Spread Per Employee (SPE)VIII. Profit Per Employee (PPE)
Productivity and profitability analysis of banking sector in India
Table
–3.1
Em
ployee Productivity
State Bank of India G
roup (SBI)
Rs in C
rore
Year
BP
EIN
DE
XD
PE
IND
EX
AP
EIN
DE
XIIP
EIN
DE
XN
IIPE
IND
EX
IEP
EIN
DE
XSP
EIN
DE
XP
PE
IND
EX
1991-920.436
1000.255
1000.181
1000.040
1000.006
1000.025
1000.015
1000.003
100
92-930.473
108.52620.279
109.72550.193
106.83860.040
1010.006
1060.028
1110.012
840.001
32
93-940.473
108.50670.307
120.70260.165
91.344190.037
930.006
1120.025
1010.012
790.001
38
94-950.595
136.65310.379
148.76750.216
119.60540.047
1180.007
1260.029
1190.017
1170.003
98
95-960.644
147.83690.393
154.13680.252
138.97150.055
1390.011
2000.035
1410.020
1370.003
89
96-970.722
165.70360.455
178.48360.267
147.71920.064
1630.011
1950.041
1670.023
1560.005
185
97-980.878
201.54100.562
220.71460.316
174.55940.069
1740.012
2140.045
1810.024
1610.008
277
98-991.064
244.31870.712
279.65840.352
194.58740.082
2060.014
2470.055
2220.026
1800.005
166
99-20001.259
288.99560.837
328.62520.422
233.22750.095
2410.016
2840.065
2620.030
2060.009
304
2000-011.610
369.56491.087
426.62010.524
289.27490.118
3000.019
3360.080
3210.039
2630.008
269
370427
290300
336321
263269
2001-021.829
419.73221.245
488.87780.584
322.42810.137
3480.021
3850.094
3800.043
2940.012
426
2002-032.062
473.28761.390
545.61570.672
371.50490.145
3670.028
5120.097
3900.049
3300.016
558
2003-042.480
569.19021.646
646.14120.834
460.90220.155
3920.041
7440.096
3870.059
4000.021
738
2004-052.996
687.70691.917
752.61131.079
596.37120.167
4220.036
6470.094
3800.073
4940.022
749
2005-063.519
807.58822.088
819.89141.430
790.27470.189
4780.038
6790.107
4310.082
5570.023
798
2006-074.177
958.70572.371
930.89811.806
997.83740.211
5330.029
5260.127
5110.084
5710.025
856
2007-085.982
1373.07783.385
1329.10572.597
1434.9570.308
7790.052
9310.209
8430.099
6720.039
1371
2008-096.980
1602.04674.024
1580.04452.956
1633.0090.356
9020.064
11570.247
9950.110
7440.048
16542009-2010
7.1191633.9304
4.0121575.3258
3.1071716.401
0.355897
0.0671200
0.240966
0.115780
0.0451567
2010-117.931
1820.24184.411
1731.80403.520
1944.6830.389
9840.068
12270.237
9560.152
10300.042
1461
434354
603283
319252
351343
18201732
1945984
1227956
10301461
Source: 1) Financial Analysis of B
anks2) Perform
ance highlights of different banks
127
I.J.E.M.S., VOL.6 (3) 2015: 124 - 148 ISSN 2229-600X
Table
–3.2
Em
ployee Productivity N
ationalised Banks G
roup (NB
)R
s. in Crore
Year
BP
EIN
DE
XD
PE
IND
EX
AP
EIN
DE
XIIP
EIN
DE
XN
IIPE
IND
EX
IEP
EIN
DE
XSP
EIN
DE
XP
PE
IND
EX
1991-920.458
1000.293
1000.165
1000.035
1000.004
1000.025
1000.010
1000.003
100
92-930.488
1070.319
1090.169
1030.035
1010.004
1030.028
1110.008
77-0.006
-219
93-940.508
1110.349
1190.160
970.035
1010.005
1270.026
1060.009
90-0.008
-277
94-950.615
1340.416
1420.200
1210.042
1210.005
1420.029
1150.014
1390.000
16
95-960.660
1440.432
1480.227
1380.052
1490.006
1720.035
1410.016
167-0.002
-71
96-970.742
1620.501
1710.241
1460.060
1710.007
1880.041
1650.018
1870.003
86
97-980.912
1990.628
2140.285
1720.066
1910.009
2330.046
1840.020
2080.005
153
98-991.073
2340.740
2520.333
2020.079
2260.009
2470.055
2190.024
2430.003
108
99-20001.270
2770.865
2950.405
2450.090
2600.012
3180.064
2560.027
2720.004
149
2000-011.628
3551.098
3740.530
3210.114
3290.014
3840.078
3120.036
3720.004
143
355374
321329
384312
372143
2001-021.972
4311.305
4450.667
4040.131
3770.022
5950.090
3610.041
4180.010
349
2002-032.224
4851.460
4980.764
4630.141
4050.028
7530.090
3620.050
5130.017
562
2003-042.604
5681.714
5850.890
5390.148
4250.037
9890.087
3490.061
6210.023
799
2004-053.053
6661.941
6621.112
6740.156
4490.029
7890.088
3520.068
6970.020
685
2005-063.737
8162.269
7741.468
8890.179
5150.026
7060.102
4090.077
7840.022
752
2006-074.933
10772.937
10021.996
12090.235
6760.027
7190.142
5710.093
9450.029
1001
2007-086.256
13653.684
12572.571
15580.309
8880.044
11900.215
8610.094
9570.040
1354
2008-097.833
17104.578
15623.255
19720.396
11400.057
15190.279
11160.118
12010.050
1692
2009-1010.257
22395.987
20434.270
25870.482
13870.071
18910.338
13520.144
14740.062
2116
2010-1111.785
25726.776
23125.009
30350.556
15990.062
16600.356
14240.200
20430.072
2437
598519
751424
279395
489698
25722312
30351599
16601424
20432437
Source: 1) Financial Analysis of B
anks2) Perform
ance highlights of different banks
128
Productivity and profitability analysis of banking sector in India
Table
–3.3
Em
ployee Productivity P
rivate Sector Banks G
roup (PB
)R
s. inC
rore
Year
BP
EIN
DE
XD
PE
IND
EX
AP
EIN
DE
XIIP
EIN
DE
XN
IIPE
IND
EX
IEP
EIN
DE
XSP
EIN
DE
XP
PE
IND
EX
1991-920.355
1000.233
1000.122
1000.026
1000.003
1000.015
1000.011
1000.003
100
92-930.438
1240.289
1240.150
1230.031
1200.004
1410.022
1420.010
890.001
36
93-940.546
1540.367
1580.179
1470.038
1440.006
2000.025
1640.013
1150.002
77
94-950.776
2190.506
2170.270
2210.050
1920.012
4220.035
2290.015
1410.007
222
95-960.968
2730.584
2510.384
3140.073
2780.016
5860.054
3500.019
1750.009
303
96-971.273
3590.786
3380.487
3990.109
4160.017
6010.078
5120.030
2790.012
371
97-981.684
4751.115
4790.569
4660.127
4840.025
9010.095
6190.032
2930.014
432
98-991.896
5351.329
5710.567
4650.160
6100.023
8340.125
8180.035
3180.011
360
99-20002.306
6501.737
7470.569
4660.188
7190.036
13030.142
9280.046
4250.019
621
2000-013.012
8492.007
8631.005
8230.215
8200.031
11170.158
10340.056
5180.017
550
849863
823820
11171034
518550
2001-023.911
11032.318
9961.593
13060.226
8640.058
20960.167
10920.059
5410.025
803
2002-034.445
12532.660
11431.784
14630.315
12050.094
33660.240
15680.075
6930.038
1215
2003-045.272
14873.222
13852.050
16810.306
11710.091
32820.210
13740.096
8850.042
1337
2004-055.336
15053.383
14541.953
16010.283
10810.069
24630.175
11450.108
9900.039
1234
2005-066.820
19233.941
16942.879
23600.324
12380.074
26590.198
12930.126
11620.045
1450
2006-077.031
19824.011
17243.020
24750.360
13770.090
32220.239
15610.121
11180.050
1584
2007-087.544
21274.267
18343.277
26860.450
17180.107
38330.307
20030.143
13170.060
1926
2008-097.344
20714.120
17713.224
26430.477
18220.101
36290.319
20860.157
14490.061
1944
2009-107.973
22484.508
19373.465
28400.454
17340.112
40220.281
18330.173
15940.072
2298
2010-118.233
23214.586
19713.647
29890.443
16920.095
34060.261
17070.182
16720.081
2592
211198
229196
163156
309222
23211971
29891692
34061707
16722592
Source: 1) Financial Analysis of B
anks2) Perform
ance highlights of different banks
129
I.J.E.M.S., VOL.6 (3) 2015: 124 - 148 ISSN 2229-600X
Table
–3.4
Em
ployee Productivity F
oreign Banks G
roup (FB
)R
s in crore
Year
BP
EIN
DE
XD
PE
IND
EX
AP
EIN
DE
XIIP
EIN
DE
XN
IIPE
IND
EX
IEP
EIN
DE
XSP
EIN
DE
XP
PE
IND
EX
1991-921.995
1001.292
1000.703
1000.211
1000.064
1000.137
1000.074
1000.046
100
92-932.330
1171.554
1200.777
1100.270
1280.023
360.187
1370.083
112-0.067
-146
93-942.874
1441.984
1540.890
1270.256
1210.057
880.149
1080.107
1450.039
84
94-953.277
1642.116
1641.161
1650.267
1260.085
1320.161
1180.105
1420.043
93
95-963.984
2002.242
1741.742
2480.373
1770.114
1770.257
1870.116
1570.059
129
96-974.761
2392.742
2122.019
2870.467
2210.106
1640.295
2150.172
2330.050
110
97-984.700
2362.792
2161.908
2710.442
2090.125
1940.275
2010.167
2260.041
89
98-994.902
2462.998
2321.904
2710.507
2400.120
1860.335
2450.172
2320.034
75
99-20005.817
2923.378
2612.439
3470.560
2650.147
2290.341
2490.218
2960.066
145
2000-017.731
3884.477
3473.254
4630.716
3390.190
2950.436
3180.280
3780.071
156
388347
463339
295318
378156
2001-029.461
4745.394
4184.067
5780.811
3840.273
4230.506
3690.305
4120.125
272
2002-0310.278
5155.864
4544.414
6280.757
3590.261
4050.428
3120.330
4460.155
338
2003-0412.572
6307.160
5545.412
7700.813
3850.364
5650.387
2820.427
5770.203
443
2004-0512.240
6146.543
5075.697
8100.694
3290.292
4540.306
2230.388
5250.150
327
2005-0612.581
6316.772
5245.809
8260.729
3450.310
4810.307
2240.422
5710.064
139
2006-0714.503
7277.891
6116.611
9400.943
4470.363
5640.399
2910.544
7370.240
524
2007-0819.389
97210.503
8138.886
12641.340
6350.582
9050.582
4240.758
10250.363
792
2008-0922.647
113512.878
9979.770
13901.824
8640.896
13920.771
5621.053
14240.452
986
2009-1019.001
95311.155
8647.846
11161.268
6010.478
7430.430
3130.839
11350.228
498
2010-1115.597
7828.606
6666.991
9941.020
4830.392
6090.380
2770.640
8660.276
603
165160
172126
14475
210221
782666
994483
609277
66603
Source: 1) Financial Analysis of B
anks2) Perform
ance highlights of different banks
B)
BR
AN
CH
PR
OD
UC
TIV
ITY
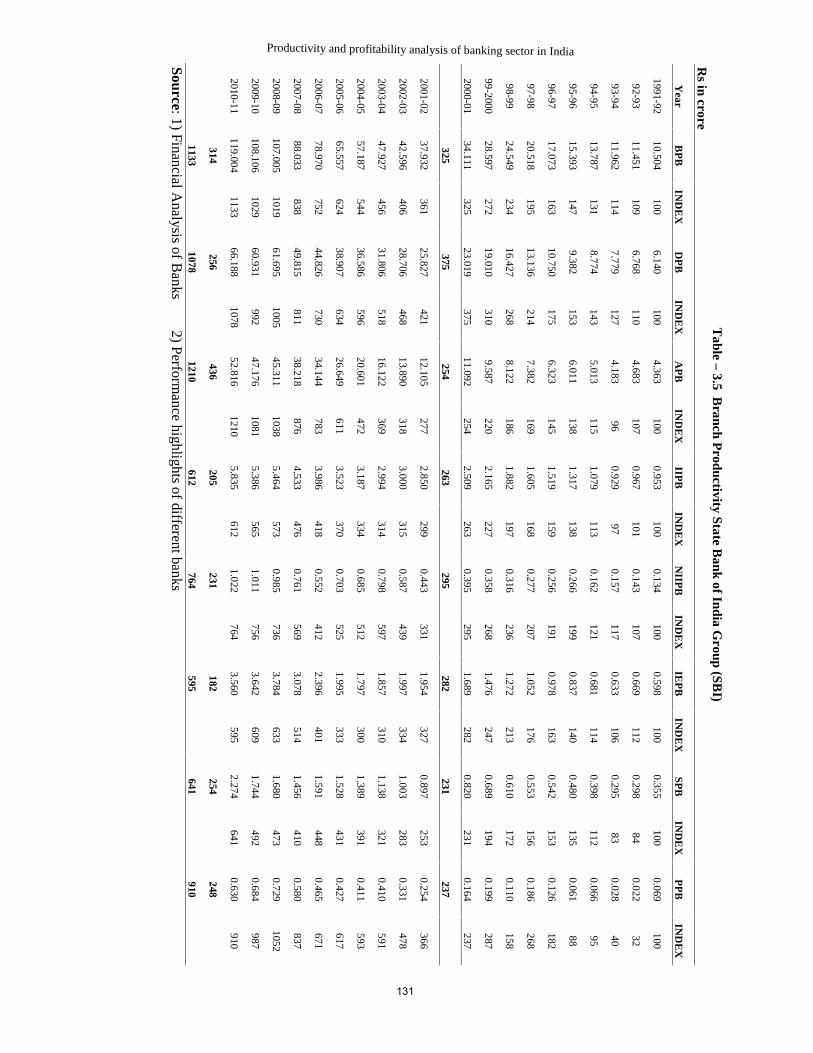
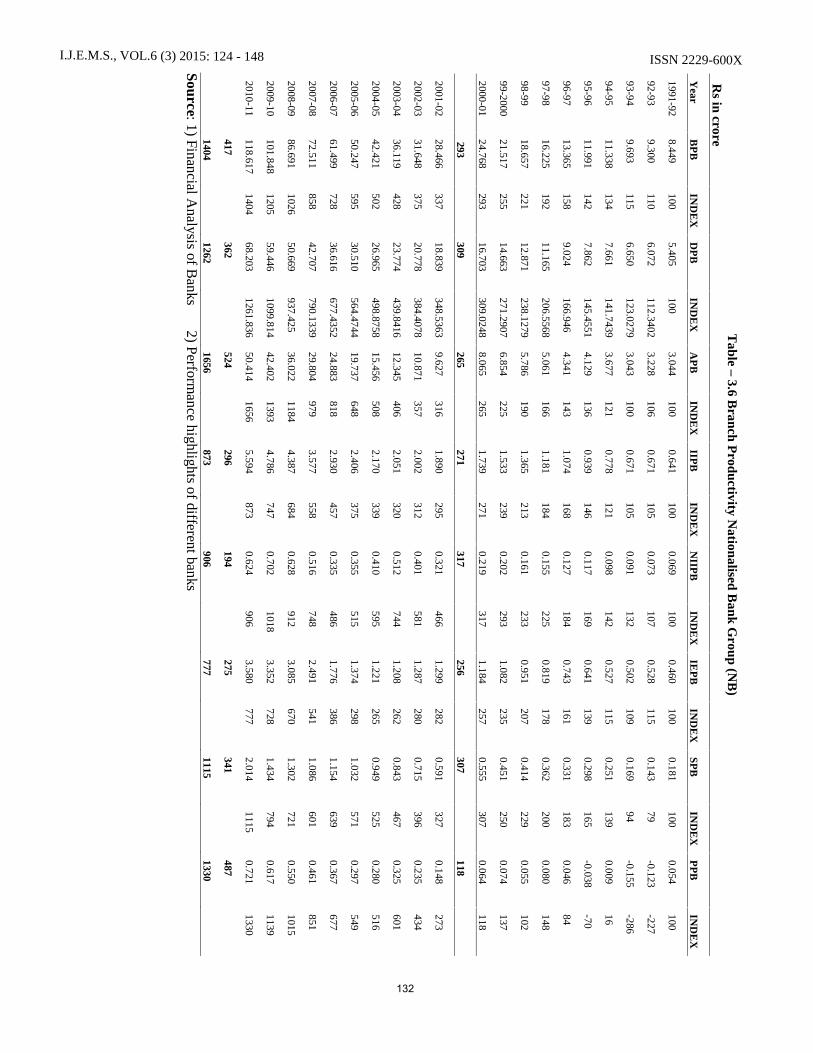
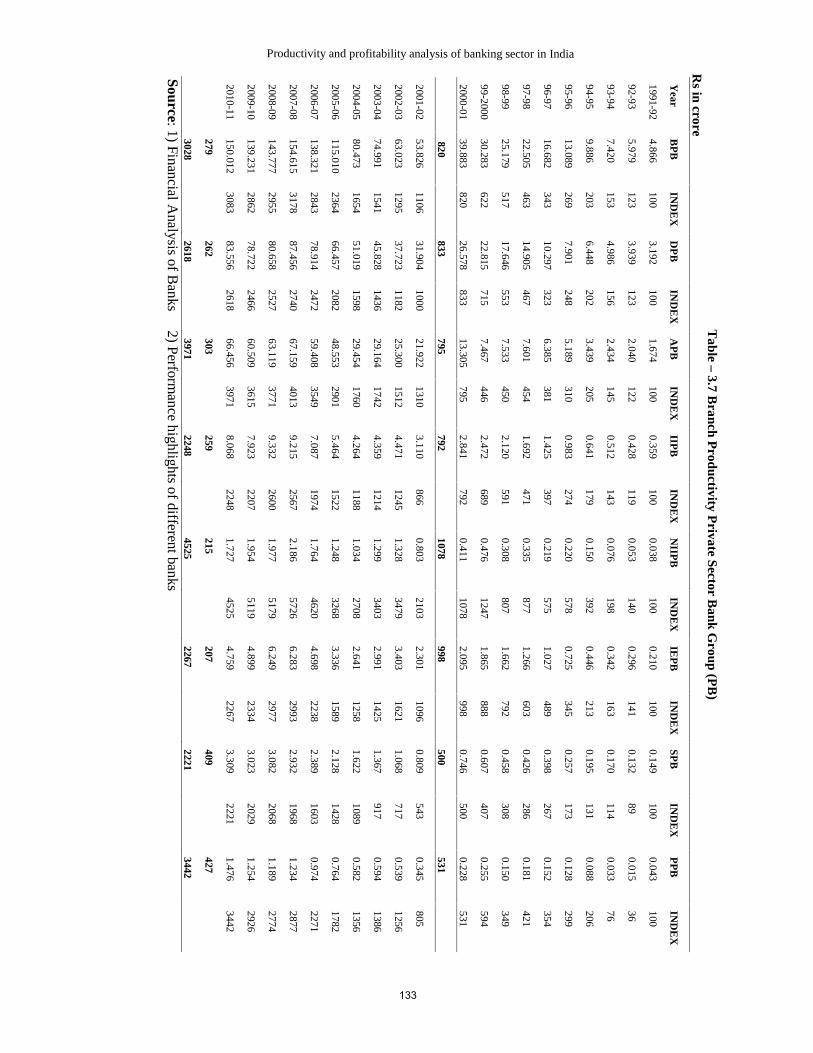
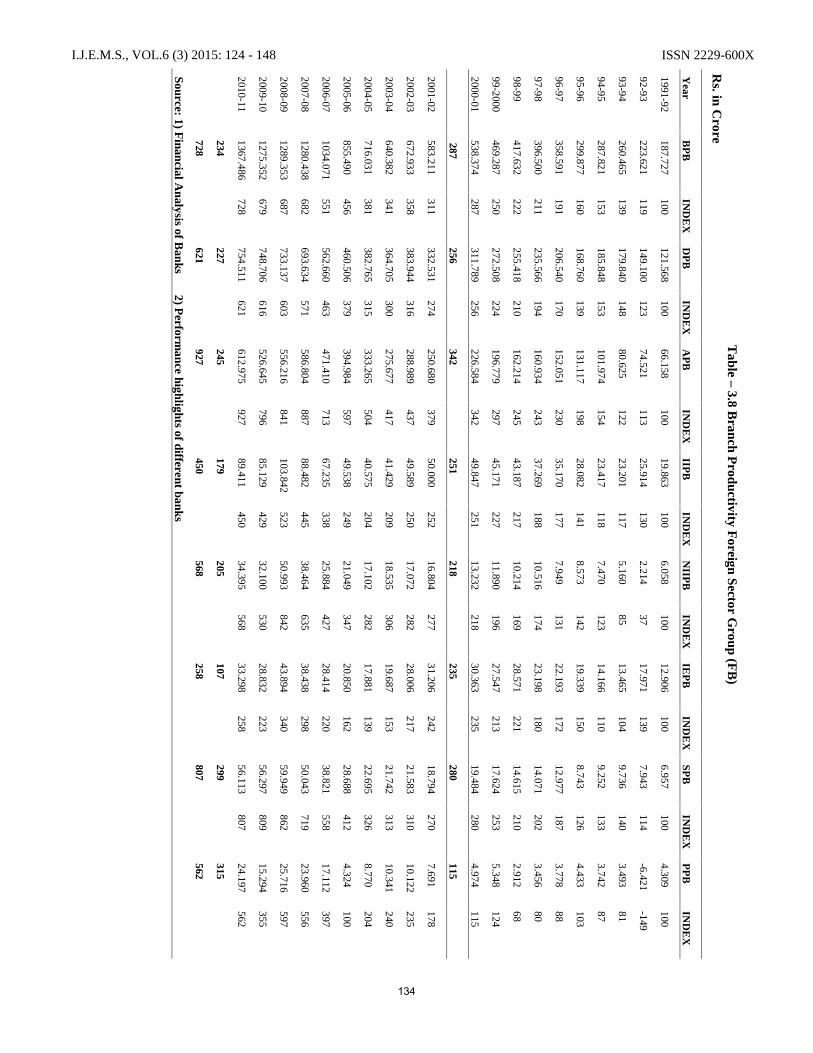
In order to have wider and deeper understanding of the level of productivity, all
the parameters of em
ployee level productivity indices of business, deposit, advance,interest incom
e, interest expended, non–
interest income, spread and profit per
branch have been presented and analyzed in the following paragraphs. T
heproductivity param
eter of all the four sample bank groups; nam
ely, SBI G
roup,N
B G
roup, PB group and FB
Group are presented in T
able-
3.5,Table-
3.6,Table-
3.7 and Table-3.8 respectively, over the study period of 1991-92 to 2010-11.T
hebranch level productivity indices are presented as follow
s :
I.B
usiness Per B
ranch (BP
B)
II.D
eposits Per B
ranch (DP
B)
III.A
dvances Per B
ranch (AP
B)
IV.
Interest Income P
er Branch (IIP
B)
V.
Non Interest Incom
e Per B
ranch (NIIP
B)
VI.
Interest Expended P
er Branch (IE
PB)
VII.
Spread per Branch (SP
B)
VIII.
Profit P
er Branch (P
PB)
130
Productivity and profitability analysis of banking sector in India
Table
–3.5
Branch P
roductivity State Bank of India G
roup (SBI)
Rs in crore
Year
BP
BIN
DE
XD
PB
IND
EX
AP
BIN
DE
XIIP
BIN
DE
XN
IIPB
IND
EX
IEP
BIN
DE
XSP
BIN
DE
XP
PB
IND
EX
1991-9210.504
1006.140
1004.363
1000.953
1000.134
1000.598
1000.355
1000.069
100
92-9311.451
1096.768
1104.683
1070.967
1010.143
1070.669
1120.298
840.022
32
93-9411.962
1147.779
1274.183
960.929
970.157
1170.633
1060.295
830.028
40
94-9513.787
1318.774
1435.013
1151.079
1130.162
1210.681
1140.398
1120.066
95
95-9615.393
1479.382
1536.011
1381.317
1380.266
1990.837
1400.480
1350.061
88
96-9717.073
16310.750
1756.323
1451.519
1590.256
1910.978
1630.542
1530.126
182
97-9820.518
19513.136
2147.382
1691.605
1680.277
2071.052
1760.553
1560.186
268
98-9924.549
23416.427
2688.122
1861.882
1970.316
2361.272
2130.610
1720.110
158
99-200028.597
27219.010
3109.587
2202.165
2270.358
2681.476
2470.689
1940.199
287
2000-0134.111
32523.019
37511.092
2542.509
2630.395
2951.689
2820.820
2310.164
237
325375
254263
295282
231237
2001-0237.932
36125.827
42112.105
2772.850
2990.443
3311.954
3270.897
2530.254
366
2002-0342.596
40628.706
46813.890
3183.000
3150.587
4391.997
3341.003
2830.331
478
2003-0447.927
45631.806
51816.122
3692.994
3140.798
5971.857
3101.138
3210.410
591
2004-0557.187
54436.586
59620.601
4723.187
3340.685
5121.797
3001.389
3910.411
593
2005-0665.557
62438.907
63426.649
6113.523
3700.703
5251.995
3331.528
4310.427
617
2006-0778.970
75244.826
73034.144
7833.986
4180.552
4122.396
4011.591
4480.465
671
2007-0888.033
83849.815
81138.218
8764.533
4760.761
5693.078
5141.456
4100.580
837
2008-09107.005
101961.695
100545.311
10385.464
5730.985
7363.784
6331.680
4730.729
1052
2009-10108.106
102960.931
99247.176
10815.386
5651.011
7563.642
6091.744
4920.684
987
2010-11119.004
113366.188
107852.816
12105.835
6121.022
7643.560
5952.274
6410.630
910
314256
436205
231182
254248
11331078
1210612
764595
641910
Source: 1) Financial Analysis of B
anks2) Perform
ance highlights of different banks
131
I.J.E.M.S., VOL.6 (3) 2015: 124 - 148 ISSN 2229-600X
Table
–3.6
Branch
Productivity N
ationalised Bank G
roup (NB
)R
s in crore
Year
BP
BIN
DE
XD
PB
IND
EX
AP
BIN
DE
XIIP
BIN
DE
XN
IIPB
IND
EX
IEP
BIN
DE
XSP
BIN
DE
XP
PB
IND
EX
1991-928.449
1005.405
1003.044
1000.641
1000.069
1000.460
1000.181
1000.054
100
92-939.300
1106.072
112.34023.228
1060.671
1050.073
1070.528
1150.143
79-0.123
-227
93-949.693
1156.650
123.02793.043
1000.671
1050.091
1320.502
1090.169
94-0.155
-286
94-9511.338
1347.661
141.74393.677
1210.778
1210.098
1420.527
1150.251
1390.009
16
95-9611.991
1427.862
145.45514.129
1360.939
1460.117
1690.641
1390.298
165-0.038
-70
96-9713.365
1589.024
166.9464.341
1431.074
1680.127
1840.743
1610.331
1830.046
84
97-9816.225
19211.165
206.55685.061
1661.181
1840.155
2250.819
1780.362
2000.080
148
98-9918.657
22112.871
238.12795.786
1901.365
2130.161
2330.951
2070.414
2290.055
102
99-200021.517
25514.663
271.29076.854
2251.533
2390.202
2931.082
2350.451
2500.074
137
2000-0124.768
29316.703
309.02488.065
2651.739
2710.219
3171.184
2570.555
3070.064
118
293309
265271
317256
307118
2001-0228.466
33718.839
348.53639.627
3161.890
2950.321
4661.299
2820.591
3270.148
273
2002-0331.648
37520.778
384.407810.871
3572.002
3120.401
5811.287
2800.715
3960.235
434
2003-0436.119
42823.774
439.841612.345
4062.051
3200.512
7441.208
2620.843
4670.325
601
2004-0542.421
50226.965
498.875815.456
5082.170
3390.410
5951.221
2650.949
5250.280
516
2005-0650.247
59530.510
564.474419.737
6482.406
3750.355
5151.374
2981.032
5710.297
549
2006-0761.499
72836.616
677.435224.883
8182.930
4570.335
4861.776
3861.154
6390.367
677
2007-0872.511
85842.707
790.133929.804
9793.577
5580.516
7482.491
5411.086
6010.461
851
2008-0986.691
102650.669
937.42536.022
11844.387
6840.628
9123.085
6701.302
7210.550
1015
2009-10101.848
120559.446
1099.81442.402
13934.786
7470.702
10183.352
7281.434
7940.617
1139
2010-11118.617
140468.203
1261.83650.414
16565.594
8730.624
9063.580
7772.014
11150.721
1330
417362
524296
194275
341487
14041262
1656873
906777
11151330
Source: 1) Financial Analysis of B
anks2) Perform
ance highlights of different banks
132
Productivity and profitability analysis of banking sector in India
Table
–3.7
Branch
Productivity P
rivate Sector Bank G
roup (PB
)R
s in crore
Year
BP
BIN
DE
XD
PB
IND
EX
AP
BIN
DE
XIIP
BIN
DE
XN
IIPB
IND
EX
IEP
BIN
DE
XSP
BIN
DE
XP
PB
IND
EX
1991-924.866
1003.192
1001.674
1000.359
1000.038
1000.210
1000.149
1000.043
100
92-935.979
1233.939
1232.040
1220.428
1190.053
1400.296
1410.132
890.015
36
93-947.420
1534.986
1562.434
1450.512
1430.076
1980.342
1630.170
1140.033
76
94-959.886
2036.448
2023.439
2050.641
1790.150
3920.446
2130.195
1310.088
206
95-9613.089
2697.901
2485.189
3100.983
2740.220
5780.725
3450.257
1730.128
299
96-9716.682
34310.297
3236.385
3811.425
3970.219
5751.027
4890.398
2670.152
354
97-9822.505
46314.905
4677.601
4541.692
4710.335
8771.266
6030.426
2860.181
421
98-9925.179
51717.646
5537.533
4502.120
5910.308
8071.662
7920.458
3080.150
349
99-200030.283
62222.815
7157.467
4462.472
6890.476
12471.865
8880.607
4070.255
594
2000-0139.883
82026.578
83313.305
7952.841
7920.411
10782.095
9980.746
5000.228
531
820833
795792
1078998
500531
2001-0253.826
110631.904
100021.922
13103.110
8660.803
21032.301
10960.809
5430.345
805
2002-0363.023
129537.723
118225.300
15124.471
12451.328
34793.403
16211.068
7170.539
1256
2003-0474.991
154145.828
143629.164
17424.359
12141.299
34032.991
14251.367
9170.594
1386
2004-0580.473
165451.019
159829.454
17604.264
11881.034
27082.641
12581.622
10890.582
1356
2005-06115.010
236466.457
208248.553
29015.464
15221.248
32683.336
15892.128
14280.764
1782
2006-07138.321
284378.914
247259.408
35497.087
19741.764
46204.698
22382.389
16030.974
2271
2007-08154.615
317887.456
274067.159
40139.215
25672.186
57266.283
29932.932
19681.234
2877
2008-09143.777
295580.658
252763.119
37719.332
26001.977
51796.249
29773.082
20681.189
2774
2009-10139.231
286278.722
246660.509
36157.923
22071.954
51194.899
23343.023
20291.254
2926
2010-11150.012
308383.556
261866.456
39718.068
22481.727
45254.759
22673.309
22211.476
3442
279262
303259
215207
409427
30282618
39712248
45252267
22213442
Source: 1) Financial Analysis of B
anks2) Perform
ance highlights of different banks
133
I.J.E.M.S., VOL.6 (3) 2015: 124 - 148 ISSN 2229-600X
Table
–3.8
Branch P
roductivity Foreign Sector G
roup (FB
)R
s. in Crore
Year
BP
BIN
DE
XD
PB
IND
EX
AP
BIN
DE
XIIP
BIN
DE
XN
IIPB
IND
EX
IEP
BIN
DE
XSP
BIN
DE
XP
PB
IND
EX
1991-92187.727
100121.568
10066.158
10019.863
1006.058
10012.906
1006.957
1004.309
100
92-93223.621
119149.100
12374.521
11325.914
1302.214
3717.971
1397.943
114-6.421
-149
93-94260.465
139179.840
14880.625
12223.201
1175.160
8513.465
1049.736
1403.493
81
94-95287.821
153185.848
153101.974
15423.417
1187.470
12314.166
1109.252
1333.742
87
95-96299.877
160168.760
139131.117
19828.082
1418.573
14219.339
1508.743
1264.433
103
96-97358.591
191206.540
170152.051
23035.170
1777.949
13122.193
17212.977
1873.778
88
97-98396.500
211235.566
194160.934
24337.269
18810.516
17423.198
18014.071
2023.456
80
98-99417.632
222255.418
210162.214
24543.187
21710.214
16928.571
22114.615
2102.912
68
99-2000469.287
250272.508
224196.779
29745.171
22711.890
19627.547
21317.624
2535.348
124
2000-01538.374
287311.789
256226.584
34249.847
25113.232
21830.363
23519.484
2804.974
115
287256
342251
218235
280115
2001-02583.211
311332.531
274250.680
37950.000
25216.804
27731.206
24218.794
2707.691
178
2002-03672.933
358383.944
316288.989
43749.589
25017.072
28228.006
21721.583
31010.122
235
2003-04640.382
341364.705
300275.677
41741.429
20918.535
30619.687
15321.742
31310.341
240
2004-05716.031
381382.765
315333.265
50440.575
20417.102
28217.881
13922.695
3268.770
204
2005-06855.490
456460.506
379394.984
59749.538
24921.049
34720.850
16228.688
4124.324
100
2006-071034.071
551562.660
463471.410
71367.235
33825.884
42728.414
22038.821
55817.112
397
2007-081280.438
682693.634
571586.804
88788.482
44538.464
63538.438
29850.043
71923.960
556
2008-091289.353
687733.137
603556.216
841103.842
52350.993
84243.894
34059.949
86225.716
597
2009-101275.352
679748.706
616526.645
79685.129
42932.100
53028.832
22356.297
80915.294
355
2010-111367.486
728754.511
621612.975
92789.411
45034.395
56833.298
25856.113
80724.197
562
234227
245179
205107
299315
728621
927450
568258
807562
Source: 1) Financial A
nalysis of Banks 2) P
erformance
highlights ofdifferent banks
134
Productivity and profitability analysis of banking sector in India
135
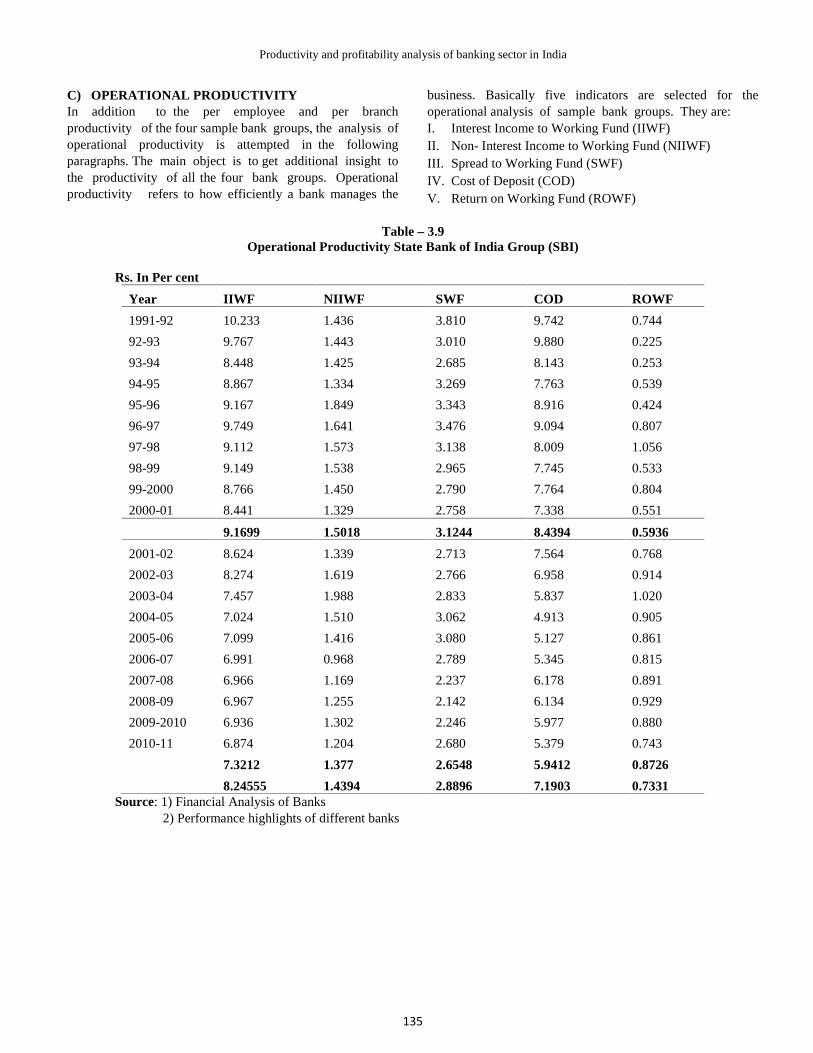
C) OPERATIONAL PRODUCTIVITYIn addition to the per employee and per branchproductivity of the four sample bank groups, the analysis ofoperational productivity is attempted in the followingparagraphs. The main object is to get additional insight tothe productivity of all the four bank groups. Operationalproductivity refers to how efficiently a bank manages the
business. Basically five indicators are selected for theoperational analysis of sample bank groups. They are:I. Interest Income to Working Fund (IIWF)II. Non- Interest Income to Working Fund (NIIWF)III. Spread to Working Fund (SWF)IV. Cost of Deposit (COD)V. Return on Working Fund (ROWF)
Table – 3.9Operational Productivity State Bank of India Group (SBI)
Rs. In Per cent
Year IIWF NIIWF SWF COD ROWF
1991-92 10.233 1.436 3.810 9.742 0.744
92-93 9.767 1.443 3.010 9.880 0.225
93-94 8.448 1.425 2.685 8.143 0.253
94-95 8.867 1.334 3.269 7.763 0.539
95-96 9.167 1.849 3.343 8.916 0.424
96-97 9.749 1.641 3.476 9.094 0.807
97-98 9.112 1.573 3.138 8.009 1.056
98-99 9.149 1.538 2.965 7.745 0.533
99-2000 8.766 1.450 2.790 7.764 0.804
2000-01 8.441 1.329 2.758 7.338 0.551
9.1699 1.5018 3.1244 8.4394 0.5936
2001-02 8.624 1.339 2.713 7.564 0.768
2002-03 8.274 1.619 2.766 6.958 0.914
2003-04 7.457 1.988 2.833 5.837 1.020
2004-05 7.024 1.510 3.062 4.913 0.905
2005-06 7.099 1.416 3.080 5.127 0.861
2006-07 6.991 0.968 2.789 5.345 0.815
2007-08 6.966 1.169 2.237 6.178 0.891
2008-09 6.967 1.255 2.142 6.134 0.929
2009-2010 6.936 1.302 2.246 5.977 0.880
2010-11 6.874 1.204 2.680 5.379 0.743
7.3212 1.377 2.6548 5.9412 0.8726
8.24555 1.4394 2.8896 7.1903 0.7331Source: 1) Financial Analysis of Banks
2) Performance highlights of different banks
I.J.E.M.S., VOL.6 (3) 2015: 124 - 148 ISSN 2229-600X
136
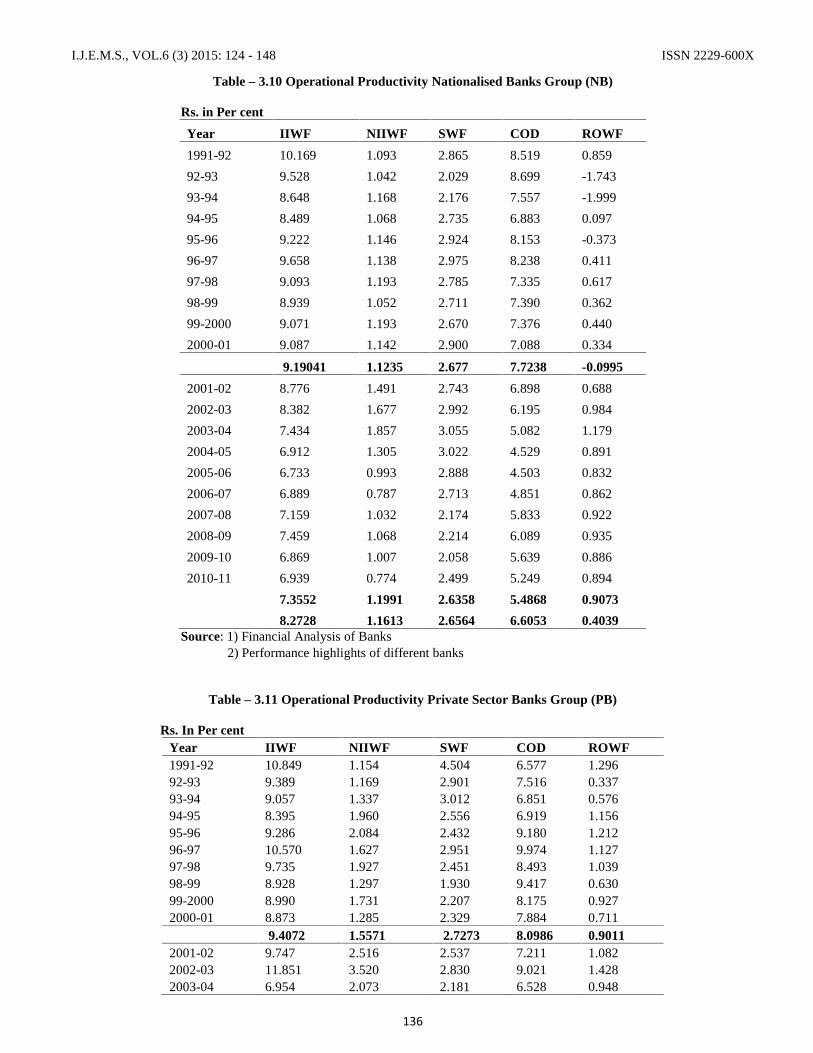
Table – 3.10 Operational Productivity Nationalised Banks Group (NB)
Rs. in Per cent
Year IIWF NIIWF SWF COD ROWF
1991-92 10.169 1.093 2.865 8.519 0.859
92-93 9.528 1.042 2.029 8.699 -1.743
93-94 8.648 1.168 2.176 7.557 -1.999
94-95 8.489 1.068 2.735 6.883 0.097
95-96 9.222 1.146 2.924 8.153 -0.373
96-97 9.658 1.138 2.975 8.238 0.411
97-98 9.093 1.193 2.785 7.335 0.617
98-99 8.939 1.052 2.711 7.390 0.362
99-2000 9.071 1.193 2.670 7.376 0.440
2000-01 9.087 1.142 2.900 7.088 0.334
9.19041 1.1235 2.677 7.7238 -0.0995
2001-02 8.776 1.491 2.743 6.898 0.688
2002-03 8.382 1.677 2.992 6.195 0.984
2003-04 7.434 1.857 3.055 5.082 1.179
2004-05 6.912 1.305 3.022 4.529 0.891
2005-06 6.733 0.993 2.888 4.503 0.832
2006-07 6.889 0.787 2.713 4.851 0.862
2007-08 7.159 1.032 2.174 5.833 0.922
2008-09 7.459 1.068 2.214 6.089 0.935
2009-10 6.869 1.007 2.058 5.639 0.886
2010-11 6.939 0.774 2.499 5.249 0.894
7.3552 1.1991 2.6358 5.4868 0.9073
8.2728 1.1613 2.6564 6.6053 0.4039Source: 1) Financial Analysis of Banks
2) Performance highlights of different banks
Table – 3.11 Operational Productivity Private Sector Banks Group (PB)
Rs. In Per centYear IIWF NIIWF SWF COD ROWF1991-92 10.849 1.154 4.504 6.577 1.29692-93 9.389 1.169 2.901 7.516 0.33793-94 9.057 1.337 3.012 6.851 0.57694-95 8.395 1.960 2.556 6.919 1.15695-96 9.286 2.084 2.432 9.180 1.21296-97 10.570 1.627 2.951 9.974 1.12797-98 9.735 1.927 2.451 8.493 1.03998-99 8.928 1.297 1.930 9.417 0.63099-2000 8.990 1.731 2.207 8.175 0.9272000-01 8.873 1.285 2.329 7.884 0.711
9.4072 1.5571 2.7273 8.0986 0.90112001-02 9.747 2.516 2.537 7.211 1.0822002-03 11.851 3.520 2.830 9.021 1.4282003-04 6.954 2.073 2.181 6.528 0.948
Productivity and profitability analysis of banking sector in India
137
2004-05 6.136 1.488 2.335 5.177 0.8372005-06 6.162 1.407 2.400 5.020 0.8622006-07 6.654 1.656 2.243 5.954 0.9142007-08 7.566 1.794 2.407 7.184 1.0132008-09 8.272 1.752 2.732 7.748 1.0542009-10 7.196 1.775 2.746 6.223 1.1392010-11 6.925 1.482 2.840 5.696 1.267
7.7463 1.9463 2.5251 6.5762 1.05448.57675 1.7517 2.6262 7.3374 0.97775
Source: 1) Financial Analysis of Banks2) Performance highlights of different banks
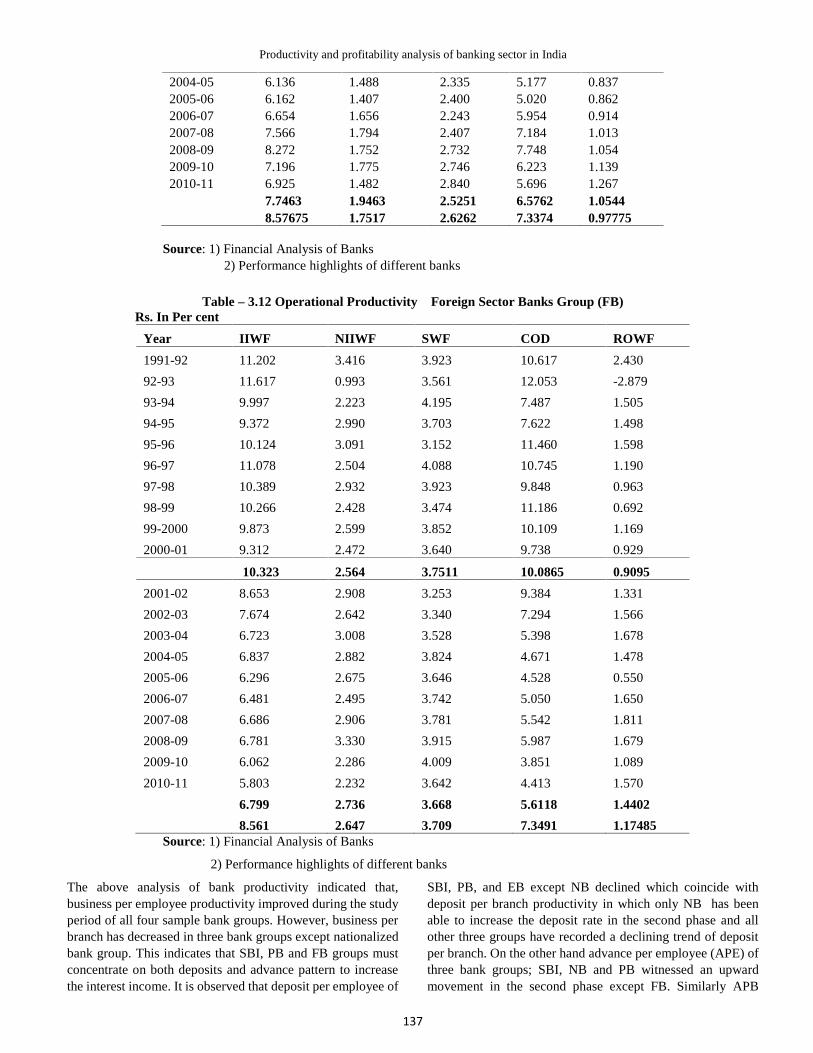
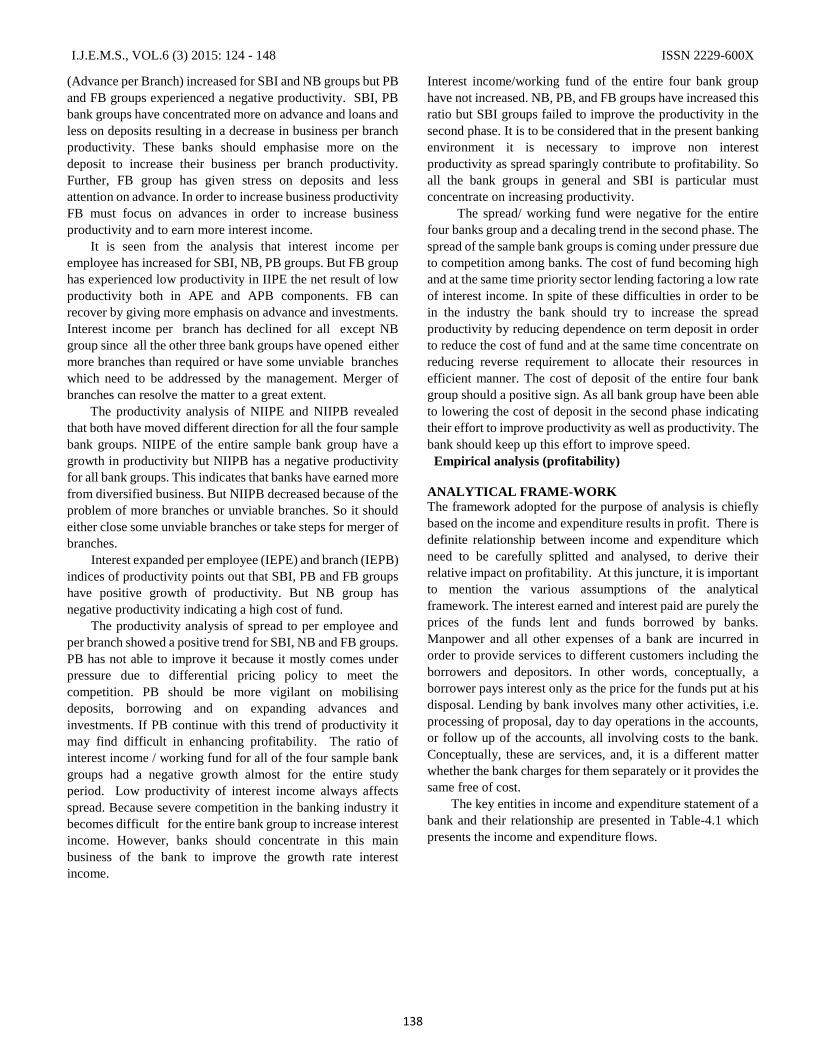
Table – 3.12 Operational Productivity Foreign Sector Banks Group (FB)Rs. In Per cent
Year IIWF NIIWF SWF COD ROWF
1991-92 11.202 3.416 3.923 10.617 2.430
92-93 11.617 0.993 3.561 12.053 -2.879
93-94 9.997 2.223 4.195 7.487 1.505
94-95 9.372 2.990 3.703 7.622 1.498
95-96 10.124 3.091 3.152 11.460 1.598
96-97 11.078 2.504 4.088 10.745 1.190
97-98 10.389 2.932 3.923 9.848 0.963
98-99 10.266 2.428 3.474 11.186 0.692
99-2000 9.873 2.599 3.852 10.109 1.169
2000-01 9.312 2.472 3.640 9.738 0.929
10.323 2.564 3.7511 10.0865 0.9095
2001-02 8.653 2.908 3.253 9.384 1.331
2002-03 7.674 2.642 3.340 7.294 1.566
2003-04 6.723 3.008 3.528 5.398 1.678
2004-05 6.837 2.882 3.824 4.671 1.478
2005-06 6.296 2.675 3.646 4.528 0.550
2006-07 6.481 2.495 3.742 5.050 1.650
2007-08 6.686 2.906 3.781 5.542 1.811
2008-09 6.781 3.330 3.915 5.987 1.679
2009-10 6.062 2.286 4.009 3.851 1.089
2010-11 5.803 2.232 3.642 4.413 1.570
6.799 2.736 3.668 5.6118 1.4402
8.561 2.647 3.709 7.3491 1.17485Source: 1) Financial Analysis of Banks
2) Performance highlights of different banks
The above analysis of bank productivity indicated that,business per employee productivity improved during the studyperiod of all four sample bank groups. However, business perbranch has decreased in three bank groups except nationalizedbank group. This indicates that SBI, PB and FB groups mustconcentrate on both deposits and advance pattern to increasethe interest income. It is observed that deposit per employee of
SBI, PB, and EB except NB declined which coincide withdeposit per branch productivity in which only NB has beenable to increase the deposit rate in the second phase and allother three groups have recorded a declining trend of depositper branch. On the other hand advance per employee (APE) ofthree bank groups; SBI, NB and PB witnessed an upwardmovement in the second phase except FB. Similarly APB
I.J.E.M.S., VOL.6 (3) 2015: 124 - 148 ISSN 2229-600X
138
(Advance per Branch) increased for SBI and NB groups but PBand FB groups experienced a negative productivity. SBI, PBbank groups have concentrated more on advance and loans andless on deposits resulting in a decrease in business per branchproductivity. These banks should emphasise more on thedeposit to increase their business per branch productivity.Further, FB group has given stress on deposits and lessattention on advance. In order to increase business productivityFB must focus on advances in order to increase businessproductivity and to earn more interest income.
It is seen from the analysis that interest income peremployee has increased for SBI, NB, PB groups. But FB grouphas experienced low productivity in IIPE the net result of lowproductivity both in APE and APB components. FB canrecover by giving more emphasis on advance and investments.Interest income per branch has declined for all except NBgroup since all the other three bank groups have opened eithermore branches than required or have some unviable brancheswhich need to be addressed by the management. Merger ofbranches can resolve the matter to a great extent.
The productivity analysis of NIIPE and NIIPB revealedthat both have moved different direction for all the four samplebank groups. NIIPE of the entire sample bank group have agrowth in productivity but NIIPB has a negative productivityfor all bank groups. This indicates that banks have earned morefrom diversified business. But NIIPB decreased because of theproblem of more branches or unviable branches. So it shouldeither close some unviable branches or take steps for merger ofbranches.
Interest expanded per employee (IEPE) and branch (IEPB)indices of productivity points out that SBI, PB and FB groupshave positive growth of productivity. But NB group hasnegative productivity indicating a high cost of fund.
The productivity analysis of spread to per employee andper branch showed a positive trend for SBI, NB and FB groups.PB has not able to improve it because it mostly comes underpressure due to differential pricing policy to meet thecompetition. PB should be more vigilant on mobilisingdeposits, borrowing and on expanding advances andinvestments. If PB continue with this trend of productivity itmay find difficult in enhancing profitability. The ratio ofinterest income / working fund for all of the four sample bankgroups had a negative growth almost for the entire studyperiod. Low productivity of interest income always affectsspread. Because severe competition in the banking industry itbecomes difficult for the entire bank group to increase interestincome. However, banks should concentrate in this mainbusiness of the bank to improve the growth rate interestincome.
Interest income/working fund of the entire four bank grouphave not increased. NB, PB, and FB groups have increased thisratio but SBI groups failed to improve the productivity in thesecond phase. It is to be considered that in the present bankingenvironment it is necessary to improve non interestproductivity as spread sparingly contribute to profitability. Soall the bank groups in general and SBI is particular mustconcentrate on increasing productivity.
The spread/ working fund were negative for the entirefour banks group and a decaling trend in the second phase. Thespread of the sample bank groups is coming under pressure dueto competition among banks. The cost of fund becoming highand at the same time priority sector lending factoring a low rateof interest income. In spite of these difficulties in order to bein the industry the bank should try to increase the spreadproductivity by reducing dependence on term deposit in orderto reduce the cost of fund and at the same time concentrate onreducing reverse requirement to allocate their resources inefficient manner. The cost of deposit of the entire four bankgroup should a positive sign. As all bank group have been ableto lowering the cost of deposit in the second phase indicatingtheir effort to improve productivity as well as productivity. Thebank should keep up this effort to improve speed.
Empirical analysis (profitability)
ANALYTICAL FRAME-WORKThe framework adopted for the purpose of analysis is chieflybased on the income and expenditure results in profit. There isdefinite relationship between income and expenditure whichneed to be carefully splitted and analysed, to derive theirrelative impact on profitability. At this juncture, it is importantto mention the various assumptions of the analyticalframework. The interest earned and interest paid are purely theprices of the funds lent and funds borrowed by banks.Manpower and all other expenses of a bank are incurred inorder to provide services to different customers including theborrowers and depositors. In other words, conceptually, aborrower pays interest only as the price for the funds put at hisdisposal. Lending by bank involves many other activities, i.e.processing of proposal, day to day operations in the accounts,or follow up of the accounts, all involving costs to the bank.Conceptually, these are services, and, it is a different matterwhether the bank charges for them separately or it provides thesame free of cost.
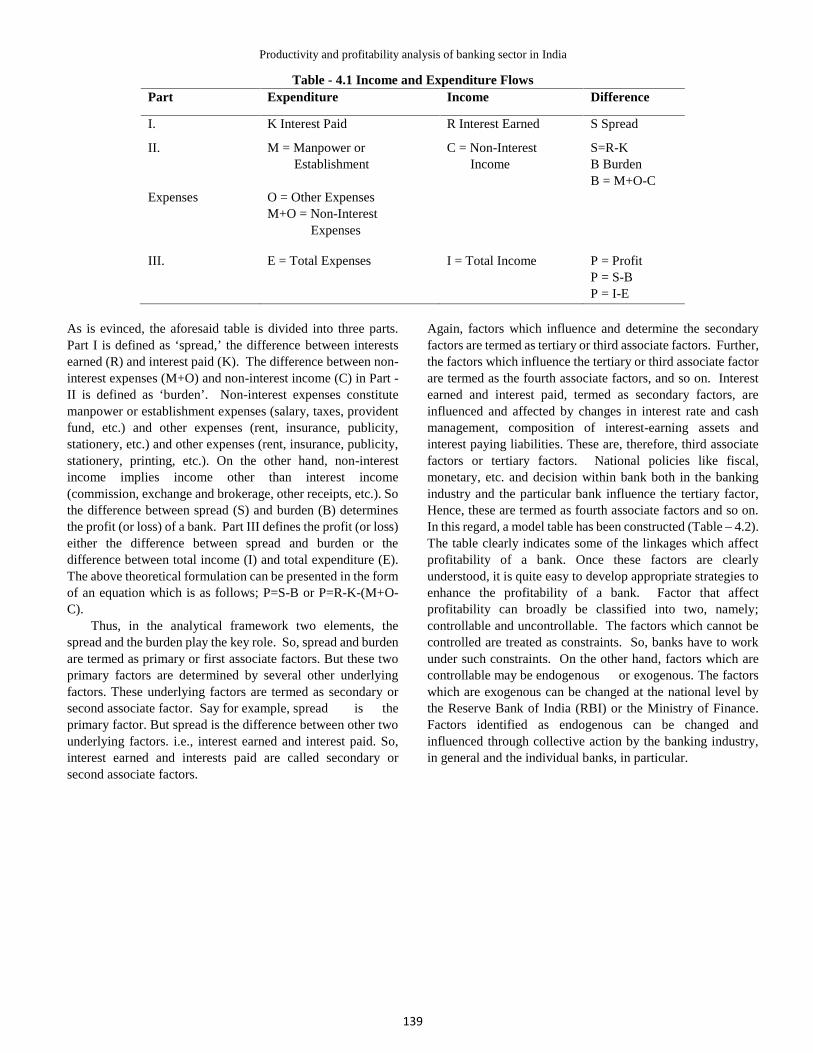
The key entities in income and expenditure statement of abank and their relationship are presented in Table-4.1 whichpresents the income and expenditure flows.
Productivity and profitability analysis of banking sector in India
139
Table - 4.1 Income and Expenditure FlowsPart Expenditure Income Difference
I. K Interest Paid R Interest Earned S Spread
II. M = Manpower orEstablishment
C = Non-InterestIncome
S=R-KB BurdenB = M+O-C
Expenses O = Other ExpensesM+O = Non-Interest
Expenses
III. E = Total Expenses I = Total Income P = ProfitP = S-BP = I-E
As is evinced, the aforesaid table is divided into three parts.Part I is defined as ‘spread,’ the difference between interestsearned (R) and interest paid (K). The difference between non-interest expenses (M+O) and non-interest income (C) in Part -II is defined as ‘burden’. Non-interest expenses constitutemanpower or establishment expenses (salary, taxes, providentfund, etc.) and other expenses (rent, insurance, publicity,stationery, etc.) and other expenses (rent, insurance, publicity,stationery, printing, etc.). On the other hand, non-interestincome implies income other than interest income(commission, exchange and brokerage, other receipts, etc.). Sothe difference between spread (S) and burden (B) determinesthe profit (or loss) of a bank. Part III defines the profit (or loss)either the difference between spread and burden or thedifference between total income (I) and total expenditure (E).The above theoretical formulation can be presented in the formof an equation which is as follows; P=S-B or P=R-K-(M+O-C).
Thus, in the analytical framework two elements, thespread and the burden play the key role. So, spread and burdenare termed as primary or first associate factors. But these twoprimary factors are determined by several other underlyingfactors. These underlying factors are termed as secondary orsecond associate factor. Say for example, spread is theprimary factor. But spread is the difference between other twounderlying factors. i.e., interest earned and interest paid. So,interest earned and interests paid are called secondary orsecond associate factors.
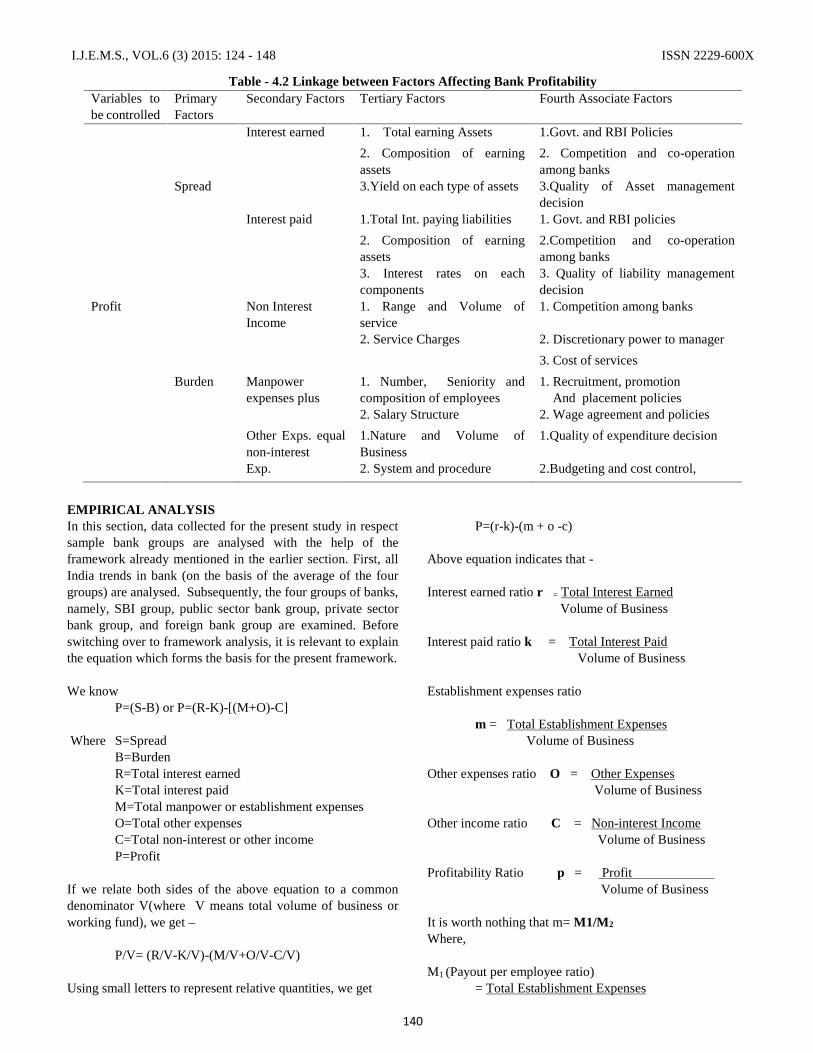
Again, factors which influence and determine the secondaryfactors are termed as tertiary or third associate factors. Further,the factors which influence the tertiary or third associate factorare termed as the fourth associate factors, and so on. Interestearned and interest paid, termed as secondary factors, areinfluenced and affected by changes in interest rate and cashmanagement, composition of interest-earning assets andinterest paying liabilities. These are, therefore, third associatefactors or tertiary factors. National policies like fiscal,monetary, etc. and decision within bank both in the bankingindustry and the particular bank influence the tertiary factor,Hence, these are termed as fourth associate factors and so on.In this regard, a model table has been constructed (Table – 4.2).The table clearly indicates some of the linkages which affectprofitability of a bank. Once these factors are clearlyunderstood, it is quite easy to develop appropriate strategies toenhance the profitability of a bank. Factor that affectprofitability can broadly be classified into two, namely;controllable and uncontrollable. The factors which cannot becontrolled are treated as constraints. So, banks have to workunder such constraints. On the other hand, factors which arecontrollable may be endogenous or exogenous. The factorswhich are exogenous can be changed at the national level bythe Reserve Bank of India (RBI) or the Ministry of Finance.Factors identified as endogenous can be changed andinfluenced through collective action by the banking industry,in general and the individual banks, in particular.
I.J.E.M.S., VOL.6 (3) 2015: 124 - 148 ISSN 2229-600X
140
Table - 4.2 Linkage between Factors Affecting Bank ProfitabilityVariables tobe controlled
PrimaryFactors
Secondary Factors Tertiary Factors Fourth Associate Factors
Interest earned 1. Total earning Assets 1.Govt. and RBI Policies
2. Composition of earningassets
2. Competition and co-operationamong banks
Spread 3.Yield on each type of assets 3.Quality of Asset managementdecision
Interest paid 1.Total Int. paying liabilities 1. Govt. and RBI policies
2. Composition of earningassets
2.Competition and co-operationamong banks
3. Interest rates on eachcomponents
3. Quality of liability managementdecision
Profit Non InterestIncome
1. Range and Volume ofservice
1. Competition among banks
2. Service Charges 2. Discretionary power to manager
3. Cost of services
Burden Manpowerexpenses plus
1. Number, Seniority andcomposition of employees
1. Recruitment, promotionAnd placement policies
2. Salary Structure 2. Wage agreement and policies
Other Exps. equalnon-interest
1.Nature and Volume ofBusiness
1.Quality of expenditure decision
Exp. 2. System and procedure 2.Budgeting and cost control,
EMPIRICAL ANALYSISIn this section, data collected for the present study in respectsample bank groups are analysed with the help of theframework already mentioned in the earlier section. First, allIndia trends in bank (on the basis of the average of the fourgroups) are analysed. Subsequently, the four groups of banks,namely, SBI group, public sector bank group, private sectorbank group, and foreign bank group are examined. Beforeswitching over to framework analysis, it is relevant to explainthe equation which forms the basis for the present framework.
We knowP=(S-B) or P=(R-K)-[(M+O)-C]
Where S=SpreadB=BurdenR=Total interest earnedK=Total interest paidM=Total manpower or establishment expensesO=Total other expensesC=Total non-interest or other incomeP=Profit
If we relate both sides of the above equation to a commondenominator V(where V means total volume of business orworking fund), we get –
P/V= (R/V-K/V)-(M/V+O/V-C/V)
Using small letters to represent relative quantities, we get
P=(r-k)-(m + o -c)
Above equation indicates that -
Interest earned ratio r = Total Interest EarnedVolume of Business
Interest paid ratio k = Total Interest PaidVolume of Business
Establishment expenses ratio
m = Total Establishment ExpensesVolume of Business
Other expenses ratio O = Other ExpensesVolume of Business
Other income ratio C = Non-interest IncomeVolume of Business
Profitability Ratio p = ProfitVolume of Business
It is worth nothing that m= M1/M2
Where,
M1 (Payout per employee ratio)= Total Establishment Expenses
Productivity and profitability analysis of banking sector in India
141
Total Number of EmployeesM2 (Volume of business per employee ratio)
= Volume of BusinessTotal Number of Employees
Thus, the profit equation can be rewritten as follows;
P=(r-k)-(M1/M2+o-c)
It is apparent from the aforesaid equation that for increasingprofitability, a bank has to aim at widening the gap betweeninterest earned ratio and interest paid ratio so as to increasespread ratio and lowering the burden ratio. Increasing themagnitude of spread ratio can be achieved by increasing theinterest earned ratio (r) higher than the interest paid ratio (k).Lowering the burden ratio can be achieved by reducingmanpower or establishment expenses (m), other expenses (o),and increasing other income ratio (c). Again, lowering (m)ratio can be possible by increasing volume of business peremployee ratio (M2) faster than payout per employee ratio(M1). So, with the help of these indicators, analysis ofprofitability have been done for the all the sample bank groupsin the following sections.
EMPIRICAL ANALYSIS RESULT –TOTAL SAMPLE
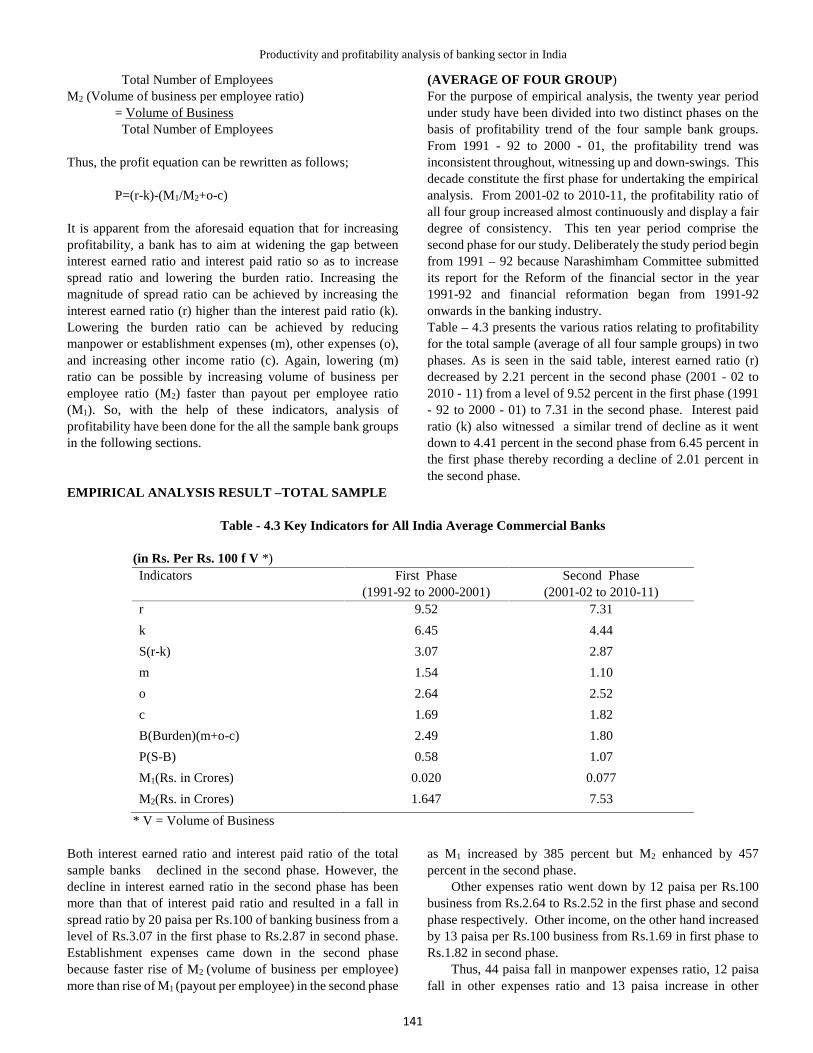
(AVERAGE OF FOUR GROUP)For the purpose of empirical analysis, the twenty year periodunder study have been divided into two distinct phases on thebasis of profitability trend of the four sample bank groups.From 1991 - 92 to 2000 - 01, the profitability trend wasinconsistent throughout, witnessing up and down-swings. Thisdecade constitute the first phase for undertaking the empiricalanalysis. From 2001-02 to 2010-11, the profitability ratio ofall four group increased almost continuously and display a fairdegree of consistency. This ten year period comprise thesecond phase for our study. Deliberately the study period beginfrom 1991 – 92 because Narashimham Committee submittedits report for the Reform of the financial sector in the year1991-92 and financial reformation began from 1991-92onwards in the banking industry.Table – 4.3 presents the various ratios relating to profitabilityfor the total sample (average of all four sample groups) in twophases. As is seen in the said table, interest earned ratio (r)decreased by 2.21 percent in the second phase (2001 - 02 to2010 - 11) from a level of 9.52 percent in the first phase (1991- 92 to 2000 - 01) to 7.31 in the second phase. Interest paidratio (k) also witnessed a similar trend of decline as it wentdown to 4.41 percent in the second phase from 6.45 percent inthe first phase thereby recording a decline of 2.01 percent inthe second phase.
Table - 4.3 Key Indicators for All India Average Commercial Banks
(in Rs. Per Rs. 100 f V *)Indicators First Phase
(1991-92 to 2000-2001)Second Phase
(2001-02 to 2010-11)r 9.52 7.31
k 6.45 4.44
S(r-k) 3.07 2.87
m 1.54 1.10
o 2.64 2.52
c 1.69 1.82
B(Burden)(m+o-c) 2.49 1.80
P(S-B) 0.58 1.07
M1(Rs. in Crores) 0.020 0.077
M2(Rs. in Crores) 1.647 7.53
* V = Volume of Business
Both interest earned ratio and interest paid ratio of the totalsample banks declined in the second phase. However, thedecline in interest earned ratio in the second phase has beenmore than that of interest paid ratio and resulted in a fall inspread ratio by 20 paisa per Rs.100 of banking business from alevel of Rs.3.07 in the first phase to Rs.2.87 in second phase.Establishment expenses came down in the second phasebecause faster rise of M2 (volume of business per employee)more than rise of M1 (payout per employee) in the second phase
as M1 increased by 385 percent but M2 enhanced by 457percent in the second phase.
Other expenses ratio went down by 12 paisa per Rs.100business from Rs.2.64 to Rs.2.52 in the first phase and secondphase respectively. Other income, on the other hand increasedby 13 paisa per Rs.100 business from Rs.1.69 in first phase toRs.1.82 in second phase.
Thus, 44 paisa fall in manpower expenses ratio, 12 paisafall in other expenses ratio and 13 paisa increase in other
I.J.E.M.S., VOL.6 (3) 2015: 124 - 148 ISSN 2229-600X
142
income ratio in the second phase of the study contributed anaggregate fall of 69 paisa (44+12+13) per Rs.100 of businessin burden ratio. Profitability ratio increased by 49 paisa perRs.100 business in the second phase from (58 paisa in the firstphase to Rs. 1.07 in the second phase). The growth of profit iscalculated as 84.48 percent in the second phase for theaggregate sample banks over the first phase of the study period.
It is inferred from Table- 4.3 that rise in the profitabilityratio of the sample banks in the second phase was only due tofall in burden ratio i.e. fall in both establishment ratio and otherexpenses ratio and rise in other income ratio. It is observed thatspread ratio which is regarded as the main contributor to theprofitability ratio, made a negative impact on profitability ratiodue to fall of 20 paisa per Rs.100 business. Despite thenegative contribution by sprea, sample commercial bankscould earn more profit due to good management of burdenwhich was responsible for rise in profit. The burden ratio(m+o-c) made positive impact on profit because decline inestablishment ratio which became possible due to faster rise involume of business (M2) than payment per employee (M1)ratio. Other expenses ratio, another constituent of burden ratioalso could make a positive impact on profitability ofcommercial banks because of fall of other expenses ratio.
Other income ratio of all the commercial banks alsoincreased in the second phase and made favorable impact onprofit. The other income based on non-fund based business
like commission based business such as guarantees, foreignexchange business, remittance of fund and other servicerendered to the customer have positive impact on profitabilityratio. So combine establishment ratio, other expenses ratio andother fee-based business otherwise known as other incomeratio can play a key role in improving the profitability ratioeven if there is a decline in spreads, as witnessed from theabove table. Hence we can conclude that increase in volumeof business, increase in non-fund business and control overnon-interest expenses (combine regarded as good managementof burden) can have positive impact on profitability ofcommercial banks. This can even negate the negative impactby spread.
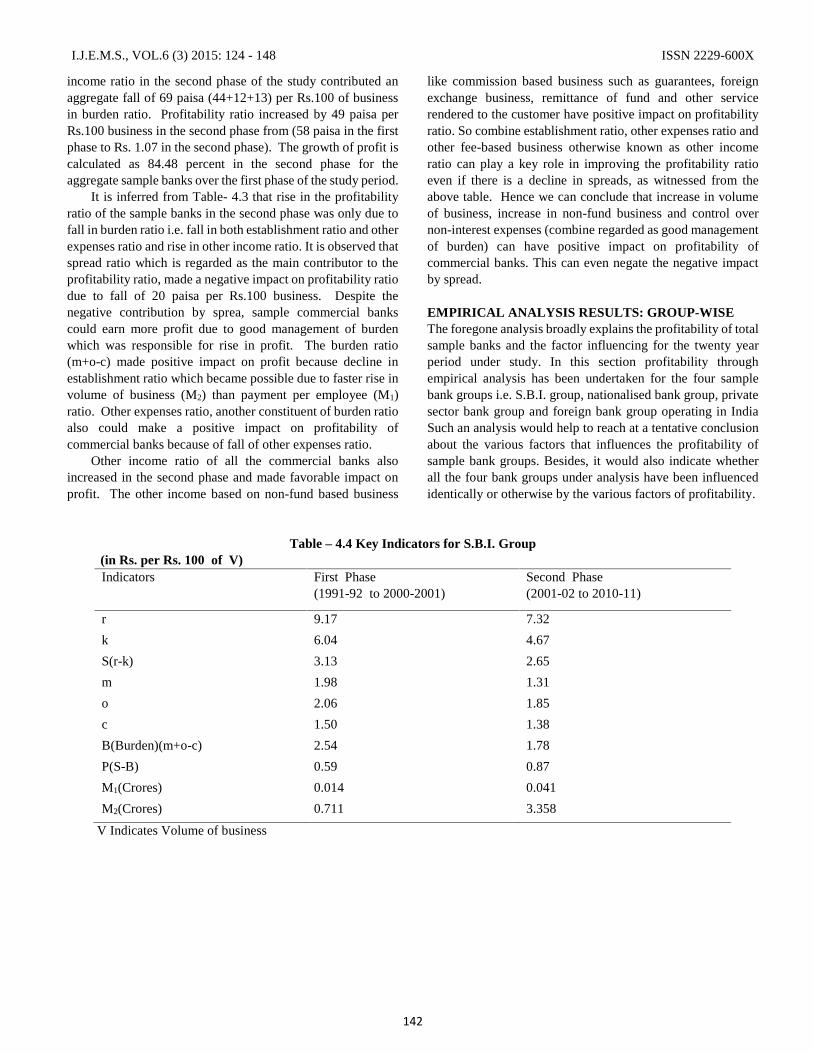
EMPIRICAL ANALYSIS RESULTS: GROUP-WISEThe foregone analysis broadly explains the profitability of totalsample banks and the factor influencing for the twenty yearperiod under study. In this section profitability throughempirical analysis has been undertaken for the four samplebank groups i.e. S.B.I. group, nationalised bank group, privatesector bank group and foreign bank group operating in IndiaSuch an analysis would help to reach at a tentative conclusionabout the various factors that influences the profitability ofsample bank groups. Besides, it would also indicate whetherall the four bank groups under analysis have been influencedidentically or otherwise by the various factors of profitability.
Table – 4.4 Key Indicators for S.B.I. Group(in Rs. per Rs. 100 of V)Indicators First Phase
(1991-92 to 2000-2001)Second Phase(2001-02 to 2010-11)
r 9.17 7.32
k 6.04 4.67
S(r-k) 3.13 2.65
m 1.98 1.31
o 2.06 1.85
c 1.50 1.38
B(Burden)(m+o-c) 2.54 1.78
P(S-B) 0.59 0.87
M1(Crores) 0.014 0.041
M2(Crores) 0.711 3.358
V Indicates Volume of business
Productivity and profitability analysis of banking sector in India
143
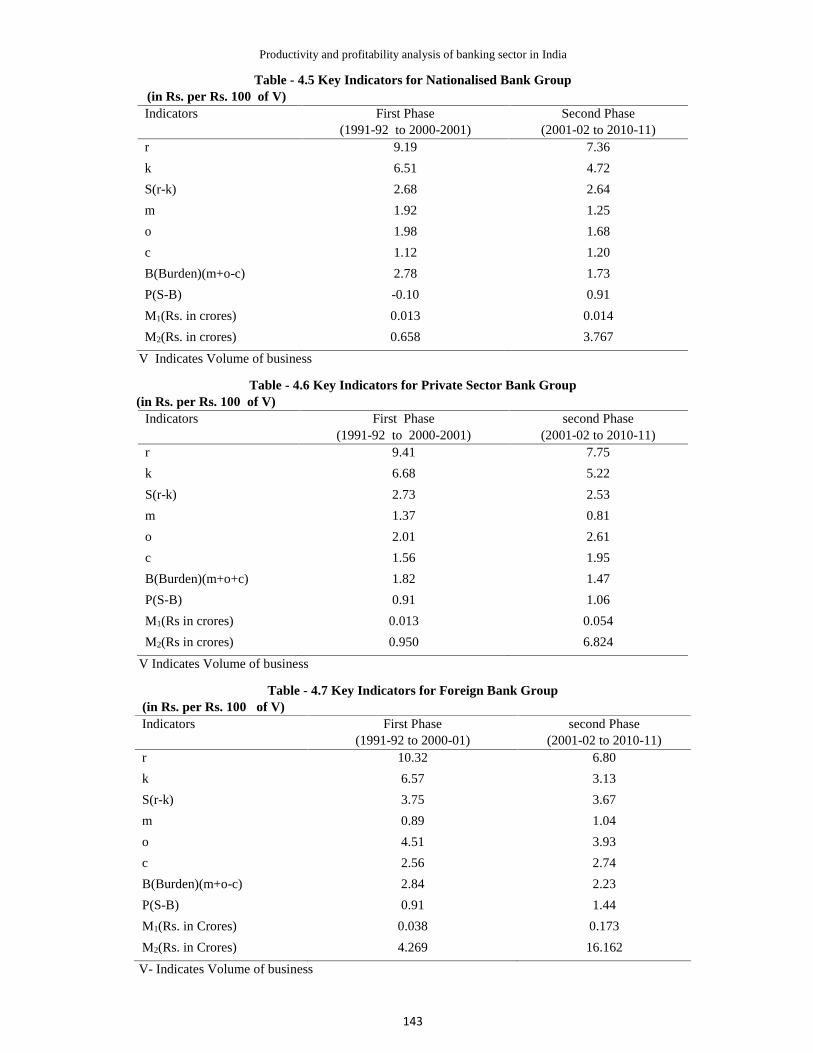
Table - 4.5 Key Indicators for Nationalised Bank Group(in Rs. per Rs. 100 of V)Indicators First Phase
(1991-92 to 2000-2001)Second Phase
(2001-02 to 2010-11)r 9.19 7.36
k 6.51 4.72
S(r-k) 2.68 2.64
m 1.92 1.25
o 1.98 1.68
c 1.12 1.20
B(Burden)(m+o-c) 2.78 1.73
P(S-B) -0.10 0.91
M1(Rs. in crores) 0.013 0.014
M2(Rs. in crores) 0.658 3.767
V Indicates Volume of business
Table - 4.6 Key Indicators for Private Sector Bank Group(in Rs. per Rs. 100 of V)
Indicators First Phase(1991-92 to 2000-2001)
second Phase(2001-02 to 2010-11)
r 9.41 7.75
k 6.68 5.22
S(r-k) 2.73 2.53
m 1.37 0.81
o 2.01 2.61
c 1.56 1.95
B(Burden)(m+o+c) 1.82 1.47
P(S-B) 0.91 1.06
M1(Rs in crores) 0.013 0.054
M2(Rs in crores) 0.950 6.824
V Indicates Volume of business
Table - 4.7 Key Indicators for Foreign Bank Group(in Rs. per Rs. 100 of V)Indicators First Phase
(1991-92 to 2000-01)second Phase
(2001-02 to 2010-11)r 10.32 6.80
k 6.57 3.13
S(r-k) 3.75 3.67
m 0.89 1.04
o 4.51 3.93
c 2.56 2.74
B(Burden)(m+o-c) 2.84 2.23
P(S-B) 0.91 1.44
M1(Rs. in Crores) 0.038 0.173
M2(Rs. in Crores) 4.269 16.162
V- Indicates Volume of business
I.J.E.M.S., VOL.6 (3) 2015: 124 - 148 ISSN 2229-600X
144
The above tables profitability analysis of the four sample bankgroups have been undertaken by dividing the twenty yearperiod under study into two distinct phases; the first phasecovering ten years and second phase comprising the latter tenyears. The analysis has been done through an analyticalframework so as to find out the factors affecting profitability.This framework splits the income and expenditure statement tofind out the relation between different components of incomeand expenditure and its impact on profitability. Basically,spread, difference between interests earned and interest paidand burden play major role in determining the profitability ofa commercial bank. Both spread and burden are treated asprimary on first associate factor. Factors which determine thisprimary factor are treated as secondary factor. Factors whichdetermine their secondary factors are known as tertiary factor.The factors which influence this tertiary factor are termed asfourth associate factors. The framework adopted for thepurpose of analysis have spread, burden and its components areto be related to a common denominator, volume of business(V) and to convert these into ratio. Establishment ratio isderived by dividing payout per employee (M1) by volume ofbusiness per employee (M2).
Analysis of total sample (average of all four samplegroups) during second phase reveals that fall in establishmentexpenses, fall in other expenses and rise in other income ratioare the major determinant and main contributors toprofitability. However, fall in spread ratio had a negativeimpact on profitability. So, increase in volume of business,control over other expenses and increase in fee-based businessof banking sector have a positive impact on the profitability ofthe banking sector during the post reform era.
Sample group wise, S.B.I. bank group has improvedprofitability ratio due to fall in establishment ratio, fall in otherexpenses ratio. In this case, spread and other income havemade negative contribution to the profitability ratio. Here thekey to profitability is volume of business, check on otherexpenses and increase in commission based income.
Analysis of nationalized bank group indicates that bothestablishment ratio and other expenses ratio declined in thesecond phase. Over the same period other income ratio alsoincreased. Contrary to expectations, spread influencednegatively to the profitability ratio. Profitability ofnationalized bank group improved in the second phase onlydue to positive contribution by burden ratio. So, increasedvolume of business, check on other expenses and increase non-
fund based business are the main contributors to theprofitability ratio of nationalized bank group.
Analysis undertaken for sample private sector bank groupdepicts that decrease in establishment ratio and increase inother income ratio made it possible to improve profitability forthis group in the second phase despite negative support byspread and other expenses ratio. So, volume of business andfee-based income are main determinants of profitability in caseof sample private sector banks.
Perusal of framework for analysis of foreign bank groupindicates that spread and establishment expenses contributednegatively to the profitability in the second phase. Butdecrease in other expenses and increase in other income ratioare the main factors which improved profitability ratio offoreign bank group in the second phase of our study. Despitenegative contribution by establishment expenses ratio, burdenratio decreased in the second phase due to support of otherexpenses and income ratio and profitability improved in asituation where spread, the interest income, went down tocreate negative contribution on profitability. So, key toprofitability in case of foreign bank group is proper handlingof burden ratio.
Comparative study of all four groups reveals that in- spiteof fall in spread ratio in the entire sample four bank groups inthe second decade of the study period, profitability hadimproved in the second phase. None of the four sample bankgroups deepened on spread ratio which is widely considered asthe main determinant of profitability ratio of a bank. All thesample bank groups, alternatively stressed on the propermanagement of burden to increase profitability. Thus it isrevealed that when compulsive reasons does not allowenhancement of the spread volume by the banks, profitabilitycan be improved with proper handling and managing ofburden. So under Indian financial environment burdenmanagement seems to be an important strategy for enhancingprofitability along with successful discharge of socialresponsibility.
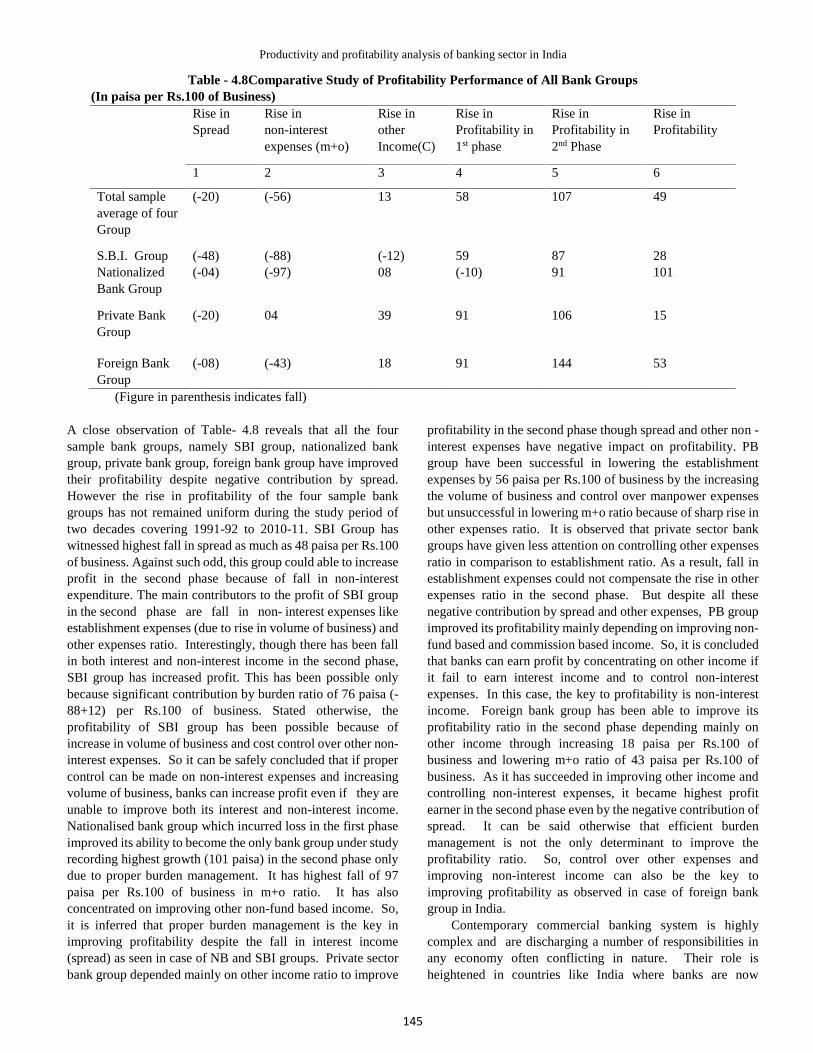
COMPARATIVE ANALYSIS OF THE FOUR SAMPLEBANK GROUPSTable - 4.8 summaries study of the four sample bank groups aswell as of the total sample (average of four groups) with themagnitude of rise in spread ratio rise non-interest expenses(establishment plus other expenses) and rise in other incomeratio.
Productivity and profitability analysis of banking sector in India
145
Table - 4.8Comparative Study of Profitability Performance of All Bank Groups(In paisa per Rs.100 of Business)
Rise inSpread
Rise innon-interestexpenses (m+o)
Rise inotherIncome(C)
Rise inProfitability in1st phase
Rise inProfitability in2nd Phase
Rise inProfitability
1 2 3 4 5 6
Total sampleaverage of fourGroup
(-20) (-56) 13 58 107 49
S.B.I. Group (-48) (-88) (-12) 59 87 28NationalizedBank Group
(-04) (-97) 08 (-10) 91 101
Private BankGroup
(-20) 04 39 91 106 15
Foreign BankGroup
(-08) (-43) 18 91 144 53
(Figure in parenthesis indicates fall)
A close observation of Table- 4.8 reveals that all the foursample bank groups, namely SBI group, nationalized bankgroup, private bank group, foreign bank group have improvedtheir profitability despite negative contribution by spread.However the rise in profitability of the four sample bankgroups has not remained uniform during the study period oftwo decades covering 1991-92 to 2010-11. SBI Group haswitnessed highest fall in spread as much as 48 paisa per Rs.100of business. Against such odd, this group could able to increaseprofit in the second phase because of fall in non-interestexpenditure. The main contributors to the profit of SBI groupin the second phase are fall in non- interest expenses likeestablishment expenses (due to rise in volume of business) andother expenses ratio. Interestingly, though there has been fallin both interest and non-interest income in the second phase,SBI group has increased profit. This has been possible onlybecause significant contribution by burden ratio of 76 paisa (-88+12) per Rs.100 of business. Stated otherwise, theprofitability of SBI group has been possible because ofincrease in volume of business and cost control over other non-interest expenses. So it can be safely concluded that if propercontrol can be made on non-interest expenses and increasingvolume of business, banks can increase profit even if they areunable to improve both its interest and non-interest income.Nationalised bank group which incurred loss in the first phaseimproved its ability to become the only bank group under studyrecording highest growth (101 paisa) in the second phase onlydue to proper burden management. It has highest fall of 97paisa per Rs.100 of business in m+o ratio. It has alsoconcentrated on improving other non-fund based income. So,it is inferred that proper burden management is the key inimproving profitability despite the fall in interest income(spread) as seen in case of NB and SBI groups. Private sectorbank group depended mainly on other income ratio to improve
profitability in the second phase though spread and other non -interest expenses have negative impact on profitability. PBgroup have been successful in lowering the establishmentexpenses by 56 paisa per Rs.100 of business by the increasingthe volume of business and control over manpower expensesbut unsuccessful in lowering m+o ratio because of sharp rise inother expenses ratio. It is observed that private sector bankgroups have given less attention on controlling other expensesratio in comparison to establishment ratio. As a result, fall inestablishment expenses could not compensate the rise in otherexpenses ratio in the second phase. But despite all thesenegative contribution by spread and other expenses, PB groupimproved its profitability mainly depending on improving non-fund based and commission based income. So, it is concludedthat banks can earn profit by concentrating on other income ifit fail to earn interest income and to control non-interestexpenses. In this case, the key to profitability is non-interestincome. Foreign bank group has been able to improve itsprofitability ratio in the second phase depending mainly onother income through increasing 18 paisa per Rs.100 ofbusiness and lowering m+o ratio of 43 paisa per Rs.100 ofbusiness. As it has succeeded in improving other income andcontrolling non-interest expenses, it became highest profitearner in the second phase even by the negative contribution ofspread. It can be said otherwise that efficient burdenmanagement is not the only determinant to improve theprofitability ratio. So, control over other expenses andimproving non-interest income can also be the key toimproving profitability as observed in case of foreign bankgroup in India.
Contemporary commercial banking system is highlycomplex and are discharging a number of responsibilities inany economy often conflicting in nature. Their role isheightened in countries like India where banks are now
I.J.E.M.S., VOL.6 (3) 2015: 124 - 148 ISSN 2229-600X
146
considered as catalyst for social change. Priority sectorlending, financing agriculture and small business in the ruralareas, rise in NPA are some of the problem areas which affectthe interest earning of commercial banks adversely. Obligationlike SLR, CRR requirements, etc. have continuously hinderedthe earning of banks. No doubt, in the post financial reformperiod the banking sector are given operational flexibility andfinancial autonomy to some extend regarding fixing rate ofinterest. However, at the same free time entry of banks, bothIndian and foreign, into the banking industry are inviting widecompetition among banks. As a result, banks have practicallylittle freedom to change the rate of interest in the fear of loss ofexisting customers to competitors.
Under such a highly competitive financial environment,banks enjoy little freedom to increase gap between interestearned and interest paid so as to increase the spread volume.Consequently, the only option left for the banking industrywhere spread is unlikely to be extended, is the propermanagement of burden. Introduction of labor saving devices,increasing volume of business, adoption of modern technologyare significant steps to control establishment expenses.Likewise, other expenses can be controlled through propertraining of the staff about the various cost element and costcentre and improving their skill to keep controllable cost at theminimum. Further, other income can be improved throughimproving fee-based and commission based business. In short,proper management of burden can independently play positiverole in improving profitability of commercial banks in theIndian financial environment. This has been proved throughthe analysis undertaken in the earlier part of this chapter. Thus,the widely accepted myth that social responsibility and profitcannot go hand in hand is exploded through the foregoneanalysis undertaken. Banks can earn handsome profit evenafter meeting the various social obligatory responsibilities.Therefore the key to profit and profitability of commercialbanks in the Indian financial environment are - high volume ofbusiness (in total as well as per employee), check on thevarious controllable expenditure through cost awareness driveamong the staff and improving non-fund based business. It isalso concluded that apt management of spread comparativelycontributes less than the efficient management of burden toimprove profitability. Stated otherwise, though spread iscrucial for profits and profitability, but in case of financialcompulsions proper burden management can also be animportant instrument to improve upon profits and profitability.
FINDINGS OF THE STUDYi) Analysis of productivityProductivity is a vital indicator of economic performance. In aservice sector industry like banking which operate underhighly competitive conditions, productivity acquiresconsiderable significance. The productivity parameters for thepresent study are employee productivity, branch productivityand operational productivity over the two phases of all the foursample bank groups.
ii) Analysis of profitabilityThe analysis of productivity is supplemented andcomplemented by the analysis of profitability sinceprofitability is the net outcome of efficiency and productivity.As in case of productivity, the profitability analysis of the foursample banks groups have been done by dividing the postreform twenty years period into to distinct phases of ten tearseach. Broadly, the primary factors of commercial bankprofitability are spread and burden. Secondary factors are thosewhich influence the primary factors and factors which impactthe secondary factors are termed as tertiary factors and so on.The total sample analysis (average of the four sample bankgroup) during the second phase of reforms reveal that thedecline in establishment expenses, other expenses and increasein other income components are the main determinants ofprofitability. Decline in spread remained a drag on profitabilityon banks.
Among the four sample bank group, SBI group’simproved profitability is the net outcome of fall inestablishment expenses as well as other expenses coupled withincrease in other income. In case of nationalised bank group,the key to higher profitability is decline of establishmentexpenses other expenses as well as burden during the studyperiod. Analysis of private sector bank group depicts thatdecline of establishment ratio, an increase of other income, arethe major contributor to profitability. Foreign bank group’sanalysis of profitability discerns that increase in other incomeand decrease in other expenses is the main factors improvingthe profitability. In other words, proper handling of the burdenratio by this group has been the main contributor ofprofitability. One of the interesting observation regardingIndian banking sector profitability in the post reform era is thatdespite a fall in the ‘spread’ component, which is consideredunder the normal circumstances as the primary profitabilitydeterminant, improvement of profitability is observed. As amatter of fact, none of the four sample bank groups dependedupon ‘spread’ to improve their profitability. Alternatively, allthe four sample groups judiciously managed the ‘burden’component which contributed to their increased profitability.Specially, “burden management” emerged as a moreappropriate financial strategy for the banking sector to increaseprofitability than enhancing the ‘spread’ volume which isfirmly associated with several socio-economic compulsions. Inother words, the Indian banking system seems to be coming ofage since it could manage to increase its profitability by anefficient management of the burden component, a majordeterminant of profitability. This trend is also crucial sincehigher profitability through burden management is achieved bythe banking sector during the second decade of the reform erawhen the reform process deepened and intensified.
LIMITATIONS AND SCOPE OF FUTURE RESEARCHSince the data of the present study have been collected mainlyfrom secondary sources it has its own limitations. Similarly,to bring uniformity in the data and analysis procedure,some approximations are made which has got its own
Productivity and profitability analysis of banking sector in India
147
limitations. Only selected banks for which data areavailable throughout the study period have been includedin the present study. Various analytical tools which are usedin the present study have their own limitations. Despite allthese limitations, the finding and conclusions of the study ofthis kind without doubt provide on empirical basis to thestudies undertaken in the area of banking profitability andproductivity. Therefore the significance of such empiricalstudies can hardly be overemphasized.
Within available time and resources, the present studyhave been attempted to be more intensive and comprehensive.The finding of the present study no doubt will throw new lighton productivity and profitability studies undertaken for thebanking sector. Besides, the research gaps that exist provide anew dimension for future research work in the era ofprofitability and productivity. Qualitative dimensions ofprofitability and productivity can be explored in futureresearch studies by including social profitability and socialproductivity dimensions in to such studies. It is hoped that theanalysis done, interpretations made and conclusions derived inthe present study will act as a springboard to the future researchendeavors in the years to come.
REFERENCES1. Abramovitz, M. ‘Resource and Output Trends, in the
United States since 1870’ Occasional Paper 63 NationalBureau of Economic Research, New York, 1950.
2. Aggrawal B. P. Commercial Banking in India, ClassicalPublishing Company, New Delhi, 1981. AmericanBankers Association Productivity improvement for theBanking
3. Office –A Comprehensive Guide Book, AmericanBankers Association, Washington, 1983 Butterworth,Jack, Productivity New Pergamum Press, London, 1969.
4. Chandra, Durgesh, Dynamics of Productivity, SouthAsian Pvt. Ltd., New Delhi, 1980.
5. Denison E.F., Accounting for United States EconomicGrowth, 1929-1969. The Brookings Institution,Washington, 1974.
6. Desai V R M Banking Development in India, RawatPublications Raipur 1978 .
7. Desai, Vasant, Indian Banking—Nature and Problems,Himalaya Publishing House, Bombay, 1980 .
8. Divatia, V.V., and T. R. Venkatachalam , ‘OperationalEfficiency and Profitability of Public Sector Banks’ RBIOccasional papers, June 1978, pp. 1-16 .
9. Economic and Scientific Research Foundation,Productivity Wages and Prices in Indian Industry (1953-
1963), Economic and Scientific Research Foundation,New Delhi, 1968.
10. Elise, Eugene S, Money and Banking , South WesternPublishing Company , New York, 1955.
11. Fabricant Soloman, ‘Basic Facts on Productivity Change,Occasional Paper 63, National Bureau of EconomicResearch, New York, 1959. A primer on productivity,Prentice Hall of India Pvt. Ltd, New Delhi 1973.
12. Fabricant, Soloman, Productivity in Asia’s developingeconomics reflections on the design, construction andanalysis of relevant information, productivitymeasurement, theory and practice in Asia. Selected Papersfrom APO Symposium and Workshop 1975 and 1979,Asia Productivity Organization, Tokyo.
13. Fare R, Grosskopf S, Norris M, Zhang Z (1994).Productivity growth, technical progress and efficiencychange in industrialised countries. American EconomicReview, 8, 66-83.
14. Federal Reserve Bank of Boston, the Decline inProductivity Growth, Conference Series 22, Boston, June,1980.
15. Ganguly, H.C. Industrial Productivity and Motivation APsychological Analysis, Allied Publications Pvt. Ltd. NewDelhi, 1983.
16. Garcia, F.L. Encyclopedia of Banking and Finance,Bankers Publishing Company, Boston, 1973.
17. Ganguly, H.C. Industrial Productivity and Motivation APsychological Analysis, Allied Publications Pvt. Ltd. NewDelhi, 1983 .
18. Garcia, F.L. Encyclopedia of Banking and Finance,Bankers Publishing Company, Boston, 1973.
19. Hester, Donald, D., Indian Banking ---Their Portfolios,Profits and Polices, University of Bombay, Bombay,1961.
20. Hornbruch, F. W. ‘Raising Productivity’ McGraw HillBook Co., New York, 1977 .
21. National Productivity Council, Role of LaborProductivity, NPC Report No. -46, New Delhi 1966.
22. Organization for European Economic Co-operation,Terminology of Productivity, Organization for EuropeanEconomic Co-operation, Paris 1950.
23. Wahab N., Rahim A., Rahman A. (2012). Productivitygrowth of zakat institutions in Malaysia An application of
I.J.E.M.S., VOL.6 (3) 2015: 124 - 148 ISSN 2229-600X
148
data envelopment analysis. Journal of Studies inEconomics and Finance, 29(3).
GOVT. REPORT1. Report of the Banking Commission, Government of
India, 1972. Report of the Productivity , Efficiency andProfitability (PEP) Committee on Banking (mimeo) ,(Headed by J.C. Luther) , Reserve Bank of India , 1977
ARTICLES1. Angadi, VB. And Devraj V John, ‘Productivity and
Profitability of Banks in India ‘Economic and PoliticalWeekly, Nov., 1983, pp. 160-170.
2. Baumol, W.J. ‘Productivity Growth Convergence andWelfare ‘American Economic Review, Dec. 1986, pp.1072-85.
3. Berndt, Ernst R. and Laureates. R. Christensen , ‘Testingfor the existence of a consistent aggregate index of laborinputs’ American Review , June , 1974, pp. 391-404