Embed Size (px)
Citation preview

PRODUCTIVITYIMPROVEMENTOFAUTOMOTIVEINDUSTRY
USINGLEANMANUFACTURING
1SWAPNILT.FIRAKE,2DR.KEDARH.INAMDAR
1Student,DepartmentofMechanicalEngineering,WCE,Sangli,Maharashtra,INDIA,
Email:[email protected]
2Professor,DepartmentofMechanicalEngineering,WCE,Sangli,Maharashtra,INDIA,
Email:[email protected]
ABSTRACT
Leanmanufacturingisdefinedasasystematicapproachtoidentifyingandeliminating
wastethroughcontinuousimprovement,flowingtheproductatthepullofthecustomer
inpursuitofperfection.Theidentificationandmeasurementofbestpractices, inLean
Production implementation, followed by the evaluation of its usage level, in the
organizations,aretheadequatewaythroughtheeliminationorminimizationofwaste.
However, the lack of a coordinated and structured roadmap, in the Lean Production
implementation, may result in poor and disappointing results. In that sense, it is
important to identify thestepsrequiredtoassess thestagesofcompanies towardthe
LeanProductionsystem.
The automotive industry under study includes assembly, testing and pre‐dispatch
inspection department. Kaizen improvements and 5S are the two lean tools that are
takenintoconsiderationforimprovements.Thedataiscollectedforthetimestudyand
analyzedwith the leanmetrics. Line balancing of production line is done in order to
removetheunnecessarystepsandthusshortentheleadtime.Theleanmanufacturing
reducestheleadtimeandalsoincreasesthequalityoftheproduct.
INDEXTERMS:Productivity,LeanManufacturing,Linebalancing,Kaizen,5S.
SWAPNIL T. FIRAKE et al DATE OF PUBLICATION: JULY 3, 2014
ISSN: 2348-4098 VOLUME 02 ISSUE 05 JUNE 2014
INTERNATIONAL JOURNAL OF SCIENCE, ENGINEERING AND TECHNOLOGY-www.ijset.in 428

1. INTRODUCTION TO LEAN
MANUFACTURING
Lean manufacturing is one of the
initiatives that many major
manufacturingplants inAsia,especially
inMalaysiahavebeentryingtoadoptin
order to remain competitive in an
increasingly competitive globalmarket.
The focus of the approach is on cost
reductionthrougheliminatingnonvalue
added activities via applying a
management philosophywhich focused
on identifying and eliminating waste
from each step in theproduction chain
respective of energy, time, motion and
resources alike throughout a product’s
value stream, known as lean. Since the
birth of Toyota Production System,
manyofthetoolsandtechniquesoflean
manufacturing (e.g., just‐in‐time (JIT),
cellularmanufacturing, totalproductive
maintenance,single‐minuteexchangeof
dies, production smoothing) have been
extensively used. This activity is more
towards to Toyota Production System
(TPS),asystematicapproachtoidentify
and eliminate waste activities through
continuous improvement. All these
effort is objectively to keep cost down
andstayaheadintherace.
Industrial organizations have
increasingly sought to optimize the
resources needed for the manufacture
of itsproducts fromthecompetition, in
order to maintain their profit margins.
Thesearchforbalanceofresourcesand
balanceddistributionoftasksinvarious
types of industrial environments is
calledbalancing.Whenadjustmentsare
madeandadequacyofanassemblyline
thatisalreadyinoperation,thisprocess
is called rebalancing. Productivity of a
manufacturingsystemcanbedefinedas
the amount of work that can be
accomplished per unit time using the
availableresources.
Lean manufacturing has emerged
relatively recently as an approach that
integratesdifferenttoolstofocusonthe
elimination of waste and produce
products that meet customer
expectations. It helps in reduction of
resourcesandpresentsbenefitssuchas:
reduced delivery time, reduced
inventory, bettermanagement and less
rework[1].
1.1LINEBALANCING
Line balancing (LB) is usually
undertaken to minimize imbalance
between machines or personnel while
meetingarequiredoutputfromtheline.
Line balancing is a tool to improve the
throughputofaworkcellor linewhich
SWAPNIL T. FIRAKE et al DATE OF PUBLICATION: JULY 3, 2014
ISSN: 2348-4098 VOLUME 02 ISSUE 05 JUNE 2014
INTERNATIONAL JOURNAL OF SCIENCE, ENGINEERING AND TECHNOLOGY-www.ijset.in 429

at the same time reducing manpower
and cost needed. It is often used to
develop product based layout. LB job
descriptionistoassigntaskstoaseries
of connected workstations where the
number of workstations and the total
amountofidletimeareminimizedfora
givenoutput level. The line is balanced
if the amountofworkassigned to each
workstationisidentical.
Line balancing is commonly technique
tosolveproblemsoccurredinassembly
line. Line balancing is a technique to
minimize imbalance between workers
and workloads in order to achieve
required run rate. This can be done by
equalizing the amount of work in each
station and assign the smallest number
of workers in the particular
workstation.
Generally,LBtechniqueisusedbymany
companies to improve theproductivity,
decreases the man power, decreases
idletimeandbufferoreventoproduce
more than two products at the same
time.LBtechniqueisusedtoachievethe
minimization of the number of
workstations, theminimizationof cycle
time, the maximization of workload
smoothness and the maximization of
workrelatedness.
Linebalancingiscommonlytechnique
to solve problems occurred in
assemblyline.Basically,linebalancing
triestominimizeimbalancebetween
workersandworkloadinordertoget
higher efficiency. There are some
methods to solve line balancing
problem; Heigesson Birnie Method,
Moodie‐Young Method, Immediate
Update First‐Fit Heuristic, and Rank‐
and‐AssignHeuristic.
1.2‘5S’METHODOLOGY
It is one of the simplest tools of lean
manufacturing.5Sisasystemtohave
less waste, optimize quality and
productivity through maintaining an
orderly workplace and using visual
signs to achieve operational results.
The practice of 5S comes from first
letter of five Japanese words and
translates as: sort, set in order, shine,
standardizeandsustain.
i) Sort:isthefirst“S”andrefersto
sorting tools, equipments on the work
place, relocate or remove all
components that is unnecessary or not
usedoften.
ii) Set inorder:means“aplace for
everything and everything in itsplace”.
Itaimstoorganizetheworkplace.
SWAPNIL T. FIRAKE et al DATE OF PUBLICATION: JULY 3, 2014
ISSN: 2348-4098 VOLUME 02 ISSUE 05 JUNE 2014
INTERNATIONAL JOURNAL OF SCIENCE, ENGINEERING AND TECHNOLOGY-www.ijset.in 430

iii) Shine: refers to clean the work
area. It involves improving the
appearance of the work area and
housekeepingefforts.Everythingshould
stayclean.
iv) Standardize: everyone in the
organizationmustbeinvolvedinthe
5S effort. 5S should be implemented
withthesamewaytoeverywhere.
v) Sustain:referstomakingsure5S
implementation is followed by the
personnel. 5S is a culture and it has to
beingrainedintotheorganization[2].
1. CRITERIAINLINE
BALANCING
Therearesomecriteriawhichshouldbe
considered in a line balancing process.
These are takt time, cycle time,
downtime and minimum number of
workstationswhichcanbeexplainedas
below:
A. TAKTTIME
Takt time is pre‐requisite procedure in
doing line balancing task. Takt time is
the pace of production that aligns
production with customer demand. It
showshowfasttheneedtomanufacture
product in order to fill the customer
orders. Producing faster than takt time
results in over‐production which is a
typeofwastewhereasproducingslower
than takt time results in bottlenecks
where the customerordersmaynotbe
filled in time. The takt time is
determinedbyusingEq.1.
dayperdemandCustomer
daypertimeAvailableTaktTime
(1)
B. CYCLETIME
Cycle time shows how often the
productionlinecanproducetheproduct
withcurrentresourcesandstaffing.Itis
an accurate indicator to represent of
how the line is currently set up to run.
Cycletimeistheexpectedaveragetotal
production time per unit produced. On
anassembly lineor in awork cellwith
multiple operators, each operator will
have his own time associated with
completingtheworkheisdoing.
Takt time and cycle time are definitely
not the same. Takt time represents the
maximum time allowed to meet the
customerdemandwhereascycletimeis
the actual time necessary for an
operator to perform an activity or
completeonecycleofhisprocess.Both
takttimeandcycletimearedetermined
by customer demand. Using Eq.2, we
can calculate the cycle time for one
enginecompleteassembly.
SWAPNIL T. FIRAKE et al DATE OF PUBLICATION: JULY 3, 2014
ISSN: 2348-4098 VOLUME 02 ISSUE 05 JUNE 2014
INTERNATIONAL JOURNAL OF SCIENCE, ENGINEERING AND TECHNOLOGY-www.ijset.in 431

requiredoduction
timeproductionActualCycleTime
Pr (2)
C. DOWNTIME
Downtime can be defined as that time
that is non value added. It is often
related with the 7 wastes that are:
defects, overproduction, waiting,
transportation, unnecessary inventory,
unnecessary motion and inappropriate
processing.
D. MINIMUM NUMBER OF
WORKSTATIONS
Aworkstationisaphysicalareawherea
workerwithtools,aworkerwithoneor
more machines, or an unattended
machine performs particular sets of
worktogether.Numberofworkstations
working is the amount of work to be
done at a work center expressed in
numberofworkstations.
Minimumnumberofworkstation is the
least number of workstations that can
providetherequiredproduction.Actual
number of workstation is the total
numberofworkstationsrequiredonthe
entireproductionline,calculatedasthe
next integer value of the number of
workstationsworking[3].
2. THEORIES RELATED TO
LEANMANUFACTURING
Literature is studied for lean
manufacturing. Literature review gives
detail information about present
practices in lean manufacturing and
results of advanced researches all over
the world. Literature review not only
givesthehistoryofaparticularproblem
but also provides results of recent
researchesonthesame.
3.1ABRIEFHISTORYOFLEAN
Mention ‘lean’ andmost ‘lean thinkers’
willknowthatthis isareferencetothe
leanproductionapproachpioneeredby
Toyota but also the subject of The
MachinethatChangedtheWorld,abook
which first highlighted Japanese
production methods as compared to
traditional Western mass production
systems,italsohighlightedthesuperior
performanceof the former.The follow‐
on book, Lean Thinking: Banish Waste
andCreateWealthinyourOrganization
is equally a key step in the history of
lean as it summarizes the lean
principles which ‘guide action’. It also
coinedthephrase‘LeanProduction’.
3.2 RECENT THEORIES AND
PRACTICES
The recent researches are studied for
the lean manufacturing concept, line
SWAPNIL T. FIRAKE et al DATE OF PUBLICATION: JULY 3, 2014
ISSN: 2348-4098 VOLUME 02 ISSUE 05 JUNE 2014
INTERNATIONAL JOURNAL OF SCIENCE, ENGINEERING AND TECHNOLOGY-www.ijset.in 432

balancing approach and 5S
implementation.
2.2.1 Leanmanufacturing
Jostein Pettersen suggested that the
Lean principles are applicable to any
industry. If this is correct, then the
Japanese should logically have
distributed the knowledge of these
principles throughout all domestic
Japanese industry. This does not seem
to be the case. The only ‘true’ Lean
producers in Japan are confined to the
automobile industry, represented by,
e.g.Toyota,HondaandMazda,whereas
other areas of industry are performing
at the same level as or worse than
western competitors. This was pointed
outthattheprinciplesconstitutingLean
Productionhavenotreceivedanywide‐
spread attention outside the auto‐
industry. He argues that the possibility
to become ‘Lean’ through JIT in
particular is highly dependent upon
businessconditionsthatarenotalways
met, thus limiting the ‘universality’ of
theconcept[4].
3.2.2Linebalancing
R. B. Breginski et al. explained the line
balancing methods for flexible
manufacturing processes. It includes
Heuristic Method of line balancing
whichnormallyusedforbalancingof
number of group activities to be
performed during operation and
explained the problem solution which
gives optimum output for such
problems. This method is very easy to
understand as well as implement into
actual analysis is of problem. No extra
expense is required to analyze the
problemaswellasfindingsolution[5].
Hudli Mohd. Rameez et al. explained
main purpose of implementing lean
manufacturing is to increase
productivity, reduce lead time and
cost and improve quality thus
providing the up most value to
customers. Lean Manufacturing is an
operational strategy oriented toward
achieving the shortest possible cycle
time by eliminating waste. Lean
manufacturing techniquesarebasedon
the application of five principles to
guide management’s action toward
success. Lean production method is an
effective way to improve management,
enhance the international
competitiveness of manufacturing
enterprises[6].
3.2.3 ‘5S’ methodology: P. M. Rojasra
and M. N. Qureshi demonstrate the
implementation of 5S as lean
manufacturing technique in small scale
SWAPNIL T. FIRAKE et al DATE OF PUBLICATION: JULY 3, 2014
ISSN: 2348-4098 VOLUME 02 ISSUE 05 JUNE 2014
INTERNATIONAL JOURNAL OF SCIENCE, ENGINEERING AND TECHNOLOGY-www.ijset.in 433

industry. Leanmanufacturing is one of
theoptions toreducenon‐value‐added‐
activity or waste and improve
operational efficiency of the
organization. The efficient
implementationof5Stechniqueleads
to subsequent improvement in
productivity of the manufacturing
plant.The5Simprovesenvironmental
performanceandthusrelateprimarily
in reduction of wastes in
manufacturing. It promotesneatness in
storage of raw material and finished
products.The5Simplementationleads
to the improvement of the case
company organization in many ways
[7].
3. CASESTUDY‐LEAN
IMPLEMENTATION
In order to increase the productivity,
theautomotiveindustrydecidedtotake
initiative of lean implementation. The
Greaves Cotton Limited is one of the
leadingindustriestomanufacturesingle
cylinder diesel engines. The case study
in this paper is regarding the
manufacturing of 3‐wheeler TML
engine. The different departments
include assembly department, testing
departmentandpre‐dispatchinspection
department. The data is collected and
analyzedforalldepartments.
The following assumptions are used to
definetheproblem:
a) The assembly line is never
starved,
b) Set‐up times are not taken into
consideration.Because ina real system
the setup process is usually
accomplishedattheendoftheworking
time,
c) No maintenance process is
performedduringtheworkingperiod,
d) Transportation of raw materials
is performed by workers who aren’t
usedforassemblyoperations.
The method used for improvements is
showninfollowingFig‐1.
Figure1:ProcessImprovementFlowDiagram
SWAPNIL T. FIRAKE et al DATE OF PUBLICATION: JULY 3, 2014
ISSN: 2348-4098 VOLUME 02 ISSUE 05 JUNE 2014
INTERNATIONAL JOURNAL OF SCIENCE, ENGINEERING AND TECHNOLOGY-www.ijset.in 434

4.1 COMPANY AND PROCESS
BACKGROUND
The Industry currently is one of the
leadingindustriestomanufacturesingle
cylinder diesel engines. The industry is
heading towards becoming the world
class leader. They have current peak
capacity of assembly of 225
engines/shift, testing of 154
engines/shift and PDI of 200 engines.
The industry is seeking to increase its
capacity so that it can satisfy the
increased demand of the existing
customer in the future and also seeks
the other customers to bring towards
them.
In automotive industries, themain aim
whileincreasingproductivityisfoundto
be the increase in number of output
units that are manufactured. The lean
implementation also takes care of
quality of the product that is
manufactured.Thelinebalancingofthe
assemblylineistheinitiatetowardsthis
fulfillment.
Some of the tools used are kaizen
improvements, pokayoke, motion
reduction,transportationreduction,line
balancing,5S implementation, takttime
etc. The steps include process review
and data collection, data analysis,
observations and data collection after
the improvement, results and
discussions.
4.2ENGINEFLOWDIAGRAM
Thisdiagramshowswhichsequencethe
product, engine, flows from one
departmenttoanotherdepartment.The
engine is assembled in the assembly
department on the conveyor. The
assembled engine is tested in engine
testingdepartment.Thetorquesettings
are done in this testing and also the
engine is checked for any leak while
actual running of the engine. The OK
engine from testing department then
transferred to pre‐dispatch inspection
(PDI) department. In this department,
all the accessories,markings are added
to engine and also the tappet settings
aredone.
Figure2:EngineFlowDiagram
EngineAssemblyDepartment
This is the first and the main area of
concern towards the lean
implementation. There are 30‐Online
workstationsand9‐Offlineworkstations
ontheconveyor.Theconveyoravailable
SWAPNIL T. FIRAKE et al DATE OF PUBLICATION: JULY 3, 2014
ISSN: 2348-4098 VOLUME 02 ISSUE 05 JUNE 2014
INTERNATIONAL JOURNAL OF SCIENCE, ENGINEERING AND TECHNOLOGY-www.ijset.in 435

is power and free conveyor which is
already installed. From the data
analysis, the target in the productivity
improvement is set for assembly of
engines,whichis16%improvement.
ProcessreviewanddatacollectionPrior
to Lean Production implementation, a
process review on TMLwas conducted
toinvestigatetheexistingmethodof its
actual assembly processes through
direct observation. Hardcopy
information on actual manufacturing
activities is based on their Operations
Manuals and the Standard Operating
Procedure (SOP). The Cycle Time or
Processing Timemeasured is observed
by the video taken from the ongoing
process of the assembly in order to
establish the baseline for data analysis.
Further to that, line observation was
conducted tomonitor and to grasp full
understanding on the current practice
at the assembly line as well as to
identifytypesofwastesintheprocess.
The engine is assembled on conveyor
which is already available. The
conveyor used is power and free
conveyor. The following data is
collected as before improvement data.
The issues that are found out from the
presentassemblylineareasfollows:
a) The activities contain value‐
added as well as non‐value‐added
activities. Non‐value‐added activities
aretakingtimethataddsnovaluetothe
final product. So the time required is
more and again there ismotion loss. It
leadstolowproductionrate.
b) Line is not balanced and one
station is taking too much time to
complete the set of activities that are
subjected to be done on that
workstation only. That leads to
bottlenecks and the next station is idle
fortheremainingtime.
c) Thereareidlestationspresentin
thelinethatarenotaddinganyvalueto
the product, thus leads to take more
timetoassembletheengineandleadsto
lowproductionrate.
d) The activities are taking too
much time than the actual time they
havetotake,sincetheycontainvarious
non‐valueaddedmotions.Thusthetime
taken for completion of thework for a
particularstationismore.
Table‐1 shows the detailed operations
intheassemblylinewiththeprocessing
times at respective stations. The
observations before the improvements
for assembly line related to total
workstations, total capacity of the line
SWAPNIL T. FIRAKE et al DATE OF PUBLICATION: JULY 3, 2014
ISSN: 2348-4098 VOLUME 02 ISSUE 05 JUNE 2014
INTERNATIONAL JOURNAL OF SCIENCE, ENGINEERING AND TECHNOLOGY-www.ijset.in 436

andtheoutputpermanaremadewhich
areasbelow:
a) Numberofworkstations:40
(Online‐30,Offline‐10)
b) Capacity (Engines/Shift) = 225
Engines
c) Output/Man: Total Team
Associate(TA)=35
Hence, Output/TA = 225/35 = 6.42
Engines/TA
As it can be seen from the above data,
thereare30onlineworkstations.Outof
these, five stations are without Team
Associate. Out of these, on the two
stations there is In‐ProcessVerification
(IPV) setup is installed as a quality
check point and three stations are
idle/man‐lessstations.
a) DATAANALYSIS
For thedata analysis, total shift time is
taken 8Hour and 30minutes, i.e. 510
minutes. Excluding the unproductive
time like lunch and other time, the
available productive time is 450
minutes.
Table‐1:G600WIIIOperationsDetails
WSNo. Operationstobedone Timeinseconds
01 Loadingofcrankcase,Historycardscanningandlocate
atidentifiedlocation
74.4
02 Crankshaftfitment,starterplate,retainerplate 94.2
03 IPV‐01(AxialPlayMeasurement) 52
04 Fitmentofcamshaft,rollertappet&PRTsupport,FWE
cover
123.6
05 Fitmentofcylinderheadstud&PTOcoverfitment 126
06 Barrelfitment,Piston&con.rodfitment 88.8
07 Fitmentofstrainer,studonadaptorforfilterfitment 122
08 Fitment of oil pan with loctite & pressure switch on
adaptor
68
SWAPNIL T. FIRAKE et al DATE OF PUBLICATION: JULY 3, 2014
ISSN: 2348-4098 VOLUME 02 ISSUE 05 JUNE 2014
INTERNATIONAL JOURNAL OF SCIENCE, ENGINEERING AND TECHNOLOGY-www.ijset.in 437

09 Oilpantightening,LOFadaptorfitment 80
10 Positivelubricationpipefitment 114
11 Studfitmentonstarterplate 86
12 FWE tightening in sequence, alternator bracket stand,
enginefeettrolley
85
13 IPV‐II(Torquetoturn) ‐
14 Flywheel&crankshaftpulleyfitment 81
15 Fitmentoffwaterpump&waterfeedpumppulley 81
16 FitmentofFIP,checkBDCwithdialgauge 126
17 Bumpingclearance&TDCmarking 75
18 PRT,Pushrod,Cylinderheadfitment 68
19 Cylinder head tightening, DCNR torquing, Tappet
setting
85
20 Waterfeedpumppulley,inletandexhauststudfitment 120
21 Thermostat cover with sealant and stop bracket
fitment
79
22 Fuelfeedpumpandricovalvefitment 79
23 Rockerlubricationpipe,oilreturnpipefitment 73
24 FeedpumptoFIPpipeandoverflowpipefitment 87
25 Rockercover,Intakemanifoldfitment 78
26 Idlestation ‐
27 Engineairleaktest,highpressurepipefitment 121
SWAPNIL T. FIRAKE et al DATE OF PUBLICATION: JULY 3, 2014
ISSN: 2348-4098 VOLUME 02 ISSUE 05 JUNE 2014
INTERNATIONAL JOURNAL OF SCIENCE, ENGINEERING AND TECHNOLOGY-www.ijset.in 438

28 Idlestation ‐
29 Idlestation ‐
30 Breather cap, name plate fitment, oil dispensing,
registerentry,barcodescanninganddeclareenginefor
84
FromEq.2, the cycle time is calculated
andwhichisfoundtobe2minutes.This
means that there is assembly of one
engine for every 2minutes that is 120
seconds. The time taken for pallet
movement from one station to another
station is found to be 13 seconds. This
shows that the available time for
working on the each station is 107
seconds.
Basedon this, the target is set for16%
improvement which gives 262 engines
per shift andwith the takt time of 103
seconds. Excluding the prior available
palletmovementtimebetweenstations,
the time available for completing the
work at each station is found to be 90
seconds,i.e.,theassemblylineshouldbe
balancedfor90seconds.Thisisthetakt
timeforassemblydepartment.
b) IMPROVEMENTS INASSEMBLY
LINE
The improvements done are done by
kaizen improvements and 5S
implementation on the assembly line.
Theseimprovementsreducethemotion
losses, waiting losses, transportation
losses, etc. Apart from these
improvements,pokayokeimprovements
arealsodoneasqualityimprovements.
KAIZENIMPROVEMENTS:
Thesearedoneforreducingfatigueand
motion losses. These improvements
help to reduce the time for completing
thetask.Thenon‐value‐addedactivities
ormotionsareeliminated/reducedwith
the help of proper kaizen
improvements.
Rebalancing is done by the proper
shifting or distribution of activities at
variousworkstationssuchthatidentical
time is required at all workstations to
complete the activities distributed on
them.
These are continuous improvements.
The basic idea of improvement is got
form actual walking on the assembly
line. The operator on the station
provides the idea of the improvement.
SWAPNIL T. FIRAKE et al DATE OF PUBLICATION: JULY 3, 2014
ISSN: 2348-4098 VOLUME 02 ISSUE 05 JUNE 2014
INTERNATIONAL JOURNAL OF SCIENCE, ENGINEERING AND TECHNOLOGY-www.ijset.in 439

This helps to reduce the fatigue to the
worker.
Someofthekaizenimprovementsareas
showninfollowingTables.
Table‐2:KaizenImprovements(1)
KaizenObjective:
Toreducedtimeandfatigue
Idea:
To provide location arrangement forgasketandTDCplate
Problem/Presentstatus:
More time and fatigue during taking ofmaterial
Countermeasure:
Gasket and TDC plate bin provided inrightsideofoperator
Before After
Description:
Materialtakingonbackside
(Timerequired=11sec)
Description:
Materialtakingonrightside
(Timerequired=7sec)
AsshowninTable‐2,thelocationforthe
bin ischanged.Thisreducesthefatigue
totheworker.Thelocationofthebinis
also placed at the good height and
distance.
SWAPNIL T. FIRAKE et al DATE OF PUBLICATION: JULY 3, 2014
ISSN: 2348-4098 VOLUME 02 ISSUE 05 JUNE 2014
INTERNATIONAL JOURNAL OF SCIENCE, ENGINEERING AND TECHNOLOGY-www.ijset.in 440

Table‐3:KaizenImprovements(2)
KaizenObjective:
Toreducedtimeandfatigue
Idea:
ToprovidearrangementforFIFOrack
Problem/Presentstatus:
More time and fatigue during taking ofmaterial
Countermeasure:
Small bin attached over FIFO rack atcomfortablelevel
Before After
Description:
Materialbinisnotatcomfortablelevel
(Timereqd=09sec)
Description:
Smallbinprovidedatcomfortablelevel
(Timereqd=3sec)
As shown from Table‐3, it is seen that
the bin before was not at the
comfortablelevel.Thecomfortablelevel
ofbinreducesfatiguetotheworker.
Table‐4:KaizenImprovements(3)
KaizenObjective:
Toreducedtimeandfatigue
Idea:
ToprovidearrangementforFIFOrack
Problem/Presentstatus:
More time and fatigue during taking ofsolenoidbracket
Countermeasure:
Slant tray provided in the side ofoperator
Before After
SWAPNIL T. FIRAKE et al DATE OF PUBLICATION: JULY 3, 2014
ISSN: 2348-4098 VOLUME 02 ISSUE 05 JUNE 2014
INTERNATIONAL JOURNAL OF SCIENCE, ENGINEERING AND TECHNOLOGY-www.ijset.in 441

Description:
Solenoidbrackettakingfrombackside
(Timereqd=8sec)
Description:
Solenoid bracket taking from side ofoperator
(Timereqd=4sec)
Table‐4 shows that before kaizen
improvement, the solenoid bracket has
to be taken from the back side of the
worker. After, the tray is provided by
thesideoftheoperator.
Table‐5:KaizenImprovements(4)
KaizenObjective:
Toreducedtimeandfatigue
Idea:
Toprovidearrangementforbackplate
&airshroud
Problem/Presentstatus:
Moretime&fatigueduringBOMissue
Countermeasure:
Hanger type trolley provided for back
plate&airshroud
Before After
SWAPNIL T. FIRAKE et al DATE OF PUBLICATION: JULY 3, 2014
ISSN: 2348-4098 VOLUME 02 ISSUE 05 JUNE 2014
INTERNATIONAL JOURNAL OF SCIENCE, ENGINEERING AND TECHNOLOGY-www.ijset.in 442

Description:
BeforeBOMissueforbackplate,itisin
box
(Timereqd=09sec)
Description:
TrolleyforAirshroud&backplate
(Timereqd=6sec)
Table‐5 shows before kaizen
improvements, the back plate was
provided in box on the assembly line
whichcauses fatigueduringBOMissue.
Thetrolleyisprovidedforairshroud
Andbackplate,reducesfatigueandtime
duringBOMissue.
5SIMPROVEMENTS
These are workplace related improvements. These cause the best utilization of the
workplace.
Table‐6:5'S'Improvements(1)
5SObjective:
To improved 5's' and increase workingspace
Idea:
To provide location arrangement fors/aofEGRvalve
Problem/Presentstatus:
5's' not maintained and difficulty forworking
Countermeasure:
Hangerprovidedfors/aofEGRvalve
Before After
SWAPNIL T. FIRAKE et al DATE OF PUBLICATION: JULY 3, 2014
ISSN: 2348-4098 VOLUME 02 ISSUE 05 JUNE 2014
INTERNATIONAL JOURNAL OF SCIENCE, ENGINEERING AND TECHNOLOGY-www.ijset.in 443

Description:
S/aofEGRvalveonworkingtable
Description:
S\aofEGRvalveonhanger
Table‐7:5'S'Improvements(2)
5SObjective:
Toimproved5's'
Idea:
To provide location arrangement for oilreturnpipefitmentgauge
Problem/Presentstatus:
5's'notmaintained
Countermeasure:
location change and separate standprovidedforgauge
Before After
Description:
Gauge location and material binlocationissamenotseparate
Description:
separate location provided for gaugelocation
AsshowninTable‐6andTable‐7, these
are 5'S' improvements. The right
locationissetforallthematerials.After
usage, same is placed to its respective
location. These are out of some of the
5'S'improvements.
Table‐8 shows the time before (P) line
balancing and the time required after
(Q) line balancing at all workstations.
Action taken to reduce the timing at
eachworkstationisalsoincludedinthe
table. All the time study is done in
seconds.
SWAPNIL T. FIRAKE et al DATE OF PUBLICATION: JULY 3, 2014
ISSN: 2348-4098 VOLUME 02 ISSUE 05 JUNE 2014
INTERNATIONAL JOURNAL OF SCIENCE, ENGINEERING AND TECHNOLOGY-www.ijset.in 444

Table‐8:TimeBeforeandAftertheImprovementsandtheActionsTaken
WSNo. P Q ActionsTaken
01 74.4 85 Activityrebalancedfor90sec
02 94.2 88 Activityrebalancedfor90sec
03 52 52 IPV‐1(EndFloat)Man‐less
04 123.6 82 Layoutchanged&rebalancingdone
05 126 81.4 Motionlossreduced
06 88.8 81.6 Motionlossreduced
07 121.2 69 Motionlossreduced
08 67.2 82 Activityrebalancedfor90sec
09 79.2 67.8 Activityrebalancedfor90sec
10 124.8 82.2 Activityrebalancedfor90sec
11 85.2 81.6 Activityrebalancedfor90sec
12 85.2 85.8 Activityrebalancedfor90sec
13 62 62 IPV‐2TorqueToTurn(Man‐lessstation)
14 81.6 79.2 Motionlossreduced
15 81 84 Activityrebalancedfor90sec
16 126 72 Motionlossreduced
17 81 66.6 Activity rebalanced for 90 sec & motion lossreduction
SWAPNIL T. FIRAKE et al DATE OF PUBLICATION: JULY 3, 2014
ISSN: 2348-4098 VOLUME 02 ISSUE 05 JUNE 2014
INTERNATIONAL JOURNAL OF SCIENCE, ENGINEERING AND TECHNOLOGY-www.ijset.in 445

18 67.8 87 Activityrebalancedfor90sec
19 85.2 75.6 Activityrebalancedfor90sec
20 120.6 69 Motionlossreduced
21 78.6 90 Activity rebalanced for 90 sec & motion lossreduced
22 78.6 78 Activityrebalancedfor90sec
23 73.2 82 Activityrebalancedfor90sec
24 86.4 85 Activityrebalancedfor90sec
25 0 82 Idlestationusedtoutilizeconveyor&Activityrebalancedfor90sec
26 77.4 83.4 Activityrebalancedfor90sec
27 121.2 73.2 Motionlossreduced
28 0 0 Idlestation
29 0 0 Idlestation
30 84 72.6 Motionlossreduced
Thus,thetotaltasktimerequiredbefore
line balancing is 2426.4 seconds and
that required after line balancing is
2180 seconds. Fig‐3 below shows the
graph for above data for OnlineWS‐01
to WS‐30. WS‐28 and WS‐29 are idle
stations. The activities at all
workstationsarebalancedfor90secby
usingmotionlosses,changedlayoutand
rebalancingofactivities.
SWAPNIL T. FIRAKE et al DATE OF PUBLICATION: JULY 3, 2014
ISSN: 2348-4098 VOLUME 02 ISSUE 05 JUNE 2014
INTERNATIONAL JOURNAL OF SCIENCE, ENGINEERING AND TECHNOLOGY-www.ijset.in 446

Figure3:TimestudyandTaktTime
As shown in above Figure 3 , the cycle
time isrebalanced for90secondsatall
workstations,whichistakttime.
c) DATA AFTER LEAN
IMPLEMENTATION
i) Productioncapacity:
Before Improvement = 225
Engines/Shift
AfterImprovement=262Engines/Shift
PercentageImprovement=(262‐225)/
225×100
=16%improvement.
ii) Production lead time: Time from
startofphysicalproductionoffirstsub‐
module/part to production finished
(readyfordelivery).
FromTable‐7, theproduction lead time
before was 2426.4 seconds and that
after line balancing is 2180 seconds.
Thusproductionleadtimeisalsofound
tobereduced.
iii) Product yield per employee or
Output/Man = 262/34 = 7.71 engines,
which was 6.67 engines before
improvement.
iv) It determines optimize use of
labor. It measures effectiveness of
manufacturingprocessandproductivity
ofemployee.Thus, in thiscasestudy, it
isfoundtobeincreased.
SWAPNIL T. FIRAKE et al DATE OF PUBLICATION: JULY 3, 2014
ISSN: 2348-4098 VOLUME 02 ISSUE 05 JUNE 2014
INTERNATIONAL JOURNAL OF SCIENCE, ENGINEERING AND TECHNOLOGY-www.ijset.in 447

v) Additional 925 (= 37×25) engines
canbemadeinoneshiftbasisonly.
vi) With225engines/shiftwecanran
single shift up to maximum 5625
engines/month but with 262
engines/shift, we can achieve 6550
engines per month with the same
manpower.
d) Results Observed after Lean
Implementation
i) ProductivityImprovement
Increase in the number of engine
assembly leads to increase in the
productivity. Here, the number of
enginesassemblyisincreasedfrom225
to 262 engines per shift. Percentage
improvement observed is 16%
improvement. This shows that the lead
time is also reduced since there is
increase in the number of engine
assembliesinthesameamountoftime.
ii) LineEfficiency
Eq. 3 below shows the formula for
calculating the efficiency of the
assemblyline.FromTable‐7,addingthe
data for before line balancing, the
equationgivesthelineefficiencybefore
improvement[7].
TimeCycleestLnsWorkstatioofNumber
TimeTaskEfficiencyLine
arg
................(3)
LineEfficiency=2426.4/(30×126)=
64.19%
Now, adding the data for after line
balancing,Eq.3becomes,
Line Efficiency = 2180 / (30 × 90) =
80.74%
Thus, it can be seen that there is
improvement in line efficiency from
64.19%to80.74%.
I. G600WIII Engine Testing
Department
In this department, every assembled
engineistestedforitsperformanceand
thevarioussettingsarealsodonewhile
testing of the engine. Some of these
settingsincludesmaximumRPMsetting,
low RPM, idle RPM settings, rico valve
setting, etc. Testing of engine includes
loading of engine on the testbed then
running the engine and setting the
differentenginespecificationsand then
again unloading of the engine. Testing
departmentconsistsoftotal11testbeds
onwhichengineistested.
Following roadmap is prepared for the
improvementinthetestingdepartment.
SWAPNIL T. FIRAKE et al DATE OF PUBLICATION: JULY 3, 2014
ISSN: 2348-4098 VOLUME 02 ISSUE 05 JUNE 2014
INTERNATIONAL JOURNAL OF SCIENCE, ENGINEERING AND TECHNOLOGY-www.ijset.in 448
i) VideotobetakenfromLoading+
Connection+Removal of connection to
unloading.
ii) Conduct time study (Loading +
Running+Unloading).
iii) Identify wastages/Improvement
opportunities.
iv) Implementkaizen.
v) Checkresults.
a) Data Collection before and
afterImprovement
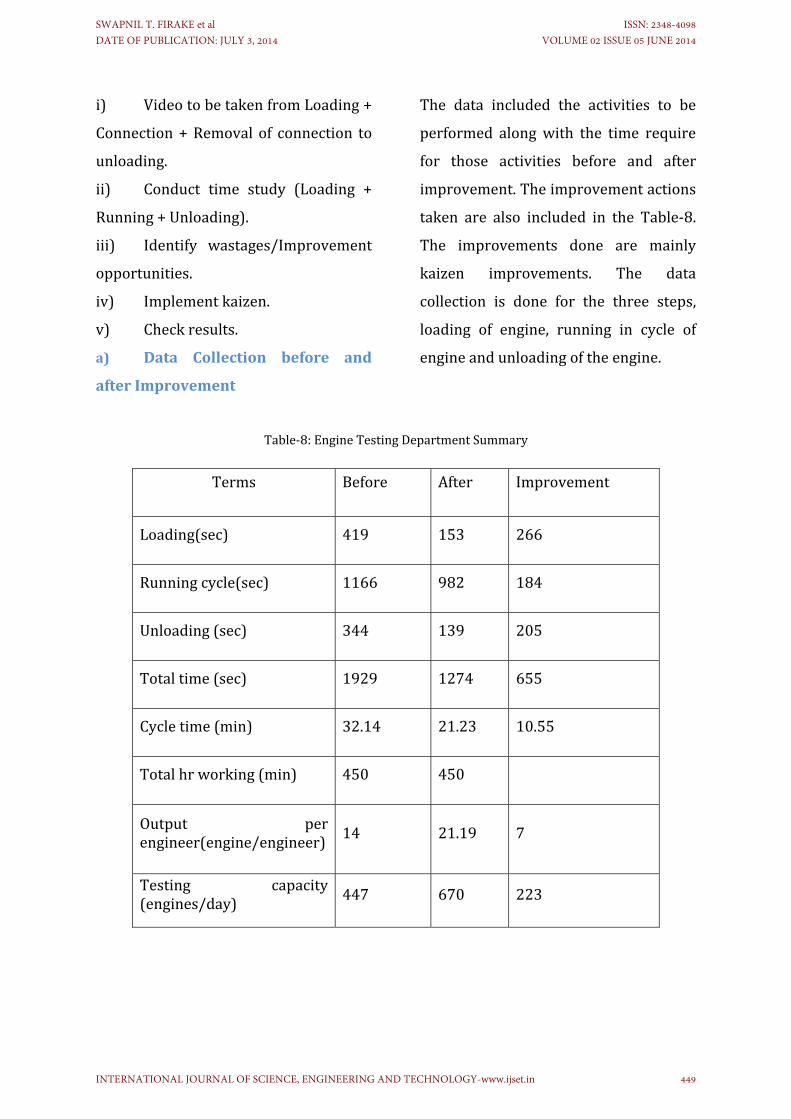
The data included the activities to be
performed alongwith the time require
for those activities before and after
improvement.Theimprovementactions
taken are also included in the Table‐8.
The improvements done are mainly
kaizen improvements. The data
collection is done for the three steps,
loading of engine, running in cycle of
engineandunloadingoftheengine.
Table‐8:EngineTestingDepartmentSummary
Terms Before After Improvement
Loading(sec) 419 153 266
Runningcycle(sec) 1166 982 184
Unloading(sec) 344 139 205
Totaltime(sec) 1929 1274 655
Cycletime(min) 32.14 21.23 10.55
Totalhrworking(min) 450 450
Output perengineer(engine/engineer) 14 21.19 7
Testing capacity(engines/day) 447 670 223
SWAPNIL T. FIRAKE et al DATE OF PUBLICATION: JULY 3, 2014
ISSN: 2348-4098 VOLUME 02 ISSUE 05 JUNE 2014
INTERNATIONAL JOURNAL OF SCIENCE, ENGINEERING AND TECHNOLOGY-www.ijset.in 449

b) DataAnalysisforObservations
BeforeandAftertheImprovements
Manpower required for 447
engines/day=2.8shifts/day.
Before required = 447/14= 32 TA
(approx.)
After required = 447/21.19 =21
TA(approx.)
Benefit it can be seen that, after the
improvements, required 11 Team
associates(TA)lessthanprevious.
Investmentfortest‐bedimprovement:
Per test cell investment (Rs. in lacs) =
Rs.0.5lacs.
Total test bed (11nos.) investment =
11×0.5=Rs.5.5lacs.
The required investment is regained
backwiththereductioninTA.
II. G600WIIIPDIDEPARTMENT
Thisisthelastdepartmentunderstudy.
This includes the per‐dispatch
inspectionofengine.Italsoincludesthe
addition of OK tags, markings, final
tappet setting, and applying anti‐rust.
The data collection, data analysis,
observations and data collection after
the improvements are the major steps
includedinthisstudy.
a) Data Collection and
Improvements
There are 10 Workstations, Operation‐
10 to Operation‐100. The following
Table‐9 shows time taken at various
workstations before and after
rebalancing and actions taken to
rebalancingthePDIline.
Table‐9:EnginePDIDepartmentSummary
WSNo.TimeRequired(sec)
ActionstakenBefore After
OP‐10 88 110 Linebalancedfor110sec
OP‐20 85 0 Retorquingeliminated
OP‐30 128 100 Motioneliminated
OP‐40 112 105 Motioneliminated
SWAPNIL T. FIRAKE et al DATE OF PUBLICATION: JULY 3, 2014
ISSN: 2348-4098 VOLUME 02 ISSUE 05 JUNE 2014
INTERNATIONAL JOURNAL OF SCIENCE, ENGINEERING AND TECHNOLOGY-www.ijset.in 450

OP‐50 100 100 ‐
OP‐60 135 101 Motioneliminated
OP‐70 135 106 PTOretorquingeliminated
OP‐80 132 103 Motioneliminated
OP‐90 70 102 Linebalancedfor110sec
OP‐100 105 109 Paint marking eliminated for oneplace
Figure4:TimestudyandTaktTime
Fig‐4showsthegraphforthetimestudy
for various workstations in PDI
department. It can be seen that, all the
workstations are balanced for the takt
time of 110 seconds. The operation‐20
is eliminated after the improvements
[8].
b) Observations after the
Improvements
i) Capacity improved to 270
engines/shiftfrom200engines/shift.
Percentage improvement = (270‐
200)/200×100
=35%improvement.
ii) Output per man is improved
from20nos.enginesto27nos.engine.
SWAPNIL T. FIRAKE et al DATE OF PUBLICATION: JULY 3, 2014
ISSN: 2348-4098 VOLUME 02 ISSUE 05 JUNE 2014
INTERNATIONAL JOURNAL OF SCIENCE, ENGINEERING AND TECHNOLOGY-www.ijset.in 451

iii) Additional 1750 nos. of engines
per month can be made in one shift
basisonly.
iv) With 200 nos. engines/shift, we
can run a single shift upto max. 5000
engines/month, but with 270 nos. of
engines/shift,wecanachieve6750nos.
of engines/month with optimum
manpower.
5. CONCLUSIONS
Thisisconcludedthattheassemblyline
balancingisoneofthemajorsteptobe
taken into consideration while
increasing productivity of automotive
industries. Line balancing is done with
taking in account the takt time, cycle
time and downtime and thus reduces
theproductionleadtimewithincreased
number of output engines. Continuous
improvement is the step to reduce
unnecessary downtime losses. The
productivity of engine assembly line is
thus found to be increased. The testing
department and PDI department also
have some non‐value‐added activities.
Thosearealsoreducedoreliminatedby
the kaizen improvements and 5'S'
changes and the operation are
rebalanced taking in account the takt
time. The productivity of both testing
andPDIdepartmentsisalsofoundtobe
increased. Thus lean manufacturing
concept when deployed increases the
productivity. The primary lean tools
used are kaizen improvements and the
5S implementation. By using line
balancing and Lean techniques,
practitioners can better calculate the
timeandeffortneededtocompletetheir
products or services, and also utilize
theirresourcestothefullesttoproduce
theoutputdemandedbythecustomer.
6. REFERENCES
[1] Abhishek Dwivedi, "An analysis
and development of software for
assembly line balancing problem of
manufacturing industry, " VSRD‐MAP,
vol.2(2),pp.74‐87,2012.
[2] DuarteF.Gomes,ManuelPereira
Lopes and Carlos Vaz de Carvalho, "
SeriousGames for LeanManufacturing:
The 5S Game, " IEEE, vol. 8, no. 4, pp.
191‐196,2013.
[3] DanielKitaw,AmareMatebuand
Solomon Tadesse , "Assembly line
balancingusingsimulationtechniquein
agarmentmanufacturingfirm,"Journal
ofEEA,vol.27,pp.69‐80,2010.
[4] JosteinPettersen, “DefiningLean
Production: Some Conceptual and
SWAPNIL T. FIRAKE et al DATE OF PUBLICATION: JULY 3, 2014
ISSN: 2348-4098 VOLUME 02 ISSUE 05 JUNE 2014
INTERNATIONAL JOURNAL OF SCIENCE, ENGINEERING AND TECHNOLOGY-www.ijset.in 452

Practical Issues,” The TQM Journal,
2009,vol.21,no.2,pp.127‐142.
[5] R.B.Breginski,M.G.CletoandJ.
L.SaasJunior,"AssemblyLineBalancing
using Eight Heuristics, " 22nd
Internatinal Conference on Production
Research.
[6] HudliMohd.RameezandDr.K.
H. Inamdar, “Areas of Lean
Manufacturing for Productivity
Improvement in a Manufacturing
Unit,” World Academy of Science,
Engineering and Technology, 2010, pp.
584‐587.
[7] P.M.RojasraandM.N.Qureshi,"
Performance Improvement through 5S
in Small Scale Industry: A case study, "
International Journal of Modern
EngineeringResearch,vol.3,issue3,pp.
1654‐1660,2013.
[8] Scholl. A, Balancing and
sequencing of assembly lines, 2nd ed.,
Physica,Heidelberg,pp.62‐63.
SWAPNIL T. FIRAKE et al DATE OF PUBLICATION: JULY 3, 2014
ISSN: 2348-4098 VOLUME 02 ISSUE 05 JUNE 2014
INTERNATIONAL JOURNAL OF SCIENCE, ENGINEERING AND TECHNOLOGY-www.ijset.in 453