Embed Size (px)
Citation preview

BART VAN ARK University of Groningen
DIRK PILAT University of Groningen
Productivity Levels in Germany, Japan, and the United States: DiJferences and Causes
THIS PAPER EXPLORES the comparative productivity performance in man- ufacturing of three countries-Germany, Japan, and the United States- since 1950.1 The productivity level estimates are based on the industry- of-origin approach, making use of detailed information from censuses of manufactures for each country. Comparative measures of sectoral produc- tivity levels have a vast array of applications in, for example, the study of structural change, technological progress, comparative advantage, and competitiveness and in the analysis of catch-up and convergence.
Since the late nineteenth century the United States has led the world economy in per capita income and productivity.2 Many countries, in par- ticular those in the Organization for Economic Cooperation and Devel- opment (OECD), have converged on the U.S. productivity level since World War II. It has been suggested frequently that the U.S. productivity
We are grateful to Nienke Beintema and Remco Kouwenhoven for assistance with data processing and to Martin Baily, Dale Jorgenson, Frank Lichtenberg, Angus Mad- dison, Mary O'Mahony, Peter Reiss, Karin Wagner, and participants in the June 1993 Microeconomics Panel Meeting for the Brookings Papers on Economic Activity for comments. We also acknowledge the McKinsey Global Institute, and in particular Hans Gersbach, for the advice we received on this research project during the past year. Bernt Gorzig, Heinrich Mortel, Norbert Raht, and Gerhard Stock kindly advised us concerning the data for Germany. We are also grateful to Tamisaburo Sasaki, Eiichi Tanabe, Kimio Uno, and Kazuhisa Yamane for their advice concerning the Japanese data. Edwin R. Dean and John Musgrave provided us with data on working hours and capital stock, respectively, in the United States.
1. "Germany" in this paper refers to the former Federal Republic of Germany. 2. See, for example, Abramovitz (1986); Baumol (1986); and De Long (1988).
1

2 Brookings Papers: Microeconomics 2, 1993
advantage has further eroded during the 1980s. Signs have also appeared that the United States might have lost its pioneering role in certain key technological areas during the past decade. Nevertheless, recent estimates of gross domestic product (GDP) per hour worked still show the United States ahead of its most important rivals.3
Here we focus on the comparative performance of one major sector of the economy, manufacturing. Despite the decreased importance of man- ufacturing in advanced countries in shares of output and employment, its role in the economy remains important, because the sector generates most technological innovations with important spillover effects to the rest of the economy. Moreover, the three countries considered in this paper con- tinue to play a major role in world production and trade of manufactured products. In 1988 Germany, Japan, and the United States accounted for as much as 35 percent of trade in manufactured goods among market economies.
This paper shows that the comparative productivity performance in manufacturing reflected the catch-up and convergence process for the economy as a whole for most of the postwar period. Apart from a brief interruption during the early 1980s, the manufacturing productivity gap between Japan and the United States continuously narrowed from 1950 to 1990, the latest year in our comparison. The German manufacturing pro- ductivity level relative to the United States also rose-although at a slower pace-during the first three decades after the Second World War, but the productivity gap between the two countries widened during most of the 1980s.
We begin with a brief review of the industry-of-origin method, which we used for our productivity comparisons, and a discussion of the results pertaining to unit value ratios, relative output, and productivity for six major manufacturing branches.4 The results for 1987, the year on which the comparisons are benchmarked, are then extrapolated over a period of
3. Among a wide range of studies focusing on comparative productivity performance at the level of the total economy, see Baumol, Blackman, and Wolff (1989); and Mad- dison (1987, 1991), which are particularly informative. For a review of issues concern- ing American technological leadership, see Lawrence (1984); Baily and Chakrabarty (1988); and Nelson and Wright (1992).
4. The six major branches more or less represent light industries (food, beverages, and tobacco; textiles, clothing, and leather products; other industries), heavy industries (chemicals, petroleum, rubber, and plastic products; basic and fabricated metals) and investment industries (machinery, electrical machinery, and transport equipment).

Bart van Ark and Dirk Pilat 3
four decades (1950 to 1990) by national time series on output and labor input. We then look more deeply into some of the factors that account for the productivity gap, such as differences in capital and skill intensity, the composition of the manufacturing sector, and the size distribution of man- ufacturing plants.
Estimating Comparative Productivity Levels in Manufacturing
The comparisons of sectoral output and productivity levels in this study are based on the industry-of-origin method, which involves com- parisons of real output in major sectors of the economy (agriculture, industry, and services) and of branches and industries within these broad sectors. This approach differs from the more widely used ex- penditure approach to level comparisons, which focuses on the expen- diture components of GDP (private consumption, investment, and government expenditure).5
In the first industry-of-origin studies, comparisons were frequently made by comparing physical quantities (tons, liters, units) of output of product items.6 As the number of product items increased and as the number of product varieties rose exponentially, arriving at a satisfactory coverage of output by physical quantity indicators became increasingly difficult. The alternative is to derive a specific conversion factor for each industry to convert the output value of all product items to a common currency.
Since 1983 a substantial research effort has been made at the Uni- versity of Groningen to develop the industry-of-origin approach as part of the International Comparisons of Output and Productivity (ICOP) project. Most ICOP studies so far deal with comparisons for the man-
5. See the results of the surveys conducted at regular intervals by the International Comparisons Project (ICP) since 1967 (for example, Kravis, Heston, and Summers, 1982) and the subsequent Penn World Tables (Summers and Heston, 1988, 1991), which were derived from the ICP estimates.
6. See, for example, Rostas (1948) on a comparison of manufacturing output and productivity between the United Kingdom and the United States from 1935 to 1939. For an extensive discussion of the alternative methods and procedures and an overview of studies based on the industry-of-origin approach, see van Ark (forthcoming).
4 Brookings Papers: Microeconomics 2, 1993
ufacturing sector, which now cover seventeen countries.7 Substantial progress has also been made in measuring comparative productivity performance in other sectors of the economy, including agriculture and services.8
The most solid basis for industry-of-origin comparisons is provided when all information for each country can be derived from the same primary source. For manufacturing the best source is the national census of production. It shows considerable detail on the output and input structure by industry as well as information on the sales value and quantities of specific products. For the United States we used the 1987 Census of Manufactures, which provides information on about 450 industries and 11,000 products.9 For Germany we made use of the Kostenstruktur der Unternehmen 1987, which is based on an annual survey. It includes some 175 industries, but only covers enterprises with twenty or more employees; enterprises with fewer than twenty employees are therefore excluded from our Germany-U. S. comparison. Product detail on Germany for some 6,000 items is taken from the Produktion im Produzierendes Gewerbe 1987. The basic source for Japan was the Census of Manufactures for 1987, which shows infor- mation for about 575 industries in the Report by Industries and for about 1,850 product items in the Report by Commodities. The latest year for which census or survey information is available in all three countries was 1987. For the adjustments for the hours worked per person, we made use of separate sources.10
Unit Value Ratios
Our currency conversion factors are based on unit value ratios (or UVRs)11 for comparable manufactured product items for two pairs of
7. These countries are Argentina, Australia, Brazil, Czechoslovakia, Ecuador, France, Germany (FRG and GDR), India, Indonesia, Korea, Japan, Mexico, the Neth- erlands, Spain, the United Kingdom, and the United States. See, for example, Maddison and van Ark (1988); Szirmai and Pilat (1990); and van Ark (1990, forthcoming).
8. See Maddison and Van Ooststroom (1993) for a comparison of agricultural output and productivity for thirteen countries. See Pilat (1993) for a total economy comparison based on sectoral estimates. See Mulder and Maddison (1993) for a detailed account of comparative productivity performance in distribution.
9. For data sources, see data appendix. 10. See appendix and tables A-3 and A-4 for sources. 11. Other studies use the term "purchasing power parity" instead of "unit value

Bart van Ark and Dirk Pilat 5
countries: Germany and the United States, and Japan and the United States. UVRs are preferable to official exchange rates. If the latter is used, one implicitly assumes that price levels between countries are the same for any item. Exchange rate conversions are therefore based on the "law of one price" and can be referred to as "nominal" output comparisons. In reality prices of one country can be relatively high for one item and relatively low for another compared with the prices of the other country. These variations are caused by a range of factors related to both demand and supply. For example, the price of factor inputs may differ because of differences in factor mobility or production tech- niques. Protection or trade barriers may cause a lack of competitiveness in one country compared with the other. Or sectoral demand patterns may differ between countries. Furthermore, the exchange rate itself has been increasingly affected in recent years by capital movements and speculation on the currency markets.
For comparisons of real output, price comparisons are required for separate items. We obtained the unit values from the production cen- suses by dividing the total ex-factory sales value for reported items by their corresponding quantities and deriving unit value ratios for products that could be matched between countries.
This method is fundamentally different from the specification pricing technique of International Comparison Project expenditure studies. Our unit values have a quantity counterpart, and quantities times prices always equal the value equivalent. There are two ways in which other scholars have used expenditure-based purchasing power parities (PPPs) for sectoral productivity analysis. Some studies have applied expendi- ture GDP PPPs to sectors. 12 Others have used expenditure PPPs with a specific sectoral content, which we call "proxy PPPs."13
Expenditure PPPs are suitable for analyzing real output and produc- tivity at the total economy level, but for sectoral analysis they may lead to considerable biases. First, expenditure-based PPPs include prices of imports, but not of exports.'4 Second, the expenditure prices include
ratio." These two terms are interchangeable, but the latter term expresses more clearly the nature of our "price" information.
12. Dollar and Wolff (1988; 1993). 13. Hooper and Larin (1989); Jorgenson, Kuroda, and Nishimizu (1992). 14. For Japan several studies have documented the different behavior of domestic
and export prices; see, for instance, Ohno (1989); and Marston (1990).
6 Brookings Papers: Microeconomics 2, 1993
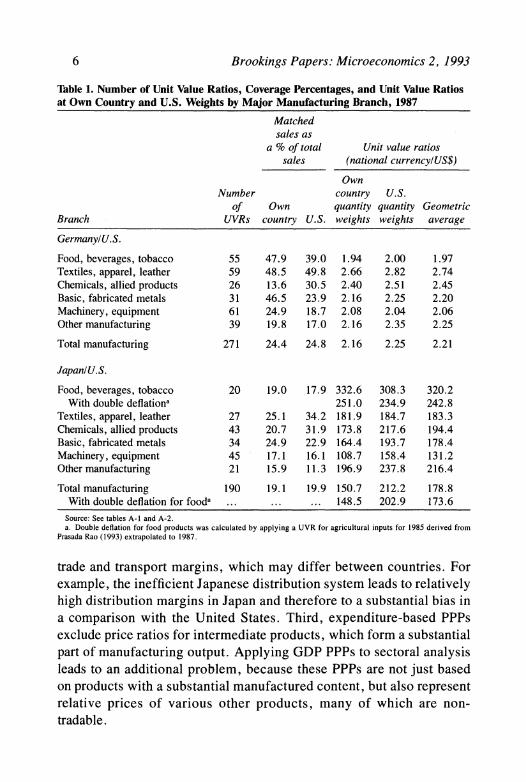
Table 1. Number of Unit Value Ratios, Coverage Percentages, and Unit Value Ratios at Own Country and U.S. Weights by Major Manufacturing Branch, 1987
Matched sales as
a % of total Unit value ratios sales (national currencyl US$)
Own Number country U.S.
Of Own quantity quantity Geometric Branch UVRs country U.S. weights weights average
GermanylU.S.
Food, beverages, tobacco 55 47.9 39.0 1.94 2.00 1.97 Textiles, apparel, leather 59 48.5 49.8 2.66 2.82 2.74 Chemicals, allied products 26 13.6 30.5 2.40 2.51 2.45 Basic, fabricated metals 31 46.5 23.9 2.16 2.25 2.20 Machinery, equipment 61 24.9 18.7 2.08 2.04 2.06 Other manufacturing 39 19.8 17.0 2.16 2.35 2.25
Total manufacturing 271 24.4 24.8 2.16 2.25 2.21
Japan/U.S.
Food, beverages, tobacco 20 19.0 17.9 332.6 308.3 320.2 With double deflationa 251.0 234.9 242.8
Textiles, apparel, leather 27 25.1 34.2 181.9 184.7 183.3 Chemicals, allied products 43 20.7 31.9 173.8 217.6 194.4 Basic, fabricated metals 34 24.9 22.9 164.4 193.7 178.4 Machinery, equipment 45 17.1 16.1 108.7 158.4 131.2 Other manufacturing 21 15.9 11.3 196.9 237.8 216.4
Total manufacturing 190 19.1 19.9 150.7 212.2 178.8 With double deflation for fooda ... ... ... 148.5 202.9 173.6
Source: See tables A-I and A-2. a. Double deflation for food products was calculated by applying a UVR for agricultural inputs for 1985 derived from
Prasada Rao (1993) extrapolated to 1987.
trade and transport margins, which may differ between countries. For example, the inefficient Japanese distribution system leads to relatively high distribution margins in Japan and therefore to a substantial bias in a comparison with the United States. Third, expenditure-based PPPs exclude price ratios for intermediate products, which form a substantial part of manufacturing output. Applying GDP PPPs to sectoral analysis leads to an additional problem, because these PPPs are not just based on products with a substantial manufactured content, but also represent relative prices of various other products, many of which are non- tradable.

Bart van Ark and Dirk Pilat 7
The price comparisons underlying our own calculations could not be obtained for all product items. First, the description of the products in the production censuses often differed. For example, the production of bricks may be specified in cubic meters in one country and in tons in the other country. In some cases, expert information from industry sources provided a way out of these problems, but in other instances the product match could not be made. Second, the censuses do not report on sales values or quantities for some products, generally because to do so would breach confidentiality. Third, certain products have a unique character and are produced only in one country and not in the other (for example, supertankers in Japan and space aircraft in the United States). Fourth, and probably most important, many products cannot be matched because they represent different qualities in terms of product mix or content.
Table 1 shows that we obtained 271 unit value ratios for the Ger- many-U.S. comparison, which are based on 24.4 percent of total man- ufacturing shipments in Germany and 24.8 percent in the United States. Coverage was slightly lower in the Japan-U.S. comparison, for which we made 190 matches covering 19 to 20 percent of manufacturing sales.
Mainly because of differences in product mix and product quality, our coverage percentages are relatively low in branches such as ma- chinery and transport equipment. Recently, the McKinsey Global In- stitute scrutinized our UVRs for nine industries (audio and video equip- ment, beer, computers, food products, iron and steel, machine tools, passenger cars, car parts, and soap and detergents) to assess the extent to which differences in product mix and product quality affected the comparisons. For three industries (computers, machine tools, and motor vehicles) substantial adjustments were made to the original product UVRs we use here, but the assessment found no clear evidence of a systematic bias in our UVRs across industries. 1 In branches that in- clude products with fewer quality and mix differences between coun- tries (for example, textiles, paper and wood products, nonmetallic min-
15. McKinsey Global Institute (1993). For example, in the comparison between Japan and the United States, our UVR for passenger cars was adjusted upward to allow for the smaller size of Japanese cars, but that adjustment was partly offset by an adjust- ment for the better quality of Japanese cars. McKinsey also obtained substantially different industry PPPs for food products, but these were derived from ICP expenditure PPPs adjusted for distribution margins and indirect taxes rather than taken directly from the census.
8 Brookings Papers: Microeconomics 2, 1993
erals, and basic metals), the margin of uncertainty of our UVRs is much smaller. These branches represent one third to half of manufacturing output in all three countries. On the whole we judge our UVRs to be sufficiently robust at the level of the six major manufacturing branches, which we analyze below. 16
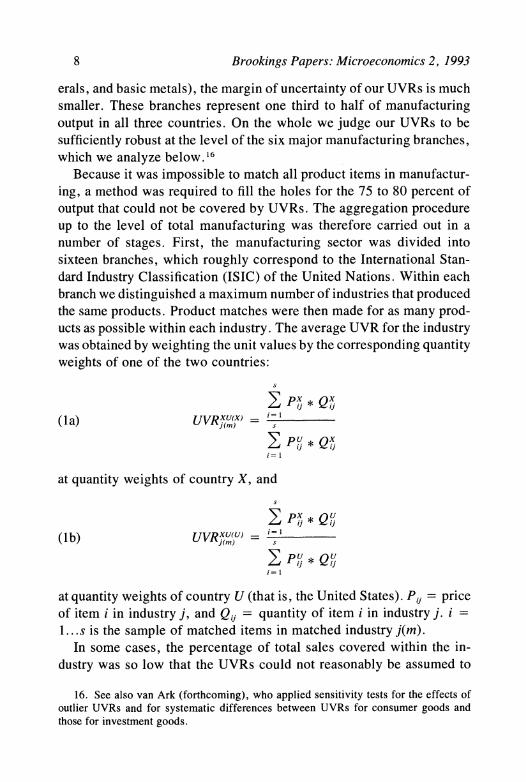
Because it was impossible to match all product items in manufactur- ing, a method was required to fill the holes for the 75 to 80 percent of output that could not be covered by UVRs. The aggregation procedure up to the level of total manufacturing was therefore carried out in a number of stages. First, the manufacturing sector was divided into sixteen branches, which roughly correspond to the International Stan- dard Industry Classification (ISIC) of the United Nations. Within each branch we distinguished a maximum number of industries that produced the same products. Product matches were then made for as many prod- ucts as possible within each industry. The average UVR for the industry was obtained by weighting the unit values by the corresponding quantity weights of one of the two countries:
pX * QX (la) UVRuX(x) =- _
EpU* QX
at quantity weights of country X, and
> PiXj * QU (I b) UVRx(U) - l
at quantity weights of country U (that is, the United States). Pij = price of item i in industry j, and Qij = quantity of item i in industry j. i =
1.. .s is the sample of matched items in matched industry j(m). In some cases, the percentage of total sales covered within the in-
dustry was so low that the UVRs could not reasonably be assumed to
16. See also van Ark (forthcoming), who applied sensitivity tests for the effects of outlier UVRs and for systematic differences between UVRs for consumer goods and those for investment goods.

Bart van Ark and Dirk Pilat 9
represent the whole industry. In Japan, at least 25 percent of total sales were matched in thirty-seven industries, whereas in Germany thirty-six industries met this criterion. These industries represented about 40 to 50 percent of total value added in manufacturing. For industries in which less than 25 percent of output was matched, or in which no matches were made at all, the quantity-weighted UVR of all matched items in a branch was assumed to be representative of the unknown UVR of the nonmatched industries in that branch.
The second stage of aggregation from industry to branch level was made by weighting the UVRs for gross output, UVRgO, as derived above, by the value added, VA, of each industry in country X or country U:
> [UVRx,u'u * VAu]
(2a) UVRxU(U) = j=1 VAu
for the UVR of branch k at quantity weights of country U, and
(2b) UVRxU(X) = VAk
E [VAX I UVRx,ux'] j= 1
for the UVR of branch k at country X's quantity weights. In the final stage, branch UVRs were weighted at branch value added to obtain a UVR for total manufacturing.
This aggregation by stages using either quantities (in the first stage from product to industry level) or value added (in the following stages) has the advantage that the original product UVRs are successively re- weighted according to their relative importance in the aggregate. As a result our aggregate UVRs are less sensitive to outlier UVRs.
The last three columns of table 1 show the UVRs at own country and U.S. weights and at their geometric (Fisher) average. The UVRs weighted at U.S. quantity weights are higher than the UVRs at local weights because of the "Gerschenkron" effect. In the remainder of this paper, we base our results on the geometric (Fisher) average of the UVRs, which stands out relatively well in terms of certain index number properties.17 Furthermore, an important advantage of binary compari-
17. For example, in contrast to the Paasche and Laspeyres indexes, the Fisher index
10 Brookings Papers: Microeconomics 2, 1993
sons is that the weights that are applied are the most "country charac- teristic.''
It is clear from table 1 that, on the whole, the Fisher UVRs are substantially above the official exchange rates of 1.80 deutsche marks (DM) to the U.S. dollar and 144.6 yen to the U.S. dollar in 1987. This is in line with our expectations because of the relatively low exchange value of the U.S. dollar in that year.
The UVR for food manufacturing in Japan is most out of line with the average UVR. To a large extent that is attributable to the relatively highly priced agricultural inputs in this sector in Japan. Because we used our UVRs at value added level (see below), we considered it desirable to adjust the food products UVRgo for Japan for the relatively high prices of intermediate inputs in that sector. We used a price ratio of 825 yen to the U.S. dollar for agricultural inputs to adjust the output UVR for food products using input shares from the Japanese and U.S. input-output tables for 1987. This pro- cedure reduced the UVR for food products, beverages, and tobacco from 320 yen to 243 yen to the dollar. 18
We did not make separate unit value comparisons for intermediate inputs for the other branches. Even if quantity and value information for intermediate inputs were available (which is rarely the case), double de- flation (that is, deflating output and intermediate inputs separately) easily leads to volatile and improbable results, particularly when intermediate inputs make up a large part of gross output or when the input-output structure differs greatly between countries. Our method in using output UVRs to convert value added by industry is referred to as the "adjusted
satisfies the country reversal test (that is, changing the denominator and numerator does not alter the results) and the factor reversal test (that is, a Fisher price index times a Fisher quantity index gives a Fisher value index). In addition, Diewert (1981) stressed some economic theoretic properties of the Fisher index, one of them being that it is a "superlative" index number. Other studies on international comparisons, for example, the expenditure-based comparisons of the International Comparisons Project, have used multilateral weighting schemes to obtain PPPs that are transitive for more than two countries and that are independent of the base country chosen. For a comparison of three countries with fairly similar output structures in manufacturing, however, multilateral- ization changes the results only marginally. See Pilat and Prasada Rao (1991) for the use of multilateralization methods for our ICOP comparisons.
18. See Prasada Rao (1993) for the latest measures of agricultural PPPs based on prices paid to farmers.

Bart van Ark and Dirk Pilat 11
single indicator" method and, in general, can be accepted as sufficiently robust for the purpose. '9
Benchmark Comparisons of Value Added and Labor Productivity
A major feature of our approach is that the comparisons of real output and productivity are derived simultaneously with the UVRs, because the information is taken largely from the same source or from directly related sources.
In this study we focus on comparisons of value added derived from production censuses. The "census concept" of value added is some- what broader than the definition commonly used in the national ac- counts. The census concept is defined as gross value of output minus the cost of raw materials, packaging, energy inputs, and contract work. Under this definition, value added still includes the value of purchased industrial and nonindustrial services (including repair and maintenance, advertising, and accountancy). In fact, these services are not even re- ported in the U.S. and Japanese production censuses, but information from input-output tables shows that the share of services in total inter- mediate inputs in manufacturing does not differ much between these countries. 0
Some authors have argued that for sectoral comparisons it would be desirable to measure gross output instead of value added, because, for an analysis of competitiveness or technological supremacy, one should take into account not only the relative level of labor and capital (which together constitute value added) but also the relative level of interme-
19. See Paige and Bombach (1959); Szirmai and Pilat (1990) show a test of double- deflated versus single-deflated output for their Japan-U.S. comparison for 1975.
20. In 1987 purchased services accounted for 25.6 percent of intermediate inputs in U.S. manufacturing (U.S. Dept. of Commerce, Survey of CurrentBusiness, April 1992). The corresponding percentage was 23.8 for Japan (MITI, 1987 Input-Output Tables, Tokyo) and 25.9 for Germany (Statistische Bundesamt, Input-Output Tabellen, 1985 bis 1988, Wiesbaden). It should be emphasized that our estimates for Germany are based on census information for legal units (enterprises) and not on an activity basis, as they are in the input-output tables. According to the German census, the share of service inputs in total intermediate inputs is 18.6 percent. Germany is generally known for its relatively small share of outsourcing of service activities. See, for example, Ockel and Schreyer (1988).

12 Brookings Papers: Microeconomics 2, 1993
diate inputs.2' Measuring the effect of intermediate inputs on the com- parative productivity performance separately requires a detailed account of intermediate inputs (including their prices-which are not the same as the output prices of corresponding products-and quantities). Such detail is difficult to obtain in practice and is very sensitive to the mea- surement procedure explained above. Furthermore, gross output in- volves a good deal of double counting of output that is used as an intermediate input elsewhere, and that double counting complicates the aggregation of the industry and sectoral results to total GDP. Hence, with our focus on value added rather than gross output, we do not treat differences in efficiency related to the use of intermediate inputs as a separate explanatory factor in our analysis.
Our employment figures refer to the total number of employees on the payroll of the manufacturing units. This also includes employees in so-called auxiliary units, which are establishments at a different loca- tion from the producing units, but which perform a direct supporting function, such as administration, research and development, or mar- keting. These units were not included in Japan's census, but we added them, using information from the 1986 Establishment Census of Japan. Apparently, the number of employees in auxiliary units was substan- tially higher in Japan than in the United States, accounting for about 14.5 percent of total manufacturing employment in Japan, compared with 6.5 percent in the United States.22
Total labor input was also adjusted for differences in the number of hours each employee worked. In 1987 manufacturing employees worked an average of 1,909 hours in the United States, 1,630 in Ger- many, and 2,161 in Japan. These estimates refer to "actual hours," which are paid hours adjusted downward to exclude hours not worked because of holidays, vacation, sickness, and the like. The longer hours
21. See, for example, Jorgenson, Gollop, and Fraumeni (1987). Ideally, such com- parisons should be made within the framework of an input-output table that shows all transfers of output from one sector to another and that simultaneously derives expendi- ture, gross output, and value added. To make this approach work, however, one needs to apply representative prices and quantities to all cells in the matrix. As we showed above, separate UVRs for intermediate inputs are very hard to obtain in practice. More- over, in using input-output tables, one loses one of the fundamental advantages of census material-the direct link between output and labor input information.
22. We had no separate figures on auxiliary units in Germany, but they were included in the total.

Bart van Ark and Dirk Pilat 13
Table 2. Comparison of Value Added, Value Added per Employee, and Value Added per Hour Worked by Major Manufacturing Branch, 1987 U.S. = 100
Value Value added added
Value per per hour Branch added employee worked
GermanylU.S.a
Food, beverages, tobacco 20.2 66.8 69.2 Textiles, apparel, leather 17.9 73.2 87.2 Chemicals, allied products 28.9 58.9 70.6 Basic, fabricated metals 33.2 69.8 86.0 Machinery, equipment 40.7 72.4 86.0 Other manufacturingb 15.8 69.9 79.1
Total manufacturing 28.2 70.2 82.2
Japan/U.S.
Food, beverages, tobacco 23.4 28.4 25.2 With double deflation for food 30.9 37.4 33.3
Textiles, apparel, leather 50.5 64.4 56.4 Chemicals, allied products 46.1 80.1 75.8 Basic, fabricated metals 63.5 91.6 82.0 Machinery, equipment 81.8 106.7 93.2 Other manufacturingb 29.5 57.7 50.0
Total manufacturing 49.7 74.2 65.6 With double deflation for food 51.2 76.4 67.5
Source: See table I and tables A-3 and A-4. All estimates are based on the geometric average of the UVRs at own country weights and at U.S. weights from table 1.
a. The Germany-U.S. comparison excludes units with fewer than twenty employees. b. The Germany-U.S. comparison for other manufacturing excludes publishing.
in Japan reflect both more paid hours and shorter holidays. Paid hours of employees in Germany and the United States are some 300 hours a year less than in Japan. Relatively long holidays are the main reason for shorter working time in Germany compared with the United States.
The first column in table 2 shows comparisons of value added for Germany and Japan with that in the United States for 1987. It appears that manufacturing value added was about half that of the United States in Japan, and just over a quarter of the U.S. level in Germany. In both Germany and Japan the real output in U.S. dollars in basic metals and metal products and in machinery and transport equipment is relatively large compared with the other branches.

Table 3.
Annual
Compound
Growth
Rates of
Real
Value
Added
and
Real
Value
Added
per
Hour by
Major
Manufacturing
Branch,
1950-90
Real
value
added
Real
value
added/hour
1950-
1965-
1973-
1979-
1950-
1965-
1973-
1979-
Branch
1965a
1973
1979
1990
1965a
1973
1979
1990
Germany Food,
beverages,
tobacco
7.42
1.97
1.74
-0.65
5.74
2.80
3.51
0.79
Textiles,
apparel,
leather
7.45
-0.48
-1.03
-1.41
7.29
3.24
4.80
2.89
Chemicals,
allied
products
12.09
9.29
2.24
0.79
8.20
8.03
3.98
0.33
Basic,
fabricated
metals
7.91
3.26
0.90
0.64
5.24
4.60
4.38
1.89
Machinery,
equipment
12.01
5.38
2.67
2.37
6.42
4.52
4.67
2.25
Other
manufacturing
8.20
4.37
0.57
0.02
6.29
5.22
3.54
1.36
Total
manufacturing
9.38
4.60
1.70
1.02
6.53
5.11
4.44
1.80
Japan Food,
beverages,
tobacco
6.17
9.03
2.06
0.71
3.11
10.06
2.23
-0.07
Textiles,
apparel,
leather
10.77
7.63
1.79
0.78
8.05
7.36
4.34
1.42
Chemicals,
allied
products
20.12
13.89
3.80
5.36
-13.88
12.04
5.69
3.99
Basic,
fabricated
metals
15.29
18.30
1.65
2.90
7.95
14.85
4.82
2.20
Machinery,
equipment
23.25
16.79
6.77
10.93
14.10
12.80
9.07
7.96
Other
manufacturing
14.89
11.22
1.94
3.82
10.50
9.72
3.66
4.47
Total
manufacturing
13.05
13.03
3.35
5.88
7.75
11.04
5.42
4.88
United
States
Food,
beverages,
tobacco
2.83
3.56
1.86
0.44
3.17
4.32
2.13
0.58
Textiles,
apparel,
leather
2.78
2.91
1.46
0.44
3.27
2.77
3.78
2.65
Chemicals,
allied
products
5.53
5.78
2.90
3.41
3.37
3.51
1.28
3.32
Basic,
fabricated
metals
2.57
2.62
-0.69
-1.48
1.45
1.67
-0.59
1.05
Machinery,
equipment
5.48
3.86
2.65
3.82
2.46
2.52
1.12
4.47
Other
manufacturing
3.62
3.87
1.80
1.88
2.77
2.68
0.96
1.46
Total
manufacturing
3.96
3.78
1.79
2.18
2.76
2.81
1.27
2.82
Source:
See
sources in
data
appendix.
a.
1955-65
for
Japan;
the
1950-65
growth
rate
for
total
manufacturing is
13.9
percent
for
GDP
and
8.5
percent
for
real
value
added
per
hour.

Bart van Ark and Dirk Pilat 15
The second and third columns of table 2 show the corresponding ratios of labor productivity for the two comparisons on the basis of either employees or hours worked. Productivity performance relative to the United States appears to vary considerably between the major branches. Value added per hour worked in German manufacturing ranges from 69 to 87 percent of the U.S. level, but in Japan it ranges from 25 to 93 percent. Even after correcting for the high prices of agricultural inputs, productivity in food products, beverages, and to- bacco remains the major outlier at only 33 percent of the U.S. produc- tivity level. Japan, however, was close to the U.S. productivity level in basic metals and metal products and in machinery and equipment.
Trends in Comparative Labor Productivity
The 1987 benchmark results for labor productivity were extrapolated on the basis of national time series for real output and labor input. Table 3 shows the annual compound growth rates of value added and labor productivity from 1950 to 1990. It appears that throughout the postwar period, Japan showed the fastest growth of output and productivity for manufacturing as a whole, although it experienced a serious setback during the second half of the 1970s, when productivity growth fell from 11.0 percent a year in the earlier period to only 5.4 percent. Japanese growth was especially rapid in the investment goods sector, and the slowdown of productivity growth during the 1970s was also less in that branch than in the others (from 12.8 percent in 1965-73 to 9.1 percent in 1973-79).
In Germany growth slowed throughout the period, but the setback was particularly large during the 1980s, when the average productivity growth rate for total manufacturing was only 1.8 percent a year, and even lower in food products (0.8 percent) and chemicals (0.3 percent).
U.S. productivity growth in manufacturing was slower than in the other two countries, until the 1980s, when the growth rate recovered, especially in chemicals and machinery and equipment.23 U.S. produc- tivity growth in these latter branches was much faster than in Germany
23. Especially between 1979 and 1982, the United States experienced a strong decline in manufacturing output. The compound productivity growth rate from 1973 to 1982 was slightly negative at - 0.09 percent a year.

16 Brookings Papers: Microeconomics 2, 1993
during the last decade, a fact which underlies the diverging trend in the comparative productivity performance between the two countries.
Before discussing the comparative productivity levels, we need to look briefly at the consistency of the national accounts series of man- ufacturing real output in the three countries. Gordon and Baily attrib- uted part of the estimated gain of U.S. manufacturing output compared with Germany and Japan (and also with France and the United King- dom) to the use of 1982 fixed weights in the U.S. national accounts in combination with a more rapidly decreasing price trend in computers.24 Elsewhere we experimented with the U.S. GDP series, where instead of fixed weights, we used shifting base year weights for subperiods of five years.25 The latter is common practice in the national accounts of Germany and Japan. We found that compared with the German and Japanese series, the U.S. growth rates were particularly affected by the fixed weight system from 1987 onward. For the latter period, we there- fore linked the recently published 1987 fixed weight series to the 1982 fixed weight series for the previous period.
The use of a hedonic price index for computers led to a relatively rapid increase of U.S. real output in machinery and equipment, espe- cially between 1982 and 1985. The U.S. deflator for this branch, which could be implicitly derived from the national accounts, showed a de- crease of one-third in only three years.26 Hedonic price indexes consider products as a bundle of quality characteristics, each representing a price premium that is derived by regression analysis. They differ from con- ventional price indexes, which are based on "matched models," a procedure that is difficult to implement in the rapidly changing com- puter industry. Although hedonic price indexes are not explicitly used for the deflation of computer output in the national accounts of Germany and Japan, the deflator for office machinery in Germany and for elec- trical machinery (which includes computers) in Japan both show a sig- nificant price drop. Although it would be desirable if other countries would follow the U.S. practice of using the hedonic pricing technique
24. See Gordon and Baily (1991). They also discuss the puzzle of the limited effect that the rise in computer output appears to have had on the growth of U.S. nonmanu- facturing output. See also Baily and Gordon (1988); and Denison (1989).
25. Van Ark (forthcoming). 26. After 1985 the deflator for machinery and equipment declined less rapidly, in
particular when using 1987 weights from 1987 onward. See Young (1989); and Sinclair and Catron (1990).

Bart van Ark and Dirk Pilat 17
Table 4. Comparison of Value Added per Hour Worked in Major Manufacturing Branches, 1950-90 U.S. = 100
Branch 1950a 1965 1973 1979 1990
GermanylU.S.
Food, beverages, tobacco 53.1 76.9 68.4 74.1 75.8 Textiles, apparel, leather 44.0 78.1 81.0 85.9 88.2 Chemicals, allied products 32.4 64.3 90.5 106.0 76.7 Basic, fabricated metals 30.9 53.6 67.2 90.1 98.8 Machinery, equipment 43.7 77.1 90.0 110.7 87.6 Other manufacturing 34.2 56.6 68.8 80.1 79.3
Total manufacturing 38.9 66.7 79.7 95.8 85.9
Japan/U.S.
Food, beverages, tobacco 26.7 25.8 39.5 39.8 37.0 Textiles, apparel, leather 24.7 37.5 53.2 54.9 48.0 Chemicals, allied products 13.0 32.1 60.4 78.0 83.8 Basic, fabricated metals 12.5 23.1 61.4 84.3 95.6 Machinery, equipment 8.0 23.5 50.6 79.6 114.4 Other manufacturing 9.7 20.0 34.0 39.8 54.9
Total manufacturing 16.6 26.6 49.2 62.6 77.9 Source: See tables 2 and 3. a. 1955 for Japan.
for products whose quality characteristics change rapidly, we do not expect that our main facts on the changes in comparative productivity performance over time, as presented below, would change significantly.
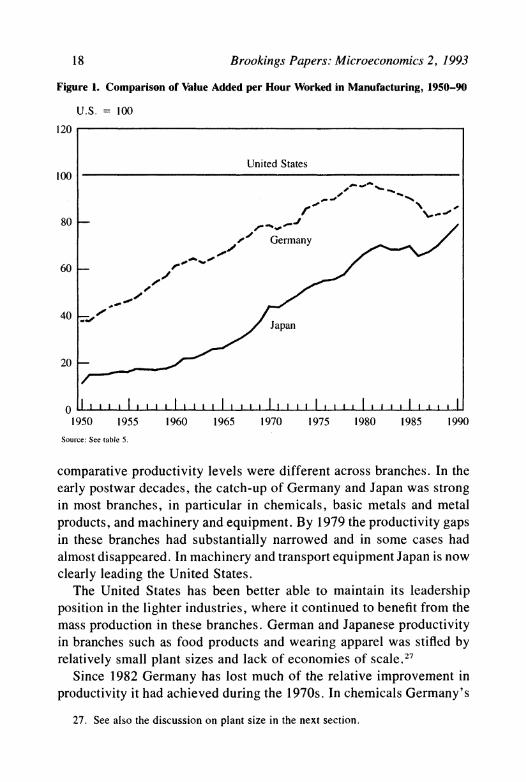
The time series for real output and labor input in total manufacturing and for the major branches from 1950 to 1990 were linked to the benchmark estimates of relative productivity levels for 1987 to obtain trends of comparative productivity levels. Table 4 and figure 1 show that until the early 1980s both Japan and Germany converged rapidly on the U.S. manufacturing labor productivity level. By the beginning of the 1980s, Germany had almost the same productivity level as the United States. Since then Germany has begun to fall behind, although a slight recovery took place between 1987 and 1990. Although the Japanese comparative productivity level also stagnated during the first half of the 1980s, it clearly returned to the catch-up track thereafter. Since 1985 the productivity gap between Germany and Japan has de- creased very rapidly.
Table 4 and figure 2 show that the dynamics of the changes in
18 Brookings Papers: Microeconomics 2, 1993
Figure 1. Comparison of Value Added per Hour Worked in Manufacturing, 1950-90
U.S. 100
120
United States 100
80
60
40 ., 40 / ~~~~~~~~Japan
20
o 1 ,. 1 , j I I .1 I,,, I ,I , 1 1 . 1 I l 1- , I I .,1 . I I ,- , I 1950 1955 1960 1965 1970 1975 1980 1985 1990
Source: See table 5.
comparative productivity levels were different across branches. In the early postwar decades, the catch-up of Germany and Japan was strong in most branches, in particular in chemicals, basic metals and metal products, and machinery and equipment. By 1979 the productivity gaps in these branches had substantially narrowed and in some cases had almost disappeared. In machinery and transport equipment Japan is now clearly leading the United States.
The United States has been better able to maintain its leadership position in the lighter industries, where it continued to benefit from the mass production in these branches. German and Japanese productivity in branches such as food products and wearing apparel was stifled by relatively small plant sizes and lack of economies of scale.27
Since 1982 Germany has lost much of the relative improvement in productivity it had achieved during the 1970s. In chemicals Germany's
27. See also the discussion on plant size in the next section.

Bart van Ark and Dirk Pilat 19
Figure 2. Comparison of Value Added per Hour Worked by Major Branch, 1950-90
A. Food, beverages, tobacco B. Textiles, apparel, leather U.S.= I00 U.S. = 100
120 120 United States United States
100 100 Germany Germany
80 - G | 80 - ^
60 - 60-
40 Japan 40 -Japan
20 20 'O O 1950 55 60 65 70 75 80 85 1990 1950 55 60 65 70 75 80 85 1990
C. Chemicals, allied products D. Basic, fabricated metals U.S. = 100 U.S. = 100
120 120 United States United States
100 100
80 - 80 -
Germany, 60 - 60- Germany -
40 /~40 -
20 Japa 2 Japan 20 -i I I 1 20I - J
1950 55 60 65 70 75 80 85 1990 1950 55 60 65 70 75 80 85 1990
E. Machinery and equipment F. Other manufacturing U.S. = 100 U.S. = 100
120 120 United States ,d United States
100 100
80 Germany / 80 G
60 - ~~~~~~~~60-
40 -40 - Japan
20 - Ja 20
O II <1 I . I I I 1. 1 o I r0 I I I I I 1950 55 60 65 70 75 80 85 1990 1950 55 60 65 70 75 80 85 1990
Source: See table 4.

20 Brookings Papers: Microeconomics 2, 1993
Table 5. Comparison of Value Added per Hour in Manufacturing and the Total Economy, 1950-90 U.S. = 100
Sector 1950 1960 1973 1979 1990
Germany Total economy 27.6 42.0 59.0 69.6 75.2 Manufacturing 38.9 61.6 79.7 95.8 85.9
Japan Total economy 12.6 17.2 39.8 45.0 55.0 Manufacturing 11.8 19.5 49.2 62.6 77.9
Source: See table 4 for manufacturing estimates. For total economy, GDP (in national currencies) and employment 1960 to 1990 from OECD. NationalAccounts Main Aggregates, various issues; and OECD. LaborForce Statistics. Total economy for 1950 and hours for the whole period from Maddison (1982, 1990). Hours for 1990 refer to 1985. In accordance with our manufacturing estimates, the total economy figures are converted to U.S. dollars with Fisher PPPs for 1985 (provided by EUROSTAT).
comparative productivity performance in 1990 was much worse than in the early 1970s, and the productivity gap also widened in machinery and transport equipment. In 1990 Germany had productivity levels close to those of the United States only in textiles and in basic metals and metal products.
Summarizing, we conclude that although the United States is clearly still the productivity leader, its position is more secure in light industries than in heavy and investment industries. For manufacturing as a whole, we can speak of a "shared leadership" between Japan and the United States. It is unlikely that Japan will be able to converge on the U.S. productivity level in all branches of manufacturing in the near future. Germany does not appear to be a participant in this "leadership con- test." Since the beginning of the 1980s, Germany's comparative pro- ductivity level by branch has either remained stable or diverged from the U.S. level. Furthermore, by the end of the 1980s, Germany's pro- ductivity performance was better than Japan's only in light industries.
One specific point of interest is how the comparative productivity results in this paper compare with studies for the economy as a whole. The catch-up of OECD countries, including Germany and Japan, to U.S. per capita income and productivity levels has been extensively documented by various scholars,28 but so far the role of the individual sectors has received less attention. Table 5 compares the relative pro- ductivity ratio for the economy as a whole with that for manufacturing.
28. For instance, Abramovitz (1986); Baumol (1986); and Maddison (1982, 1991).

Bart van Ark and Dirk Pilat 21
It is clear that throughout the postwar period the catch-up process for manufacturing reflected the pattern for the economy as a whole. Only the relative productivity performance of German manufacturing during the 1980s did not conform to this pattern: whereas the productivity gap between Germany and the United States for the economy as a whole was smaller in 1990 than in 1979, the manufacturing productivity gap widened during this period.29
Throughout the period both Germany and Japan showed a better productivity performance relative to the United States in manufacturing than for the economy as a whole. The productivity gap in manufacturing also narrowed more rapidly than for the total economy in both countries. Manufacturing therefore was one of the driving forces behind the catch- up and convergence process in the first three decades after World War II. Except for a few years of stagnation at the beginning of the 1980s, the manufacturing sector in Japan continued to contribute to the catch- up process for the economy as a whole.30 However, this process came to a virtual standstill in German manufacturing. Which forces account for the ongoing process of catch-up in value added per hour worked in the nonmanufacturing part of the German economy is an intriguing issue that goes beyond the scope of this paper. In the next section we address in more detail the factors that account for the productivity gaps in manufacturing.
The Causes of the Productivity Gaps
Estimates of labor productivity can be referred to as "single factor productivity" or "partial productivity." They measure the output per unit of labor input, which after an adjustment for differences in hours worked and labor force participation rates, can be converted into com- parative measures of per capita income. Sectoral estimates of labor productivity also make it possible to search for the factors that account for productivity gaps.
29. Van Ark (forthcoming) records a similar pattern in three other West European countries-France, the Netherlands, and the United Kingdom-as in Germany, but in none of these other countries was the widening of the manufacturing productivity gap as big as in Germany.
30. See Pilat (1993) for more details on the contribution of sectoral growth to overall performance of the Japanese economy.

22 Brookings Papers: Microeconomics 2, 1993
In the "level accounting" approach that we develop in this section, the contribution to the productivity gap of differences in capital inten- sity and labor quality is analyzed in detail. We also look at the effect of differences in the branch composition of manufacturing employment and the size of manufacturing plants, but we do not integrate these with the first two factors because substantial interaction effects between these factors may lead to an overexplanation of the productivity gap. Last, we look at some areas where further analysis is required to account for the productivity gap.
The Capital Intensity Effect
The greater use of capital goods in the manufacturing production process is probably one of the most important reasons why the United States achieved productivity leadership in manufacturing as far back as the mid-nineteenth century.31 Germany and Japan also invested heavily in capital, especially during the postwar period. Between 1950 and 1973 the average growth rate of manufacturing investment was 7.5 percent in Germany and 15.0 percent in Japan, against only 4.2 percent in the United States. These differences in investment growth have led to a convergence of capital intensity, which underlies the narrowing of the labor productivity gaps observed above.
The stock of structures and equipment in manufacturing is calculated on the basis of the perpetual inventory method by cumulating annual investments and by deducting a share of the existing capital stock to account for the investment made in an earlier year that has reached the end of its lifetime. For this study we "standardized" the assumptions on asset lives and scrapping patterns for each country, because the comparability of the official estimates for the various countries is very weak. We then converted these capital stock estimates into U. S. dollars, making use of the expenditure PPPs for capital formation in machinery and equipment and in structures.32
Table 6 shows comparative estimates of the stock of structures and equipment per manufacturing employee in Germany and Japan as a percentage of the U.S. estimate. The estimates for total manufacturing
31. Broadberry (1992). 32. See the data appendix for a detailed description of our estimates of the manu-
facturing capital stock.

Bart van Ark and Dirk Pilat 23
Table 6. Comparison of Gross Stock of Structures and Equipment per Employee by Major Branch in Manufacturing, 1950-90 U.S. = 100
Branch 1950a 1960 1973 1979 1990
GermanylU.S.
Food, beverages, tobacco 58.1 75.5 147.1 146.0 132.6 Textiles, apparel, leather 51.5 76.7 159.4 170.3 189.3 Chemicals, allied products 64.3 45.8 70.1 72.9 59.1 Basic, fabricated metals 57.7 50.2 92.5 98.2 71.3 Machinery, equipment 64.4 54.3 75.0 86.3 73.3 Other manufacturing 37.1 45.8 89.4 99.4 102.4
Total manufacturing 53.1 51.3 87.4 94.2 82.4 Equipment only 47.8 46.2 92.2 94.8 81.5
Japan/U.S.
Food, beverages, tobacco 13.1 7.5 36.9 48.3 60.2 Textiles, apparel, leather 33.8 22.9 76.2 82.9 103.9 Chemicals, allied products 16.5 14.2 58.0 79.4 86.8 Basic, fabricated metals 46.9 30.9 82.2 126.0 117.5 Machinery, equipment 22.2 15.9 52.8 77.5 80.6 Other manufacturing 10.3 13.8 40.2 57.7 93.4
Total manufacturing 20.1 16.2 54.1 75.4 86.7 Equipment only 28.0 20.2 70.2 93.1 106.4
Sources and method: See data appendix. Capital stock estimates are based on the perpetual inventory method, using standardized assumptions on asset lives and retirement patterns and ICP PPP converters for equipment and structures.
a. 1955 for Japan.
are also reproduced in figure 3. Although capital intensity grew slightly faster in the United States than in Germany and Japan during the 1950s, the latter countries quickly caught up to the U.S. level during the 1960s and 1970s. During the 1980s the catch-up slowed in Germany but continued in Japan. Table 6 also separates out equipment from the total manufacturing capital stock per employee, and it shows an even more pronounced catch-up trend for capital intensity, particularly for Japan. In the late 1980s Japanese capital intensity in machinery and equipment surged ahead of that in the United States. Recently, De Long and Sum- mers emphasized the importance for growth of these investments.33 Machinery and equipment now make up more than 60 percent of the total capital stock in manufacturing in Germany and the United States; during the 1950s they accounted for only 45 to 50 percent. In Japan
33. De Long and Summers (1991).

24 Brookings Papers: Microeconomics 2, 1993
Figure 3. Comparison of Capital Stock per Employee in Manufacturing, 1950-90
U.S.= 100
120
United States 100
80
/ Germany 60 _
40
20 Japan
0 I I I I I I I
1950 1955 1960 1965 1970 1975 1980 1985 1990
Source: See table 6.
machinery and equipment accounted for about three-quarters of the total capital stock in manufacturing throughout the postwar period.34
To analyze the impact of the different levels of capital intensity for major branches and across the three countries, we calculated relative levels of value added per joint unit of labor input and capital. For this purpose we adopted a Cobb-Douglas production function with constant returns to scale. A fixed factor share for labor was obtained from na- tional accounts sources for 1987.35 The Cobb-Douglas function can be
34. For a more detailed assessment, see van Ark (forthcoming). 35. The factor shares for labor were obtained from each country's national accounts
(see source description in the data appendix) and were defined as the ratio of labor costs to the gross domestic product in manufacturing minus indirect taxes plus subsidies. For the United States, we had to use the unpublished tabulation of the Department of Commerce to make the adjustment from market prices to factor cost. Apart from wages and salaries, labor costs also include supplementary payments for labor input by em- ployers, but not the income of self-employed persons and unpaid family workers. In the national accounts the latter is included with the operating surplus. As a result the

Bart van Ark and Dirk Pilat 25
reformulated by subtracting the logarithmic index of the relative capital- labor ratio of countries X and U (KXlLx over KUlLu) from that of the corresponding ratio of labor productivity (YXlLx over YulLu):
l Ax In YXILX _ -) In Kx/Lx Au YU/LU Ku/Lu'
with a representing the unweighted average of the share of labor com- pensation in gross domestic product at factor cost in country X and country U in 1987.
Benchmark comparisons of joint factor productivity were made for 1987 and extrapolated over the postwar period on the basis of national time series. The relative levels of joint factor productivity by major branch are presented in table 7 and are also reproduced for total man- ufacturing in figure 4. At first sight the comparative trends in joint factor productivity look similar to those of relative labor productivity shown in figure 1, and, indeed, the relation between the two measures is strong. If figures 1 and 4 are compared in more detail, however, it appears that labor productivity converged more rapidly on the U.S. level than did joint factor productivity. In 1950 the labor productivity gap was larger than the joint factor productivity gap for both Germany and Japan because of the higher capital intensity in the United States. The catch-up in labor productivity levels until the early 1980s is partly associated with a relative increase in capital intensity, as shown above, but other factors have figured in the catch-up process as well.
By the end of the 1980s, differences in capital intensity explained a negligible part of the difference in labor productivity levels between Germany and the United States but slightly more for the Japan-U.S. comparison. Japan's joint factor productivity relative to the United
contribution of labor input to output is slightly underestimated, although the share of income for self-employed and unpaid family workers in manufacturing labor compen- sation in advanced countries is small. We also estimated joint factor productivity on the basis of annual weights, which increased the joint factor productivity levels of Germany and Japan only slightly relative to the United States, because of the relatively lower labor shares of these countries in the 1950s and 1960s. In their recent work on growth theory Lucas (1988) and Romer (1990) have argued in favor of increasing returns to scale because of higher returns to human or physical capital than their factor shares suggest. The empirical support for substantially increasing returns to scale is not very strong. At best there are slightly increasing returns to scale but diminishing returns on each of the individual production factors. See Crafts (1992) for a review of the empirical evidence based on "new growth" models.

26 Brookings Papers: Microeconomics 2, 1993
Table 7. Comparison of Value Added per Joint Unit of Labor and Capital by Major Branch in Manufacturing, 1950-90 U.S. = 100
Branch 1950a 1960 1973 1979 1990
GermanylU.S.
Food, beverages, tobacco 70.7 83.9 59.1 63.2 64.7 Textiles, apparel, leather 53.7 77.0 70.5 73.5 72.2 Chemicals, allied products 39.6 73.1 99.5 113.1 86.1 Basic, fabricated metals 36.3 61.0 67.4 88.0 101.2 Machinery, equipment 49.8 85.6 94.5 111.9 89.7 Other manufacturing 49.1 67.1 71.2 79.2 76.2
Total manufacturing 47.9 75.0 81.5 95.1 86.2
Japan/U.S.
Food, beverages, tobacco 70.4 74.9 64.1 57.6 47.2 Textiles, apparel, leather 34.2 43.9 59.1 60.0 49.4 Chemicals, allied products 35.9 62.8 82.9 90.2 92.8 Basic, fabricated metals 17.4 24.4 68.7 81.6 94.1 Machinery, equipment 13.3 28.8 63.5 89.4 126.6 Other manufacturing 23.1 30.8 49.3 51.0 59.1
Total manufacturing 30.9 40.1 63.7 72.4 85.1 Source: See tables 4 and 6 and with adjustment for capital intensity from capital stock per employee to capital stock per
hour. Joint factor productivity is based on a Cobb-Douglas function with constant returns to scale, using average unweighted factor shares for labor in 1987 for each pair of countries as the coefficients. For total manufacturing the factor labor shares in 1987 were 73.4 percent for Germany, 57.2 percent for Japan, and 73.8 percent for the United States (see also footnote 35).
a. 1955 for Japan.
States is now close to that of Germany. It appears that as the labor productivity gap widened between Germany and the United States, joint factor productivity also deteriorated in relative terms. Along with the slowdown in growth of manufacturing output in Germany during the 1980s, growth in the capital stock also fell, but it appears that not enough labor was laid off to keep joint factor productivity at the level of the late 1970s.
In Germany the relative positions of the major branches do not change significantly after adjusting for differences in capital intensity. The one exception is textiles, where joint factor productivity perfor- mance is much lower than labor productivity performance, apparently because capital intensity levels are very high. In Japan the good per- formance of the machinery and equipment branch is even more pro- nounced after adjusting for capital intensity.

Bart van Ark and Dirk Pilat 27
Figure 4. Comparison of Value Added per Joint Unit of Labor and Capital Input ini Manufacturing, 1950-90
U. S. I 100
120
United States 100
80 ' ~~~~~~~Germnany
60-
*0.001 ~~~~~apan
40
20
0 1111II i iIllIlI II 11 I 1950' 1955 1960 1965 1970 1975 1980 1985 1990
Source: See table 7.
The Quality of Labor Input
So far the accounting for the role of labor and capital in explaining the productivity gaps in manufacturing has been entirely focused on the quantities of these inputs. Differences in the quality of the factor inputs should also be taken in account. We therefore need to look in some more detail at the level of education of the manufacturing labor force in the three countries.
Most studies of the role of education in economic growth look at the average number of years of schooling of the population. Such measures, however, do not provide information on the actual distribution of skills across sectors. Table 8 shows the distribution of skills among the labor force for 198.7 based on the highest level of formal schooling received, which is obtained from the national labor force and population surveys. Most manufacturing employees do not have more than a high school

28 Brookings Papers: Microeconomics 2, 1993
education, although this is less true for "skill-intensive" branches such as chemicals and machinery and equipment. Nevertheless, 34 percent of manufacturing employees in the United States hold postsecondary degrees, compared with 28 percent in Germany and only 17 percent in Japan.
We developed an average labor quality index by weighting the shares for each of the education levels at their relative wages.36 More pre- cisely, we took the arithmetic average for each country and the United States of the wage differentials in total manufacturing. Following Denison37 this differential was reduced by 40 percent to exclude the effect of other factors on wage differences, such as ability or social background. Under this procedure, the average labor quality index for total manufacturing was 96.5 percent of the U.S. level for Germany and 97.4 percent for Japan.
Estimates of general education levels tend to understate the contri- bution of education to manufacturing productivity performance. First, these estimates do not take into account on-the-job training. Second, they do not adjust for the vocational content of the schooling. Studies by the National Institute of Economic and Social Research show that education received at technical colleges or through an apprenticeship system and the possession of vocational certificates are more important for explaining productivity differentials in manufacturing than years of general schooling.38
Adjustments for vocational qualifications appear to be especially important for Germany, where a large proportion of the labor force obtained certificates through vocational schools and apprenticeship sys- tems. Table 9 shows the distribution of the manufacturing labor force according to levels of vocational qualifications in Germany and the United States. For the United States the adjustment to a distribution based on vocational skills is fairly crude, because the U.S. statistics do not clearly distinguish between vocational and general qualifications at the high school level.39 It appears from table 9 that intermediate voca-
36. Wages were derived from the same sources as the education levels, although for Germany and the United States they were available only for total manufacturing.
37. Denison (1967). 38. See, for example, Prais (1981); and results from comparisons of "matched
plants" by Daly, Hitchens, and Wagner (1985) covering Germany and the United King- dom.
39. See the description of our sources in the data appendix. In the United States,

Bart van Ark and Dirk Pilat 29
Table 8. Distribution of Employees according to Highest Level of General Education Completed by Major Branch in Manufacturing, 1987 Percentage
Elementary Senior Senior or junior high Junior college,
Branch high school school college university
Germany
Food, beverages, tobacco 80.6 14.8 4.6 Textiles, apparel, leather 80.1 14.9 4.9 Chemicals, allied products 60.1 22.8 17.0 Basic, fabricated metals 78.3 15.2 6.5 Machinery, equipment 67.5 19.5 12.9 Other manufacturing 76.2 17.6 6.2
Total manufacturing 72.2 18.1 9.7
Japan
Food, beverages, tobacco 32.4 53.6 2.8 11.2 Textiles, apparel, leather 44.9 48.2 1.4 5.4 Chemicals, allied products 21.9 51.8 4.4 21.8 Basic, fabricated metals 36.3 49.5 3.2 11.0 Machinery, equipment 26.4 53.3 5.0 15.3 Other manufacturing 32.9 49.2 4.3 13.7
Total manufacturing 31.2 51.3 4.0 13.5
United States
Food, beverages, tobacco 26.9 50.3 12.9 9.8 Textiles, apparel, leather 39.0 45.7 7.8 7.5 Chemicals, allied products 14.1 43.7 16.8 25.4 Basic, fabricated metals 23.2 48.4 16.8 16.8 Machinery, equipment 15.4 42.3 19.8 22.4 Other manufacturing 20.4 45.7 16.6 17.4
Total manufacturing 20.8 45.0 16.5 17.7 Sources and notes: See data appendix.
tional qualifications (in particular at craft level) are of much greater importance in German manufacturing than in the United States, which partly compensates for Germany's lower proportion of employees with postsecondary levels of general education. As a result the German labor
the provision of separate schools for vocational training below college level has tradi- tionally been limited. Neither have apprenticeship systems been of great importance. Most general high schools, however, offer technical subjects that students can choose to integrate into their program.

30 Brookings Papers: Microeconomics 2, 1993
Table 9. Distribution of Employees According to Highest Level of Vocational Education Levels by Major Branch in Manufacturing, 1987 Percentage
No Intermediate Higher vocational vocational
Branch qualifications Lower Upper qualifications
Germany
Food, beverages, tobacco 33.5 55.0 9.9 1.6 Textiles, apparel, leather 39.4 53.2 5.9 1.6 Chemicals, allied products 25.2 56.1 7.9 10.8 Basic, fabricated metals 32.6 57.5 6.7 3.2 Machinery, equipment 25.5 57.0 8.9 8.6 Other manufacturing 30.9 57.7 8.5 2.8
Total manufacturing 29.3 56.7 8.4 5.7
United States
Food, beverages, tobacco 75.4 14.8 9.8 Textiles, apparel, leather 80.3 12.2 7.5 Chemicals, allied products 59.5 15.1 25.4 Basic, fabricated metals 72.1 16.3 11.6 Machinery, equipment 6i.1 16.5 22.4 Other manufacturing 67.0 15.6 17.4
Total manufacturing 66.8 15.5 17.7 Sources: See data appendix.
quality index for total manufacturing rises from 96.5 percent of the U.S. level on the basis of general education to 98.5 percent applying a distribution of vocational qualifications.
Table 10 shows that the effect of adjusting the joint factor produc- tivity gap in total manufacturing for differences in labor quality is fairly small for 1987, especially after the Germany-U.S. comparison is ad- justed for vocational qualifications. The effect appears to be slightly more important in chemicals and machinery and equipment, where the United States takes advantage of its greater stock of higher qualifica- tions compared with the other two countries.
The Effect of Structure
Differences in comparative productivity levels may also result from different structures or compositions of the manufacturing sectors. A concentration in activities with a low absolute level of value added per

U.S. = 100
Joint factor productivity
Value added Unadjusted Adjusted Adjustedfor per hour for labor for general vocational
Branch worked quality levels levels
Germany/U.S.
Food, beverages, tobacco 69.2 59.7 60.5 59.4 Textiles, apparel, leather 87.2 72.4 72.2 71.5 Chemicals, allied products 70.6 79.4 80.8 80.9 Basic, fabricated metals 86.0 88.0 90.0 87.8 Machinery, equipment 86.0 88.3 91.6 90.0 Other manufacturing 79.1 75.3 78.1 76.8
Total manufacturing 82.2 82.5 84.7 83.4
Japan/U.S.
Food, beverages, tobacco 33.3 45.0 44.4 n.a. Textiles, apparel, leather 56.4 59.2 60.3 n.a. Chemicals, allied products 75.8 87.5 88.3 n.a. Basic, fabricated metals 82.0 81.7 82.4 n.a. Machinery, equipment 93.2 105.2 107.6 n.a. Other manufacturing 50.0 56.0 56.9 n.a.
Total manufacturing 67.5 75.8 77.1 n.a. Source: Labor productivity, see table 2; joint factor productivity, see table.7; differences in labor qualifications from
table.s and 9. weighted at 0.6 times the wage differential. n.a. = not available.
hour worked may help explain a relative low productivity level for manufacturing as a whole in one country compared with another. This structural effect can be calculated by reweighting the manufacturing branch productivity in each country by the labor input weights of only one of the two countries. In other words, the labor force is assumed to be distributed identically among the branches in both countries. For instance, at prices and labor input weights of country X, the effect is calculated as
(4) PRODTYxu(f) = E x* Lk/ + Y *k Lk k=w p ik m auik m
where PRODTYXUx' is relative productivity for total manufacturing be-

32 Brookings Papers: Microeconomics 2, 1993
Table 11. Comparison of the Effect of Structure on Value Added per Hour Worked for Manufacturing Branches, 1987 U.S. = 100
Unadjusted Adjusted Adjusted for at at
structural branch industry Branch differences level level
GermanylU.S.
Food, beverages, tobacco 69.2 n.a. 64.2 Textiles, apparel, leather 87.2 n.a. 85.4 Chemicals, allied products 70.6 n.a. 69.4 Basic, fabricated metals 86.0 n.a. 82.0 Machinery, equipment 86.0 n.a. 83.4 Other manufacturing 79.1 n.a. 76.1
Total manufacturing 82.2 78.9 76.7
Japan/U.S.
Food, beverages, tobacco 33.3 n.a. 36.1 Textiles, apparel, leather 56.4 n.a. 54.3 Chemicals, allied products 75.8 n.a. 83.1 Basic, fabricated metals 82.0 n.a. 86.1 Machinery, equipment 93.2 n.a. 99.3 Other manufacturing 50.0 n.a. 51.3
Total manufacturing 67.5 70.1 69.7 Source: Unadjusted productivity ratios from table 2; adjustment at branch level on the basis of output and labor from
tables A-3 and A-4; adjustment at industry level for Germany-U.S. based on industry matches for 50 industries, and for Japan-U.S. based on matches for 206 industries. Adjusted results are based on a geometric average of the four combinations of weighting at labor input and price weights of own country and the United States.
n.a. = not available.
tween country X and U in prices and labor input weights of country X, Yx(x) and Yu(X) are value added in branch k in country X and U, respec-
tively, at prices of country X, Lx and Lu are the number of hours worked in branch k in country X and U, respectively, and Lx is the total number of hours worked in manufacturing in country X.40
Table 11 shows the results of these structural adjustments, which we made at two different levels. The first adjustment (second column) was made at the level of the sixteen manufacturing branches. This adjust- ment reduces the German productivity ratio from 82.2 percent to 78.9 percent. It appears that Germany has a relatively large share of its manufacturing activities in branches with a high absolute productivity
40. Similar formulations can be derived for any combination of labor input and price weights of country U and country X.

Bart van Ark and Dirk Pilat 33
level, such as chemicals, metal products, and machinery and equip- ment. The structural effect reduces Japan's productivity gap with the United States. Japan still has a relatively large share in branches with low relative productivity levels, such as food products and textiles, and the structural adjustment increases its productivity level from 67.5 per- cent to 70. 1 percent.4'
The third column of table 11 show the structural effect after a more detailed adjustment, because we took the structure effect within branches into account as well. For the Germany-U.S. comparison pro- ductivity and labor input ratios were derived from the censuses for 50 industries. This structural effect for total manufacturing was slightly stronger than when measured at branch level only. The direction of adjustment was reflected at the level of all major branches; in each case the adjustment increased the productivity gap between Germany and the United States. For the Japan-U.S. comparison a breakdown of 206 industry matches was possible. It appears that substantial structural effects occurred for each of the six major manufacturing branches, particularly chemicals, basic and fabricated metals, and machinery and equipment.
After adjusting for structural effects, the labor productivity gap be- tween Germany and the United States is only slightly smaller than that between Japan and the United States in 1987. This indicates that the better productivity performance (without such an adjustment) in Ger- many is partly related to the strong concentration of German manufac- turing in branches and industries with relatively high absolute produc- tivity levels.
The Effect of Plant Size
Labor productivity gaps between countries are to some extent related to differences in plant size. The production censuses used for this study include information on the distribution of value added and employment among size categories. On the whole, plants with few employees show lower value added per employee than do large plants. To a large extent
41. It is common practice to use employment shares in calculating structural effects. One could also use output shares, which slightly increases the structural effect at branch level by 1.9 percentage points for Germany (as the German-U.S. productivity ratio goes down from 78.9 to 77.0 percent) and by 1.7 percentage points for Japan (namely, from 70.1 to 71.8 percent).

34 Brookings Papers: Microeconomics 2, 1993
Table 12. The Effect of Size Differences on Value Added per Hour Worked, Japan as a Percentage of the United States, 1987 U.S. = 100
Branch Unadjusted Adjusted
Food, beverages, tobacco 33.3 41.9 Textiles, apparel, leather 56.4 63.2 Chemicals, allied products 75.8 84.8 Basic, fabricated metals 82.0 92.4 Machinery, equipment 93.2 105.7 Other manufacturing 50.0 62.1
Total manufacturing 67.5 79.2 Source: Unadjusted productivity ratios from table 2; adjustment on the basis of the size distribution in the censuses of
production excluding employment in auxiliary units. This ratio was applied to the productivity ratio adjusted for auxiliary units. Adjusted results are based on a geometric average of weighting at labor weights of Japan and the United States.
that difference is related to differences in capital intensity by size category.
In Japan manufacturing units with fewer than one hundred employees accounted for more than half of all manufacturing units, whereas only 30 percent of the units in the United States had fewer than one hundred employees.42 The lowest quartile of all units in Japan had fewer than twenty employees, compared with seventy employees in the United States. Table 12 shows the effect of differences of size distribution on the Japan-U.S. comparison. The same procedure was applied as ex- plained above for the structural adjustment; that is, value added per hour worked was weighted at the labor input weights of one of the two countries (see equation 4 above).
It appears that the relatively small size of local units in Japan ac- counts for a substantial part of the productivity gap, in particular in machinery and transport equipment and in other manufacturing. This effect, however, can probably not be seen independently of the some- what lower level of capital intensity in Japanese manufacturing ob- served above.
We were not able to calculate the size effect for Germany, because the census estimates are for enterprises and not for local units, and because the German production census excludes information for enter-
42. The unit is a "local unit," which is a producing unit at a single postal address. The local unit is the most relevant concept for an analysis of the effect of average size on productivity, although certain economies of scale, such as those derived from large- scale administrative management, can only be obtained at activity or legal unit level.

Bart van Ark and Dirk Pilat 35
Table 13. Comparison of the Average Median Size of Manufacturing Units by Employment, 1987
United Branch Germany Japan States
Food, beverages, tobacco 31 52 274 Textiles, apparel, leather 112 26 233 Chemicals, allied products 723 107 240 Basic, fabricated metals 248 48 208 Machinery, equipment 889 195 633 Other manufacturing 79 28 198
Total manufacturing Median size 318 166 263 Average size 30 16 49
Source: See sources for size of manufacturing unit in the data appendix. Excludes auxiliary units.
prises with fewer than twenty employees. Using German labor statis- tics, however, we derived information on the distribution of employ- ment by size and local unit.
Table 13 compares the average median size of local manufacturing units by major branch for the three countries in 1987. The median is the average size where half of all employees are employed in plants that are smaller and half in plants that are bigger. This measure is more suitable for analyzing productivity differences than the average number of workers per plant.
For total manufacturing the median plant size is clearly larger in Germany than in the United States, whereas the Japanese plant size is much smaller. In terms of an arithmetic average, however, the United States, and not Germany, has the largest number of employees per plant, namely, 49 compared with 30 employees. This implies that, although more than half of American manufacturing employees work in plants with fewer than 263 employees, the United States had more large plants than either of the other two countries.
The variation in median size is quite substantial among major branches. Germany had the smallest median size of the three countries in food manufacturing; for textiles and other manufacturing industries the median size in Germany was also smaller than in the United States. The fact that more than half of the employees in the chemicals group and the investment goods group work in very large plants explains the relatively high median size for Germany.

36 Brookings Papers: Microeconomics 2, 1993
Although no estimate can be provided for the size effect on the comparative productivity performance of Germany and the United States, table 13 makes clear that an adjustment for size would increase, rather than reduce, the productivity gap between these two countries, although the effect will not be as substantial as for the Japan-U.S. comparison.
Conclusion
In this section we looked at four possible causes for the manufactur- ing productivity gaps between the United States and Germany and Ja- pan, respectively. We conclude that at the level of total manufacturing, capital intensity once played an important role in narrowing the pro- ductivity gap but that it is no longer a powerful explanatory factor. Differences in labor force qualifications and structure were also not very important in 1987, although the effects of capital and skill intensity are occasionally bigger at branch level.
An adjustment for structure slightly widened the productivity gap between Germany and the United States and slightly narrowed the gap between Japan and the United States. We found a more substantial effect for size differences in the Japan-U.S. comparison. This effect is also likely to play a role in the Germany-U.S. comparison although in the opposite direction, increasing, rather than reducing, the productivity gap.
On the whole, the factors we examined appeared either to increase the labor productivity gap between Germany and the United States or to be insignificant, whereas these factors explain at least part of the original difference in labor productivity between Japan and the United States. This finding implies that, after adjusting for the factors studied here, the productivity gaps are much more of the same magnitude than they were before the adjustment.
The level accounting method applied in this section needs to be developed further to make it a more accurate tool in explaining cross- country productivity differentials. First, some additional factors, which are looked at in traditional growth accounting studies, need to be con- sidered here as well. Potential candidates for further analysis are dif- ferences in the age-gender structure of the manufacturing labor force and the effects of the adoption of new technology. For the latter, indi-
Bart van Ark and Dirk Pilat 37
cators of expenditure on research and development or the effects of patents can be analyzed. Recent studies found that privately funded R&D investment has a significant positive effect on productivity growth, although in a cross-country level comparison, the factor share of R&D is likely to be well below 10 percent if a production function with constant returns to scale is used.43
Finally, we did not take account of possible interaction effects be- tween the various factors. These may, for example, be important in relation to the effects of capital intensity on the one hand and size and structure on the other. Furthermore, differences in the degree of em- bodied technology in the capital stock installed in the countries need to be assessed more carefully than was possible in the framework of this paper.
Summary and Concluding Remarks
In this paper we applied the industry-of-origin approach to interna- tional comparisons of output and productivity levels in manufacturing for Germany, Japan, and the United States during the postwar period. Unit value ratios, based on the quantities and ex-factory sales value of matched product items, were compiled to convert the output value by manufacturing branch in national currencies to a common currency. It appears that the diversity in unit value ratios across branches is quite substantial, particularly in the Japan-U. S. comparison. Branch-specific unit value ratios, instead of GDP or proxy PPPs, are therefore crucial in determining the relative productivity performance across branches. For a more disaggregated analysis at industry level, it will be necessary to consider the effect of quality differences and double deflation, but at the level of major branches (with the exception of the need for double deflation in food manufacturing), these effects are not so great as to seriously affect our results.
We found that up to the early 1980s the manufacturing sectors of Germany and Japan performed in accordance with the catch-up and convergence hypothesis on relative productivity levels. Since then, however, the productivity gap between Germany and the United States
43. See, for example, Lichtenberg (1992b).

38 Brookings Papers: Microeconomics 2, 1993
has significantly increased. After a brief slowdown during the first half of the 1980s, Japan continued to improve its relative productivity stan- dards vis-a-vis the United States. In some major branches, in particular machinery and transport equipment, Japan is now clearly the produc- tivity leader. Because the Japanese productivity performance in some other branches such as food manufacturing is still much worse than in the United States, Japan and the United States are likely to share pro- ductivity leadership in manufacturing for some time to come.
We also looked at four possible factors that could explain part of the productivity gap. It appears that at the level of total manufacturing, the role of differences in relative capital intensity, skill intensity, and com- position of the sector was quite small by 1990. For the six major branches in manufacturing, however, we occasionally found more sub- stantial effects. The average median size of manufacturing units was largest in Germany and smallest in Japan. An adjustment for size dif- ferences therefore increased Japan's relative productivity performance.
We conclude that part of the productivity gaps that still exist between the countries has to be explained by factors of a broader nature than those analyzed here. These broad factors cover a wide range from socio- political and institutional differences to the effects of rent seeking, bargaining outcomes, and economic policies. The effects of such fac- tors can differ widely between branches and industries and can be related to the organizational structure of the industry, to the degree of international competitiveness that the industry faces, and to differences in the effect of government regulations on quality, safety, and environ- mental standards. To assess the impact of such factors, more detailed industry studies are required, for which this study can perhaps serve as a reference point for the aggregate picture.
Appendix
Following are the sources and methods the authors used in their paper.
Real Output in Manufacturing
The series for real output in manufacturing were derived from the national accounts for Germany (from 1960 onward), Japan (from 1955

Bart van Ark and Dirk Pilat 39
onward), and the United States (for the whole period). For earlier years (Germany from 1950 to 1960; Japan from 1950 to 1955), we used production indexes for real output.
The original manufacturing GDP series is expressed in market prices of a recent year, namely, 1985 for Germany and Japan and 1982 for the United States. The German and Japanese national accounts use weights that are shifted at regular intervals (mostly every five years), but the U.S. national accounts use fixed weights for the whole period.
Apart from its use of fixed weights, the U.S. national accounts series on manufacturing has been also criticized for, among other things, its use of an inadequate double deflation procedure and the inclusion of a statistical adjustment factor to make the double deflated results consis- tent with the rest of the national accounts. Although complete revisions of the manufacturing GDP series are not yet available, the Bureau of Economic Affairs (BEA) recently completed and published some of the revisions back to 1977. 44
Germany: 1950-60 based on index of net production from Statistisches Bundesamt, Lange Reihen zur Wirtschaftsentwicklung 1974, Wies- baden, 1974; 1960-70 from Statistisches Bundesamt, Volkswirtschaftliche Gesamtrechnungen, Revidierte Ergebnisse 1950-1990, Wiesbaden, 1991; 1970-90 from Statistisches Bunde- samt, Volkswirtschaftliche Gesamtrechnungen, Konten und Stan- dardtabellen 1991, Wiesbaden, 1992.
Japan: 1950-53 based on production index from Kazushi Ohkawa and Miyohei Shinohara, Patterns of Japanese Economic Development: A Quantitative Appraisal, Yale University Press, New Haven, 1979; 1953-55 based on Kazushi Ohkawa and Henry Rosovsky, Japanese Economic Growth, Stanford University Press, Stanford, 1973; 1955- 89 based on Economic Planning Agency (EPA), Report on National Accounts from 1955 to 1989, Tokyo, 1991; 1990 from EPA, Annual Report on National Accounts 1993, Tokyo, 1993.
United States: 1950-87 at 1982 fixed weights from U.S. Department of Commerce, National Income and Product Accounts of the United
44. For the most explicit criticism of the U.S. national accounts output series in recent years, see Mishel (1988) and Denison (1989). For a defense see Lawrence (1991). Revisions were published and discussed in U.S. Department of Commerce, Survey of Current Business, January and April 1991 and May 1993.

40 Brookings Papers: Microeconomics 2, 1993
States, 1929-1982, Washington, D.C., 1986, and U.S. Department of Commerce, Survey of Current Business, Washington, D.C., Jan- uary and April 1991; 1987-90 from Survey of Current Business, May 1993.
Number of Persons Engaged in Manufacturing
Germany: 1950-70 based on Statistisches Bundesamt, Lange Reihen zur Wirtschaftsentwicklung 1974, Wiesbaden, 1974; 1970-90 from Statistisches Bundesamt, Volkswirtschaftliche Gesamtrechnungen, Konten und Standardtabellen 1991, Wiesbaden, 1992. The figures are for all employees ("Erwerbstatige").
Japan: 1950-55 based on Statistics Bureau, Management and Coordi- nation Agency, Labor Force Survey, Tokyo, various issues; 1955- 89 based on EPA, Report on National Accounts from 1955 to 1989, Tokyo, 1991; 1990 from EPA, Annual Report on National Accounts 1993, Tokyo, 1993; industry breakdown for some branches adjusted with employment from Ministry of International Trade and Industry (MITI), Census of Manufactures, Report by Industries, Tokyo, var- ious issues.
United States: U.S. Department of Commerce, National Income and Product Accounts of the United States, 1929-1982, Washington, D.C., 1986; U.S. Department of Commerce, National Income and Product Accounts of the United States, vol. 2, 1959-1988, Washing- ton, D.C., 1992; and U.S. Department of Commerce, Survey of Current Business, Washington, D.C., various issues. The U.S. fig- ures are for all persons engaged and are derived as the sum of full- time and part-time employees and self-employed persons.
Annual Working Hours
For all three countries annual working hours are derived as hours actually worked and exclude paid hours that are not worked due to holidays, sickness, and other absences.
Germany: 1950-60 based on Statistisches Bundesamt, Lange Reihen zur Wirtschaftsentwicklung 1974, Wiesbaden, 1974; 1960-86 from H. Kohler and L. Reyher, Arbeitszeit und Arbeitsvolumen in der Bundesrepublik Deutschland, 1960-1988, Institut fur Berufsfor-

Bart van Ark and Dirk Pilat 41
schung, Niirnberg, 1988; updated to 1990 with series from Deutsches Institut fur Wirtschaftsforschung, Produktionsvolumen und -potential, Produktionsfaktoren des Bergbaus und des Verarbei- tendes Gewerbe, Berlin, 1991.
Japan: Ministry of Labor, Monthly Report on the Labor Force Survey, Tokyo, various issues, weighted with employment by branch, as given above.
United States: Weekly hours paid from Bureau of Labor Statistics (BLS), Employment, Hours and Earnings, United States, 1909- 1990, BLS Bulletin 2370, Washington, D.C., 1991; adjusted to hours worked with ratios of hours at work to hours paid from Mary Jablonski, Kent Kunze, and Phyllis F. Otto, "Hours at Work: A New Base for BLS Productivity Statistics," Monthly Labor Review, 113, pp. 17-34, Washington, D.C., February 1990. 1989 and 1990 from tabulations provided by BLS.
Estimating Gross Capital Stock in Manufacturing
Stocks of machinery and equipment and structures can be calculated on the basis of the perpetual inventory method (PIM), as pioneered by Raymond Goldsmith.45 This method depends on the availability of se- ries on investment, which are cumulated and scrapped on the basis of assumptions concerning asset lives and retirement patterns.
For this study we did not use the official capital stock estimates for each country because the comparability of the estimates across countries is weak. The German and U.S. series are based entirely on a PIM, but the Japanese estimates also make use of wealth surveys.46 Furthermore, each country applies its own assumptions on asset lives and scrapping patterns. In some cases these assumptions are derived from an ad hoc sample survey, but more often they are based on tax records, company accounts, or expert advice. As a result machinery in Japanese manu- facturing is, for example, assumed to last for eleven years, compared with nineteen years in the United States, and the lifetime of all manu- facturing assets in Germany is taken to be forty-one years, compared with thirty-two years in the United States.
Because there is little hard evidence for such large differences in
45. Goldsmith (195 1). 46. See Dean, Darrough, and Neef (1990) for a discussion.

42 Brookings Papers: Microeconomics 2, 1993
asset lives and scrapping patterns, we compiled our own capital stock estimates on the basis of the PIM using "standardized" assumptions on asset lives and the retirement of the assets. The standardized service lives are based on an average of the assumed lives for fourteen OECD countries, which we derived from a detailed OECD survey.47 On this basis we applied a service life of forty-five years to investment in nonresidential structures in manufacturing and seventeen years to in- vestment in equipment and vehicles used in manufacturing. We as- sumed that assets were retired on the basis of a "delayed linear" retirement pattern, which implied that structures are scrapped propor- tionally, between thirty-six and fifty-four years, and that equipment and vehicles (taken together) are scrapped between fourteen and twenty years.4
Because of the lack of long-run investment data, we were not able to calculate our own PIM estimates for major branches. As a proxy we therefore derived the share of the major branches in total manufacturing according to the official estimates, which we applied to our own esti- mates for total manufacturing.
The conversion of the capital stock estimates to U.S. dollars was done on the basis of Fisher PPPs for 1985 for capital formation in machinery and equipment and structures, which were supplied by Eu- rostat.
Sources on Investment Series for Total Manufacturing and Capital Stock Breakdown by Sector
Germany: Investment before 1960 from W. Kirner, Zeitreihenfuir das Anlagevermogen der Wirtschaftsbereiche in der Bundesrepublik Deutschland, Deutsches Institut fur Wirtschaftsforschung, Berlin,
47. OECD (1993). 48. See Maddison (1993) for a detailed assessment of the comparability of capital
stock across countries and long-run series for the total economy for six OECD countries (France, Germany, Japan, the Netherlands, the United Kingdom, and the United States). See van Ark (forthcoming) for a more detailed account of the manufacturing capital stock estimates for the same countries. Blades (1993) criticizes the standardization of asset life assumptions across countries. At an aggregate level, different asset lives may, of course, arise from differences in the composition of assets. This argues in favor of a more disaggregated approach to obtain capital stock estimates on the basis of PIM than was possible in the framework of this study.
Bart van Ark and Dirk Pilat 43
1968; 1960-88 from Statistisches Bundesamt, Volkswirtschaftliche Gesamtrechnungen, Revidierte Ergebnisse 1950-1990, Wiesbaden, 1991; 1989 and 1990 years from Volkswirtschaftliche Gesamtre- chnungen, recent issues. The breakdown of the capital stock over branches for 1970-90 was based on Statistisches Bundesamt, Volk- swirtschaftliche Gesamtrechnungen, Revidierte Ergebnisse 1950- 1990, Wiesbaden, 1991; 1950 and 1960 were based on Heinrich Liitzel, "Estimates of Capital Stock by Industries in the Federal Republic of Germany," Review of Income and Wealth, 23 (March) 1977.
Japan: Investment series before 1954 from Ohkawa and Rosovsky (1973), and Ohkawa and Shinohara (1979); 1954 to 1965 from MITI, Census of Manufactures, Report by Industries, Tokyo, various is- sues, deflated with price indexes from Bank of Japan, Price Indexes Annual, Tokyo, various issues;- 1965-90 from EPA, Gross Capital Stock of Private Enterprises, Tokyo, 1991 and 1993 issues, and distributed between machinery and equipment and structures on the basis of the census. Breakdown of capital stock over branches for 1965-90 based on EPA (1991, 1993), 1955 based on Administrative Management Agency, 1970 Input-Output Tables: Fixed Capital Stock Matrices (data for 1955); 1960 based on Kimio Uno, Japanese Industrial Performance, North-Holland, Amsterdam, 1987.
United States: Investment from U.S. Department of Commerce, Fixed Reproducible Tangible Wealth in the United States, 1925-1985, 1986; recent years from BEA Wealth Data Tape; sectoral breakdown based on U.S. Department of Commerce, Fixed Reproducible Tan- gible Wealth in the United States, 1925-1989, 1993; 1990 from U.S. Department of Commerce, Survey of Current Business, January 1992.
The Quality of the Manufacturing Labor Force
The estimates of qualification levels of the labor force are based on the labor force and population surveys in each country.
General qualification levels in Germany were distributed on the basis of the American classification scheme by assuming that qualifications at the level of "(Volks)Hauptschule" were equivalent to elementary and high school qualifications, "Realschule" to junior college level,

44 Brookings Papers: Microeconomics 2, 1993
and "(Fach)Hochschule" to senior college and university. German vo- cational qualifications were distributed by putting "Angelernte" and "Lehrberuf" in lower intermediate qualifications, "Meister" and "Techniker" in upper intermediate qualifications, and "Fachhoch- schule" and "Hochschule" in higher vocational qualifications.
The classification of vocational qualifications in the United States was much cruder, because the population survey does not distinguish between general and vocational qualifications. Estimates from a survey for 1963 show that about 37.5 percent of the labor force received some kind of vocational training at the high school level.49 On the assumption that the time spent on vocational subjects by this 37.5 percent of all working people attending high school was about one-third of all edu- cation received, we classified 12.5 percent of the 1987 labor force with high school diplomas as having intermediate vocational qualifications. Furthermore, we included half of junior college graduates in the seg- ment of intermediate vocational qualifications and the other half in "no vocational qualifications. " U.S. higher qualifications are senior college and university.
Germany: Statistisches Bundesamt, Mikrozensus 1987, Special Tabu- lations, kindly provided by Mary O'Mahony and Karin Wagner.
Japan: Ministry of Labor, Basic Survey on the Wage Structure 1987, Tokyo,1988.
United States: Unpublished tabulations from U.S. Department of La- bor, "Educational Attainment of Workers, March 1987."
49. See Daly (1984, p. 236).

Table
A-1.
Unit
Value
Ratios,
Percentage of
Matched
Sales,
and
Number of
Matched
Items by
Manufacturing
Branch,
Germany/United
States,
1987 Unit
value
ratio
(DMIUS$)
U.S.
Germany
Percent of
matched
sales
Number
quantity
quantity
Geometric
of
weights
weights
average
Germany
U.S.
UVRs
Branch
(1)
(2)
(3)
(4)
(5)
(6)
Food
manufacturing
1.98
1.92
1.95
44.04
35.92
43
Beverages
2.59
2.38
2.48
58.85
38.41
11
Tobacco
products
1.20
1.23
1.21
69.29
82.23
1
Textiles
2.69
2.52
2.61
39.64
59.68
21
Wearing
apparel
2.92
2.90
2.91
56.93
39.71
27
Leather
products,
footwear
2.85
2.76
2.80
64.38
53.14
11
Wood,
furniture,
fixtures
2.83
2.57
2.70
30.76
16.11
13
Paper,
printing
2.28
2.23
2.26
18.63
23.67
13
Chemical
products
2.66
2.47
2.56
11.80
12.87
17
Petroleum,
coal
products
1.96
1.98
1.97
25.02
76.04
5
Rubber,
plastic
products
2.33
2.31
2.32
7.68
8.71
4
Stone,
clay,
glass
2.11
1.88
1.99
18.94
23.03
13
Basic,
fabricated
metals
2.25
2.16
2.20
46.49
23.89
31
Machinery,
transport
equipment
2.49
2.49
2.49
13.83
11.56
40
Electric
machinery
1.87
1.92
1.90
29.61
20.97
21
Other
manufacturing
2.25
2.16
2.21
0.00
0.00
0
Total
manufacturing
2.25
2.16
2.21
24.36
24.82
271
Sources:
Statistisches
Bundesamt,
Produktion im
Produzierenden
Gewerbe
1987,
Wiesbaden,
1988;
U.S.
Department of
Commerce,
Bureau of
the
Census,
1987
Census of
Manufactures,
Industry
Series,
Washington,
D.C.,
1990.

Table
A-2.
Unit
Value
Ratios,
Percentage of
Matched
Sales,
and
Number of
Matched
Items by
Manufacturing
Branch,
Japan/United
States,
1987 Unit
value
ratio
(Yen/US$)
U.S.
Japan
Percent of
matched
sales
Number
quantity
quantity
Geometric
of
weights
weights
average
Japan
U.S.
UVRs
Branch
(1)
(2)
(3)
(4)
(5)
(6)
Food
manufacturing
258.5
274.1
266.2
13.71
11.21
16
Beverages
208.3
207.8
208.1
32.73
30.21
3
Tobacco
products
113.3
113.3
113.3
86.00
80.68
1
Textiles
178.6
184.8
181.7
25.85
38.87
14
Wearing
apparel
185.8
172.9
179.2
21.20
30.38
9
Leather
products,
footwear
212.6
205.3
208.9
34.12
29.30
4
Wood,
furniture,
fixtures
478.2
464.9
471.5
19.52
7.86
2
Paper,
printing
186.4
189.9
188.1
13.05
15.04
10
Chemicals
241.3
218.3
229.6
15.53
14.20
31
Petroleum,
coal
products
284.6
222.5
251.6
64.93
76.64
6
Rubber,
plastic
products
125.2
117.6
121.3
7.37
11.44
6
Stone,
clay,
glass
194.2
184.5
189.3
32.97
27.75
9
Basic,
fabricated
metals
193.7
164.4
178.4
24.92
22.94
34
Machinery,
transport
equipment
160.8
97.2
125.0
20.28
17.69
26
Electric
machinery
152.0
133.9
142.6
11.49
11.06
18
Other
manufacturing
202.9
148.5
173.6
0.00
0.00
0
Total
manufacturing
202.9
148.5
173.6
19.10
19.86
190
Sources:
MITI,
Census of
Manufactures
1987,
Report by
Commodities,
Tokyo,
1989,
and
MITI,
Census of
Manufactures
1987,
Report by
industries,
Tokyo,
1989;
Bureau of
the
Census,
1987
Census of
Manufactures,
Industry
Series,
1990.

Table
A-3.
Value
Added,
Labor
Input,
and
Comparative
Labor
Productivity,
Germany
and
the
United
States,
1987
Germanya
United
Statesa
Germany/U.S.
(%)
Census
Census
Census
value
Annual
value
Annual
Census
value
added at
hours
added at
hours
value
added
factor
worked
factor
worked
added
per
cost
Employees
per
cost
Employees
per
per
hour
Branch
(mln.
DM)
(OOOs)
employee
(mln. $)
(OOOs)
employee
employee"
worked"
Food
manufacturing
36,018
363.8
1,889
95,349
1,319.6
1,893
70.2
70.3
Beverages
12,781
87.3
1,585
21,961
165.9
1,866
44.5
52.4
Tobacco
products
3,483
16.8
1,585
14,252
63.1
1,853
75.6
88.3
Textiles
15,928
222.0
1,606
24,861
681.1
2,053
75.4
96.4
Wearing
apparel
9,529
171.7
1,557
29,808
1,029.3
1,794
65.9
75.9
Leather
products,
footwear
3,317
54.6
1,621
4,155
128.0
1,843
66.8
76.0
Wood,
furniture,
fixtures
16,906
214.3
1,728
42,614
1,045.4
1,964
71.8
81.5
Paper,
printingb
29,859
293.4
1,666
82,678
1,311.9
1,847
71.6
79.4
Chemicals
87,414
592.6
1,627
116,030
980.1
1,922
48.6
57.4
Petroleum,
coal
products
8,027
30.9
1,663
17,223
144.6
1,922
110.7
127.9
Rubber,
plastic
products
28,760
325.7
1,621
42,080
811.2
1,986
73.3
89.8
Stone,
clay,
and
glass
23,163
239.4
1,726
29,508
479.7
2,003
79.1
91.8
Basic,
fabricated
metals
82,949
973.8
1,587
113,481
2,048.6
1,956
69.8
86.0
Machinery,
transport
equipment
191,645
1,969.5
1,624
244,040
3,690.5
1,905
77.5
90.9
Electrical
machinery
91,085
1,019.4
1,550
93,385
1,636.4
1,877
62.8
76.1
Other
manufacturing
14,667
192.3
1,612
83,080
1,323.3
1,885
55.1
64.4
Total
manufacturing
655,529
6,767.6
1,630
1,054,503
16,858.7
1,909
70.2
82.2
Sources:
Statistisches
Bundesamt,
Produzierende
Gewerbe,
Kostenstruktur
der
Unternehmen
1987,
Reihe
4.3.1 to
4.3.3;
hours
from H.
Kohler
and C.
Reyher,
Arbeitszeit
undArbeitsvolurnenl
in
der
Bundesrepublik
Deutschland,
1960-1986,
Institut
fur
Arbeitsmarkt
und
Berufsforschung,
Nurnberg
1988,
updated to
1987
with
data
from
Deutsches
Institut
fur
Wirtschaftsforschung,
Produktionsvolumen
und
-potential,
Produktionsfaktoren
des
Bergbaus
und
des
Verarbeitendes
Gewerbe,
Berlin,
1991;
United
States
from
Bureau of
the
Census,
1987
Census of
Manufactures
General
Summary,
1990;
hours
worked
from
BLS,
Monthly
Labor
Review,
various
issues,
adjusted to
actual
hours
worked
with
ratios
from
BLS,
"Ratios of
Hours at
Work to
Hours
Paid
for
Production
and
Nonsupervisory
Employees,
1981-1988.'"
a.
Excludes
establishments
with
fewer
than
twenty
employees.
b.
Excludes
publishing.
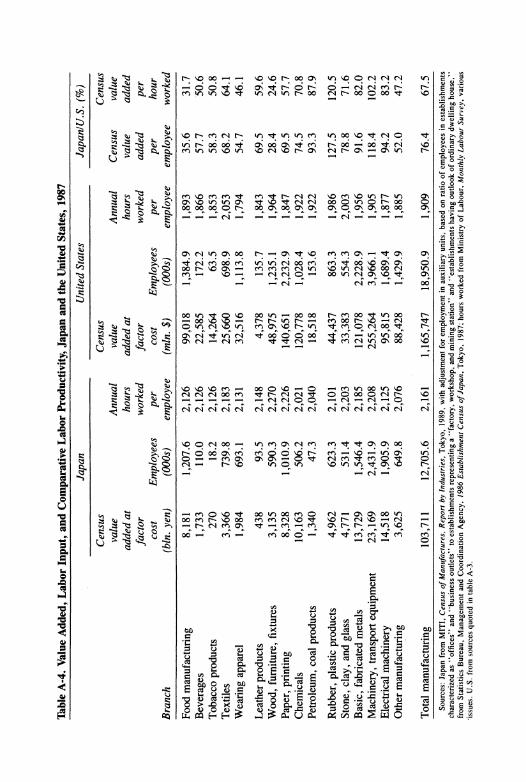
Table
A-4.
Value
Added,
Labor
Input,
and
Comparative
Labor
Productivity,
Japan
and
the
United
States,
1987
Japan
United
States
Japan/U.S.
(%)
Census
Census
Census
value
Annual
value
Annual
Census
value
added at
hours
added at
hours
value
added
factor
worked
factor
worked
added
per
cost
Employees
per
cost
Employees
per
per
hour
Branch
(bln.
yen)
(OOOs)
employee
(mln. $)
(OOOs)
employee
employee
worked
Food
manufacturing
8,181
1,207.6
2,126
99,018
1,384.9
1,893
35.6
31.7
Beverages
1,733
110.0
2,126
22,585
172.2
1,866
57.7
50.6
Tobacco
products
270
18.2
2,126
14,264
63.5
1,853
58.3
50.8
Textiles
3,366
739.8
2,183
25,660
698.9
2,053
68.2
64.1
Wearing
apparel
1,984
693.1
2,131
32,516
1,113.8
1,794
54.7
46.1
Leather
products
438
93.5
2,148
4,378
135.7
1,843
69.5
59.6
Wood,
furniture,
fixtures
3,135
590.3
2,270
48,975
1,235.1
1,964
28.4
24.6
Paper,
printing
8,328
1,010.9
2,226
140,651
2,232.9
1,847
69.5
57.7
Chemicals
10,163
506.2
2,021
120,778
1,028.4
1,922
74.5
70.8
Petroleum,
coal
products
1,340
47.3
2,040
18,518
153.6
1,922
93.3
87.9
Rubber,
plastic
products
4,962
623.3
2,101
44,437
863.3
1,986
127.5
120.5
Stone,
clay,
and
glass
4,771
531.4
2,203
33,383
554.3
2,003
78.8
71.6
Basic,
fabricated
metals
13,729
1,546.4
2,185
121,078
2,228.9
1,956
91.6
82.0
Machinery,
transport
equipment
23,169
2,431.9
2,208
255,264
3,966.1
1,905
118.4
102.2
Electrical
machinery
14,518
1,905.9
2,125
95,815
1,689.4
1,877
94.2
83.2
Other
manufacturing
3,625
649.8
2,076
88,428
1,429.9
1,885
52.0
47.2
Total
manufacturing
103,711
12,705.6
2,161
1,165,747
18,950.9
1,909
76.4
67.5
Sources:
Japan
from
MITI,
Census of
Manufactures,
Report by
Industries,
Tokyo,
1989,
with
adjustment
for
employment in
auxiliary
units,
based on
ratio of
employees in
establishments
characterized as
"offices"
and
"business
outlets" to
establishments
representing a
"factory,
workshop,
and
mining
station"
and
"establishments
having
outlook of
ordinary
dwelling
house,"
from
Statistics
Bureau,
Management
and
Coordination
Agency,
1986
Establishment
Census of
Japan,
Tokyo,
1987;
hours
worked
from
Ministry of
Labour,
Monthly
Labour
Survey,
various
issues.
U.S.
from
sources
quoted in
table
A-3.

Comments and Discussion
Comment by Dale Jorgenson: The theme of the paper by Bart van Ark and Dirk Pilat is an extremely important one for trade policy. Although the links between productivity and international competitiveness are well understood at a conceptual level, official data on productivity are inappropriate for assessments of competitiveness. As a consequence, the discussion of trade policy often takes place without the benefit of even the most rudimentary information about the sources of changes in competitiveness.
Because the U.S. trade balance has moved from surplus to deficit with both Germany and Japan during the postwar period, economic journalists have naturally assumed that U.S. competitiveness has dete- riorated. A large literature developed during the 1980s, presenting a broad panoply of mainly fanciful ideas about the alleged decline in U. S. competitiveness and its role in the determination of the U.S. trade balance. According to comparisons of prices and manufactured prod- ucts for Germany, Japan, and the United States, however, the United States has gained very substantially in international competitiveness, relative to Germany and Japan, over the postwar period.
Since the Smithsonian agreements of 1970, changes in the interna- tional competitiveness of German, Japanese, and U.S. industries have strongly favored the United States. These changes have been driven primarily by rapid appreciation of the yen-dollar and mark-dollar ex- change rates and, secondarily, by the relative growth of wage rates in the three countries. In periods affected by increases in petroleum prices, such as 1973 and 1979, changes in these prices were also a force undercutting Japanese and, to a lesser extent, German competitiveness.
49

50 Brookings Papers: Microeconomics 2, 1993
The decline in petroleum prices from 1981 to 1986 and the substantial appreciation of the U.S. dollar temporarily strengthened the competi- tive positions of both Germany and Japan. Renewal of depreciation of the dollar after 1985 has helped to restore the U.S. competitive position, however.
An important implication of the finding by van Ark and Pilat is that relative productivity levels in the three countries have moved in the opposite direction. This is brought out in table 4, giving value added per hour worked for the period 1950-90, and in table 7, giving value added per "joint unit" of labor and capital for the same period. German productivity relative to the United States roughly doubled between 1950 and 1980 but has lost ground since then. Japanese productivity doubled relative to the United States between 1950 and 1973, but Japanese gains have moderated during the past two decades.
By 1990 Germany and Japan had emerged as laggards in productiv- ity, relative to the United States. For example, manufacturing produc- tivity in both countries fell below that in the United States by about 20 percent. This finding received front page coverage from the New York Times when it was first reported in a somewhat different form by the McKinsey Global Institute.1 Readers of the business press are still bombarded with anecdotal evidence of the low level of U.S. productiv- ity relative to Germany and Japan. In fact Japan has been touted as the world's leader in productivity so regularly that the Japanese media have begun to believe it. This has led to a literature, mainly in Japanese, rationalizing the inferiority of U.S. productive performance.
The origin of confusion in the media is that productivity measure- ment is far from a settled matter among economists. For decades there have been two competing approaches to the measurement of productiv- ity-one based on income, and the other on product. A very useful comparison of the two approaches has been given by Charles Hulten, who points out that national income is best regarded as a measure of present and future consumption opportunities, while national product provides the appropriate point of departure for productivity measure- ment.2 This approach is used in a rapidly increasing proportion of the
1. Sylvia Nasar, "U.S. Output per Worker Called Best," New York Times, October 13, 1992, p. D1.
2. Hulten (1992).
Bart van Ark and Dirk Pilat 51
empirical literature, including the paper of van Ark and Pilat. A shrink- ing number of productivity analysts still utilize income, however.3
The critical issue in linking productivity to international competi- tiveness is the definition of output for individual industries. The older literature on productivity measurement, especially that associated with the work of John Kendrick, uses the concept of value added as a mea- sure of industry output.4 Value added is defined as the difference be- tween the value of gross output and the value of intermediate inputs. The value added measure of industry output has the convenient property that national product is an arithmetic sum of industry-level measures of value added. By "simplifying" productivity measurements, however, the value added approach severs the connection between productivity and international competitiveness.
One of the most important advances in industry-level productivity measurement has been to use gross output rather than value added as a measure of product at the industry level.5 Industry output is especially advantageous for international comparisons because measures of com- petitiveness are based on product prices rather than on prices of value added. Another advantage of industry output is that intermediate inputs can be treated symmetrically with inputs of capital and labor services in measuring productivity. These important advantages are acquired at some cost, however, because a fully satisfactory implementation re- quires the integration of interindustry accounts with national income and product accounts for each of the countries involved in an interna- tional comparison.
Masahiro Kuroda and I have employed industry-level gross outputs in comparisons of productivity between Japan and the United States.6 For this purpose we have developed annual time series of interindustry accounts in current and constant prices for both Japan and the United States. We have supplemented these data with extensive information
3. See, for example, Baily and Schultze (1991); Denison (1962, 1989); and Solow (1957, 1988).
4. Kendrick (1975). This approach has been adopted as the basis for industry-level data sets for industrialized countries discussed by Englander and Mittelstadt (1988).
5. See Jorgenson (1990). 6. See Jorgenson and Kuroda (1992). Earlier results were presented in our joint
paper with Mieko Nishimizu (1987). Conrad and Jorgenson (1985) have presented trilateral comparisons for Germany, Japan, and the United States, using data for Japan and the United States from the study of Jorgenson, Kuroda, and Nishimizu.

52 Brookings Papers: Microeconomics 2, 1993
on labor and capital inputs for both countries. Completion of this ar- duous task is essential for relating productivity to international com- petitiveness.
Unfortunately, van Ark and Pilat have based their international com- parisons of productivity on the "industry-of-origin" method described in their paper. This obsolete methodology is based on value added rather than on gross output. To arrive at international comparisons of value added, it is necessary to introduce the prices of inputs of intermediate goods as well as product prices. Van Ark and Pilat, however, have chosen to ignore the prices of intermediate goods altogether. This ac- counts for the lack of any direct connection between their productivity comparisons and indicators of international competitiveness.
To justify the omission of intermediate goods prices from their com- parisons, van Ark and Pilat appeal to the "adjusted single indicator" method of Paige and Bombach, where the single indicator is gross output.7 The assumption of this method is that prices of value added are identical to those of gross output. This assumption is sharply at variance with the evidence presented in table 2 of the paper, comparing value added for the food industry in Japan and the United States with and without introducing prices of intermediate goods. Value added for Japan is 23.4 percent of the U.S. level for 1987, using the single indicator method, while it is 30.9 percent, using the "double deflation" method incorporating prices of intermediate goods. This fails to inspire confidence in the authors' conclusion that their method is "sufficiently robust for the purpose.'"
Van Ark and Pilat's assumption that prices of gross output and value added are the same is also employed in comparisons of manufacturing productivity over time for Germany, Japan, and the United States. This assumption entails the related proposition that prices of intermediate goods are the same as those of output. The plausibility of this propo- sition can be judged in light of the dramatic rise and fall of energy prices during the 1970s and 1980s, because energy comprises an im- portant component of intermediate input in all of the manufacturing industries they consider. Moreover, intermediate inputs make up more than half the value of manufacturing output, so that assumptions of this
7. Paige and Bombach (1959).
Bart van Ark and Dirk Pilat 53
type, no matter how clearly stated, are never an adequate substitute for empirical measurements.
After measures of output have been constructed for individual in- dustries, the next.problem is to link the results for different countries. This requires purchasing power parities for outputs. At the aggregate level purchasing power parities for outputs are well established in the official statistics, thanks to the work of Kravis, Heston, and Summers.8 The most recent studies, coordinated by Eurostat and the Organization for Economic Cooperation and Development (OECD), are much more detailed than the original studies by Kravis and his associates.9 These purchasing power parities, however, are based on purchasers' prices rather than the producers' prices required for output comparisons at the industry level.
Kuroda and I have transformed the purchasers' prices to producers' prices for Japan and the United States, using interindustry accounts for both countries to eliminate trade and transportation margins and indirect taxes. A similar approach, employed by the McKinsey Global Institute, produces results that differ "substantially" from the unit value ratios (UVRs) employed by van Ark and Pilat. The UVRs are preferable, in principle, because they represent ratios of producers' prices for the two countries being compared. For the United States the underlying data source provides prices for 11,000 products; for Germany and Japan prices are available for 6,000 and 1,850 items, respectively.
The difficulty with the exploitation of unit values for international comparisons is that items for which prices are available must be matched between countries. Van Ark and Pilat could match only 271 items for Germany and the United States, and these cover less than a quarter of manufacturing output, while the 190 matched items for Japan and the United States cover an even smaller proportion of output in the two countries. These "matches" are extended to all manufacturing output by a tortuous and highly implausible series of assumptions. The practical disadvantages of UVRs largely outweigh their conceptual ad- vantages, so the purchasing power parities of Kravis and his associates, combined with internationally comparable interindustry accounts, are far more satisfactory.
8. Kravis, Heston, and Summers (1982). 9. See, for example, OECD (1992).
54 Brookings Papers: Microeconomics 2, 1993
Another issue that arises in productivity measurement is the com- parison of labor inputs between countries. Official statistics are not much help in resolving the issues. For example, data from the U.S. Bureau of Labor Statistics employed by van Ark and Pilat are based on unweighted hours worked as a measure of labor input. This measure is highly inappropriate for international comparisons, however, because it ignores substitution among different types of labor inputs. Hours worked for each type of labor must be weighted by the corresponding marginal product to capture this substitution. Because labor force com- position by characteristics such as age, sex, and educational attainment of workers differs substantially among Germany, Japan, and the United States, this is a fundamental issue in comparing labor inputs among the three countries.
Assessments of international competitiveness require estimates of purchasing power parities for labor inputs of the type that Kuroda and I have constructed for Japan and the United States, taking account of the differences in the composition of the labor forces in the two coun- tries by age, sex, and education. Comparisons of labor inputs over time for a given country also require detailed breakdowns of labor input by these characteristics. In Germany, Japan, and the United States, the educational qualifications of the labor force have been substantially upgraded, and important changes have occurred in age and sex com- position as well. The unweighted measures of hours worked used in official statistics are inappropriate for comparisons over time.
All of the comparisons of productivity over time for Germany, Japan, and the United States presented by van Ark and Pilat are limited to measures of labor input based on employment or hours worked. They have chosen to ignore empirical evidence accumulated over three dec- ades of productivity measurement that changes in the composition of the labor force are very important sources of growth in labor input. The comparisons among labor inputs for Germany, Japan, and the United States for the year 1987, presented by van Ark and Pilat in table 10 of their paper, incorporate differences in educational attainment. The au- thors, however, reduce industry differences for both Germany and Ja- pan, relative to the United States, by an arbitrary 40 percent for all six industries included in their study to reflect the omission of age, sex, and other differences in labor force composition.
A similar issue arises for a capital input. Capital goods differ sub-

Bart van Ark and Dirk Pilat 55
stantially in marginal productivity. To account for substitutions among different types of capital inputs, each capital good must be weighted by its marginal product. For this purpose it is necessary to focus on the flow of capital services rather than the stock of capital. Marginal prod- ucts must be broken down by legal form of organization and class of asset. Comparisons between countries require purchasing power pari- ties for different types of capital input such as those Kuroda and I have constructed for Japan and the United States.
Important progress has been made in measuring capital input in the U.S. official statistics compiled by the Bureau of Labor Statistics. Un- fortunately, the traditional approach-used by Denison, Kendrick, and Solow' 0-uses unweighted capital stocks. Productivity comparisons be- tween countries or between different time periods for a given country, such as those of van Ark and Pilat, do not adequately account for substitutions among different types of capital inputs. This results in a highly distorted view of capital as a source of economic growth and a contributor to differences in production levels between countries.
The research required for productivity comparisons relevant to inter- national competitiveness poses formidable challenges for economists. These comparisons require a system of national accounts for each coun- try that successfully integrates interindustry accounts with national in- come and product accounts. Even for Japan and the United States, two countries with highly developed statistical systems, productivity com- parisons have required the development of new data bases for output and for intermediate, capital, and labor inputs. Extending productivity comparisons to Germany poses many additional problems. Finally, data for these countries must be linked, using purchasing power parities.
The international comparisons of productivity presented by van Ark and Pilat are very far from state of the art. However, their conclusion that relative productivity levels have moved in precisely the opposite direction from changes in competitiveness will undoubtedly survive the infusion of more up-to-date methodology and more satisfactory data. International competitiveness has changed very rapidly under the post- Smithsonian regime of floating exchange rates, and these changes have been driven by exchange rate changes. With wildly fluctuating ex-
10. See Jorgenson (1989) for detailed comparisons of the Denison and Kendrick approaches with the capital input approach. The traditional approach has been imple- mented for OECD countries by Englander and Mittelstadt (1988).

56 Brookings Papers: Microeconomics 2, 1993
change rates, relative productivity movements are simply too slow to affect competitiveness substantially over periods as short as one or two decades.
The conclusion by van Ark and Pilat that Germany and Japan have emerged as productivity laggards, despite impressive growth in pro- ductivity during the 1960s and 1970s, should no longer surprise econ- omists. This conclusion, however, has far-reaching implications for the literature on the U. S. decline in technology, summarized, for example, by Richard Nelson and Gavin Wright."I Economists have miseducated a whole generation of technologists, who regularly extol advances in technology in Germany and Japan, overlooking the rapid development of U.S. technology, and support their anecdotal evidence of German and Japanese superiority by appealing to the deterioration of the U.S. trade balance.
Economists face an uphill battle in selling the position that the de- cline in the U.S. trade balance is, first and foremost, an issue in mac- roeconomics. The notion that the saving-investment identity is relevant to understanding the implications of monetary and fiscal policy for the trade balance is simply too remote from ordinary discourse to be readily intelligible to a lay audience. Empirical studies like that of van Ark and Pilat will help to raise the level of professional discussion. Even econ- omists who are not remotely interested in the details of productivity measurement will be able to appreciate the importance of the authors' findings on relative productivity growth.
Comment by Frank R. Lichtenberg: In this paper Bart van Ark and Dirk Pilat measure, and attempt to explain, differences among Ameri- can, German, and Japanese productivity levels during the past forty years. The U.S. Bureau of Labor Statistics (BLS) publishes official comparative international productivity data, but BLS reports only growth rates, not levels, of nations' productivity. There is, therefore, a clear need for the kind of research performed in this paper. At the same time, the reluctance of BLS to make comparisons of productivity levels signals that there are major difficulties in doing so.
Labor productivity is defined as real output Q divided by labor input. Accurate measurement of productivity therefore requires accurate mea-
11. See Nelson and Wright (1992); and Arrison and others (1992).

Bart van Ark and Dirk Pilat 57
surement of real output. In principle Q can be measured in two equiv- alent ways: direct-the approach used by van Ark and Pilat-and in- direct. The direct approach simply counts the quantity of units produced, for example, bushels of wheat or tons of steel. Such direct quantity measures are available for some manufacturing industries from Censuses of Manufactures. The reliability of these measures is likely to be greatest in industries with homogeneous (undifferentiated) prod- ucts. These are also the industries to which the "law of one price" (purchasing power parity) should apply most strongly and in which international equalization of productivity is therefore most likely to occur.
The accounting identity Q = VIP, where V = nominal output and P = output price (or output deflator) underlies the second, indirect, approach to real output measurement. Generally, the measurement of V is subject to minimal error, so Q can be measured (and compared) accurately if reliable price deflators are available. As the authors point out, the International Comparisons Project, conducted under the direc- tion of Kravis, Heston, Lipsey, and Summers, has been based on this "specification pricing" approach: comparisons of the prices in different countries of goods with rather detailed characteristics, for example, a 21-inch, cable-ready, remote-controlled, color television set.
Pursuing the direct approach and comparing its results to those of the indirect approach is certainly useful. But the direct approach has some important disadvantages. As the authors note, "many products cannot be matched because they represent different qualities in terms of product mix or content." Consequently, 75 to 80 percent of output could not be covered by their procedure. Their analysis presumably does not cover most R&D-intensive industries such as aircraft, con- sumer electronics, and semiconductors, where the issue of international productivity leadership is perhaps of greatest concern. Moreover, pre- vious research based on simultaneous analysis of the two approaches suggests that the specification pricing method is greatly superior. Both the U.S. Interagency Task Force for the Measurement of Real Output and Lichtenberg and Griliches1 concluded that producer price indexes (PPIs) were far more reliable measures of output prices than census unit values (a unit value is the ratio of nominal output to the direct quantity
1. Lichtenberg and Griliches (1989).

58 Brookings Papers: Microeconomics 2, 1993
measure). The latter estimated that the signal-to-noise ratio of the PPI was more than five times higher than that of the unit value.
Another, less serious limitation of the paper's approach is that the authors constructed "benchmark" estimates of relative productivity levels for only a single year-1987; "the time series for real output and labor input in total manufacturing and for the major branches from 1950 to 1990 were linked to the benchmark estimates of relative pro- ductivity levels for 1987 to obtain trends of comparative productivity." In principle it would be desirable to obtain benchmark estimates for at least one other year, although the effort required to do this is apparently considerable.
Despite these concerns about various aspects of the authors' meth- odology, I believe that their major findings are basically correct. A partial summary of these findings is as follows: All countries exhibited catch-up on the U.S. manufacturing productivity level up to the early 1980s. In 1990, however, only the United Kingdom and Japan showed significantly higher productivity levels relative to the United States than they had in 1979. The overall U. S. leadership position in manufacturing has strengthened during the 1980s, although its leadership position has been much more secure in light industries than in heavy and investment industries. Moreover, during the 1980s catch-up and convergence ap- peared to continue outside of manufacturing.
Much of the remainder of the paper attempts to explain changes in international relative productivity levels in terms of capital intensity, labor quality, and other factors. To assess the role of capital intensity, the authors developed their own capital stock estimates through the perpetual inventory method, using "standardized" assumptions on as- set lives and the retirement of assets, which is commendable. They found that German and Japanese capital intensity converged toward U.S. levels throughout 1950-90 (except for Germany in the 1980s) and that as a result, labor productivity converged more rapidly on the U.S. level than did joint factor productivity.
The authors considered the role of investment in equipment and structures but not of investment in research and development. I believe this would have been appropriate even though (as noted above) their sample probably excludes most high-technology industries and although the uncertainty about the magnitude of the (social) rate of return to

Bart van Ark and Dirk Pilat 59
Table 1. Nondefense R&D Expenditure by Year and Percentage Increase Billions of constant U.S. dollars
Year Germany Japan United States
1971 10.1 13.2 41.8 1979 14.2 21.1 52.4 1988 19.9 42.0 78.4
Percentage increase 1971-79 40.6 59.8 25.4 1979-88 40.1 99.1 49.6
Source: National Science Board. 1991. Science and Engineering lndicaters-1991. NSB91-1. Washington, D.C.: Gov- ernment Printing Office.
research and development (R&D) is greater than the uncertainty about the return to fixed investment. Many studies at the firm, industry, and aggregate levels provide strong support for the hypothesis that private R&D has a strong positive effect on productivity. Moreover, relative R&D spending patterns in these three countries in the 1970s and 1980s are consistent with the relative productivity levels (table 1): during the 1970s nondefense R&D spending grew least in the United States; in the 1980s, it grew least in Germany.
With regard to labor quality van Ark and Pilat considered the effects on productivity levels in 1987 (but not on growth rates) of differences in the distribution of workers by educational qualifications. They re- duced education-related wage differentials "by 40 percent to exclude the effect of other factors . . . such as ability or social background." This adjustment is rather ad hoc. Also, although reducing the wage differential in this way may be appropriate for determining the rate of return to education, I do not think that it is appropriate for quality- adjusting labor input.
The authors might have considered disaggregating labor input by other attributes potentially correlated with productivity, especially age. Adjusting for age might be very important in light of the very different experiences those three countries have had in terms of the size and age structures of their populations and labor forces. Between 1965 and 1987 the percentage increases in the labor forces of these countries were: Germany, 4 percent; Japan, 27 percent; and the United States, 61 per- cent.

60 Brookings Papers: Microeconomics 2, 1993
Table 2. Median Age of Population of Germany, Japan, and the United States, 1950-90
Year Germany Japan United States
1950 34.6 22.3 30.2 1960 34.4 25.5 29.4 1970 34.3 29.0 27.9 1980 36.7 32.6 30.0 1990 38.5 36.8 32.8
Percentage increase 1950-80 6.1 46.2 -0.1 1980-90 4.9 12.9 9.3
Source: United Nations. 1986. World Population Prospects: Estimates and Projections as Assessed in 1984. Population Studies 98. New York.
Table 2 presents data on the median age of the populations of these countries from 1950 to 1990. (It would be preferable to have data on the age distribution of manufacturing workers.) Again, the pre- and post-1980 changes in median age "fit" the changes in relative produc- tivity. The United States is the only country whose median age declined between 1950 and 1980 (due to the "baby boom"). This may have reduced its relative productivity: the age-earnings profile is positively sloped (at least up until age fifty-five or so), although this does not necessarily arise from a positively sloped age-productivity profile. In the 1980s the median age of Americans increased more than that of Germans.
After "correcting" for capital intensity and labor quality, the authors make further adjustments for the effects of industrial structure and firm size. They argue that "a concentration in activities with a low absolute level of value added per hour worked may help explain a relative low productivity level for manufacturing as a whole in one country com- pared with another." Of course, if factors were mobile, we would expect productivity to be equalized across sectors. The authors do not "explain their explanation": why don't labor and capital move from low- to high-productivity activities?
I have the same reservation about their adjustment for firm size. The authors argue that "labor productivity gaps between countries are to some extent related to differences in firm size" because "plants with few employees show lower value added per person employed than large

Bart van Ark and Dirk Pilat 61
Table 3. Output and Investment per Employee and Total Factor Productivity, by Establishment Sizes
Size VA INV N EMP YIL IIL TFP
1-249 316,308 25,430 335,318 8,355 37.9 3.04 27.1 ?250 507,811 49,161 13,067 9,463 53.7 5.20 32.7
Source: Author's calculations, based on Bureau of the Census, U.S. Department of Commerce. 1985. 1982 Census of Manufactures MC82-S-I (Part 2) Subject Series, General Summary, Industry Statistics by Employment Size of Establish- ment. December.
Notes: Size = number of employees. EMP = total number of employees, in thousands. VA = value added, in millions of dollars. Y/L = VA/EMP.
INV = capital expenditures, in millions of dollars. I/L = INV/EMP. N = number of establishments. TFP = (Y/L)/[(I/L)0.31.
plants," and countries have different distributions of plant size. Why don't resources flow from small to large firms? Actually, it is the size of the establishment (or "local unit"), rather than the size of the firm, that the authors adjust for. They argue that "the local unit is the most relevant concept for an analysis of the impact of average size on pro- ductivity. "2 This is not necessarily the case; I have found that the total factor productivity of a plant is positively related to the size of the parent firm (measured by the number of plants owned by the parent).'
Even if adjustment for each of the productivity determinants consid- ered by the authors-capital intensity, labor quality, industrial struc- ture, and firm size-is appropriate, those adjustments should be made simultaneously rather than sequentially, because the adjustments are not generally independent. Sequential adjustment poses the risk of un- der- or (more likely) over-adjustment, when the adjustments are cor- related. Table 3, based on U.S. Census of Manufactures data, indicates that investment (and capital stock) per worker are higher in large estab- lishments: capital intensity and firm size are positively correlated. The authors' separate adjustments for the two effects probably overadjust.
General Discussion: Methodological and measurement issues domi- nated the discussion. Several participants argued the merits of the au- thors' choosing to use unit value ratios in currency conversion rather
2. The definition of median establishment size is somewhat peculiar. Apparently what this means is the size of the establishment in which the median employee (ranked by establishment size) is employed. The median establishment size (about ten) is smaller than the mean (about fifty).
3. Lichtenberg (1992a).

62 Brookings Papers: Microeconomics 2, 1993
than purchasing power parities. Robert Gordon said that unit values yield poor results because they are completely contaminated by changes in the product mix. He stressed that he had been able to use them in his own work for only two homogeneous programs where additional infor- mation on unit sizes had been available. Eric Bartlesman, however, argued that the authors had chosen correctly because unit value ratios allowed them to collect both price and quantity data from the same source. By contrast, he said, the Bureau of Labor Statistics has been creating industry-based producer price indexes from inconsistent data sources, without knowing what prices to collect and for which products. Steven Davis contended that the reliability of unit value ratios could be confirmed if it were shown that they helped to explain cross-industry patterns of trade flows.
Zvi Griliches suggested that the authors use an indicator other than median age to measure age effects on productivity because that indicator is highly insensitive to the changes in the age structure occurring in the labor forces of these countries. Ernst Berndt noted that the paper reports much lower labor factor shares for Japan than for Germany and the United States. He surmised that this is an error, attributable to the exclusion of year-end bonuses from the Japanese data on labor income; these bonuses represent a substantial portion of total labor compensation in Japan. Berndt said that correcting the data should bring Japanese labor factor shares up to the level of the other two countries. Wondering why some of the variables explain productivity gaps at the industry level but not at the level of manufacturing as a whole, Ishaq Nadiri said that the authors need to explore this phenomenon more closely.
Michelle White noted that workers in European countries generally have longer vacations, shorter work weeks, more generous disability leaves, and lower retirement ages than workers in the United States. Because these factors would seem to give Europe a healthier, fresher labor force than the United States has and consequently would have a positive effect on relative European productivity, she suggested con- trolling for them in international productivity comparisons.
John Helliwell argued that there is inadequate understanding of the international transmission of technological knowledge, which is a key factor driving productivity convergence. Noting that this transfer is not

Bart van Ark and Dirk Pilat 63
taking place through higher rates of investment in the less productive countries than in the more productive ones, as many earlier studies had suggested, Helliwell urged that more attention be paid to this issue.
Robert Gordon said that one of the most well-known and important facts presented in the paper is that the yen has appreciated almost 300 percent against the dollar in the last two decades. Because greater productivity growth and high inflation in Japan does not account for this appreciation, Gordon said, one must ask how the Japanese continue to be so competitive in their trade with the United States. This phenom- enon, he said, could best be attributed to the marketing of new products, which for various reasons American consumers purchase even if the products are relatively expensive. He also suggested that quality dif- ferences, which should show up in productivity differentials, might not be accounted for properly. As an example, he argued that it would not be unreasonable to think that seemingly homogeneous products, such as Japanese-made and American-made bricks, vary in quality.
Peter Reiss said that this paper and many of the studies cited by the authors tend to assume that productivity should be converging. This assumption needs to be more closely scrutinized, he said, because it relies on a presumption of perfect factor mobility, which is clearly not present in a world of government regulations and trade barriers. Reiss also suggested that even if convergence were occurring, it might be hidden in the data by using average productivity levels for making the international comparisons. He argued that because consumption choices vary across countries, it is necessary to compare marginal productivity levels.
Robert Summers said that the paper might force changes in assump- tions about the overall productivity gap between the United States and Japan. He noted a recent tendency to revise data to show that relative Japanese labor productivity is greater than previously presumed-about 80 percent of the U.S. level, rather than 70 percent. Combining the paper's results showing that Japanese manufacturing productivity is only 80 percent of the U.S. level with the commonly held presumption that Japanese service and agricultural sectors have lower relative pro- ductivity than their manufacturing sector must mean, Summers said, that overall Japanese labor productivity is somewhat lower than 80

64 Brookings Papers: Microeconomics 2, 1993
percent of the U.S. level. His own Penn World Table (Summers- Heston) estimates for 1989 are 74 percent for output per employee and 64 percent for output per manhour.
Commenting on the authors' finding that relative German manufac- turing productivity had been retrogressing over the past decade, Gordon argued that capacity in Germany is no longer enough to employ the labor force at unemployment rates of fifteen years ago. He suggested that there must be some relation between the productivity and capacity problems.

Bart van Ark and Dirk Pilat 65
References
Abramovitz, Moses. 1986. "Catching Up, Forging Ahead, and Falling Be- hind." Journal of Economic History 46 (June): 385-406.
Arrison, Thomas S., C. Fred Bergsten, Edward M. Graham, and Martha C. Harris, eds. 1992. Japan's Growing Technological Capability: Implications for the U.S. Economy. Washington, D.C.: National Academy Press.
Baily, Martin Neil, and Alok K. Chakrabarti. 1988. Innovation and the Pro- ductivity Crisis. Washington, D.C.: Brookings.
Baily, Martin Neil, and Charles L. Schultze. 1990. "The Productivity of Capital in a Period of Slower Growth." Brookings Papers on Economic Activity: Microeconomics: 1990: 369-406.
Baily, Martin Neil, and Robert J. Gordon. 1988. "The Productivity Slowdown, Measurement Issues, and the Explosion of Computer Power." Brookings Papers on Economic Activity 2: 347-431.
Baumol, William J. 1986. "Productivity Growth, Convergence, and Welfare: What the Long-Run Data Show." American Economic Review 76 (Decem- ber): 1072-85.
Baumol, William J., Sue Anne Batey Blackman, and Edward N. Wolff. 1989. Productivity and American Leadership: The Long View. Cambridge, Mass.: MIT Press.
Blades, Derek W. 1993. "Comparing Capital Stocks." In Szirmai, Adam E., Bart van Ark, and Dirk Pilat, eds. Explaining Economic Growth. Amster- dam: North-Holland.
Broadberry Stephen N. 1992. "Manufacturing and the Convergence Hypoth- esis; What the Long-Run Data Show." CEPR Discussion Paper 708. Center for Economic Policy Research, London. July.
Conrad, Klaus. 1985. Produktivitatslucken nach Wirtschaftssweigen im inter- nationalen Vergleich. Berlin: Springer-Verlag.
Conrad, Klaus, and Dale W. Jorgenson. 1985. "Sectoral Productivity Gaps between the United States, Japan, and Germany, 1960-1979." In Giersch, Hans, ed. Probleme under Perspektiven der weltwirtschaftlichen Entwick- lung. Munich: Duncker and Humbolt.
Crafts, Nicholas F. R. 1992. "Productivity Growth Reconsidered." Economic Policy 15 (October): 388-462.
Daly, Anne. 1984. "Education and Productivity: A Comparison of Britain and the United States. " British Journal of Industrial Relations 24 (July): 251- 66.
Daly, Anne, D. M. W. N. Hitchens, and Karin Wagner. 1985. "Productivity, Machinery, and Skills in a Sample of British and German Manufacturing Plants." National Institute Economic Review (February): 48-61.

66 Brookings Papers: Microeconomics 2, 1993
De Long, J. Bradford. 1988. "Productivity, Convergence, and Welfare: Com- ment." American Economic Review 78 (December): 1138-54.
De Long, J. Bradford, and Lawrence H. Summers. 1992. "Equipment Invest- ment and Economic Growth." Quarterly Journal of Economics 106 (May): 445-502.
Denison, Edward F. 1962. Sources of Economic Growth in the United States and the Alternatives before Us. New York: Committee for Economic De- velopment.
1967. Why Growth Rates Differ. Washington, D.C.: Brookings. Estimates of Productivity Change by Industry: An Evaluation and an
Alternative. Washington, D.C.: Brookings. Diewert, W. Erwin. 1981. "The Economic Theory of Index Numbers." In
Deaton, Angus, ed. Essays in the Theory and Measurement of Consumer Behavior. Cambridge, Eng.: Cambridge University Press.
Dollar, David, and Edward N. Wolff. 1988. "Convergence of Industry Labor Productivity among Advanced Economies, 1963-1982." Review of Econom- ics and Statistics 70 (November): 549-58.
Englander, A. Steven, and Axel Mittelstadt. 1988. "Total Factor Productivity: Macroeconomic and Structural Aspects of the Slowdown. " OECD Economic Studies 10 (Spring): 7-56.
Gordon Robert J., and Martin Neil Baily. 1991. "Measurement Issues and the Productivity Slowdown in Five Major Industrial Countries." In Organization for Economic Cooperation and Development. Technology and Productivity: The Challenge for Economic Policy. Paris.
Hooper, Peter, and Kathryn A. Larin. 1989. "International Comparisons of Labor Costs in Manufacturing." Review of Income and Wealth 35 (Decem- ber): 335-56.
Hulten, Charles R. 1992. "Accounting for the Wealth of Nations: The Net Versus Gross Controversy and Its Ramifications." Scandinavian Economic Journal 94 (Supplement): 9-24.
Jorgenson, Dale W. 1989. "Capital as a Factor of Production." In Joregenson, Dale W., and Ralph Landau, eds. Technology and Capital Formation. Cam- bridge, Mass.: MIT Press.
1990. "Productivity and Economic Growth." In Berndt, Ernst R., and Jack Triplett, eds. Fifty Years of Economic Measurement. Chicago: University of Chicago Press.
Jorgenson, Dale W., Frank M. Gollop, and Barbara M. Fraumeni. 1987. Productivity and U. S. Economic Growth. Amsterdam: North-Holland.
Jorgenson, Dale W., and Masahiro Kuroda. 1992. "Productivity and Interna- tional Competitiveness in Japan and the United States, 1960-1985." Eco- nomic Studies Quarterly 43 (December): 313-25.
Jorgenson, Dale W., Masahiro Kuroda, and Mieko Nishimizu. 1987. "Japan-

Bart van Ark and Dirk Pilat 67
U.S. Industry-level Comparisons, 1960-1979." Journal of the Japanese and International Economies 1 (March): 1-30.
Kendrick, John W. 1975. Productivity Trends in the United States, 1948- 1969. New York: National Bureau of Economic Research.
Kravis, Irving B., Alan W. Heston, and Robert Summers. 1982. World Product and Income: International Comparisons of Real Growth Product. Baltimore: Johns Hopkins University Press.
Lawrence, Robert Z. 1984. Can America Compete? Washington, D.C.: Brook- ings.
. 1991. "Issues in Measurement and International Comparison of Out- put Growth in Manufacturing." In Hooper, Peter, and J. David Richardson, eds. International Economic Transactions: Issues in Measurement and Em- pirical Research. Chicago: University of Chicago Press.
Lichtenberg, Frank R. 1992a. Corporate Takeovers and Productivity. Cam- bridge, Mass.: MIT Press.
. 1992b. R&D Investment and International Productivity Differences. Working Paper 4161. National Bureau of Economic Research, Cambridge, Mass. September.
Lichtenberg, Frank R., and Zvi Griliches. 1989. "Errors of Measurement in Output Deflators." Journal of Business and Economic Statistics 7 (January): 1-9.
Lucas, Robert E. 1988. "On the Mechanics of Economic Development." Journal of Monetary Economics 22 (July): 3-42.
Maddison, Angus. 1982. Phases of Capitalist Development. Oxford, Oxford University Press.
. 1991. Dynamic Forces in Capitalist Development. New York: Oxford University Press.
Maddison, Angus, and Bart van Ark. 1988. "Comparisons of Real Output in Manufacturing." Policy, Planning, and Research Working Paper 5. World Bank, Washington, D.C.
Maddison, Angus, and H. van Ooststroom. 1993. "The International Com- parison of Value Added, Productivity, and Purchasing Power Parities in Agriculture." Research Memorandum GD-1. Groningen Growth and De- velopment Centre, Groningen.
Marston, Richard C. 1990. "Pricing to Market in Japanese Manufacturing." Journal of International Economics 29 (November): 217-36.
McKinsey Global Institute. 1993. Manufacturing Productivity. Washington, D.C.
Mulder, N., and Angus Maddison. 1993. "A New Approach to International Comparisons of Performance in Distribution: Value Added, Labor Produc- tivity, and PPPs in Mexican and U.S. Wholesale and Retail Trade, 1975/

68 Brookings Papers: Microeconomics 2, 1993
7." Research Memorandum GD-2. Groningen Growth and Development Centre, Groningen.
Nelson, Richard R., and Gavin Wright. 1992. "The Rise and Fall of American Technological Leadership: The Postwar Era in Historical Perspective." Journal of Economic Literature 30 (December): 1931-64.
Ockel, W. and P. Schreyer. 1988. "Beschaftigungsentwicklung im Bereich Unternehmensorientierter Dienstleistungen: USA-Bundesrepublik im Ver- gleich." Beihefte der Konjunkturpolitik 35:139-73.
OECD (Organization for Economic Cooperation and Development). 1992. Pur- chasing Power Parities and Real Expenditures, 1990. Paris.
Ohno, Kenichi. 1989. "Export Pricing Behavior of Manufacturing: A U.S.- Japan Comparison." IMF Staff Papers 36 (September): 55-79.
Paige, Deborah, and Gottfried Bombach. 1959. A Comparison of National Output and Productivity. Paris: Organization for European Economic Co- operation.
Pilat, Dirk. 1993. The Catch-Up Factor in Economic Growth: The Experience of Korea and Japan. Monograph Series 2. Groningen Growth and Devel- opment Centre, Groningen.
Pilat, Dirk, and D. S. Prasada Rao. 1991. "A Multilateral Approach to Inter- national Comparisons of Real Output, Productivity, and Purchasing Power Parities in Manufacturing." Research Memorandum 440. Institute of Eco- nomic Research, Groningen.
Prais, S. J. 1981. Productivity and Industrial Structure. London: Cambridge University Press.
Prasada Rao, D. S. 1993. Intercountry Comparisons of Agricultural Output and Productivity. FAO Economic and Social Development Paper 112. Food and Agriculture Organization, Rome.
Romer Paul M. 1990. "Capital, Labor, and Productivity." Brookings Papers on Economic Activity: Microeconomics: 1990: 337-67.
Rostas, Laszlo. 1948. Comparative Productivity in British and American In- dustry. London: Cambridge University Press.
Sinclair, James, and Brian Catron. 1990. "An Experimental Price Index for the Computer Industry." Monthly Labor Review 113 (October): 16-24.
Solow, Robert M. 1957. "Technical Change and the Aggregate Production Function." Review of Economics and Statistics 39 (August): 312-20.
1988. "Growth Theory and After." American Economic Review 78 (June): 301-17.
Summers, Robert, and Alan W. Heston. 1988. "A New Set of International Comparisons of Real Product and Price Levels: Estimates for 130 Countries, 1950-1985." Review of Income and Wealth 34 (March): 1-25.
1991. "The Penn World Table (Mark 5): An Expanded Set of Inter-

Bart van Ark and Dirk Pilat 69
national Comparisons. 1950- 1988. " Quarterly Journal of Economics 106 (May): 327-68.
Szirmai, Adam, and Dirk Pilat. 1990. "The International Comparison of Real Output and Labor Productivity in Manufacturing: A Study for Japan, South Korea, and the USA for 1975." Research Memorandum 354. Institute of Economic Research, Groningen.
van Ark. Bart. 1990. "Comparative Levels of Manufacturing Productivity in Postwar Europe: Measurement and Comparisons." Oxford Bulletin of Eco- nomics and Statistics 52 (November): 343-73.
. Forthcoming. The Economics of Convergence: A Comparative Anal- ysis of Industrial Productivity since 1950. Aldershot, Eng.: Edward Elgar Publishers.
Young, Allan H. 1989. "BEA's Measurement of Computer Output." Survey of Current Business 69 (July): 108-15.