Embed Size (px)
Citation preview
24 December 2016NEW ZEALAND OPTICS
BY DR ANMAR ABDUL-RAHMAN*
Optical coherence tomography angiography (OCT-A) is a nascent non-invasive imaging OCT modality applicable to retinal and optic
nerve assessment of the microvascular network1. Its main indication is in the diagnosis and follow up of exudative and ischemic maculopathies in addition to establishing a diagnosis of some forms of optic neuropathy where there is associated atrophy or vasculopathy.
Due to the similarity of OCT-A and the more familiar fluorescein/indocyanine green angiography (FFA/ICG) images it is prudent to note when interpreting OCT-A images there is a poor concordance in regards to hyper-fluorescence (FFA/ICG) and hyper-reflectivity (OCT-A), the two methods are complementary and not comparative2. Table 1. compares the attributes of the two techniques.
All images in this article are obtained using the DRI Triton Swept Source OCT (SS-OCT), which utilises central wavelength 1,050 nm, allowing some level of imaging through optical opacities. Scan speed 100,000 A-scan/sec.
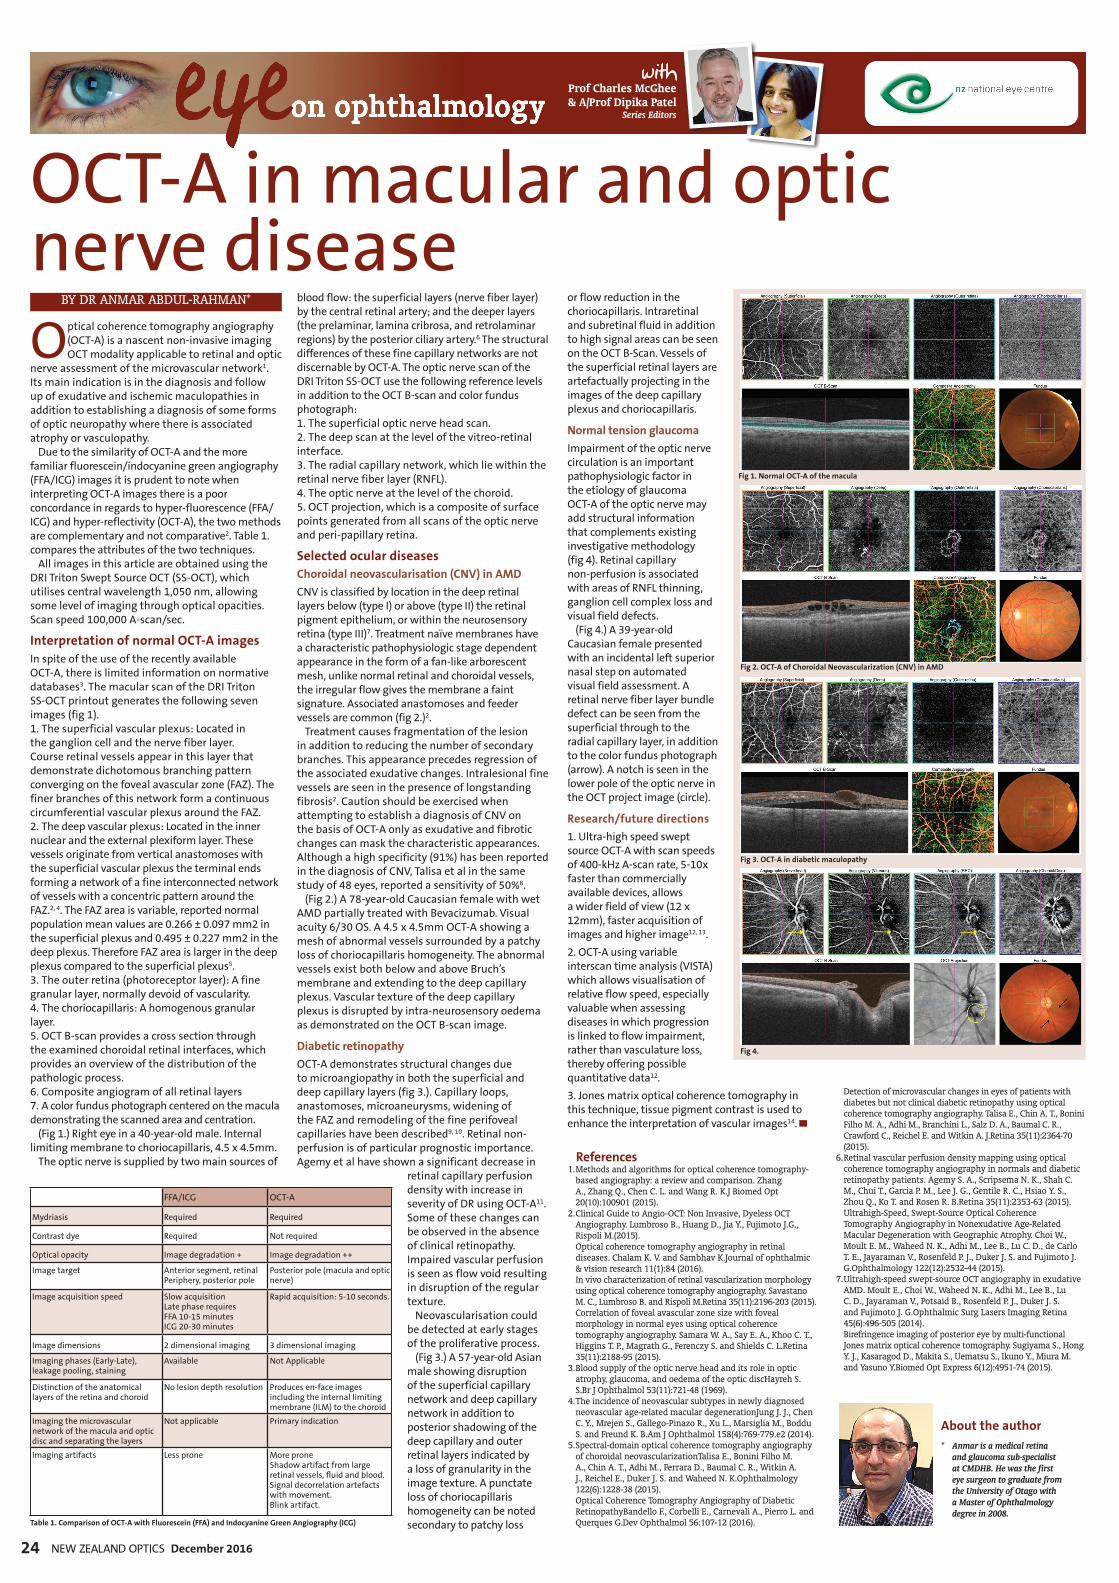
Interpretation of normal OCT-A imagesIn spite of the use of the recently available OCT-A, there is limited information on normative databases3. The macular scan of the DRI Triton SS-OCT printout generates the following seven images (fig 1).1. The superficial vascular plexus: Located in the ganglion cell and the nerve fiber layer. Course retinal vessels appear in this layer that demonstrate dichotomous branching pattern converging on the foveal avascular zone (FAZ). The finer branches of this network form a continuous circumferential vascular plexus around the FAZ. 2. The deep vascular plexus: Located in the inner nuclear and the external plexiform layer. These vessels originate from vertical anastomoses with the superficial vascular plexus the terminal ends forming a network of a fine interconnected network of vessels with a concentric pattern around the FAZ.2, 4. The FAZ area is variable, reported normal population mean values are 0.266 ± 0.097 mm2 in the superficial plexus and 0.495 ± 0.227 mm2 in the deep plexus. Therefore FAZ area is larger in the deep plexus compared to the superficial plexus5. 3. The outer retina (photoreceptor layer): A fine granular layer, normally devoid of vascularity.4. The choriocapillaris: A homogenous granular layer. 5. OCT B-scan provides a cross section through the examined choroidal retinal interfaces, which provides an overview of the distribution of the pathologic process. 6. Composite angiogram of all retinal layers 7. A color fundus photograph centered on the macula demonstrating the scanned area and centration.
(Fig 1.) Right eye in a 40-year-old male. Internal limiting membrane to choriocapillaris, 4.5 x 4.5mm.
The optic nerve is supplied by two main sources of
blood flow: the superficial layers (nerve fiber layer) by the central retinal artery; and the deeper layers (the prelaminar, lamina cribrosa, and retrolaminar regions) by the posterior ciliary artery.6 The structural differences of these fine capillary networks are not discernable by OCT-A. The optic nerve scan of the DRI Triton SS-OCT use the following reference levels in addition to the OCT B-scan and color fundus photograph:1. The superficial optic nerve head scan.2. The deep scan at the level of the vitreo-retinal interface.3. The radial capillary network, which lie within the retinal nerve fiber layer (RNFL).4. The optic nerve at the level of the choroid.5. OCT projection, which is a composite of surface points generated from all scans of the optic nerve and peri-papillary retina.
Selected ocular diseasesChoroidal neovascularisation (CNV) in AMD
CNV is classified by location in the deep retinal layers below (type I) or above (type II) the retinal pigment epithelium, or within the neurosensory retina (type III)7. Treatment naïve membranes have a characteristic pathophysiologic stage dependent appearance in the form of a fan-like arborescent mesh, unlike normal retinal and choroidal vessels, the irregular flow gives the membrane a faint signature. Associated anastomoses and feeder vessels are common (fig 2.)2.
Treatment causes fragmentation of the lesion in addition to reducing the number of secondary branches. This appearance precedes regression of the associated exudative changes. Intralesional fine vessels are seen in the presence of longstanding fibrosis2. Caution should be exercised when attempting to establish a diagnosis of CNV on the basis of OCT-A only as exudative and fibrotic changes can mask the characteristic appearances. Although a high specificity (91%) has been reported in the diagnosis of CNV, Talisa et al in the same study of 48 eyes, reported a sensitivity of 50%8.
(Fig 2.) A 78-year-old Caucasian female with wet AMD partially treated with Bevacizumab. Visual acuity 6/30 OS. A 4.5 x 4.5mm OCT-A showing a mesh of abnormal vessels surrounded by a patchy loss of choriocapillaris homogeneity. The abnormal vessels exist both below and above Bruch’s membrane and extending to the deep capillary plexus. Vascular texture of the deep capillary plexus is disrupted by intra-neurosensory oedema as demonstrated on the OCT B-scan image.
Diabetic retinopathy
OCT-A demonstrates structural changes due to microangiopathy in both the superficial and deep capillary layers (fig 3.). Capillary loops, anastomoses, microaneurysms, widening of the FAZ and remodeling of the fine perifoveal capillaries have been described9, 10. Retinal non-perfusion is of particular prognostic importance. Agemy et al have shown a significant decrease in
retinal capillary perfusion density with increase in severity of DR using OCT-A11. Some of these changes can be observed in the absence of clinical retinopathy. Impaired vascular perfusion is seen as flow void resulting in disruption of the regular texture.
Neovascularisation could be detected at early stages of the proliferative process.
(Fig 3.) A 57-year-old Asian male showing disruption of the superficial capillary network and deep capillary network in addition to posterior shadowing of the deep capillary and outer retinal layers indicated by a loss of granularity in the image texture. A punctate loss of choriocapillaris homogeneity can be noted secondary to patchy loss
or flow reduction in the choriocapillaris. Intraretinal and subretinal fluid in addition to high signal areas can be seen on the OCT B-Scan. Vessels of the superficial retinal layers are artefactually projecting in the images of the deep capillary plexus and choriocapillaris.
Normal tension glaucoma
Impairment of the optic nerve circulation is an important pathophysiologic factor in the etiology of glaucoma OCT-A of the optic nerve may add structural information that complements existing investigative methodology (fig 4). Retinal capillary non-perfusion is associated with areas of RNFL thinning, ganglion cell complex loss and visual field defects.
(Fig 4.) A 39-year-old Caucasian female presented with an incidental left superior nasal step on automated visual field assessment. A retinal nerve fiber layer bundle defect can be seen from the superficial through to the radial capillary layer, in addition to the color fundus photograph (arrow). A notch is seen in the lower pole of the optic nerve in the OCT project image (circle).
Research/future directions
1. Ultra-high speed swept source OCT-A with scan speeds of 400-kHz A-scan rate, 5-10x faster than commercially available devices, allows a wider field of view (12 x 12mm), faster acquisition of images and higher image12, 13.
2. OCT-A using variable interscan time analysis (VISTA) which allows visualisation of relative flow speed, especially valuable when assessing diseases in which progression is linked to flow impairment, rather than vasculature loss, thereby offering possible quantitative data12.
3. Jones matrix optical coherence tomography in this technique, tissue pigment contrast is used to enhance the interpretation of vascular images14. ▀
with Prof Charles McGhee & A/Prof Dipika Patel
Series Editors
About the author * Anmar is a medical retina
and glaucoma sub-specialist at CMDHB. He was the first eye surgeon to graduate from the University of Otago with a Master of Ophthalmology degree in 2008.
References1. Methods and algorithms for optical coherence tomography-
based angiography: a review and comparison. Zhang A., Zhang Q., Chen C. L. and Wang R. K.J Biomed Opt 20(10):100901 (2015).
2. Clinical Guide to Angio-OCT: Non Invasive, Dyeless OCT Angiography. Lumbroso B., Huang D., Jia Y., Fujimoto J.G., Rispoli M.(2015). Optical coherence tomography angiography in retinal diseases. Chalam K. V. and Sambhav K.Journal of ophthalmic & vision research 11(1):84 (2016). In vivo characterization of retinal vascularization morphology using optical coherence tomography angiography. Savastano M. C., Lumbroso B. and Rispoli M.Retina 35(11):2196-203 (2015). Correlation of foveal avascular zone size with foveal morphology in normal eyes using optical coherence tomography angiography. Samara W. A., Say E. A., Khoo C. T., Higgins T. P., Magrath G., Ferenczy S. and Shields C. L.Retina 35(11):2188-95 (2015).
3. Blood supply of the optic nerve head and its role in optic atrophy, glaucoma, and oedema of the optic discHayreh S. S.Br J Ophthalmol 53(11):721-48 (1969).
4. The incidence of neovascular subtypes in newly diagnosed neovascular age-related macular degenerationJung J. J., Chen C. Y., Mrejen S., Gallego-Pinazo R., Xu L., Marsiglia M., Boddu S. and Freund K. B.Am J Ophthalmol 158(4):769-779.e2 (2014).
5. Spectral-domain optical coherence tomography angiography of choroidal neovascularizationTalisa E., Bonini Filho M. A., Chin A. T., Adhi M., Ferrara D., Baumal C. R., Witkin A. J., Reichel E., Duker J. S. and Waheed N. K.Ophthalmology 122(6):1228-38 (2015). Optical Coherence Tomography Angiography of Diabetic RetinopathyBandello F., Corbelli E., Carnevali A., Pierro L. and Querques G.Dev Ophthalmol 56:107-12 (2016).
FFA/ICG OCT-A
Mydriasis Required Required
Contrast dye Required Not required
Optical opacity Image degradation + Image degradation ++
Image target Anterior segment, retinal Periphery, posterior pole
Posterior pole (macula and optic nerve)
Image acquisition speed Slow acquisition Late phase requires FFA 10-15 minutes ICG 20-30 minutes
Rapid acquisition: 5-10 seconds.
Image dimensions 2 dimensional imaging 3 dimensional imaging
Imaging phases (Early-Late), leakage pooling, staining
Available Not Applicable
Distinction of the anatomical layers of the retina and choroid
No lesion depth resolution Produces en-face images including the internal limiting membrane (ILM) to the choroid
Imaging the microvascular network of the macula and optic disc and separating the layers
Not applicable Primary indication
Imaging artifacts Less prone More proneShadow artifact from large retinal vessels, fluid and blood. Signal decorrelation artefacts with movement. Blink artifact.
OCT-A in macular and optic nerve disease
Table 1. Comparison of OCT-A with Fluorescein (FFA) and Indocyanine Green Angiography (ICG)
Fig 1. Normal OCT-A of the macula
Fig 2. OCT-A of Choroidal Neovascularization (CNV) in AMD
Fig 3. OCT-A in diabetic maculopathy
Fig 4.
Detection of microvascular changes in eyes of patients with diabetes but not clinical diabetic retinopathy using optical coherence tomography angiography. Talisa E., Chin A. T., Bonini Filho M. A., Adhi M., Branchini L., Salz D. A., Baumal C. R., Crawford C., Reichel E. and Witkin A. J.Retina 35(11):2364-70 (2015).
6. Retinal vascular perfusion density mapping using optical coherence tomography angiography in normals and diabetic retinopathy patients. Agemy S. A., Scripsema N. K., Shah C. M., Chui T., Garcia P. M., Lee J. G., Gentile R. C., Hsiao Y. S., Zhou Q., Ko T. and Rosen R. B.Retina 35(11):2353-63 (2015). Ultrahigh-Speed, Swept-Source Optical Coherence Tomography Angiography in Nonexudative Age-Related Macular Degeneration with Geographic Atrophy. Choi W., Moult E. M., Waheed N. K., Adhi M., Lee B., Lu C. D., de Carlo T. E., Jayaraman V., Rosenfeld P. J., Duker J. S. and Fujimoto J. G.Ophthalmology 122(12):2532-44 (2015).
7. Ultrahigh-speed swept-source OCT angiography in exudative AMD. Moult E., Choi W., Waheed N. K., Adhi M., Lee B., Lu C. D., Jayaraman V., Potsaid B., Rosenfeld P. J., Duker J. S. and Fujimoto J. G.Ophthalmic Surg Lasers Imaging Retina 45(6):496-505 (2014). Birefringence imaging of posterior eye by multi-functional Jones matrix optical coherence tomography. Sugiyama S., Hong Y. J., Kasaragod D., Makita S., Uematsu S., Ikuno Y., Miura M. and Yasuno Y.Biomed Opt Express 6(12):4951-74 (2015).


![Submitted By: Dipika Agarwal [B13025 ]](https://img.pdfslide.net/doc/110x75/5681649c550346895dd67f14/submitted-by-dipika-agarwal-b13025-.jpg)