Embed Size (px)
Citation preview

Prof. D.N. ReddyDirector
Centre for Energy TechnologyUniversity College of Engineering
Osmania University.

Thermal performance
• The main impact of the Supercritical Cycle is to
increase the overall plant efficiency by reducing Fuel
consumption for Unit of Power Generated.
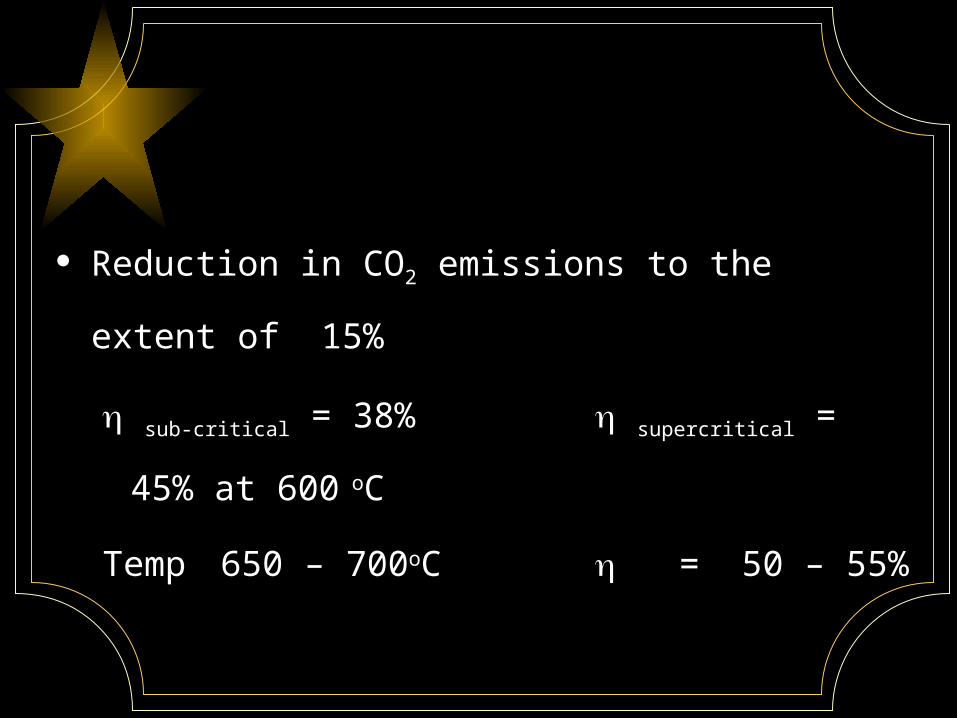
Reduction in CO2 emissions to the extent of 15%
sub-critical = 38% supercritical = 45% at 600 oC
Temp 650 – 700oC = 50 – 55%
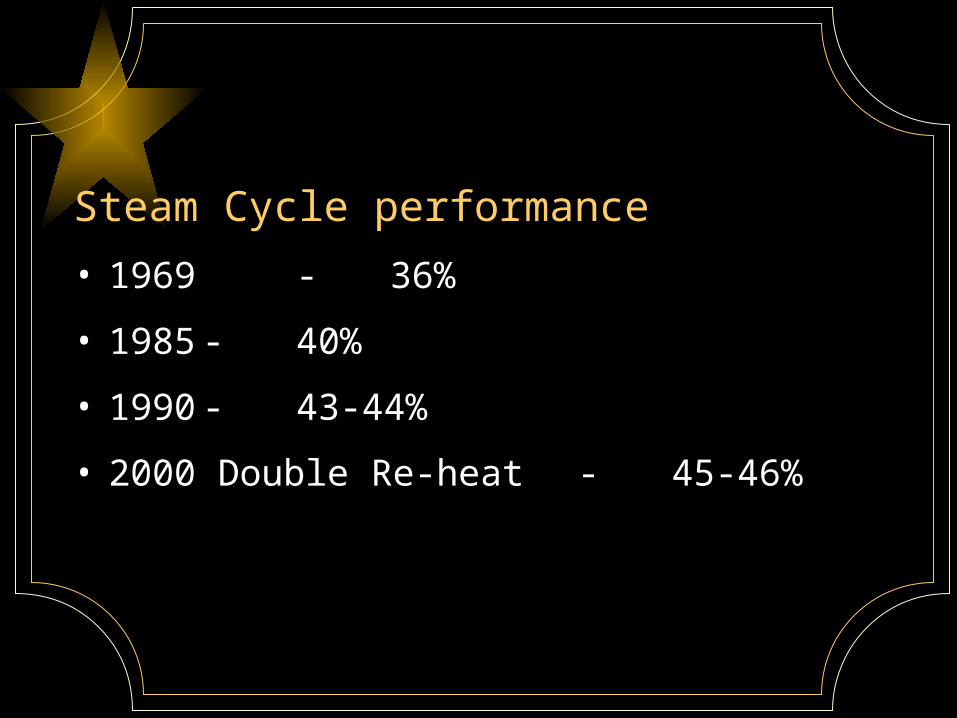
Steam Cycle performance
• 1969 - 36%
• 1985 - 40%
• 1990 - 43-44%
• 2000 Double Re-heat - 45-46%
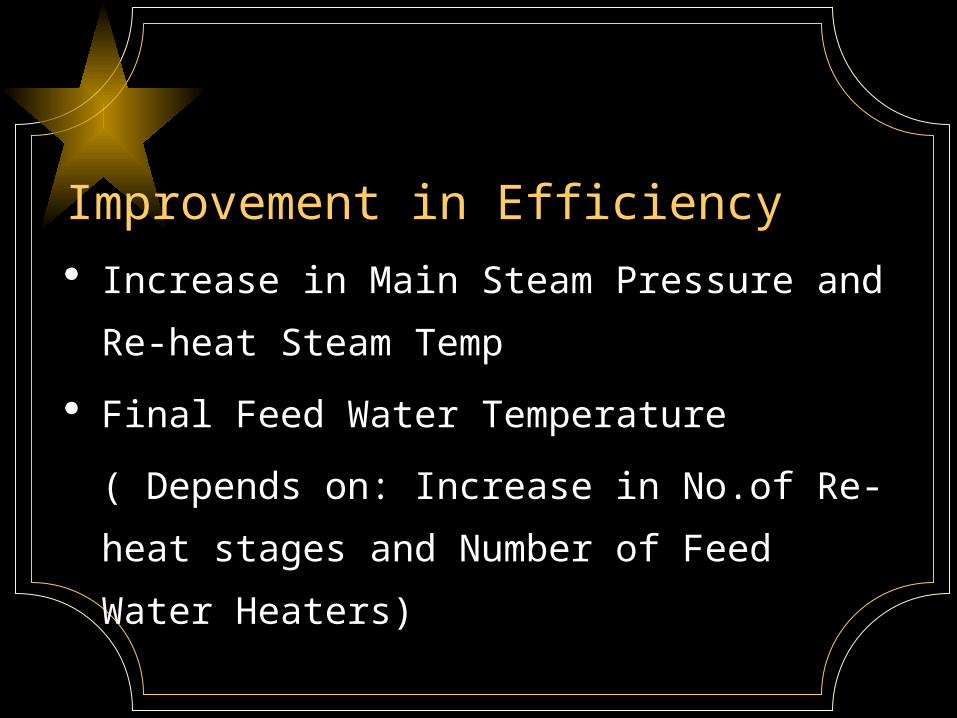
Improvement in Efficiency
Increase in Main Steam Pressure and Re-heat Steam
Temp
Final Feed Water Temperature
( Depends on: Increase in No.of Re-heat stages and
Number of Feed Water Heaters)

BOILER EXIT GAS TEMPERATURE
( 20oC reduction increases Efficiency by 1.1%)
Condensor pressure
Reduction of Auxillary Power Consumption
Improvement in Component Efficiencies
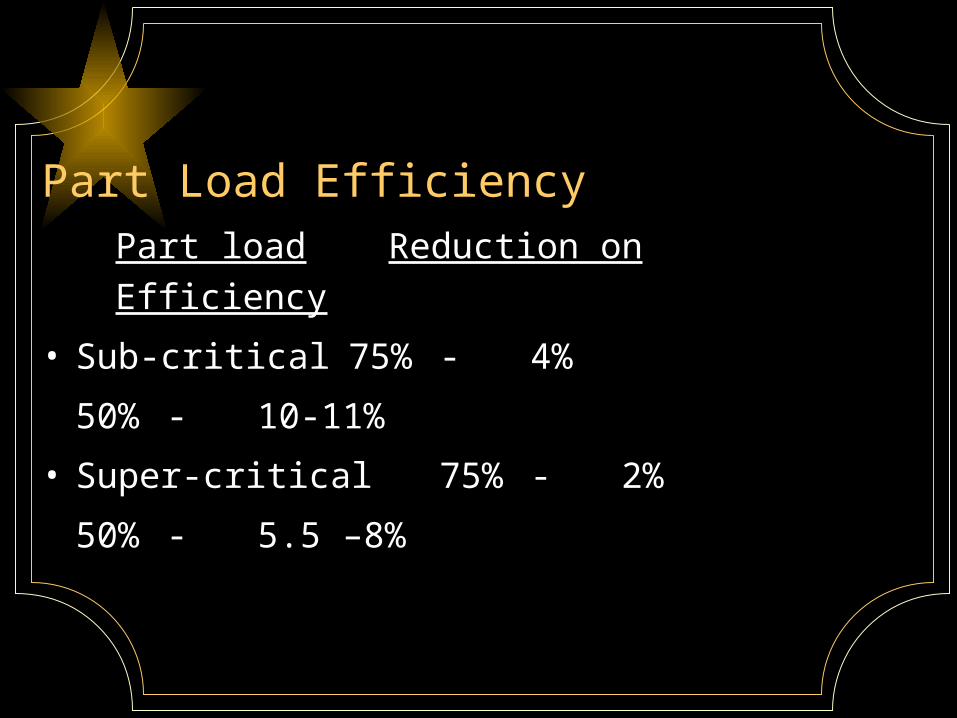
Part Load Efficiency
Part load
Reduction on
Efficiency
• Sub-critical 75% - 4%
50% - 10-11%
• Super-critical 75% - 2%
50% - 5.5 –8%

Boiler Design Optimisation
• Sub-Critical Boilers - Drum Boilers Steam
and
Water Separated in the
evaporator
• Super-Critical - Once-through design
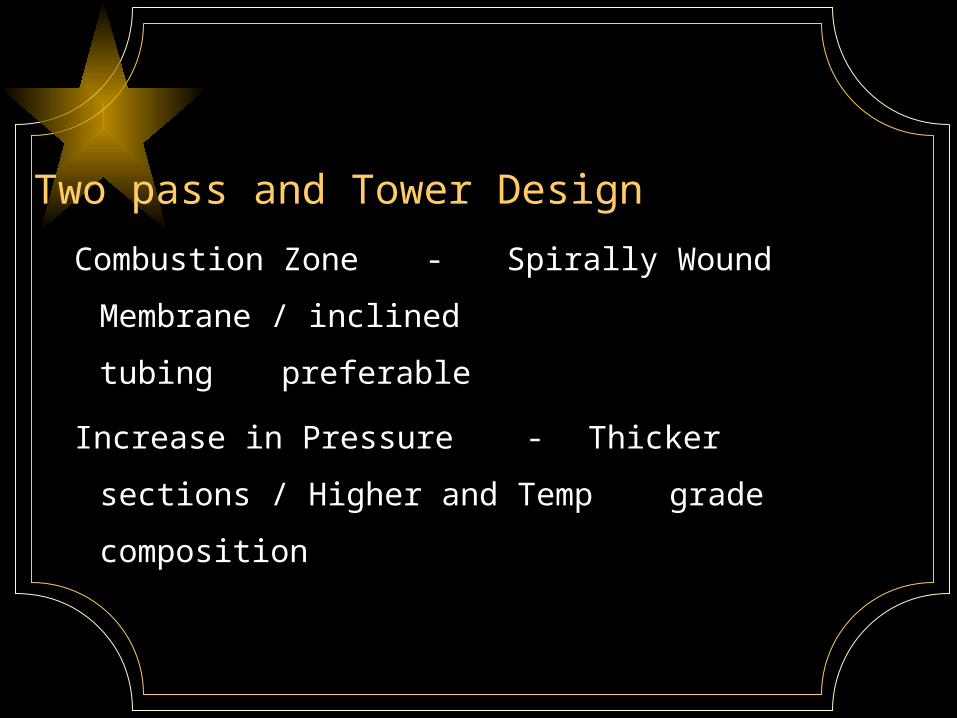
Two pass and Tower Design
Combustion Zone - Spirally Wound
Membrane / inclined
tubing preferable
Increase in Pressure - Thicker sections / Higher and
Temp grade composition
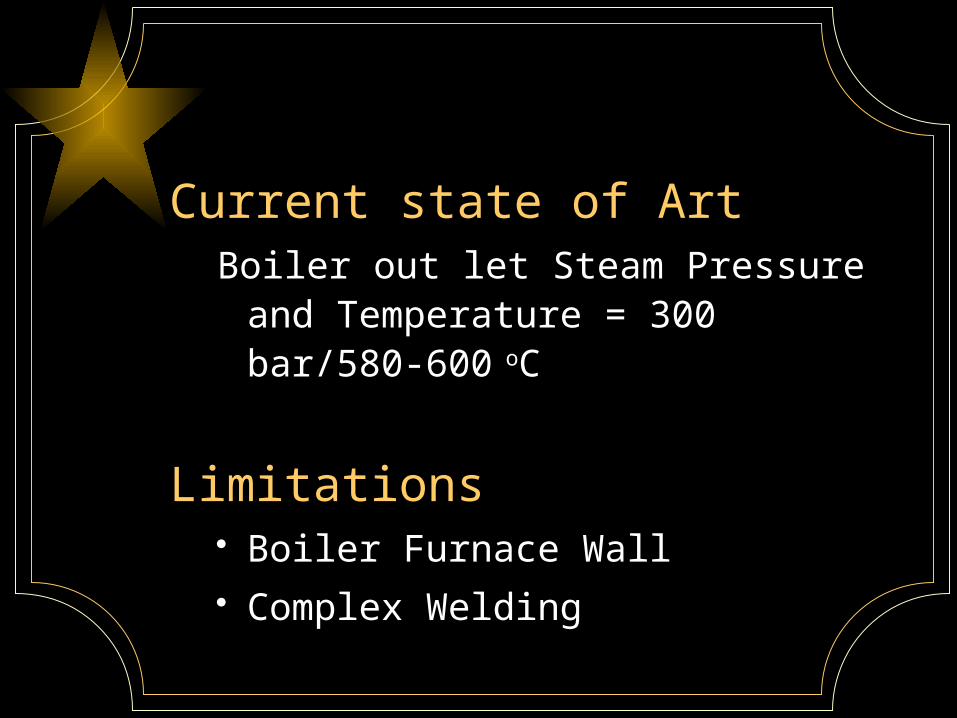
Current state of ArtBoiler out let Steam Pressure and
Temperature = 300 bar/580-600 oC
Limitations Boiler Furnace Wall Complex Welding
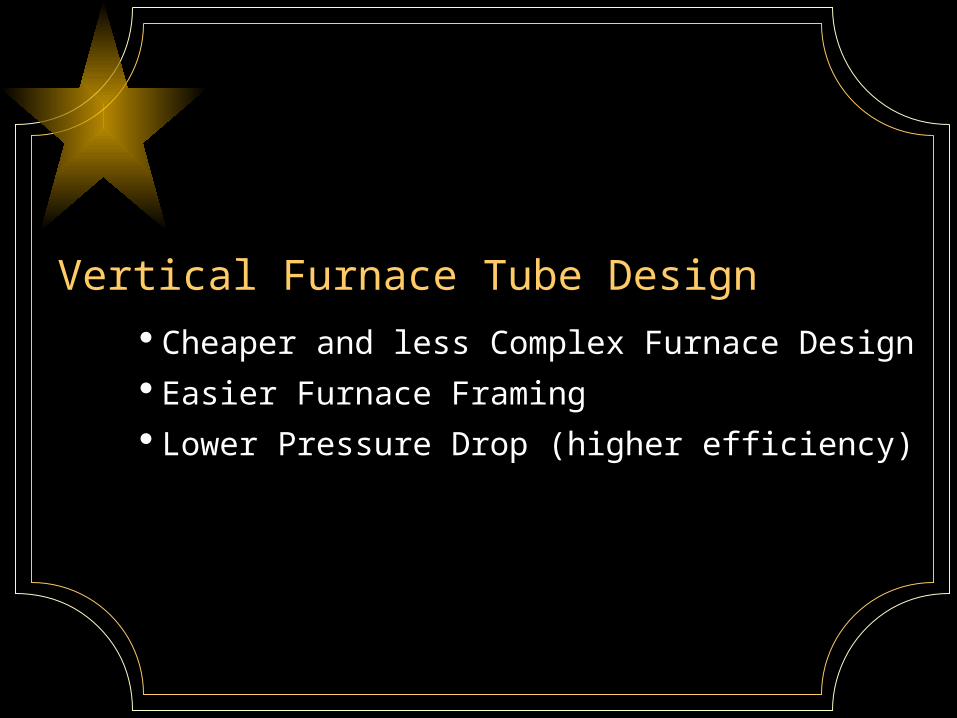
Vertical Furnace Tube Design
Cheaper and less Complex Furnace Design
Easier Furnace Framing
Lower Pressure Drop (higher efficiency)
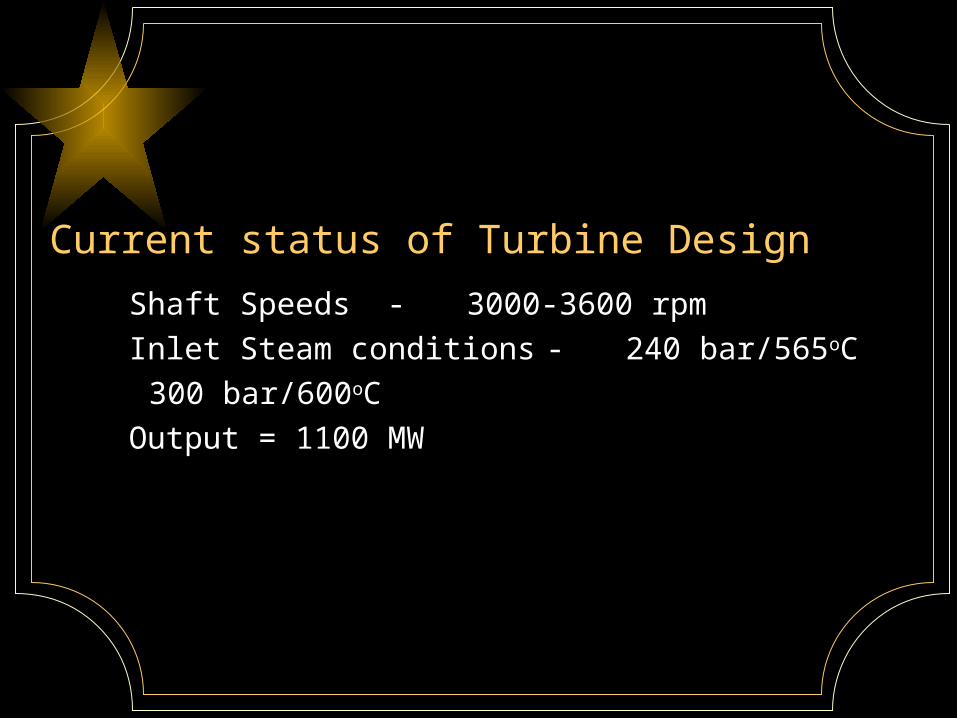
Current status of Turbine Design
Shaft Speeds - 3000-3600 rpm
Inlet Steam conditions - 240 bar/565oC
300 bar/600oC
Output = 1100 MW

Feed Water Pumps
Boiler Feed Water Pumps - 3-4% of gross
power output
Feed Water Temperature - 280 – 300oC
Flue Gas Temperature - 120oC
(can be reduced to 80oC using Heat Recovery System)
Upstream Flue gas De-Sulfurization

Improvement in Efficiency
Heat Recovery System = 0.6% Coal Fired
= 1.0% Lignite Fire

Turbine and Cycle Optimisation Improved blading profiles making use of Modern
CFD Technologies
Higher Final Feed Temperature and Bled Steam
Temperature
Bled Steam Tapping off the HP cylinder

Improved Efficiency of Auxillaries
Lower condenser pressures using larger
condensers and large exhaust areas
Large unit sizes improving Turbine Efficiencies
Increasing automation and level of controls
Optimising plant layout
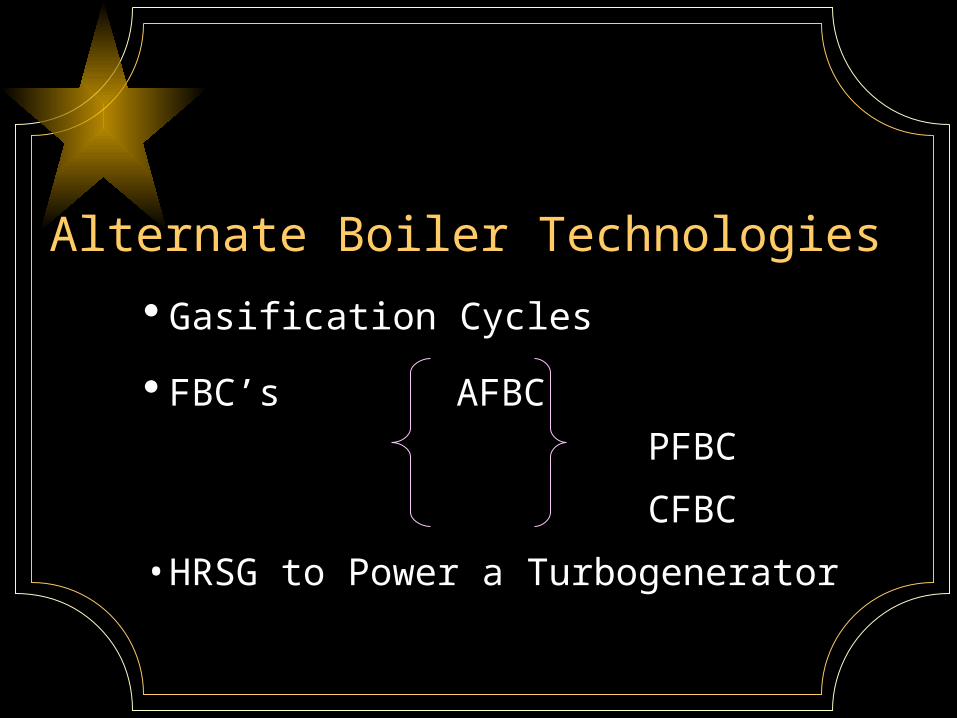
Alternate Boiler Technologies
Gasification Cycles
FBC’s AFBC
PFBC
CFBC
• HRSG to Power a Turbogenerator
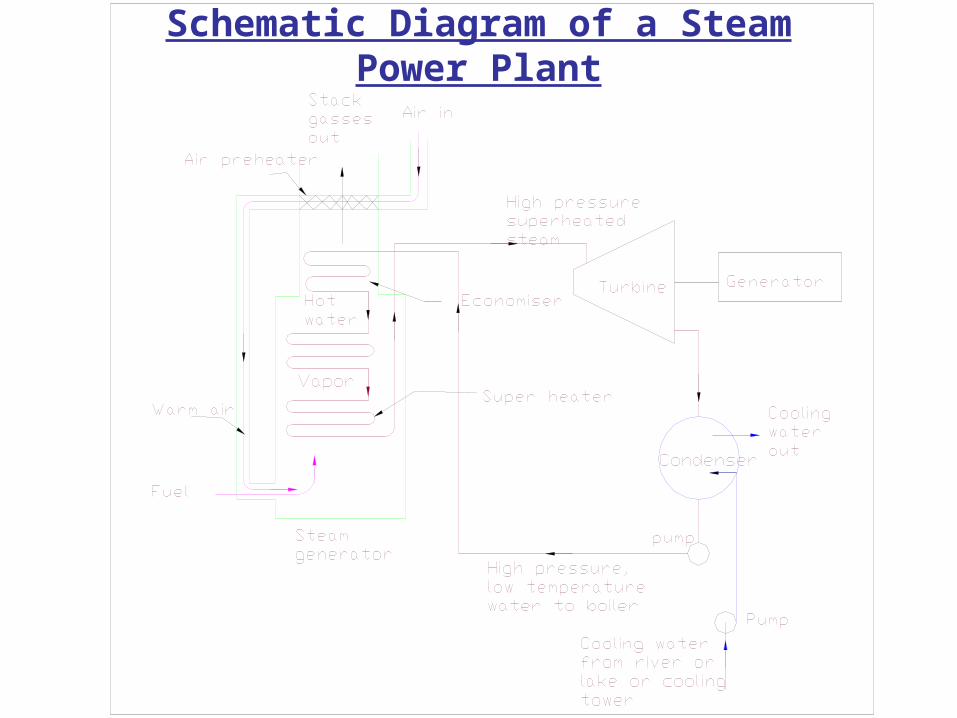
Schematic diagram of a steam power plantSchematic Diagram of a Steam Power Plant

Process plant diagramProcess Plant Diagram
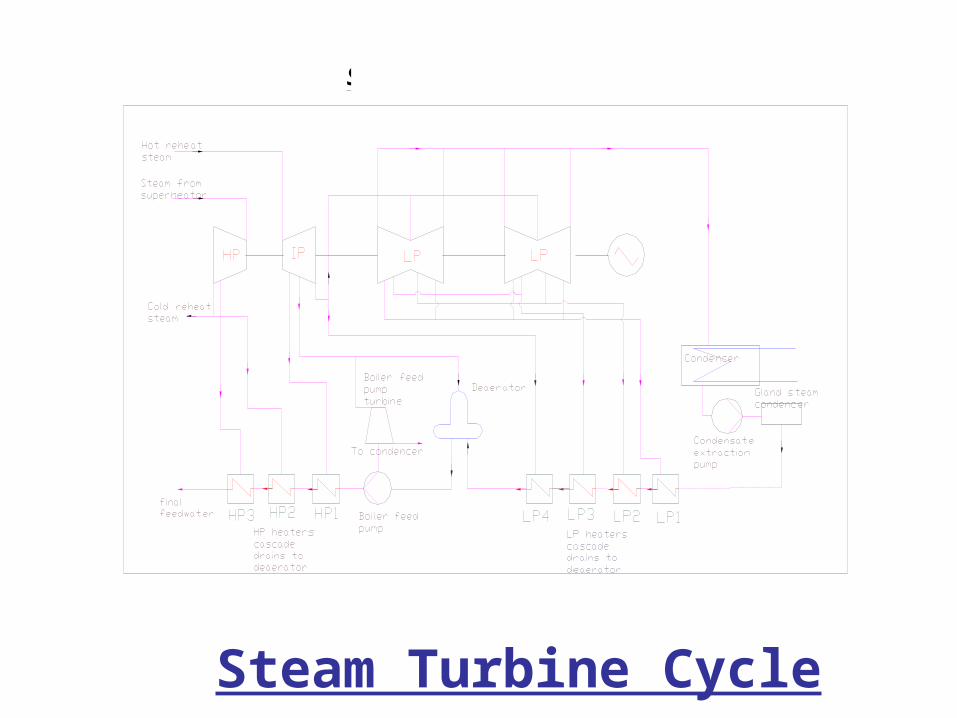
Steam turbine cycle
Steam Turbine Cycle

The ideal reheat cycleThe Ideal Reheat Cycle

The ideal regenerative cycleThe Ideal Regenerative Cycle
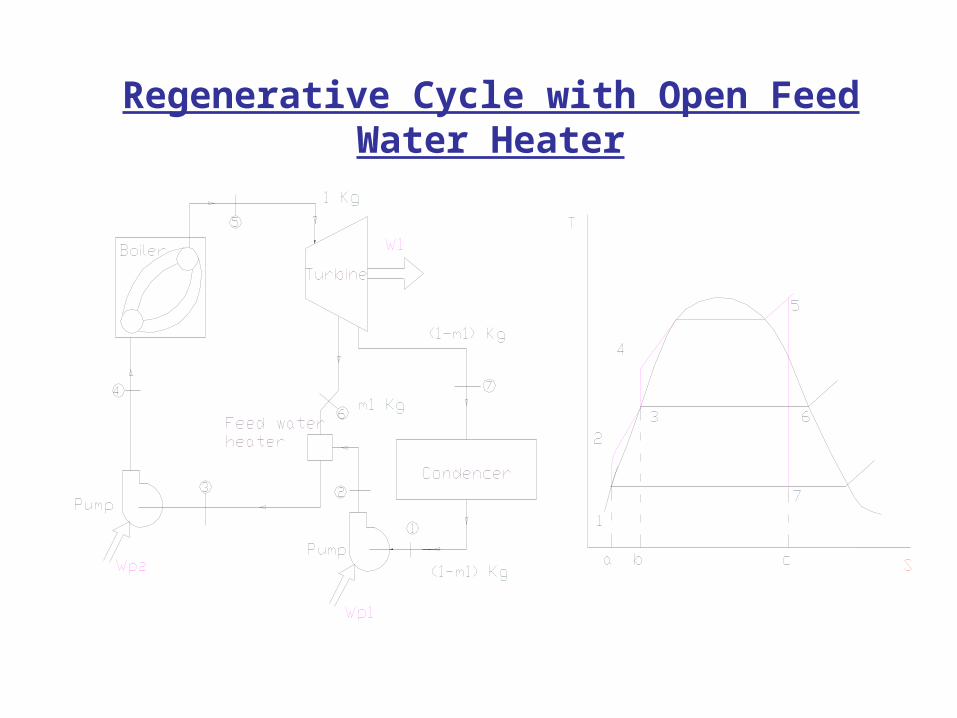
Regenerative cycle with open feed water heaterRegenerative Cycle with Open Feed Water Heater
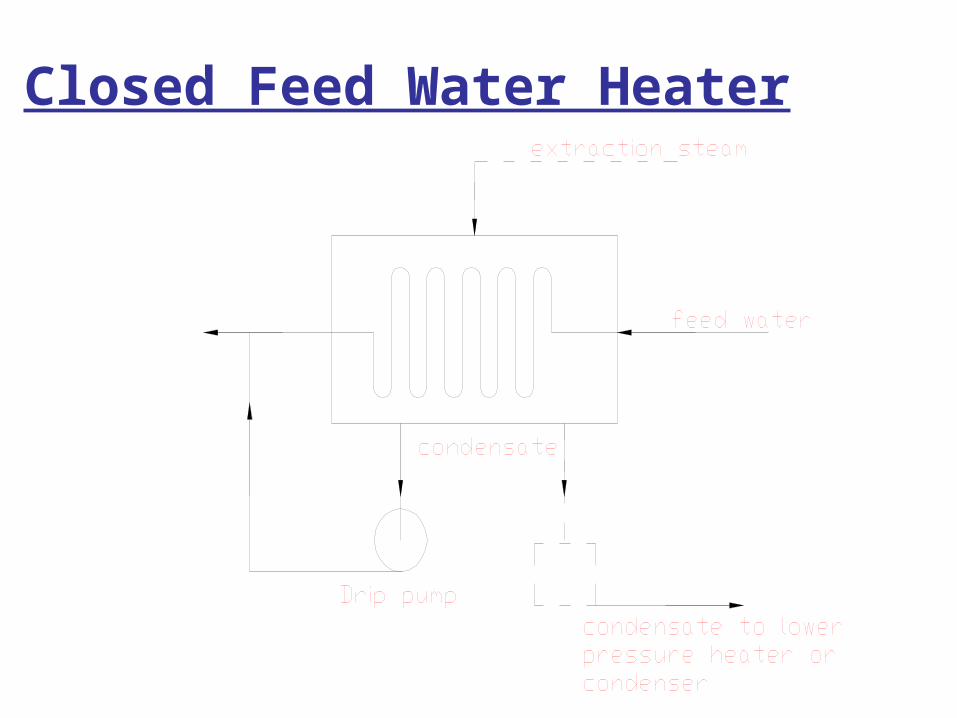
Closed Feed Water Heater
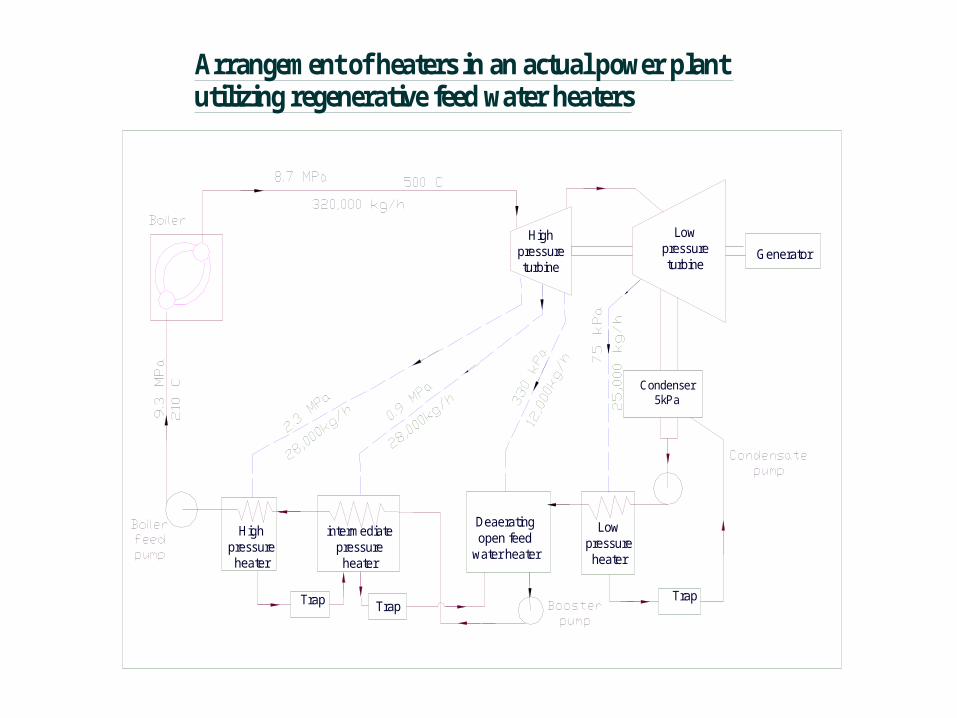
Arrangement of heaters in an actual power plant utilizing regenerative feed water heaters
High pressure turbine
Deaerating open feed
water heater
High pressure heater
intermediate pressure heater
Trap Trap
Low pressure heater
Trap
Condenser 5kPa
Low pressure turbine
Generator
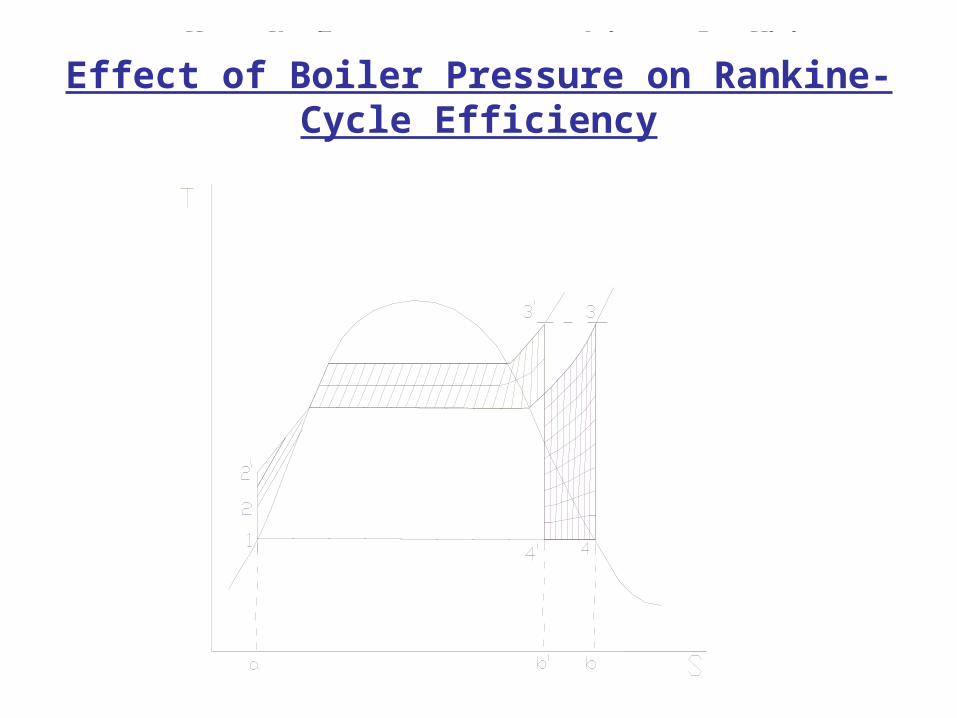
Effect of boiler pressure on Rankine-cycle efficiency
Effect of Boiler Pressure on Rankine-Cycle Efficiency
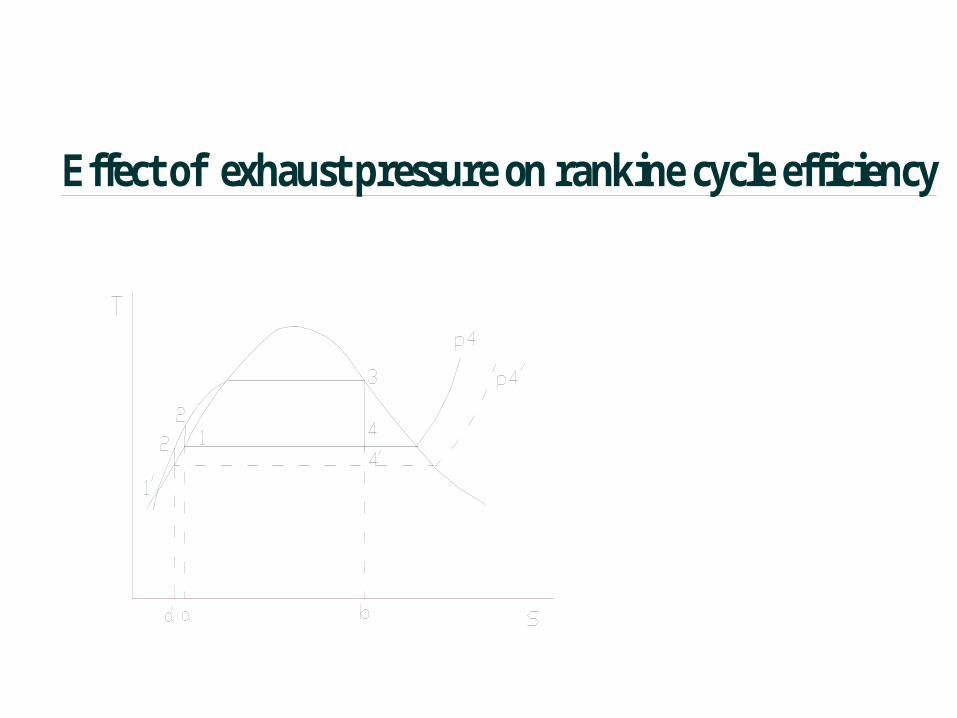
Effect of exhaust pressure on rankine cycle efficiency
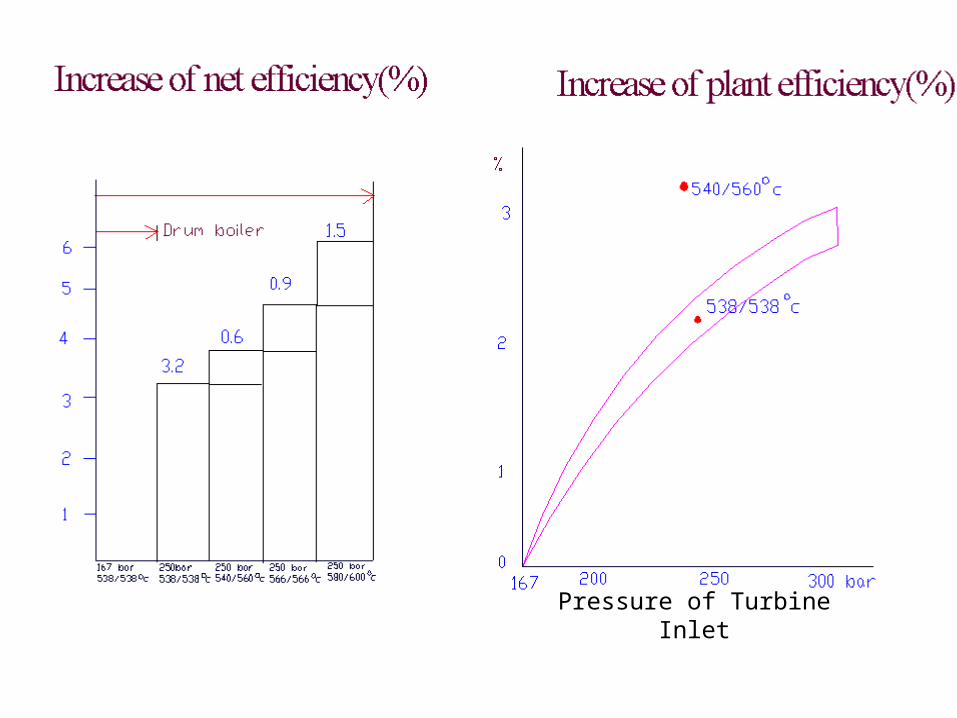
Pressure of Turbine Inlet
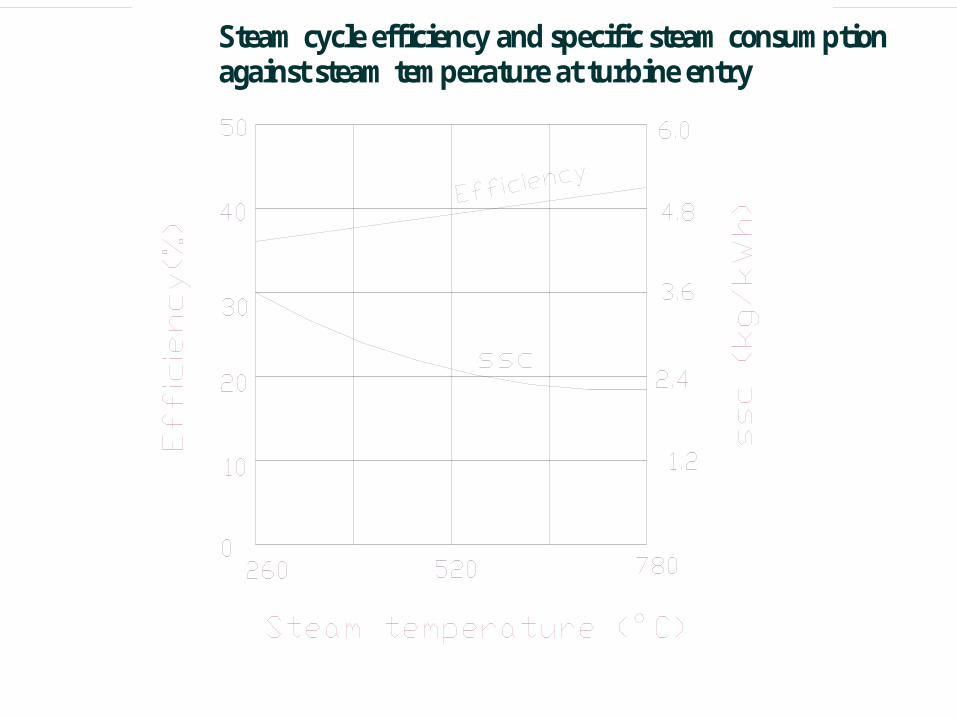
Steam cycle efficiency and specific steam consumption against steam temperature at turbine entry