Embed Size (px)
Citation preview
Prof. dr. Bart Baesens
Department of Decision Sciences and Information Management,
KU Leuven (Belgium)
School of Management, University of Southampton (United Kingdom)
Twitter/Facebook/YouTube: DataMiningApps
www.dataminingapps.com
ROCKING ANALYTICS IN A DATA FLOODED
WORLD: CHALLENGES AND OPPORTUNITIES
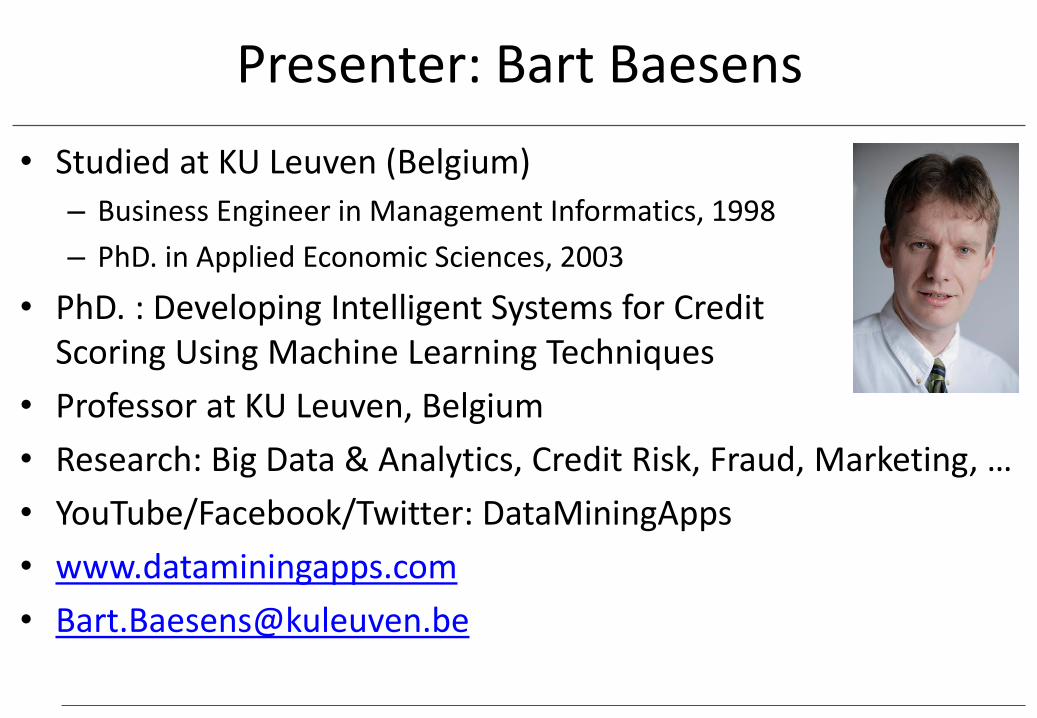
Presenter: Bart Baesens
• Studied at KU Leuven (Belgium)
– Business Engineer in Management Informatics, 1998
– PhD. in Applied Economic Sciences, 2003
• PhD. : Developing Intelligent Systems for CreditScoring Using Machine Learning Techniques
• Professor at KU Leuven, Belgium
• Research: Big Data & Analytics, Credit Risk, Fraud, Marketing, …
• YouTube/Facebook/Twitter: DataMiningApps
• www.dataminingapps.com
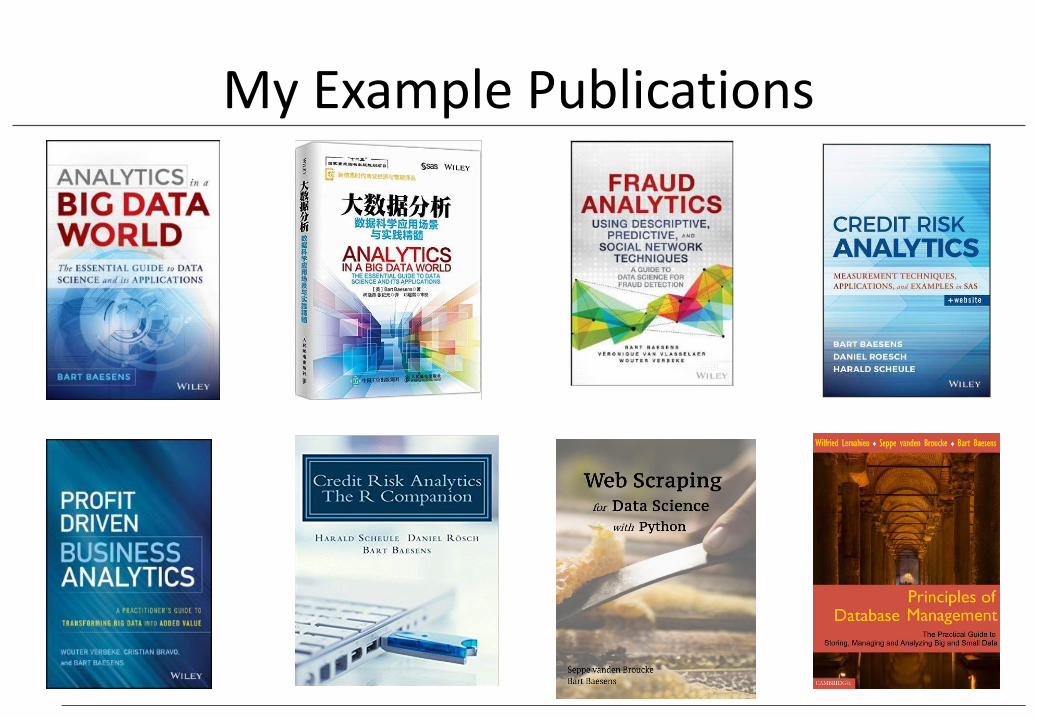
My Example Publications
My Example Publications
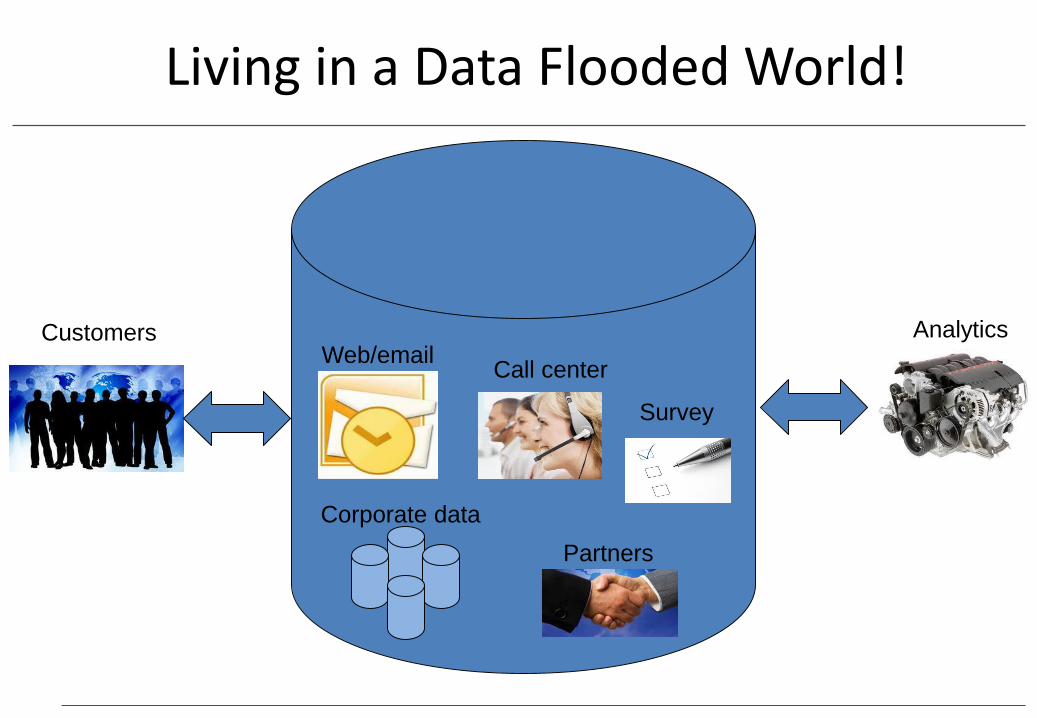
Living in a Data Flooded World!
Web/email
Partners
Corporate data
Call center
Analytics
Survey
Customers
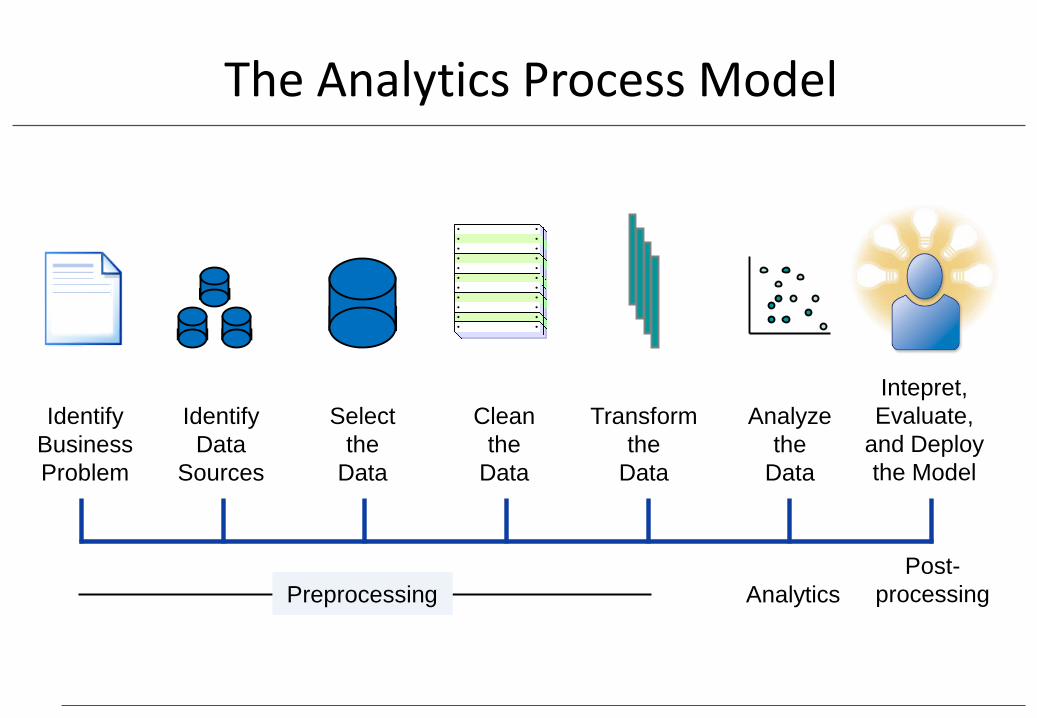
The Analytics Process Model
Identify
Business
Problem
Identify
Data
Sources
Select
the
Data
Clean
the
Data
Transform
the
Data
Analyze
the
Data
Intepret,
Evaluate,
and Deploy
the Model
Preprocessing Analytics
Post-
processing
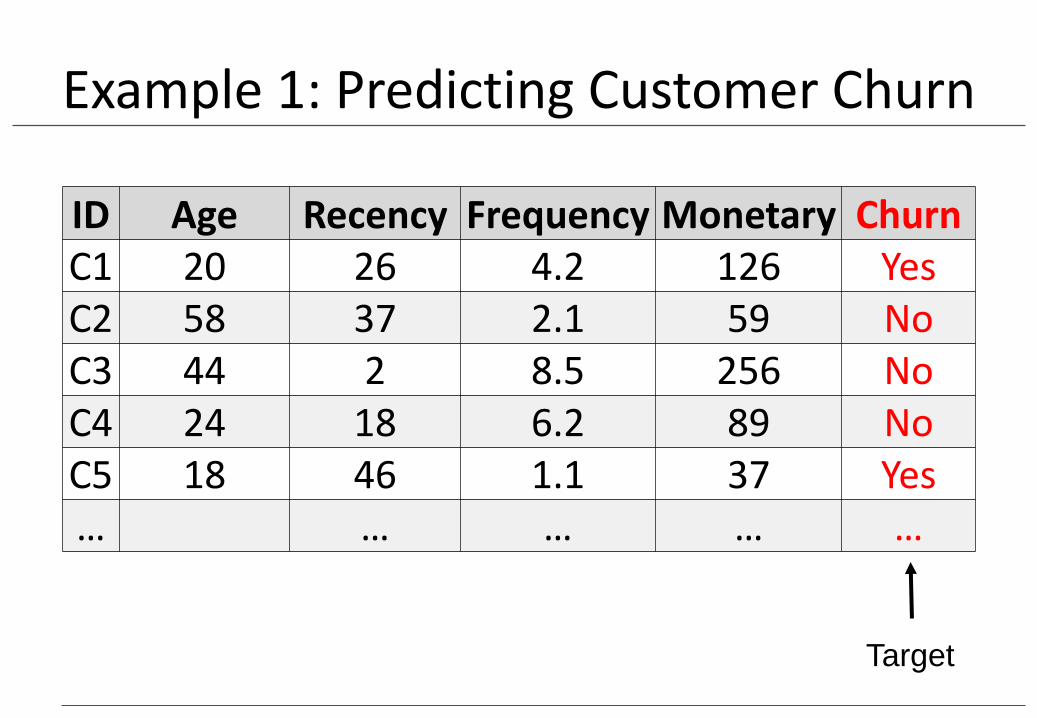
Example 1: Predicting Customer Churn
Target
ID Age Recency Frequency Monetary ChurnC1 20 26 4.2 126 YesC2 58 37 2.1 59 NoC3 44 2 8.5 256 NoC4 24 18 6.2 89 NoC5 18 46 1.1 37 Yes… … … … …
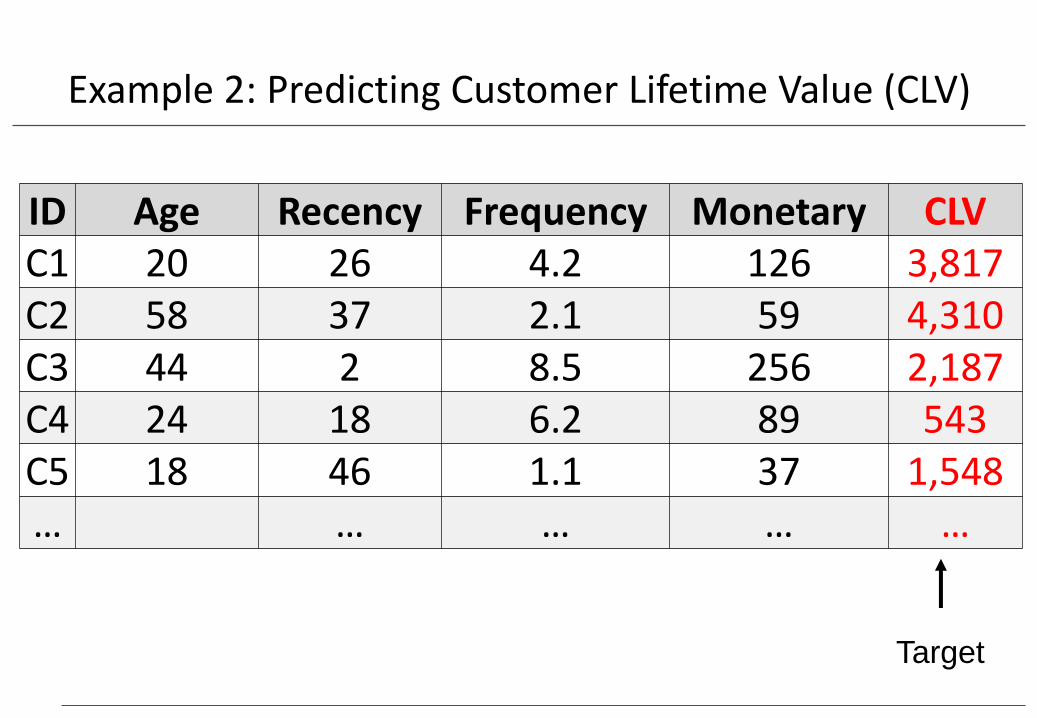
Example 2: Predicting Customer Lifetime Value (CLV)
ID Age Recency Frequency Monetary CLV C1 20 26 4.2 126 3,817C2 58 37 2.1 59 4,310C3 44 2 8.5 256 2,187C4 24 18 6.2 89 543C5 18 46 1.1 37 1,548… … … … …
Target
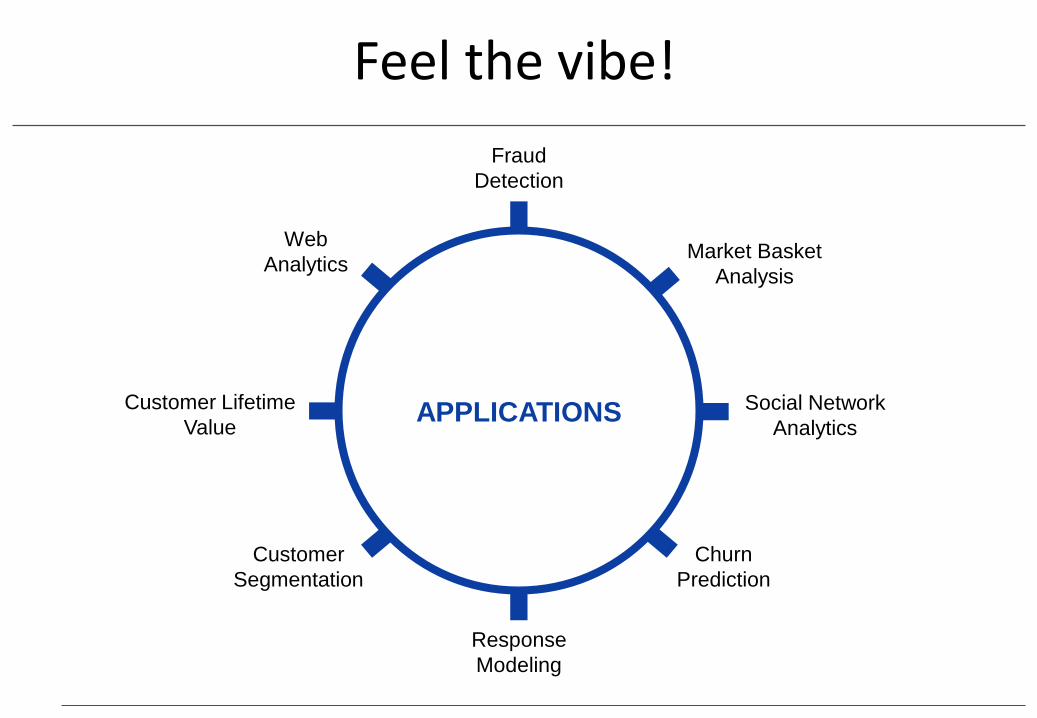
Feel the vibe!
APPLICATIONS
Fraud
Detection
Social Network
Analytics
Response
Modeling
Customer Lifetime
Value
Market Basket
Analysis
Churn
Prediction
Customer
Segmentation
Web
Analytics
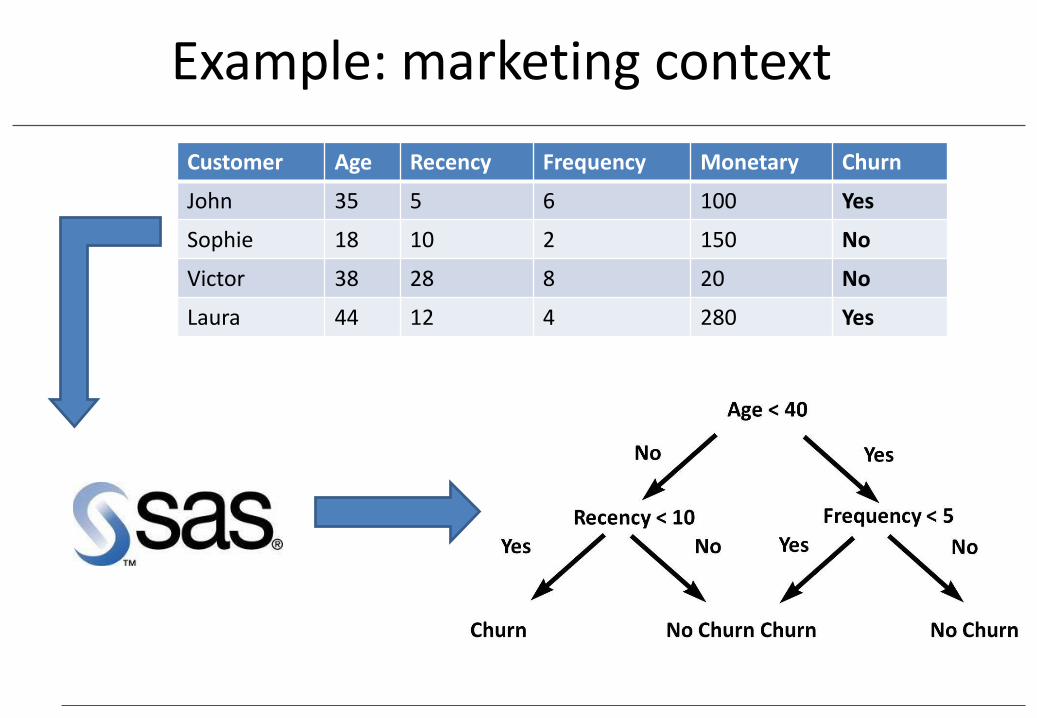
Example: marketing context
Customer Age Recency Frequency Monetary Churn
John 35 5 6 100 Yes
Sophie 18 10 2 150 No
Victor 38 28 8 20 No
Laura 44 12 4 280 Yes
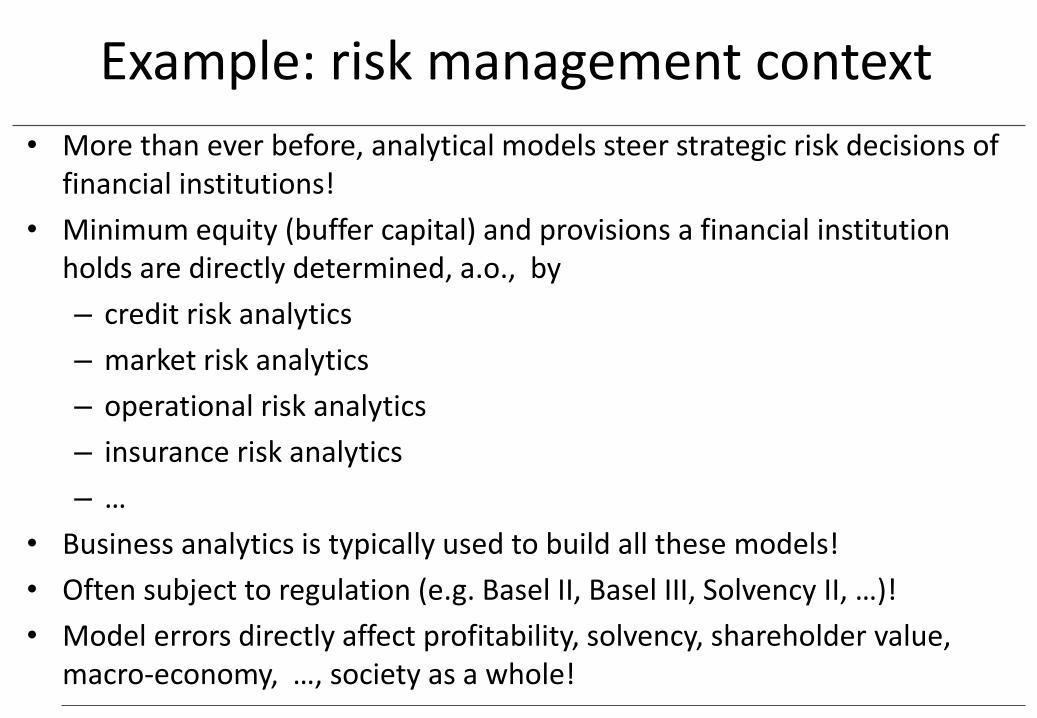
Example: risk management context
• More than ever before, analytical models steer strategic risk decisions of financial institutions!
• Minimum equity (buffer capital) and provisions a financial institution holds are directly determined, a.o., by
– credit risk analytics
– market risk analytics
– operational risk analytics
– insurance risk analytics
– …
• Business analytics is typically used to build all these models!
• Often subject to regulation (e.g. Basel II, Basel III, Solvency II, …)!
• Model errors directly affect profitability, solvency, shareholder value, macro-economy, …, society as a whole!
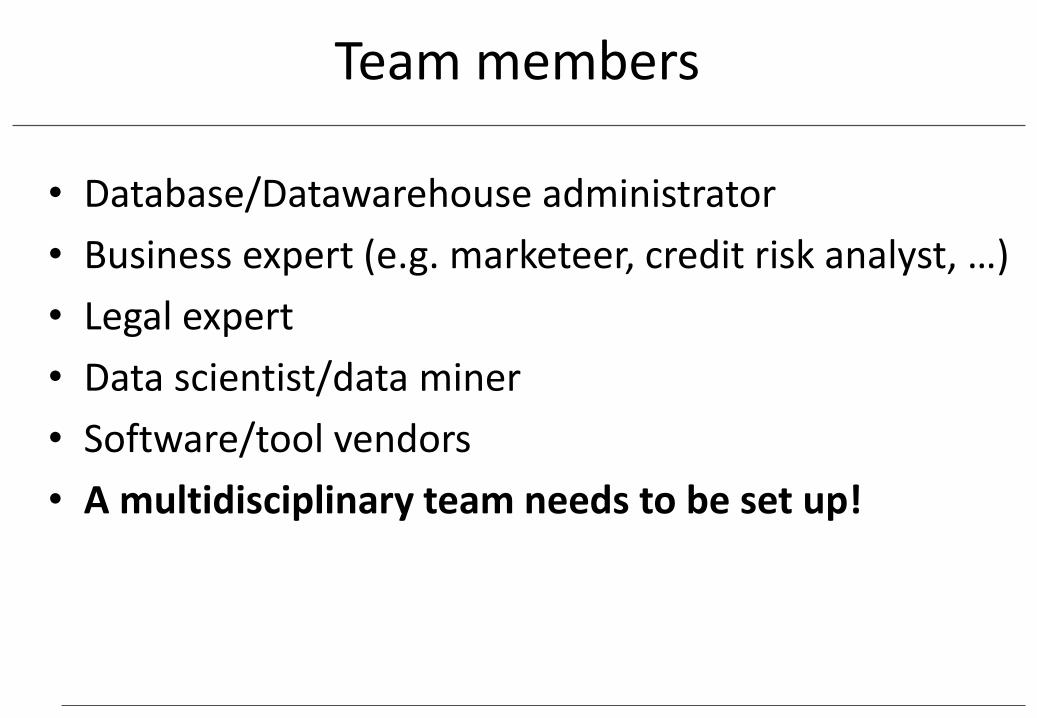
Team members
• Database/Datawarehouse administrator
• Business expert (e.g. marketeer, credit risk analyst, …)
• Legal expert
• Data scientist/data miner
• Software/tool vendors
• A multidisciplinary team needs to be set up!
Data Scientist
• A data scientist should have solid quantitative skills!
• A data scientist should be a good programmer!
• A data scientist should excel in communication and visualization skills!
• A data scientist should have a solid business understanding!
• A data scientist should be creative!
• GIGO principle– Garbage in, Garbage out; messy data gives messy models
• In many cases, simple analytical models perform well, so biggest performance increase comes from the data!– Baesens et al., 2003; Van Gestel, Baesens et al., 2004
– Holte, 1993
• Importance of Master Data Management and Data quality programmes!
• “ The best way to improve the performance of an analytical model is not to look for fancy tools or techniques, but to improve DATA QUALITY first”
• Baesens B., It’s the data, you stupid!, Data News, 2007.
Data Quality
Example data quality criteria• Data accuracy
– E.g., outliers
– Age is 300 years versus Income is 1.000.000 Euro (not the same!)
• Data completeness– Are missing values important?
• Data bias and sampling– Try to minimise, but can never totally get rid of
• Data definition– Variables: what is the meaning of 0?
– Target: fraud, churn, default, customer lifetime value (CLV), ….
• Data recency/latency– Refresh frequency
Analytics
• Term often used interchangeably with data mining, knowledge discovery, predictive/descriptive modeling, …
• Essentially refers to extracting useful business patterns and/or mathematical decision models from a preprocessed data set
• Predictive analytics
– Predict the future based on patterns learnt from past data
– Classification (churn, response) versus regression (CLV)
• Descriptive analytics
– Describe patterns in data
– Clustering, Association rules, Sequence rules
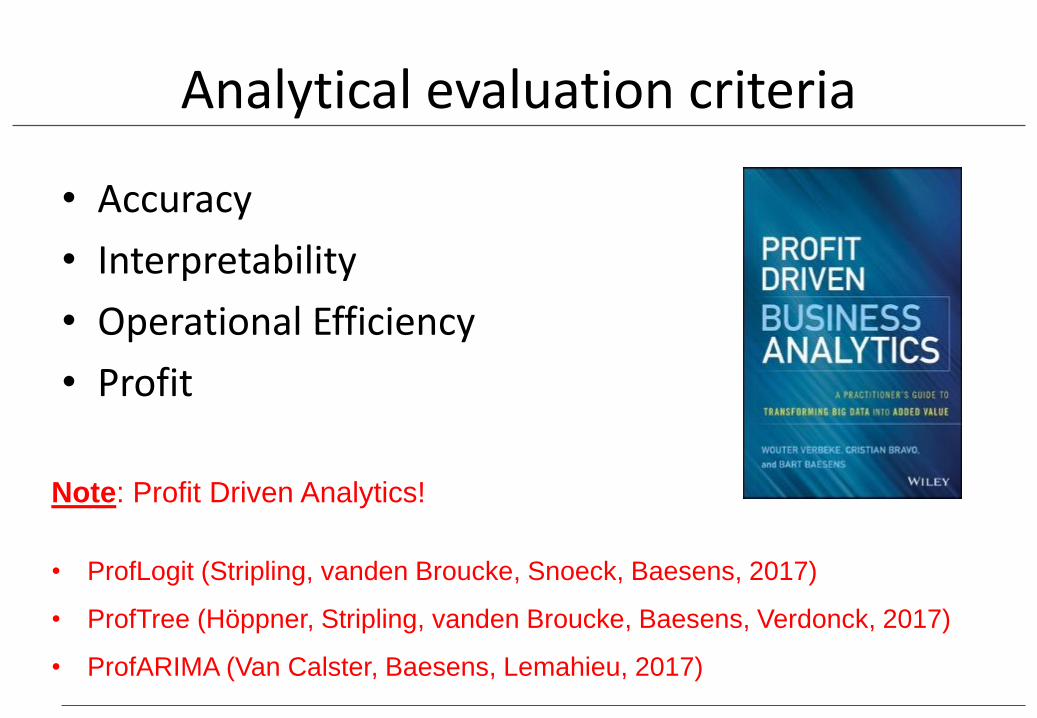
Analytical evaluation criteria
• Accuracy
• Interpretability
• Operational Efficiency
• Profit
Note: Profit Driven Analytics!
• ProfLogit (Stripling, vanden Broucke, Snoeck, Baesens, 2017)
• ProfTree (Höppner, Stripling, vanden Broucke, Baesens, Verdonck, 2017)
• ProfARIMA (Van Calster, Baesens, Lemahieu, 2017)
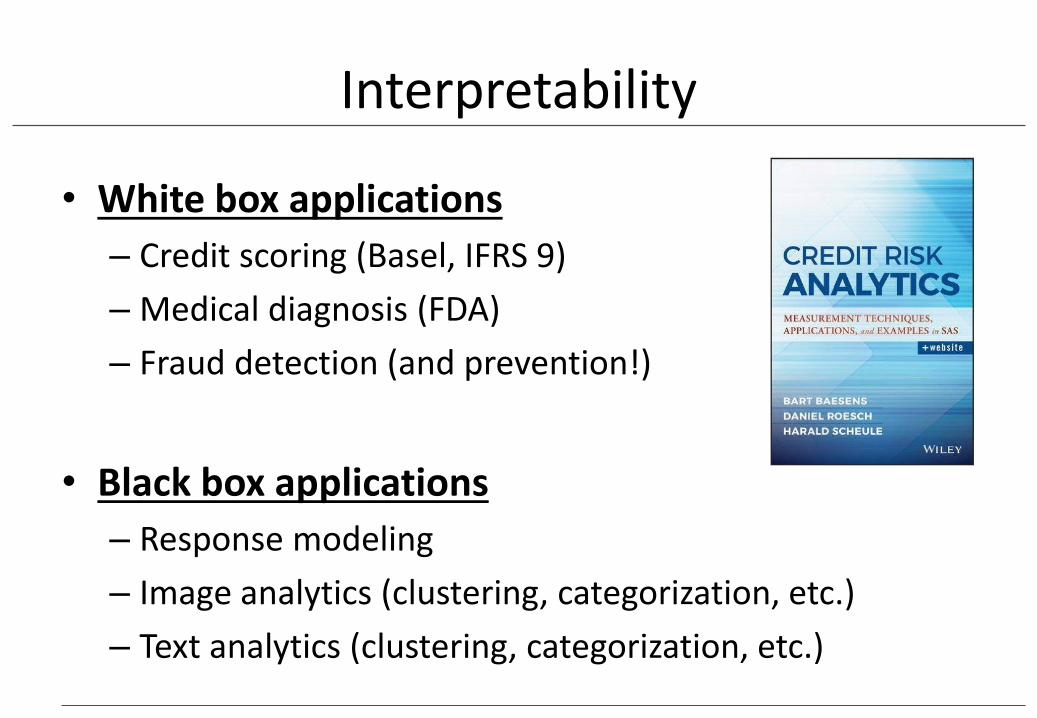
Interpretability
• White box applications
– Credit scoring (Basel, IFRS 9)
– Medical diagnosis (FDA)
– Fraud detection (and prevention!)
• Black box applications
– Response modeling
– Image analytics (clustering, categorization, etc.)
– Text analytics (clustering, categorization, etc.)
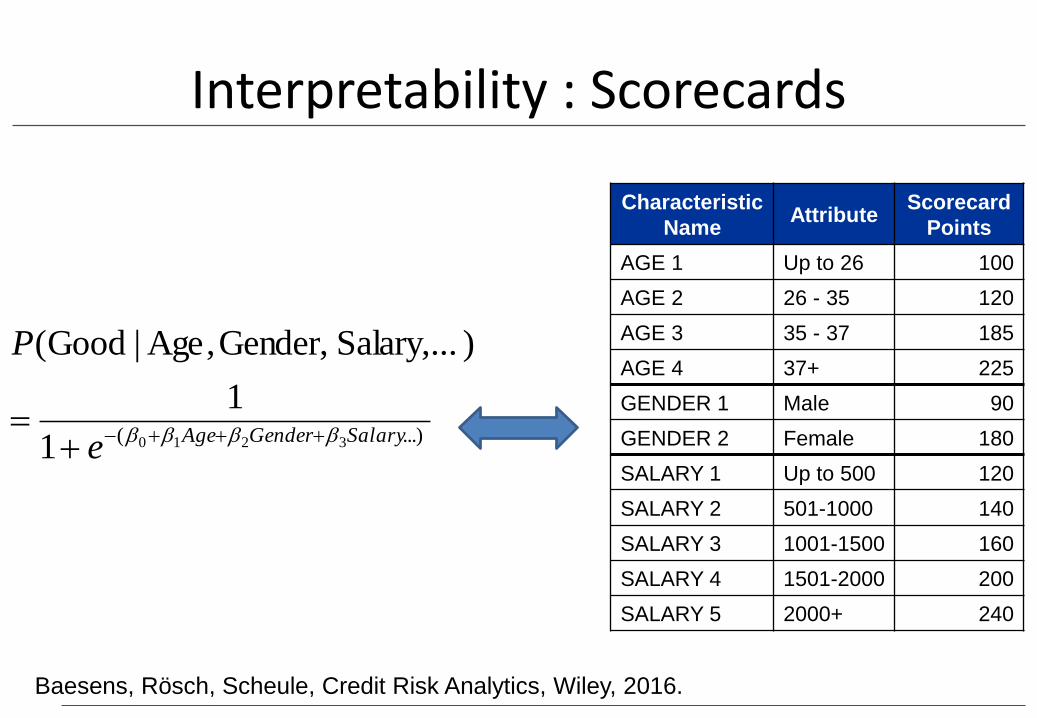
Interpretability : Scorecards
Characteristic
NameAttribute
Scorecard
Points
AGE 1 Up to 26 100
AGE 2 26 - 35 120
AGE 3 35 - 37 185
AGE 4 37+ 225
GENDER 1 Male 90
GENDER 2 Female 180
SALARY 1 Up to 500 120
SALARY 2 501-1000 140
SALARY 3 1001-1500 160
SALARY 4 1501-2000 200
SALARY 5 2000+ 240
...)( 32101
1
)Salary,...Gender,,Age|Good(
SalaryGenderAgee
P
Baesens, Rösch, Scheule, Credit Risk Analytics, Wiley, 2016.
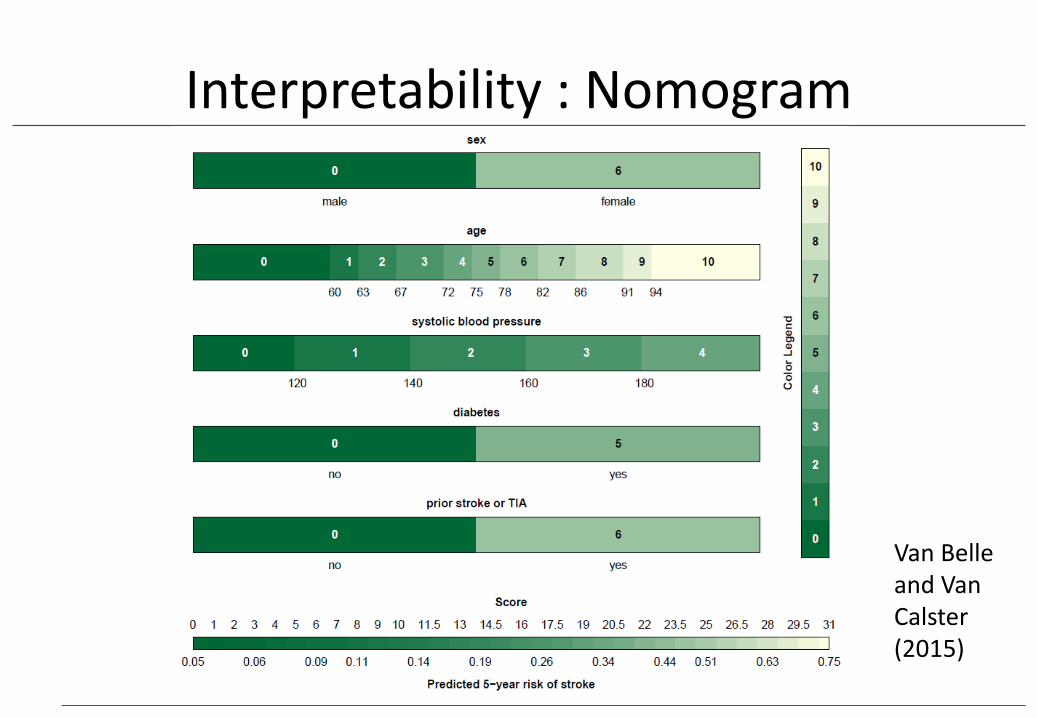
Interpretability : Nomogram
Van Belle and Van Calster (2015)
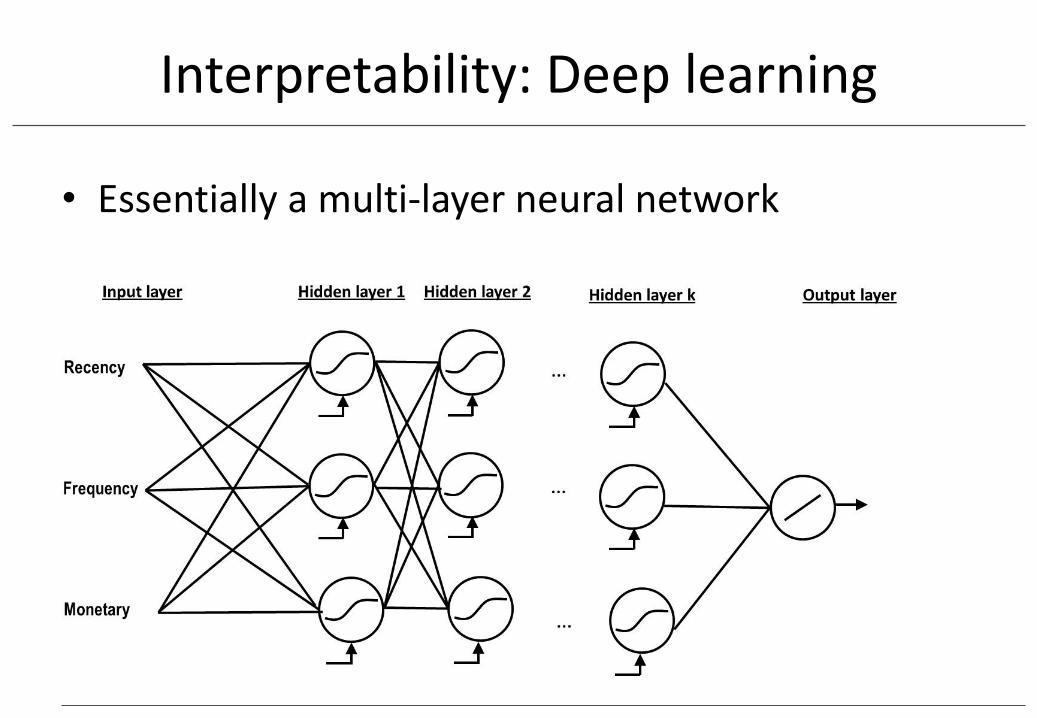
Interpretability: Deep learning
• Essentially a multi-layer neural network
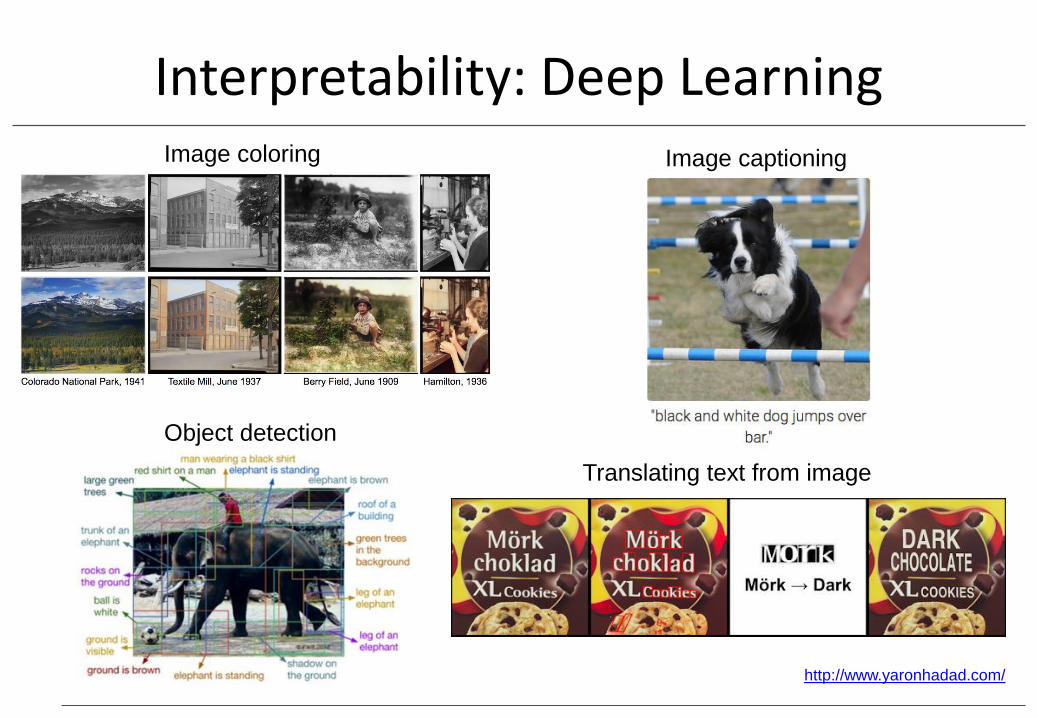
Interpretability: Deep LearningImage captioning
Object detection
Translating text from image
Image coloring
http://www.yaronhadad.com/
Interpretability: Deep Learning
• Neural Network Rule Extraction
• Extract rules that mimic the behavior of the neural network
• Combine the performance of theneural network with the readabilityof If-Then Rules
• Best of both Worlds approach!
• Baesens, PhD Thesis, 2003.
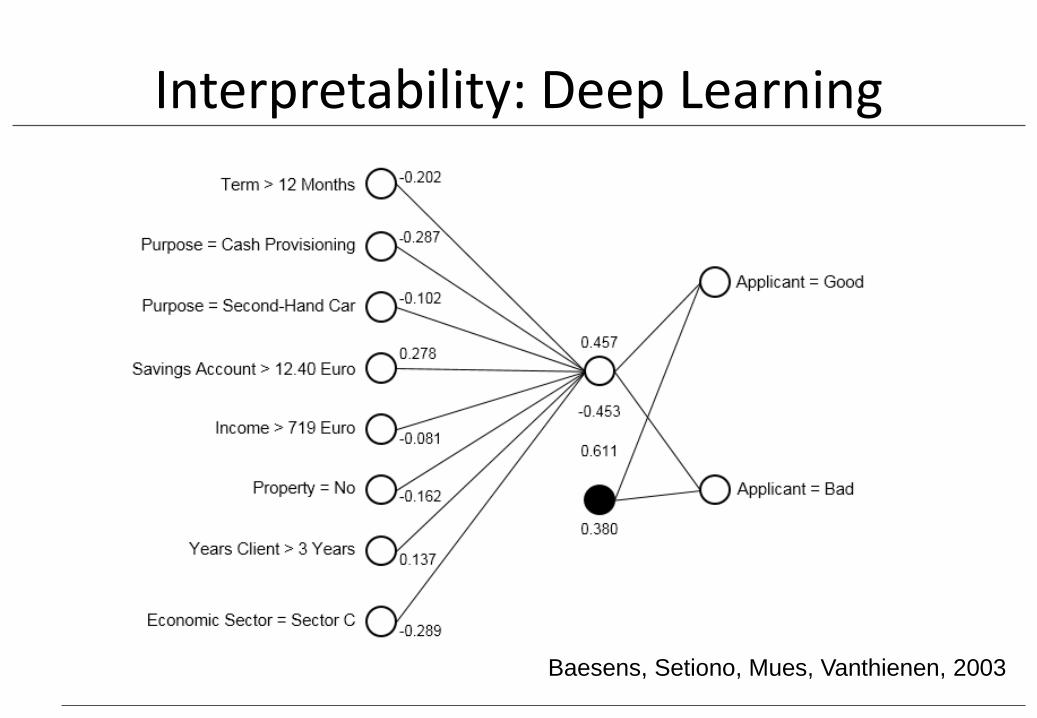
Interpretability: Deep Learning
Baesens, Setiono, Mues, Vanthienen, 2003
Interpretability: Deep Learning
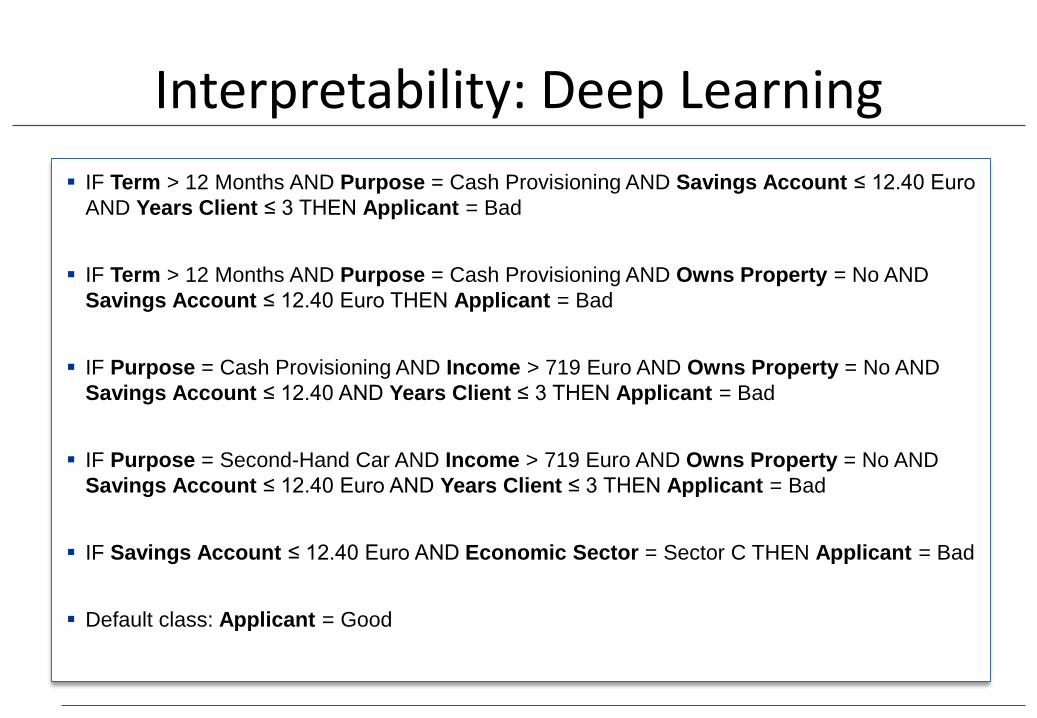
▪ IF Term > 12 Months AND Purpose = Cash Provisioning AND Savings Account ≤ 12.40 Euro
AND Years Client ≤ 3 THEN Applicant = Bad
▪ IF Term > 12 Months AND Purpose = Cash Provisioning AND Owns Property = No AND
Savings Account ≤ 12.40 Euro THEN Applicant = Bad
▪ IF Purpose = Cash Provisioning AND Income > 719 Euro AND Owns Property = No AND
Savings Account ≤ 12.40 AND Years Client ≤ 3 THEN Applicant = Bad
▪ IF Purpose = Second-Hand Car AND Income > 719 Euro AND Owns Property = No AND
Savings Account ≤ 12.40 Euro AND Years Client ≤ 3 THEN Applicant = Bad
▪ IF Savings Account ≤ 12.40 Euro AND Economic Sector = Sector C THEN Applicant = Bad
▪ Default class: Applicant = Good
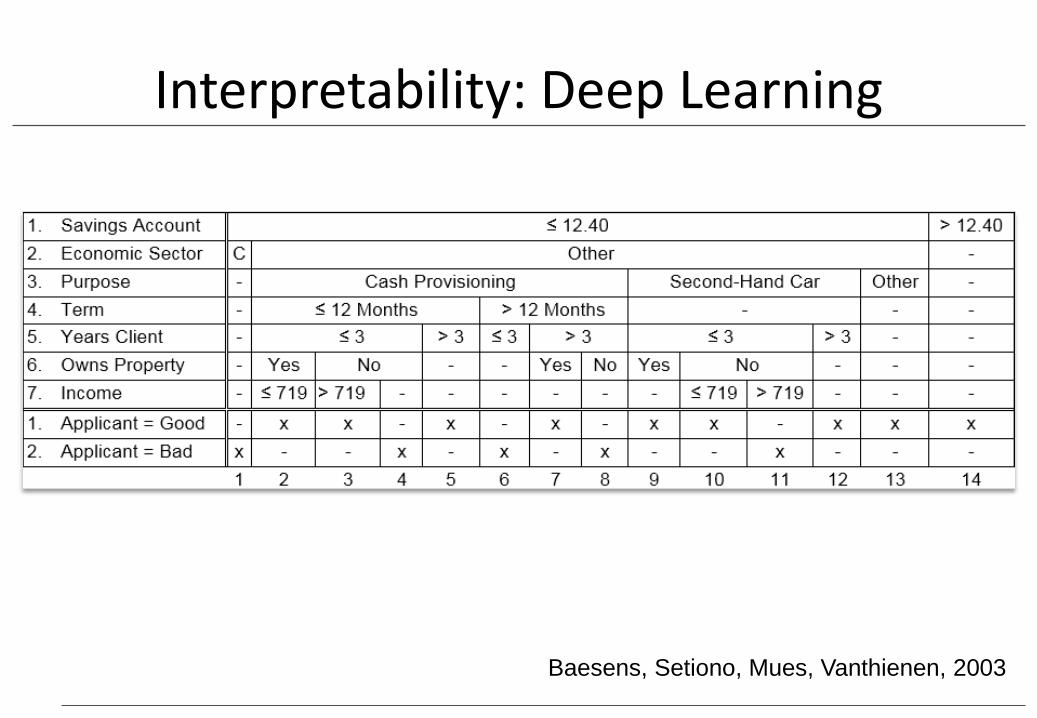
Interpretability: Deep Learning
Baesens, Setiono, Mues, Vanthienen, 2003
• Time needed to evaluate the model (e.g., score a customer)
• Depends upon
– Complexity of data (e.g., ETL)
– Complexity of model
– Complexity of software
• Not always a key concern
– Fraud detection versus Response modeling
Operational Efficiency
Profit: ProfTree
• Decision tree classifier directly optimizing profit instead of impurity (e.g., Gini, Entropy, etc.)
• Profit focus directly embedded in the classifier instead of using it only for ex-post evaluation
• Focus is now on economic value rather than statistics (e.g. likelihood, p-values, etc.)!
• Work by Höppner, Stripling, vanden Broucke, Baesens, Verdonck, 201
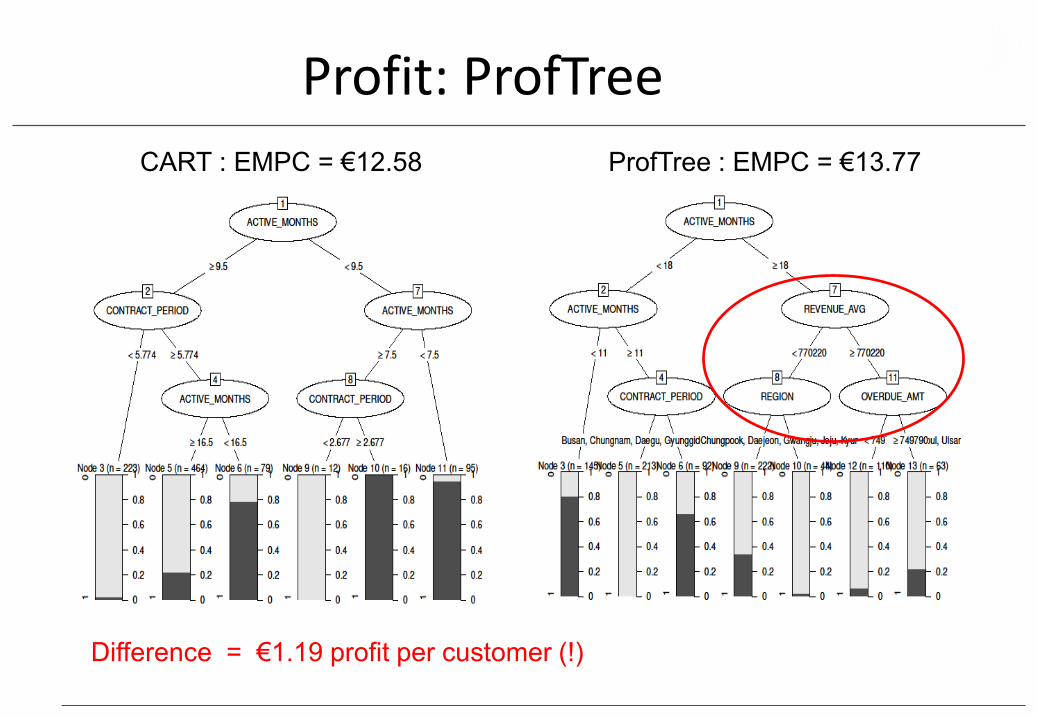
Profit: ProfTree
CART : EMPC = €12.58 ProfTree : EMPC = €13.77
Difference = €1.19 profit per customer (!)
Post processing
• Interpretation and validation of analytical models by business experts
• Trivial versus unexpected (interesting?) patterns
• Sensitivity analysis• How sensitive is the model wrt sample characteristics, assumptions and/or
technique parameters?
• Deploy analytical model into business setting• Represent model output in a user-friendly way
• Integrate with campaign management tools and marketing decision engines
• Model monitoring and backtesting• Continuously monitor model output
• Contrast model output with observed numbers
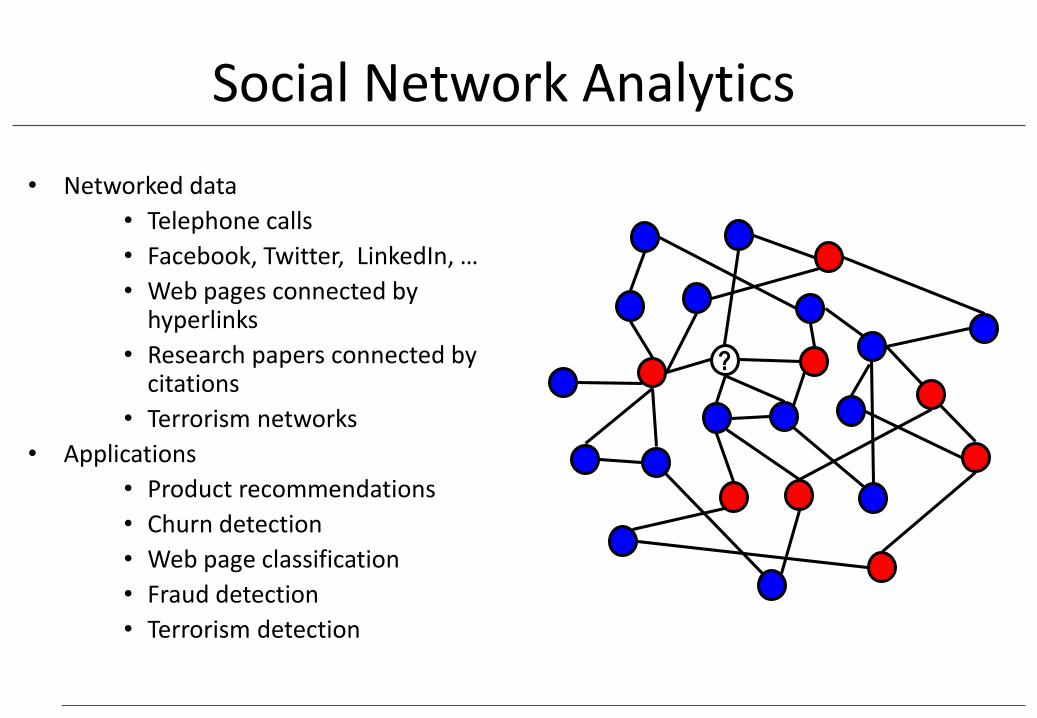
Social Network Analytics
• Networked data
• Telephone calls
• Facebook, Twitter, LinkedIn, …
• Web pages connected by hyperlinks
• Research papers connected by citations
• Terrorism networks
• Applications
• Product recommendations
• Churn detection
• Web page classification
• Fraud detection
• Terrorism detection
?
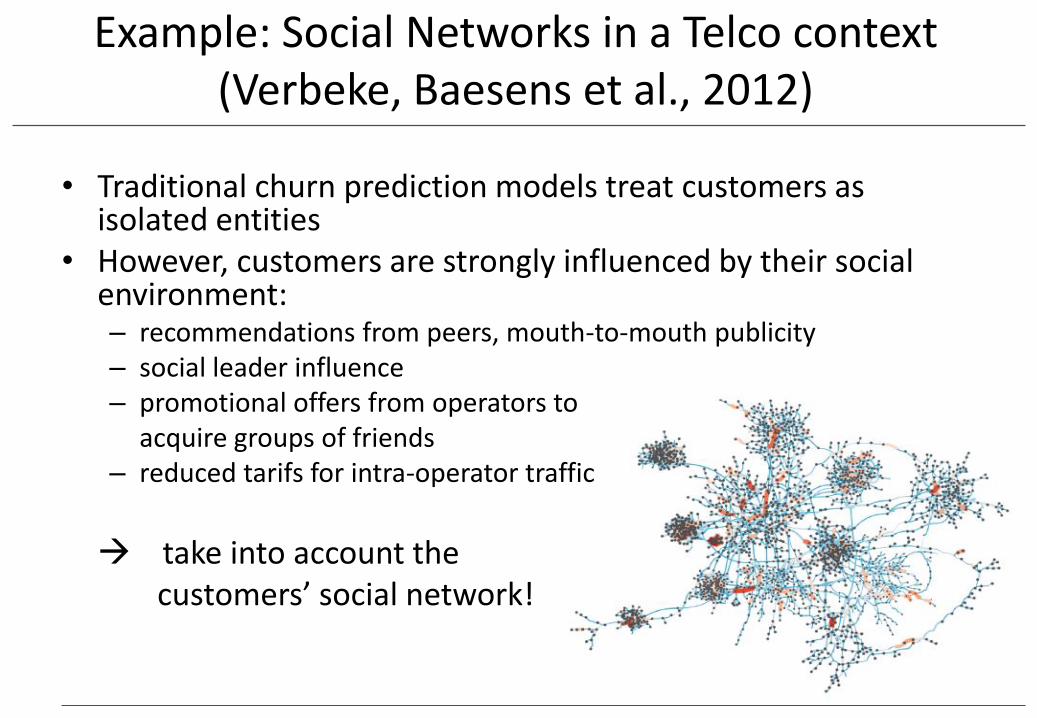
Example: Social Networks in a Telco context (Verbeke, Baesens et al., 2012)
• Traditional churn prediction models treat customers as isolated entities
• However, customers are strongly influenced by their social environment:– recommendations from peers, mouth-to-mouth publicity– social leader influence– promotional offers from operators to
acquire groups of friends– reduced tarifs for intra-operator traffic
take into account the customers’ social network!
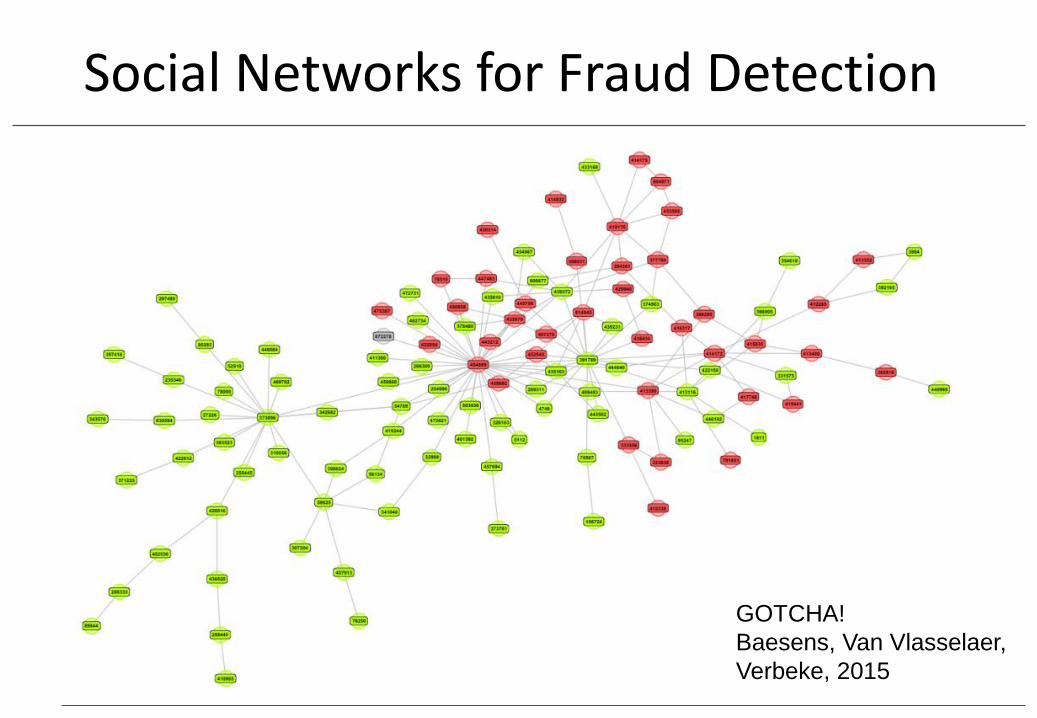
Social Networks for Fraud Detection
GOTCHA!
Baesens, Van Vlasselaer,
Verbeke, 2015
HR analytics
• Employee churn
• Employee performance
• Employee absence
• Employee satisfaction
• Employee Lifetime Value
• …
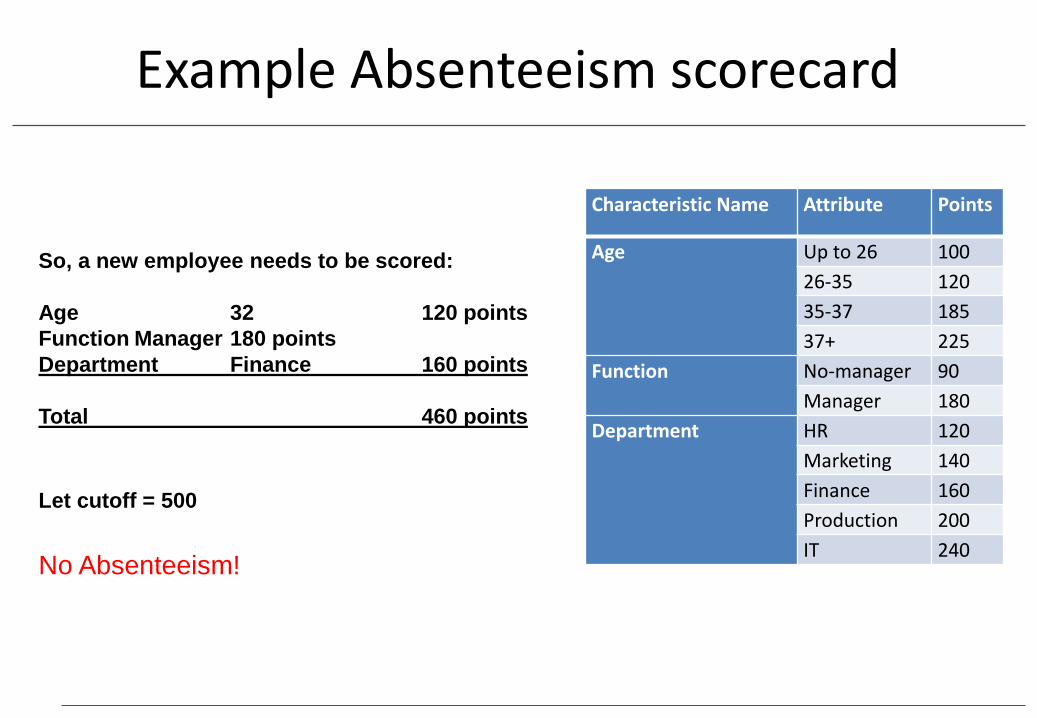
Example Absenteeism scorecard
So, a new employee needs to be scored:
Age 32 120 points
Function Manager 180 points
Department Finance 160 points
Total 460 points
Let cutoff = 500
No Absenteeism!
Characteristic Name Attribute Points
Age Up to 26 100
26-35 120
35-37 185
37+ 225
Function No-manager 90
Manager 180
Department HR 120
Marketing 140
Finance 160
Production 200
IT 240
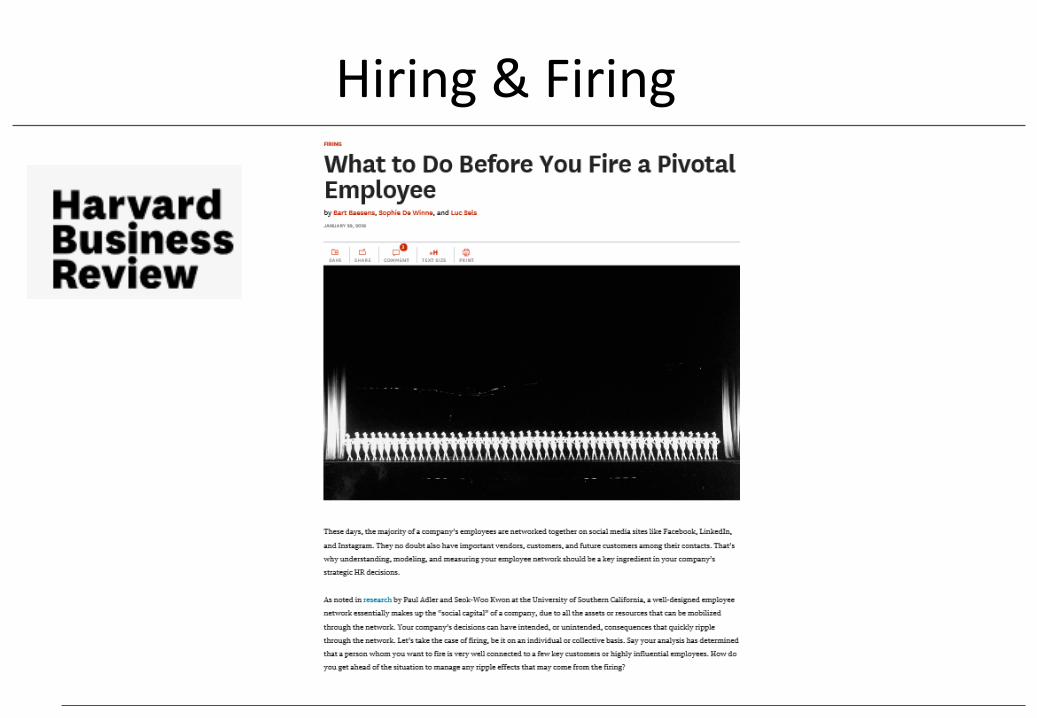
Hiring & Firing
• Advanced Analytics in a Big Data Worldhttps://support.sas.com/edu/schedules.html?id=2169&ctry=US
• Credit Risk Modelinghttps://support.sas.com/edu/schedules.html?id=6353&ctry=US
• Fraud Analytics using Descriptive, Predictive and Social Network Analyticshttps://support.sas.com/edu/schedules.html?id=1912&ctry=US
• Profit Driven Business Analytics https://support.sas.com/edu/schedules.html?id=5962&ctry=BE&utm_source=TWITTER&utm_medium=social-sprinklr&utm_content=1084173631
E-learning Courses
E-learning Course: Advanced Analytics
E-learning course: Advanced Analytics in a Big Data World
https://support.sas.com/edu/schedules.html?id=2169&ctry=US
The E-learning course starts by refreshing the basic concepts of the analytics process model: datapreprocessing, analytics and post processing. We then discuss decision trees and ensemblemethods (random forests), neural networks, SVMs, Bayesian networks, survival analysis, socialnetworks, monitoring and backtesting analytical models. Throughout the course, we extensivelyrefer to our industry and research experience. Various business examples (e.g. credit scoring,churn prediction, fraud detection, customer segmentation, etc.) and small case studies are alsoincluded for further clarification. The E-learning course consists of more than 20 hours of movies,each 5 minutes on average. Quizzes are included to facilitate the understanding of the material.Upon registration, you will get an access code which gives you unlimited access to all coursematerial (movies, quizzes, scripts, ...) during 1 year. The E-learning course focusses on theconcepts and modeling methodologies and not on the SAS software. To access the coursematerial, you only need a laptop, iPad, iPhone with a web browser. No SAS software is needed.
E-learning course: Credit Risk Modeling
E-learning course: Credit Risk Modeling
https://support.sas.com/edu/schedules.html?id=6353&ctry=US
The E-learning course covers both the basic as well some more advanced ways ofmodeling, validating and stress testing Probability of Default (PD), Loss Given Default(LGD ) and Exposure At Default (EAD) models. Throughout the course, we extensivelyrefer to our industry and research experience. Various business examples and small casestudies in both retail and corporate credit are also included for further clarification. TheE-learning course consists of more than 20 hours of movies, each 5 minutes on average.Quizzes are included to facilitate the understanding of the material. Upon registration,you will get an access code which gives you unlimited access to all course material(movies, quizzes, scripts, ...) during 1 year. The course focusses on the concepts andmodeling methodologies and not on the SAS software. To access the course material,you only need a laptop, iPad, iPhone with a web browser. No SAS software is needed.See https://support.sas.com/edu/schedules.html?id=6353&ctry=US for more details.
E-learning course: Fraud Analytics
E-learning course: Fraud Analytics
https://support.sas.com/edu/schedules.html?id=1912&ctry=US
This new E-learning course will show how learning fraud patterns from historical data can be used to fight fraud. To be discussed is the use of descriptive analytics (using an unlabeled data set), predictive analytics (using a labeled data set) and social network learning (using a networked data set). The techniques can be applied across a wide variety of fraud applications, such as insurance fraud, credit card fraud, anti-money laundering, healthcare fraud, telecommunications fraud, click fraud, tax evasion, counterfeit, etc. The course will provide a mix of both theoretical and technical insights, as well as practical implementation details. The instructor will also extensively report on his recent research insights about the topic. Various real-life case studies and examples will be used for further clarification.
E-learning course: Profit Analytics
https://support.sas.com/edu/schedules.html?id=5962&ctry=BE&utm_source=TWITTER&utm_medium=social-sprinklr&utm_content=1084173631
This course provides actionable guidance for optimizing the use of data to add value and drive better business decisions. Combining theoretical and technical insights into daily operations and long-term strategy, this course acts as a development manual for practitioners who seek to conceive, develop, and manage advanced analytical models. Detailed discussion delves into the wide range of analytical approaches and modeling techniques that can help maximize business payoff, and the instructor team draws on their recent research to share deep insights about optimal strategy. Real-life case studies and examples illustrate these techniques at work and provide clear guidance for implementation in your own organization. From step-by-step instruction on data handling to analytical fine-tuning and evaluating results, this course provides invaluable guidance for practitioners who want to reap the advantages of true profit-driven business analytics. Software demonstrations illustrate and clarify the concepts, but no hands-on use of software is included.


![[CLV] Sales Outline](https://img.pdfslide.net/doc/110x75/577cb4701a28aba7118c7998/clv-sales-outline.jpg)