Embed Size (px)
Citation preview
Experimental evolution of halotolerance in Escherichia coli
Inaugural-Dissertation to obtain the academic degree
Doctor rerum naturalium (Dr. rer. nat.)
Submitted to the Department of Biology, Chemistry and Pharmacy of Freie Universität Berlin
By
Mohammed Rawway Khalil Khlaf
From Kena, Egypt
2011
2007-2011
Supervised by
Prof. Dr. Rupert Mutzel
Institute for Biology - Microbiology
Department of Biology, Chemistry, Pharmacy
Freie Universität Berlin
1st Reviewer: Prof. Dr. Rupert Mutzel
2nd Reviewer: Prof. Dr. Kürsad Turgay
Date of defence: 18.08.2011
Acknowledgments
I
Acknowledgments First of all, I would like to praise and thank my gracious and great God “ALLAH” who
enables me to carry out this work.
The completion of this study leaves me indebted to many people. My first
indebtedness goes to Professor Dr. Rupert Mutzel who gave me the opportunity to
work “under his roof”. I would like to express my deepest thanks for his kind
supervision, continuous encouragement and valuable comments, in addition to
improving the writing and presentation of my thesis.
Further, I would like to thank Professor Dr. Kürsad Turgay for evaluating my thesis.
All the best feelings and deepest thanks for all the members of Mutzel's work group;
Dr. Malgorzata Czarna and Dr. Sascha Thewes shared their experience in
biochemistry, microbiology and molecular biology with me, were always enthusiastic
about my project and its progress, contributed many helpful suggestions, and
critically read the thesis. Dr. Czarna also introduced me into the mysteries of "2 D
technology". Many thanks, Gosia and Sascha!
I would also like to thank Angela Lahrz and Sabine Sieboth-Gutschmidt for their
constant technical support, valuable practical advices and help with continuous
cultures.
Several students, whose bachelor theses I accompanied, also contributed to the
work presented here: Elena Ulbricht and Stefanie Wolter on trehalose and amino
acid analyses; Anna-Leonie Wolfrum on measuring generation times and salt
tolerance analysis of some strains. Lilian Löwenau, Susanne Vettermann, Robert Hauffe and Florian Scholz communicated results of ongoing experiments which
helped to make some points of the story clearer.
Quantification of amino acids by HPLC would not have been so straightforward
without the help of Kathleen Dahncke who postponed her own experiments to get
the HPLC running for my samples.
Special thanks for Eberhard Klauck for the kind gift of anti-RpoS.
Great thanks to the Egyptian Government for the financial support offered to me to
undertake this study in Germany.

Dedication
II
Dedication
I would like to dedicate this thesis to the dearest people to my heart.
To my family whose cooperation and understanding, at all stages of this
study and against all odds, have been simply overwhelming
With my thanks and appreciation
Mohammed
Summary
III
Summary This thesis describes experiments to evolve a mesophilic bacterium, Escherichia coli,
towards halophily. The applied technology consisted in the continuous proliferation of
vast populations of cells in suspension in the "Genemat" format under self-adjusting,
limiting NaCl concentrations in the growth medium. This was achieved by applying a
conditional pulse feed regime where the proliferating suspension culture is
periodically diluted with a "permissive" medium of an osmolarity that is compatible
with growth of the cells if cell density falls below a pre-set value, and with a pulse of
"nonpermissive" medium of high osmolarity when cell density is superior to this
threshold. This regime favors genetic variants with elevated osmotolerance, which
rapidly replace their less-adapted progenitors.
Two parallel cultures were run over approximately 8800 and 6700 generations,
respectively. The first culture consisted of the prototypic E. coli strain MG1655, the
second of a ∆def/fmt/mutD variant (ε2124) which is distinct from other eubacteria in
its mechanism of initiation of translation and, in addition, shows a mutator phenotype.
Both experiments yielded offspring with greatly enhanced levels of halotolerance,
MG1655 evolvants growing at steady state concentrations of 1.3 M NaCl with
generation times of about 4 hours, ε2124 evolvants supporting steady state
concentrations of about 1.2 M NaCl. The former can grow in salinities of up to 2.0 M,
the latter up to 1.6 M. They tolerate similar concentrations of KCl and K2SO4, as well
as the uncharged, osmotically active sugar, sorbitol. Evolved derivatives are impaired
in growth at low salinities but can still be adapted to grow in the absence of
extracellular salt. Whereas adaptation proceeded smoothly for MG1655 cells, the
ε2124 culture showed massive and sustained oscillations in the consumption of
nonpermissive medium, an effect that could be due to its high genetic variability.
Whereas both populations of evolving cells relied on synthesis of the disaccharide
trehalose as an intracellular osmoprotectant during the initial stages of the
experiments, both cultures switched later this strategy to massive accumulation of
the amino acid proline which can accumulated to intracellular concentrations of up to
500 mM during growth in high salt medium. Both derivatives may chronically enrich
K+ ions in their cytosol since both showed enhanced sensitivity for the presence of
KI, and MG1655 derivatives could not grow at salt concentrations of more than 1 M
NaCl when K+ was omitted from the growth medium.
Summary
IV
The general stress response of evolved cells was compared with that of wild type
MG1655 cells by analyzing the expression of the stress sigma factor, RpoS, on
Western Blots of cellular proteins isolated during growth at various salt
concentrations. From these analyses it can be concluded that the stress answer sets
in at higher salinities in the evolved derivatives.
Changes in the outer membrane and total proteomes were revealed by SDS-
polyacrylamide gel electrophoresis and two-dimensional gel electrophoresis.
Further work should aim in doing analysis of the adaptive changes during the
evolution process in molecular details by determination of the complete genome
sequences as well as further functional, physiological, transcriptomic, and proteomic
analysis, and both experiments should be continued.
Zusammenfassung
V
Zusammenfassung Diese Arbeit beschreibt Experimente zur Evolution des mesophilen Bakteriums
Escherichia coli zur Halophilie. Dazu wurde die Technologie der kontinuierlichen
Kultur großer Populationen von Zellen in Suspension unter automatisch
eingestellten, gerade noch mit dem Wachstum der bestangepassten Varianten
vereinbaren Salzkonzentrationen im "Genemat"-Format angewendet. Die Zellen
wurden in einem conditional pulse feed Regime kultiviert. Dabei wird das Kulturgefäß
mit Pulsen eines "permissiven" Mediums (mit einer Salzkonzentration, die mit dem
Wachstum der Zellen vereinbar ist) verdünnt, wenn die Zelldichte unter einer
vorgegebenen Schwelle liegt. Übersteigt die Zelldichte diese Schwelle, so wird
stattdessen mit einem Puls von "nichtpermissivem" Medium (mit
wachstumslimitierender Salzkonzentration) verdünnt. Unter diesen Bedingungen
genießen genetische Varianten mit erhöhter Salztoleranz einen selektiven Vorteil
gegenüber ihren weniger salztoleranten Vorläufern und verdrängen diese rasch aus
der Kultur.
Es wurden zwei parallele Experimente über etwa 8800 Generationen und etwa 6700
Generationen durchgeführt. Für das erste Experiment wurde der prototypische E. coli
Stamm MG1655 eingesetzt, für das zweite ein Abkömmling davon, ε2124, der sich
durch eine Deletion des def/fmt Operons auszeichnet und sich daher im
Mechanismus der Initiation der Proteinsynthese von anderen Eubakterien
unterscheidet und der zudem auf Grund einer Mutation des mutD Gens einen
Mutatorphänotyp zeigt.
Beide Experimente resultierten in der Selektion von Evolvaten, die gegenüber dem
Ausgangstyp stark erhöhte Salzresistenz aufweisen, wobei MG1655 Derivate mit
Generationszeiten von etwa 4 Stunden kontinuierlich bei 1,3 M NaCl wachsen
können, ε2124 Derivate bei etwa 1,2 M NaCl. MG1655 Derivate zeigen Wachstum
noch bei 2 M NaCl, ε2124 Derivate bis etwa 1,6 M. Ähnliche Konzentrationen
anderer Salze wie KCl und K2SO4 werden ebenso toleriert wie hohe Konzentrationen
des Zuckers Sorbitol. Die evolvierten Derivate wachsen schlecht in Abwesenheit von
Salz, können aber noch an Medien mit geringen Salzkonzentrationen adaptieren.
Während die Adaptation im Fall von MG1655 recht gleichmäßig voranschritt, zeigte
die ε2124 Kultur starke, anhaltende Schwankungen im Verbrauch an
nichtpermissivem Medium. Dies könnte im Mutator-Phänotyp dieser Linie begründet
sein.
Zusammenfassung
VI
Während früher Stadien der Evolutionsexperimente akkumulierten Zellen beider
Linien intrazellulär das Disaccharid Trehalose als osmoprotektive Substanz. Beide
Linien wechselten dann auf die massive intrazelluläre Akkumulation der
osmoprotektiven Aminosäure Prolin, die in den Zellen bei hoher externer Salinität
Konzentrationen von bis zu 500 mM erreichen konnte. Eine erhöhte Sensitivität
gegenüber dem toxischen KI und eine starke Verringerung der Salztoleranz in
Abwesenheit von Kalium im Medium könnten darauf hinweisen, dass die evolvierten
Derivate intrazellulär Kaliumionen anreichern.
Die Stressantwort evolvierter Zellen wurde mit der von Wildtyp Zellen anhand der
Expression des "Stress-Sigmafaktors" RpoS während des Wachstums in
unterschiedlichen Salinitäten verglichen. Aus den erhaltenen Ergebnissen kann
geschlossen werden, dass die Stressantwort in den evolvierten Stämmen bei
höherer externer Salzkonzentration induziert wird als im Wildtyp.
Analysen der Proteinzusammensetzung von Präparationen der äußeren Membran
und von Gesamt-Zellextrakten durch 1- und 2-dimensionale Gelektrophoresen
zeigen Änderungen im Proteom.
Neben der Fortsetzung der Evolutionsexperimente sollten in künftigen Arbeiten
molekulare Details des Adaptationsprozesses anhand von Gesamtsequenzen der
evolvierten Genome ermittelt werden, und weitere funktionelle und physiologische
Studien sowie Transkriptom- und Proteomanalysen sollten durchgeführt werden, um
Ablauf und Resultat der Evolution zu beschreiben.
Abbreviations
VII
Abbreviations APS Ammoniumperoxodisulfate
bp Base pair(s)
DMSO Dimethylsulfoxid
IEF Isoelectric focussing
MQ Salt-free, sterile, RNase-free water (MilliPore)
NTA Nitrilotriacetic acid
OD600nm Optical density at 600 nm
PAGE Polyacrylamide gel electrophoresis
PCR Polymerase chain reaction
rpm Rounds per minute
RT Room temperature
SDS Sodium dodecyl sulfate
TCA Trichloroacetic acid
Table of contents
VIII
Contents Acknowledgments ..................................................................................................... I
Dedication .................................................................................................................. II
Summary ................................................................................................................... III
Zusammenfassung ................................................................................................... V
Abbreviations .......................................................................................................... VII
1. Introduction ........................................................................................................... 1
1.1 Halotolerance and halophily .............................................................................. 1
1.2 Experimental evolution ...................................................................................... 3
1.2.1 Continuous culture and the "sticker problem" ............................................ 4
1.2.2 Genemat technology .................................................................................. 6
1.3 Experimental evolution of halophily ................................................................... 7
1.4 The Escherichia coli model ............................................................................... 8
1.5 Biotechnological applications for experimentally evolved halotolerant and
halophilic bacteria ................................................................................................... 8
1.6 Aim of the work ............................................................................................. 10
2. Materials and Methods ....................................................................................... 11
2.1 Materials ......................................................................................................... 11
2.1.1 Chemicals ................................................................................................ 11
2.1.2 Instruments .............................................................................................. 11
2.1.3 Escherichia coli strains ............................................................................. 12
2.1.4 Media ....................................................................................................... 13
2.1.5 Buffer and sterilizing agent for the genetic machine ................................ 15
2.1.6 Reagents for PCR .................................................................................... 16
2.1.7 Materials and solutions for detection of amino acids and trehalose by thin-
layer chromatography ....................................................................................... 16
2.1.8 Materials and reagents for detection of amino acids by HPLC ................ 18
2.1.9 Buffers and materials for Western-Blot .................................................... 19
Table of contents
IX
2.1.10 Buffers and staining kit for detection of outer membrane proteins on
SDS-polyacrylamide gels .................................................................................. 21
2.1.11 Buffers and solutions for 1-dimensionsional SDS-polyacrylamide gel
electrophoresis .................................................................................................. 21
2.1.12 Buffers and solutions for two-dimensionsional SDS-polyacrylamide gel
electrophoresis .................................................................................................. 24
2.2 Methods ......................................................................................................... 27
2.2.1 Operation of the genetic machine ............................................................ 27
2.2.2 Analysis of salt tolerance and sorbitol tolerance ...................................... 33
2.2.3 Determination of generation time ............................................................. 33
2.2.4 Detection of intracellular trehalose by thin-layer chromatography ........... 34
2.2.5 Detection of intracellular amino acids by thin-layer chromatography ....... 34
2.2.6 Quantification of intracellular amino acids by high-performance liquid
chromatography (HPLC) ................................................................................... 35
2.2.7 Detection of total cellular proteome with the use of one-dimensional SDS-
polyacrylamide gel electrophoresis ................................................................... 36
2.2.8 Western Blot ............................................................................................. 37
2.2.9 Detection of outer membrane proteins by SDS-polyacrylamide gel
electrophoresis .................................................................................................. 38
2.2.10 Analysis of the total cellular proteome by two-dimensional SDS gel
electrophoresis (2-D PAGE) .............................................................................. 39
3. Results ................................................................................................................. 43
3.1 MG1655 .......................................................................................................... 44
3.1.1 Evolutionary kinetics................................................................................. 44
3.1.2 Evolution of halotolerance ........................................................................ 45
3.1.3 Determination of generation times ........................................................... 52
3.1.4 Mechanisms of halotolerance in wild type and evolved MG1655 cells .... 53
3.1.5 A switch in the synthesis of osmoprotectants during evolution of salt
tolerance ........................................................................................................... 56
3.1.6 Quantification of intracellular amino acids by high-performance liquid
chromatography (HPLC) ................................................................................... 57
Table of contents
X
3.1.7 Stress response in evolving populations .................................................. 60
3.1.8 Detection of outer membrane proteins by SDS-polyacrylamide gel
electrophoresis .................................................................................................. 61
3.1.9 Analysis of the total cellular proteome by two-dimensional SDS gel
electrophoresis (2-D PAGE) .............................................................................. 62
3.2. ε2124 .............................................................................................................. 65
3.2.1. Evolutionary kinetics................................................................................ 65
3.2.2 Evolution of halotolerance ........................................................................ 67
3.2.3 Mechanism of evolved halotolerance in ε2124 evolvants ........................ 71
3.2.4 Accumulation of intracellular amino acids during growth in high salt media
.......................................................................................................................... 72
3.2.5 Quantification of intracellular amino acids by high-performance liquid
chromatography (HPLC) ................................................................................... 73
3.2.6 Stress response in evolving ε2124 populations ....................................... 75
3.2.7 Changes in the outer membrane and total proteome of ε2124 derivatives
.......................................................................................................................... 76
4. Discussion ........................................................................................................... 78
4.1 Technology for experimental evolution ........................................................... 78
4.2 Experimental evolution of halotolerance and evolved mechanisms of
halotolerance ......................................................................................................... 79
4.3 Osmoregulation of proline synthesis ............................................................... 81
4.4 Impaired growth of evolved cells in the absence of salt .................................. 83
4.5 Proteome evolution ......................................................................................... 83
4.6 Influence of genetic variability on halophilic adaptation .................................. 84
4.7 Outlook ........................................................................................................... 86
5. References ........................................................................................................... 88
Erklärung ................................................................................................................. 94
Introduction
1
1. Introduction 1.1 Halotolerance and halophily Microbial life exists over the whole range of salinities from freshwater and marine
biotopes to hypersaline environments with NaCl concentrations at saturation.
Halophilic and halotolerant microorganisms are found in all three domains of life,
Archaea, Bacteria, and Eucarya (Oren, 1999). While halotolerant organisms can be
found in all three domains of life, halophily was long considered to be restricted to the
Archaea, but more recently, a group of eubacteria has been shown to be extremely
halophilic in the strict sense (Oren and Mana, 2002; Oren, 2008). Microorganisms,
which can only live in extreme hypersaline environments, are designated halophiles,
while those capable of growth in the absence of salt, but can thrive in varying
concentrations, are considered to be halotolerant. Nevertheless, the concepts of
halophilic and halotolerant organisms, as well as their response to salt, vary
depending on the used criteria (Ventosa and Nieto, 1995).
Kushner (1985) identified several categories of microorganisms according to their
salt concentration optimal for growth. He classified them as follows: non-halophiles
grow best in media containing < 0.2 M NaCl (some of which, the halotolerant, can
tolerate higher concentrations), slight halophiles (marine bacteria) grow best at 0.2 to
0.5 M NaCl, moderate halophiles grow best at 0.5 to 2.5 M NaCl, and extreme
halophiles show optimal growth in media containing 2.5 to 5.2 M (saturated) NaCl.
Biological membranes are permeable to water and cells cannot maintain the water
activity of their cytoplasm higher than that of the surrounding medium, because this
would lead to a rapid loss of water to the environment (Brown, 1990). Therefore, the
microorganisms, which live in high salt environments, are expected to keep their
cytoplasm at least isoosmotic with the extracellular environment; to establish turgor
pressure, the cytoplasm should be slightly hyperosmotic.
In the case of organisms living in highly concentrated salt solutions extracellular ions
compete with a cell's intracellular macromolecules for water. Two fundamentally
different molecular strategies exist within the microbial world that enables
microorganisms to cope with this environmental constraint, halophily and
Introduction
2
halotolerance. Halophily is the genetic adaptation to a high salt environment which
becomes manifest in the chemical composition and structures of cellular
macromolecules and in the intracellular accumulation of monovalent cations (the
“salt-in” strategy). Halotolerance is a regulatory response, which consists in either de
novo synthesis or uptake from the medium of compatible solutes which bind water
(Galinski, 1993) (the “compatible-solutes” strategy).
Halophilic organisms accumulate cations (in most cases K+) in their cytoplasm,
equilibrating their intracellular osmolarity with the extracellular (Oren, 1986).
Extremely halophilic organisms are dependent on high extracellular salt and cannot
live in diluted milieus.
In cells using the salt-in strategy for osmotic adaptation, all enzymes and structural
cell components have to be adapted to the presence of high salt concentrations to
ensure proper functioning of the intracellular enzymatic machinery. Halophilic
proteins show unique molecular adaptations, a strikingly large excess of acidic amino
acids and reduced amounts of hydrophobic amino acids (which even becomes
manifest in the overall amino acid composition of the proteome (Gandbhir et al.,
1995), allowing them to stay in solution due to hydration of acidic residues, charge
shielding by electrostatic interactions, and the reduction of hydrophobic interactions
which could cause a collapse of the structure (Lanyi, 1974; Zaccai and Eisenberg,
1990).
There is no need for specially adapted proteins in the cells, which use the
compatible-solute strategy (Oren, 1999). Compatible solutes were defined as solutes
that, at high concentrations, allow enzymes to function efficiently (Brown, 1990).
Sugars and sugar derivatives (trehalose, sucrose, glucosylglycerol), polyols such as
glycerol and arabitol, amino acids and their derivatives, and quaternary amines such
as glycine betaine were detected in halophilic and halotolerant microorganisms as
compatible solutes (Roberts, 2005).
Halomonas elongata (an extremely halotolerant member of the proteobacterial Vibrio
group) shares properties of both halotolerant and halophilic microorganisms,
massively overproducing the compatible solute ectoine in a high-salt medium but
also displaying biased composition of its total cellular protein (Galinski, 1993;
Gandbhir et al., 1995). This may be used as a hint to designing possible adaptive
scenarios for the evolution of halophily. As the Halomonaceae are phylogenetically
closely related to the main branch of mesophilic proteobacteria (Ventosa et al.,
Introduction
3
1998), remodeling of a proteobacterium's macromolecules in a stringently selective,
high-salt environment might be a rapid process, opening the possibility to reproduce
and extend genetic adaptation to live in a hypersaline milieu under controlled
laboratory conditions. Interestingly, a comparison of the rates of evolution of
halophilic and freshwater micro-crustaceans demonstrated accelerated molecular
evolution in halophilic lineages which was suggested to be due to the effects of salt
on DNA-protein interactions (Hebert et al., 2002). Moreover, it was demonstrated that
among haloarchaeal species intergenomic recombination even between highly
conserved rRNA operons is a frequent event (Boucher et al., 2004).
1.2 Experimental evolution
In studies of experimental evolution, hypotheses and theories of evolution are tested
by conducting controlled experiments. Evolution can be carried out in the laboratory
by adapting a population to new environmental conditions through the action of
variation (mutation) and natural selection. With the help of molecular tools, it is
possible to determine and to identify the mutations that selection acts on, and to find
out how exactly these mutations affect the biological fitness of the organism under
selection.
In 1859 Darwin published On the origin of species by means of natural selection
(Darwin, 1859). His biological opus magnum established the theory of evolution and,
most important, defined the role of natural selection in determining its course. Darwin
seeks to explain the adaptations of organisms, their complexity, and diversity as the
result of natural processes (Ayala, 2009).
The use of microbial experimental systems is not new. In the fact, such experiments
were carried out as early as 1887 by W. D. Dallinger who conducted long-term
evolutionary experiments with protists and observed that specialization in one
environment can yield a sort of adaptation (Jessup and Forde, 2008). Experimental
evolution trials between 1880 and 1980 were practiced by a variety of evolutionary
biologists, including Theodosius Dobzhansky whom we owe the immortal words
"nothing in Biology makes sense except in the light of evolution" (Dobzhansky, 1964).
But in this period much of the work lacked extensive replication and was carried out
only for relatively short periods of time. In the 1980s, successful experiments with
Introduction
4
extensive parallel replication of evolving lineages as well as large numbers of
generations under selection appeared. One of the first in a new wave of experiments
using this strategy was the laboratory "evolutionary radiation" of Drosophila
melanogaster populations that Michael R. Rose started in 1980 (Rose, 1984).
In 1988, Richard Lenski, applying the technique of serial subculture (see below)
started a long-term evolution experiment with the bacterium Escherichia coli. The
experiment continues to this day, and is by now probably the longest controlled
evolution experiment ever undertaken. Since the inception of the experiment, the
bacteria have grown for 50000 generations (Lenski, 2011).
1.2.1 Continuous culture and the "sticker problem"
Basically, a device for continuous cultivation operates by renewing a liquid culture of
constant volume with nutrient medium inflow, such that organisms must counteract
dilution by growing at least at an equal rate.
Before 1944 continuous culture devices were designed primarily to give a continuous
supply of microorganisms without routine subculturing. Much of this early work was
industrial and was limited to increasing the efficiency of utilization of fermentable
sugars. Reviews by Novick (1955) and James (1961) summarize the scientific
attempts of this early period. Later, many investigators used exponential phase
cultures to study and compare the growth of different microorganisms. The first
successful prototype of the turbidostat appears to have been that of Myers and Clark
(1944). In 1950 the technology for experimental evolution of organisms by long-term
continuous cultivation of huge populations under strictly controlled, selective
conditions was established around Monod's "bactogene" or the equivalent Novick
and Szilard's "chemostat" (Monod, 1950; Novick and Szilard, 1950). Mutants
proliferating at higher growth rates are selected during prolonged operation of these
devices (Kubitschek, 1970).
In continuous cultures, control of growth can be either external or internal (Fig.1). In
chemostats growth is controlled externally by limiting the supply of a critical growth
factor, and the cells grow at a rate equal to a constant dilution rate. In turbidostats,
growth is internally controlled and a photodetector/actuator-couple (the actuator
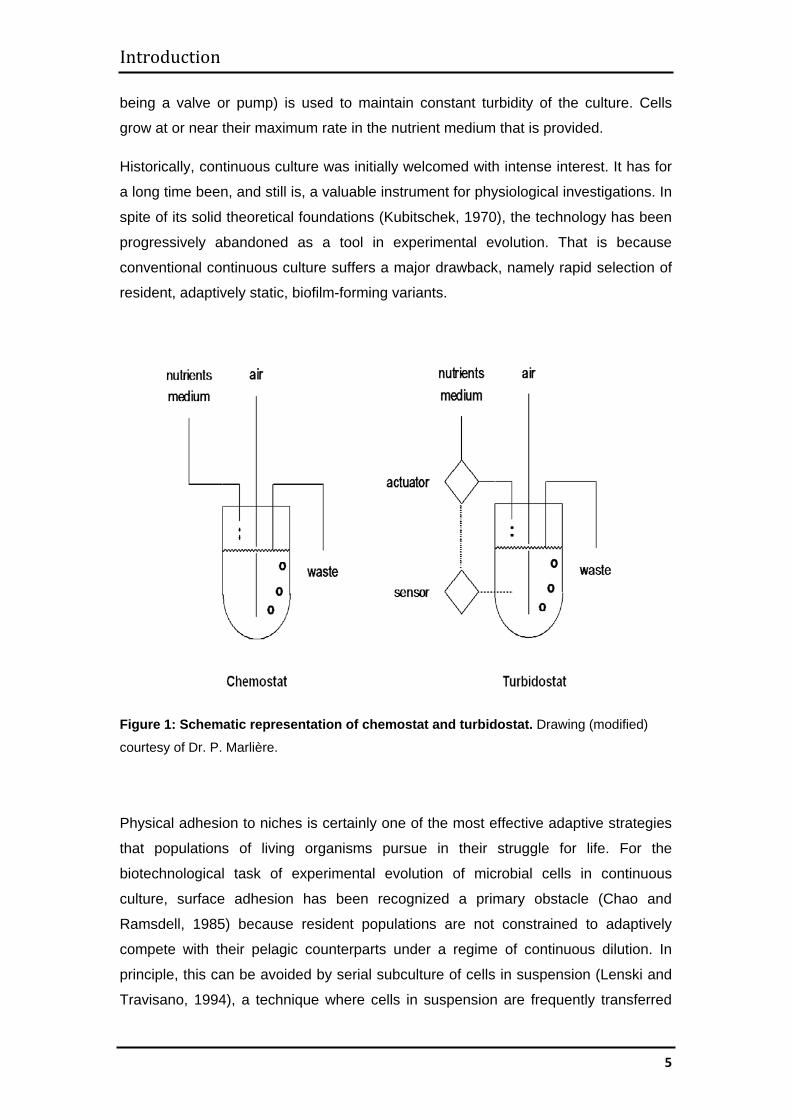
Introduction
5
being a valve or pump) is used to maintain constant turbidity of the culture. Cells
grow at or near their maximum rate in the nutrient medium that is provided.
Historically, continuous culture was initially welcomed with intense interest. It has for
a long time been, and still is, a valuable instrument for physiological investigations. In
spite of its solid theoretical foundations (Kubitschek, 1970), the technology has been
progressively abandoned as a tool in experimental evolution. That is because
conventional continuous culture suffers a major drawback, namely rapid selection of
resident, adaptively static, biofilm-forming variants.
Figure 1: Schematic representation of chemostat and turbidostat. Drawing (modified)
courtesy of Dr. P. Marlière.
Physical adhesion to niches is certainly one of the most effective adaptive strategies
that populations of living organisms pursue in their struggle for life. For the
biotechnological task of experimental evolution of microbial cells in continuous
culture, surface adhesion has been recognized a primary obstacle (Chao and
Ramsdell, 1985) because resident populations are not constrained to adaptively
compete with their pelagic counterparts under a regime of continuous dilution. In
principle, this can be avoided by serial subculture of cells in suspension (Lenski and
Travisano, 1994), a technique where cells in suspension are frequently transferred
Introduction
6
into fresh culture vessels (i.e., surfaces that could be colonized are periodically
discarded), creating a selective disadvantage for static variants.
The most extensive experiments of microbial adaptation published so far by the
Lenski group (50000 generations of E. coli; Lenski, 2011) were therefore conducted
by tedious, manual, serial sub-culturing in common glassware, and not by automated
propagation in continuous culture equipment. At an industrial scale, serial subculture
technology has not been systematically exploited because it is laborious and requires
absolute sterility during transfers. Moreover, the technology has major conceptional
drawbacks. Cells are exponentially growing only during a very limited fraction of the
cultivation process because every fresh inoculum will undergo initial lag and final
stationary phases, respectively, and natural selection will not exclusively favor faster-
growing variants but also variants with shorter lag phase or later entry into stationary
phase. Most important, however, serial subculturing forces the evolving population at
each transfer through a narrow bottleneck of small numbers of individuals since only
a small part of the population is preserved. Indeed, when the statistical chance for a
beneficial mutation to arise is highest (during the last generation before transfer), the
size of the subpopulation, which carries this mutation and can be transferred to the
next cycle is minimal (Wahl and Gerrish, 2001). Also, frequent passage through small
population sizes may lead to fixation of deleterious mutations by genetic drift
(Silander et al., 2007).
1.2.2 Genemat technology
The technological solution for these drawbacks is an automated fluidics device
("Genemat") with two growth chambers undergoing transient phases of sterilization
(Marlière and Mutzel, 2004). Its function ensures that (i) a population of cells in
suspension is kept under permanent proliferation over long periods of time and (ii)
resident cells in any part of the device are frequently and effectively destroyed. Fully
defined and strictly controlled chemostat or turbidostat conditions can be imposed on
evolving populations.
In addition to its potential for directed evolution of cell lines of industrial interest, this
technology opens avenues for full mathematical analysis and modeling of
evolutionary processes and the underlying molecular mechanisms since the
properties of evolving populations can be readily extracted from their growth
Introduction
7
characteristics, which in turn are strictly correlated to cell densities and dilution rates
(Kubitschek, 1970).
1.3 Experimental evolution of halophily
Halophilic microorganisms and the proteins encoded in their genomes are highly
adapted to function in a milieu of up to 5 M inorganic salt. They offer a valuable
source of catalysts for biotechnical applications. Common physiological properties of
halophilic microorganisms and structural and compositional features of halophilic
proteins have been elucidated over the past decades (see above); however, the
adaptive mechanisms which allow mesophilic organisms to invade and explore high
salt environments are still obscure. In this study we set out to experimentally evolve
the mesophilic bacterium Escherichia coli to halophily by long-term proliferation of the
organism under strictly controlled, highly challenging laboratory conditions.
Species such as E. coli dispose on a limited inventory of regulatory answers ranging
from intracellular enrichment of compatible solutes such as glycine betaine or
trehalose, to induction of general stress responses (Wood et al., 2001). With
increasing osmolarity this limited regulatory response will no longer allow for rapid
growth, allowing better adapted genetic variants to displace the original genotype. A
first adaptive response could, for example, consist in the deregulation or
overexpression of an enzymatic pathway for compatible solute synthesis, leading to
massive intracellular accumulation of osmolytes. Even such a strain would, however,
eventually come to an upper limit of osmolarity where growth is inhibited, not only
because water will leak from the cell, but also because those proteins which are in
contact with the extracellular medium (outer membrane proteins, periplasmic
proteins, and the outer face of inner transmembrane proteins) will lose their activity.
At this point the only escape from the challenge consists in structural alterations of
these proteins such that they remain active in high salt. Finally, at an even more
stringent level of selection the evolving bacteria will no longer be able to retain water
in their cytoplasm, entailing selective pressure to adapt the intracellular ionic milieu
and the structures of intracellular macromolecules to maximal retention of water.
Two pilot experiments were carried out previously in this laboratory to genetically
adapt the gram-negative bacteria Escherichia coli to highly challenging osmotic
conditions. After about 1250 generations of E. coli ε2124 (M. von Scheibner, Diploma
thesis, 2006) and 1745 generations of E. coli MG1655 (L. Corvers, Diploma thesis,
Introduction
8
2007) under constant selection, E. coli derivatives were isolated that grow in the
presence of 1 M NaCl. In high salt medium these derivatives accumulate the
osmoprotective solute, trehalose.
1.4 The Escherichia coli model
The wealth of genetic and biochemical knowledge available for E. coli makes it an
obvious choice as a model organism for experimental evolution.
In this study we used two E. coli K-12 strains, MG1655 and ε2124. MG1655 strain is
a wild type of E. coli and ε2124 strain is derived from strain β2124 (an MG1655
∆def/fmt/mutD derivative), which is devoid of the genes for Met-tRNAi transformylase
and polypeptide deformylase. The products of these genes are present in all
eubacteria and their mitochondrial and plastid descendants, but are absent in
archaea and eukaryotes. The β2124 lineage is distinct from all known eubacteria in
being devoid of N-formylation and deformylation activities, resembling eukaryotes
and archaea in this trait, and thus representing a unique form of life (Marlière et al.,
2005). This strain can be considered the ancestor to a whole lineage of artificially
evolved bacteria which are devoid of N-formylated peptides and therefore ideal
hosts, e.g. for the production of proteins for therapeutical use in mammals. Moreover,
these strains carry an unambiguous "genetic watermark" (the absence of the
ubiquitous eubacterial fmt/def genes).
1.5 Biotechnological applications for experimentally evolved halotolerant and halophilic bacteria
Lineages of experimentally evolved halotolerant/halophilic bacteria and their products
have an evident potential for every biotechnical application where high salt conditions
are required or desired.
Salt-resistant enzymes were produced from several halotolerant bacteria, such as
the amylase produced by a Bacillus sp., which is stable at 5 M NaCl and could be
used in the treatment of effluents containing starchy or cellulosic residues (Khire and
Pant 1992).
Introduction
9
Compatible solutes (in particular amino acids and their derivatives such as ectoine)
have a proven commercial value for industrial, medical and cosmetical use and can
be easily extracted from halotolerant producers (Ventosa and Nieto, 1995). These
compatible solutes may be applied as stabilizers of enzymes and whole cells
(Galinski and Tindall, 1992). Thus, hydroxyectoine protects lactate dehydrogenase
and other enzymes against high and low temperatures, salt and desiccation (Galinski
and Lippert, 1991). Industrial use of some of these compatible solutes, which are
easily produced by biotechnological processes, is a very promising field.
As a result of industrial activities, ecosystems are often subjected to heavy metal
pollution and chemical industries pay increasing attention to biotransformations,
which can greatly reduce production costs and pollution of the environment.
Substrates for these enzymatic transformations may stem from upstream chemical
processes that require the presence of high salt. Halophilic biocatalysts will reduce
the costs and efforts to make biotransformation in such reaction media compatible
with proper function and high activity of the catalyst. Similarly, bioremediation of
pollutants in high salt environments would be facilitated by the use of halophilic
microorganisms or halophilic enzymes encoded by them.
In the case of large-scale industrial biotransformation processes, enzyme extracts,
substrates, products, and the ionic composition of the reaction medium often provide
ideal growth conditions for contaminating microorganisms that enter the reactor with
the freshwater supply. Such contaminants can drastically reduce the yield of the
process due to metabolism of substrates and products, and the degradation of the
enzyme extract. In many cases, this could be easily circumvented by the use of a
catalyst that functions in high-salt medium, which inhibits growth of freshwater
microorganisms, economizing frequent refeeding of enzyme extract or expensive
treatment of the freshwater supply.
Production of bio-fuel is one of the most important processes, which could be
achieved in the future by contribution of halophiles. Bio-fuel products such as ethanol
and hydrogen could be produced from lignocellulosic biomass by fermenting
processes after removal of lignin components. The required alkaline pre-treatment (to
remove lignin) and subsequent partial neutralization will create an environment for
halophilic or haloalkaliphilic fermentative bacteria in the cellulose-converting process
(Ma et al., 2010).
Another process in which moderate halophiles could contribute is removal of
phosphate from saline environments in a cheaper alternative to chemical approaches
Introduction
10
(Ramos-Cormenzana, 1989). Increasing irrigation has led to 30% to 50% of
agricultural areas being affected by salinity. The potential use of moderate halophiles
in the recovery of saline soils is therefore gaining importance.
It is thus possible that in the future, halophilic microorganisms that are readily
accessible to genetic engineering would be ideal hosts for the in vivo adaptation of
valuable but salt-labile macromolecules to high salt stability. Recombinant enzymes
from mesophilic donor organisms evolved to halophily would greatly broaden the
spectrum of all of the applications mentioned above.
1.6 Aim of the work Two major goals were pursued during the research presented in this thesis:
I. Experimentally adaptation of a mesophilic model organism, Escherichia coli,
to osmotic environments in which its progenitor cannot grow, and
experimentally evolving the cellular macromolecules of the bacterium to
function in highly concentrated salt solutions.
II. Analysis of the adaptive kinetics which allows mesophilic organisms to invade
and explore high salt environment, as well as the analysis of the adaptive
changes that the evolving organism undergoes during adaptation to the
extreme environment.
Materials and Methods
11
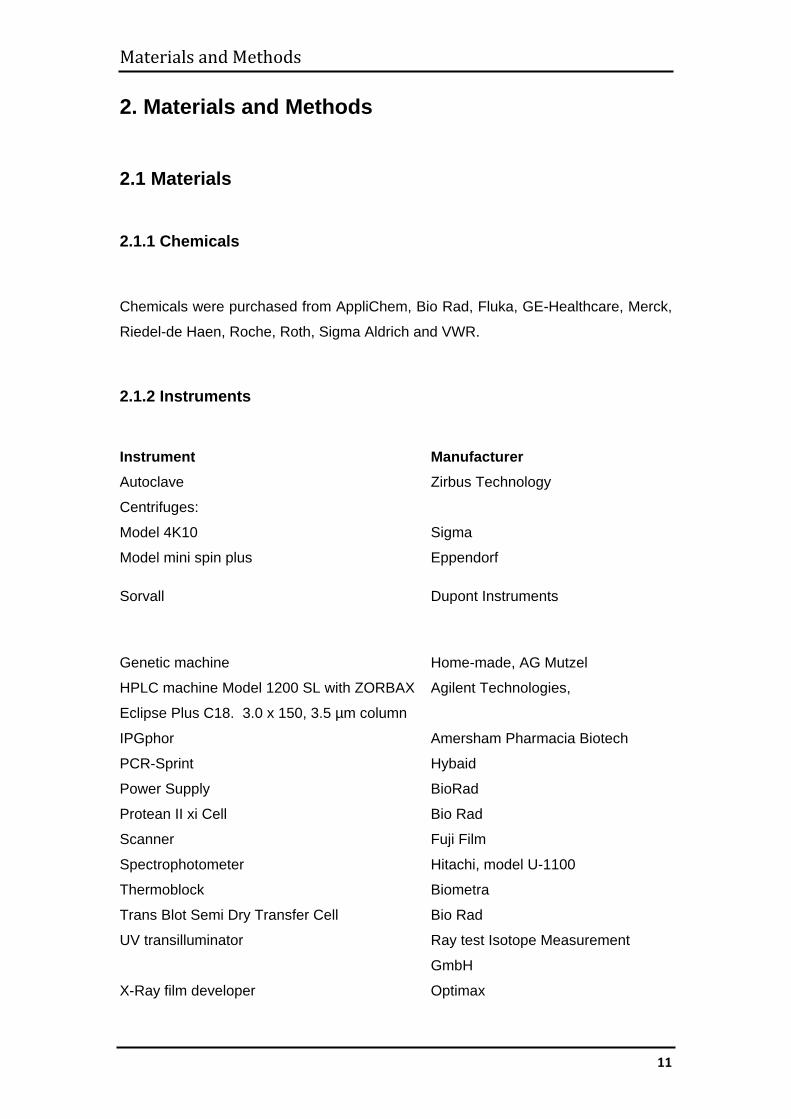
2. Materials and Methods 2.1 Materials 2.1.1 Chemicals
Chemicals were purchased from AppliChem, Bio Rad, Fluka, GE-Healthcare, Merck,
Riedel-de Haen, Roche, Roth, Sigma Aldrich and VWR.
2.1.2 Instruments Instrument Manufacturer Autoclave Zirbus Technology
Centrifuges:
Model 4K10
Model mini spin plus
Sorvall
Sigma
Eppendorf
Dupont Instruments
Genetic machine Home-made, AG Mutzel
HPLC machine Model 1200 SL with ZORBAX
Eclipse Plus C18. 3.0 x 150, 3.5 µm column
Agilent Technologies,
IPGphor Amersham Pharmacia Biotech
PCR-Sprint Hybaid
Power Supply BioRad
Protean II xi Cell Bio Rad
Scanner Fuji Film
Spectrophotometer Hitachi, model U-1100
Thermoblock Biometra
Trans Blot Semi Dry Transfer Cell Bio Rad
UV transilluminator Ray test Isotope Measurement
GmbH
X-Ray film developer Optimax
Materials and Methods
12
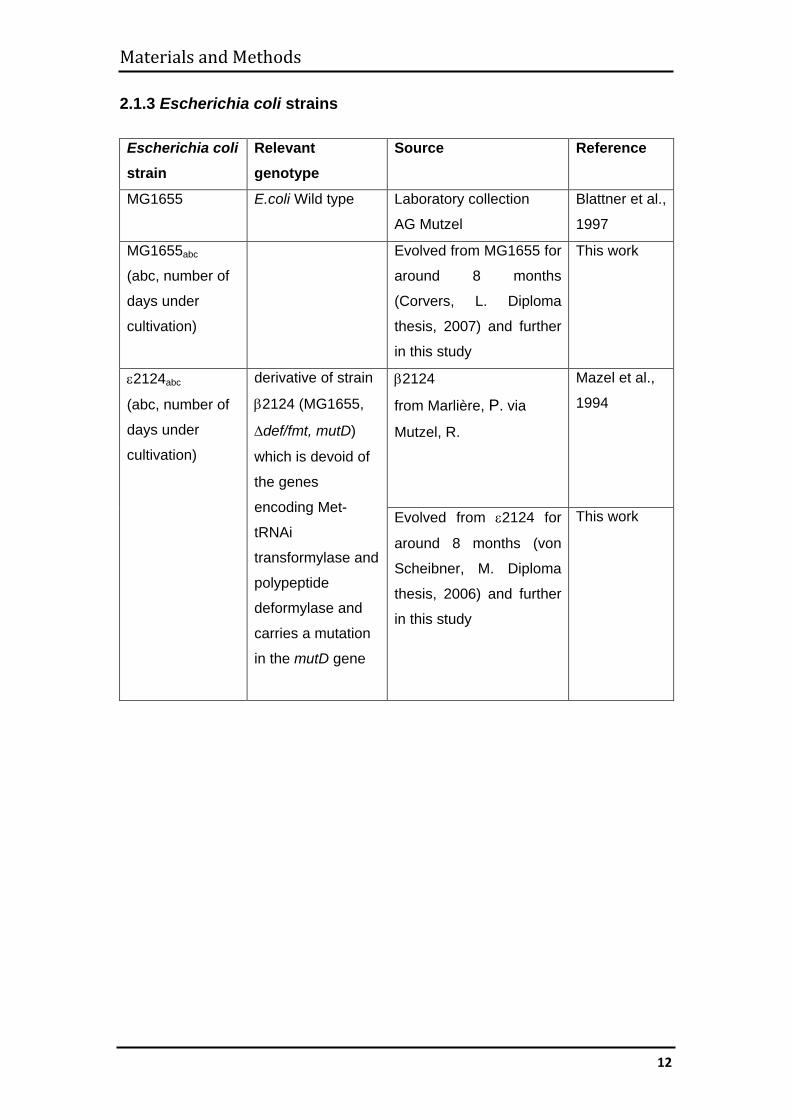
2.1.3 Escherichia coli strains Escherichia coli strain
Relevant genotype
Source Reference
MG1655 E.coli Wild type Laboratory collection
AG Mutzel
Blattner et al.,
1997
MG1655abc
(abc, number of
days under
cultivation)
Evolved from MG1655 for
around 8 months
(Corvers, L. Diploma
thesis, 2007) and further
in this study
This work
ε2124abc
(abc, number of
days under
cultivation)
derivative of strain
β2124 (MG1655,
∆def/fmt, mutD)
which is devoid of
the genes
encoding Met-
tRNAi
transformylase and
polypeptide
deformylase and
carries a mutation
in the mutD gene
β2124
from Marlière, P. via
Mutzel, R.
Mazel et al.,
1994
Evolved from ε2124 for
around 8 months (von
Scheibner, M. Diploma
thesis, 2006) and further
in this study
This work
Materials and Methods
13
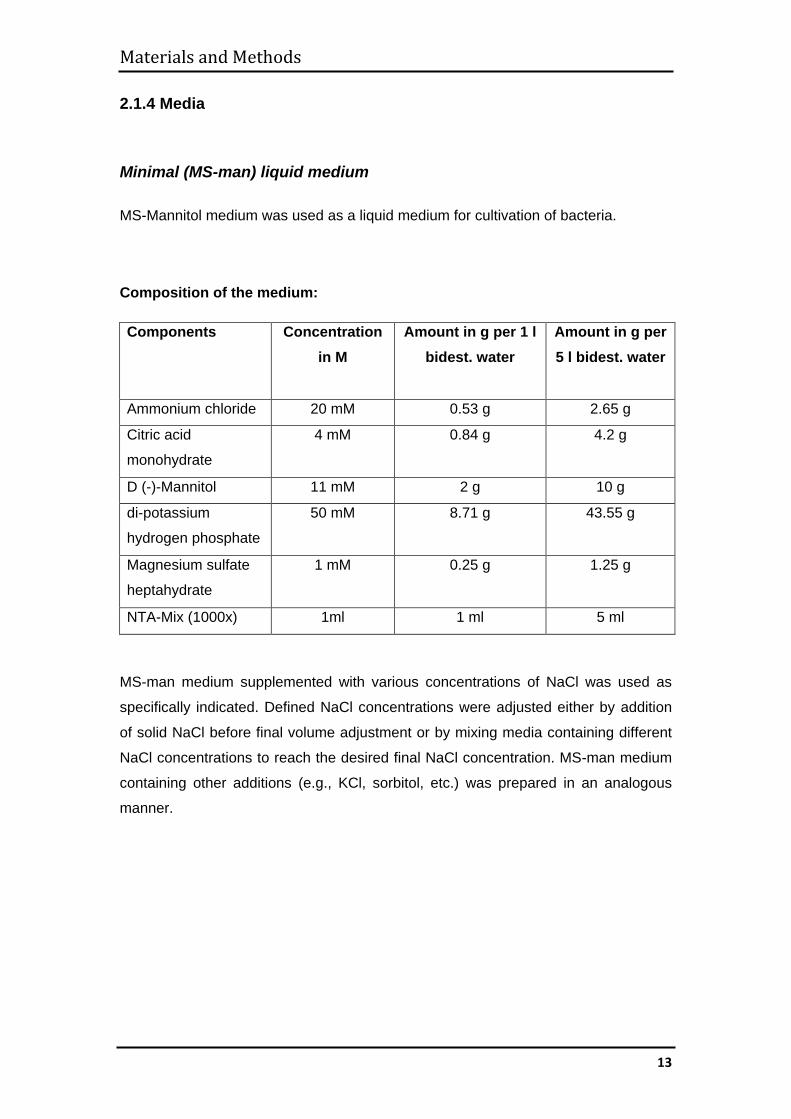
2.1.4 Media
Minimal (MS-man) liquid medium MS-Mannitol medium was used as a liquid medium for cultivation of bacteria.
Composition of the medium:
Components Concentration in M
Amount in g per 1 l bidest. water
Amount in g per 5 l bidest. water
Ammonium chloride 20 mM 0.53 g 2.65 g
Citric acid
monohydrate 4 mM 0.84 g 4.2 g
D (-)-Mannitol 11 mM 2 g 10 g
di-potassium
hydrogen phosphate 50 mM 8.71 g 43.55 g
Magnesium sulfate
heptahydrate 1 mM 0.25 g 1.25 g
NTA-Mix (1000x) 1ml 1 ml 5 ml
MS-man medium supplemented with various concentrations of NaCl was used as
specifically indicated. Defined NaCl concentrations were adjusted either by addition
of solid NaCl before final volume adjustment or by mixing media containing different
NaCl concentrations to reach the desired final NaCl concentration. MS-man medium
containing other additions (e.g., KCl, sorbitol, etc.) was prepared in an analogous
manner.
Materials and Methods
14
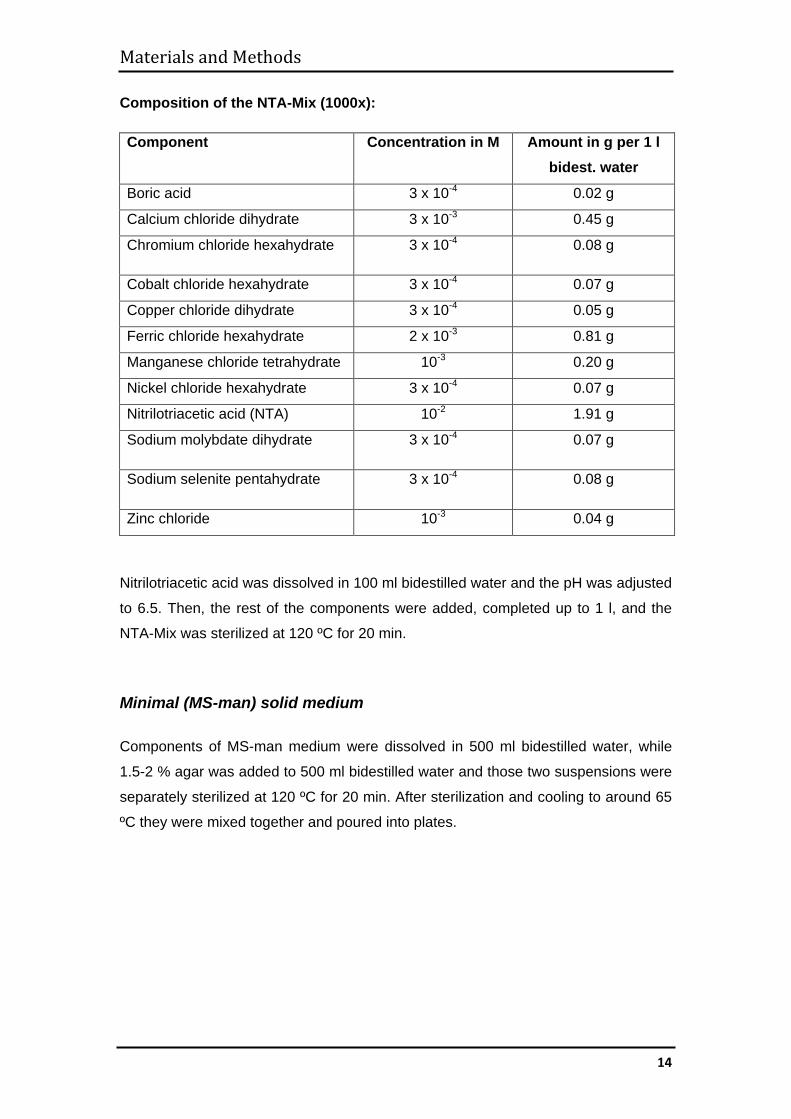
Composition of the NTA-Mix (1000x):
Component Concentration in M Amount in g per 1 l bidest. water
Boric acid 3 x 10⁻⁴ 0.02 g
Calcium chloride dihydrate 3 x 10⁻³ 0.45 g
Chromium chloride hexahydrate 3 x 10⁻⁴ 0.08 g
Cobalt chloride hexahydrate 3 x 10⁻⁴ 0.07 g
Copper chloride dihydrate 3 x 10⁻⁴ 0.05 g
Ferric chloride hexahydrate 2 x 10⁻³ 0.81 g
Manganese chloride tetrahydrate 10-3 0.20 g
Nickel chloride hexahydrate 3 x 10⁻⁴ 0.07 g
Nitrilotriacetic acid (NTA) 10-2 1.91 g
Sodium molybdate dihydrate 3 x 10⁻⁴ 0.07 g
Sodium selenite pentahydrate 3 x 10⁻⁴ 0.08 g
Zinc chloride 10-3 0.04 g
Nitrilotriacetic acid was dissolved in 100 ml bidestilled water and the pH was adjusted
to 6.5. Then, the rest of the components were added, completed up to 1 l, and the
NTA-Mix was sterilized at 120 ºC for 20 min.
Minimal (MS-man) solid medium Components of MS-man medium were dissolved in 500 ml bidestilled water, while
1.5-2 % agar was added to 500 ml bidestilled water and those two suspensions were
separately sterilized at 120 ºC for 20 min. After sterilization and cooling to around 65
ºC they were mixed together and poured into plates.
Materials and Methods
15
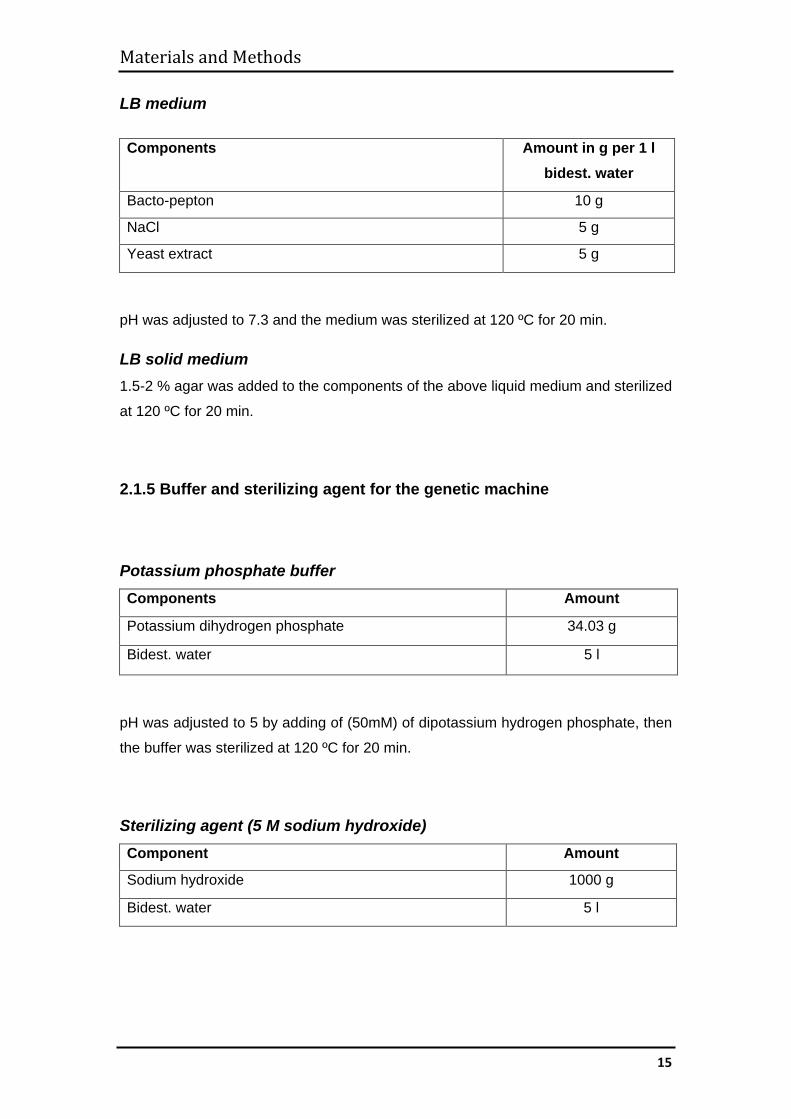
LB medium Components Amount in g per 1 l
bidest. water
Bacto-pepton 10 g
NaCl 5 g
Yeast extract 5 g
pH was adjusted to 7.3 and the medium was sterilized at 120 ºC for 20 min.
LB solid medium 1.5-2 % agar was added to the components of the above liquid medium and sterilized
at 120 ºC for 20 min.
2.1.5 Buffer and sterilizing agent for the genetic machine
Potassium phosphate buffer Components Amount
Potassium dihydrogen phosphate 34.03 g
Bidest. water 5 l
pH was adjusted to 5 by adding of (50mM) of dipotassium hydrogen phosphate, then
the buffer was sterilized at 120 ºC for 20 min.
Sterilizing agent (5 M sodium hydroxide) Component Amount
Sodium hydroxide 1000 g
Bidest. water 5 l
Materials and Methods
16
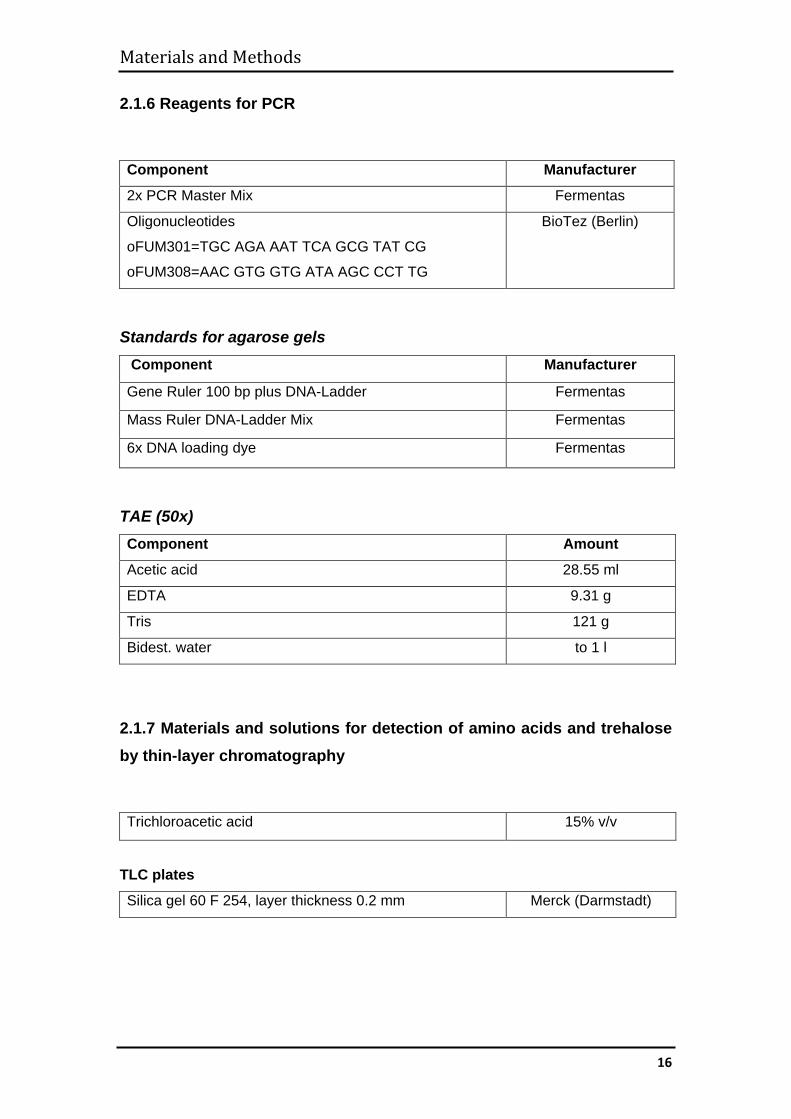
2.1.6 Reagents for PCR
Component Manufacturer
2x PCR Master Mix Fermentas
Oligonucleotides
oFUM301=TGC AGA AAT TCA GCG TAT CG
oFUM308=AAC GTG GTG ATA AGC CCT TG
BioTez (Berlin)
Standards for agarose gels
Component Manufacturer
Gene Ruler 100 bp plus DNA-Ladder Fermentas
Mass Ruler DNA-Ladder Mix Fermentas
6x DNA loading dye Fermentas
TAE (50x) Component Amount
Acetic acid 28.55 ml
EDTA 9.31 g
Tris 121 g
Bidest. water to 1 l
2.1.7 Materials and solutions for detection of amino acids and trehalose by thin-layer chromatography
Trichloroacetic acid 15% v/v
TLC plates
Silica gel 60 F 254, layer thickness 0.2 mm Merck (Darmstadt)
Materials and Methods
17
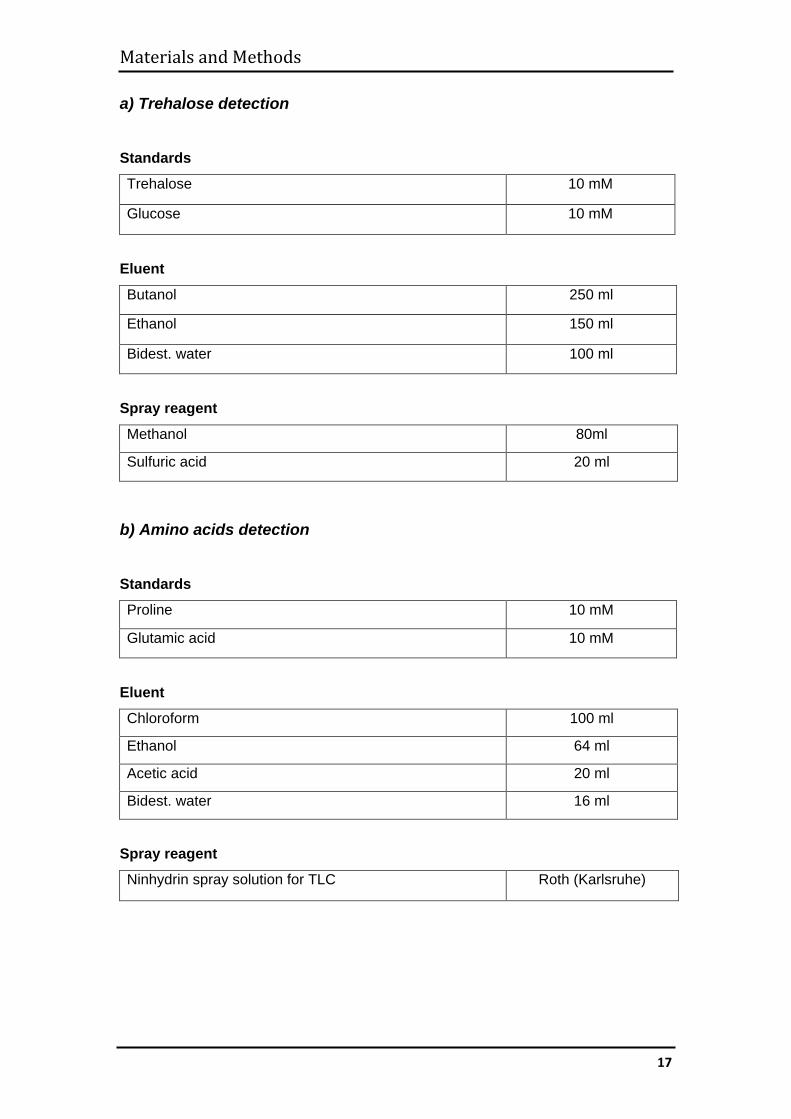
a) Trehalose detection Standards
Trehalose 10 mM
Glucose 10 mM
Eluent
Butanol 250 ml
Ethanol 150 ml
Bidest. water 100 ml
Spray reagent
Methanol 80ml
Sulfuric acid 20 ml
b) Amino acids detection Standards
Proline 10 mM
Glutamic acid 10 mM
Eluent
Chloroform 100 ml
Ethanol 64 ml
Acetic acid 20 ml
Bidest. water 16 ml
Spray reagent
Ninhydrin spray solution for TLC Roth (Karlsruhe)
Materials and Methods
18
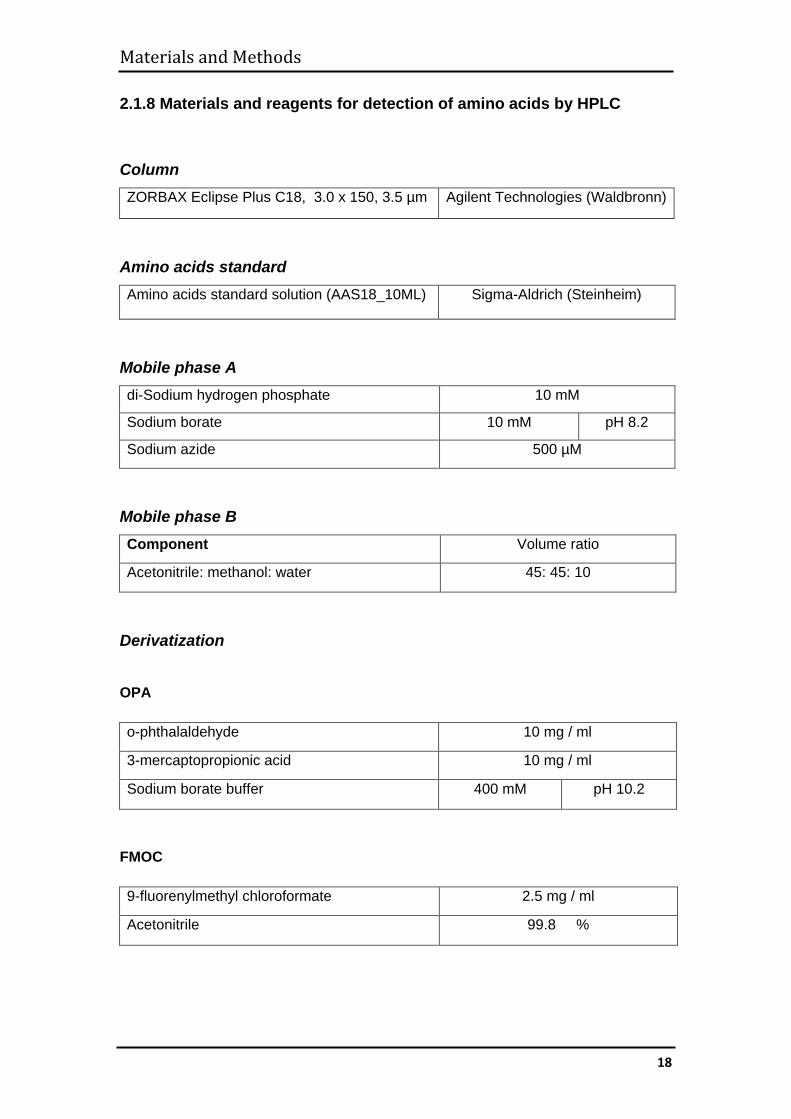
2.1.8 Materials and reagents for detection of amino acids by HPLC
Column ZORBAX Eclipse Plus C18, 3.0 x 150, 3.5 µm Agilent Technologies (Waldbronn)
Amino acids standard Amino acids standard solution (AAS18_10ML) Sigma-Aldrich (Steinheim)
Mobile phase A di-Sodium hydrogen phosphate 10 mM
Sodium borate 10 mM pH 8.2
Sodium azide 500 µM
Mobile phase B Component Volume ratio
Acetonitrile: methanol: water 45: 45: 10
Derivatization
OPA
o-phthalaldehyde 10 mg / ml
3-mercaptopropionic acid 10 mg / ml
Sodium borate buffer 400 mM pH 10.2
FMOC
9-fluorenylmethyl chloroformate 2.5 mg / ml
Acetonitrile 99.8 %
Materials and Methods
19
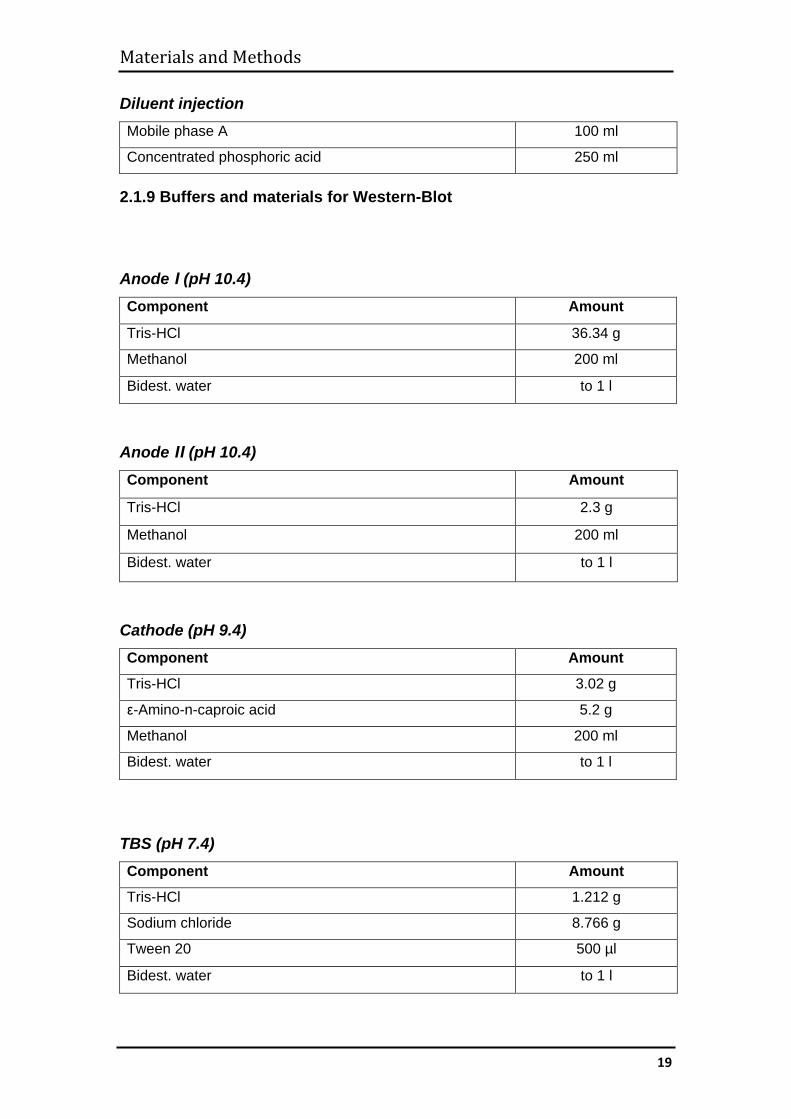
Diluent injection Mobile phase A 100 ml
Concentrated phosphoric acid 250 ml
2.1.9 Buffers and materials for Western-Blot
Anode I (pH 10.4) Component Amount
Tris-HCl 36.34 g
Methanol 200 ml
Bidest. water to 1 l
Anode II (pH 10.4) Component Amount
Tris-HCl 2.3 g
Methanol 200 ml
Bidest. water to 1 l
Cathode (pH 9.4) Component Amount
Tris-HCl 3.02 g
ε-Amino-n-caproic acid 5.2 g
Methanol 200 ml
Bidest. water to 1 l
TBS (pH 7.4) Component Amount
Tris-HCl 1.212 g
Sodium chloride 8.766 g
Tween 20 500 µl
Bidest. water to 1 l
Materials and Methods
20
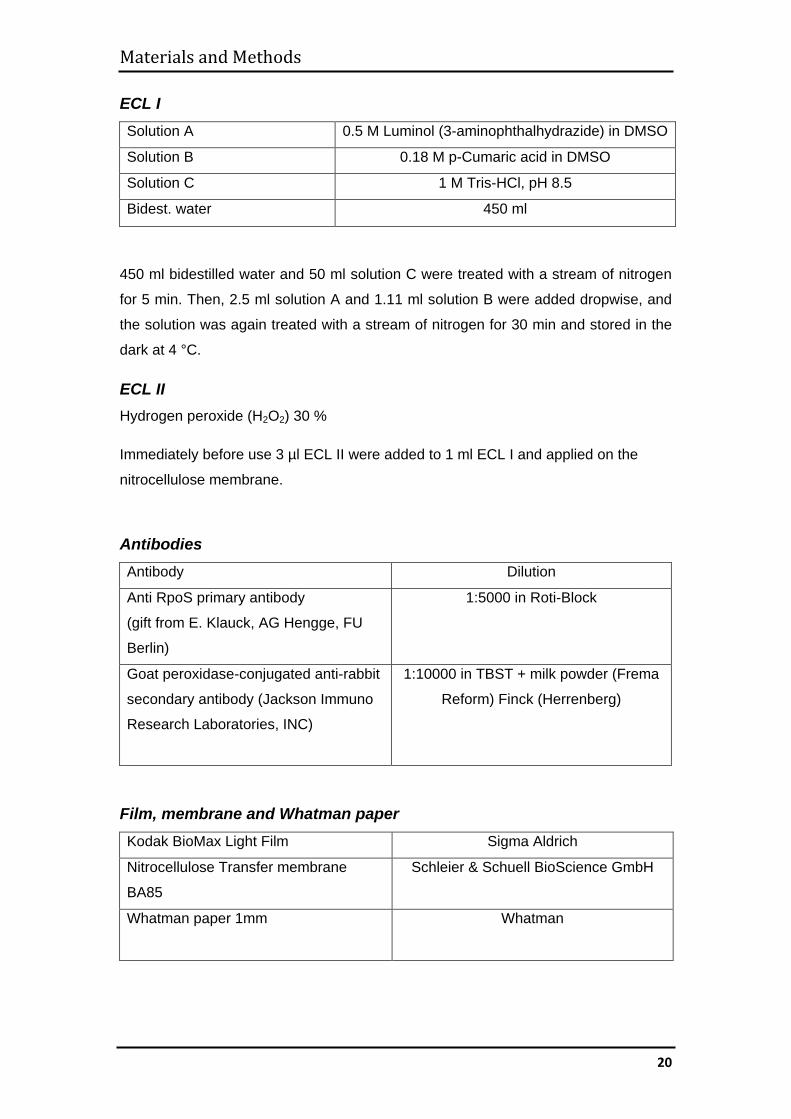
ECL I Solution A 0.5 M Luminol (3-aminophthalhydrazide) in DMSO
Solution B 0.18 M p-Cumaric acid in DMSO
Solution C 1 M Tris-HCl, pH 8.5
Bidest. water 450 ml
450 ml bidestilled water and 50 ml solution C were treated with a stream of nitrogen
for 5 min. Then, 2.5 ml solution A and 1.11 ml solution B were added dropwise, and
the solution was again treated with a stream of nitrogen for 30 min and stored in the
dark at 4 °C.
ECL II Hydrogen peroxide (H2O2) 30 %
Immediately before use 3 µl ECL II were added to 1 ml ECL I and applied on the
nitrocellulose membrane.
Antibodies Antibody Dilution
Anti RpoS primary antibody
(gift from E. Klauck, AG Hengge, FU
Berlin)
1:5000 in Roti-Block
Goat peroxidase-conjugated anti-rabbit
secondary antibody (Jackson Immuno
Research Laboratories, INC)
1:10000 in TBST + milk powder (Frema
Reform) Finck (Herrenberg)
Film, membrane and Whatman paper Kodak BioMax Light Film Sigma Aldrich
Nitrocellulose Transfer membrane
BA85
Schleier & Schuell BioScience GmbH
Whatman paper 1mm
Whatman
Materials and Methods
21
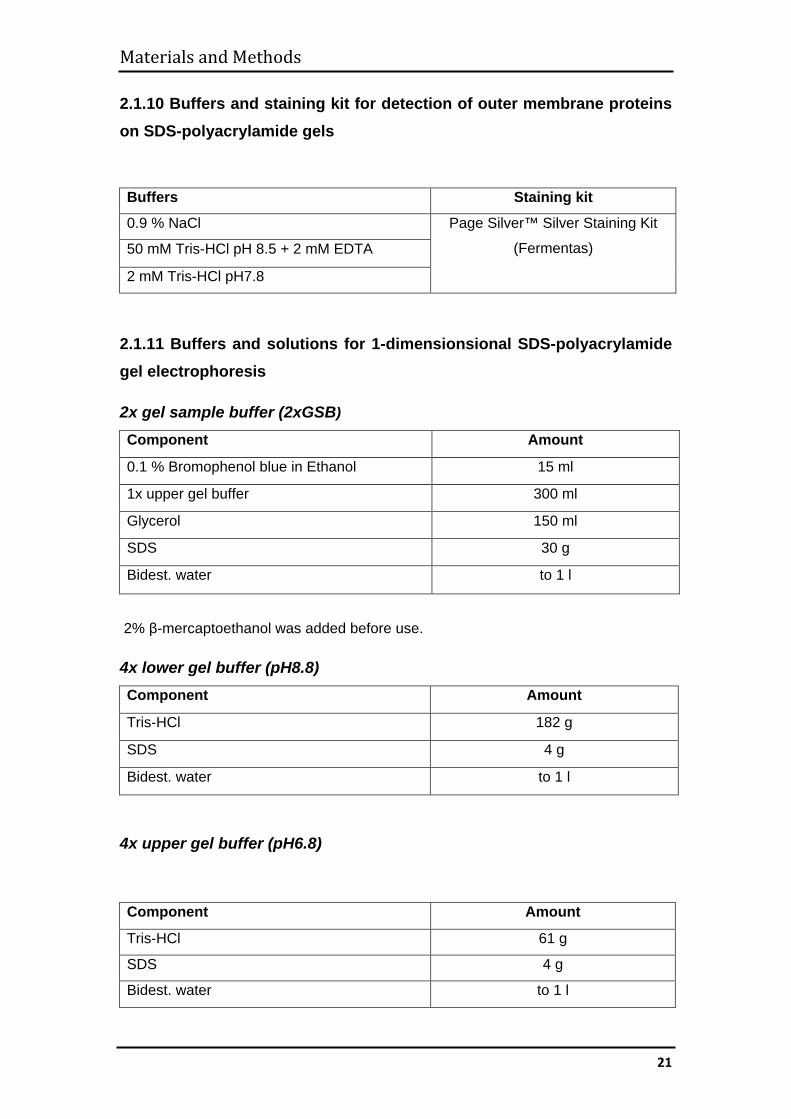
2.1.10 Buffers and staining kit for detection of outer membrane proteins on SDS-polyacrylamide gels
Buffers Staining kit
0.9 % NaCl Page Silver™ Silver Staining Kit
(Fermentas) 50 mM Tris-HCl pH 8.5 + 2 mM EDTA
2 mM Tris-HCl pH7.8
2.1.11 Buffers and solutions for 1-dimensionsional SDS-polyacrylamide gel electrophoresis
2x gel sample buffer (2xGSB)
Component Amount
0.1 % Bromophenol blue in Ethanol 15 ml
1x upper gel buffer 300 ml
Glycerol 150 ml
SDS 30 g
Bidest. water to 1 l
2% β-mercaptoethanol was added before use.
4x lower gel buffer (pH8.8) Component Amount
Tris-HCl 182 g
SDS 4 g
Bidest. water to 1 l
4x upper gel buffer (pH6.8)
Component Amount
Tris-HCl 61 g
SDS 4 g
Bidest. water to 1 l
Materials and Methods
22
SDS-polyacrylamide gel electrophoresis
Small gel (5 ml Separation gel, 2.5 ml Stacking gel) Separation gel
Components for 2 gels 12.5%
4x Lower gel buffer (ml) 3.1
30% acrylamid/ bisacrylamid (ml)
(Rotiphorese Gel 30)
5.2
MQ water (ml) 4.1
TEMED (µl) 10
10% APS (µl) 100
Stacking gel
Components for 2 gels Volume
4x Upper gel buffer 1.25 ml
30% acrylamid/ bisacrylamid (Rotiphorese Gel 30) 0.5 ml
MQ water 3.2 ml
TEMED 5 µl
10% APS 30 µl
Large gel (35 ml Separation gel , 8 ml Stacking gel) Separation gel
Components for 2 gels 12.5%
4x Lower gel buffer (ml) 18.6
30% acrylamid/bisacrylamid (Rotiphorese Gel 30) (ml) 31.2
MQ water (ml) 24.4
TEMED (µl) 54
10% APS (µl) 540
Materials and Methods
23
Stacking gel
Components for 2 gels Volume
4x Upper gel buffer 5 ml
30% acrylamid/ bisacrylamid (Rotiphorese Gel 30) 2 ml
MQ water 12.8 ml
TEMED 20 µl
10% APS 120 µl
10 x running buffer
Component Amount
Tris-HCl 30.3 g
Glycine 144 g
SDS 10 g
Bidest. water to 1 l
Coomassie stain
Component Volume
Acetic acid 100 ml
Methanol 300 ml
Bidest. water 600 ml
Standard for protein gel
Component Manufacturer
Protein molecular weight marker Fermentas
Materials and Methods
24
2.1.12 Buffers and solutions for two-dimensionsional SDS-polyacrylamide gel electrophoresis
Washing buffer 10mM Tris-HCl pH 8, 5 mM magnesium acetate
SA buffer SA buffer contained 0.3% (wt/vol) SDS, 4.44 mg of Tris-HCl liter -1, 2.56 mg of Tris
base liter -1, and 20 mM dithiothreitol (DTT) added freshly.
DNase I and RNase A DNase I and RNase A were added at concentrations of 0.064 mg ml-1 and 0.09 mg
ml-1, respectively, together with 58mM MgCl2.
Lysis buffer Component Amount per 10 ml Final concentration
Urea 4.8 g 8M
Thiourea 1.52 g 2M
300mM Tris-HCl pH 8.5 1 ml 30 mM
ASB-14 0.2 g 2%
DTT 0.030 g 20mM
Antiprotease cocktail a little amount (optionally)
Urea and thiourea were dissolved by intensive shaking, then 0.5 g Resin (AG 501-X8
Resin, Bio Rad) was added, and the solution was filtrated through a Milipore filter
(0.22 µm). 0.2 g ASB-14 was added and 2 ml aliquots were stored at -20 °C. 20mM
DTT (0.006 g) and half of tablet of antiprotease cocktail (EDTA free, Roche) were
added to aliquot 2 ml prior to use.
SDS equilibration buffer Component Amount Final concentration
Urea 21.66 g 6M
Tris-HCl 1.5 M pH 8.8 2.02 g 50 mM
Glycerol (50 %) 36 ml 30 %
SDS 1.2 g 2 %
MQ water to 60 ml
Materials and Methods
25
Rehydration buffer (for IPG Strips 4-7, GE Healthcare) Component Amount per 25 ml Final concentration
Urea 10.51 g 7M
Thiourea 3.8 g 2M
ASB-14 0.5 g 2 %
IPG buffer pH 4-7 (GE Healthcare) 150 µl 0.6 %
Destreak solution (GE Healthcare) 300 µl
DTT 1%
Urea and thiourea were dissolved in around 20 ml MQ water by vigorous vortexing
for 20 min at RT, then 5 g resin/100 ml was added and the suspension was vortexed
for 1 h at RT, then the solution was filtrated through a 0.22 µm filter. ASB, IPG buffer
and Destreak solution were added and the suspension was completed to 25 ml with
MQ water. The buffer was stored aliquoted as 0.8 ml at -20 °C. Before using, DTT
were added to final concentration 1%. For 18 cm dry strips the total volume of
rehydration buffer including the protein sample was equal to 340 µl.
Agarose sealing solution Component Amount
1xSDS electrophoresis buffer 100 ml
Agarose 0.5 g
1% Bromophenol blue stock solution 200 µl
Bromophenol blue stock solution Component Amount
Bromophenol blue 100 mg
Tris-base 60 mg
MQ water to 10 ml
SDS electrophoresis buffer (10x) Component Amount
Tris-base 60.5 g
Glycine 288.2 g
SDS 40 g
MQ water to 2 l
Materials and Methods
26
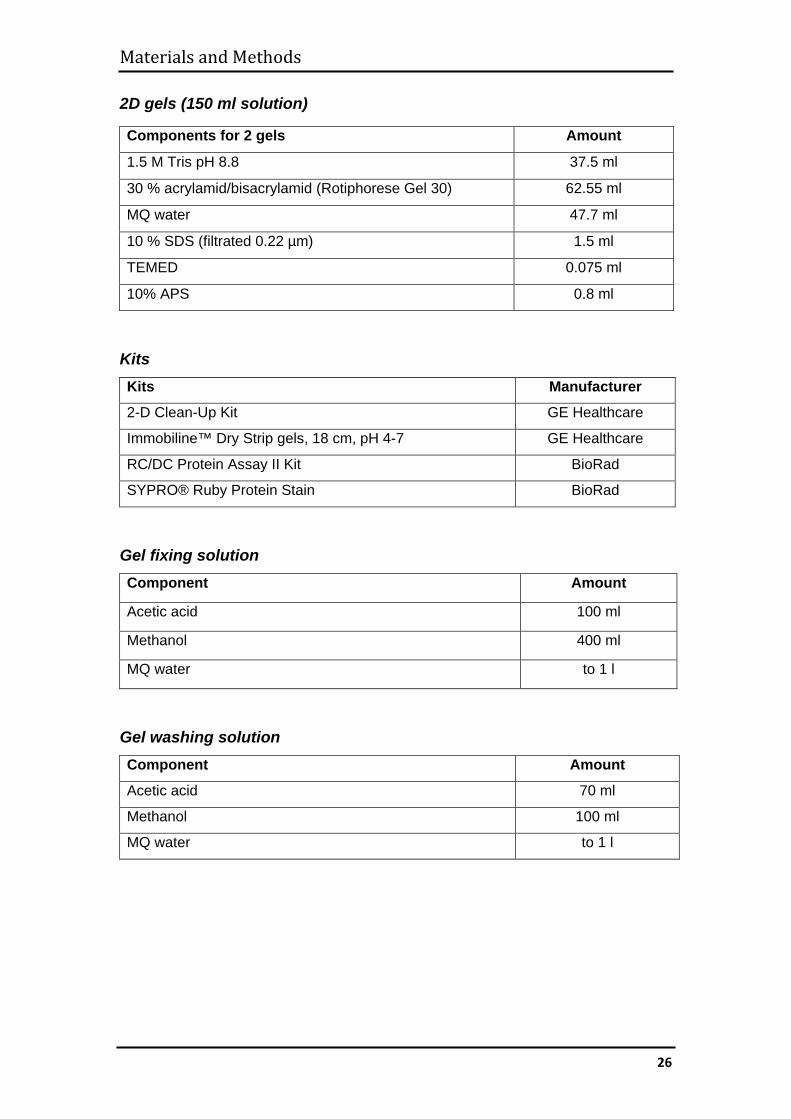
2D gels (150 ml solution)
Kits Kits Manufacturer
2-D Clean-Up Kit GE Healthcare
Immobiline™ Dry Strip gels, 18 cm, pH 4-7 GE Healthcare
RC/DC Protein Assay II Kit BioRad
SYPRO® Ruby Protein Stain BioRad
Gel fixing solution Component Amount
Acetic acid 100 ml
Methanol 400 ml
MQ water to 1 l
Gel washing solution Component Amount
Acetic acid 70 ml
Methanol 100 ml
MQ water to 1 l
Components for 2 gels Amount
1.5 M Tris pH 8.8 37.5 ml
30 % acrylamid/bisacrylamid (Rotiphorese Gel 30) 62.55 ml
MQ water 47.7 ml
10 % SDS (filtrated 0.22 µm) 1.5 ml
TEMED 0.075 ml
10% APS 0.8 ml
Materials and Methods
27
2.2 Methods
2.2.1 Operation of the genetic machine
Continuous proliferation under osmotic selection
All evolved strains were cultivated aerobically in simple inorganic minimal media
supplemented with a chemically stable, autoclavable carbon source (mannitol) at 30
°C. In the 26.5-ml reactors, which were used for continuous cultivation, cell densities
were adjusted to approximately 1 x 10⁹/ml, resulting in a total of ca. 2.5 x 10¹⁰ cells
under constant selection (the mutation rate for E. coli is ca. 5 x 10⁻¹⁰ per base pair
per generation; Drake, 1991).
Technically (Fig. 2 and 3), the continuous cultivation process is executed
automatically as follows. Cultures are grown under the regime described above (for 6
h in case of MG1655 and for 12 h in case of ε2124) in one of the two reactors (the
second reactor being empty and sterile). The culture is then transferred to the second
reactor. The first reactor and all of the other inner surfaces of the device which were
in contact with living cells are sterilized with an excess of concentrated (5 M) NaOH.
After removing the sterilizing agent, all surfaces that were in contact with it are
neutralized by rinsing with an excess of slightly acidic (pH 5.0) 50 mM K-phosphate
buffer. After removal of the buffer solution, this part of the device is empty and sterile,
ready to accommodate the proliferating cell suspension which was in the second
reactor.
During normal operation of the device, the risk of contamination with undesired
microorganisms is nil, however, any "open" manipulation necessary during
inoculation, exchange of reservoirs for liquids or withdrawal of samples bears such a
risk. This is controlled by (i) applying standardized procedures for autoclaving liquids
and connecting reservoirs or devices for inoculation or sampling to the device (for
example, all entries into and exits from recipients are protected by tandem sterile
filters during and after autoclaving; connections between tubing are realized via
isolated sectors delimited by stainless steel adapters which can be flame-sterilized)
and (ii) by regularly checking the genetic identity of the evolved strains (every 200-
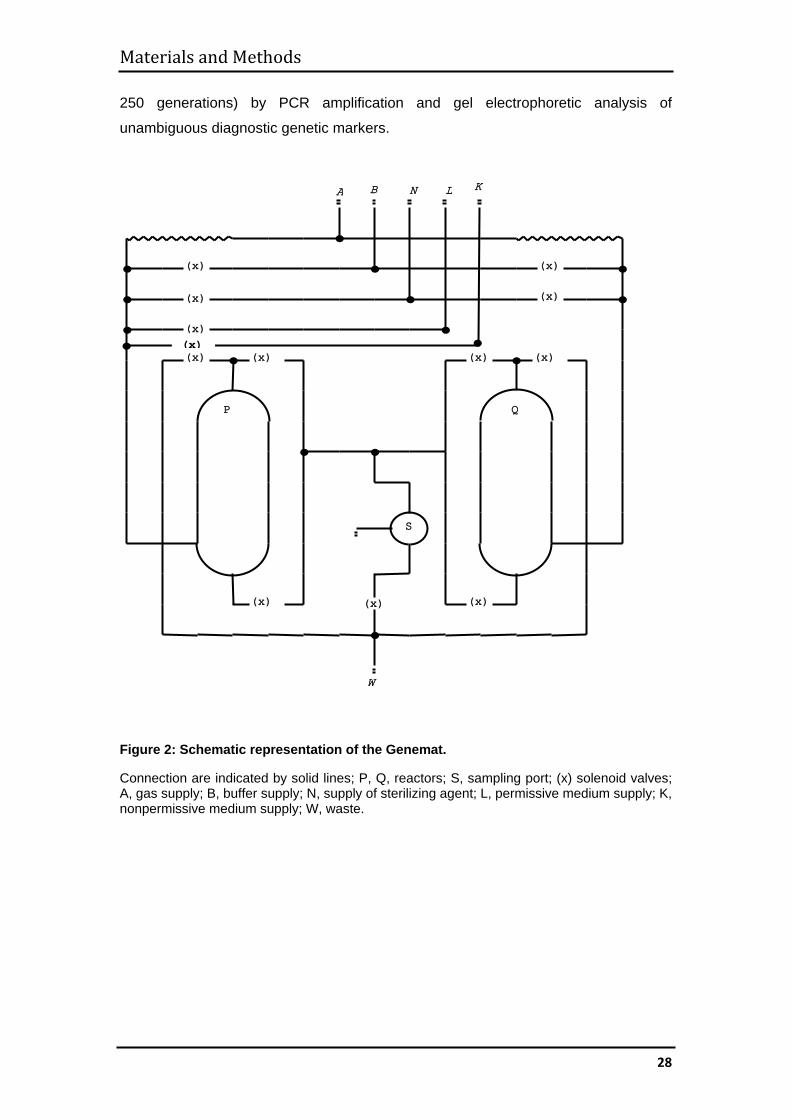
Materials and Methods
28
250 generations) by PCR amplification and gel electrophoretic analysis of
unambiguous diagnostic genetic markers.
Figure 2: Schematic representation of the Genemat.
Connection are indicated by solid lines; P, Q, reactors; S, sampling port; (x) solenoid valves; A, gas supply; B, buffer supply; N, supply of sterilizing agent; L, permissive medium supply; K, nonpermissive medium supply; W, waste.
(x) (x)
(x) (x)
(x) (x) (x)
(x)
(x)
(x)
(x)
(x)
P Q
S
A B N L K
(x)
W
Materials and Methods
29
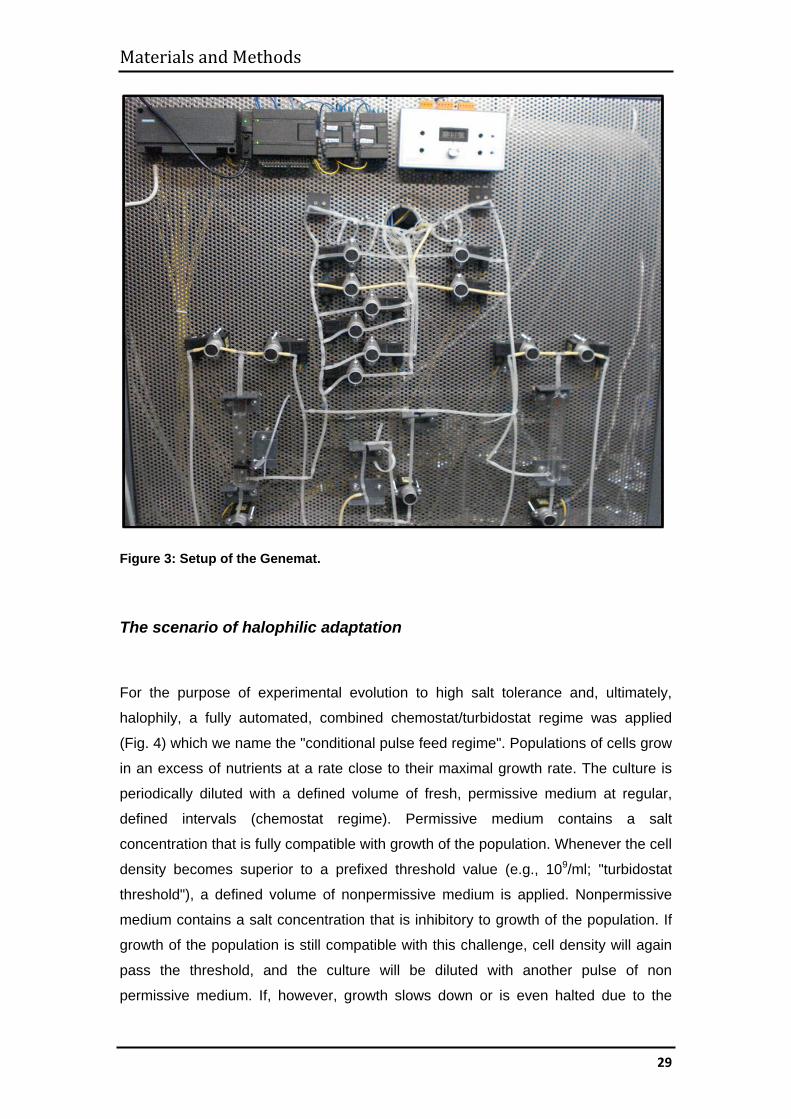
Figure 3: Setup of the Genemat.
The scenario of halophilic adaptation
For the purpose of experimental evolution to high salt tolerance and, ultimately,
halophily, a fully automated, combined chemostat/turbidostat regime was applied
(Fig. 4) which we name the "conditional pulse feed regime". Populations of cells grow
in an excess of nutrients at a rate close to their maximal growth rate. The culture is
periodically diluted with a defined volume of fresh, permissive medium at regular,
defined intervals (chemostat regime). Permissive medium contains a salt
concentration that is fully compatible with growth of the population. Whenever the cell
density becomes superior to a prefixed threshold value (e.g., 109/ml; "turbidostat
threshold"), a defined volume of nonpermissive medium is applied. Nonpermissive
medium contains a salt concentration that is inhibitory to growth of the population. If
growth of the population is still compatible with this challenge, cell density will again
pass the threshold, and the culture will be diluted with another pulse of non
permissive medium. If, however, growth slows down or is even halted due to the
Materials and Methods
30
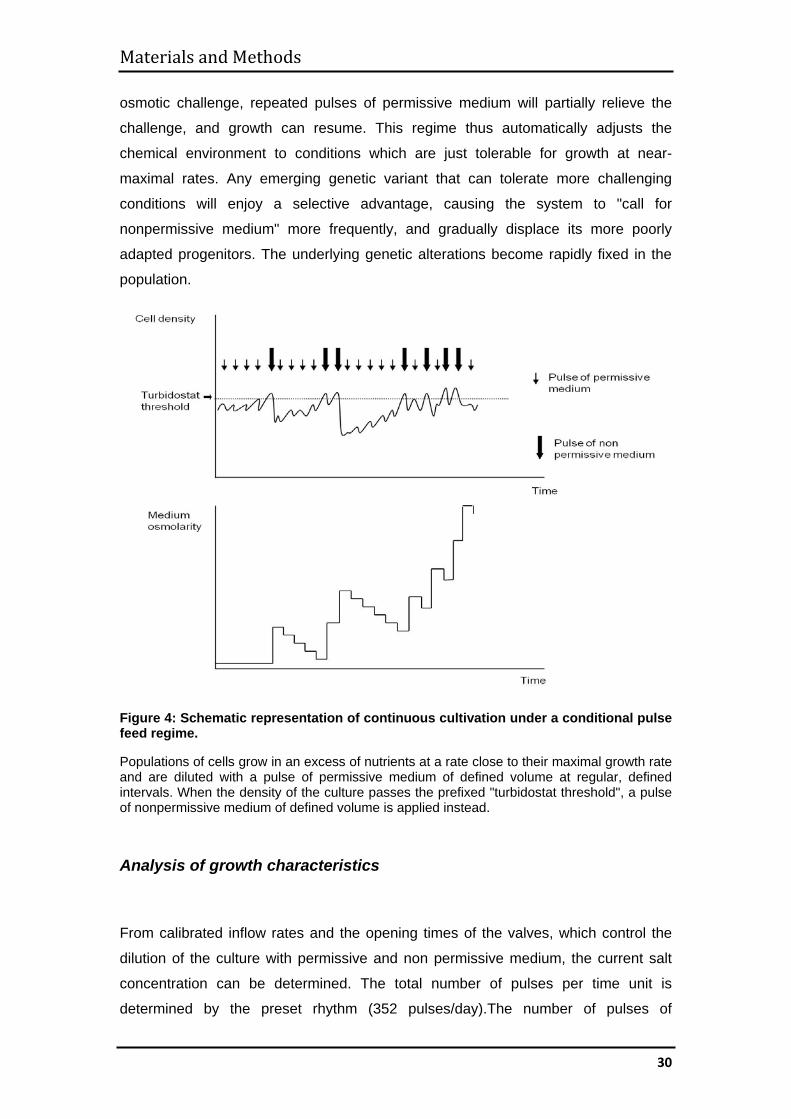
osmotic challenge, repeated pulses of permissive medium will partially relieve the
challenge, and growth can resume. This regime thus automatically adjusts the
chemical environment to conditions which are just tolerable for growth at near-
maximal rates. Any emerging genetic variant that can tolerate more challenging
conditions will enjoy a selective advantage, causing the system to "call for
nonpermissive medium" more frequently, and gradually displace its more poorly
adapted progenitors. The underlying genetic alterations become rapidly fixed in the
population.
Figure 4: Schematic representation of continuous cultivation under a conditional pulse feed regime.
Populations of cells grow in an excess of nutrients at a rate close to their maximal growth rate and are diluted with a pulse of permissive medium of defined volume at regular, defined intervals. When the density of the culture passes the prefixed "turbidostat threshold", a pulse of nonpermissive medium of defined volume is applied instead.
Analysis of growth characteristics
From calibrated inflow rates and the opening times of the valves, which control the
dilution of the culture with permissive and non permissive medium, the current salt
concentration can be determined. The total number of pulses per time unit is
determined by the preset rhythm (352 pulses/day).The number of pulses of
Materials and Methods
31
nonpermissive medium and the respective opening times of the valve commanding
addition of nonpermissive medium are recorded on a personal computer running in
the DOS mode with the help of a program ("snoopy", S. Brunke, unpublished) and
from these data the supplied volumes of permissive and nonpermissive medium per
day can be calculated.
Inoculation of the genetic machine
Initial cultures of MG1655 and ε2124 from previous work were used. These cultures
were stored frozen in the presence of 10% (v/v) DMSO at -70°C. A one-ml aliquot
was thawed at room temperature, inoculated in 30 ml MS-man/0.8 M NaCl medium
in an Erlenmeyer flasks and incubated at 30ºC for 2 days. Cultures were inoculated
via the machine's sampling port using a sterile 50 ml plastic syringe.
Preservation of bacterial strains
For preservation of bacterial strains, samples were withdrawn weekly from the
machines. 100 µl DMSO were mixed with 900 µl of the bacterial culture, vortexed,
and the samples were frozen at -70°C.
Control of the genetic identity of bacterial strains by PCR
The genetic identity of the evolving strains was checked every 200-250 generations
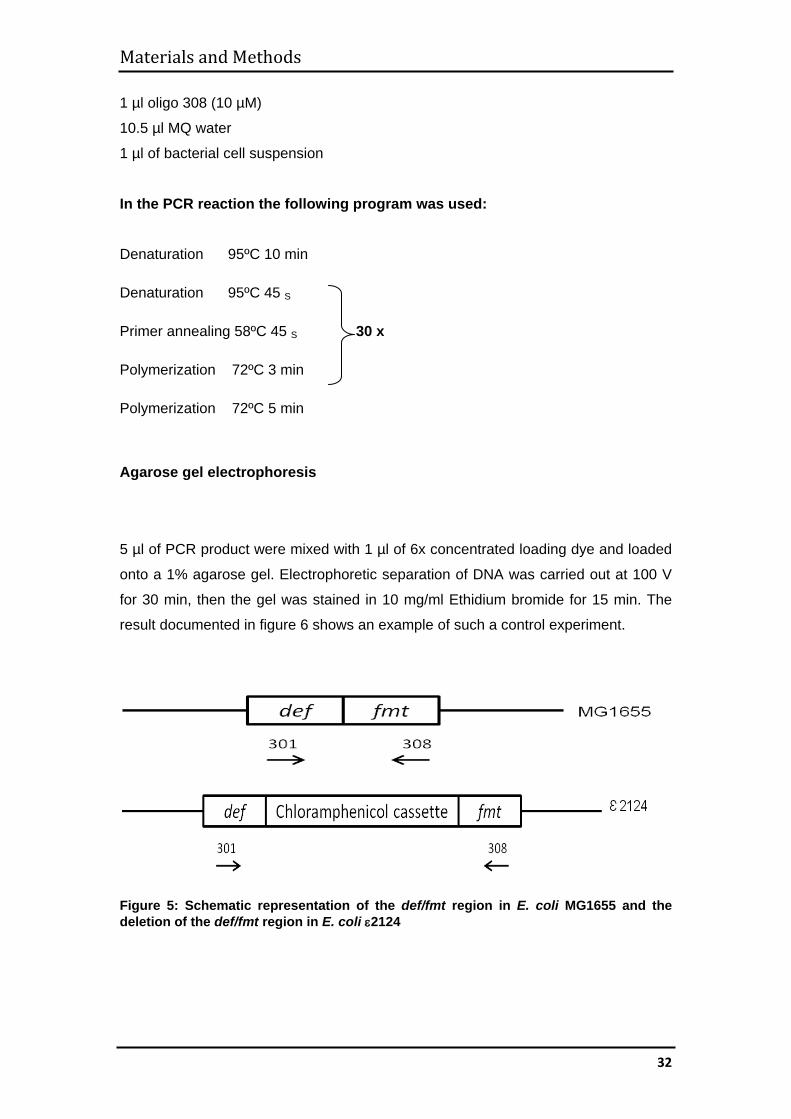
by PCR amplification of a part of the def/fmt operon (Fig. 5). In ε2124 the operon is
disrupted by insertion of a Chloramphenicol resistance cassette which renders the
amplified DNA fragment larger (ca. 2000 bp) than in the wild type (MG1655) situation
(ca. 1000 bp). For PCR, 1 ml of bacterial suspension grown to OD600=0.8, was
centrifuged at 8000 rpm for 5 min, and the pellet was resuspended in 0.5 ml MQ
water. One µl of this suspension was used as a source of genomic DNA in the PCR
reaction. PCR reaction was performed as follows:
25 µl assay mixture contained
12.5 µl Master mix (2x)
1 µl oligo 301 (10 µM)
Materials and Methods
32
1 µl oligo 308 (10 µM)
10.5 µl MQ water
1 µl of bacterial cell suspension
In the PCR reaction the following program was used: Denaturation 95ºC 10 min
Denaturation 95ºC 45 S
Primer annealing 58ºC 45 S 30 x
Polymerization 72ºC 3 min
Polymerization 72ºC 5 min
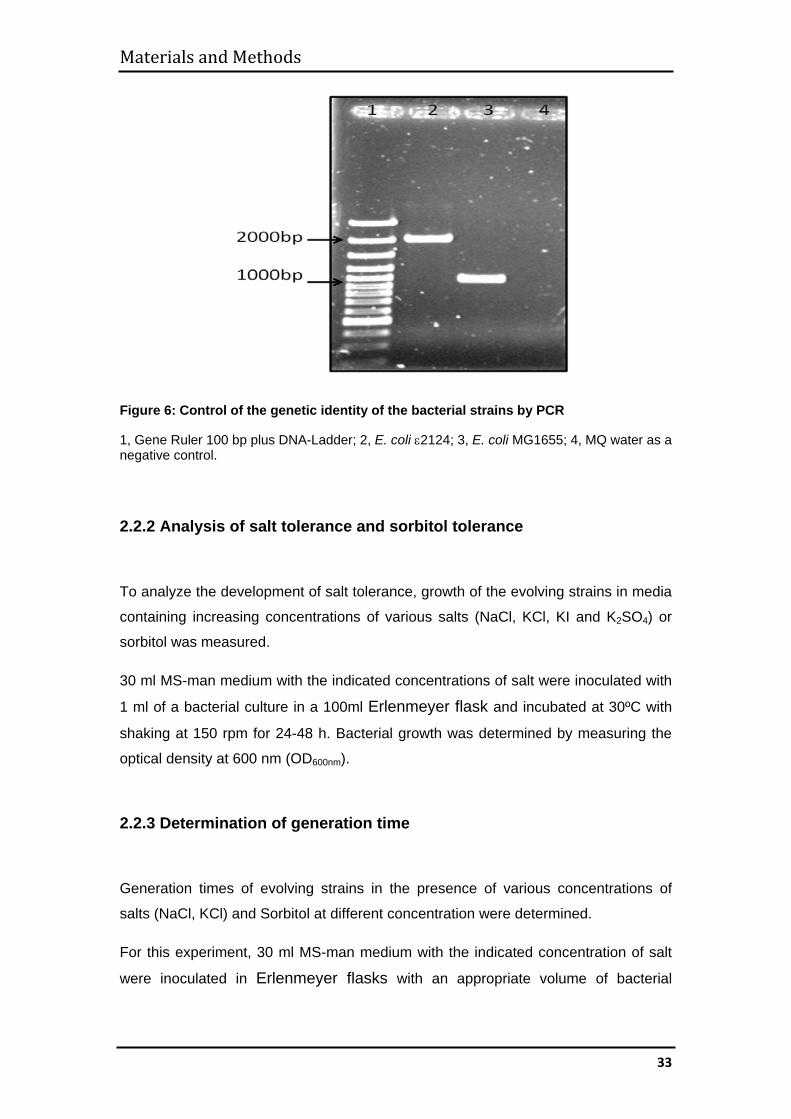
Agarose gel electrophoresis
5 µl of PCR product were mixed with 1 µl of 6x concentrated loading dye and loaded
onto a 1% agarose gel. Electrophoretic separation of DNA was carried out at 100 V
for 30 min, then the gel was stained in 10 mg/ml Ethidium bromide for 15 min. The
result documented in figure 6 shows an example of such a control experiment.
Figure 5: Schematic representation of the def/fmt region in E. coli MG1655 and the deletion of the def/fmt region in E. coli ε2124
Materials and Methods
33
Figure 6: Control of the genetic identity of the bacterial strains by PCR
1, Gene Ruler 100 bp plus DNA-Ladder; 2, E. coli ε2124; 3, E. coli MG1655; 4, MQ water as a negative control.
2.2.2 Analysis of salt tolerance and sorbitol tolerance
To analyze the development of salt tolerance, growth of the evolving strains in media
containing increasing concentrations of various salts (NaCl, KCl, KI and K2SO4) or
sorbitol was measured.
30 ml MS-man medium with the indicated concentrations of salt were inoculated with
1 ml of a bacterial culture in a 100ml Erlenmeyer flask and incubated at 30ºC with
shaking at 150 rpm for 24-48 h. Bacterial growth was determined by measuring the
optical density at 600 nm (OD600nm).
2.2.3 Determination of generation time
Generation times of evolving strains in the presence of various concentrations of
salts (NaCl, KCl) and Sorbitol at different concentration were determined.
For this experiment, 30 ml MS-man medium with the indicated concentration of salt
were inoculated in Erlenmeyer flasks with an appropriate volume of bacterial
Materials and Methods
34
culture to give an initial OD600nm of 0.1 and incubated at 30 ºC with shaking at 150
rpm. Growth was determined by measuring OD600nm at regular intervals.
2.2.4 Detection of intracellular trehalose by thin-layer chromatography
Cells were grown in MS-man medium with various concentrations of NaCl. 10 ml of
bacterial culture were harvested when the cell density had reached OD600nm=0.8 by
centrifugation at 4000 rpm for 10 min, and the bacterial pellets were washed once in
1ml of MS-man medium containing the same salt concentration. The pellets were
then resuspended with 8 µl of 15% TCA, incubated on ice for 10 min and centrifuged
again at 8000 rpm for 10 min to remove insoluble material. Afterwards the extracts
were transferred to a new Eppendorf tube.
TCA extracts (3 µl) were chromatographed on TLC silica gel 60 F254 thin-layer
plates using 50% butanol/30% ethanol/20% water for 4 h, dried, sprayed with 80%
methanol/20% sulfuric acid and the chromatograms were developed at 115ºC in an
oven for 15 min.
2.2.5 Detection of intracellular amino acids by thin-layer chromatography
Cells were grown in MS-man medium with various concentrations of NaCl and
bacterial extracts were prepared as described above (2.2.4). TCA extracts (3 µl)
were chromatographed on TLC silica gel 60 F254 thin-layer plates using 50%
chloroform/32% ethanol/10% acetic acid/8% water for 4 h, dried, sprayed with
ninhydrin solution (Spray solution ready to use , Roth) and incubated at 115ºC in an
oven for 15 min.
Materials and Methods
35
2.2.6 Quantification of intracellular amino acids by high-performance liquid chromatography (HPLC)
The detection and quantification of amino acids was performed by HPLC analysis on
an Agilent 1200 SL system referring to an Agilent Application Note. To ensure
specificity and sensitivity of the analysis, amino acids in
the samples were first derivatized using a pre-column protocol
[o-phthalaldehyde (OPA) for the primary and 9-fluorenylmethyl chloroformate
(FMOC) for secondary amino acids].
The derivatization was done using the following injection program for the automated
liquid sampler:
1. Draw 2.5 µl from sodium borate vial
2. Draw 1 µl from sample vial
3. Mix in washport 5 times
4. Wait 12 s
5. Draw 0.5 µl from OPA vial
6. Mix in washport 10 times max speed
7. Draw 0.4 µl from FMOC vial
8. Mix in washport 10 times max speed
9. Draw 32 µl from Diluent injection vial
10. Take 20 µl and mix in washport 8 times
11. Inject
12. Wait 6 s
13. Valve bypass
After injection, the samples were separated on a ZORBAX Eclipse Plus C18 column
at 40ºC using a binary mobile gradient of mobile phase A and mobile
phase B.
Materials and Methods
36
The gradient program was as follows: Time in min % of mobile phase B
0 2
0.5 2
20 57
20.1 100
23.5 100
23.6 2
25 End
Flow (ml min-1) 0.64
The eluting amino acids were detected with a fluorescence detector (FLD).
Parameter
FLD: signal was monitored at a wavelength of 450 nm (excitation wavelength
at 340 nm) after 18 min monitoring at 305 nm (excitation wavelength at 266 nm) for
detection of secondary amino acids.
Quantification: For quantitative analysis, a standard amino acid (AAS18) mix was used as a
reference to identify and determine the concentrations of the amino acids in the cell
extracts. The standard is composed of Alanine, Arginine, Aspartic acid, Cysteine,
Glutamic acid, Glycine, Histidine, Isoleucine, Leucine, Lysine, Methionine,
Phenylalanine, Proline, Serine, Threonine, Tyrosine and Valine.
2.2.7 Detection of total cellular proteome with the use of one-dimensional SDS-polyacrylamide gel electrophoresis
SDS polyacrylamide gel electrophoresis was carried out after Laemmli (Laemmli,
1970).
Materials and Methods
37
Preparation of samples
Cells were grown in MS-man medium containing various concentrations of NaCl. 10
ml of culture were harvested at OD600nm=0.4 by centrifugation at 5000 rpm for 10 min
at 4ºC. Pellets were washed once with 1 ml of the same medium, resuspended in
200 µl of 2 x GSB, heated at 95ºC for 10 min and centrifuged again at 13000 rpm for
1 min to remove insoluble material. Supernatants were transferred to fresh tubes.
Gel electrophoresis
For gel electrophoresis a Protean II xi cell was used. Equal amounts of protein
samples were loaded on 12.5 % polyacrylamide/0.1% SDS gels and proteins were
separated under cooling at 75 V overnight.
Staining
Gels were stained with Coomassie-Brilliant blue G250 stain overnight, and then
destained in destained solution for 4-6 h.
2.2.8 Western Blot
Preparation of protein samples
Cells were grown in MS-man medium supplemented with various concentrations of
NaCl. 10 ml of each culture were harvested at OD600nm=0.4 by centrifugation at 5000
rpm for 10 min at 4ºC. Pellets were washed once in 1 ml of the same medium,
resuspended in 200 µl of 2 x GSB, heated at 95ºC for 10 min and centrifuged again
at 13000 rpm for 1 min to remove any insoluble material. Supernatants were
transferred to fresh tubes.
Materials and Methods
38
Separation and transfer of protein sample
Equal amounts of protein samples were loaded onto and separated on 12.5 %
polyacrylamide/0.1% SDS gels. The transfer of proteins to nitrocellulose membrane
was carried out with the "semi dry method" according to Kyhse-Andersen (1984).
2.2.9 Detection of outer membrane proteins by SDS-polyacrylamide gel electrophoresis
Preparation of the sample
The wild type MG1655 strain was grown in MS-man medium without salt and evolved
strains with 0.8 M NaCl. Cultures were incubated with shaking at 150 rpm in 30ºC
and harvested at OD600=0.8.
Extraction of outer membrane proteins
Extraction of outer membrane proteins was carried out according to Lugtenberg et al.
(1975), as follows:
1. 100 ml of growing cells were harvested by centrifugation at 5000 rpm, 4ºC for 10
min.
2. Pellets were washed with 40 ml of 0.9% NaCl and centrifuged in a Sorvall
centrifuge using a GSA rotor at 5000 rpm, 4ºC for 10 min.
3. Pellets were resuspended in 40 ml of 50 mM Tris-HCl pH 8.5 containing 2 mM
EDTA. After sonication (4 times 1 min under cooling), unbroken cells and large
fragments were removed by centrifugation for 20 min at 5000 rpm in a Sorvall
centrifuge using a GSA rotor
4. The supernatant was centrifuged for 90 min at 20000 rpm in a Sorvall centrifuge
using a SS-34 rotor. The obtained pellet containing the envelopes was resuspended
and washed once in 20 ml of 50 mM Tris-HCl pH 8.5 containing 2 mM EDTA and
Materials and Methods
39
centrifuged again for 90 min at 20000 rpm. The pellet was finally resuspended in 2 ml
of 2 mM Tris-HCl, pH 7.8.
Gel electrophoresis
Equal amounts of protein sample were loaded onto and separated on 12.5 %
polyacrylamide /0.1% SDS gels.
Staining
Gels were stained with the Page Silver™ Silver Staining Kit (# K0681) according to
the manufacturer's instructions.
2.2.10 Analysis of the total cellular proteome by two-dimensional SDS gel electrophoresis (2-D PAGE)
Two-dimensional polyacrylamide gel electrophoresis (2D-PAGE) is a method
commonly used in proteomics. The first dimension is isoelectric focusing (IEF), which
is used to separate proteins according to their isoelectric point, while the second
dimension is SDS-PAGE, which relies on the separation of proteins according to their
molecular weight.
Preparation of protein samples for 2D-PAGE
Samples were prepared for 2D-PAGE according to Weichart et al. (2003) as follows:
The MG1655 wild type strain was grown in MS-man medium without salt and the
MG1655858 evolvant with 1.2 M NaCl. 10 ml of each sample were harvested during
the logarithmic growth phase by centrifugation at 5000 rpm for 10 min at 4ºC. Pellets
were washed once with 1 ml of the same medium, then twice with the wash buffer
and centrifuged at 13000 rpm for 5 min in mini spin plus centrifuge. Pellets were then
resuspended with 200 µl of SA buffer. The resuspended pellets were heated at 100
ºC for 2 min and subsequently kept at RT for 5 min. Then DNase I and RNase A
Materials and Methods
40
were added at concentrations of 0.064 mg ml-1 and 0.09 mg ml-1, respectively,
together with 58 mM MgCl2. The mixture was vortexed vigorously for 1-2 min and
nuclease digestion was allowed to proceed for 20 min.
Solubilization and denaturation of proteins
The pellet was resuspended in a lysis buffer to solubilize and denature proteins by
intensive vortexing for 30 min at RT. After solubilization the sample was sonicated 4
times for 30 s and then centrifuged at 13000 rpm at RT for 5 min. The supernatant,
which contains solubilized and denatured proteins, was collected and transferred into
fresh 2 ml tubes.
Cleaning of proteins with the "2-D Clean-Up Kit"
Before applying to 2D-PAGE, proteins were precipitated and cleaned up with the use
of a 2-D Clean-Up Kit (GE Healthcare) to reduce streaking on the gels and remove
non protein contaminants. The protein sample was cleaned according to the 2-D
Clean-Up Kit’s manual (GE Healthcare).
Determination of protein concentrations
The protein concentration of the samples was determined with the use of RC/DC
Protein Assay II (BioRad), according to the protocol provided by the company. The
measurement of protein concentration with the RC/DC Protein Assay II is based on
Lowry’s method (Lowry et al., 1951).
Isoelectric focusing
200 µg of the purified proteins were separated during IEF using 18 cm ImmobilineTM
Dry Strips, pH 4-7 (GE Healthcare). Before IEF, the samples were incubated in 10
mM DTT solution at RT for 20 min to reduce the disulfide bonds of the proteins.
Afterwards, the samples were incubated in 2% IPG buffer (pH 4-7) at RT for 20 min
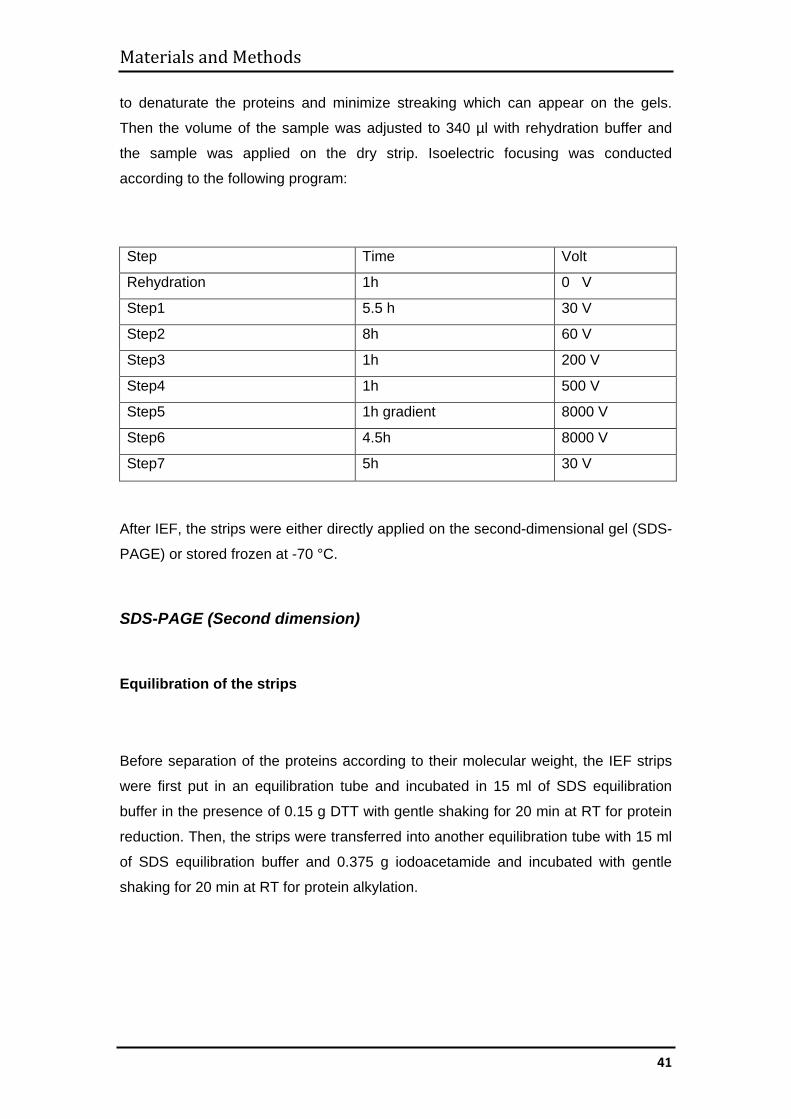
Materials and Methods
41
to denaturate the proteins and minimize streaking which can appear on the gels.
Then the volume of the sample was adjusted to 340 µl with rehydration buffer and
the sample was applied on the dry strip. Isoelectric focusing was conducted
according to the following program:
Step Time Volt
Rehydration 1h 0 V
Step1 5.5 h 30 V
Step2 8h 60 V
Step3 1h 200 V
Step4 1h 500 V
Step5 1h gradient 8000 V
Step6 4.5h 8000 V
Step7 5h 30 V
After IEF, the strips were either directly applied on the second-dimensional gel (SDS-
PAGE) or stored frozen at -70 °C.
SDS-PAGE (Second dimension)
Equilibration of the strips
Before separation of the proteins according to their molecular weight, the IEF strips
were first put in an equilibration tube and incubated in 15 ml of SDS equilibration
buffer in the presence of 0.15 g DTT with gentle shaking for 20 min at RT for protein
reduction. Then, the strips were transferred into another equilibration tube with 15 ml
of SDS equilibration buffer and 0.375 g iodoacetamide and incubated with gentle
shaking for 20 min at RT for protein alkylation.
Materials and Methods
42
SDS-PAGE
For gel electrophoresis a Protean II xi cell was used, and 12.5 % acrylamide/0.1%
SDS gels (22cm x 20 cm) were prepared.
After equilibration, the strips were placed on the surface of the SDS polyacrylamide
gel and covered with agarose sealing solution. Agarose sealing solution was used to
protect the gels from drying during SDS-PAGE gel electrophoresis. Electrophoresis
was conducted at 75 V for 19 h and 16 °C with 1 x SDS electrophoresis buffer.
Staining of the gels with SYPRO Ruby
SYPRO Ruby gel stain is a fluorescence dye used to detect proteins in an acrylamide
gel. After SDS-PAGE gel electrophoresis, the 2D gels were fixed in a fixing solution
(500 ml of fixing solution per gel) for 5 hour at RT. After fixing, the gels were washed
twice in MQ-water (each washing for 10 min at RT) and then stained with SYPRO
Ruby gel stain (500 ml per gel) overnight in the dark at RT. After staining, the gels
were washed with washing solution (800 ml per gel) for 30 min, then with MQ-water
two times for 5 min. The stained gels were then visualized using the FLA 2000
scanner (Fuji Photo Film) with 100 resolution, 16 bit degration and wavelength of 473
nm excitation and 510 nm emission.
Results
43
3. Results
This thesis describes experiments to evolve halotolerant and halophilic derivatives of
the mesophilic bacterium Escherichia coli under strictly controlled and highly
selective laboratory conditions. Using the "Genemat" technology (Marlière and
Mutzel, 2004), which allows for permanent proliferation of living organisms
exclusively in suspension, two populations of E. coli were propagated under limiting
osmolarities for approximately 8800 and 6700 generations, respectively. Populations
of approx. 2.5 x 10¹⁰ cells were grown at 30 °C in minimal medium containing
mannitol as a carbon source, and a growth rate of at least 0.25 was imposed by the
dilution rate. A conditional pulse-feed regime was applied which automatically
maintains the osmolarity in the growth medium at just tolerable levels. For this, the
culture chamber was connected with two medium reservoirs, one containing
"permissive" medium (compatible with growth of the cells), and the other containing
"nonpermissive" medium with an osmolarity that is too high for growth. Pulses of
permissive medium regularly dilute the culture, and the cell density is constantly
monitored. Whenever cell density passes a pre-set threshold (ca. 109 cells/ml) the
culture is diluted with a pulse of nonpermissive medium instead of permissive
medium. Under this regime genetic variants, which tolerate higher osmolarity, are
rapidly displacing their mesophilic progenitors. Pilot experiments have been reported
in the Diploma theses of Linda Corvers (2007) and Markus von Scheibner (2006).
The present work started with derivatives of E. coli MG1655 and ε2124 that had been
selected during their work. The following chapters describe the evolutionary paths of
both strains and their evolved traits.
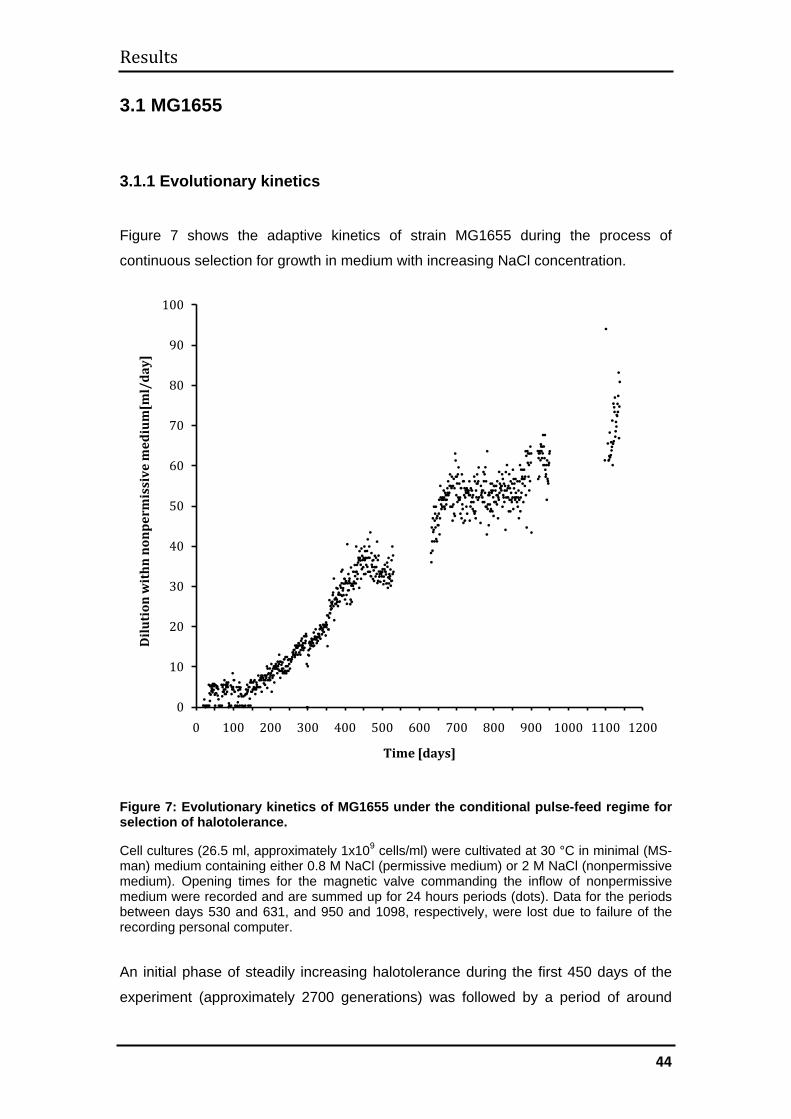
Results
44
3.1 MG1655
3.1.1 Evolutionary kinetics Figure 7 shows the adaptive kinetics of strain MG1655 during the process of
continuous selection for growth in medium with increasing NaCl concentration.
Figure 7: Evolutionary kinetics of MG1655 under the conditional pulse-feed regime for selection of halotolerance.
Cell cultures (26.5 ml, approximately 1x10⁹ cells/ml) were cultivated at 30 °C in minimal (MS-man) medium containing either 0.8 M NaCl (permissive medium) or 2 M NaCl (nonpermissive medium). Opening times for the magnetic valve commanding the inflow of nonpermissive medium were recorded and are summed up for 24 hours periods (dots). Data for the periods between days 530 and 631, and 950 and 1098, respectively, were lost due to failure of the recording personal computer.
An initial phase of steadily increasing halotolerance during the first 450 days of the
experiment (approximately 2700 generations) was followed by a period of around
0
10
20
30
40
50
60
70
80
90
100
0 100 200 300 400 500 600 700 800 900 1000 1100 1200
Dilu
tion
wit
hn n
onpe
rmis
sive
med
ium
[ml/
day]
Time [days]
Results
45
150 days where further adaptation appeared halted. Between 600 and 900 days of
continuous cultivation the consumption of nonpermissive medium (2 M NaCl) showed
a further 30% increase to remain again constant until around day 1100 when a new,
sharp increase in the rate of dilution with nonpermissive medium was recorded which
lasted until the end of the cultivation campaign reported here. From the ratio of the
volumes of permissive and nonpermissive media consumed per day, the steady state
concentration of NaCl in the culture after 1138 days of selection can be estimated to
be 1.3 M. Including the initial experiment performed by L. Corvers (2007) MG1655
has been cultivated under challenging NaCl concentrations for approx. 8800
generations.
3.1.2 Evolution of halotolerance
Growth in NaCl
To determine the level of halotolerance of MG1655 derivatives selected during the
course of the experiment, isolates from the genetic machine were tested for their
ability to grow in batch cultures in media with various osmolarities. Figure 8 shows
growth yields of successive evolvants after cultivation in batch culture in various NaCl
concentrations along with the properties of wild type MG1655 populations. To get an
idea of both growth rates and final yields as well as maximal halotolerance, the
OD600nm of the cultures was measured after incubation for 24 and 48 hours at 30 °C.
Wild type MG1655 grew best in the absence of NaCl and up to 0.6 M of the salt,
albeit with much reduced growth rates at the latter concentration; only occasionally
significant growth at 0.8 M could be observed after 48 hours of incubation. This
concentration thus delineates the limit of halotolerance of E. coli MG1655 (Fig. 8 A).
As it could be expected from the adaptive kinetics (see above, Fig. 7), evolvants
supported progressively higher salt concentrations. The last sample isolated during
this work (day 1119, "MG16551119") grew to high yields at 1.4 M NaCl and showed
significant growth up to 2.0 M (Fig. 8 D). Interestingly, growth at low salinities
became poorer and poorer in populations after longer selection. Thus, the derivative
isolated on day 858 grew only after prolonged incubation in medium without NaCl
(Fig. 8C), isolates obtained at day 1119 did not show any growth even after
incubation for 48 hours, and growth at moderate salt concentrations was severely
impaired in isolates from later stages of the experiment (Fig. 8 D).
Results
46
24h 48h
A
B
C
D
Figure 8: NaCl tolerance of E. coli MG1655 wild type cells and their evolved derivatives.
Batch cultures were inoculated to initial OD600nm of 0.05 in 30 ml minimal (MS-man) medium containing the indicated NaCl concentrations from precultures grown at 0.0 M NaCl in case of wild type MG1655 and in 0.8 M NaCl for their evolved derivatives and incubated with vigorous agitation at 30 °C. OD600nm of the cultures was measured after 24 (left panel) and 48 h (right panel). The basal MS-man medium contained 50 mM of K+ added as K2HPO4. A, wild type MG1655; B, MG1655262; C, MG1655858; D, MG16551119.
00.5
11.5
22.5
3
0 0.4 0.8 1.2 1.6 2 2.5
OD
[600
nm
]
NaCl [M]
00.5
11.5
22.5
3
0 0.4 0.8 1.2 1.6 2.0 2.5
OD
[600
nm
]
NaCl [M]
00.5
11.5
22.5
3
0 0.4 0.8 1.2 1.6 2.0 2.5
OD
[600
nm
]
NaCl [M]
00.5
11.5
22.5
3
0 0.4 0.8 1.2 1.6 2.0 2.5O
D [6
00 n
m]
NaCl [M]
00.5
11.5
22.5
3
0 0.4 0.8 1.2 1.6 2.0 2.5
OD
[600
nm
]
NaCl [M]
00.5
11.5
22.5
3
0 0.4 0.8 1.2 1.6 2.0 2.5
OD
[600
nm
]
NaCl [M]
00.5
11.5
22.5
3
0 0.4 0.8 1.2 1.6 2.0 2.5
OD
[600
nm
]
NaCl [M]
00.5
11.5
22.5
3
0 0.4 0.8 1.2 1.6 2.0 2.5
OD
[600
nm
]
NaCl [M]

Results
47
Yet, it is still possible to re-adapt these derivatives to low salt concentrations by
passaging them over decreasing salinities (data not shown). Taken together, these
data suggest a shift in the physical niche of the bacteria; robust growth in media
containing around 10% w/v salt is “paid for” by the failure to grow well in diluted
media. At an intermediate salinity of 0.6 M (approx. 3.5% w/v) NaCl growth yields of
wild type and evolved strains are comparable.
Results
48
Tolerance towards cations, anions and osmolarity
In order to analyze whether the nature of the cations and anions as well as the total
osmolarity of the medium influence growth of wild type and evolved MG1655
populations, NaCl was exchanged for KCl, K2SO4 and KI, whereas sorbitol was used
as an uncharged, osmotically active extracellular solute.
24 48h
A
B
C
Figure 9: KCl tolerance of E. coli MG1655 wild type cells and their evolved derivatives.
Batch cultures were inoculated to initial OD600nm of 0.05 in 30 ml minimal (MS-man) medium containing the indicated KCl concentrations and incubated with vigorous agitation at 30 °C. OD600nm of the cultures was measured after 24 (left panel) and 48 h (right panel). The basal MS-man medium contained 50 mM of K+ added as K2HPO4. A, wild type MG1655; B, MG1655262; C, MG1655858.
00.5
11.5
22.5
3
0 0.4 0.8 1.2 1.6
OD
[600
nm
]
KCl [M]
00.5
11.5
22.5
3
0 0.4 0.8 1.2 1.6O
D [6
00 n
m]
KCl [M]
00.5
11.5
22.5
3
0 0.4 0.8 1.2 1.6
OD
[600
nm
]
KCl [M]
00.5
11.5
22.5
3
0 0.4 0.8 1.2 1.6
OD
[600
nm
]
KCl [M]
00.5
11.5
22.5
3
0 0.4 0.8 1.2 1.6
OD
[600
nm
]
KCl [M]
00.5
11.5
22.5
3
0 0.4 0.8 1.2 1.6
OD
[600
nm
]
KCl [M]
Results
49
24h 48h
A
B
C
Figure 10: K2SO4 tolerance of E. coli MG1655 wild type cells and their evolved derivatives.
Batch cultures were inoculated to initial OD600nm of 0.05 in 30 ml minimal (MS-man) medium containing the indicated K2SO4 concentrations and incubated with vigorous agitation at 30 °C. OD600nm of the cultures was measured after 24 (left panel) and 48 h (right panel). Concentrations of more than 0.8 M could not be tested, as the salt was insoluble in MS-man medium at these higher concentrations. The basal MS-man medium contained 50 mM of K+ added as K2HPO4. A, wild type MG1655; B, MG1655262; C, MG1655858.
Growth in the presence of increasing concentrations of KCl (Fig. 9) and K2SO4 (Fig.
10) was similar to growth in the presence of increasing NaCl concentrations. It should
be noticed that wild type MG1655 could still grow with good yield in presence of 0.6
M K2SO4 (i.e., with 1.2 M K+ ions). Although the basic minimal medium contains 0.05
M K ions, this concentration was apparently not sufficient to support growth of
00.5
11.5
22.5
3
0 0.2 0.4 0.6 0.8
OD
[600
nm
]
K2SO4 [M]
00.5
11.5
22.5
3
0 0.2 0.4 0.6 0.8
OD
[600
nm
]
K2SO4 [M]
00.5
11.5
22.5
3
0 0.2 0.4 0.6 0.8
OD
[600
nm
]
K2SO4 [M]
00.5
11.5
22.5
3
0 0.2 0.4 0.6 0.8O
D [6
00 n
m]
K2SO4 [M]
00.5
11.5
22.5
3
0 0.2 0.4 0.6 0.8
OD
[600
nm
]
K2SO4 [M]
00.5
11.5
22.5
3
0 0.2 0.4 0.6 0.8
OD
[600
nm
]
K2SO4 [M]
Results
50
evolved derivatives (MG1655858) in the absence of added salt. Similar growth in the
presence of chloride or sulfate counter ions indicates that the nature of these anions
is of minor importance for halotolerance of the strains.
This was different when iodide was used as the counter-ion. Iodide is toxic for
bacterial cells and MG1655 cells can only grow up to 0.2 M KI, although slowly at this
concentration (Fig. 11).
24h 48h
A
B
C
Figure 11: KI tolerance of E. coli MG1655 wild type cells and their evolved derivatives.
Batch cultures were inoculated to initial OD600nm of 0.05 in 30 ml minimal (MS-man) medium containing the indicated KI concentrations and incubated with vigorous agitation at 30 °C. OD600nm of the cultures was measured after 24 (left panel) and 48 h (right panel). The basal MS-man medium contained 50 mM of K+ added as K2HPO4. A, wild type MG1655; B, MG1655262; C, MG1655858.
00.5
11.5
22.5
3
0 0.2 0.4
OD
[600
nm
]
KI [M]
00.5
11.5
22.5
3
0 0.2 0.4
OD
[600
nm
]
KI [M]
00.5
11.5
22.5
3
0 0.2 0.4
OD
[600
nm
]
KI [M]
00.5
11.5
22.5
3
0 0.2 0.4
OD
[600
nm
]
KI [M]
00.5
11.5
22.5
3
0 0.2 0.4
OD
[600
nm
]
KI [M]
00.5
11.5
22.5
3
0 0.2 0.4
OD
[600
nm
]
KI [M]
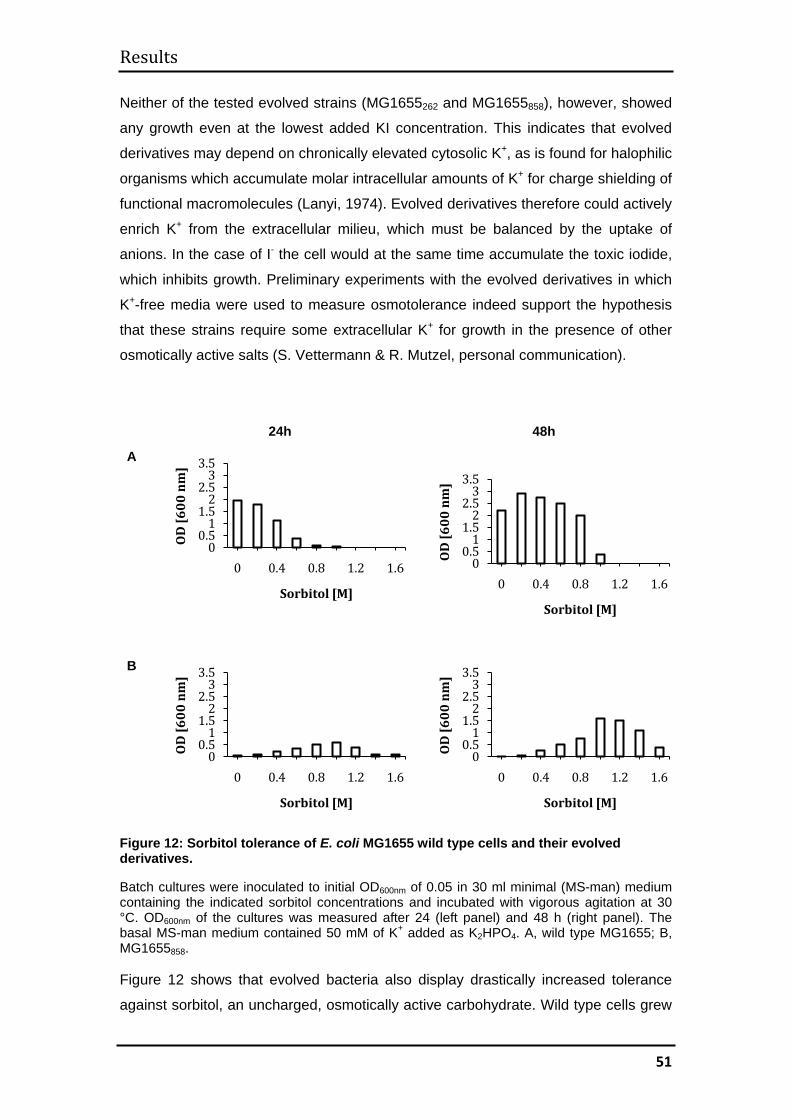
Results
51
Neither of the tested evolved strains (MG1655262 and MG1655858), however, showed
any growth even at the lowest added KI concentration. This indicates that evolved
derivatives may depend on chronically elevated cytosolic K+, as is found for halophilic
organisms which accumulate molar intracellular amounts of K+ for charge shielding of
functional macromolecules (Lanyi, 1974). Evolved derivatives therefore could actively
enrich K+ from the extracellular milieu, which must be balanced by the uptake of
anions. In the case of I- the cell would at the same time accumulate the toxic iodide,
which inhibits growth. Preliminary experiments with the evolved derivatives in which
K+-free media were used to measure osmotolerance indeed support the hypothesis
that these strains require some extracellular K+ for growth in the presence of other
osmotically active salts (S. Vettermann & R. Mutzel, personal communication).
24h 48h
A
B
Figure 12: Sorbitol tolerance of E. coli MG1655 wild type cells and their evolved derivatives.
Batch cultures were inoculated to initial OD600nm of 0.05 in 30 ml minimal (MS-man) medium containing the indicated sorbitol concentrations and incubated with vigorous agitation at 30 °C. OD600nm of the cultures was measured after 24 (left panel) and 48 h (right panel). The basal MS-man medium contained 50 mM of K+ added as K2HPO4. A, wild type MG1655; B, MG1655858. Figure 12 shows that evolved bacteria also display drastically increased tolerance
against sorbitol, an uncharged, osmotically active carbohydrate. Wild type cells grew
00.5
11.5
22.5
33.5
0 0.4 0.8 1.2 1.6
OD
[600
nm
]
Sorbitol [M]
00.5
11.5
22.5
33.5
0 0.4 0.8 1.2 1.6
OD
[600
nm
]
Sorbitol [M]
00.5
11.5
22.5
33.5
0 0.4 0.8 1.2 1.6
OD
[600
nm
]
Sorbitol [M]
00.5
11.5
22.5
33.5
0 0.4 0.8 1.2 1.6
OD
[600
nm
]
Sorbitol [M]
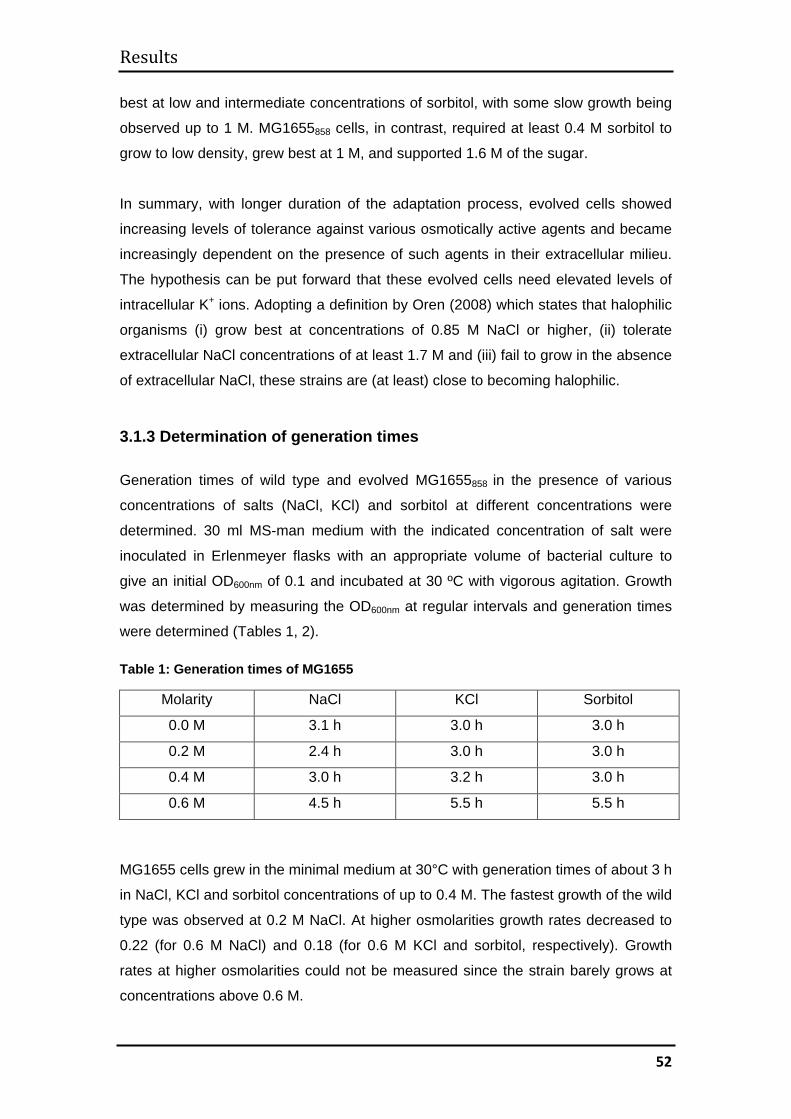
Results
52
best at low and intermediate concentrations of sorbitol, with some slow growth being
observed up to 1 M. MG1655858 cells, in contrast, required at least 0.4 M sorbitol to
grow to low density, grew best at 1 M, and supported 1.6 M of the sugar.
In summary, with longer duration of the adaptation process, evolved cells showed
increasing levels of tolerance against various osmotically active agents and became
increasingly dependent on the presence of such agents in their extracellular milieu.
The hypothesis can be put forward that these evolved cells need elevated levels of
intracellular K+ ions. Adopting a definition by Oren (2008) which states that halophilic
organisms (i) grow best at concentrations of 0.85 M NaCl or higher, (ii) tolerate
extracellular NaCl concentrations of at least 1.7 M and (iii) fail to grow in the absence
of extracellular NaCl, these strains are (at least) close to becoming halophilic.
3.1.3 Determination of generation times Generation times of wild type and evolved MG1655858 in the presence of various
concentrations of salts (NaCl, KCl) and sorbitol at different concentrations were
determined. 30 ml MS-man medium with the indicated concentration of salt were
inoculated in Erlenmeyer flasks with an appropriate volume of bacterial culture to
give an initial OD600nm of 0.1 and incubated at 30 ºC with vigorous agitation. Growth
was determined by measuring the OD600nm at regular intervals and generation times
were determined (Tables 1, 2).
Table 1: Generation times of MG1655
Molarity NaCl KCl Sorbitol
0.0 M 3.1 h 3.0 h 3.0 h
0.2 M 2.4 h 3.0 h 3.0 h
0.4 M 3.0 h 3.2 h 3.0 h
0.6 M 4.5 h 5.5 h 5.5 h
MG1655 cells grew in the minimal medium at 30°C with generation times of about 3 h
in NaCl, KCl and sorbitol concentrations of up to 0.4 M. The fastest growth of the wild
type was observed at 0.2 M NaCl. At higher osmolarities growth rates decreased to
0.22 (for 0.6 M NaCl) and 0.18 (for 0.6 M KCl and sorbitol, respectively). Growth
rates at higher osmolarities could not be measured since the strain barely grows at
concentrations above 0.6 M.
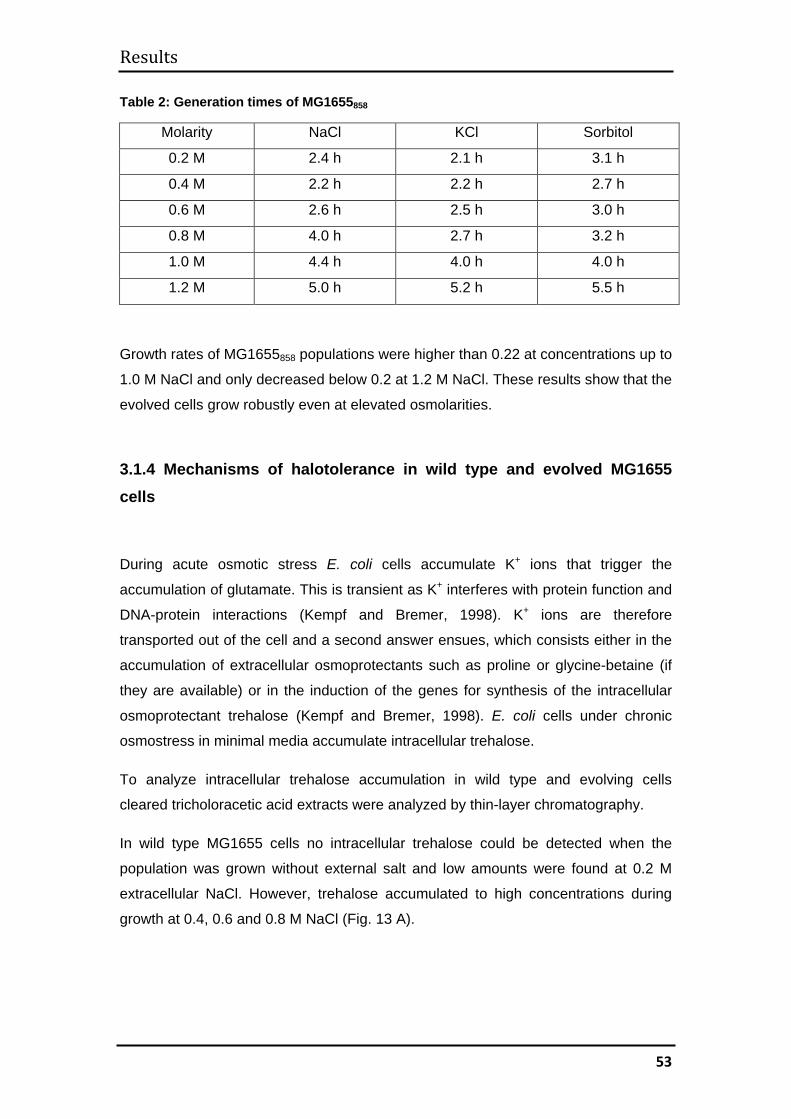
Results
53
Table 2: Generation times of MG1655858
Molarity NaCl KCl Sorbitol
0.2 M 2.4 h 2.1 h 3.1 h
0.4 M 2.2 h 2.2 h 2.7 h
0.6 M 2.6 h 2.5 h 3.0 h
0.8 M 4.0 h 2.7 h 3.2 h
1.0 M 4.4 h 4.0 h 4.0 h
1.2 M 5.0 h 5.2 h 5.5 h
Growth rates of MG1655858 populations were higher than 0.22 at concentrations up to
1.0 M NaCl and only decreased below 0.2 at 1.2 M NaCl. These results show that the
evolved cells grow robustly even at elevated osmolarities.
3.1.4 Mechanisms of halotolerance in wild type and evolved MG1655 cells
During acute osmotic stress E. coli cells accumulate K+ ions that trigger the
accumulation of glutamate. This is transient as K+ interferes with protein function and
DNA-protein interactions (Kempf and Bremer, 1998). K+ ions are therefore
transported out of the cell and a second answer ensues, which consists either in the
accumulation of extracellular osmoprotectants such as proline or glycine-betaine (if
they are available) or in the induction of the genes for synthesis of the intracellular
osmoprotectant trehalose (Kempf and Bremer, 1998). E. coli cells under chronic
osmostress in minimal media accumulate intracellular trehalose.
To analyze intracellular trehalose accumulation in wild type and evolving cells
cleared tricholoracetic acid extracts were analyzed by thin-layer chromatography.
In wild type MG1655 cells no intracellular trehalose could be detected when the
population was grown without external salt and low amounts were found at 0.2 M
extracellular NaCl. However, trehalose accumulated to high concentrations during
growth at 0.4, 0.6 and 0.8 M NaCl (Fig. 13 A).
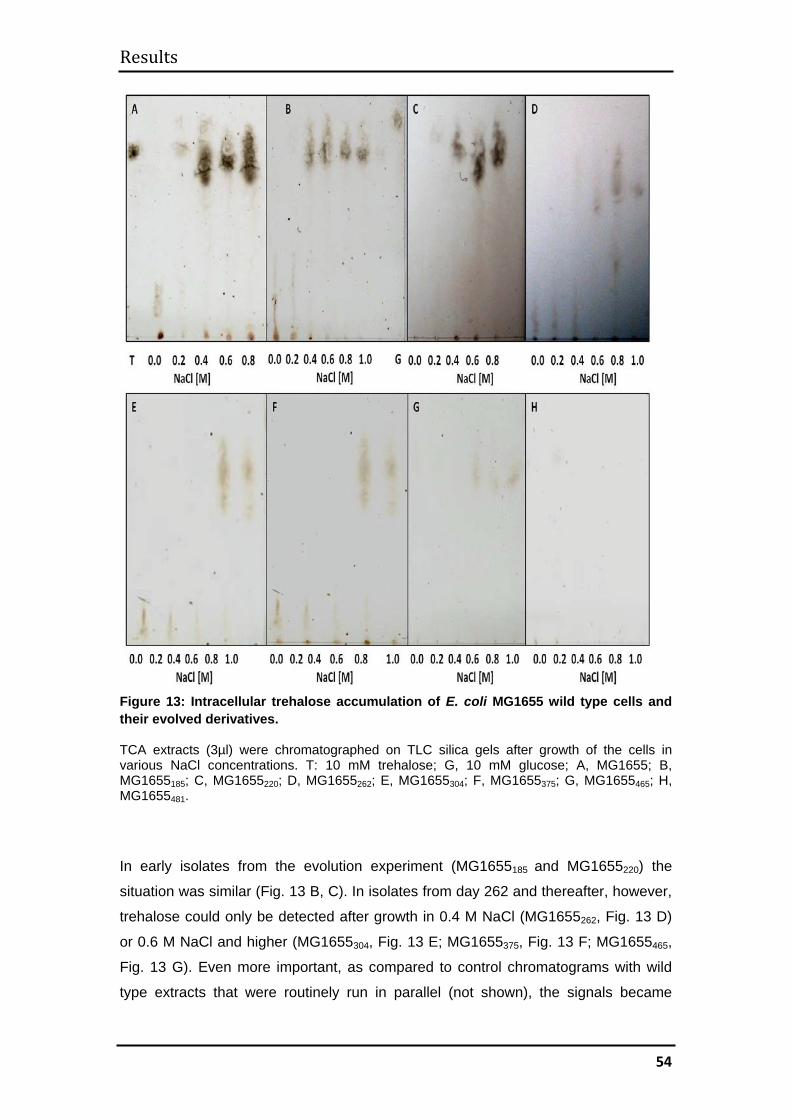
Results
54
Figure 13: Intracellular trehalose accumulation of E. coli MG1655 wild type cells and their evolved derivatives.
TCA extracts (3µl) were chromatographed on TLC silica gels after growth of the cells in various NaCl concentrations. T: 10 mM trehalose; G, 10 mM glucose; A, MG1655; B, MG1655185; C, MG1655220; D, MG1655262; E, MG1655304; F, MG1655375; G, MG1655465; H, MG1655481.
In early isolates from the evolution experiment (MG1655185 and MG1655220) the
situation was similar (Fig. 13 B, C). In isolates from day 262 and thereafter, however,
trehalose could only be detected after growth in 0.4 M NaCl (MG1655262, Fig. 13 D)
or 0.6 M NaCl and higher (MG1655304, Fig. 13 E; MG1655375, Fig. 13 F; MG1655465,
Fig. 13 G). Even more important, as compared to control chromatograms with wild
type extracts that were routinely run in parallel (not shown), the signals became
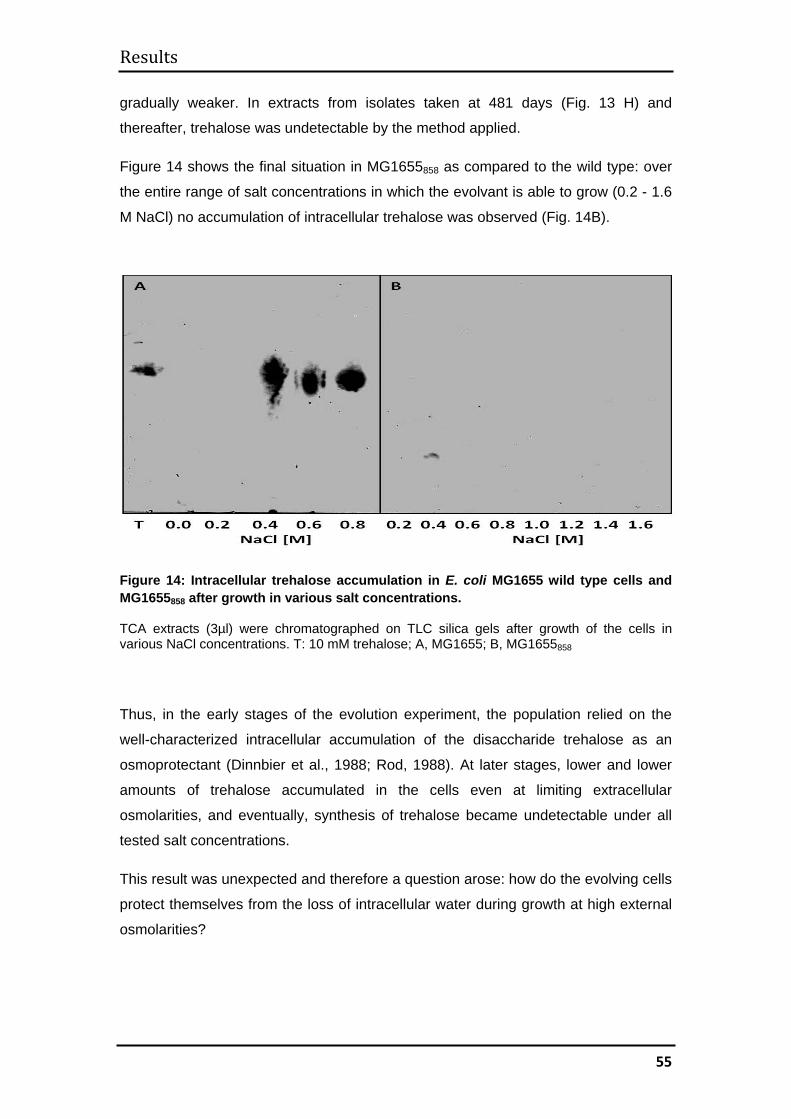
Results
55
gradually weaker. In extracts from isolates taken at 481 days (Fig. 13 H) and
thereafter, trehalose was undetectable by the method applied.
Figure 14 shows the final situation in MG1655858 as compared to the wild type: over
the entire range of salt concentrations in which the evolvant is able to grow (0.2 - 1.6
M NaCl) no accumulation of intracellular trehalose was observed (Fig. 14B).
Figure 14: Intracellular trehalose accumulation in E. coli MG1655 wild type cells and MG1655858 after growth in various salt concentrations.
TCA extracts (3µl) were chromatographed on TLC silica gels after growth of the cells in various NaCl concentrations. T: 10 mM trehalose; A, MG1655; B, MG1655858
Thus, in the early stages of the evolution experiment, the population relied on the
well-characterized intracellular accumulation of the disaccharide trehalose as an
osmoprotectant (Dinnbier et al., 1988; Rod, 1988). At later stages, lower and lower
amounts of trehalose accumulated in the cells even at limiting extracellular
osmolarities, and eventually, synthesis of trehalose became undetectable under all
tested salt concentrations.
This result was unexpected and therefore a question arose: how do the evolving cells
protect themselves from the loss of intracellular water during growth at high external
osmolarities?
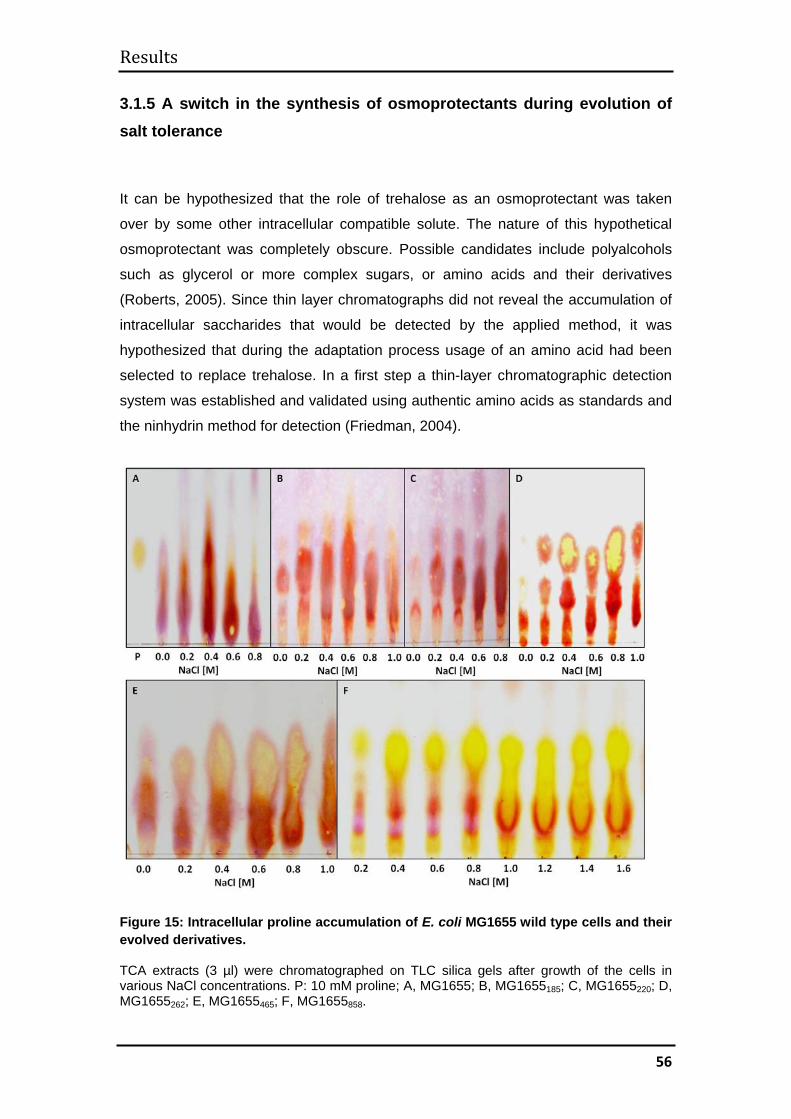
Results
56
3.1.5 A switch in the synthesis of osmoprotectants during evolution of salt tolerance
It can be hypothesized that the role of trehalose as an osmoprotectant was taken
over by some other intracellular compatible solute. The nature of this hypothetical
osmoprotectant was completely obscure. Possible candidates include polyalcohols
such as glycerol or more complex sugars, or amino acids and their derivatives
(Roberts, 2005). Since thin layer chromatographs did not reveal the accumulation of
intracellular saccharides that would be detected by the applied method, it was
hypothesized that during the adaptation process usage of an amino acid had been
selected to replace trehalose. In a first step a thin-layer chromatographic detection
system was established and validated using authentic amino acids as standards and
the ninhydrin method for detection (Friedman, 2004).
Figure 15: Intracellular proline accumulation of E. coli MG1655 wild type cells and their evolved derivatives.
TCA extracts (3 µl) were chromatographed on TLC silica gels after growth of the cells in various NaCl concentrations. P: 10 mM proline; A, MG1655; B, MG1655185; C, MG1655220; D, MG1655262; E, MG1655465; F, MG1655858.
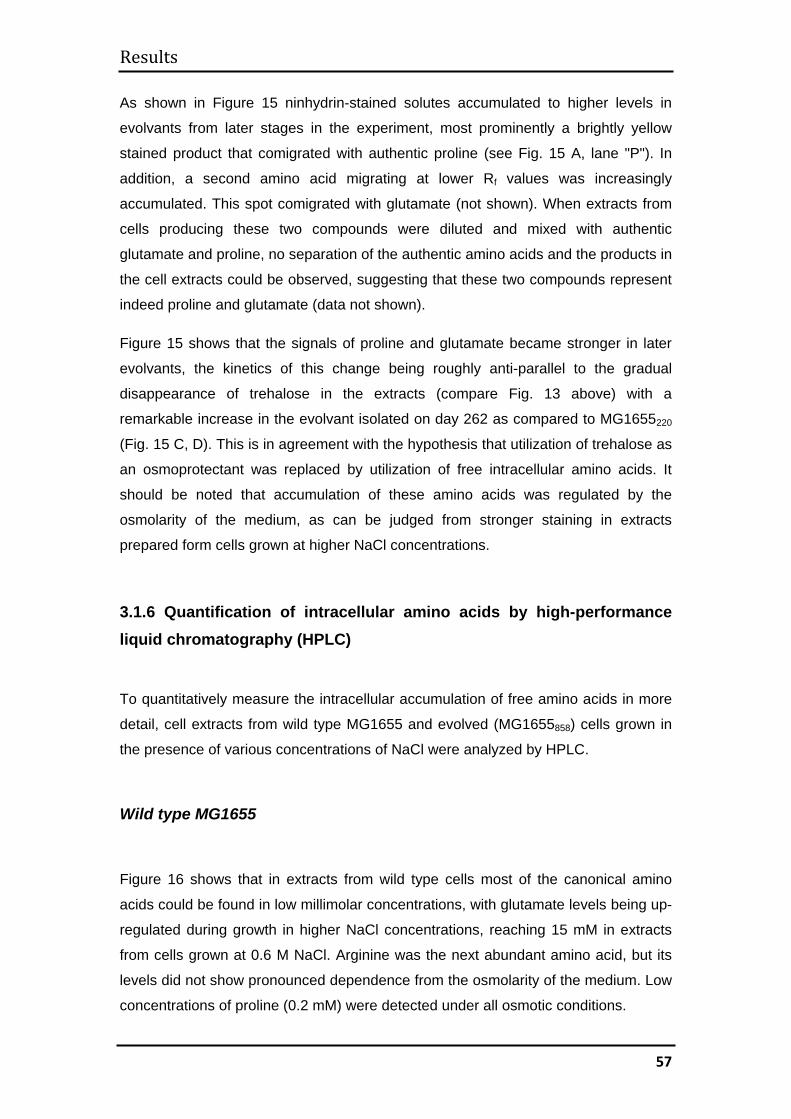
Results
57
As shown in Figure 15 ninhydrin-stained solutes accumulated to higher levels in
evolvants from later stages in the experiment, most prominently a brightly yellow
stained product that comigrated with authentic proline (see Fig. 15 A, lane "P"). In
addition, a second amino acid migrating at lower Rf values was increasingly
accumulated. This spot comigrated with glutamate (not shown). When extracts from
cells producing these two compounds were diluted and mixed with authentic
glutamate and proline, no separation of the authentic amino acids and the products in
the cell extracts could be observed, suggesting that these two compounds represent
indeed proline and glutamate (data not shown).
Figure 15 shows that the signals of proline and glutamate became stronger in later
evolvants, the kinetics of this change being roughly anti-parallel to the gradual
disappearance of trehalose in the extracts (compare Fig. 13 above) with a
remarkable increase in the evolvant isolated on day 262 as compared to MG1655220
(Fig. 15 C, D). This is in agreement with the hypothesis that utilization of trehalose as
an osmoprotectant was replaced by utilization of free intracellular amino acids. It
should be noted that accumulation of these amino acids was regulated by the
osmolarity of the medium, as can be judged from stronger staining in extracts
prepared form cells grown at higher NaCl concentrations.
3.1.6 Quantification of intracellular amino acids by high-performance liquid chromatography (HPLC)
To quantitatively measure the intracellular accumulation of free amino acids in more
detail, cell extracts from wild type MG1655 and evolved (MG1655858) cells grown in
the presence of various concentrations of NaCl were analyzed by HPLC.
Wild type MG1655
Figure 16 shows that in extracts from wild type cells most of the canonical amino
acids could be found in low millimolar concentrations, with glutamate levels being up-
regulated during growth in higher NaCl concentrations, reaching 15 mM in extracts
from cells grown at 0.6 M NaCl. Arginine was the next abundant amino acid, but its
levels did not show pronounced dependence from the osmolarity of the medium. Low
concentrations of proline (0.2 mM) were detected under all osmotic conditions.
Results
58
Figure 16: Quantification of intracellular amino acids of wild type MG1655 strain by HPLC.
Detection and quantification of amino acids was performed by HPLC analysis on an Agilent 1200 SL. Amino acids in the samples were first derivatized using a pre-column protocol [o-phthalaldehyde for the primary and 9-fluorenylmethyl chloroformate for secondary amino acids]. After injection, the samples were separated on a ZORBAX Eclipse Plus C18 column at 40 ºC using a binary gradient mobile phase. The eluting amino acids were detected with a fluorescence detector (FLD) and quantified with the use of a standard amino acid (AAS18). MG1655858
In extracts from MG1655858 cells grown in the presence of various NaCl
concentrations most of the canonical amino acids could be found in low millimolar
concentrations. Arginine, glutamine and histidine increased somewhat during growth
at higher salinity (Fig. 17 A).
A dramatic increase in the intracellular concentrations of glutamate and proline was
measured in cells grown at high osmolarities (Fig. 17 B) with glutamate accumulating
to approximately 20 mM and proline to more than 190 mM in cells grown in 1.2 M
NaCl. As could be predicted from the more qualitative detection of these amino acids
by the TLC technique, their synthesis was regulated by the medium osmolarity.
A rough calculation of the intracellular concentration of proline (assuming that an E.
coli cell is a cylinder of 1 µm diameter and 2 µm lengths) yields values of 600 mM
during growth at high NaCl concentrations.
0
2
4
6
8
10
12
14
16
0 0.2 0.4 0.6 0.8
Amin
o ac
ids
[mM
/l]
NaCl [M]
AlanineArginine AspargineAspartateCitrullineCysteineGlutamateGlutamineGlycineHistidineIsoleucineLeucineLysineMethionineOrnithinePhenylalanineProlineSerineThreonineTryptophanTyrosineValine
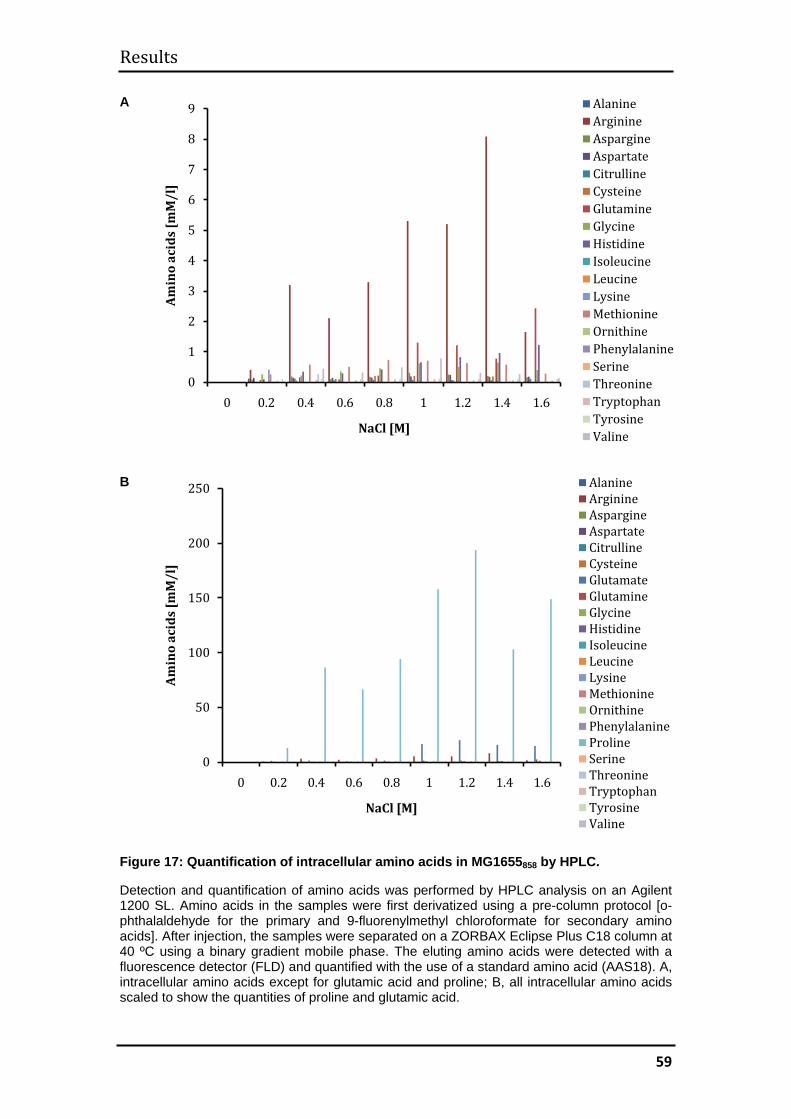
Results
59
A
B
Figure 17: Quantification of intracellular amino acids in MG1655858 by HPLC.
Detection and quantification of amino acids was performed by HPLC analysis on an Agilent 1200 SL. Amino acids in the samples were first derivatized using a pre-column protocol [o-phthalaldehyde for the primary and 9-fluorenylmethyl chloroformate for secondary amino acids]. After injection, the samples were separated on a ZORBAX Eclipse Plus C18 column at 40 ºC using a binary gradient mobile phase. The eluting amino acids were detected with a fluorescence detector (FLD) and quantified with the use of a standard amino acid (AAS18). A, intracellular amino acids except for glutamic acid and proline; B, all intracellular amino acids scaled to show the quantities of proline and glutamic acid.
0
1
2
3
4
5
6
7
8
9
0 0.2 0.4 0.6 0.8 1 1.2 1.4 1.6
Amin
o ac
ids
[mM
/l]
NaCl [M]
AlanineArginine AspargineAspartateCitrullineCysteineGlutamineGlycineHistidineIsoleucineLeucineLysineMethionineOrnithinePhenylalanineSerineThreonineTryptophanTyrosineValine
0
50
100
150
200
250
0 0.2 0.4 0.6 0.8 1 1.2 1.4 1.6
Amin
o ac
ids
[mM
/l]
NaCl [M]
AlanineArginine AspargineAspartateCitrullineCysteineGlutamateGlutamineGlycineHistidineIsoleucineLeucineLysineMethionineOrnithinePhenylalanineProlineSerineThreonineTryptophanTyrosineValine
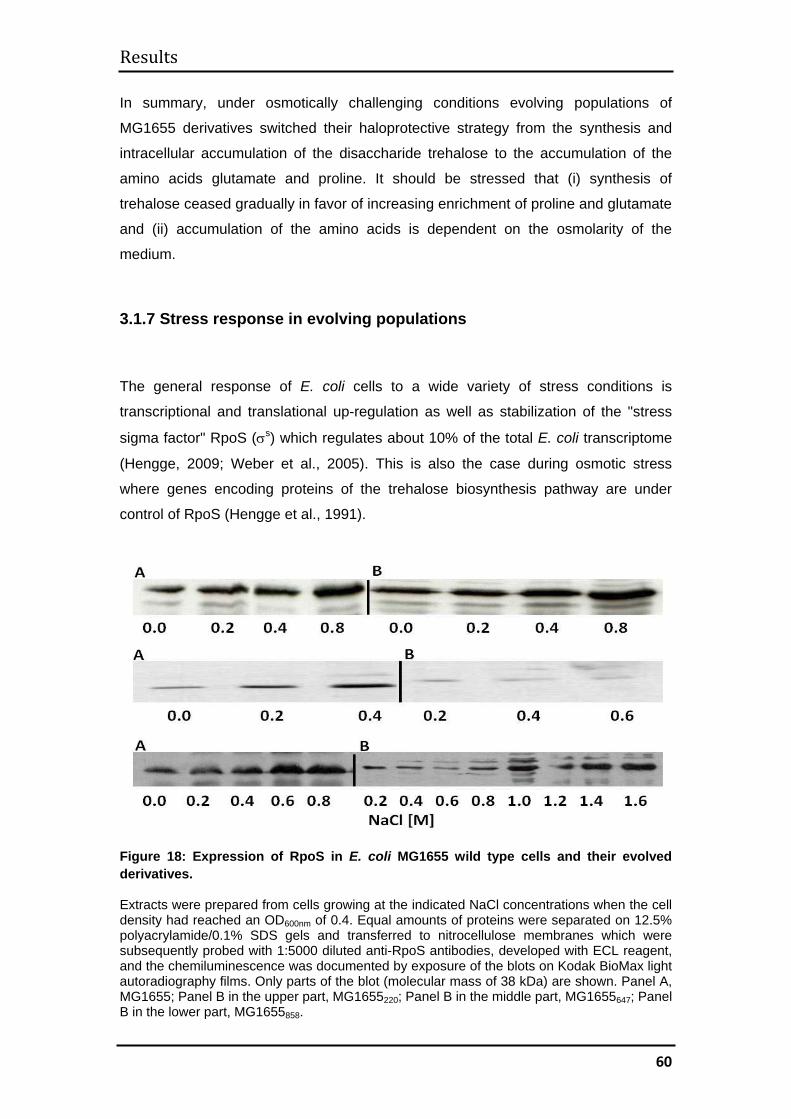
Results
60
In summary, under osmotically challenging conditions evolving populations of
MG1655 derivatives switched their haloprotective strategy from the synthesis and
intracellular accumulation of the disaccharide trehalose to the accumulation of the
amino acids glutamate and proline. It should be stressed that (i) synthesis of
trehalose ceased gradually in favor of increasing enrichment of proline and glutamate
and (ii) accumulation of the amino acids is dependent on the osmolarity of the
medium.
3.1.7 Stress response in evolving populations
The general response of E. coli cells to a wide variety of stress conditions is
transcriptional and translational up-regulation as well as stabilization of the "stress
sigma factor" RpoS (σs) which regulates about 10% of the total E. coli transcriptome
(Hengge, 2009; Weber et al., 2005). This is also the case during osmotic stress
where genes encoding proteins of the trehalose biosynthesis pathway are under
control of RpoS (Hengge et al., 1991).
Figure 18: Expression of RpoS in E. coli MG1655 wild type cells and their evolved derivatives.
Extracts were prepared from cells growing at the indicated NaCl concentrations when the cell density had reached an OD600nm of 0.4. Equal amounts of proteins were separated on 12.5% polyacrylamide/0.1% SDS gels and transferred to nitrocellulose membranes which were subsequently probed with 1:5000 diluted anti-RpoS antibodies, developed with ECL reagent, and the chemiluminescence was documented by exposure of the blots on Kodak BioMax light autoradiography films. Only parts of the blot (molecular mass of 38 kDa) are shown. Panel A, MG1655; Panel B in the upper part, MG1655220; Panel B in the middle part, MG1655647; Panel B in the lower part, MG1655858.
Results
61
On Western Blots from logarithmically growing MG1655 cells (OD600nm = 0.4) probed
with antibodies against RpoS, expression of the sigma factor increased steadily with
growth in the presence of increasing NaCl concentrations (panel A in Fig. 18) to
maximal levels at the highest tolerable salt concentration. This situation was similar
in MG1655220. In the derivative isolated after 647 days of selection, RpoS expression
was lower at all tested osmolarities than in wild type cells tested in parallel (Fig. 18
middle part). This trend was even more pronounced in MG1655858, where a
significant increase in the level of RpoS could only be measured at NaCl
concentrations of 1 M and higher (Fig. 18 lower part). Interestingly, expression of the
sigma factor even appeared to decrease somewhat in cultures growing at 0.4 M and
0.6 M NaCl as compared to samples grown at 0.2 M NaCl (expression in the
absence of salt could not be measured since this strain failed to grow at 0.0 M NaCl).
As already suggested by the results of the analysis of growth yields in the presence
of various NaCl concentrations, this shift in the expression pattern of the stress sigma
factor RpoS indicates that a shift in the "ecological niche" of the evolvants has taken
place during the adaptation process: first, osmolarities which induce the stress
response in wild type cells are apparently no longer perceived as stressful in the
evolving derivatives, second, the tendency of higher expression of RpoS in media
with low osmolarity could mean "stress" for these strains. Consequently, signal
transduction reactions that sense stressful conditions and regulate the expression of
RpoS must have changed during evolution to high salt tolerance.
3.1.8 Detection of outer membrane proteins by SDS-polyacrylamide gel electrophoresis
Proteins which face the extracellular space (outer membrane proteins, periplasmic
proteins and the periplasmic domains of inner membrane proteins) have to function
under the osmotic conditions of the extracellular milieu. To get an idea of possible
changes in the nature and structure of such proteins in evolving MG1655 cells, outer
membrane proteins were isolated according to the procedure developed by
Lugtenberg and co-workers (1975) and analyzed by SDS polyacrylamide gel
electrophoresis.
Figure 19 shows that even by this low-resolution approach dramatic change in the
expression pattern of outer membrane proteins could be revealed. Thus, as

Results
62
compared with MG1655 wild type cells grown at low osmolarity, several high
molecular mass proteins as well as a number of proteins in the molecular mass
range of approx. 18 to 25 kDa are less abundant in the outer membrane of
MG1655382 cells grown at high osmolarity (arrows in Fig. 19). The identity of these
proteins is so far unclear.
Figure 19: Separation of outer membrane proteins of E. coli MG1655 wild type cells and MG1655382.
Outer membrane proteins were extracted from MG1655 cells grown in 0.0 M NaCl lane (1) and from MG1655382 cells grown in 0.8 M NaCl lane (2) when the cell density had reached an OD600nm of 0.8. Equal amounts of proteins were separated on 12.5% polyacrylamide/0.1% SDS gel and stained with the Page Silver™ Silver Staining Kit. The position and sizes of marker proteins are indicated to the left.
3.1.9 Analysis of the total cellular proteome by two-dimensional SDS gel electrophoresis (2-D PAGE)
Since SDS polyacrylamide gel electrophoresis of outer membrane proteins (Fig. 19) and of total cells extracts (not shown) had indicated drastic changes in the cellular
proteome, an effort was made to analyze the proteome of wild type and evolved
populations by two-dimensional polyacrylamide gel electrophoresis. To give a hint on
both regulatory and molecular adaptations (i.e., to reveal the maximal change in the
proteome), extracts from wild type cells grown in the absence of NaCl and extracts
from MG1655858 cells grown in the presence of 1.2 M NaCl were compared.
Cellular proteins were separated by isoelectric focusing (pH 4-7) in the first
dimension, then on 12.5% polyacrylamide gels in the presence of 0.1% SDS
according to their apparent molecular masses (Fig. 20).
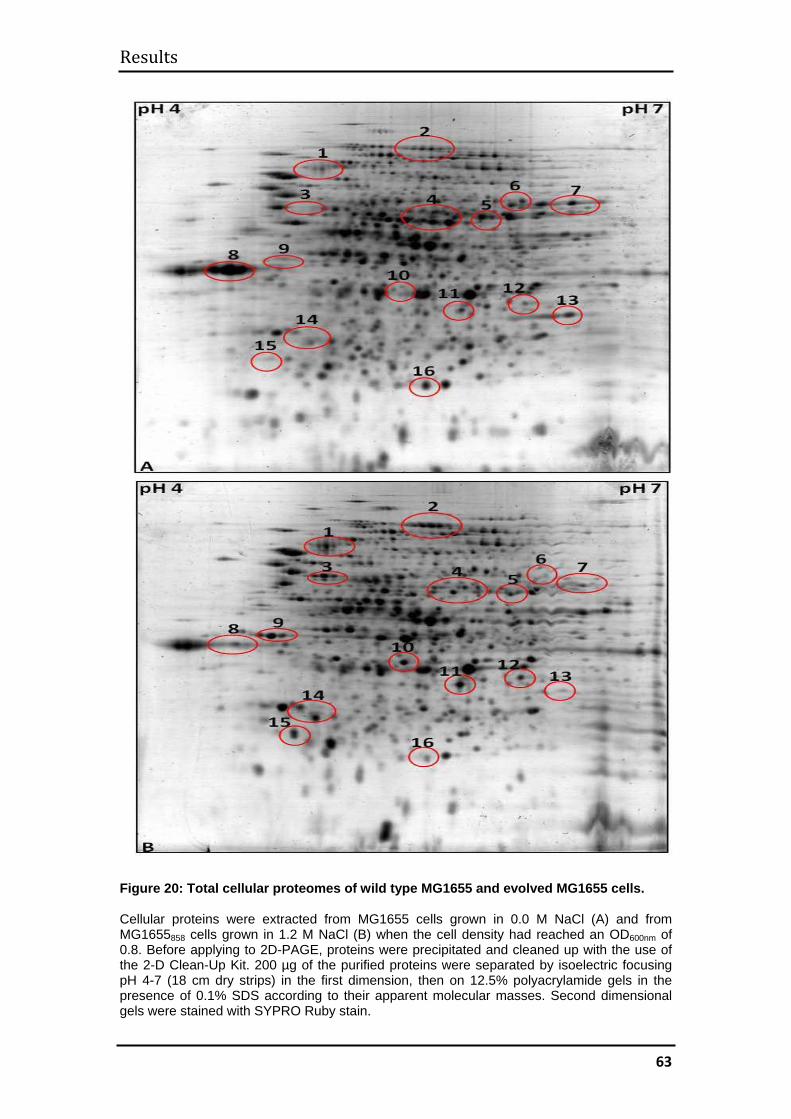
Results
63
Figure 20: Total cellular proteomes of wild type MG1655 and evolved MG1655 cells.
Cellular proteins were extracted from MG1655 cells grown in 0.0 M NaCl (A) and from MG1655858 cells grown in 1.2 M NaCl (B) when the cell density had reached an OD600nm of 0.8. Before applying to 2D-PAGE, proteins were precipitated and cleaned up with the use of the 2-D Clean-Up Kit. 200 µg of the purified proteins were separated by isoelectric focusing pH 4-7 (18 cm dry strips) in the first dimension, then on 12.5% polyacrylamide gels in the presence of 0.1% SDS according to their apparent molecular masses. Second dimensional gels were stained with SYPRO Ruby stain.
Results
64
Comparison of the two-dimensional gels reveals a number of major changes in the
total proteome. For example, the spots marked 1, 2, 3, 9, 10, 11, 12, 14, and 15 were
stained much more intensely in gels from the proteome of evolved cells, while the
spots marked 4, 5, 6, 7, 8, 13, and 16 stained much weaker in these extracts (Fig.
20). Spots 9 and 10 are barely visible in gels from wild type cells. The nature of these
proteins is unknown at present. Their identity should be analyzed by mass-
spectrometric analysis in further studies which should also aim at investigating their
expression in MG1655 and its evolved derivatives under various medium
osmolarities.
Results
65
3.2. ε2124
Strain ε2124 is a derivative of E. coli MG1655 which carries deletions of the genes
fmt and def (fmt and def encode Met-tRNAi transformylase and polypeptide
deformylase, respectively) and, in addition, a mutation in the DNA repair gene, mutD,
which leads to a mutator phenotype. Deletion of the fmt/def genes causes a severe
growth defect, increasing the generation time of the mutant by a factor of 5-10 (Mazel
et al., 1994). In previous work (Marlière et al., 2005) this growth defect was overcome
by continuous cultivation of the mutant in the GM device under a turbidostat regime.
Unlike all other known eubacteria the resulting evolvant initiates protein synthesis
with unformylated methionine. It might prove useful for biotechnological applications,
e.g. the production of recombinant proteins. To expand the spectrum of possible
applications for this strain, it was selected for higher salt tolerance in a parallel
experiment to the work described for the prototypic MG1655 in chapter 3.1. Evolution
of robust growth under the turbidostat regime had been demonstrated to be
significantly faster in the mutD version of ∆def/fmt strains (Marlière et al., 2005). It
was thus interesting to analyze whether this would also be the case for evolution of
halotolerance and to see whether higher genetic variability is a general advantage for
adaptation to stressful conditions.
3.2.1. Evolutionary kinetics
Figure 21 shows the adaptive kinetics of strain ε2124 during the process of
continuous selection for growth in medium with increasing NaCl concentration over
962 days (ca. 6700 generations). Whereas adaptation proceeded rather smoothly
with MG1655 cells (see chapter 3.1), the continuous culture of ε2124 showed
massive and sustained oscillations in the consumption of nonpermissive medium
during most of the adaptation campaign and did not reach the high steady state
concentration of 1.3 M in the MG1655 derivative but led only to tolerance of around 1
M NaCl during growth with the imposed generation time of 4 h. Although both
experiments were initially conducted using identical genetic machines in the same
environment kept at 28 - 30°C, differences in the functioning of the setup could play a
role in the different behavior of the two cultures.
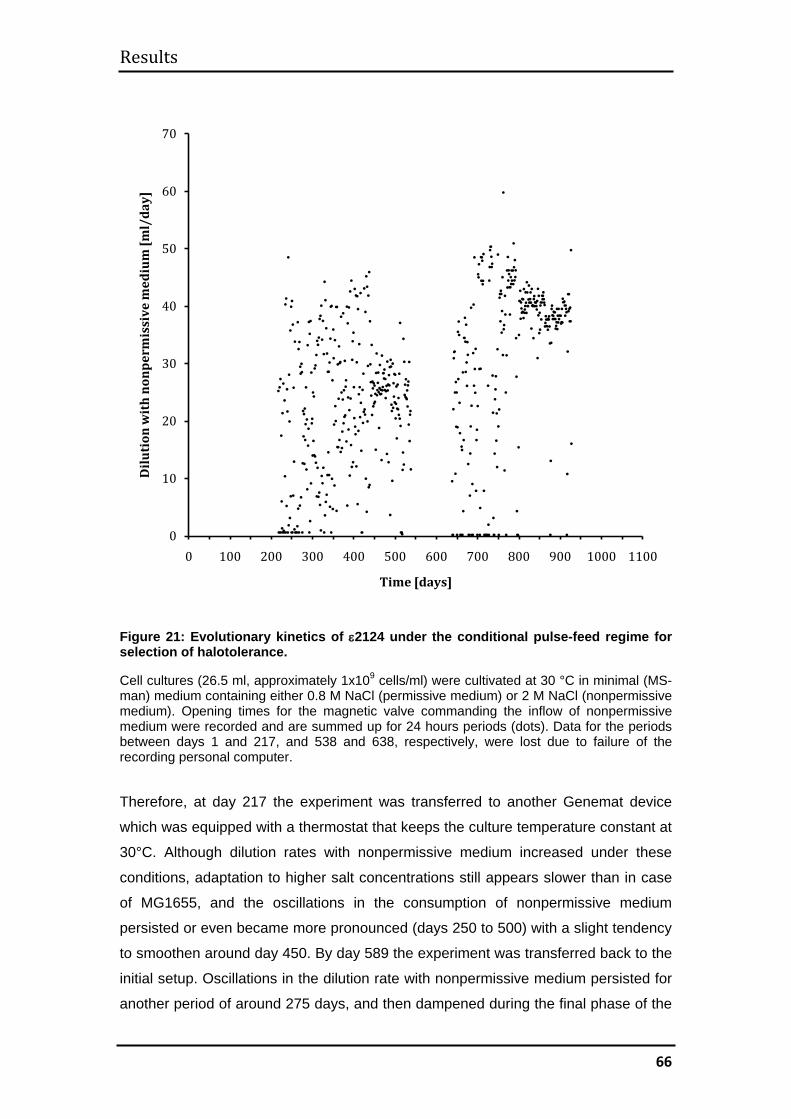
Results
66
Figure 21: Evolutionary kinetics of ε2124 under the conditional pulse-feed regime for selection of halotolerance.
Cell cultures (26.5 ml, approximately 1x10⁹ cells/ml) were cultivated at 30 °C in minimal (MS-man) medium containing either 0.8 M NaCl (permissive medium) or 2 M NaCl (nonpermissive medium). Opening times for the magnetic valve commanding the inflow of nonpermissive medium were recorded and are summed up for 24 hours periods (dots). Data for the periods between days 1 and 217, and 538 and 638, respectively, were lost due to failure of the recording personal computer.
Therefore, at day 217 the experiment was transferred to another Genemat device
which was equipped with a thermostat that keeps the culture temperature constant at
30°C. Although dilution rates with nonpermissive medium increased under these
conditions, adaptation to higher salt concentrations still appears slower than in case
of MG1655, and the oscillations in the consumption of nonpermissive medium
persisted or even became more pronounced (days 250 to 500) with a slight tendency
to smoothen around day 450. By day 589 the experiment was transferred back to the
initial setup. Oscillations in the dilution rate with nonpermissive medium persisted for
another period of around 275 days, and then dampened during the final phase of the
0
10
20
30
40
50
60
70
0 100 200 300 400 500 600 700 800 900 1000 1100
Dilu
tion
wit
h no
nper
mis
sive
med
ium
[ml/
day]
Time [days]
Results
67
present experimental campaign. Thus, these oscillations appear not to be caused by
the experimental setup, but rather by some biological trait of the culture, most
probably its mutator phenotype.
In similar experiments, as shown above for MG1655 the properties of the evolving
populations were investigated and compared with those of the prototypic MG1655
strain. The results of this analysis are presented below.
3.2.2 Evolution of halotolerance
Growth in NaCl
To determine the level of halotolerance of ε2124 derivatives selected during the
course of the experiment, isolates from the genetic machine were tested for their
ability to grow in batch cultures in media with various osmolarities. Figure 22 shows
growth yields of successive evolvants after cultivation in batch culture in various NaCl
concentrations along with the properties of wild type MG1655 populations. ε2124
populations isolated after 273 days of selection displayed both better growth at
higher NaCl concentrations and reduced yields in the absence of extracellular salt
(Fig. 22 B). This trend continued in samples from later stages of the experiment (Fig.
22 C), and cells isolated on day 962 failed to grow in the absence of NaCl, grew to
highest yields at concentrations of around 1 M and showed some growth even at
concentrations higher than 1.4 M (Fig. 22 D).
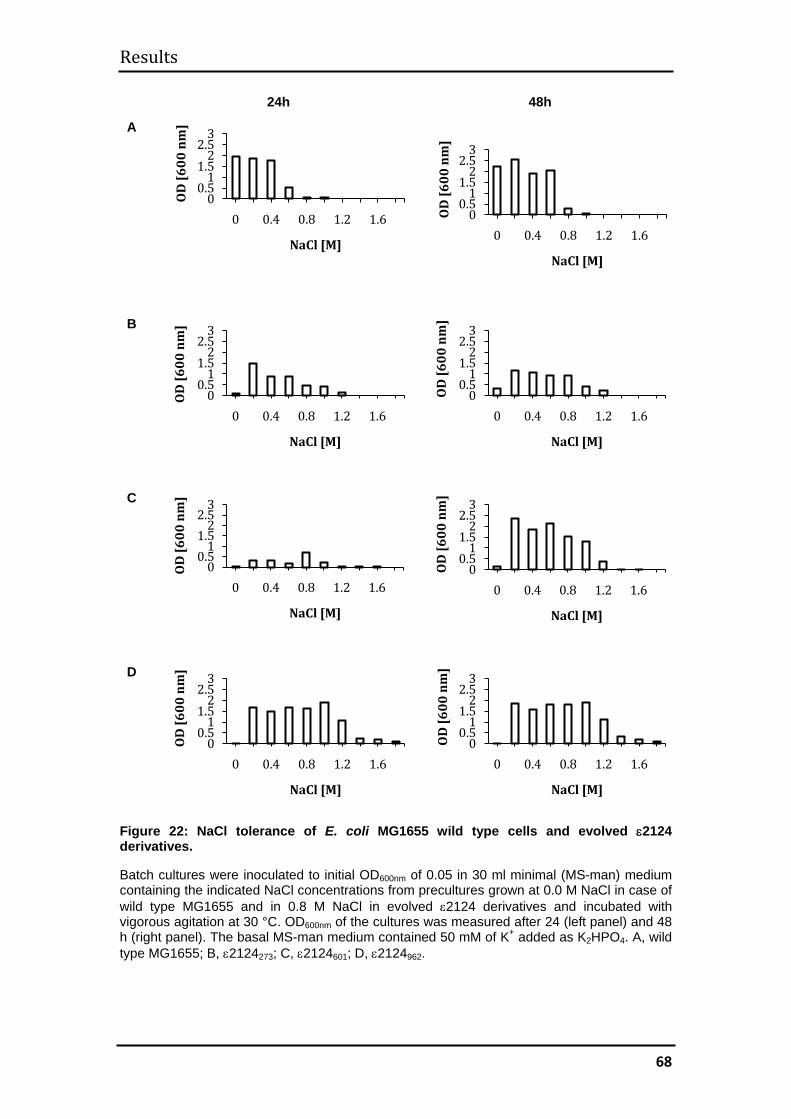
Results
68
24h 48h
A
B
C
D
Figure 22: NaCl tolerance of E. coli MG1655 wild type cells and evolved ε2124 derivatives.
Batch cultures were inoculated to initial OD600nm of 0.05 in 30 ml minimal (MS-man) medium containing the indicated NaCl concentrations from precultures grown at 0.0 M NaCl in case of wild type MG1655 and in 0.8 M NaCl in evolved ε2124 derivatives and incubated with vigorous agitation at 30 °C. OD600nm of the cultures was measured after 24 (left panel) and 48 h (right panel). The basal MS-man medium contained 50 mM of K+ added as K2HPO4. A, wild type MG1655; B, ε2124273; C, ε2124601; D, ε2124962.
00.5
11.5
22.5
3
0 0.4 0.8 1.2 1.6
OD
[600
nm
]
NaCl [M]
00.5
11.5
22.5
3
0 0.4 0.8 1.2 1.6
OD
[600
nm
]
NaCl [M]
00.5
11.5
22.5
3
0 0.4 0.8 1.2 1.6
OD
[600
nm
]
NaCl [M]
00.5
11.5
22.5
3
0 0.4 0.8 1.2 1.6
OD
[600
nm
]NaCl [M]
00.5
11.5
22.5
3
0 0.4 0.8 1.2 1.6
OD
[600
nm
]
NaCl [M]
00.5
11.5
22.5
3
0 0.4 0.8 1.2 1.6
OD
[600
nm
]
NaCl [M]
00.5
11.5
22.5
3
0 0.4 0.8 1.2 1.6
OD
[600
nm
]
NaCl [M]
00.5
11.5
22.5
3
0 0.4 0.8 1.2 1.6
OD
[600
nm
]
NaCl [M]
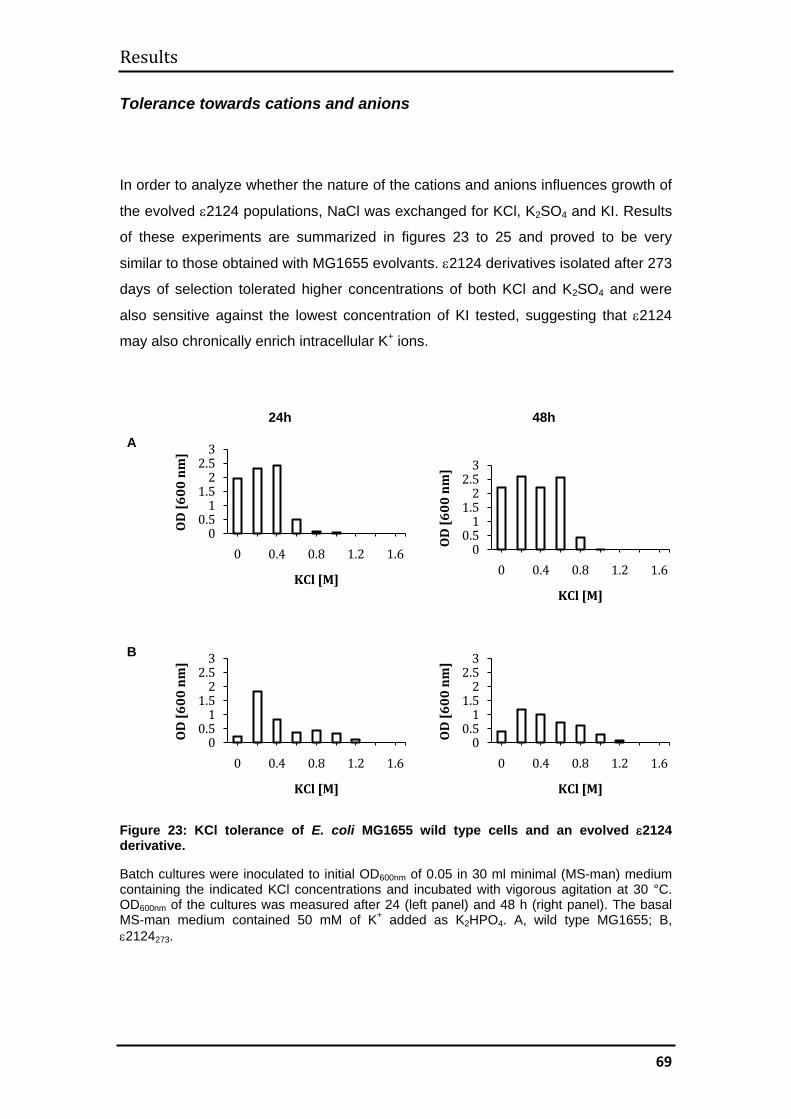
Results
69
Tolerance towards cations and anions
In order to analyze whether the nature of the cations and anions influences growth of
the evolved ε2124 populations, NaCl was exchanged for KCl, K2SO4 and KI. Results
of these experiments are summarized in figures 23 to 25 and proved to be very
similar to those obtained with MG1655 evolvants. ε2124 derivatives isolated after 273
days of selection tolerated higher concentrations of both KCl and K2SO4 and were
also sensitive against the lowest concentration of KI tested, suggesting that ε2124
may also chronically enrich intracellular K+ ions.
24h 48h
A
B
Figure 23: KCl tolerance of E. coli MG1655 wild type cells and an evolved ε2124 derivative.
Batch cultures were inoculated to initial OD600nm of 0.05 in 30 ml minimal (MS-man) medium containing the indicated KCl concentrations and incubated with vigorous agitation at 30 °C. OD600nm of the cultures was measured after 24 (left panel) and 48 h (right panel). The basal MS-man medium contained 50 mM of K+ added as K2HPO4. A, wild type MG1655; B, ε2124273.
00.5
11.5
22.5
3
0 0.4 0.8 1.2 1.6
OD
[600
nm
]
KCl [M]
00.5
11.5
22.5
3
0 0.4 0.8 1.2 1.6
OD
[600
nm
]
KCl [M]
00.5
11.5
22.5
3
0 0.4 0.8 1.2 1.6
OD
[600
nm
]
KCl [M]
00.5
11.5
22.5
3
0 0.4 0.8 1.2 1.6
OD
[600
nm
]
KCl [M]
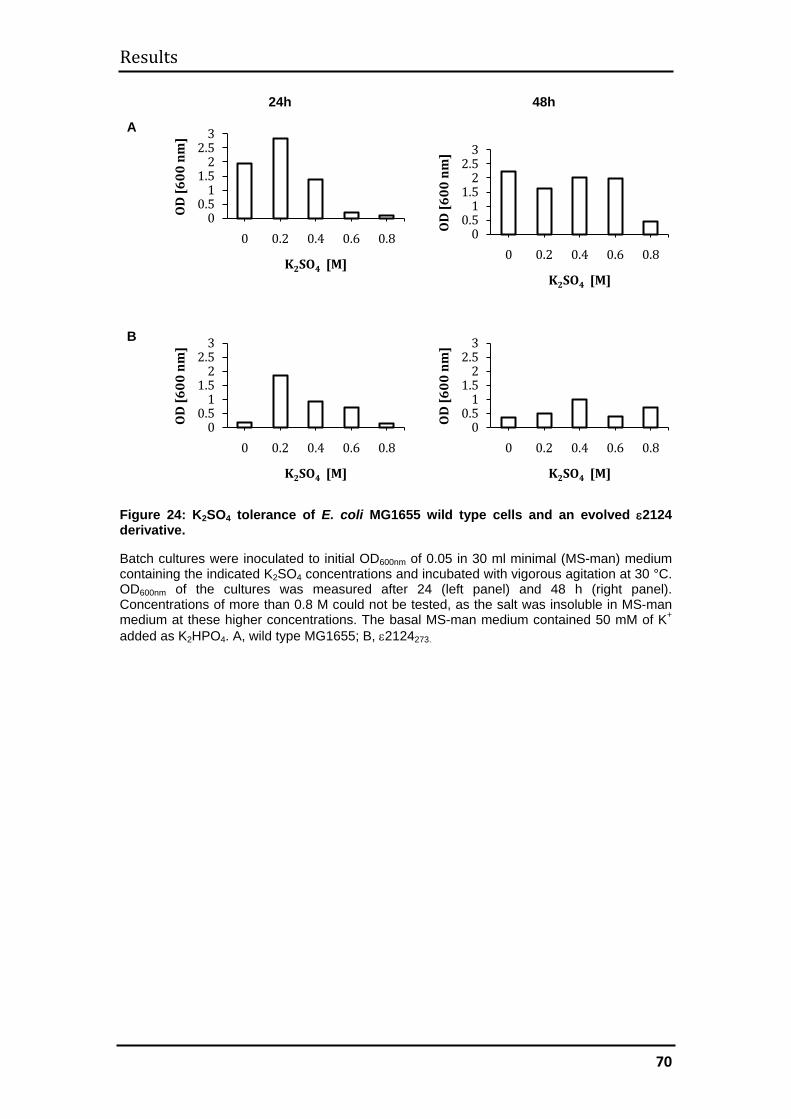
Results
70
24h 48h
A
B
Figure 24: K2SO4 tolerance of E. coli MG1655 wild type cells and an evolved ε2124 derivative.
Batch cultures were inoculated to initial OD600nm of 0.05 in 30 ml minimal (MS-man) medium containing the indicated K2SO4 concentrations and incubated with vigorous agitation at 30 °C. OD600nm of the cultures was measured after 24 (left panel) and 48 h (right panel). Concentrations of more than 0.8 M could not be tested, as the salt was insoluble in MS-man medium at these higher concentrations. The basal MS-man medium contained 50 mM of K+ added as K2HPO4. A, wild type MG1655; B, ε2124273.
00.5
11.5
22.5
3
0 0.2 0.4 0.6 0.8
OD
[600
nm
]
K2SO4 [M]
00.5
11.5
22.5
3
0 0.2 0.4 0.6 0.8
OD
[600
nm
]
K2SO4 [M]
00.5
11.5
22.5
3
0 0.2 0.4 0.6 0.8
OD
[600
nm
]
K2SO4 [M]
00.5
11.5
22.5
3
0 0.2 0.4 0.6 0.8O
D [6
00 n
m]
K2SO4 [M]
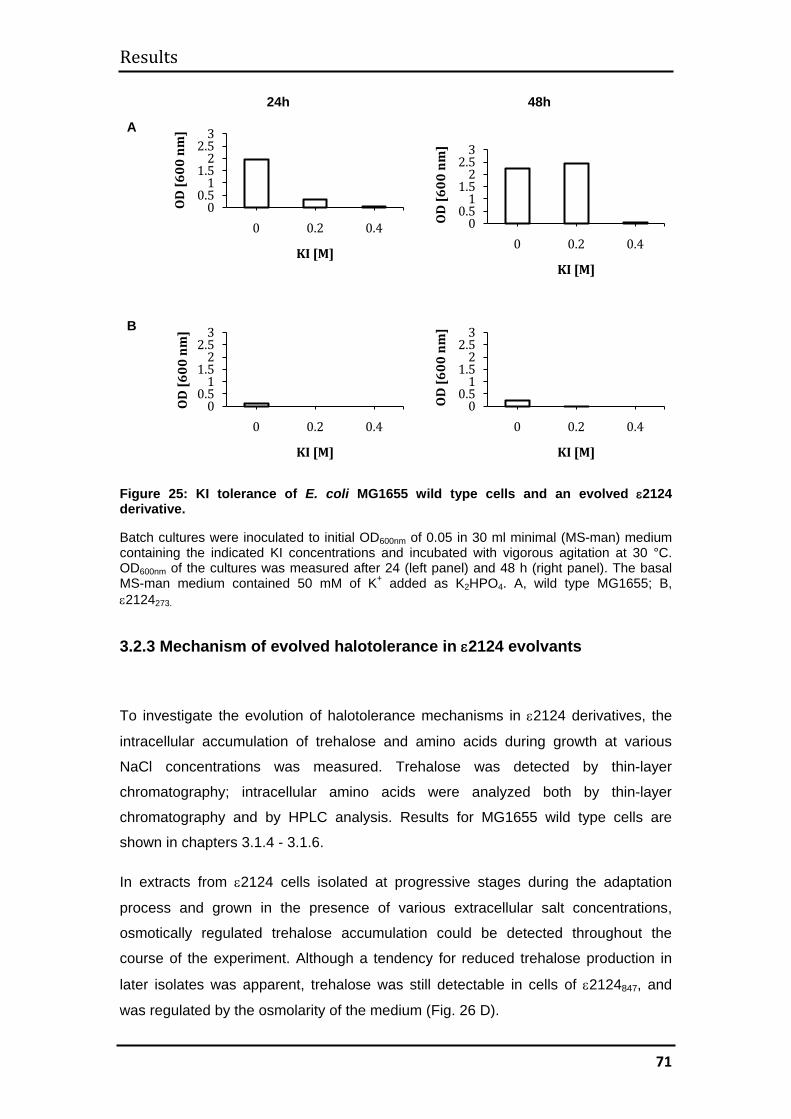
Results
71
24h 48h
A
B
Figure 25: KI tolerance of E. coli MG1655 wild type cells and an evolved ε2124 derivative.
Batch cultures were inoculated to initial OD600nm of 0.05 in 30 ml minimal (MS-man) medium containing the indicated KI concentrations and incubated with vigorous agitation at 30 °C. OD600nm of the cultures was measured after 24 (left panel) and 48 h (right panel). The basal MS-man medium contained 50 mM of K+ added as K2HPO4. A, wild type MG1655; B, ε2124273.
3.2.3 Mechanism of evolved halotolerance in ε2124 evolvants
To investigate the evolution of halotolerance mechanisms in ε2124 derivatives, the
intracellular accumulation of trehalose and amino acids during growth at various
NaCl concentrations was measured. Trehalose was detected by thin-layer
chromatography; intracellular amino acids were analyzed both by thin-layer
chromatography and by HPLC analysis. Results for MG1655 wild type cells are
shown in chapters 3.1.4 - 3.1.6.
In extracts from ε2124 cells isolated at progressive stages during the adaptation
process and grown in the presence of various extracellular salt concentrations,
osmotically regulated trehalose accumulation could be detected throughout the
course of the experiment. Although a tendency for reduced trehalose production in
later isolates was apparent, trehalose was still detectable in cells of ε2124847, and
was regulated by the osmolarity of the medium (Fig. 26 D).
00.5
11.5
22.5
3
0 0.2 0.4
OD
[600
nm
]
KI [M]
00.5
11.5
22.5
3
0 0.2 0.4
OD
[600
nm
]
KI [M]
00.5
11.5
22.5
3
0 0.2 0.4
OD
[600
nm
]
KI [M]
00.5
11.5
22.5
3
0 0.2 0.4O
D [6
00 n
m]
KI [M]
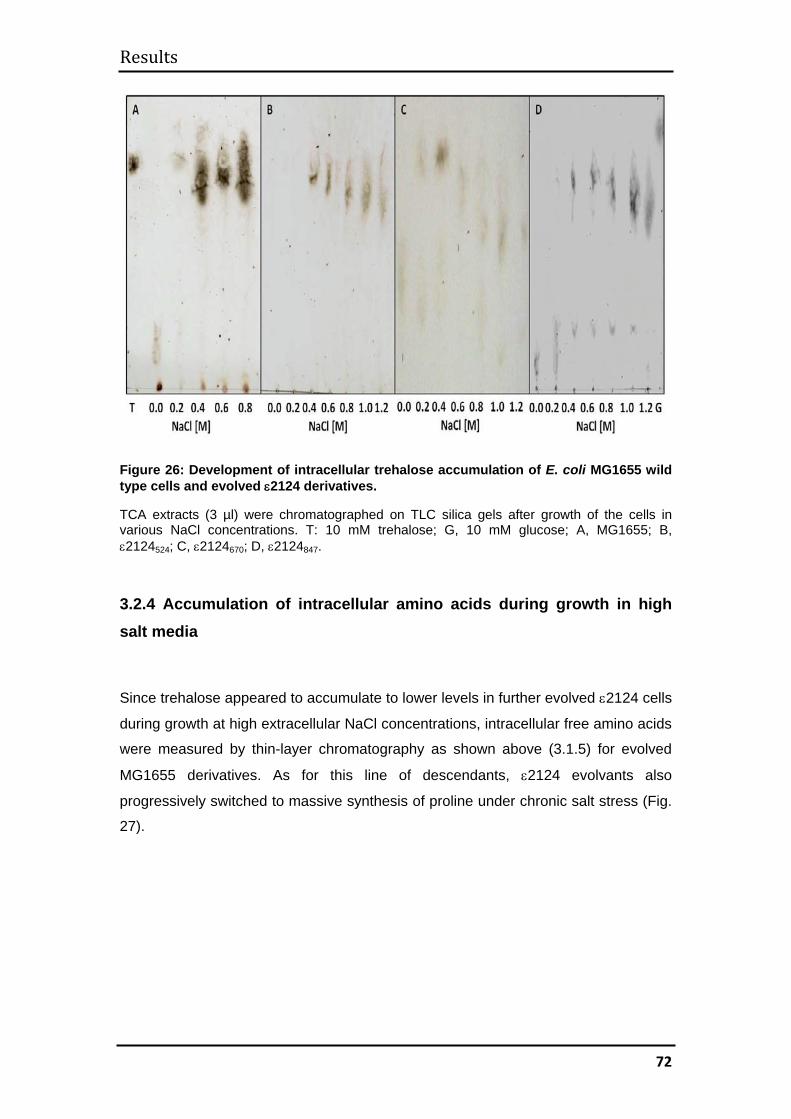
Results
72
Figure 26: Development of intracellular trehalose accumulation of E. coli MG1655 wild type cells and evolved ε2124 derivatives.
TCA extracts (3 µl) were chromatographed on TLC silica gels after growth of the cells in various NaCl concentrations. T: 10 mM trehalose; G, 10 mM glucose; A, MG1655; B, ε2124524; C, ε2124670; D, ε2124847.
3.2.4 Accumulation of intracellular amino acids during growth in high salt media
Since trehalose appeared to accumulate to lower levels in further evolved ε2124 cells
during growth at high extracellular NaCl concentrations, intracellular free amino acids
were measured by thin-layer chromatography as shown above (3.1.5) for evolved
MG1655 derivatives. As for this line of descendants, ε2124 evolvants also
progressively switched to massive synthesis of proline under chronic salt stress (Fig.
27).
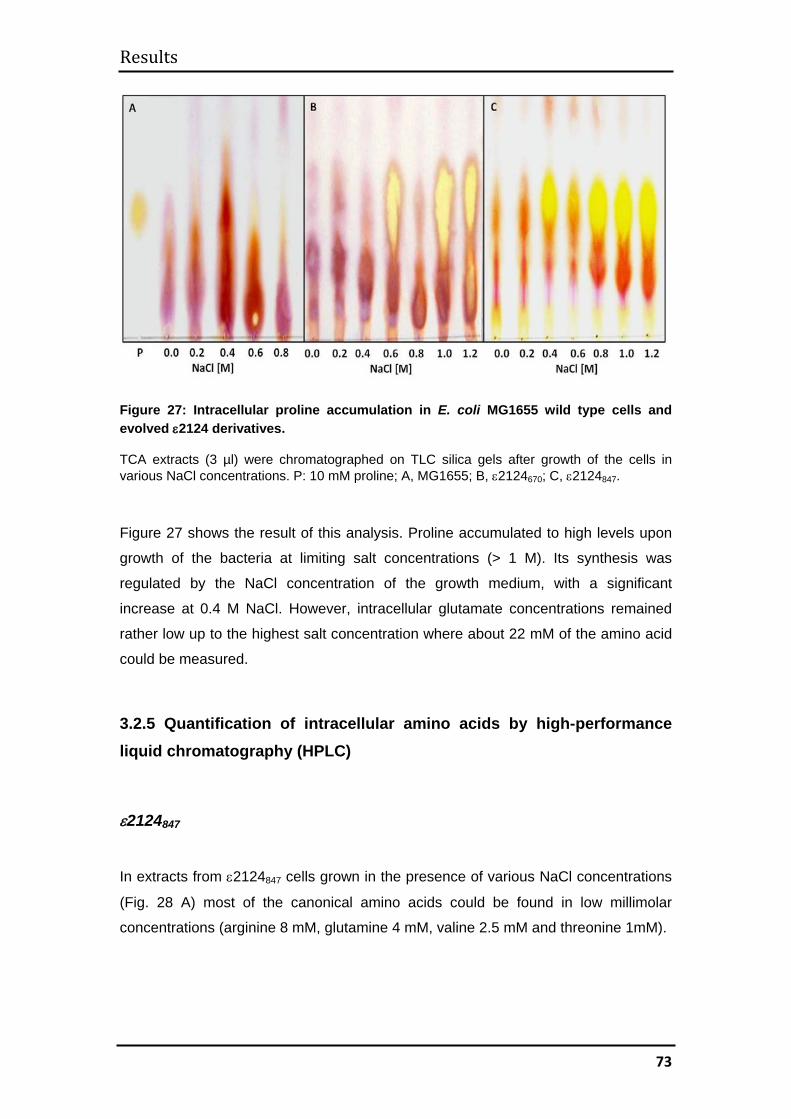
Results
73
Figure 27: Intracellular proline accumulation in E. coli MG1655 wild type cells and evolved ε2124 derivatives.
TCA extracts (3 µl) were chromatographed on TLC silica gels after growth of the cells in various NaCl concentrations. P: 10 mM proline; A, MG1655; B, ε2124670; C, ε2124847.
Figure 27 shows the result of this analysis. Proline accumulated to high levels upon
growth of the bacteria at limiting salt concentrations (> 1 M). Its synthesis was
regulated by the NaCl concentration of the growth medium, with a significant
increase at 0.4 M NaCl. However, intracellular glutamate concentrations remained
rather low up to the highest salt concentration where about 22 mM of the amino acid
could be measured.
3.2.5 Quantification of intracellular amino acids by high-performance liquid chromatography (HPLC)
ε2124847
In extracts from ε2124847 cells grown in the presence of various NaCl concentrations
(Fig. 28 A) most of the canonical amino acids could be found in low millimolar
concentrations (arginine 8 mM, glutamine 4 mM, valine 2.5 mM and threonine 1mM).
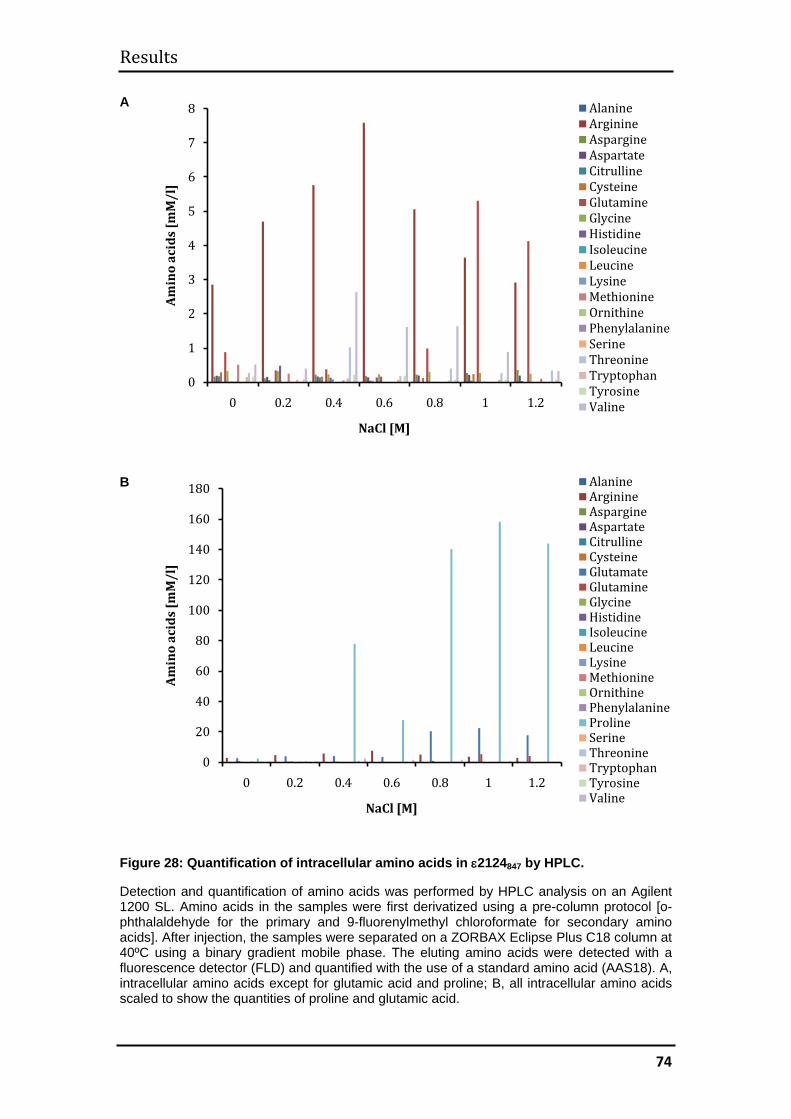
Results
74
A
B
Figure 28: Quantification of intracellular amino acids in ε2124847 by HPLC.
Detection and quantification of amino acids was performed by HPLC analysis on an Agilent 1200 SL. Amino acids in the samples were first derivatized using a pre-column protocol [o-phthalaldehyde for the primary and 9-fluorenylmethyl chloroformate for secondary amino acids]. After injection, the samples were separated on a ZORBAX Eclipse Plus C18 column at 40ºC using a binary gradient mobile phase. The eluting amino acids were detected with a fluorescence detector (FLD) and quantified with the use of a standard amino acid (AAS18). A, intracellular amino acids except for glutamic acid and proline; B, all intracellular amino acids scaled to show the quantities of proline and glutamic acid.
0
1
2
3
4
5
6
7
8
0 0.2 0.4 0.6 0.8 1 1.2
Amin
o ac
ids
[mM
/l]
NaCl [M]
AlanineArginine AspargineAspartateCitrullineCysteineGlutamineGlycineHistidineIsoleucineLeucineLysineMethionineOrnithinePhenylalanineSerineThreonineTryptophanTyrosineValine
0
20
40
60
80
100
120
140
160
180
0 0.2 0.4 0.6 0.8 1 1.2
Amin
o ac
ids
[mM
/l]
NaCl [M]
AlanineArginine AspargineAspartateCitrullineCysteineGlutamateGlutamineGlycineHistidineIsoleucineLeucineLysineMethionineOrnithinePhenylalanineProlineSerineThreonineTryptophanTyrosineValine
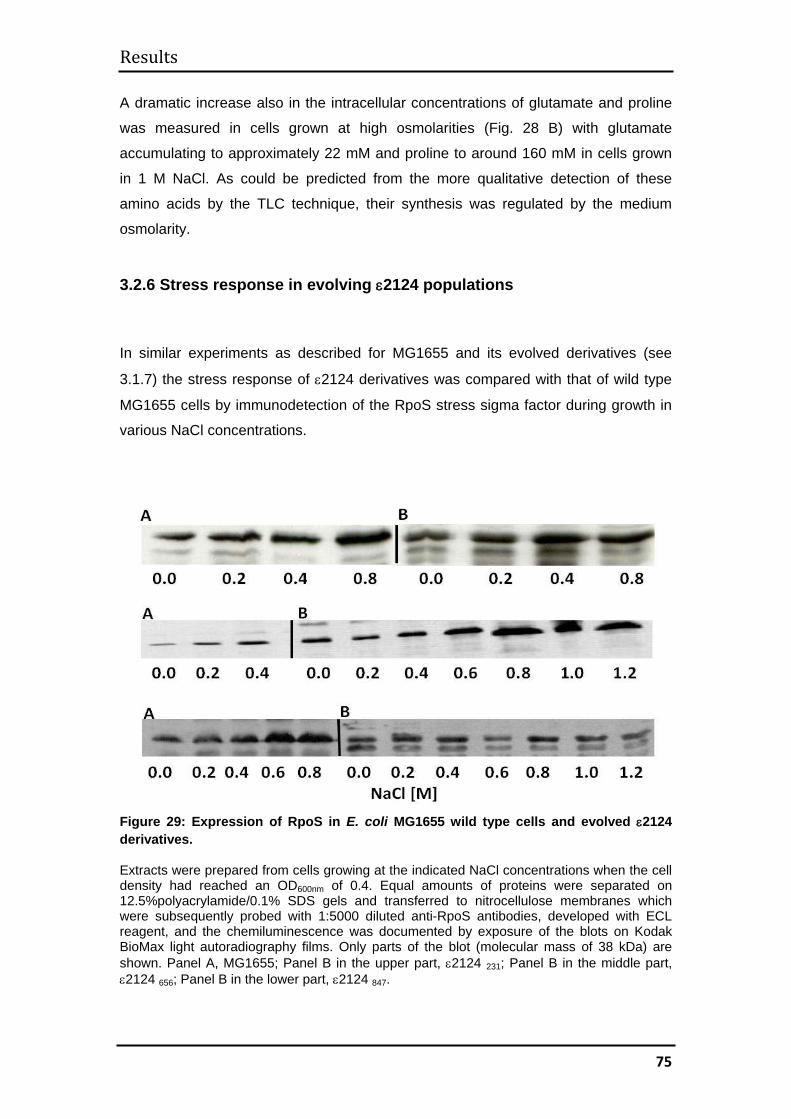
Results
75
A dramatic increase also in the intracellular concentrations of glutamate and proline
was measured in cells grown at high osmolarities (Fig. 28 B) with glutamate
accumulating to approximately 22 mM and proline to around 160 mM in cells grown
in 1 M NaCl. As could be predicted from the more qualitative detection of these
amino acids by the TLC technique, their synthesis was regulated by the medium
osmolarity.
3.2.6 Stress response in evolving ε2124 populations
In similar experiments as described for MG1655 and its evolved derivatives (see
3.1.7) the stress response of ε2124 derivatives was compared with that of wild type
MG1655 cells by immunodetection of the RpoS stress sigma factor during growth in
various NaCl concentrations.
Figure 29: Expression of RpoS in E. coli MG1655 wild type cells and evolved ε2124 derivatives.
Extracts were prepared from cells growing at the indicated NaCl concentrations when the cell density had reached an OD600nm of 0.4. Equal amounts of proteins were separated on 12.5%polyacrylamide/0.1% SDS gels and transferred to nitrocellulose membranes which were subsequently probed with 1:5000 diluted anti-RpoS antibodies, developed with ECL reagent, and the chemiluminescence was documented by exposure of the blots on Kodak BioMax light autoradiography films. Only parts of the blot (molecular mass of 38 kDa) are shown. Panel A, MG1655; Panel B in the upper part, ε2124 231; Panel B in the middle part, ε2124 656; Panel B in the lower part, ε2124 847.
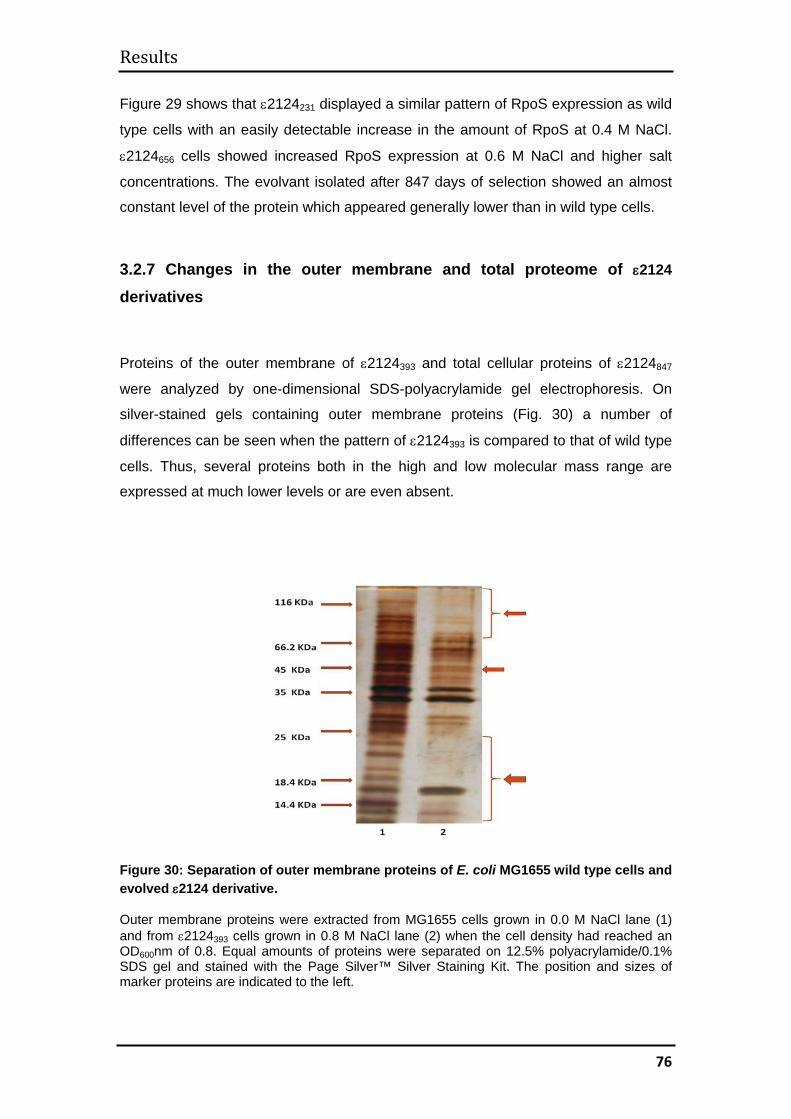
Results
76
Figure 29 shows that ε2124231 displayed a similar pattern of RpoS expression as wild
type cells with an easily detectable increase in the amount of RpoS at 0.4 M NaCl.
ε2124656 cells showed increased RpoS expression at 0.6 M NaCl and higher salt
concentrations. The evolvant isolated after 847 days of selection showed an almost
constant level of the protein which appeared generally lower than in wild type cells.
3.2.7 Changes in the outer membrane and total proteome of ε2124
derivatives
Proteins of the outer membrane of ε2124393 and total cellular proteins of ε2124847
were analyzed by one-dimensional SDS-polyacrylamide gel electrophoresis. On
silver-stained gels containing outer membrane proteins (Fig. 30) a number of
differences can be seen when the pattern of ε2124393 is compared to that of wild type
cells. Thus, several proteins both in the high and low molecular mass range are
expressed at much lower levels or are even absent.
Figure 30: Separation of outer membrane proteins of E. coli MG1655 wild type cells and evolved ε2124 derivative.
Outer membrane proteins were extracted from MG1655 cells grown in 0.0 M NaCl lane (1) and from ε2124393 cells grown in 0.8 M NaCl lane (2) when the cell density had reached an OD600nm of 0.8. Equal amounts of proteins were separated on 12.5% polyacrylamide/0.1% SDS gel and stained with the Page Silver™ Silver Staining Kit. The position and sizes of marker proteins are indicated to the left.
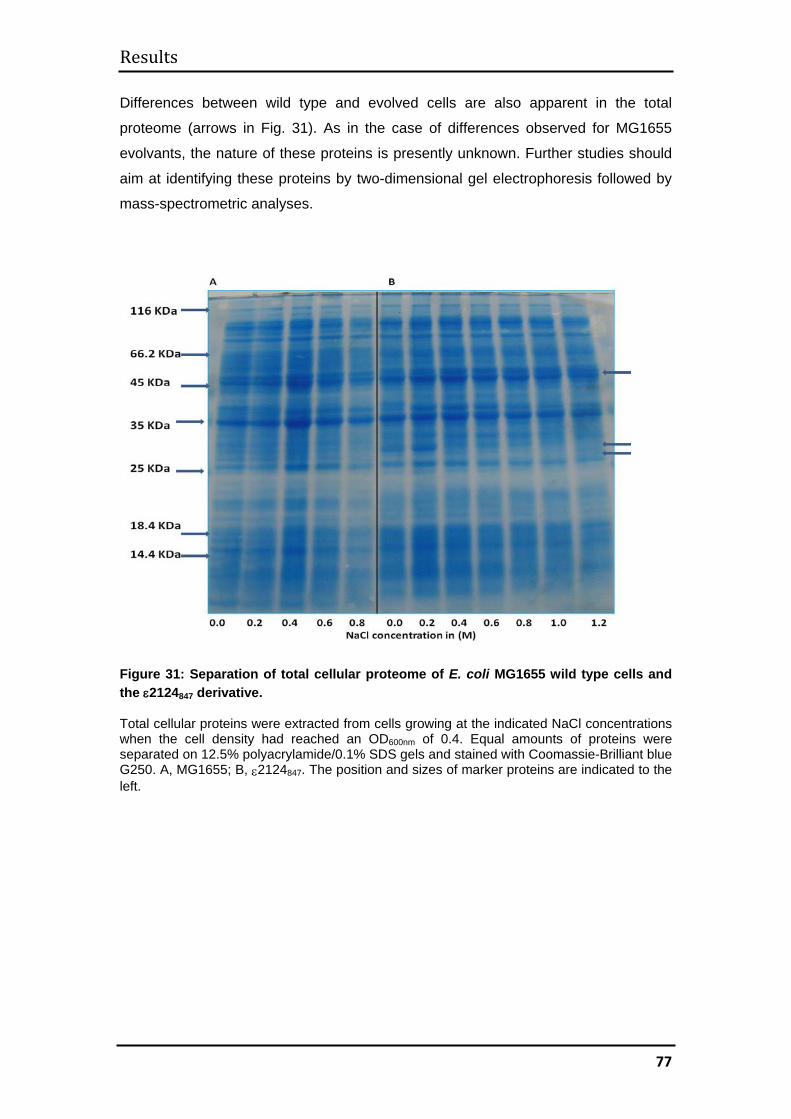
Results
77
Differences between wild type and evolved cells are also apparent in the total
proteome (arrows in Fig. 31). As in the case of differences observed for MG1655
evolvants, the nature of these proteins is presently unknown. Further studies should
aim at identifying these proteins by two-dimensional gel electrophoresis followed by
mass-spectrometric analyses.
Figure 31: Separation of total cellular proteome of E. coli MG1655 wild type cells and the ε2124847 derivative.
Total cellular proteins were extracted from cells growing at the indicated NaCl concentrations when the cell density had reached an OD600nm of 0.4. Equal amounts of proteins were separated on 12.5% polyacrylamide/0.1% SDS gels and stained with Coomassie-Brilliant blue G250. A, MG1655; B, ε2124847. The position and sizes of marker proteins are indicated to the left.
Discussion
78
4. Discussion
4.1 Technology for experimental evolution
The technology of continuous culture developed more than sixty years ago
independently by Monod (Monod, 1950) and Novick and Szilard (Novick and Szilard,
1950) is an excellent tool for experimental evolution of huge populations of cells
under strictly controlled, selective laboratory conditions. In such culture devices a
suspension of organisms is continuously renewed by a constant or conditional flow of
fresh growth medium, and the cells have to compensate the concomitant loss of
individuals by growing with a rate that is at least equal to the dilution rate. Theory
predicts that under these conditions better growing variants will be selected which
rapidly displace their less-adapted progenitors (Kubitschek, 1970). However, this
technology was soon abandoned as a tool for experimental evolution because it also
rapidly selects adhesive, biofilm-forming variants which colonize inner surfaces of the
culture apparatus and are not constrained to compete with their pelagic counterparts
(Chao and Ramsdell, 1985). The most extensive experiments on the evolution of
bacterial populations over 50000 generations during a period of more than 20 years
therefore relied on serial subculturing of cells (Barrick et al., 2009; Lenski, 2011), a
tedious, contamination-prone technology which suffers several major disadvantages
such as discontinuous growth, frequent loss of advantageous mutations due to
regular forcing of the population through narrow bottlenecks of small numbers of
individuals, and the impossibility to apply constant, harsh selection pressure.
In this work, two lines of halotolerant descendants of the prototypic E. coli strain
MG1655 were created by continuous cultivation of huge bacterial populations under
challenging medium osmolarities. Selection for constantly increasing halotolerance
was achieved by using the Genemat technology developed about a decade ago by
Marlière and Mutzel (Marlière and Mutzel, 2004). This technology overcomes the
main obstacle of permanent proliferation of suspended living cells in continuous
culture devices, rapid selection of adhesive, adaptively static variants, by alternatively
cultivating the population in twin culture vessels which are periodically sterilized by a
lethal chemical agent.
Discussion
79
A conditional pulse feed regime was applied which automatically maintains the
osmolarity of the growth medium at a level that is just tolerable for the best-adapted
variants. Here, the culture is periodically diluted with a growth medium containing a
salt concentration that is compatible with growth of the cells ("permissive medium"),
and the population density is constantly monitored. When cell density passes a pre-
set threshold, the culture is diluted with a pulse of "nonpermissive medium" (of an
osmolarity that is too high for growth) instead. Genetic variants tolerating higher
osmolarity enjoy a selective advantage under these conditions and will rapidly
displace their less salt-tolerant progenitors, to be later replaced by their own, more
salt-tolerant progeny.
The Genemat technology and the conditional pulse feed regime have recently proven
their power with the quasi-total replacement of the canonical DNA base thymine in
the genome of E. coli for the non-natural analogue, 5-chlorouracil, by Marlière and
his co-workers (Marlière et al., 2011). It can be foreseen that this technology will
become a standard tool in synthetic biology, enabling to deeply modify the chemical
and metabolic constitution of microbial cells (Acevedo-Rocha and Budisa, 2011) and
expand the range of physical environments in which experimentally evolved cells can
thrive, as demonstrated in the present work.
4.2 Experimental evolution of halotolerance and evolved mechanisms of halotolerance
Both developed lineages greatly enhanced tolerance against the monovalent cations,
Na+ and K+, as well as against the uncharged sugar, sorbitol. Cl- and SO42- could act
as counter-ions whereas I- was toxic at lower concentrations than for wild type cells.
Perhaps the most spectacular result of this experiment is a switch in the intracellular
osmoprotective strategy of evolved cells from the accumulation of the disaccharide
trehalose to accumulation of several hundred mM of the amino acid proline, which is
a well-known osmoprotectant in other organisms such as Bacillus species
(Whatmore et al., 1990) but has so far not been reported to be part of the
osmoprotective system of E. coli.
In wild type E. coli strains the response to osmotic stress consists in the rapid uptake
of K+ ions from the extracellular milieu, which triggers an increase in the synthesis of
glutamate. Next, osmoprotectants such as glycine-betaine or proline can be taken up
Discussion
80
from the medium, if they are present, or the induction of the otsBA trehalose
synthetic operon is induced by the stress sigma factor RpoS. The precursors
glucose-6-phosphate and UDP-glucose are condensed to trehalose-6-phosphate by
trehalose-6-phosphate synthase (the product of otsA), which is then
dephosphorylated by trehalose-6-phosphate phosphatase (the otsB gene product),
and K+ ions are subsequently exported from the cell because they interfere with
protein function. Addition of extracellular osmoprotectants relieves the stress
situation and, consequently, lowers intracellular trehalose concentrations (Dinnbier et
al., 1988). Upon osmotic downshift, trehalose can be metabolized by the cell after
export and re-import as trehalose-6-phosphate via the treB gene product and
degraded to glucose and glucose-6-phosphate by the product of treC. Cell growth,
which is halted during the initial phase of adaptation, can resume (Kempf and
Bremer, 1998).
During our evolution experiment cells experience chronic and constantly growth-
limiting osmotic stress. There are no osmoprotectants in the mineral medium
supplied and the cells have to rely on the production of intracellular trehalose. This
was indeed found in isolates analyzed during the early stages of adaptation, which
showed the osmotically regulated synthesis of trehalose along with increased levels
of RpoS. Both populations then switched to proline synthesis. In the MG1655
experiment this was accompanied by a distinct phase where the consumption of
nonpermissive medium per day did not increase during 150 days between days 450
and 600 (compare Fig. 7); for ε2124 this cannot be assessed as this culture showed
massive oscillations in the consumption of nonpermissive medium. In a roughly anti-
parallel manner the synthesis of intracellular trehalose in response to high salt
concentrations decreased, to be finally undetectable in MG1655 cells, whereas
ε2124 evolvants retained synthesis of the sugar, although at much lower levels than
wild type cells.
The fact that MG1655858 evolvants did not show any synthesis of trehalose even at
the highest tested salinities and when RpoS was clearly up-regulated (Fig. 13 and
18), indicates that the enzymatic machinery for trehalose synthesis is either
completely uncoupled from the regulatory answer to osmostress (and no longer
under control of RpoS), or that its enzymatic function is defective in these cells due to
one or several mutations in the corresponding genes. This question could be
answered by PCR amplification and sequence determination of these genes on the
one hand and, on the other hand by exposure of the evolved cells to cold shock, a
Discussion
81
condition that has been reported to trigger a similar increase in the intracellular
trehalose concentration as osmotic shock (Kandror et al., 2002). The gradual
decrease in trehalose accumulation probably reflects a gradual increase in proline
synthesis, such that the cells experience lower stress levels (Dinnbier et al., 1988).
An eventual "knock out" of trehalose synthesis might then be tolerated by the cells or
even be beneficial since the trehalose system is no longer required. The situation
might be similar in ε2124 evolvants, where low levels of osmotically regulated
trehalose accumulation could be measured even in later stages, together with a
moderate up-regulation of RpoS. Here, however, both trehalose and proline may still
contribute to osmoprotection.
The intracellular proline concentration in E. coli is regulated by feedback inhibition of
the gene product of proB, the γ-glutamylkinase (Baich, 1969; Smith et al., 1984). A
number of mutations in the catalytic domain are known to relieve this feedback
inhibition, causing intracellular accumulation of the amino acid (Perez-Arellano et al.,
2005). In addition, the C terminus of γ-glutamylkinase has been identified as a
regulatory domain, and truncation of this C terminal domain also leads to relief of
feedback inhibition by proline (Perez-Arellano et al., 2005). Such mutants
constitutively over-produce proline, and its synthesis is apparently not regulated by
the medium osmolarity.
First results from an ongoing project on the identification of mutations in the proline
synthesis pathway show that the proB genes from both MG16551119 and ε2124962
evolvants harbour two point mutations each in the part coding for the catalytic
domain of the enzyme, and that in the ε2124 evolvant an additional frame shift
mutation introduces a premature stop codon, so that the resulting gene encodes a C
terminally truncated variant of the enzyme (F. Scholz, personal communication). In
both strains therefore, proline synthesis should be unregulated by the concentration
of proline. It will be interesting to determine, by analyzing the "fossil record" of weekly
samples secured at -70 °C, at which point during the adaptation process these
mutations were fixed in the populations.
4.3 Osmoregulation of proline synthesis Synthesis of proline is regulated by the medium osmolarity in both evolved strains, as
can be judged both from TLC and HPLC analyses. Yet, synthesis of proline does not
appear to be regulated via the canonical RpoS-dependent stress response since
Discussion
82
huge amounts of the amino acid can be found at salinities where no enhanced
expression of RpoS is observed. How is proline synthesis regulated then?
A hint to answer this question may come from the observation that both evolved
strains are sensitive to KI concentrations which the wild type strain tolerates. Starting
from the hypothesis that evolved MG1655 and ε2124 cells may chronically enrich
intracellular K+ (with I- being co-imported as a counter-ion), Susanne Vettermann in
this laboratory recently tested the osmotolerance of the MG16551119 derivative in K+-
free medium. Her results show that under these conditions the strain fails to grow at
1 M NaCl or higher while it can grow up to 2 M NaCl in the presence of 50 mM K+.
Tolerance against challenging sorbitol concentrations is similarly impaired in the
absence of K+ (S. Vettermann, personal communication).
In wild type E. coli cells, a rapid, transient uptake of K+ triggering the synthesis of
glutamate is part of the acute response to increased osmolarity. Since the cation
interferes with protein function, the cell has to remove it from the cytosol after
induction of trehalose synthesis in order to resume growth. Glutamate is the direct
precursor for proline, and deregulation of the proB gene product in the evolved
derivatives (see above) would direct glutamate into this pathway. Chronically high
intracellular K+ would trigger constitutively high rates of glutamate synthesis, and the
actual rate of synthesis of glutamate could directly correlate with the final cellular
concentration of proline. Whether the intracellular K+ concentration in the evolved
cells directly correlates with the medium osmolarity and whether the level of
intracellular K+ regulates the rate of glutamate synthesis is a matter of speculation at
this stage. To address this, intracellular K+ concentrations in cells growing under
various osmolarities should be measured in follow-up work. If the intracellular K+
concentration indeed reflected the medium osmolarity, adaptation to various
osmolarities in the evolved cells could bypass the canonical, RpoS-dependent, stress
pathway. Chronically elevated K+ concentrations, however, are incompatible with
protein function in wild type cells. It is therefore to be expected that the adaptation
process led to mutations in the genes for proteins that do not function in wild type
cells in the presence of elevated intracellular K+. This process would probably be
slow because natural selection would have to "test" various mutants for their ability to
function in high K+, and this "search for better adapted variants" could explain the
phase of stalled increase in the consumption of nonpermissive medium observed
between days 450 and 600 in the MG1655 experiment. It might be mentioned here
that there was a second phase where the consumption of nonpermissive medium did
Discussion
83
only slowly increase (days 700 - 900) which was followed by a steep increase in the
last period of cultivation conducted during this work. This might be another instance
of such a search for rare mutations or combinations of mutations.
4.4 Impaired growth of evolved cells in the absence of salt
According to a definition proposed by Oren (2008) halophilic organisms grow best at
NaCl concentrations over 0.85 M, grow up to 1.7 M, and fail to grow in the absence
of external salt. In this respect, at least MG16551119 would be close to halophily.
Failure to grow when diluted from 0.8 M NaCl into salt-free minimal medium was first
observed in samples from the MG1655 and ε2124 experiments withdrawn at days
858 and 601, respectively. Still, even after long durations of continuous selection
both strains can be re-adapted to grow in the absence of extracellular NaCl (notice
that the medium contains 50 mM K-phosphate), either by passaging the population
over media of decreasing salinities (where they grow within 24 hours after each
passage to lower salinity) or upon direct inoculation from 0.8 M NaCl to 0 M NaCl,
where they grow after lag periods of three to five days. This long lag phase could be
due to very slow adaptation of all cells in the population to the low salt environment. It
is also possible that only a tiny fraction of the cells can survive the osmotic downshift,
leaving a small population of viable cells which grows with a fair rate but has to
undergo multiple generations before growth becomes evident for the observer. We
attempted to discriminate between these two possibilities by quantifying cell survival
rates after dilution on agar plates (both LB and MS man agar), yet this approach had
to be abandoned because evolved cells grow with very low yields on solid media
even if they are plated at the salinity of the liquid pre-culture. This failure to grow on
solid media may be explained by the fact that the cells were cultivated in the genetic
machine for thousands of generations in an environment that effectively selects
against adhesion to surfaces.
4.5 Proteome evolution
As long as the intracellular milieu can be osmotically balanced by massive synthesis
of compatible solutes, proteins that are in contact with the extracellular space (outer
membrane proteins, periplasmic proteins, and the outer face of inner membrane
Discussion
84
proteins) should be subjected to selection for proper function in high salinities. Only
when intracellular osmoprotectant production proves to be insufficient to compensate
the loss of water under increasing extracellular salt concentrations, adaptations of the
structure of intracellular proteins such as those found in the proteins of halophilic
organisms (Ventosa et al., 1998) should occur. Adaptations such as the construction
of "charge shields" - the enrichment of the outer surfaces of proteins in glutamic acid
and aspartic acid (Zaccai and Eisenberg, 1990) - will require multiple mutations in the
genes for those proteins and are expected to accumulate over many generations. For
example, the differences in the amino acid composition of total cellular proteins
would amount to at least 5% of the genome, as suggested by a comparison of the
amino acid compositions of the halophile Haloferax mediterranei and the mesophilic
E. coli (Ghanbir et al., 1995). Initial proteomic analysis of outer membrane proteins
and total cell extracts of the evolvants isolated during our work suggest that the
cellular proteome is indeed changing. So far, these changes appear to affect the
expression of individual proteins rather than their structures since at least in the case
of MG1655 evolvants shifts in the isoelectric points of individual proteins are not
observed. A shift in the pI of a protein to lower values would indicate an enrichment
of negatively charged amino acids.
4.6 Influence of genetic variability on halophilic adaptation
ε2124 carries mutations in both the def/fmt operon and the mutD gene. The original
∆def/fmt mutation led to a drastic increase in the generation time, and subsequent
cultivation under a turbidostat regime rapidly restored near wild type growth rates
(Marlière et al., 2005; see below, Fig. 32). Resurgence from the "crippling" effect of
the def/fmt deletion was much faster in the mutD derivative than in the non-mutator
parental strain (Fig. 32).
The haloadaptation experiment with ε2124 was initiated hypothesizing that higher
mutation rates would speed up evolution similarly. However, whereas adaptation to
higher osmolarities proceeded smoothly with MG1655 cells as revealed by regular
increases in the consumption of nonpermissive medium, ε2124 cultures displayed
massive and sustained oscillations in the consumption of nonpermissive medium
during most of the experiment, and halotolerance did not reach the same level as in
MG1655.
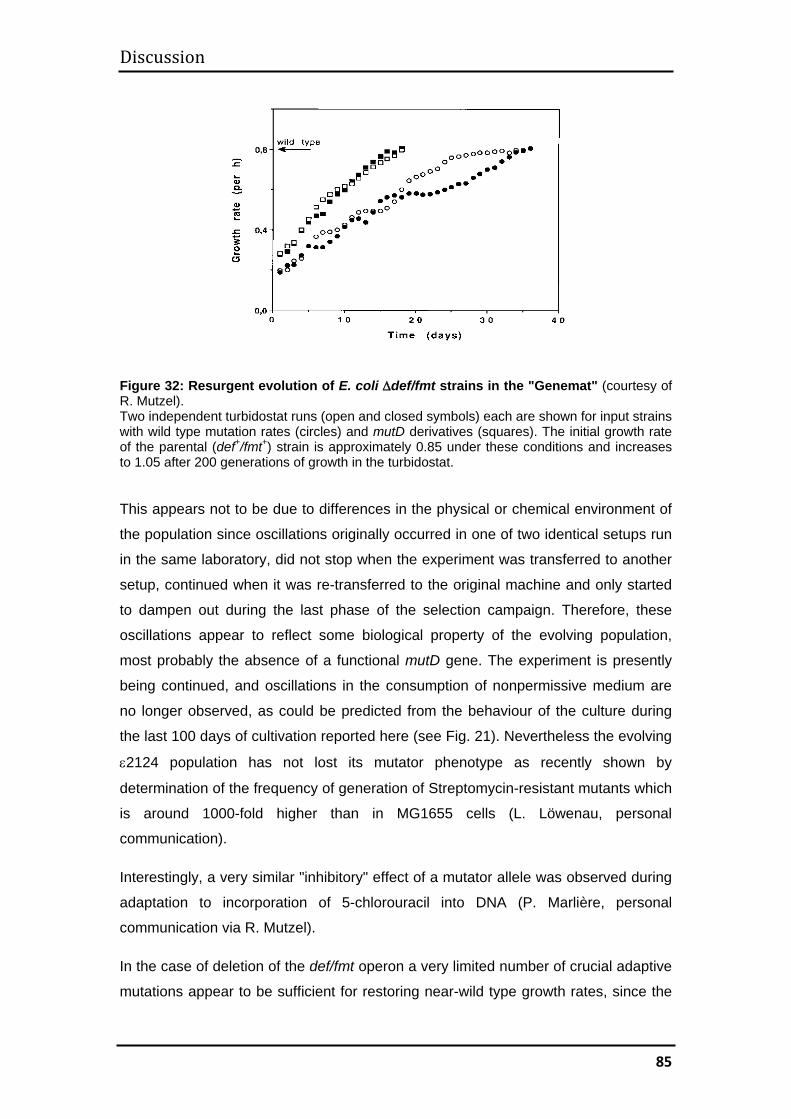
Discussion
85
Figure 32: Resurgent evolution of E. coli ∆def/fmt strains in the "Genemat" (courtesy of R. Mutzel). Two independent turbidostat runs (open and closed symbols) each are shown for input strains with wild type mutation rates (circles) and mutD derivatives (squares). The initial growth rate of the parental (def+/fmt+) strain is approximately 0.85 under these conditions and increases to 1.05 after 200 generations of growth in the turbidostat. This appears not to be due to differences in the physical or chemical environment of
the population since oscillations originally occurred in one of two identical setups run
in the same laboratory, did not stop when the experiment was transferred to another
setup, continued when it was re-transferred to the original machine and only started
to dampen out during the last phase of the selection campaign. Therefore, these
oscillations appear to reflect some biological property of the evolving population,
most probably the absence of a functional mutD gene. The experiment is presently
being continued, and oscillations in the consumption of nonpermissive medium are
no longer observed, as could be predicted from the behaviour of the culture during
the last 100 days of cultivation reported here (see Fig. 21). Nevertheless the evolving
ε2124 population has not lost its mutator phenotype as recently shown by
determination of the frequency of generation of Streptomycin-resistant mutants which
is around 1000-fold higher than in MG1655 cells (L. Löwenau, personal
communication).
Interestingly, a very similar "inhibitory" effect of a mutator allele was observed during
adaptation to incorporation of 5-chlorouracil into DNA (P. Marlière, personal
communication via R. Mutzel).
In the case of deletion of the def/fmt operon a very limited number of crucial adaptive
mutations appear to be sufficient for restoring near-wild type growth rates, since the
Discussion
86
genomes of evolved derivatives from four independent turbidostat experiments show
only a small number of common mutations hidden in a "noisy background" of several
hundred mutations in each of the ∆def/fmt/mutD evolvants (D. Mazel, personal
communication via R. Mutzel). Both for adaptation to 5-chlorouracil usage and for
haloadaptation a large number of mutations which individually have no big effect on
the overall fitness of the evolving strain, but may be together necessary for better
growth, (in fact, resurgence of the def/fmt mutation required only approx. 300
generations in case of MG1655 ∆def/fmt cells, while adaptation to high osmolarity is
under way since thousands of generations; and adaptation to 5-chlorouracil usage
has been shown to be accompanied by large numbers of point mutations and
chromosomal rearrangements (Marlière et al., 2011). It is possible that mutD cells
harbouring different adaptive mutations of small selective value coexist in the culture
subjected to osmostress. During re-adaptation of ∆def/fmt variants to robust growth,
on the other hand, individual adaptive mutations appear to confer large fitness gains
to cells acquiring them, which should lead to very rapid displacement of progenitor
populations which do not enjoy these gains in fitness.
4.7 Outlook
The focus of the work presented here was on the "constructive" aspects of
experimental evolution of halophily, and it is planned to continue the continuous
cultures under selection until no further adaptation can be observed. In-depth
analysis of molecular, biochemical and physiological properties of the evolved
bacteria obtained until now is far from being complete. A number of follow-up
analyses may be proposed based on the results obtained so far.
Determination of the genome sequences of the evolved derivatives and bio-
informatics comparison with those of their ancestors is clearly necessary. With the
recent advent of next-generation sequencing technologies these analyses are
straightforward. Moreover, with further progress in sequencing technologies the
detailed analysis not only of the genomes of provisional "endpoints" of the
experiment (such as strains MG1655858 or MG16551119), but also of interesting
intermediates or even of the full "fossil record" of samples stored weekly at -70 °C will
become within reach, allowing to define a detailed adaptive path towards halophily at
the molecular level. Molecular analysis has to be accompanied by functional studies,
which address the mechanism of evolved halotolerance in the output of my work in
Discussion
87
more details. For example, the hypothesis of chronically elevated intracellular K+ in
the evolved derivates must be tested directly. Ideally, this should be extended to the
functional analysis of selected proteins, which are known to be sensitive to high K+.
DNA sequence analyses should be extended to comparative transcriptome and
proteome analysis. Which genes are up- and downregulated in their expression
during growth of the evolved cells in media of various osmolarity? Initial 2-D gel
electrophoretic analyses revealed a number of proteins whose expression changed
dramatically in evolved MG1655 cells growing under limiting salt concentrations as
compared to wild type cells growing in medium with low salinity. These proteins
should be identified by mass-spectrometric analysis of the "spots" cut out from the
gels. Are these changes constitutive or are they induced by the osmolarity of the
growth medium?
Finally, the differences in the adaptive kinetics of mutator-wild type und mutD strains
deserve attention. It is generally believed that higher variability is beneficial during
adaptation in challenging environments. Also, one of the strains cultivated during the
Lenski long-term experiment acquired a mutator phenotype (Barrick et al., 2009). Yet
for adaptation to high osmolarity lower variability appears preferable, although a
contribution of the ∆def/fmt mutation in this experiment cannot be formally ruled out.
Once mutations in the genome, which are crucial for adaptation, have been found
and their order of appearance determined, mathematical simulation of the dynamics
of populations with different genetic variability under stressful conditions could shed
light on this problem.
References
88
5. References
Acevedo-Rocha, C. G. and Budisa, N. (2011). On the road towards chemically
modified organisms endowed with a genetic firewall. Angewandte Chemie Int. Ed., in
press.
Ayala, F. J. (2009). Darwin and the scientific method. Proc Natl Acad Sci U S A, 106
Suppl 1,10033-10039.
Baich, A. (1969). Proline synthesis in Escherichia coli. A proline-inhibitable glutamic
acid kinase. Biochim Biophys Acta, 192, 462-467.
Barrick, J. E., Yu, D. S., Yoon S. H., Jeong, H., Oh T. K., Schneider, D., Lenski R. E. and Kim, J. F. (2009). Genome evolution and adaptation in a long-term
experiment with Escherichia coli. Nature, 461,1243-1247.
Blattner, F. R., Plunkett, G., Bloch, C. A., Perna, N. T., Burland, V., Riley, M., Collado-Vides, J., Glasner, J. D., Rode, C. K., Mayhew, G. F., Gregor, J., Davis, N. W., Kirkpatrick, H. A., Goeden, M. A., Rose, D. J., Mau, B. and Shao, Y. (1997). The complete genome sequence of Escherichia coli k-12. Science, 277,
1453-1462.
Boucher, Y., Douady, C. J., Sharma, A. K., Kamekura, M., and Doolittle, W. F. (2004). Intragenomic heterogeneity and intergenomic recombination among
haloarchaeal rRNA genes. J Bacteriol, 186, 3980-3990.
Brown, A. D. (1990). Microbial water stress physiology: Principles and perspectives.
(Chichester ; New York, Wiley).
Chao, L. and Ramsdell, G. (1985). The effects of wall populations on coexistence of
bacteria in the liquid phase of chemostat cultures. J Gen Microbiol, 131, 1229-1236.
Corvers, L. (2007). Experimentelle Evolution von Halotoleranz und Halophilie:
Escherichia coli MG1655. Diplomarbeit, Freie Universität Berlin.
Darwin, C. (1859). On the origin of species by means of natural selection, or the
preservation of favoured races in the struggle for life. (John Murray, London), 6th ed.
Dinnbier, U., Limpinsel, E., Schmid, R. and Bakker, E. P. (1988). Transient
accumulation of potassium glutamate and its replacement by trehalose during
References
89
adaptation of growing cells of Escherichia coli k-12 to elevated sodium chloride
concentrations. Arch Microbiol, 150, 348-357.
Dobzhansky, T. (1964). Biology, molecular and organismic. Am Zool, 4, 443-452.
Drake, J. W. (1991). A constant rate of spontaneous mutation in DNA-based
microbes. Proc Natl Acad Sci U S A, 88, 7160-7164.
Friedman, M. (2004). Applications of the ninhydrin reaction for analysis of amino
acids, peptides, and proteins to agricultural and biomedical sciences. J Agric Food
Chem, 52, 385-406.
Galinski, E. A. (1993). Compatible solutes of halophilic eubacteria: Molecular
principles, water-solute interaction, stress protection. Experientia, 49, 487-496.
Galinski, E. A. and Lippert, K. (1991). Novel compatible solutes and their potential
application as stabilizers in enzyme technology. In General and Applied Aspects of
Halophilic Microorganisms, ed Rodriguez-Valera, F. New York: Plenum Press. 351-
358.
Galinski, E. A. and Tindall, B.J. (1992). Biotechnological prospects for halophiles
and halotolerant microorganisms. In Molecular Biology and Biotechnology of
Ertremophiles, eds Herbert, R.D. & Sharp, R.J. London: Blackie, 76-114.
Gandbhir, M., Rasched, I., Marlière, P., and Mutzel, R. (1995). Convergent
evolution of amino acid usage in archaebacterial and eubacterial lineages adapted to
high salt. Res Microbiol, 146, 113-120.
Hebert, P. D. N., Remigio, E. A., Colbourne, J. K., Taylor, D. J., and Wilson, C. C. (2002). Accelerated molecular evolution in halophilic crustaceans. Evolution, 56, 909-
926.
Hengge, R. (2009). Proteolysis of (sS) (RpoS) and the general stress response in
Escherichia coli. Research in Microbiology, 160, 667-676.
Hengge, R., Klein, W., Lange, R., Rimmele, M. and Boos, W. (1991). Trehalose
synthesis genes are controlled by the putative sigma factor encoded by RpoS and
are involved in stationary-phase thermotolerance in Escherichia coli. J Bacteriol, 173,
7918-7924.
References
90
James, T. W. (1961). Continuous culture of microorganisms. Ann. Rev. Microbiol.,
15, 27-43.
Jessup, C. M. and Forde, S. E. (2008). Ecology and evolution in microbial systems:
The generation and maintenance of diversity in phage-host interactions. Res
Microbiol, 159, 382-389.
Kandror, O., Deleon, A. and Goldberg, A. L. (2002). Trehalose synthesis is
induced upon exposure of Escherichia coli to cold and is essential for viability at low
temperatures. Proc Natl Acad Sci U S A, 99, 9727-9732.
Kempf, B. and Bremer, E. (1998). Uptake and synthesis of compatible solutes as
microbial stress responses to high-osmolality environments. Arch Microbiol, 170,
319-330.
Khire, J. M. and Pant, A. (1992). Thermostable, salt-tolerant amylase from Bacillus
sp. 64. World Journal of Microbiology and Biotechnology, 8, 167-170.
Kubitschek, H. E. (1970). Introduction to research with continuous cultures,
(Prentice Hall, Englewood Cliffs, N.J.).
Kushner, D. J. (1985). The halobacteriaceae. In the bacteria, vol. 8, eds woese, c.R.
& wolfe, r.S. Pp. 171-214. London: Academic press.
Kyhse-Andersen, J. (1984). Electroblotting of multiple gels: A simple apparatus
without buffer tank for rapid transfer of proteins from polyacrylamide to nitrocellulose.
J Biochem Biophys Methods, 10, 203-209.
Laemmli, U. K. (1970). Cleavage of structural proteins during the assembly of the
head of bacteriophage t4. Nature, 227, 680-685.
Lanyi, J. K. (1974). Salt-dependent properties of proteins from extremely halophilic
bacteria. Bacteriol Rev, 38, 272-290.
Lenski, R. E. (2011). Evolution in action: A 50,000-generation salute to Charles
Darwin. The evolutionary process can be directly observed by watching microbes as
they change and adapt over time. Microbe, 6, 30-33.
Lenski, R. E. and Travisano, M. (1994). Dynamics of adaptation and diversification:
A 10,000-generation experiment with bacterial populations. Proc Natl Acad Sci U S
A, 91, 6808-6814.
References
91
Lowry, O. H., Rosebrough, N. J., Farr, A. L. and Randall, R. J. (1951). Protein
measurement with the folin phenol reagent. J Biol Chem, 193, 265-275.
Lugtenberg, B., Meijers, J., Peters, R., Van Der Hoek, P. and Van Alphen, L. (1975). Electrophoretic resolution of the "major outer membrane protein" of
Escherichia coli k12 into four bands. FEBS Lett, 58, 254-258.
Ma, Y., Galinski, E. A., Grant, W. D., Oren, A. and Ventosa, A. (2010). Halophiles
2010: Life in saline environments. Appl Environ Microbiol, 76, 6971-6981.
Marlière, P., and Mutzel, R. (2004). Method and device for selecting accelerated
proliferation of living cells in suspension. Patent us 6, 686, 194 b1.
Marlière, P., Mutzel, R. and Mazel, D. (2005). Descendants of bacteria devoid of N
terminal formylation useful for the production of proteins and peptides. Patent us 6,
962, 807 b2.
Marlière, P., Patrouix, J., Döring, V., Herdewijn, P., Tricot, S., Cruveiller, S., Bouzon, M., and Mutzel, R. (2011). Chemical evolution of a bacterium's genome.
Angewandte Chemie Int. Ed., in press.
Mazel, D., Pochet, S. and Marliere, P. (1994). Genetic characterization of
polypeptide deformylase, a distinctive enzyme of eubacterial translation. EMBO J,
13, 914-923.
Monod, J. (1950). La technique de culture continue. Théorie et applications. Ann Inst
Pasteur 19, 390-410.
Myers, J. and Clark, L. B. (1944). Culture conditions and the development of the
photosynthetic mechanism. Ii. An apparatus for the continuous culture of chlorella. J.
Gen. Physiol, 28,103-112.
Novick, A. (1955). Growth of bacteria. Annu Rev Microbiol, 9, 97-110.
Novick, A. and Szilard, L. (1950). Description of the chemostat. Science, 112, 715-
716.
Oren, A. (1986). Intracellular salt concentrations of the anaerobic halophilic
eubacteria haloanaerobium praevalens and halobacteroides halobius Canadian
Journal of Microbiology, 32, 4-9.
References
92
Oren, A. (1999). Bioenergetic aspects of halophilism. Microbiol Mol Biol Rev, 63,
334-348.
Oren, A. (2008). Microbial life at high salt concentrations: Phylogenetic and
metabolic diversity. Saline Systems, 4:2.
Oren, A. and Mana, L. (2002). Amino acid composition of bulk protein and salt
relationships of selected enzymes of salinibacter ruber, an extremely halophilic
bacterium. Extremophiles, 6, 217-223.
Perez-Arellano, I., Rubio, V. And Cervera, J. (2005). Dissection of Escherichia coli
glutamate 5-kinase: Functional impact of the deletion of the PUA domain. FEBS Lett,
579, 6903-6908.
Ramos-Cormenzana, A. (1989). Ecological distribution and biotechnological
potential of halophilic microorganisms. In Microbiology of Erfreme Environments and
its Pofential for Biotechnology, eds DaCosta, M.S., Duarte, J.C. & Williams, R.A.D.
London: Elsevier., 289-309.
Roberts, M. F. (2005). Organic compatible solutes of halotolerant and halophilic
microorganisms. Saline Systems, 1, 5.
Rod, M. L., Alam, K. Y., Cunningham, P. R. and Clark, D. P. (1988). Accumulation
of trehalose by Escherichia coli k-12 at high osmotic pressure depends on the
presence of amber suppressors. J Bacteriol, 170, 3601-3610.
Rose, M. R. (1984). Artificial selection on a fitness-component in drosophila
melanogaster. Evolution, 38, 516-526.
Silander, O. K., Tenaillon, O. and Chao, L. (2007). Understanding the evolutionary
fate of finite populations: The dynamics of mutational effects. PLoS Biol, 5, e94.
Smith, C. J., Deutch, A. H. and Rushlow, K. E. (1984). Purification and
characteristics of a gamma-glutamyl kinase involved in Escherichia coli proline
biosynthesis. J Bacteriol, 157, 545-551.
Ventosa, A., and Nieto, J. J. (1995). Biotechnological applications and potentialities
of halophilic microorganisms. World Journal of Microbiology & Biotechnology 11, 85-
94.
References
93
Ventosa, A., Nieto, J. J. and Oren, A. (1998). Biology of moderately halophilic
aerobic bacteria. Microbiol Mol Biol Rev, 62, 504-544.
Von Scheibner, M. (2006). Experimentelle Evolution von Halotoleranz in Escherichia
coli, Diplomarbeit, Freie Universität Berlin.
Wahl, L. M. and Gerrish, P. J. (2001). The probability that beneficial mutations are
lost in populations with periodic bottlenecks. Evolution, 55, 2606-2610.
Weber, H., Polen, T., Heuveling, J., Wendisch, V. F. and Hengge, R. (2005). Genome-wide analysis of the general stress response network in Escherichia coli:
Sigma S-dependent genes, promoters, and sigma factor selectivity. J Bacteriol, 187,
1591-1603.
Weichart, D., Querfurth, N., Dreger, M. and Hengge-Aronis, R. (2003). Global role
for clpP-containing proteases in stationary-phase adaptation of Escherichia coli. J
Bacteriol, 185, 115-125.
Whatmore, A. M., Chudek, J. A. and Reed, R. H. (1990). The effects of osmotic
upshock on the intracellular solute pools of Bacillus subtilis. J Gen Microbiol, 136,
2527-2535.
Wood, J. M., Bremer, E., Csonka, L. N., Kraemer, R., Poolman, B., Van Der Heide, T. and Smith, L. T. (2001). Osmosensing and osmoregulatory compatible
solute accumulation by bacteria. Comp Biochem Physiol A Mol Integr Physiol, 130,
437-460.
Zaccai, G., and Eisenberg, H. (1990). Halophilic proteins and the influence of
solvent on protein stabilization. Trends Biochem Sci, 15, 333-337.
Erklärung
94
Erklärung
Hiermit versichere ich, dass ich die Dissertation mit dem Titel "Experimental
evolution of halotolerance in Escherichia coli" selbstständig und ohne unerlaubte
Hilfsmittel angefertigt habe.
Berlin, den 17.06.2011
........................................
Mohammed Khlaf