Embed Size (px)
Citation preview
Page 1 of 47
UNIVERSITY OF NAIROBI
FACULTY OF ENGINEERING
DEPARTMENT OF ELECTRICAL AND INFORMATION ENGINEERING
ULTRA-WIDEBAND (UWB) MODEM FOR WIRELESS BODY AREA NETWORK(WBAN) APPLICATIONS
PROJECT INDEX: PRJ 063
BY
ONYANGO BEN SEWE
F17/2394/2009
SUPERVISOR: PROF. V K ODUOL
EXAMINER: DR. G S O ODHIAMBO
Project report submitted in partial fulfillment of the
requirement for the award of the degree
of
Bachelor of Science in ELECTRICAL AND ELECTRONIC ENGINEERING of theUniversity of Nairobi 2014

Page 2 of 47
DEDICATION
To my wonderful family, for their unwavering support throughout my education.
Page 3 of 47
ACKNOWLADGEMENT
First and foremost, I wish to thank the Almighty God for guiding me and being by my side throughout mystudies.
I would like to express my sincere and heartfelt gratitude to my supervisor Prof. Vitalis K Oduol for hisguidance and insight during this project.
I would not forget to express my gratitude to our Telecommunications lecturer Dr G S O Odhiambo foravailing such a bank of knowledge to withdraw from.
Page 4 of 47
DECLARATION AND CERTIFICATION
This is my original work and has not been presented for a degree award in this or any other
university.
………………………………………………………..
ONYANGO BEN SEWE
F17/2394/2009
This report has been submitted to the Department of Electrical and Information Engineering, The
University of Nairobi with my approval as supervisor:
………………………………
PROF. V K ODUOL
Date: ……………………
Page 5 of 47
Table of contents
DEDICATION……………………………………………………………………………..2
ACKNOWLADEMENT……………………………………………………………………3
DECLARETION AND CERTIFICATION…………………………………………………………4
TABLE OF CONTENTS……………………………………………………………………………5
CHAPTER 1 INTRODUCTION……………………………………………………………………7
1.1 Problem Statement
1.2 Project Objectives
CHAPTER 2 LITERATURE REVIEW…………………………………………………………….9
2.1 WBAN……………………………………………………………………………9
2.1.1 Definition
2.1.2 BAN Regulations
2.1.3 BAN Sensing and Monitoring
2.1.4 BAN Applications
2.1.5 BAN Challenges
2.2 Ultra wideband UWB……………………………………………………………..13
2.2.1 Definition
2.2.2 Regulations
2.2.3 Advantages
2.2.4 Applications
2.2.5 Properties of UWB
2.2.6 UWB transmission Channels
2.3 Multiband OFDM Approach……………………………………………………..16
2.3.1 Signal Model
2.3.2 Transceiver model
Page 6 of 47
CHAPTER 3 DESIGN………………………………………………………………………………..19
CHAPTER 4 RESULTS………………………………………………………………………………25
CHAPTER 5 ANALYSIS…………………………………………………………………………….46
CHAPTER 6 CONCLUSIONS AND RECOMMENDATIONS……………………………………..47
Page 7 of 47
ABSTRACT
The major constraints in the design of Wireless Body Area Networks can be attributed to thebattery autonomy, need for high data rate services and low interference from the devicesoperating within the ISM bands. To meet the demand for high data rate services and low powerspectral density to avoid ISM band interference, an Ultra-Wide Band system based technologyhas been proposed.
This paper focuses on the design and demonstration of an Ultra-wide Band modem to be used inthe Body Area Network (BAN) applications and the evaluation of its performance in a near- realworld scenarios affected by noise interference and multi path fading.
It also highlights the various applications of Body Area Network.
Page 8 of 47
CHAPTER 1
INTRODUCTION
The advancement in technology can also be seen in miniaturization of electronic devices,sensors, battery and wireless communication, which have led to the development of WirelessBody Area Networks (WBAN). Wireless body area network in simple terminology, can bedescribed as a network around the body which consist of smart miniaturized devices that are ableto sense, process and communicate.[1]
Typical body area network kits consist of battery, sensor, signal processor, and a transceiver [1](modem). A modem is a device that modulates an analog signal, encode the signal then transmit,similarly it receives the signal, decodes it and demodulate it. The main objective of a transceiveris to produce a signal that can be transmitted easily and then decoded to produce the originalsignal.
Ultra-wideband (UWB) technology provides the high rate of data transmission due to itsrelatively large bandwidth of transmission. According to ITU-R, UWB spans a frequency rangeof 3.1GHz to 10.6GHz with a transmission bandwidth of more than 20% of its centre frequencyi.e. more than 500MHz. Based on this transmission bandwidth, it can be seen that the whiteGaussian channel capacity of a UWB system is large for a given SNR according to HartleyShannon law.[6]
1.1 Problem statement
The major constraint in the design of BAN is the battery autonomy, high data rate services andinterference from the devices operating within the ISM bands. To meet the demand for high datarate services and low power spectral density to avoid ISM band interference, an Ultra-WideBand system based technology has been proposed.
1.2 Project objective
The objectives of this project were to study the ultra-wideband wireless communication systems,wireless body area network (BAN) applications and then design and demonstrate a modem to beused in those applications.
Page 9 of 47
CHAPTER 2
LITERATURE REVIEW
2.1 WIRELESS BODY AREA NETWORKS (WBAN)
2.1.1 Definition
Wireless Body Area network (WBAN) or simply BAN is defined as a network of wearablecomputing devices. In particular the network consists of several miniaturized body sensor units(BSUs) placed at different points on the body referred to as nodes, and a single body central unit(BCUs) that acts as the hub for the network [3].
2.1.2 BAN Regulation
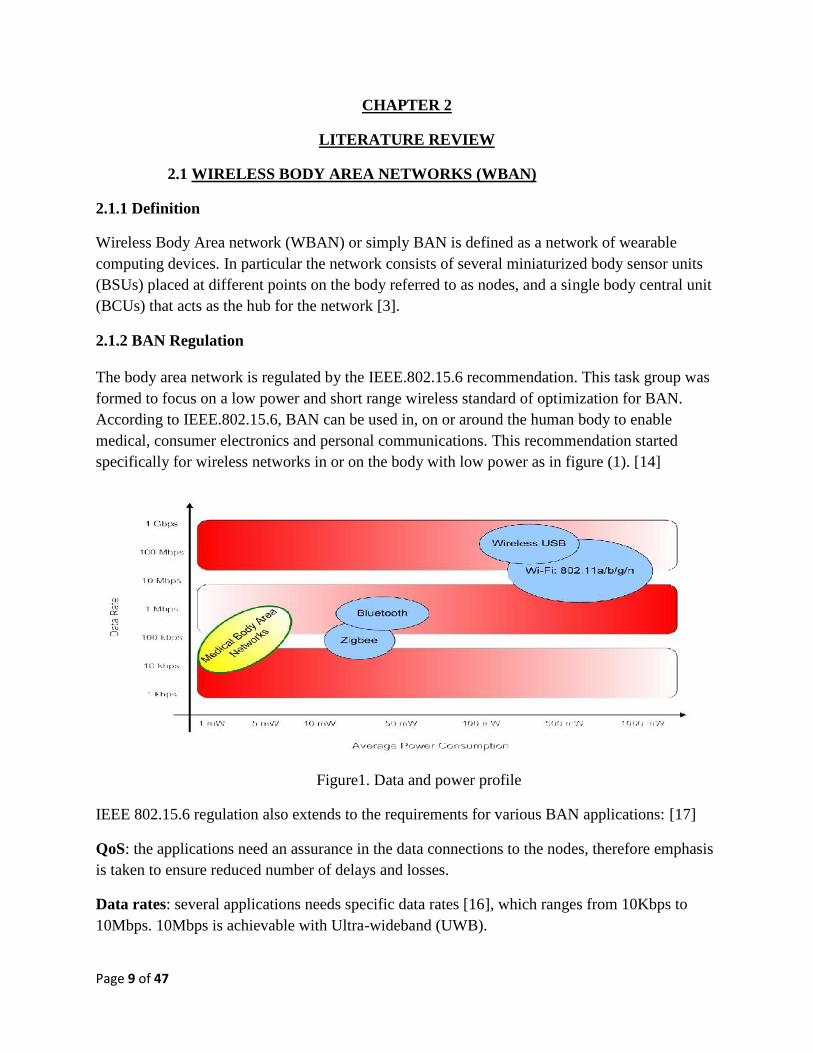
The body area network is regulated by the IEEE.802.15.6 recommendation. This task group wasformed to focus on a low power and short range wireless standard of optimization for BAN.According to IEEE.802.15.6, BAN can be used in, on or around the human body to enablemedical, consumer electronics and personal communications. This recommendation startedspecifically for wireless networks in or on the body with low power as in figure (1). [14]
Figure1. Data and power profile
IEEE 802.15.6 regulation also extends to the requirements for various BAN applications: [17]
QoS: the applications need an assurance in the data connections to the nodes, therefore emphasisis taken to ensure reduced number of delays and losses.
Data rates: several applications needs specific data rates [16], which ranges from 10Kbps to10Mbps. 10Mbps is achievable with Ultra-wideband (UWB).
Page 10 of 47
Security: secure transmission is needed for sensitive data. [16]
2.1.3 BAN sensing and monitoring
The BAN monitoring is done by special sensors located at various locations on the body. Thesensors are of two categories: wearable and implanted [1]
2.1.3a Wearable sensors
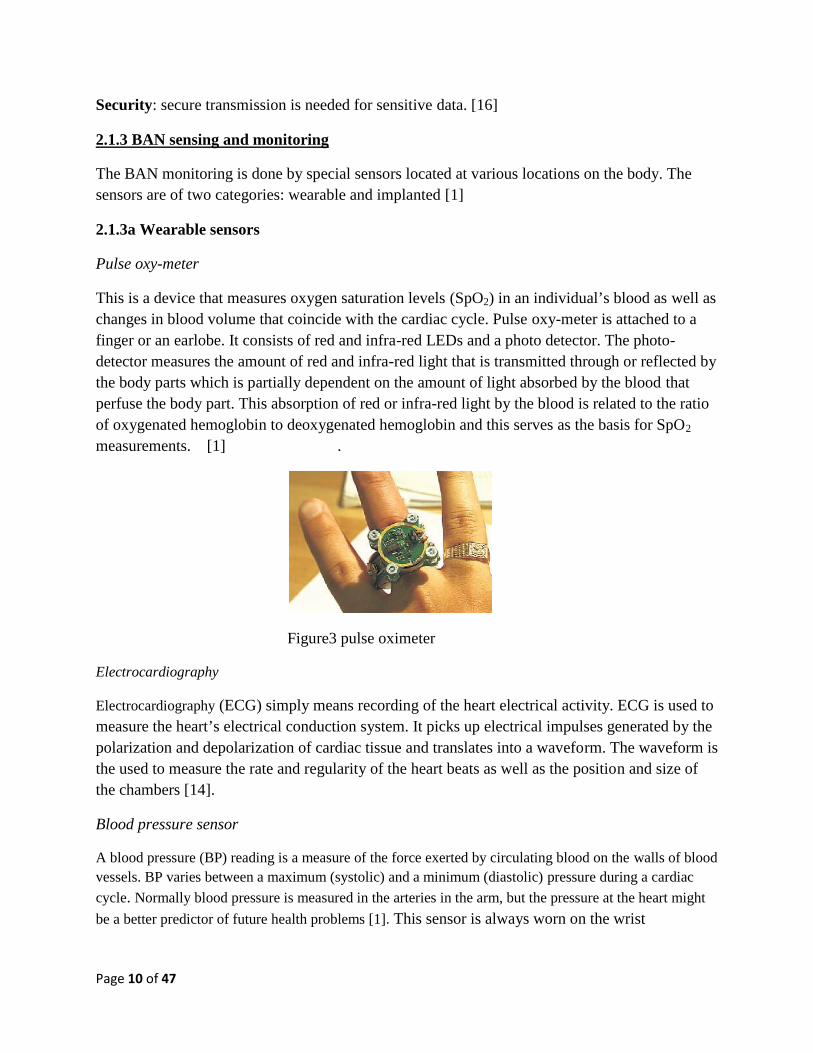
Pulse oxy-meter
This is a device that measures oxygen saturation levels (SpO2) in an individual’s blood as well aschanges in blood volume that coincide with the cardiac cycle. Pulse oxy-meter is attached to afinger or an earlobe. It consists of red and infra-red LEDs and a photo detector. The photo-detector measures the amount of red and infra-red light that is transmitted through or reflected bythe body parts which is partially dependent on the amount of light absorbed by the blood thatperfuse the body part. This absorption of red or infra-red light by the blood is related to the ratioof oxygenated hemoglobin to deoxygenated hemoglobin and this serves as the basis for SpO2
measurements. [1] .
Figure3 pulse oximeter
Electrocardiography
Electrocardiography (ECG) simply means recording of the heart electrical activity. ECG is used tomeasure the heart’s electrical conduction system. It picks up electrical impulses generated by thepolarization and depolarization of cardiac tissue and translates into a waveform. The waveform isthe used to measure the rate and regularity of the heart beats as well as the position and size ofthe chambers [14].
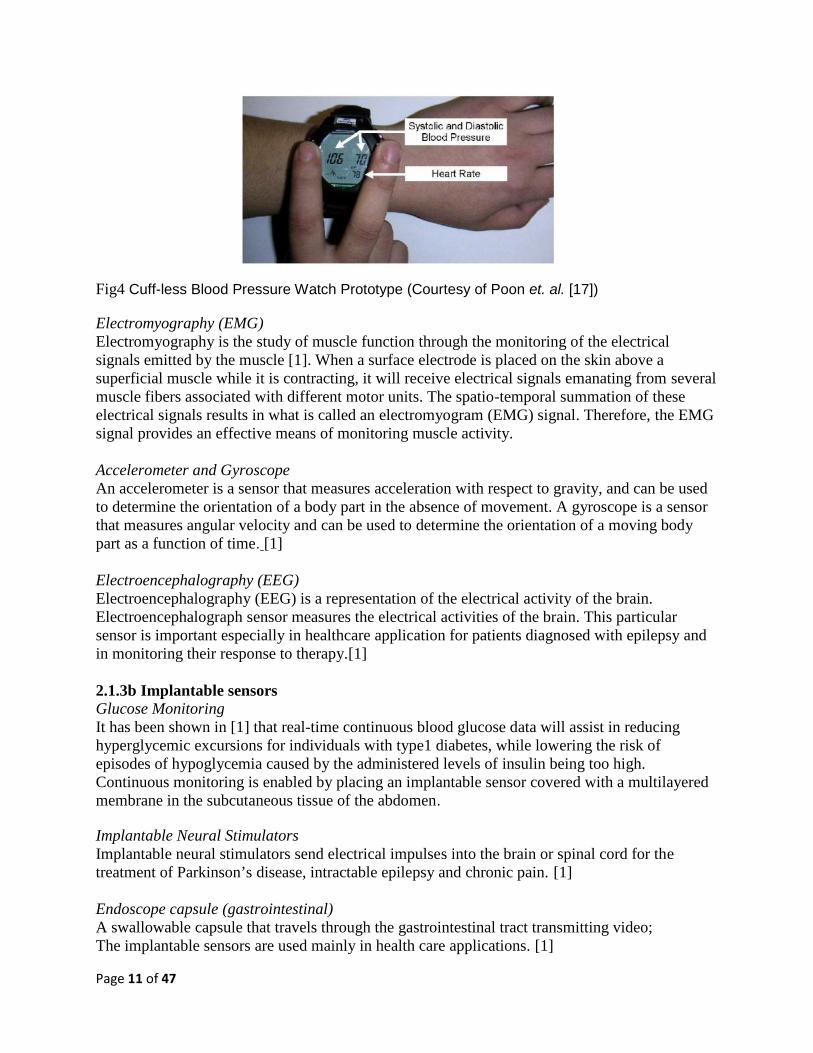
Blood pressure sensor
A blood pressure (BP) reading is a measure of the force exerted by circulating blood on the walls of bloodvessels. BP varies between a maximum (systolic) and a minimum (diastolic) pressure during a cardiac
cycle. Normally blood pressure is measured in the arteries in the arm, but the pressure at the heart might
be a better predictor of future health problems [1]. This sensor is always worn on the wrist
Page 11 of 47
Fig4 Cuff-less Blood Pressure Watch Prototype (Courtesy of Poon et. al. [17])
Electromyography (EMG)Electromyography is the study of muscle function through the monitoring of the electricalsignals emitted by the muscle [1]. When a surface electrode is placed on the skin above asuperficial muscle while it is contracting, it will receive electrical signals emanating from severalmuscle fibers associated with different motor units. The spatio-temporal summation of theseelectrical signals results in what is called an electromyogram (EMG) signal. Therefore, the EMGsignal provides an effective means of monitoring muscle activity.
Accelerometer and GyroscopeAn accelerometer is a sensor that measures acceleration with respect to gravity, and can be usedto determine the orientation of a body part in the absence of movement. A gyroscope is a sensorthat measures angular velocity and can be used to determine the orientation of a moving bodypart as a function of time. [1]
Electroencephalography (EEG)Electroencephalography (EEG) is a representation of the electrical activity of the brain.Electroencephalograph sensor measures the electrical activities of the brain. This particularsensor is important especially in healthcare application for patients diagnosed with epilepsy andin monitoring their response to therapy.[1]
2.1.3b Implantable sensorsGlucose MonitoringIt has been shown in [1] that real-time continuous blood glucose data will assist in reducinghyperglycemic excursions for individuals with type1 diabetes, while lowering the risk ofepisodes of hypoglycemia caused by the administered levels of insulin being too high.Continuous monitoring is enabled by placing an implantable sensor covered with a multilayeredmembrane in the subcutaneous tissue of the abdomen.
Implantable Neural StimulatorsImplantable neural stimulators send electrical impulses into the brain or spinal cord for thetreatment of Parkinson’s disease, intractable epilepsy and chronic pain. [1]
Endoscope capsule (gastrointestinal)A swallowable capsule that travels through the gastrointestinal tract transmitting video;The implantable sensors are used mainly in health care applications. [1]
Page 12 of 47
2.1.4 BAN applications
Healthcare applicationsThese applications are typically associated with low data rates needed to communicate vital dataabout human health e.g. heart rate, brain activity, blood pressure, muscle activity, blood sugarlevel, body temperature, levels of oxygen in the blood, motion etc. the BAN allows reliablemonitoring and data transfer for patients without interfering with their mobility [1]. [2] [4] [5]
Military applicationsIn the military, a battle dress uniform is integrated with a BAN that connects devices such as lifesupport sensors, cameras, and health monitoring GPS. These devices relay real time information.Future advancements will include missile detection sensors and this will indeed revolutionizewarfare.[1] [2] [4] [5]
Lifestyle and sportsLifestyle and sports are revolutionized since new services like wearable entertainment systems,navigation support in the car or while walking, museum or city guide, heart rate and performancemonitoring in sports using muscle activity sensors are made possible by the BAN technology.
Monitoring of persons operating in harsh or hostile environmentsThere are professions or jobs that require the integration of BAN, for example, miners, firefighters, etc to monitor their health and also improve the general working conditions.
2.1.5 BAN challenges
Cost: Today's consumers expect low cost health monitoring solutions which provide highfunctionality. WBAN implementations will need to be cost optimized to be appealingalternatives to health conscious consumers.[12] [17]
Consistent performance: The performance of the WBAN should be consistent. Sensormeasurements should be accurate and calibrated even when the WBAN is switched off andswitched on again. The wireless links should be robust and work under various userenvironments [12] [17]
Interference: The wireless link used for body sensors should reduce the interference andincrease the coexistence of sensor node devices with other network devices available in theenvironment. This is especially important for large scale implementation of WBAN systems [12][17]
Invasion of privacy: People might consider the WBAN technology as a potential threat tofreedom, if the applications go beyond "secure" medical usage. Social acceptance would be keyto this technology finding a wider application.[12] [17]
System devices: The sensors used in WBAN would have to be low on complexity, small in formfactor, light in weight, power efficient, easy to use and reconfigurable. Further, the storage
Page 13 of 47
devices need to facilitate remote storage and viewing of patient data as well as access to externalprocessing and analysis tools via the internet [12] [17]
2.2. ULTRA-WIDEBAND2.2.1 DefinitionUWB is defined as a system signal that occupies a bandwidth greater than 500MHz or 25% ofthe center frequency. This is given as
Fractional bandwidth = ≥ 0.25 where center frequency fc = Hz
Where is the upper frequency limit and is the lower frequency limit for that particularfrequency band.[6]ITU-R defines UWB as technology for short-range radio communication, involving theintentional generation and transmission of radio-frequency energy that spreads over a very largefrequency range, which may overlap several frequency bands allocated to radio communicationservices. Devices using UWB technology typically have intentional radiation from the antennawith either a –10 dB bandwidth of at least 500 MHz or a –10 dB fractional bandwidth greaterthan 0.2
2.2.2 UWB regulations
Ultra-wideband technology is governed by several international bodies, but of interest is theITU-R which restricts the UWB frequency band as from 3.1GHz. Federal CommunicationsCommission (FCC) in the USA allows the UWB technology to operate in the unlicensed 3.1GHzto 10.6GHz. These bodies also specifies the power spectral density mask for the UWB to be -41.3dBm/MHz [6]
2.2.3Advantages of UWB
Principal advantages of UWB can be summarized as follows:[6]
Potential for high data rates. The high data rates are obtained from the extremely largebandwidth yielding high theoretical capacity.
Extensive multipath diversity. The ultra-short duration of the UWB waveforms gives riseto a finer resolution of reflected pulses at the receiver hence low susceptibility tomultipath interference.
Potential small size and processing power with low equipment cost
Very low power density leads to low probability of signal detection. The low powerdensity is obtained through the radio regulation emission masks
UWB systems are suitable for coexistence with the already existing narrow bandtechnologies
Page 14 of 47
2.2.4 UWB applicationsUWB offers potential for deployment of two basic communication systems:
High data rate short range communications eg high data rate wireless personal areanetworks (WPAN). An example of WPAN application is the high speed universal serialbus (WUSB) connectivity for PCs
Low data rate and location e.g. sensor, positioning and identification networks.
It is of a particular interest to note that, UWB can trade a reduction in data rate for an increase intransmission range. [6]
2.2.6 Basic properties of UWB[10]Power spectral densityGenerally considered to be low and is given by= ( )( )This means that the energy is spread out over a very large bandwidth hence low PSD.
Pulse shapeUWB pulses are typically of nanosecond or picoseconds order. A fast switching on and off leadsto a pulse that is not rectangular but has edges smoothed off. This approximates Gaussianfunction curve
Pulse trainsInformation needs to be modulated onto a sequence of pulses called pulse trains. When pulsesare sent at regular intervals, the resulting spectrum will contain peaks of power at certainfrequencies. These peaks of power are called comb lines and they limit the total transmit power.This effect is minimized by making the spectrum more noise like i.e. adding a small randomoffset to each pulse.
Spectral masksUWB systems cover a large spectrum and interface with existing users. In order to keep thisinterference to a minimum, the regulatory groups specify the spectral mask for differentapplications which shows the allowed power output for specific frequencies
Penetration characteristics
UWB pulses are composed of large range of frequencies. The penetration capability is thereforenoted to decrease with the higher frequencies. This means that, the higher frequency waves willhave more of their energy reflected from walls and doors since their wavelengths are muchshorter.
Spatial and Spectral capacities
Page 15 of 47
Spatial capacity is measured in bits/second/square meter. Spatial capacity is calculated as= ( )( )While spectral capacity is calculated as= ( )( )Since UWB systems have a large bandwidth, it therefore has very low spectral capacitycompared with the existing systems.
Speed of data transmission
UWB communications are targeting the range of 100-500Mbps. The lower speeds of close to100Mbps are for a target of a minimum distance of 10m, above 200Mbps for not less than 4m,and 480Mbps has no fixed minimum distance
2.2.6 UWB Transmission Schemes
The transmission schemes can be categorized into two:
Single band approach
Multi-band approach
2.2.6a Single band approach
This scheme employs carrier free or impulse radio communication. Impulse radio refers a generation of
series of impulse like waveforms each of duration in the order of hundreds of picoseconds. Data couldbe modulated using PAM, PPM, OOK and PSK, and multiple users could be supported via theuse of time-hopping or direct-sequence spreading approaches [6]
This approach treats the whole frequency span of 7.5GHz (3.1GHz to 10.6GHz) as a wholetransmission bandwidth. And therefore exploits Shannon principle to a greater degree.
Channel capacity = (1 + )This scheme suffers from certain drawbacks such as:
Building RF and analog circuits as well as high speed ADC to process the largebandwidth signal is challenging and requires high power consumption
Less flexible with regard to foreign spectral regulation and may be too broadband ifforeign governments choose to limit their UWB spectral allocations.
Page 16 of 47
2.2.6b Multiband approach
This scheme divides the frequency band from 3.1 to 10.6GHz into several smaller bands calledsubbands. Each subband occupies a bandwidth of at least 500MHz in conformity with the ITU-Rrecommendations.
The transmitted symbols are interleaved across subbands therefore the multiband approach canmaintain the power being transmitted as if a large BW were being utilizedThis approach uses the OFDM as the modulation scheme.Advantages of multiband approach
Ability for a fine grained control of the PSD so as to maximize the power transmittedwhile meeting the spectral mask
Allows for peaceful coexistence with a flexible spectral coverage, and is easier to adapt todifferent world wide regulatory environment.
Processing over a smaller bandwidth eases the requirement on ADC sampling rates andconsequently facilitates greater digital processing
Using the OFDM as a modulation scheme, reduces the effect of inter symbol interference(ISI)
This scheme suffers from a complex transceiver design2.3 MULTIBAND OFDM APPROACH
OFDM relies on splitting the information to be transmitted over a large number of carriers insuch a way that the signaling rate on each of them becomes significantly longer than the echodelay period
The multiband OFDM approach is one of the leading proposals of IEEE 802.15.3a standards tocapture the multipath energy efficiently by using OFDM technique to modulate information oneach subband. The OFDM symbols are then interleaved over different subbands across both timeand frequency.2.3.1 Signal model
The available UWB spectrum is divided into S subbands with a BW>500MHz. The OFDM hasN subcarriers and the OFDM symbols are then transmitted over one of the S subbands. EachOFDM symbol ( ) is constructed using an IFFT as( ) = ( )exp ( 2 ∆ )Where ( )is the complex coefficient to be transmitted in subcarrier n during the kth OFDMsymbol period and ∆ = BW/N is the frequency spacing between the adjacent carriersThe resulting waveform has duration of = 1/∆ . The cyclic prefix of length isappended in order to mitigate the effect of multipath interference. Also a guard interval isused to provide sufficient time for switching between bands.The symbol duration = + +
Page 17 of 47
The complex baseband signal ( ) is modulated to RF signal with a carrier frequency . Thetransmitted RF signal ( ) is given as( ) = ∑ { ( − )exp ( 2 )}According to the IEEE 802.15.3a WPAN standard proposal,UWB signal is shaped so that it occupies only 528MHz of bandwidthThis allows 14 such signals to cover the entire 7.5GHz band. OFDM allows each UWB band tobe divided into a set of orthogonal narrowband channels with a much longer symbol periodduration. QPSK is used to modulate the transmitter signal at the subcarriers due to the limitationon transmitter power.
IEEE 802.15.3a timing parameters:[6]OFDM sub carriers 128
Data sub carriers 100
Number of defined pilot sub carriers 12∆ sub carrier frequency spacing (528MHz/128)=4.125MHz= 1/∆ . 242.42ns: cyclic prefix (32/528MHz)= 60.61ns
: guard interval (5/528MHz) = 9.47ns= ( + + ) : symbol duration 312.5ns
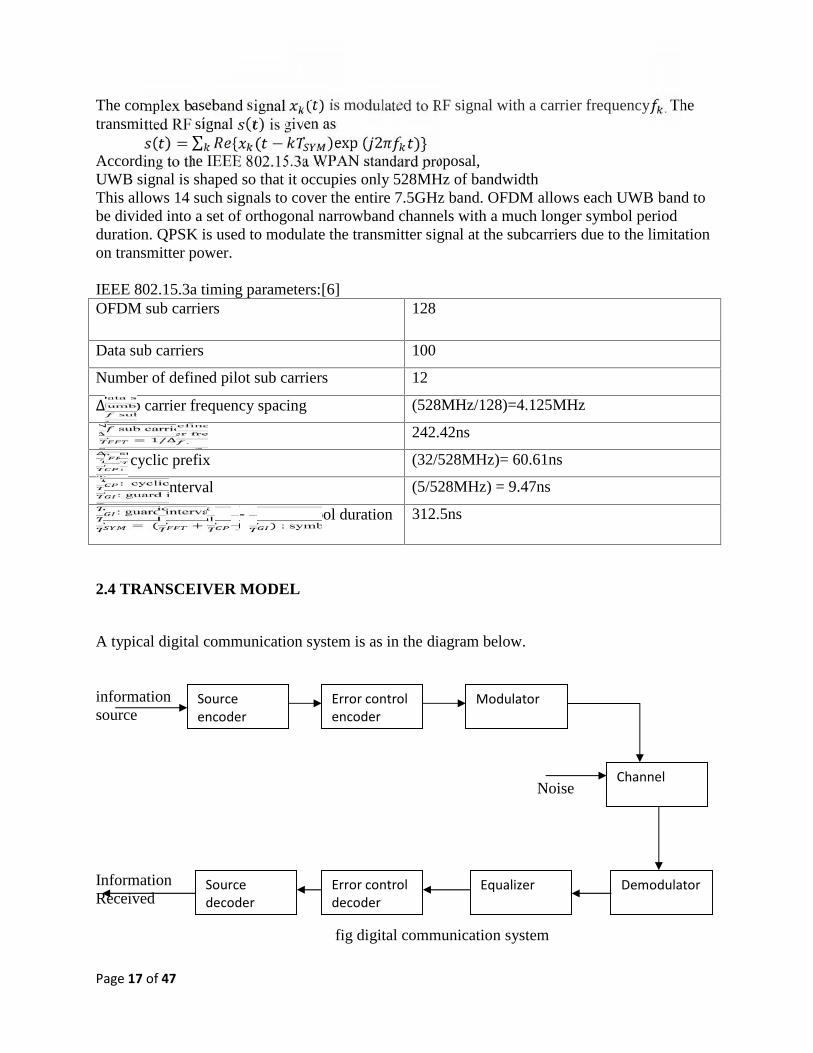
2.4 TRANSCEIVER MODEL
A typical digital communication system is as in the diagram below.
informationsource
Noise
InformationReceived
fig digital communication system
Sourceencoder
Sourcedecoder
Error controldecoder
Equalizer Demodulator
Channel
ModulatorError controlencoder
Page 18 of 47
The source encoder converts the analog signal to digital signal eg the ADC. The forward errorcontrol encoder places extra parity check digits to protect the information from channel error.This parity check digits are used by the decoder to check the errors that might have occurredduring transmission and correct some of them.
The modulator converts the bits to a waveform that is suitable for transmission through thephysical channel. The receiver demodulates the signal that comes out from the channel andconverts the signal into base-band signal.
The equalizer is used to reduce the inter-symbol interference (ISI). The error free output of theARQ is sent to the source decoder for conversion to a suitable form for the information sink.
Page 19 of 47
CHAPTER 3
UWB MODEM DESIGN
Since the BAN sensors have an integrated signal processing chips, the input to the transceiver isin digital form hence no need to include source coding as part of the transceiver design.
The physical UWB transceiver design simulation includes:
Random binary generator
Concatenated codes
QPSK modulator/ demodulator
OFDM transceiver.
Channel
3.1 Random binary generator
The Bernoulli binary generator is used to generate random binary digits using the Bernoullidistribution. It produces a zero bit (0) with a probability of p and a one bit (1) with probability of1-p.
In this case an equiprobable situation is simulated where both ‘0’ and ‘1’ are produced with aprobability of 0.5. The output of this generator is frame based having 256 bits per frame at asampling rate of 1/528MHz
3.2 Concatenated codes
In wireless communications, burst errors occur due to the reflection of the symbols on largesurfaces e.g. buildings, trees, hills etc. in addition to that random errors also occur due to thethermal noise generated in the electronic circuitry [11]. This calls for a coding scheme with alarge codeword length. A serial concatenation of codes is the most commonly used for power-limited systems
In this case a (48, 32, 8) R-S code (outer code) with symbols over GF (2 ) and a (2, 1)convolution code of constraint length 7 was used.
3.2a Reed Solomon coding/decoding
A (48, 32, 8) R-S code over GF (2 ) was obtained by code shortening scheme of puncturing(zero padding) as shown in below in a matlab simulink model
This code corrects up to 8 symbol errors out of the 48 symbols
Page 20 of 47
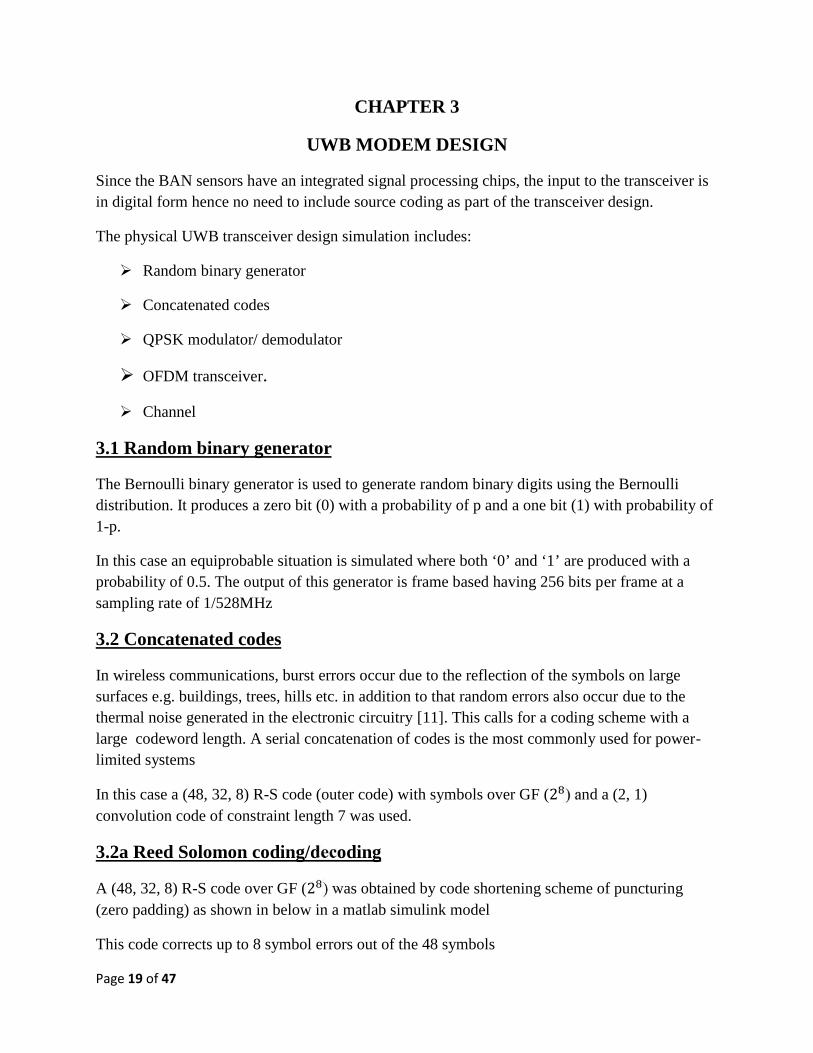
Since R-S encoder is a non binary coding scheme, the 256 bit frame from the Bernoulligenerator is converted to integers using bit to integer converter of M=8,resulting into 32 bytesThis is the input sequence to the R-S encoder subsystem below
Fig3 R-S encoder
The 32 byte sequence is zero padded to 239 message bytes which is then fed to the integer inputR-S encoder.
This block adds 16 parity check bytes to give 255 codeword length. Since we are interested inthe 48 code words, the zero padded 255 code words is passed through a selector to give the 48codewords hence a (48, 32, 8) R-S code achieved from the (255, 239,8) R-S code. The 48 bytesis converted back to binary to give 384 bits which is passed through to the convolution encoder.
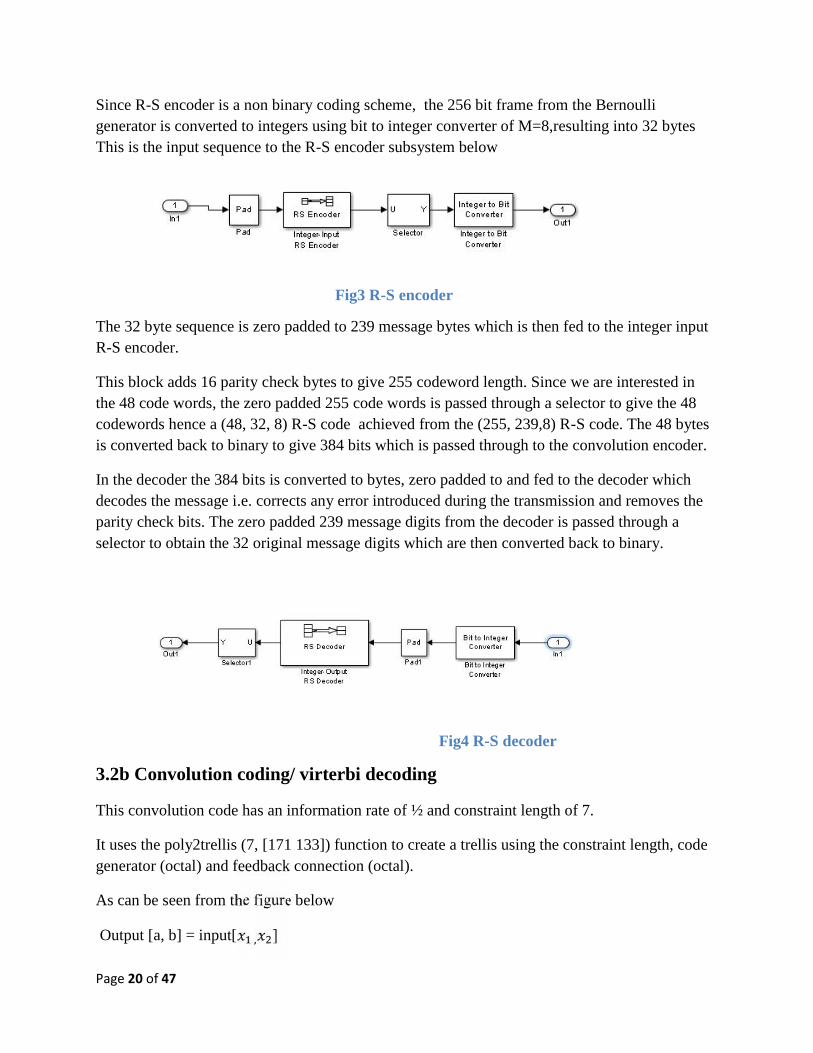
In the decoder the 384 bits is converted to bytes, zero padded to and fed to the decoder whichdecodes the message i.e. corrects any error introduced during the transmission and removes theparity check bits. The zero padded 239 message digits from the decoder is passed through aselector to obtain the 32 original message digits which are then converted back to binary.
Fig4 R-S decoder
3.2b Convolution coding/ virterbi decoding
This convolution code has an information rate of ½ and constraint length of 7.
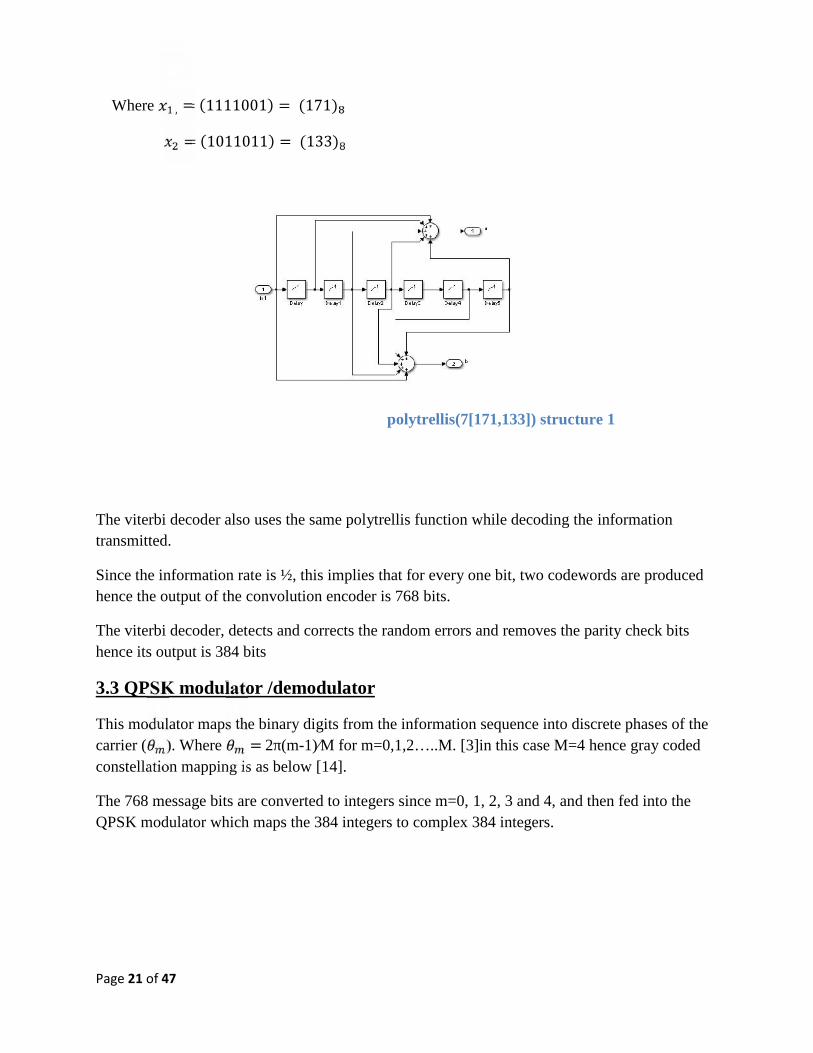
It uses the poly2trellis (7, [171 133]) function to create a trellis using the constraint length, codegenerator (octal) and feedback connection (octal).
As can be seen from the figure below
Output [a, b] = input[ , ]
Page 21 of 47
Where , = (1111001) = (171)= (1011011) = (133)
polytrellis(7[171,133]) structure 1
The viterbi decoder also uses the same polytrellis function while decoding the informationtransmitted.
Since the information rate is ½, this implies that for every one bit, two codewords are producedhence the output of the convolution encoder is 768 bits.
The viterbi decoder, detects and corrects the random errors and removes the parity check bitshence its output is 384 bits
3.3 QPSK modulator /demodulator
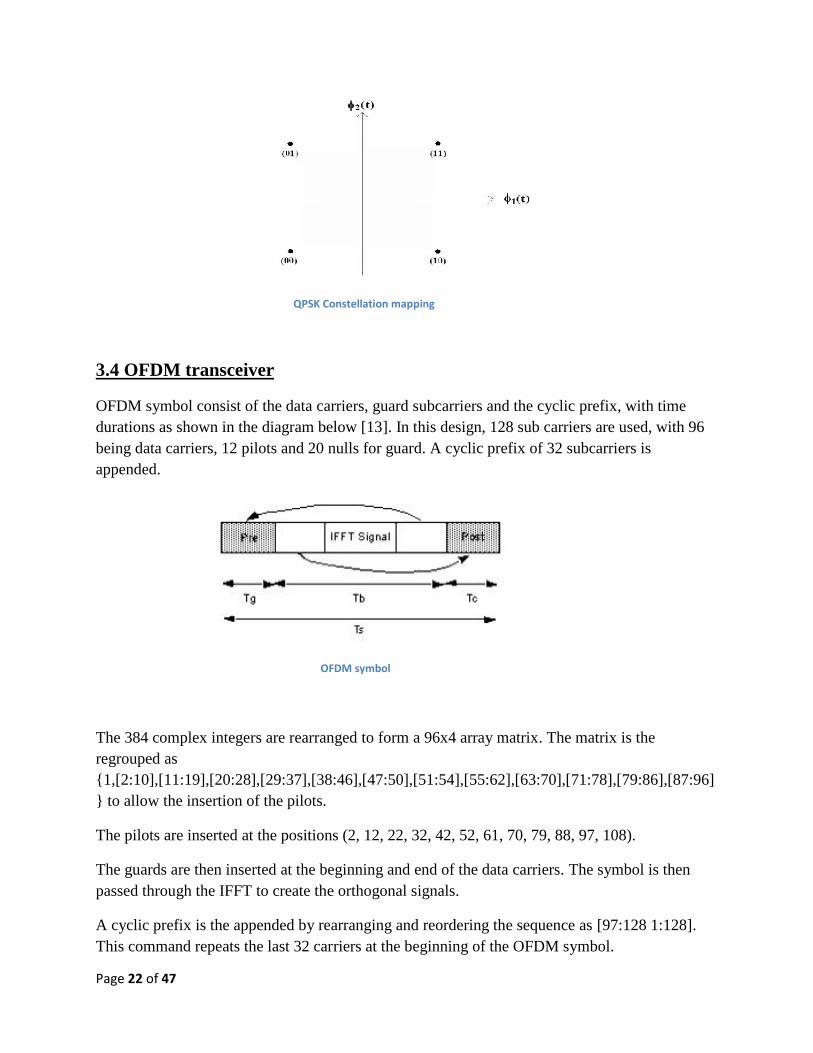
This modulator maps the binary digits from the information sequence into discrete phases of thecarrier ( ). Where = 2π(m-1)⁄M for m=0,1,2…..M. [3]in this case M=4 hence gray codedconstellation mapping is as below [14].
The 768 message bits are converted to integers since m=0, 1, 2, 3 and 4, and then fed into theQPSK modulator which maps the 384 integers to complex 384 integers.
Page 22 of 47
QPSK Constellation mapping
3.4 OFDM transceiver
OFDM symbol consist of the data carriers, guard subcarriers and the cyclic prefix, with timedurations as shown in the diagram below [13]. In this design, 128 sub carriers are used, with 96being data carriers, 12 pilots and 20 nulls for guard. A cyclic prefix of 32 subcarriers isappended.
OFDM symbol
The 384 complex integers are rearranged to form a 96x4 array matrix. The matrix is theregrouped as{1,[2:10],[11:19],[20:28],[29:37],[38:46],[47:50],[51:54],[55:62],[63:70],[71:78],[79:86],[87:96]} to allow the insertion of the pilots.
The pilots are inserted at the positions (2, 12, 22, 32, 42, 52, 61, 70, 79, 88, 97, 108).
The guards are then inserted at the beginning and end of the data carriers. The symbol is thenpassed through the IFFT to create the orthogonal signals.
A cyclic prefix is the appended by rearranging and reordering the sequence as [97:128 1:128].This command repeats the last 32 carriers at the beginning of the OFDM symbol.
Page 23 of 47
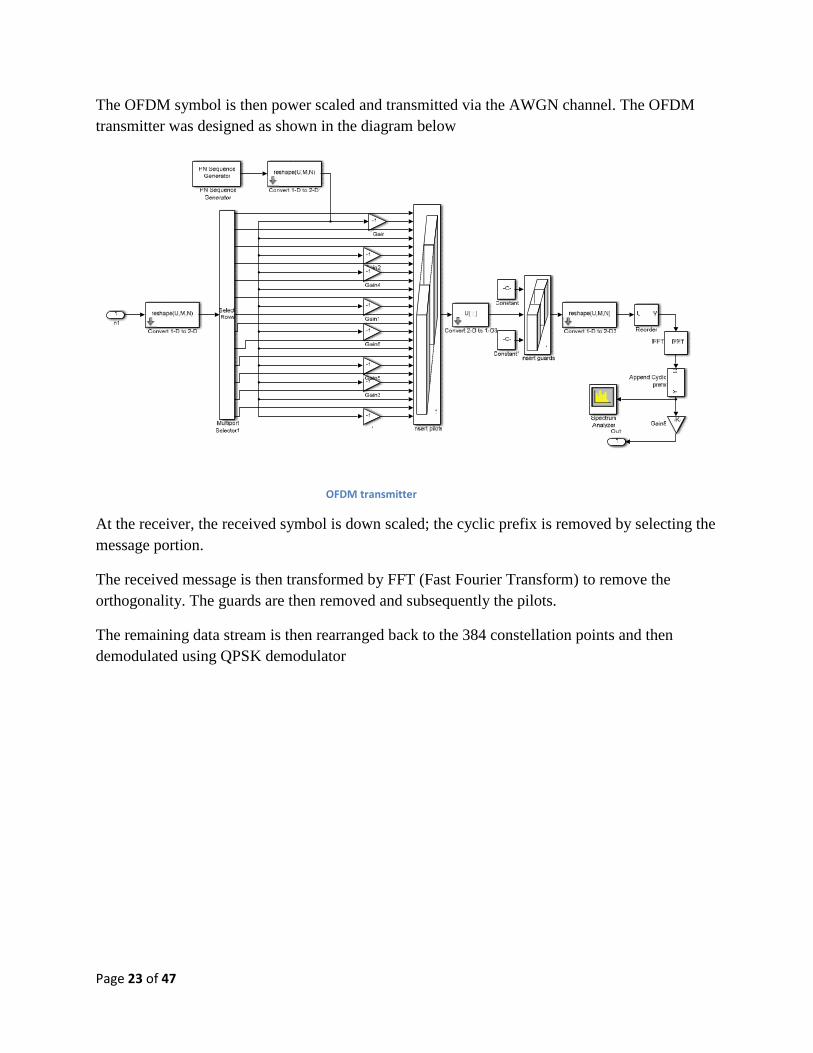
The OFDM symbol is then power scaled and transmitted via the AWGN channel. The OFDMtransmitter was designed as shown in the diagram below
OFDM transmitter
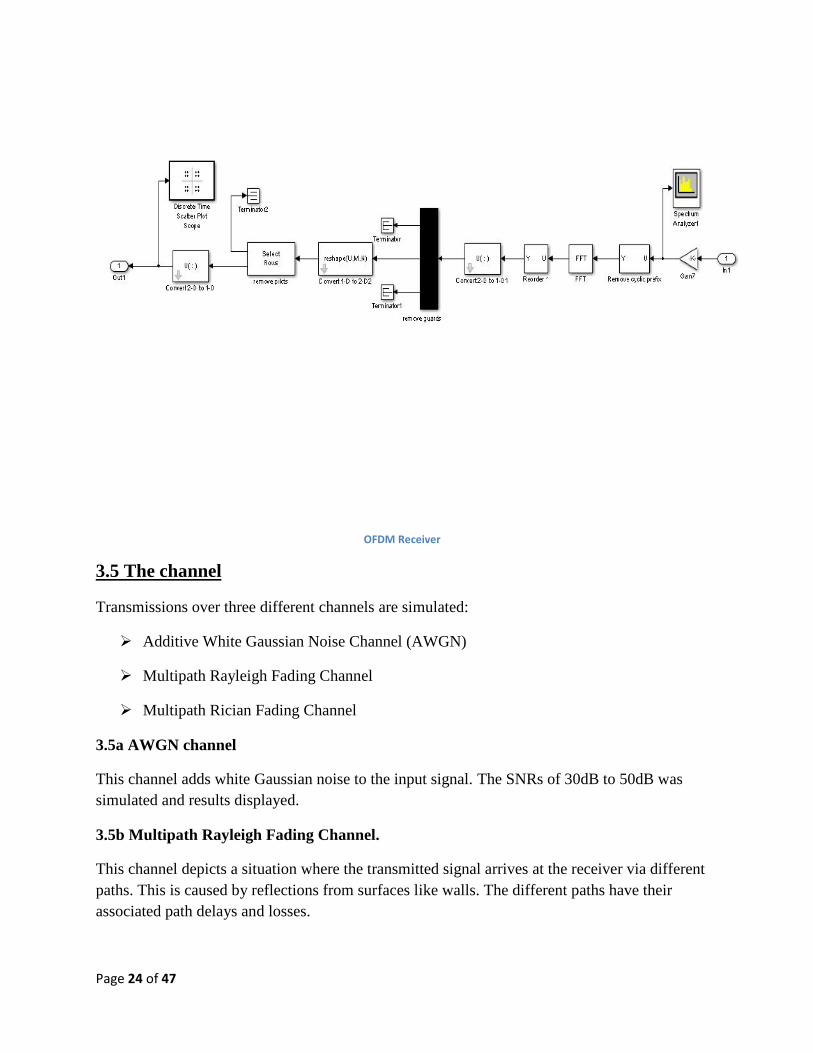
At the receiver, the received symbol is down scaled; the cyclic prefix is removed by selecting themessage portion.
The received message is then transformed by FFT (Fast Fourier Transform) to remove theorthogonality. The guards are then removed and subsequently the pilots.
The remaining data stream is then rearranged back to the 384 constellation points and thendemodulated using QPSK demodulator
Page 24 of 47
OFDM Receiver
3.5 The channel
Transmissions over three different channels are simulated:
Additive White Gaussian Noise Channel (AWGN)
Multipath Rayleigh Fading Channel
Multipath Rician Fading Channel
3.5a AWGN channel
This channel adds white Gaussian noise to the input signal. The SNRs of 30dB to 50dB wassimulated and results displayed.
3.5b Multipath Rayleigh Fading Channel.
This channel depicts a situation where the transmitted signal arrives at the receiver via differentpaths. This is caused by reflections from surfaces like walls. The different paths have theirassociated path delays and losses.
Page 25 of 47
This channel multiplies the input signal by samples of a Rayleigh-distributed complex randomprocess. In this design up to three paths are simulated and the results displayed.
3.5c Multipath Rician Fading Channel
This channel portrays a situation where the transmitted signal can travel to the receiver along adominant line-of-sight or direct path.
Relative motion between the transmitter and receiver causes Doppler shifts in the signalfrequency. In addition to the channel having multiple path delays and fading, the signaltransmitted over this channel experiences changes in the frequency of propagation
In this design up to three paths are simulated and the results displayed.
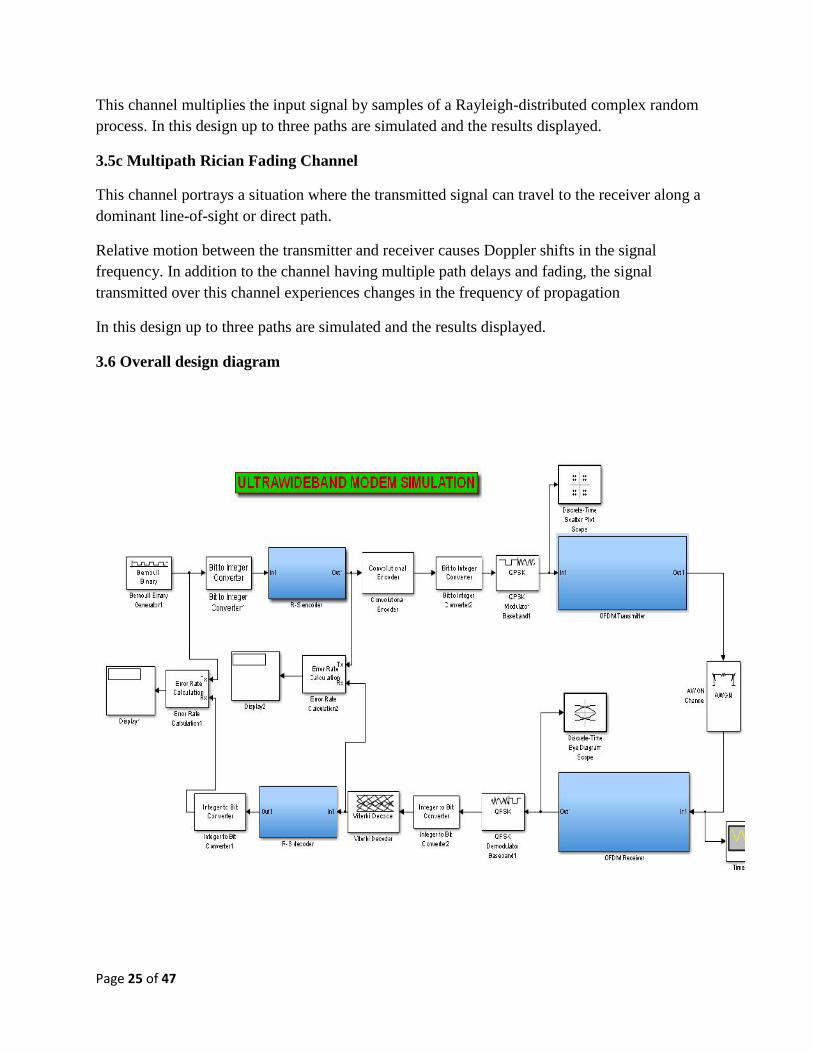
3.6 Overall design diagram
Page 26 of 47
CHAPTER 4
RESULTS
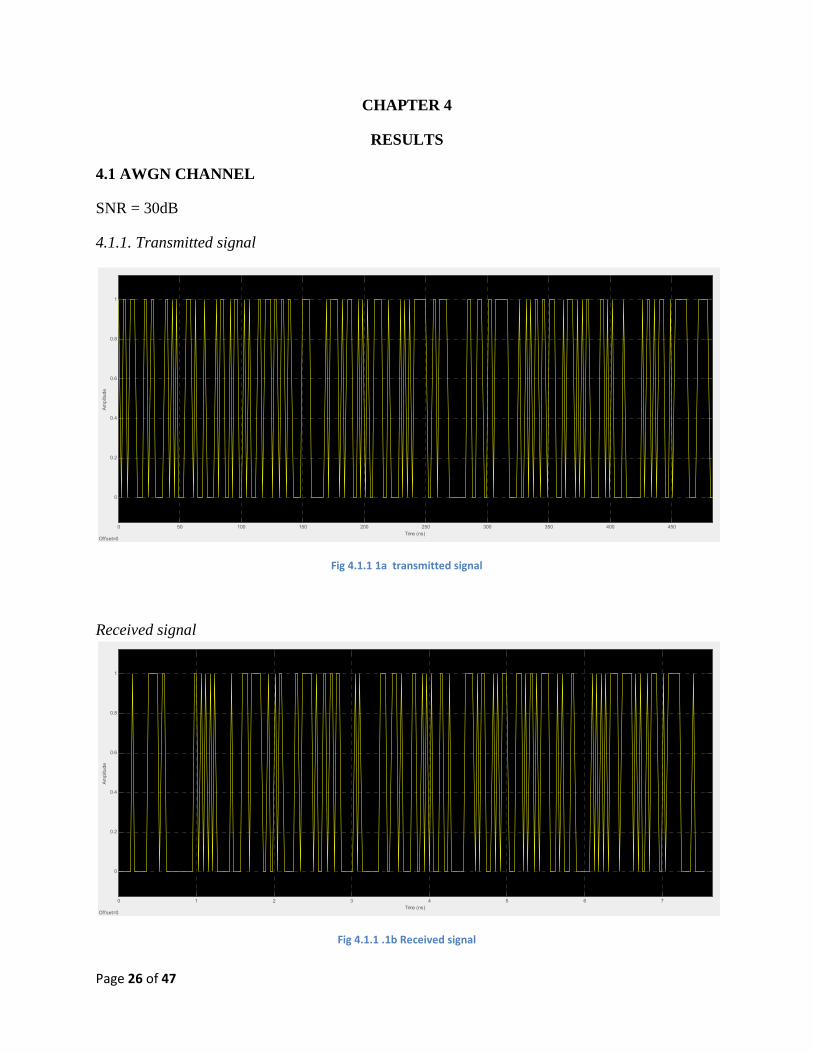
4.1 AWGN CHANNEL
SNR = 30dB
4.1.1. Transmitted signal
Fig 4.1.1 1a transmitted signal
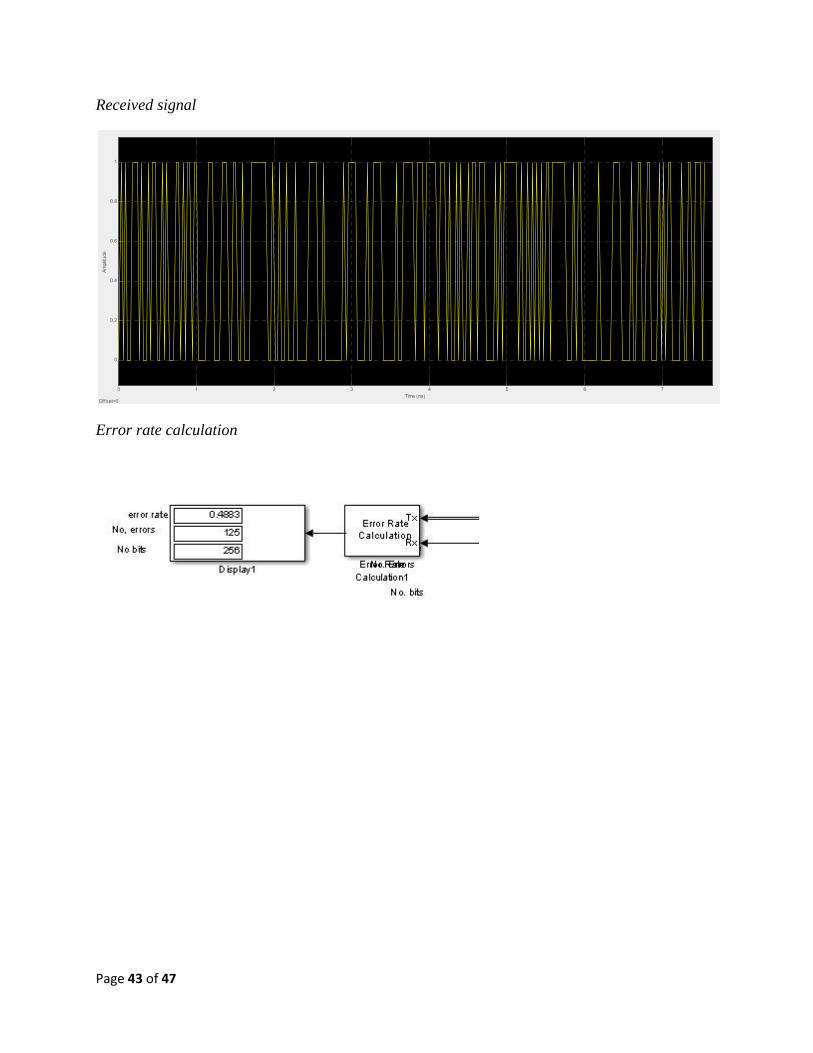
Received signal
Fig 4.1.1 .1b Received signal
0 50 100 150 200 250 300 350 400 450
0
0.2
0.4
0.6
0.8
1
Ampl
itude
Time (ns)Offset=0
0 1 2 3 4 5 6 7
0
0.2
0.4
0.6
0.8
1
Ampl
itude
Time (ns)Offset=0
Page 27 of 47
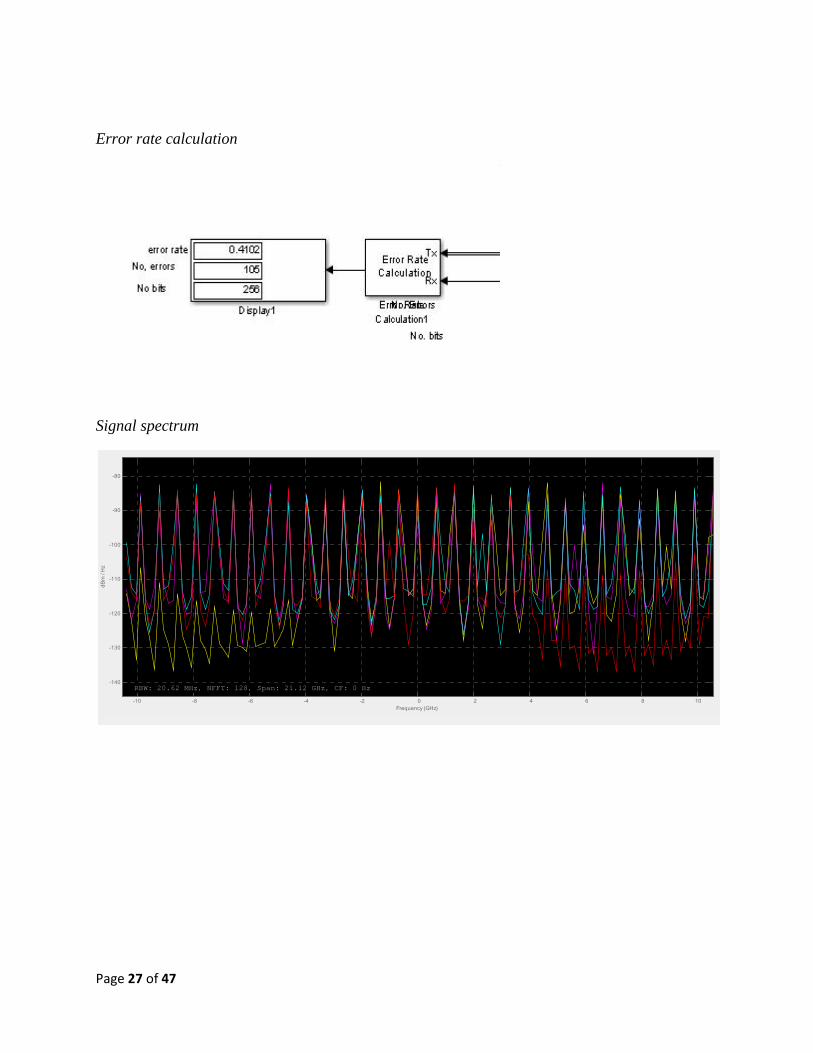
Error rate calculation
Signal spectrum
-10 -8 -6 -4 -2 0 2 4 6 8 10
-140
-130
-120
-110
-100
-90
-80
Frequency (GHz)
dB
m /
Hz
RBW: 20.62 MHz, NFFT: 128, Span: 21.12 GHz, CF: 0 Hz
Page 28 of 47
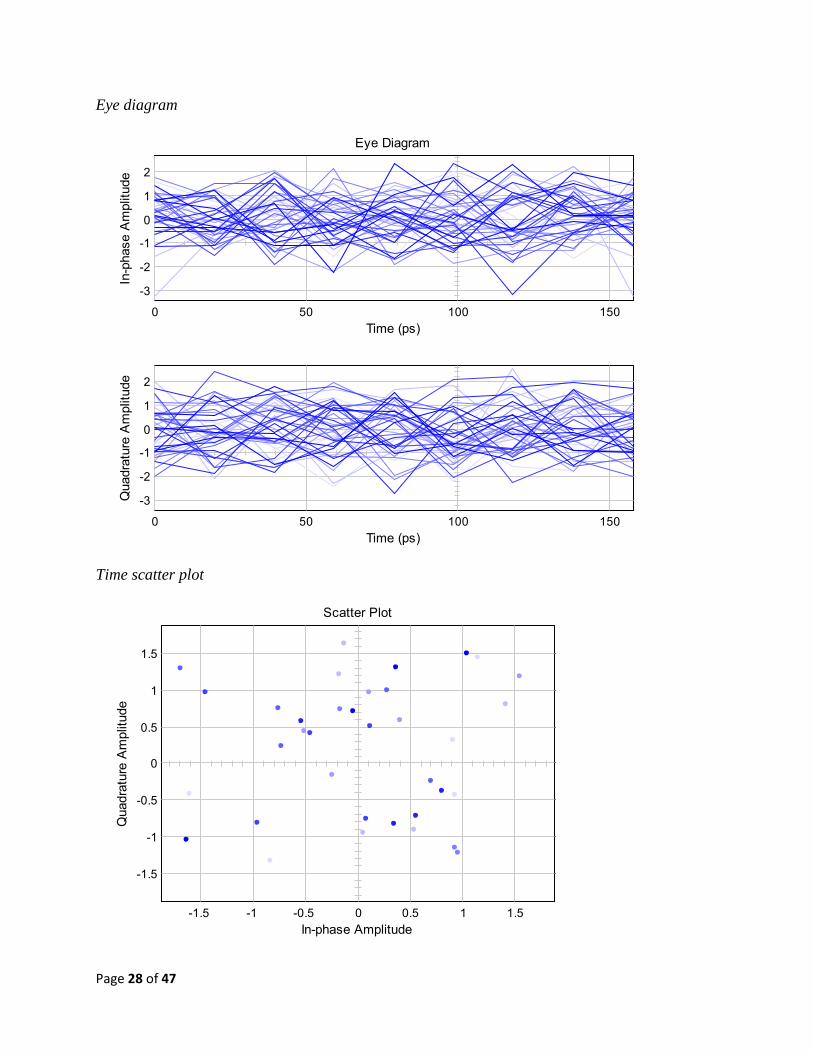
Eye diagram
Time scatter plot
0 50 100 150
-3
-2
-1
0
1
2
Time (ps)
In-p
hase
Am
plitu
deEye Diagram
0 50 100 150
-3
-2
-1
0
1
2
Time (ps)
Qua
drat
ure
Am
plitu
de
-1.5 -1 -0.5 0 0.5 1 1.5
-1.5
-1
-0.5
0
0.5
1
1.5
In-phase Amplitude
Qua
drat
ure
Am
plitu
de
Scatter Plot
Page 29 of 47
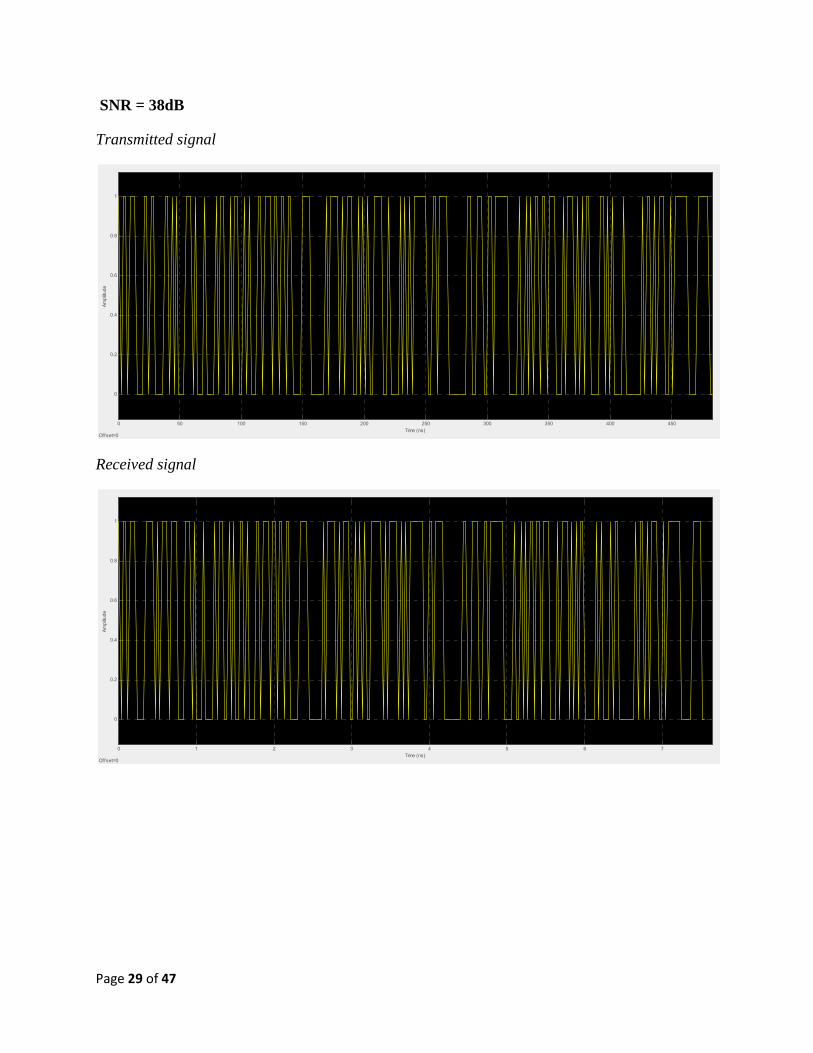
SNR = 38dB
Transmitted signal
Received signal
0 50 100 150 200 250 300 350 400 450
0
0.2
0.4
0.6
0.8
1
Ampl
itude
Time (ns)Offset=0
0 1 2 3 4 5 6 7
0
0.2
0.4
0.6
0.8
1
Ampl
itude
Time (ns)Offset=0
Page 30 of 47
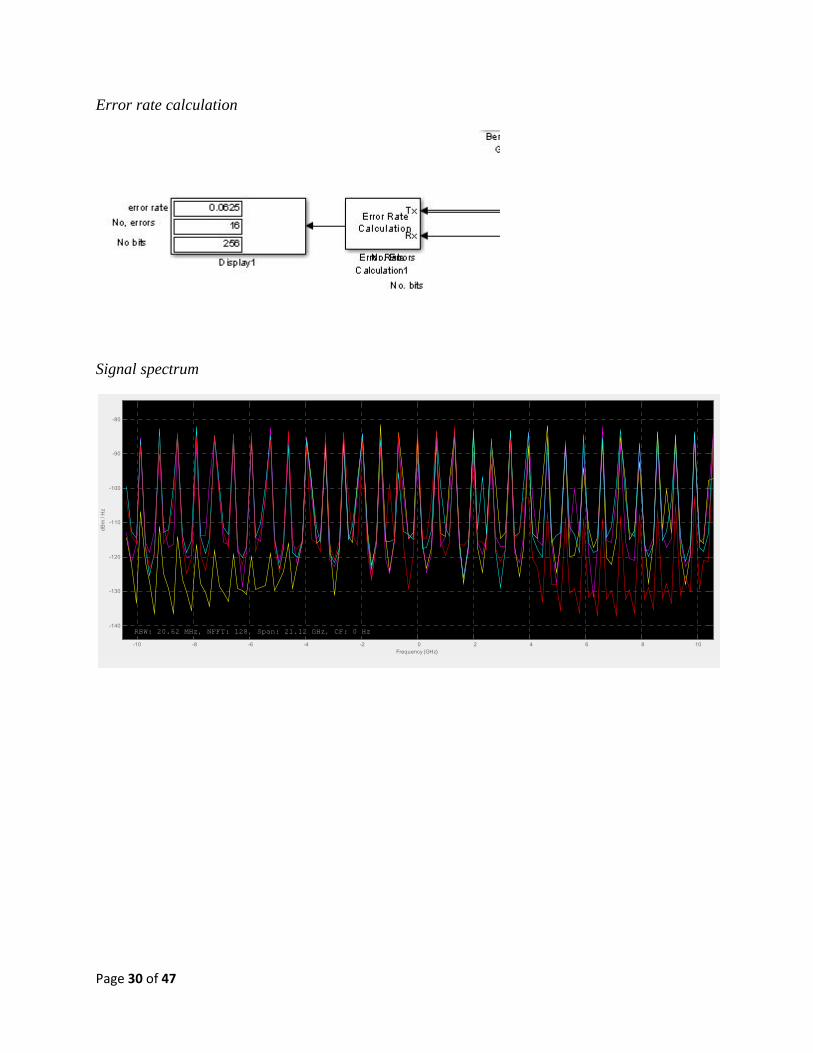
Error rate calculation
Signal spectrum
-10 -8 -6 -4 -2 0 2 4 6 8 10
-140
-130
-120
-110
-100
-90
-80
Frequency (GHz)
dB
m /
Hz
RBW: 20.62 MHz, NFFT: 128, Span: 21.12 GHz, CF: 0 Hz
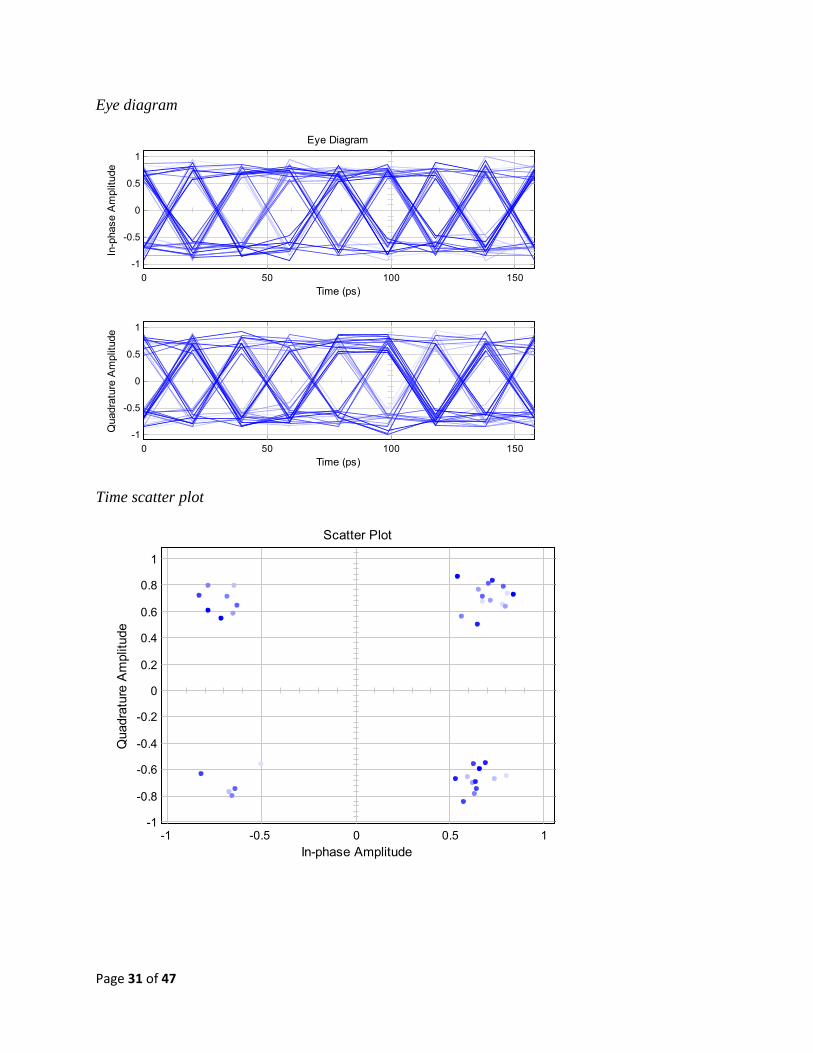
Page 31 of 47
Eye diagram
Time scatter plot
0 50 100 150-1
-0.5
0
0.5
1
Time (ps)
In-p
hase
Am
plitu
de
Eye Diagram
0 50 100 150-1
-0.5
0
0.5
1
Time (ps)
Qua
drat
ure
Am
plitu
de
-1 -0.5 0 0.5 1-1
-0.8
-0.6
-0.4
-0.2
0
0.2
0.4
0.6
0.8
1
In-phase Amplitude
Qua
drat
ure
Am
plitu
de
Scatter Plot
Page 32 of 47
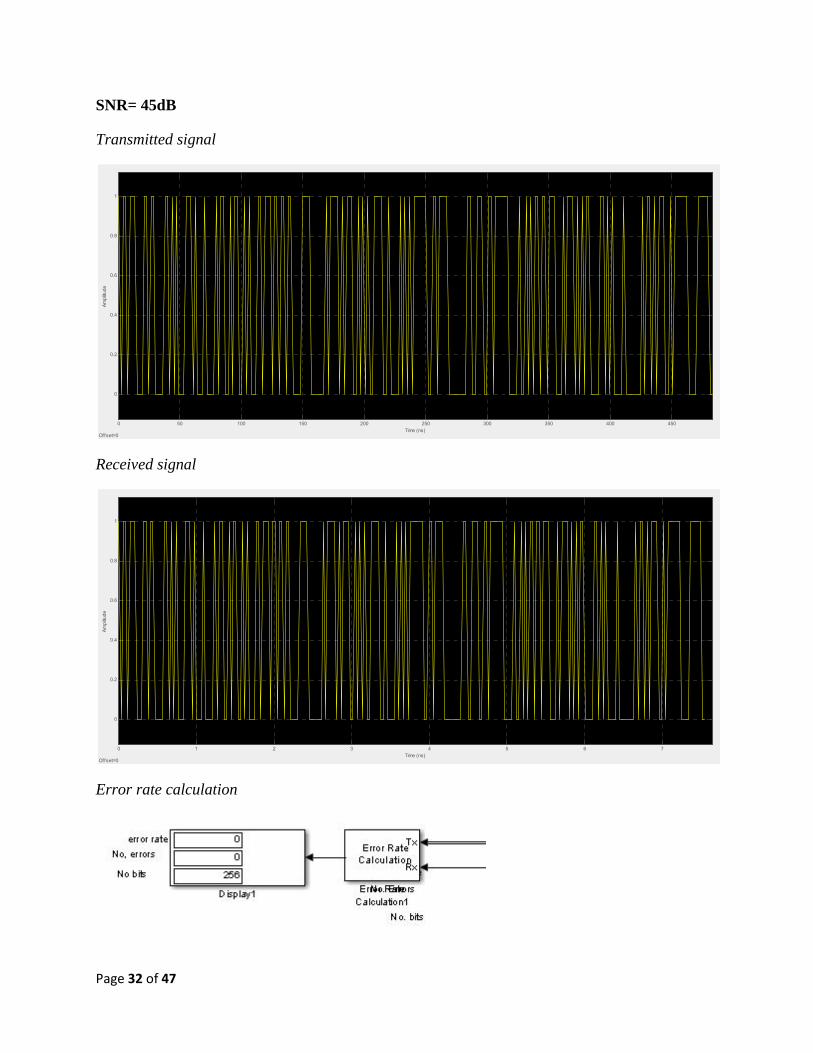
SNR= 45dB
Transmitted signal
Received signal
Error rate calculation
0 50 100 150 200 250 300 350 400 450
0
0.2
0.4
0.6
0.8
1
Ampl
itude
Time (ns)Offset=0
0 1 2 3 4 5 6 7
0
0.2
0.4
0.6
0.8
1
Ampl
itude
Time (ns)Offset=0
Page 33 of 47
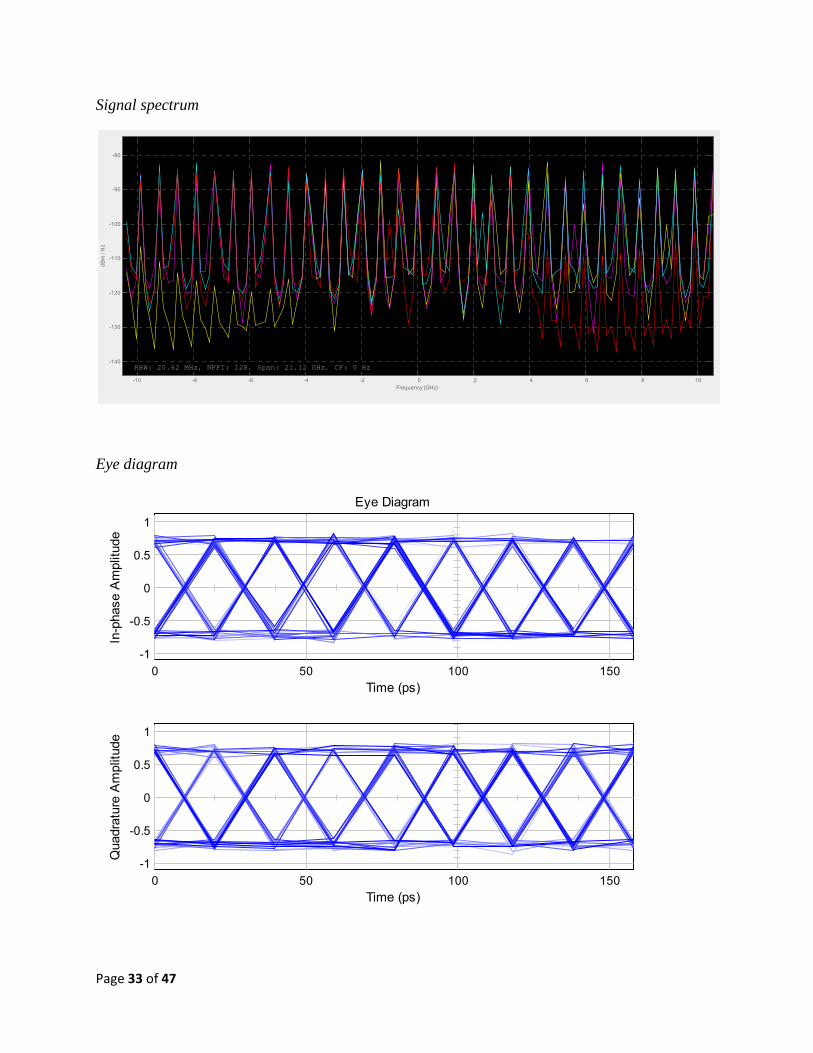
Signal spectrum
Eye diagram
-10 -8 -6 -4 -2 0 2 4 6 8 10
-140
-130
-120
-110
-100
-90
-80
Frequency (GHz)
dB
m /
Hz
RBW: 20.62 MHz, NFFT: 128, Span: 21.12 GHz, CF: 0 Hz
0 50 100 150-1
-0.5
0
0.5
1
Time (ps)
In-p
hase
Am
plitu
de
Eye Diagram
0 50 100 150-1
-0.5
0
0.5
1
Time (ps)
Qua
drat
ure
Am
plitu
de
Page 34 of 47
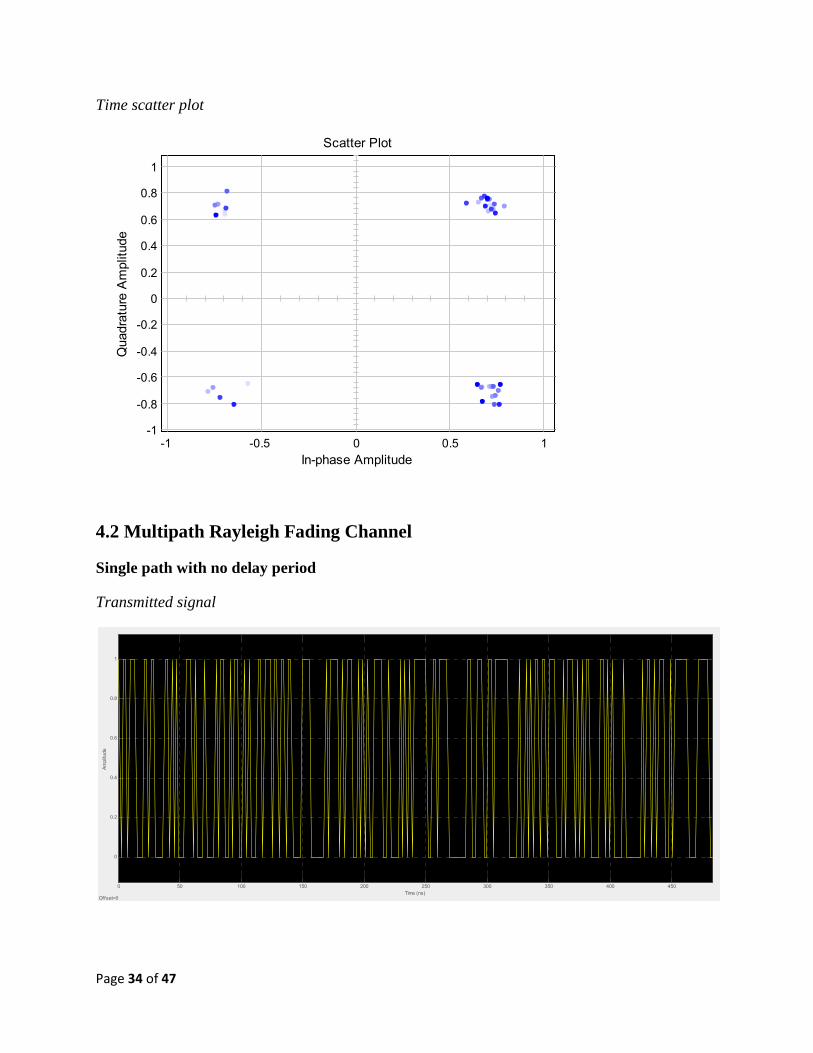
Time scatter plot
4.2 Multipath Rayleigh Fading Channel
Single path with no delay period
Transmitted signal
-1 -0.5 0 0.5 1-1
-0.8
-0.6
-0.4
-0.2
0
0.2
0.4
0.6
0.8
1
In-phase Amplitude
Qua
drat
ure
Am
plitu
deScatter Plot
0 50 100 150 200 250 300 350 400 450
0
0.2
0.4
0.6
0.8
1
Ampl
itude
Time (ns)Offset=0
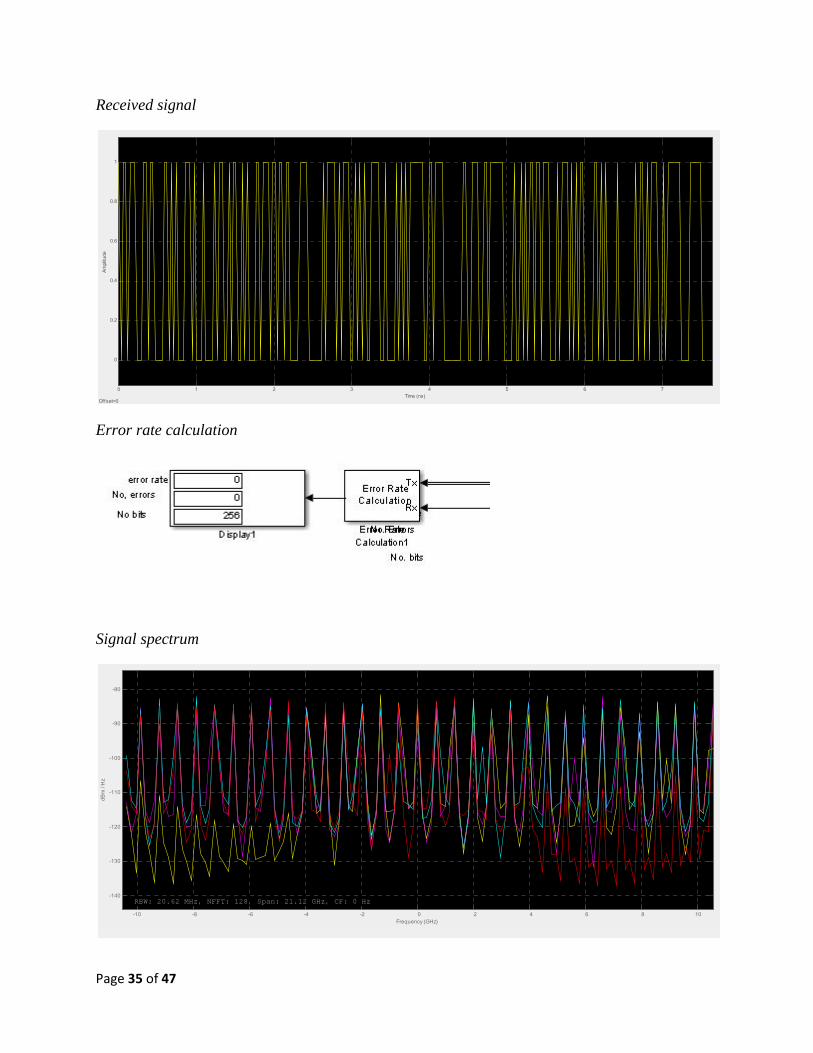
Page 35 of 47
Received signal
Error rate calculation
Signal spectrum
0 1 2 3 4 5 6 7
0
0.2
0.4
0.6
0.8
1
Ampl
itude
Time (ns)Offset=0
-10 -8 -6 -4 -2 0 2 4 6 8 10
-140
-130
-120
-110
-100
-90
-80
Frequency (GHz)
dB
m /
Hz
RBW: 20.62 MHz, NFFT: 128, Span: 21.12 GHz, CF: 0 Hz
Page 36 of 47
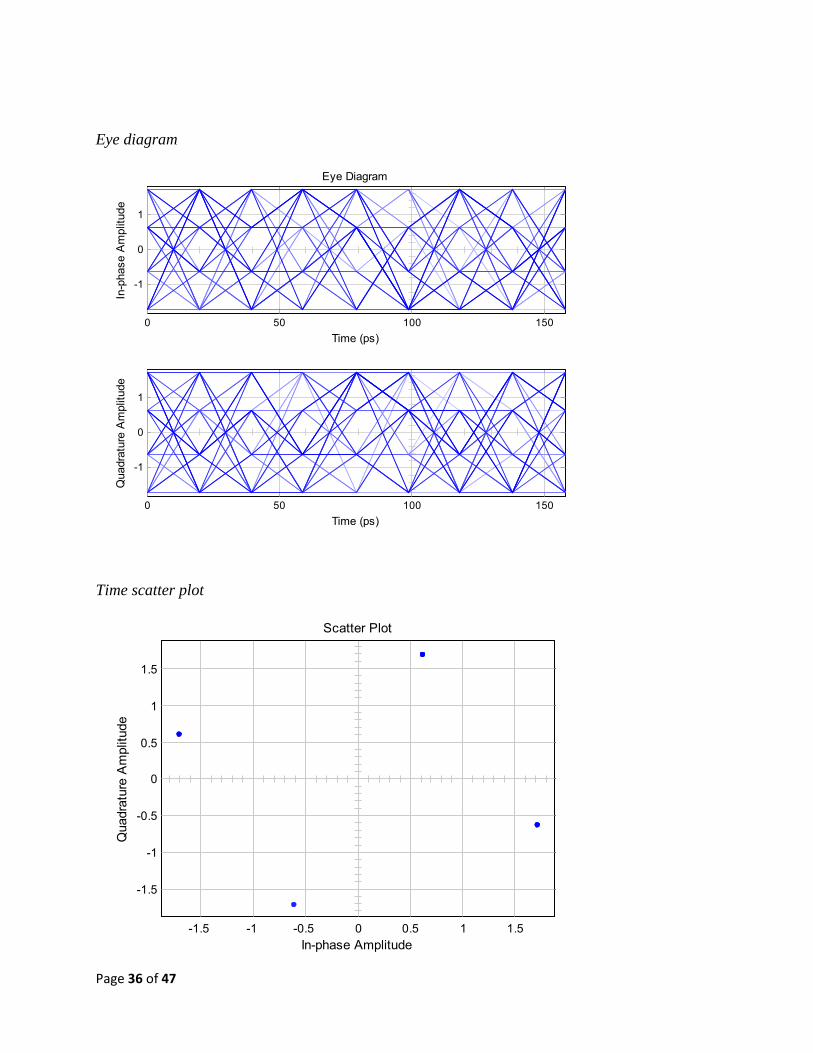
Eye diagram
Time scatter plot
0 50 100 150
-1
0
1
Time (ps)
In-p
hase
Am
plitu
de
Eye Diagram
0 50 100 150
-1
0
1
Time (ps)
Qua
drat
ure
Am
plitu
de
-1.5 -1 -0.5 0 0.5 1 1.5
-1.5
-1
-0.5
0
0.5
1
1.5
In-phase Amplitude
Qua
drat
ure
Am
plitu
de
Scatter Plot
Page 37 of 47
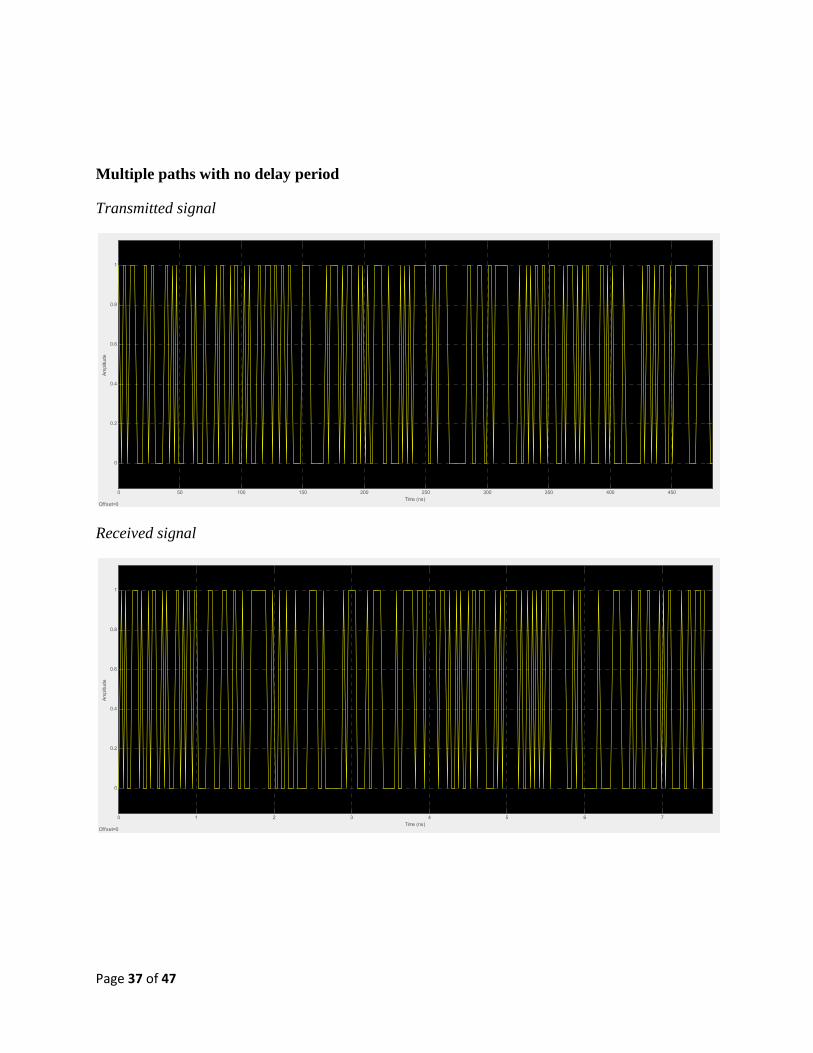
Multiple paths with no delay period
Transmitted signal
Received signal
0 50 100 150 200 250 300 350 400 450
0
0.2
0.4
0.6
0.8
1
Ampl
itude
Time (ns)Offset=0
0 1 2 3 4 5 6 7
0
0.2
0.4
0.6
0.8
1
Ampl
itude
Time (ns)Offset=0
Page 38 of 47
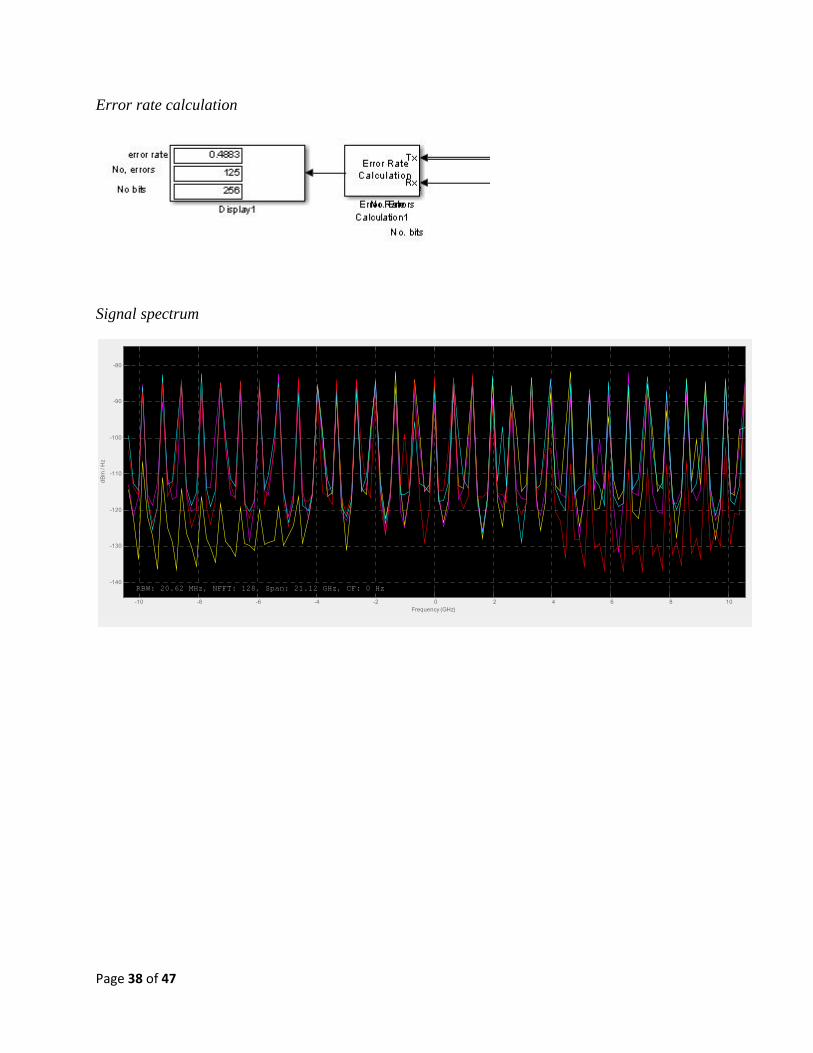
Error rate calculation
Signal spectrum
-10 -8 -6 -4 -2 0 2 4 6 8 10
-140
-130
-120
-110
-100
-90
-80
Frequency (GHz)
dB
m /
Hz
RBW: 20.62 MHz, NFFT: 128, Span: 21.12 GHz, CF: 0 Hz
Page 39 of 47
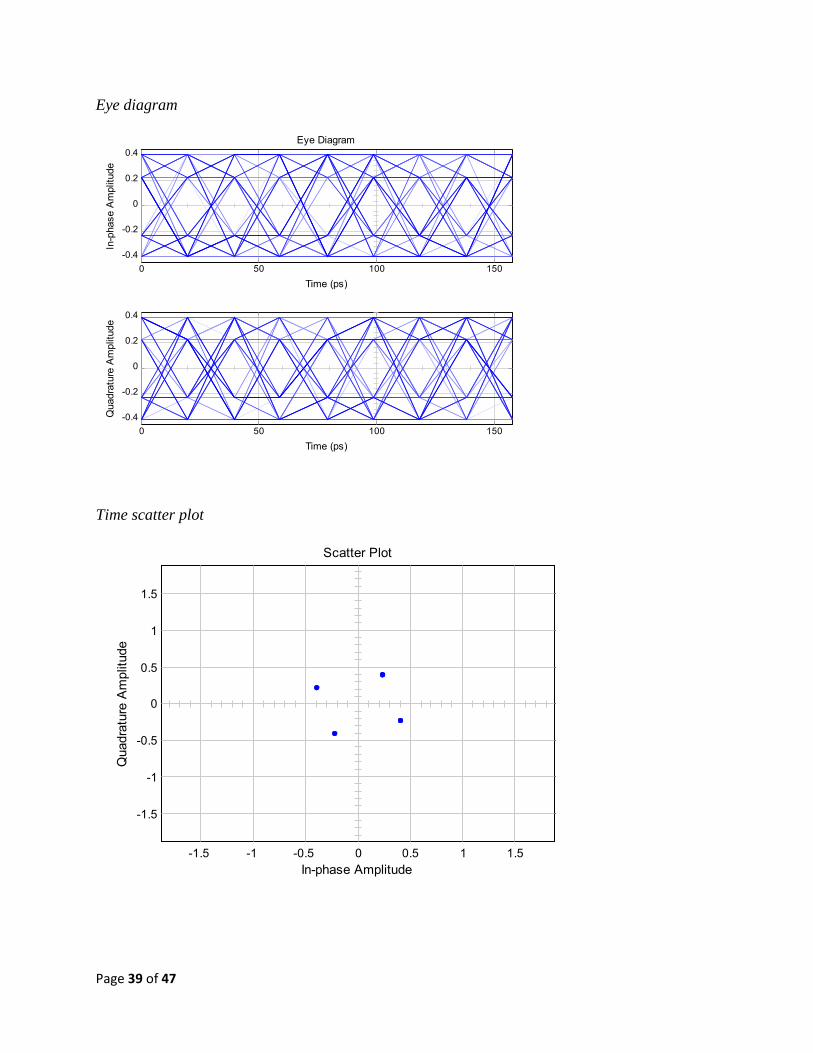
Eye diagram
Time scatter plot
0 50 100 150-0.4
-0.2
0
0.2
0.4
Time (ps)
In-p
hase
Am
plitu
de
Eye Diagram
0 50 100 150-0.4
-0.2
0
0.2
0.4
Time (ps)
Qua
drat
ure
Am
plitu
de
-1.5 -1 -0.5 0 0.5 1 1.5
-1.5
-1
-0.5
0
0.5
1
1.5
In-phase Amplitude
Qua
drat
ure
Am
plitu
de
Scatter Plot
Page 40 of 47
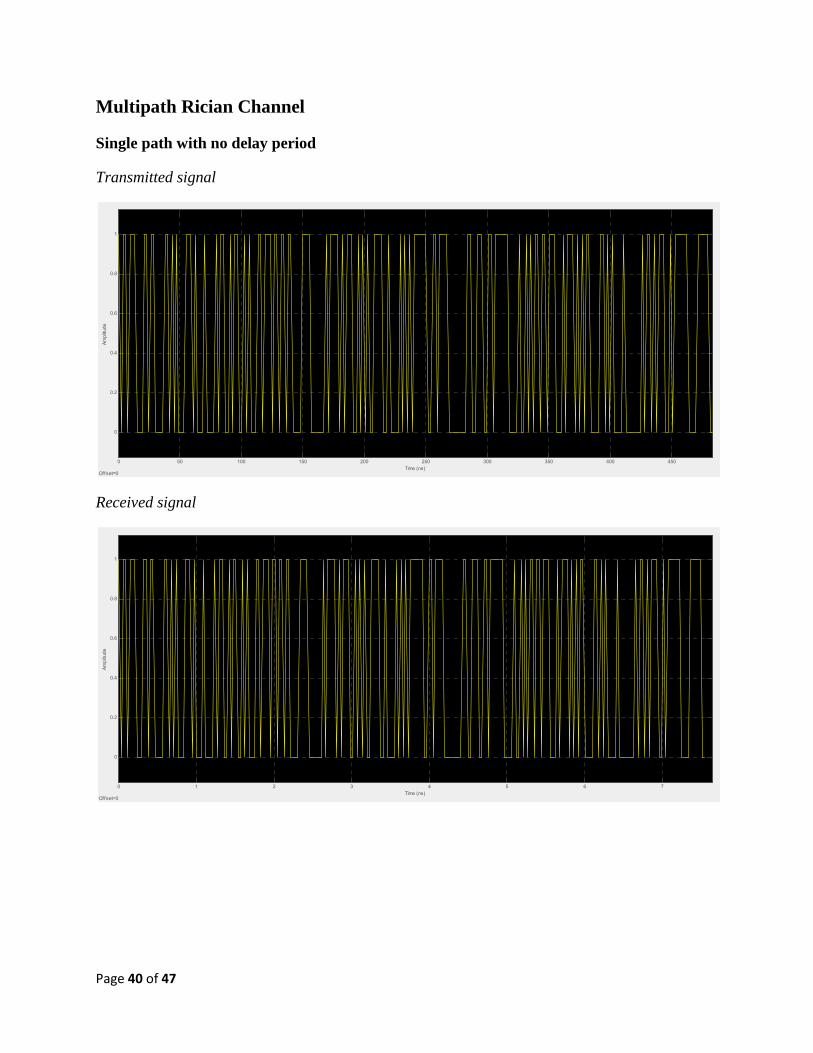
Multipath Rician Channel
Single path with no delay period
Transmitted signal
Received signal
0 50 100 150 200 250 300 350 400 450
0
0.2
0.4
0.6
0.8
1
Ampl
itude
Time (ns)Offset=0
0 1 2 3 4 5 6 7
0
0.2
0.4
0.6
0.8
1
Ampl
itude
Time (ns)Offset=0
Page 41 of 47
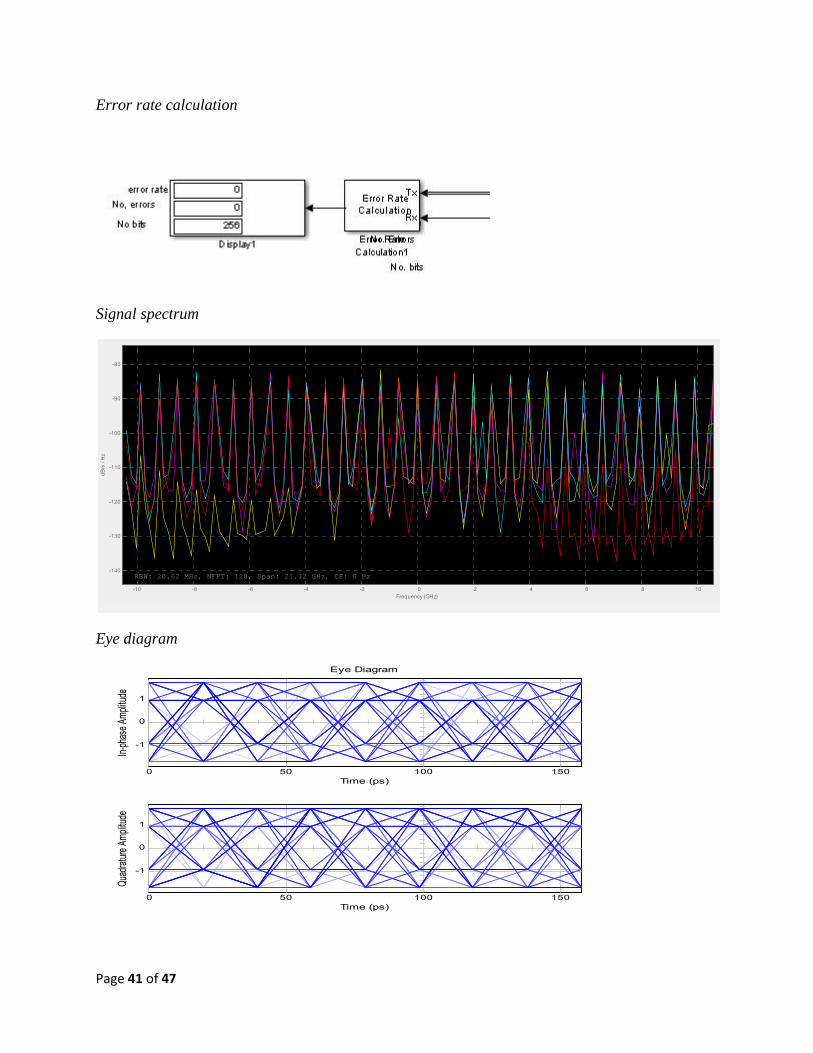
Error rate calculation
Signal spectrum
Eye diagram
-10 -8 -6 -4 -2 0 2 4 6 8 10
-140
-130
-120
-110
-100
-90
-80
Frequency (GHz)
dB
m /
Hz
RBW: 20.62 MHz, NFFT: 128, Span: 21.12 GHz, CF: 0 Hz
0 50 100 150
-1
0
1
Time (ps)
In-ph
ase A
mplitu
de
Eye Diagram
0 50 100 150
-1
0
1
Time (ps)
Quad
rature
Amplit
ude
Page 42 of 47
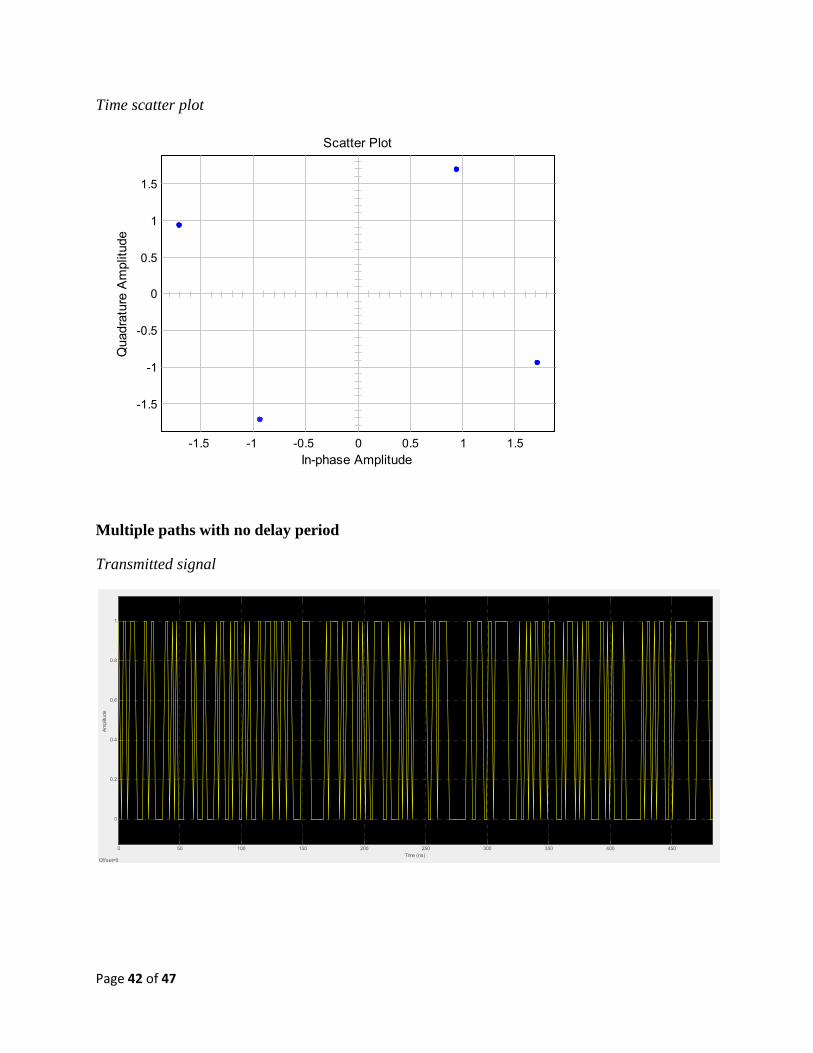
Time scatter plot
Multiple paths with no delay period
Transmitted signal
-1.5 -1 -0.5 0 0.5 1 1.5
-1.5
-1
-0.5
0
0.5
1
1.5
In-phase Amplitude
Qua
drat
ure
Am
plitu
deScatter Plot
0 50 100 150 200 250 300 350 400 450
0
0.2
0.4
0.6
0.8
1
Ampl
itude
Time (ns)Offset=0
Page 43 of 47
Received signal
Error rate calculation
0 1 2 3 4 5 6 7
0
0.2
0.4
0.6
0.8
1
Ampl
itude
Time (ns)Offset=0
Page 44 of 47
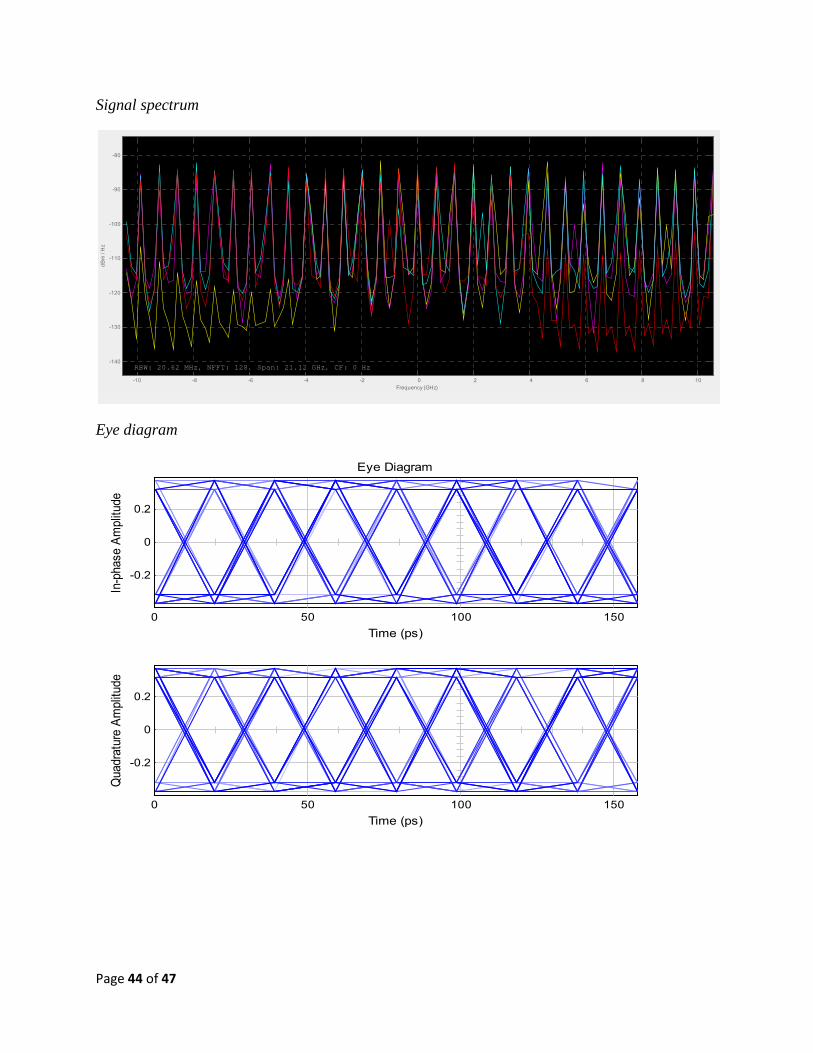
Signal spectrum
Eye diagram
-10 -8 -6 -4 -2 0 2 4 6 8 10
-140
-130
-120
-110
-100
-90
-80
Frequency (GHz)
dB
m /
Hz
RBW: 20.62 MHz, NFFT: 128, Span: 21.12 GHz, CF: 0 Hz
0 50 100 150
-0.2
0
0.2
Time (ps)
In-p
hase
Am
plitu
de
Eye Diagram
0 50 100 150
-0.2
0
0.2
Time (ps)
Qua
drat
ure
Ampl
itude
Page 45 of 47
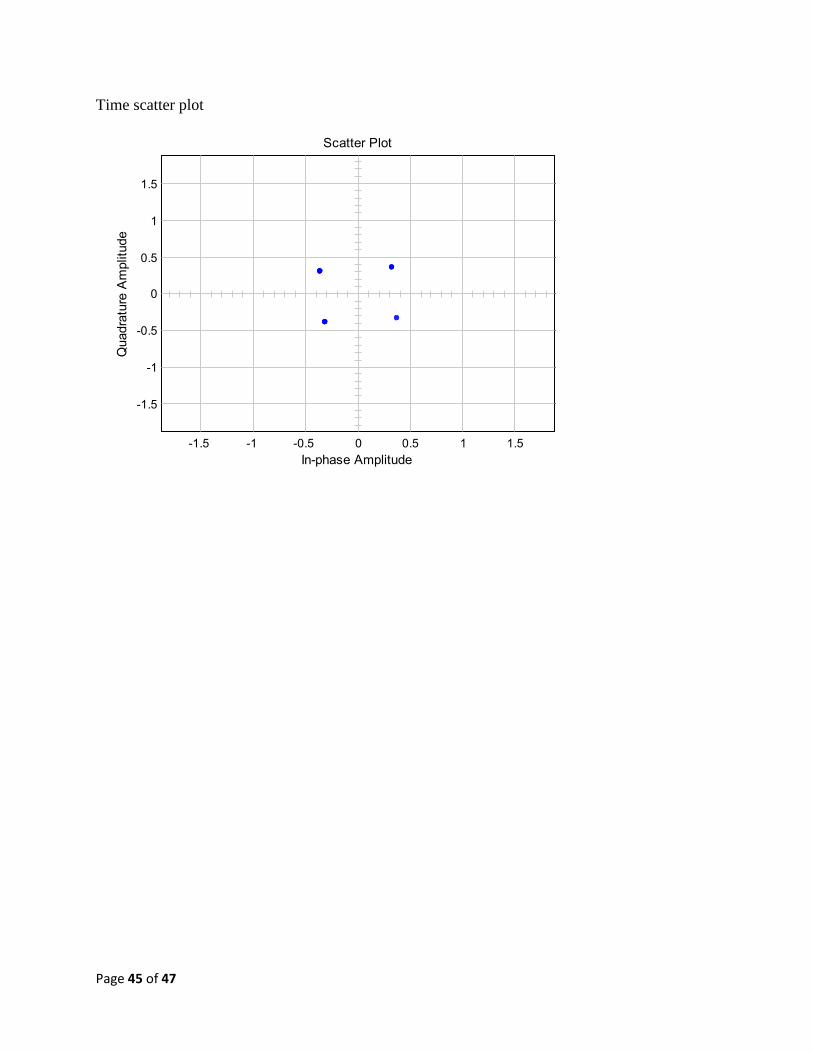
Time scatter plot
-1.5 -1 -0.5 0 0.5 1 1.5
-1.5
-1
-0.5
0
0.5
1
1.5
In-phase Amplitude
Qua
drat
ure
Am
plitu
deScatter Plot
Page 46 of 47
CHAPTER 5RESULT ANALYSIS
AWGN ChannelFrom the results obtained, the time scatter plot and the Eye diagrams shows the ISI. The widerthe eye the lower the ISI. This is further proved by a keen look at the scatter plots, if the plots arerandomly distributed, it shows that the noise power is higher than the signal power. Anotherpossible explanation could be due to the effect of ISI.
This analysis plus the results shows that for a given transmission bandwidth, the systemperformance improves as the SNR increases. This is in line with the Hartley- Shannon law forwhite Gaussian channel
The error calculations done further proves that indeed as the SNR increases, an error freetransmission is possible
Multipath Rayleigh /Rician Fading channelThe results obtained thus far aren’t conclusive especially for the multipath portions of the
simulation. This is because the comparison done using matlab simulink especially the error ratecalculation does not take into account the delay effect and multiple paths from which the signalarrives.
But a keen comparison of the transmitted signal and the received signal proves that the samesignal transmitted is the same one received even under multipath fading conditions. This can beattributed to the advantage the OFDM scheme has of being robust against multipath interference.
One thing is clear though, for the simulation considering only one path, the error rate was foundto be zero with minimum ISI.
Signal spectrumFrom the signal spectrum it is noted that the transmitted signal has a PSD of around -80dbm/Hz.Thus this modem ensures low spectral density transmission though not in conformity to the -41.3dBm/Hz required by the regulating bodies.
Transmission speedFrom the parameters mentioned before, OFDM symbol duration is 312.5 ns this gives a
maximum throughput of 3.2MHz.The speed is given by:= ( ) ( ) ( ℎ ℎ )= 96 3.2 2= 204.8
This rate could be reduced to 102.4 Mbps by a time spreading gain of 2, i.e. the IFFT to transmitat the same time the complex conjugate of the signal.
Page 47 of 47
CHAPTER 6CONLUSIONS AND RECOMMENDATION
ConclusionThe objective of this project was to study both the UWB wireless communication systems andWBAN applications and then design and demonstrate a modem to be used in those applications.This has been achieved, and the modem simulation showed that it can achieve an error freetransmission at a lower PSD and at a very high data rate.
RecommendationsUWB and Body Area Networks are potential areas for research. They are still emerging
technologies which still needs to be explored for more applications.
REFERENCES[1] Garth V. Crosby, Tirthankar Ghosh, Renita Murimi, Craig A. Chin “Wireless Body AreaNetworks for Healthcare: A Survey”, International Journal of Ad hoc, Sensor & UbiquitousComputing (IJASUC) Vol.3, No.3, June 2012.[2] Movassagi, Samaneh; Abolhasan, Meran and Lipman, Justin and Smith, “Wireless BodyArea Networks, “A survey of IEEE communications and tutorials[3] Dr. GSO Odhiambo “ Digital Transmission Systems ” FEE 521 class notes University ofNairobi. 2008[4] Mehemet R Yuce, “Ultra-wideband and 60GHz communications for BiomedicalApplications,” Springer[5] Ragesh G.K, Dr. Baskaran, “An Overview of Applications, Standards and Challenges inFuturistic Wireless Body Area Networks.” International journal of computer science issues 2012[7] W. Pam Sinwongpairat, K.J Ray Liu “Ultra-Wideband Communications Systems: Multiband
OFDM approach “John Wiley and Sons ltd 2007[8] X. Shen, M Guizani, R.C Qui, T. Le-Ngoc “Ultra-wideband Wireless Communication andNetworks,” John Wiley and sons ltd 2006[9] Man Young Rhee “Error Correcting Coding Theory,” McGraw Hill communication series
1989[10] M. Ghavami, L. B. Michael, R. Kohno “Ultra wideband Signals and Systems inCommunication Engineering”, 2nd edition, John Wiley and Sons, 2007[11] Dr GSO Odhiambo, “Information Theory and Error control coding”. FEE 522 class notesUniversity of Nairobi. 2007[12]http://www.ni.com/white-paper/14285/en/
[13\///]http://en.wikipedia.org/wiki/Electrocardiography[14] http://cnx.org/content/m32044/latest/graphics1.png[15] http://cp.literature.agilent.com/litweb/pdf/ads2008/numeric/3125521/numeric-02-02-02.gif(16 )Daniel Lewis (Ed). 802.15.6 call for applications - response summary. Technical report,IEEE, January 2009 [visited June 2011].[17] Pedro Brand˜ao, “Abstracting information on body area networks”, University ofCambridge, 2012 http://www.cl.cam.ac.uk/techreports/