Embed Size (px)
Citation preview
Professor Darrell F. SocieDepartment of Mechanical Science and Engineering
University of Illinois at Urbana-Champaign
© 2001-2010 Darrell Socie, All Rights Reserved
Frequency Based Fatigue

Frequency Based Fatigue © 2001-2011 Darrell Socie, All Rights Reserved 1 of 57
Deterministic – from past measurements the future position of a satellite can be predicted with reasonable accuracy
Random – from past measurements the future position of a car can only be described in terms of probability and statistical averages

Frequency Based Fatigue © 2001-2011 Darrell Socie, All Rights Reserved 2 of 57
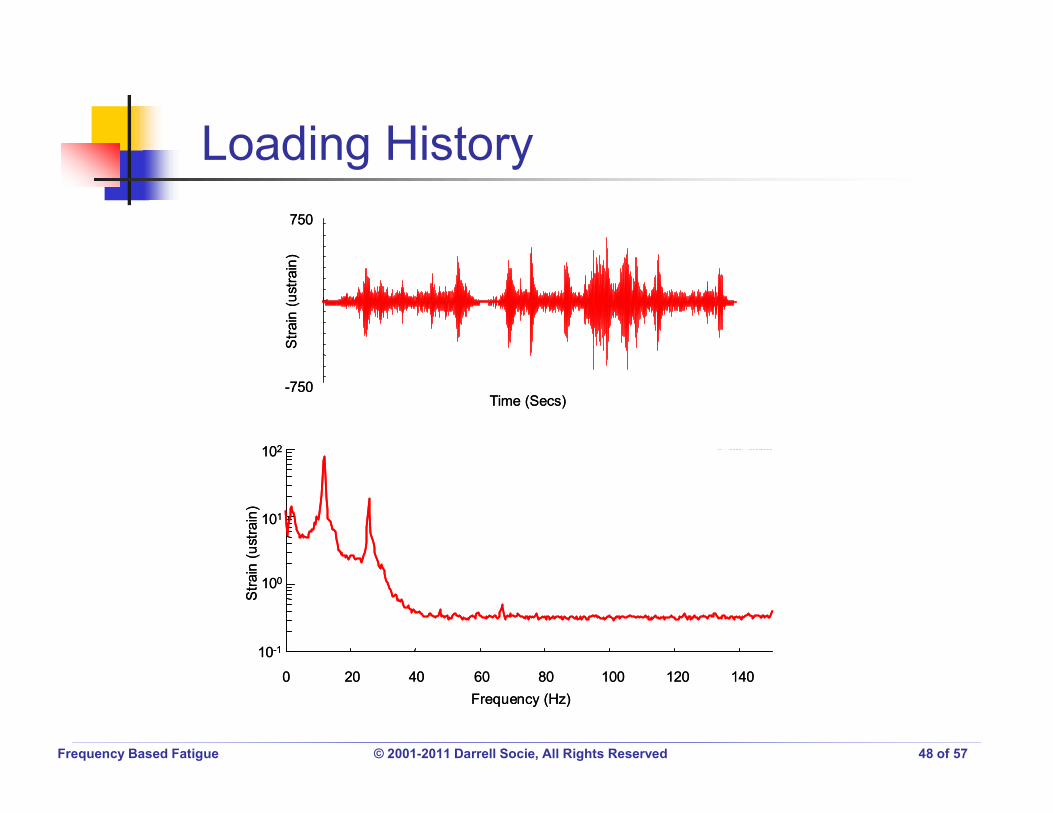
Time (Secs)
Bracket.sif-Strain_c56
-750
750
Frequency Based Fatigue © 2001-2011 Darrell Socie, All Rights Reserved 3 of 57
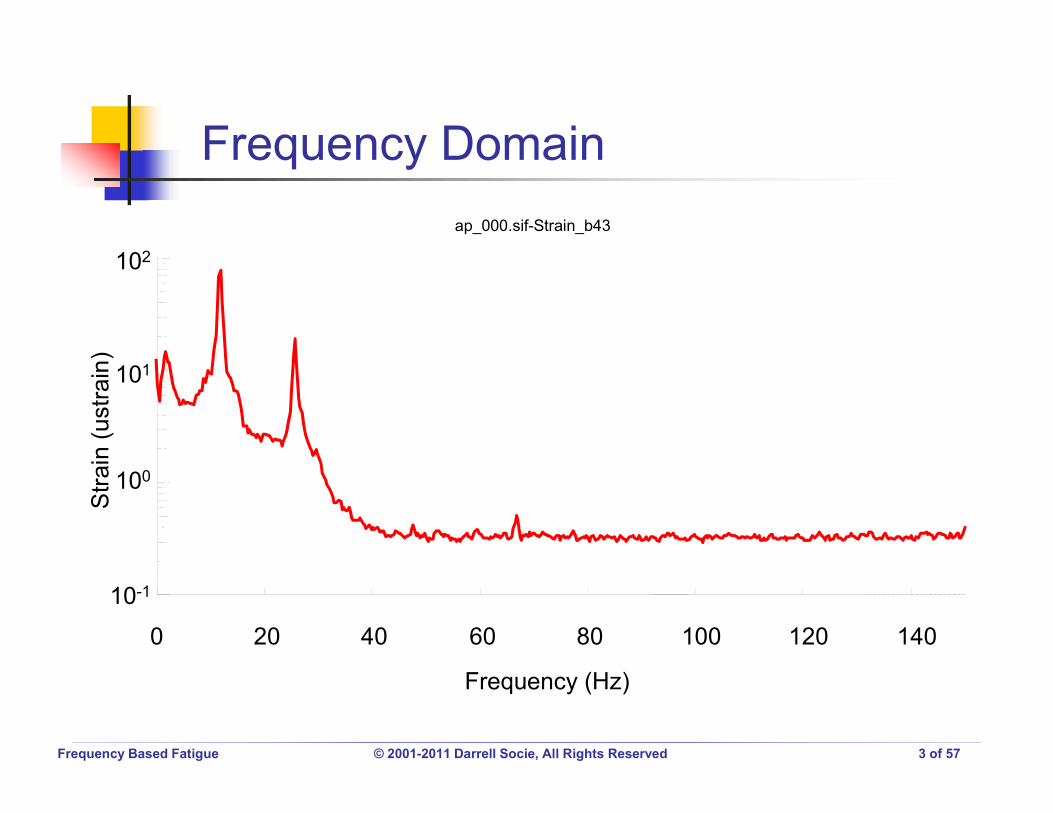
Frequency (Hz)
0 20 40 60 80 100 120 140
102
ap_000.sif-Strain_b43
101
100
10-1
Frequency Based Fatigue © 2001-2011 Darrell Socie, All Rights Reserved 4 of 57
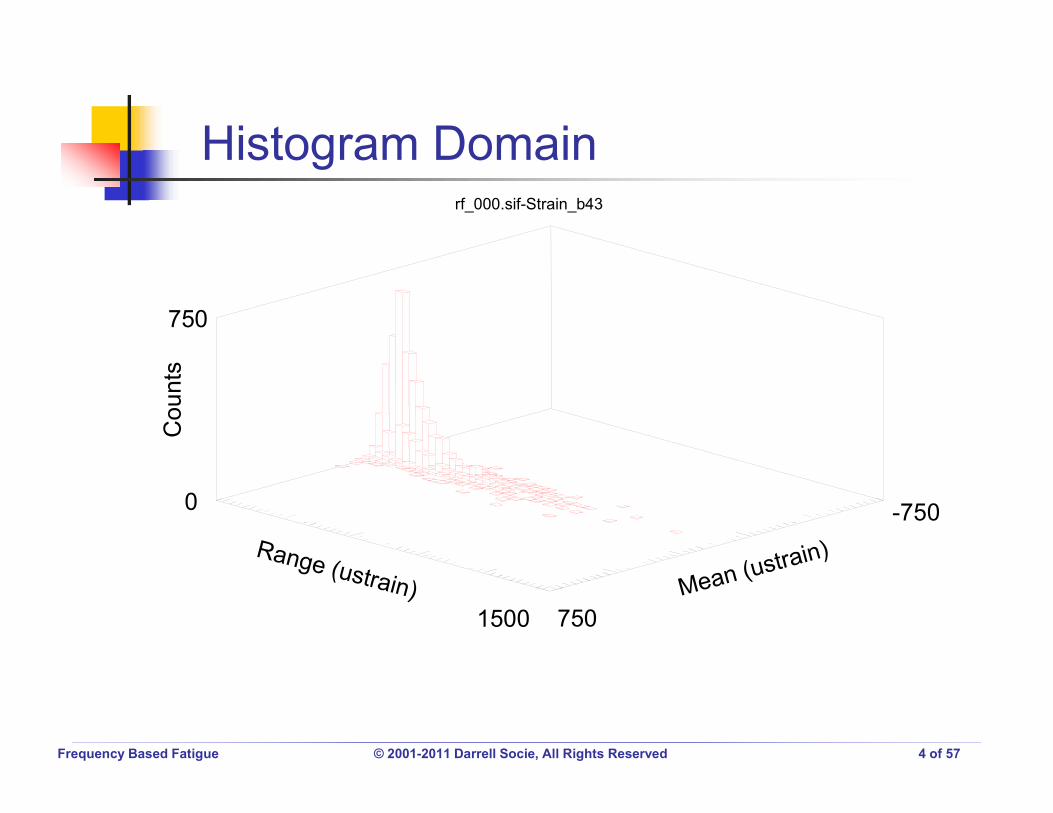
1500
-750
750
0
750
rf_000.sif-Strain_b43

Frequency Based Fatigue © 2001-2011 Darrell Socie, All Rights Reserved 5 of 57
Statistics of Time HistoriesTime Domain NomenclatureFrequency AnalysisPSD Based Fatigue Analysis

Frequency Based Fatigue © 2001-2011 Darrell Socie, All Rights Reserved 6 of 57
Mean or Expected ValueVariance / Standard DeviationRoot Mean SquareKurtosisSkewnessCrest FactorIrregularity Factor

Frequency Based Fatigue © 2001-2011 Darrell Socie, All Rights Reserved 7 of 57
Central tendency of the data
N
xXExMean
N
1ii
x

Frequency Based Fatigue © 2001-2011 Darrell Socie, All Rights Reserved 8 of 57
Dispersion of the data
N
)xx(XVar
N
1i
2i
)X(Varx
Standard deviation

Frequency Based Fatigue © 2001-2011 Darrell Socie, All Rights Reserved 9 of 57
N
xRMS
N
1i
2i
The rms is equal to the standard deviation when the mean is 0

Frequency Based Fatigue © 2001-2011 Darrell Socie, All Rights Reserved 10 of 57
Skewness is a measure of the asymmetry of the data around the sample mean. If skewness is negative, the data are spread out more to the left of the mean than to the right. If skewness is positive, the data are spread out more to the right. The skewness of the normal distribution (or any perfectly symmetric distribution) is zero.
3
N
1i
3i
N
)xx(XSkewness
Frequency Based Fatigue © 2001-2011 Darrell Socie, All Rights Reserved 11 of 57
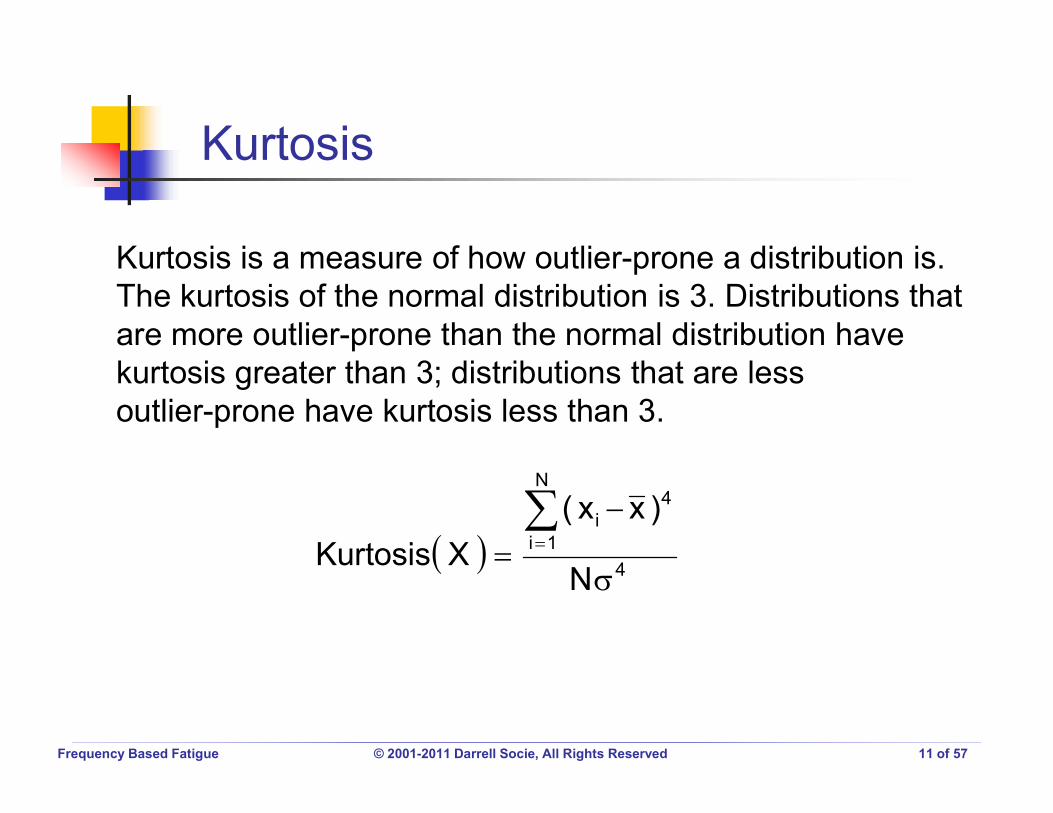
Kurtosis is a measure of how outlier-prone a distribution is. The kurtosis of the normal distribution is 3. Distributions that are more outlier-prone than the normal distribution have kurtosis greater than 3; distributions that are less outlier-prone have kurtosis less than 3.
4
N
1i
4i
N
)xx(XKurtosis

Frequency Based Fatigue © 2001-2011 Darrell Socie, All Rights Reserved 12 of 57
The crest factor is the ration of the peak (maximum) value to the root-mean-square (RMS) value. A sine wave has a crest factor of 1.414.

Frequency Based Fatigue © 2001-2011 Darrell Socie, All Rights Reserved 13 of 57
Positive zero crossingPeak 7
4)P(E)0(EIF
IF 1 is narrow band signalIF 0 is wide band signal

Frequency Based Fatigue © 2001-2011 Darrell Socie, All Rights Reserved 14 of 57
RandomStochasticStationaryNon-stationaryGaussianNarrow-bandWide-band

Frequency Based Fatigue © 2001-2011 Darrell Socie, All Rights Reserved 15 of 57
The instantaneous value can not be predicted at any future time.

Frequency Based Fatigue © 2001-2011 Darrell Socie, All Rights Reserved 16 of 57
Stochastic processes provide suitable models for physical systems where the phenomena is governed by probabilities.

Frequency Based Fatigue © 2001-2011 Darrell Socie, All Rights Reserved 17 of 57
The properties computed over short time intervals, t + t, do not significantly vary from each other
t

Frequency Based Fatigue © 2001-2011 Darrell Socie, All Rights Reserved 18 of 57
Frequency Based Fatigue © 2001-2011 Darrell Socie, All Rights Reserved 19 of 57
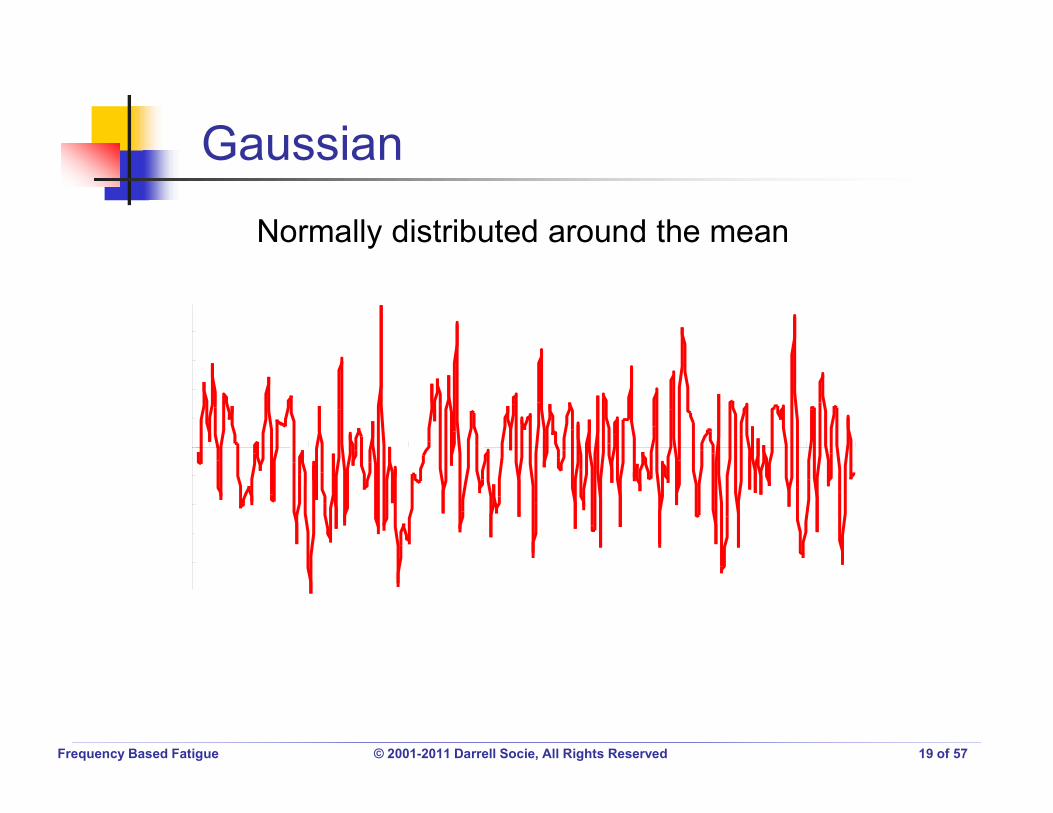
Normally distributed around the mean

Frequency Based Fatigue © 2001-2011 Darrell Socie, All Rights Reserved 20 of 57

Frequency Based Fatigue © 2001-2011 Darrell Socie, All Rights Reserved 21 of 57
Frequency Based Fatigue © 2001-2011 Darrell Socie, All Rights Reserved 22 of 57
FourierFFTInverse FFTAutospectral densityTransfer Function

Frequency Based Fatigue © 2001-2011 Darrell Socie, All Rights Reserved 23 of 57
Fourier studied the mathematical theory of heat conduction. He established the partial differential equation governing heat diffusion and solved it by using infinite series of trigonometric functions.

Frequency Based Fatigue © 2001-2011 Darrell Socie, All Rights Reserved 24 of 57
1kokoko )tkcos(b)tksin(aa)t(X
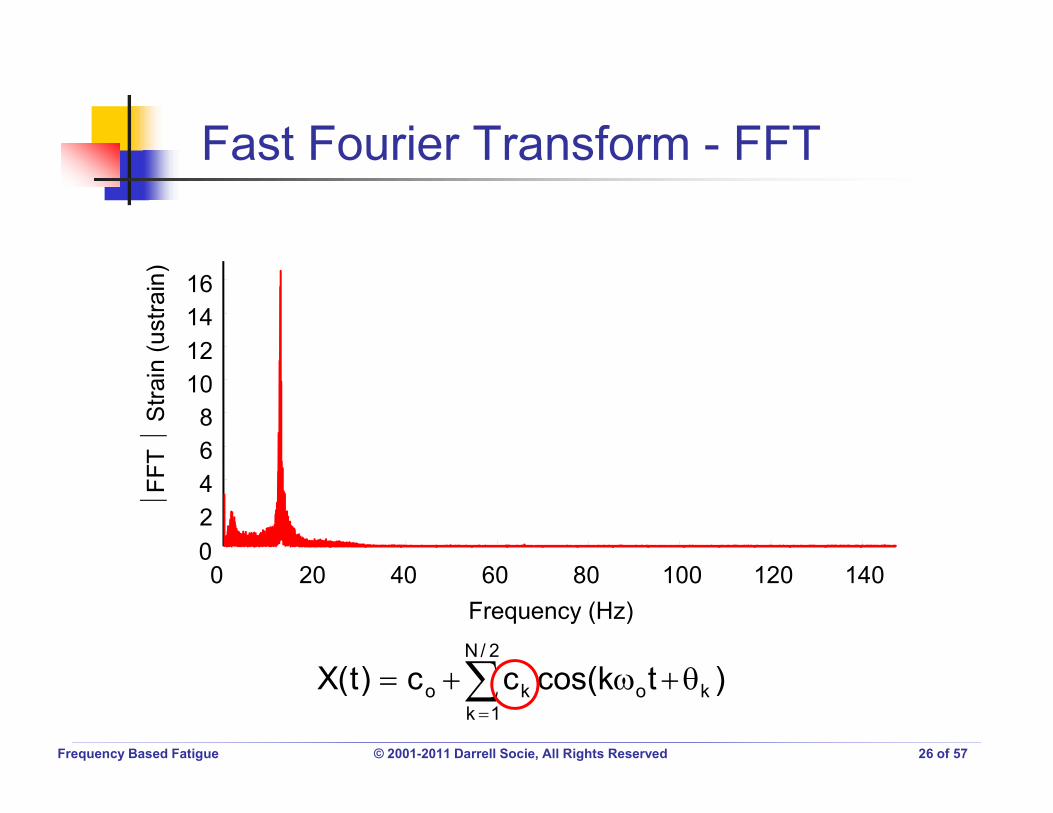
1kkoko )tkcos(cc)t(X
k
tjkS
oe]k[X)t(X
ak, bk, ck, XS[k] are Fourier coefficients
frequency, magnitude, and phase are all described by the coefficients

Frequency Based Fatigue © 2001-2011 Darrell Socie, All Rights Reserved 25 of 57
Time Frequency
The area under each spike represents the magnitude of the sine wave at that frequency.
f
The magnitude of the FFT depends on the frequency window f.
Frequency Based Fatigue © 2001-2011 Darrell Socie, All Rights Reserved 26 of 57
Frequency (Hz)0 20 40 60 80 100 120 140
16141210
86420
2/N
1kkoko )tkcos(cc)t(X

Frequency Based Fatigue © 2001-2011 Darrell Socie, All Rights Reserved 27 of 57
Frequency (Hz)
0 20 40 60 80 100 120 140
150100500
-50-100
-150
2/N
1kkoko )tkcos(cc)t(X

Frequency Based Fatigue © 2001-2011 Darrell Socie, All Rights Reserved 28 of 57
2/N
1kkoko )tkcos(cc)t(X
ck, k, and k o are all known
Time (Secs)-750
750

Frequency Based Fatigue © 2001-2011 Darrell Socie, All Rights Reserved 29 of 57
Function Units
Time History EU X(n)
Linear Spectrum EU S(n) = DFT(X(n))
AutoPower EU^2 AP(n) = S(n) · S(n)
PSD (EU^2)/Hz PSD(n) = AP(n) / ( Wf · f )
ESD (EU^2*sec)/Hz ESD(n) = AP(n) · T / ( Wf · f )

Frequency Based Fatigue © 2001-2011 Darrell Socie, All Rights Reserved 30 of 57
T 2T 3T nDTND
Dn
1i
2k
DDk fX
tNn1fS
ND Block size
Magnitude only no phase information

Frequency Based Fatigue © 2001-2011 Darrell Socie, All Rights Reserved 31 of 57
Frequency (Hz)
Log Magnitude-Power-Strain_c56
100 101 102
105
104
103
102
101
100
Average power associated with a 1 Hz frequency window centered at each frequency, f . Phase information is lost.

Frequency Based Fatigue © 2001-2011 Darrell Socie, All Rights Reserved 32 of 57
Frequency (Hz)
102
Log Magnitude-Linear-Strain_c56
100
101
100 101 102
Sometimes called Amplitude Spectral Density

Frequency Based Fatigue © 2001-2011 Darrell Socie, All Rights Reserved 33 of 57
Frequency (Hz)100 101 102
105
104
103
102
101
100
10-1
PSD
Linear Spectrum

Frequency Based Fatigue © 2001-2011 Darrell Socie, All Rights Reserved 34 of 57
Time (Secs)
800
600
400
200
0
-200
-400
EASE1.EDT-Strain_c56
Non-stationary signals

Frequency Based Fatigue © 2001-2011 Darrell Socie, All Rights Reserved 35 of 57
Frequency (Hz)0 20 40 60 80 100 120 140
103
102
101
100
10-1
Frequency Based Fatigue © 2001-2011 Darrell Socie, All Rights Reserved 36 of 57
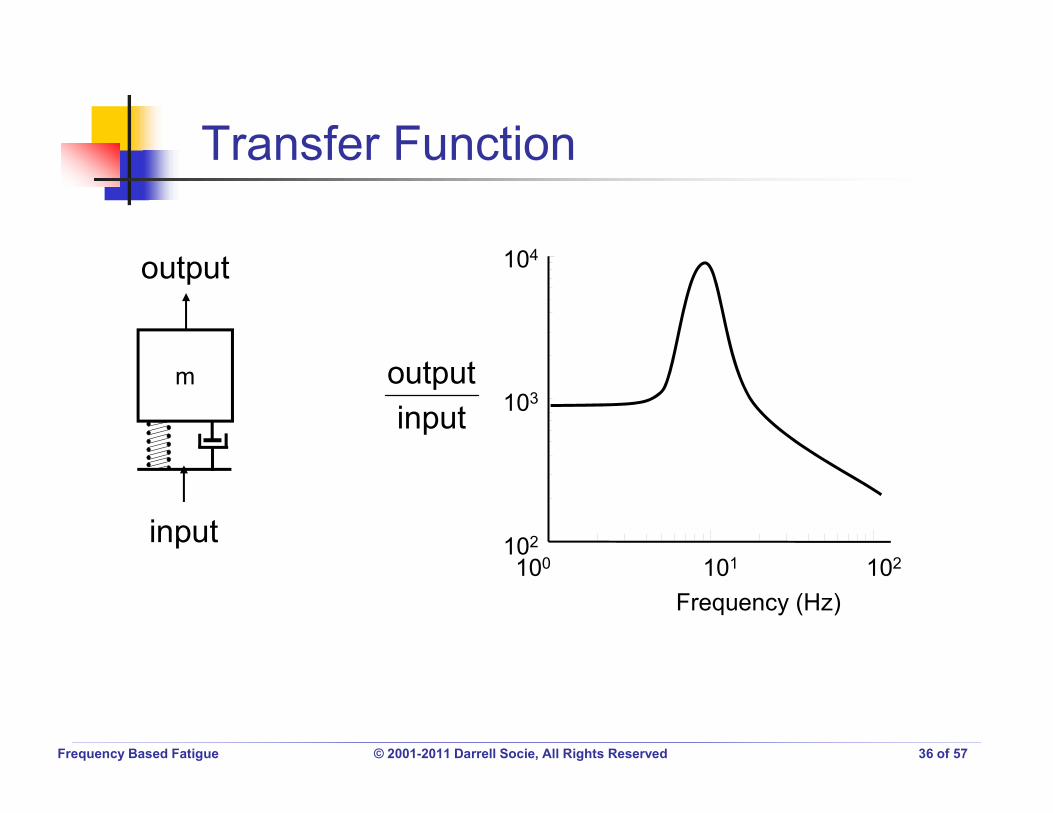
m
input
output
Frequency (Hz)100 101 102
104
103
102
inputoutput
Frequency Based Fatigue © 2001-2011 Darrell Socie, All Rights Reserved 37 of 57
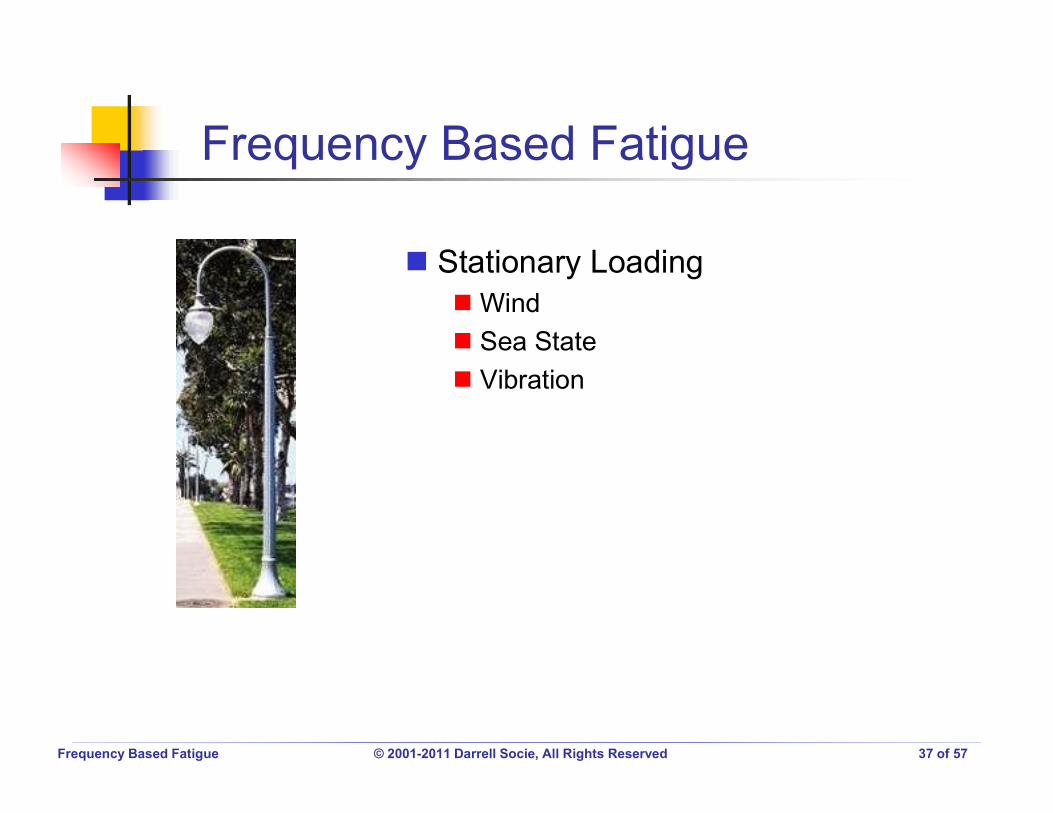
Stationary LoadingWindSea StateVibration
Frequency Based Fatigue © 2001-2011 Darrell Socie, All Rights Reserved 38 of 57
RandomGaussianStationary
Frequency Based Fatigue © 2001-2011 Darrell Socie, All Rights Reserved 39 of 57
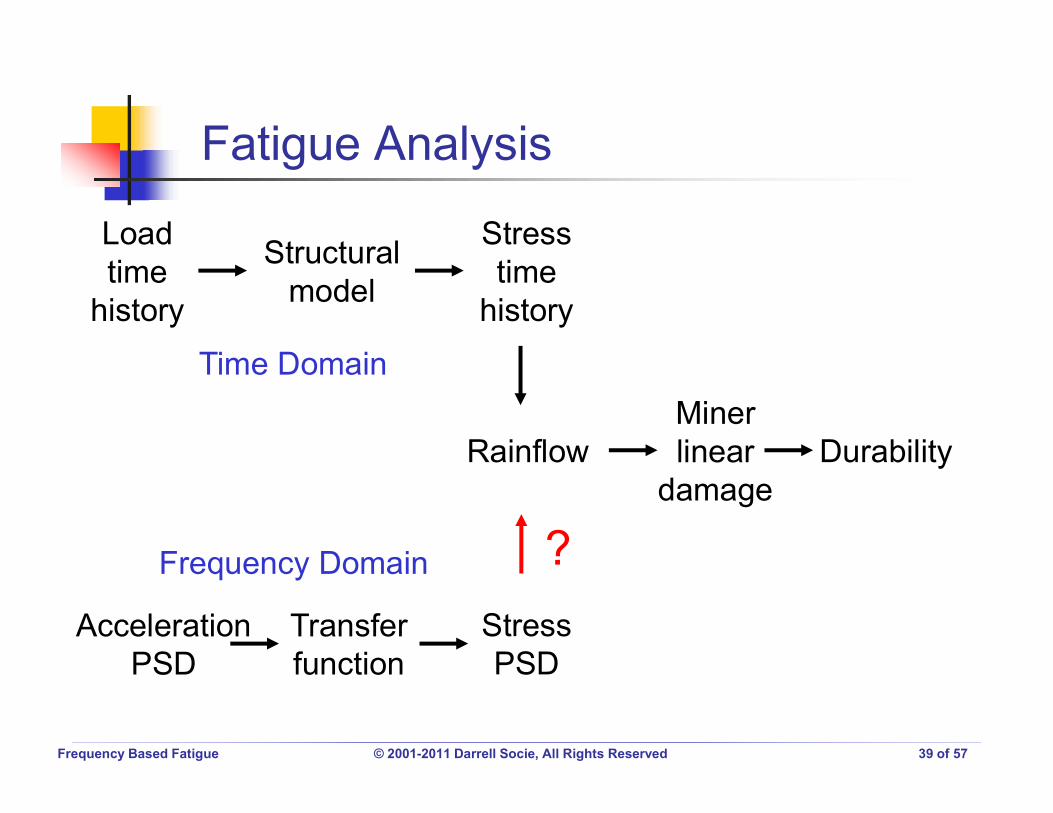
Structuralmodel
Stresstime
history
RainflowMinerlinear
damageDurability
Loadtime
history
AccelerationPSD
Transferfunction
StressPSD
Time Domain
Frequency Domain

Frequency Based Fatigue © 2001-2011 Darrell Socie, All Rights Reserved 40 of 57
y(t)
m
k cx(t)
F(t)
2
2
2
2
dtxdm)t(Fzk
dtdzc
dtzdm
z(t) = y(t) – x(t)
2
22
nn2
2
dtxdz
dtdz2
dtzd
m
F(t)y(t)
)t(Fdt
ydm 2
2

Frequency Based Fatigue © 2001-2011 Darrell Socie, All Rights Reserved 41 of 57
2
n
22
n
o
21
1FXk
oFXk
n
= 1= 0.5
= 0.25
= 0.15
Frequency Based Fatigue © 2001-2011 Darrell Socie, All Rights Reserved 42 of 57
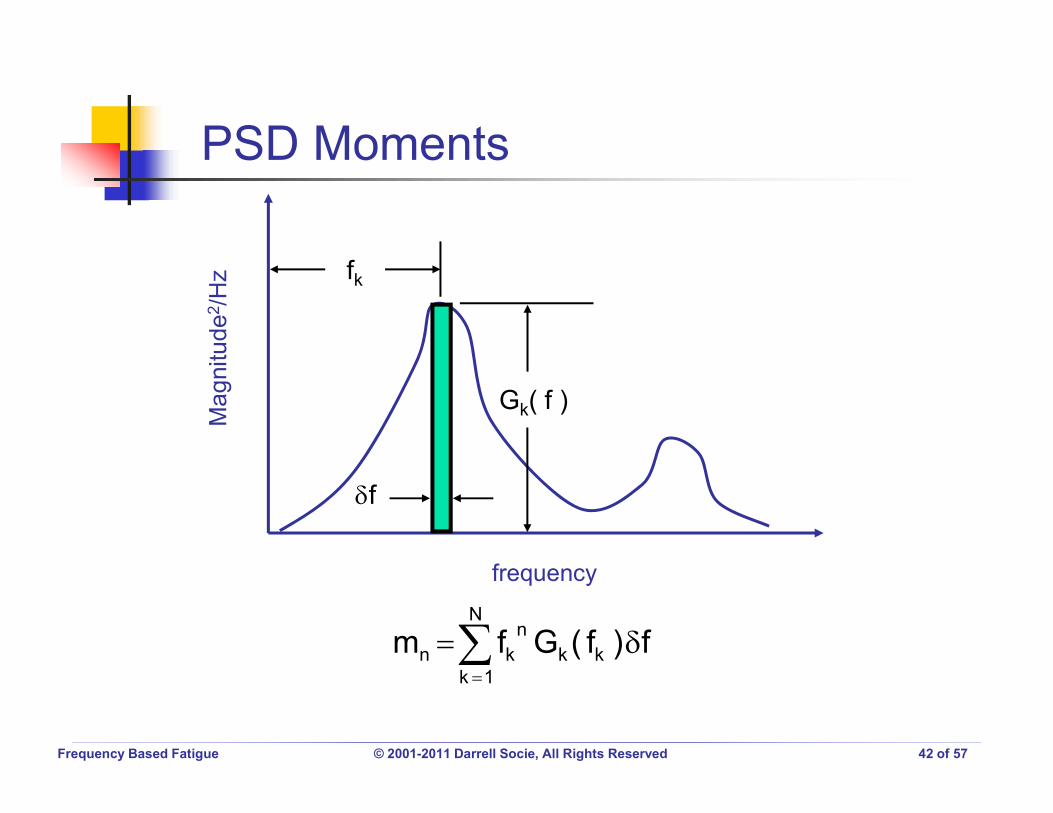
frequency
Gk( f )
fk
f
N
1kkk
nkn f)f(Gfm

Frequency Based Fatigue © 2001-2011 Darrell Socie, All Rights Reserved 43 of 57
0
2
mm)0(E
2
4
mm)P(E
40
22
mmm
)P(E)0(EIF
zero crossings
peaks
Irregularity factor

Frequency Based Fatigue © 2001-2011 Darrell Socie, All Rights Reserved 44 of 57
p( Si )
Si
S
Stress range
The probability P( Si ) of a stress range occurring between
S)S(p)S(Pis2SSand
2SS iiii

Frequency Based Fatigue © 2001-2011 Darrell Socie, All Rights Reserved 45 of 57
Cycles at level i ni = p( Si ) S NT
Total cycles NT = E( P ) T
Total time
b1
'f
iif S2
S)S(NFatigue life
Fatigue DamageN
1i b1
i
ib1
'f
N
1i if
i
S
)S(p)S2(ST)P(E
)S(NnD
Fatigue damage is determined by p( Si )
Frequency Based Fatigue © 2001-2011 Darrell Socie, All Rights Reserved 46 of 57
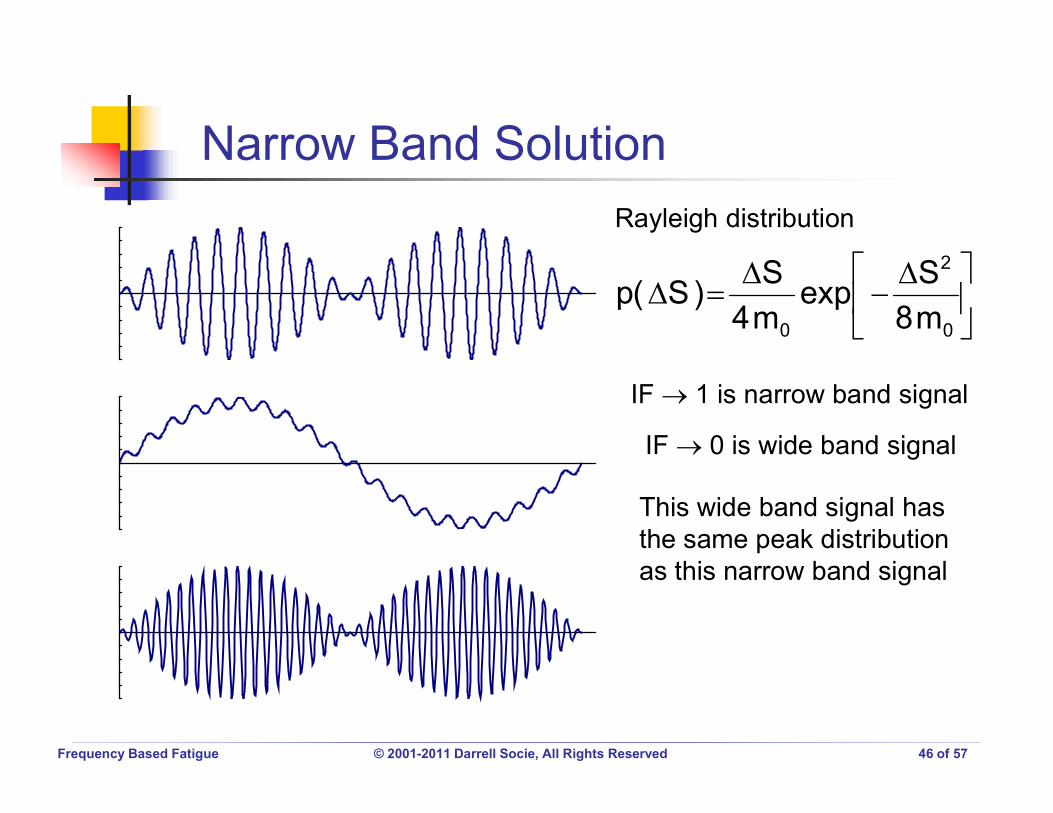
0
2
0 m8Sexp
m4S)S(p
Rayleigh distribution
This wide band signal has the same peak distribution as this narrow band signal
IF 1 is narrow band signal
IF 0 is wide band signal

Frequency Based Fatigue © 2001-2011 Darrell Socie, All Rights Reserved 47 of 57
0
2
32
2
221
m22ZexpZD
RZexp
RD
QZexp
QD
)S(p
0m2SZ
40
2
mmmIF
4
2
0
1m m
mmmX 2
2m
1 IF1IFX2D
R1DDIF1D
211
2211
21m
DDIF1DXIFR
1
21
D4RDDIF5Q
213 DD1D
p( S ) = f ( m0, m1, m2, m4 )
Frequency Based Fatigue © 2001-2011 Darrell Socie, All Rights Reserved 48 of 57

Frequency Based Fatigue © 2001-2011 Darrell Socie, All Rights Reserved 49 of 57
PSD
Time History
Stress Range
Frequency Based Fatigue © 2001-2011 Darrell Socie, All Rights Reserved 50 of 57
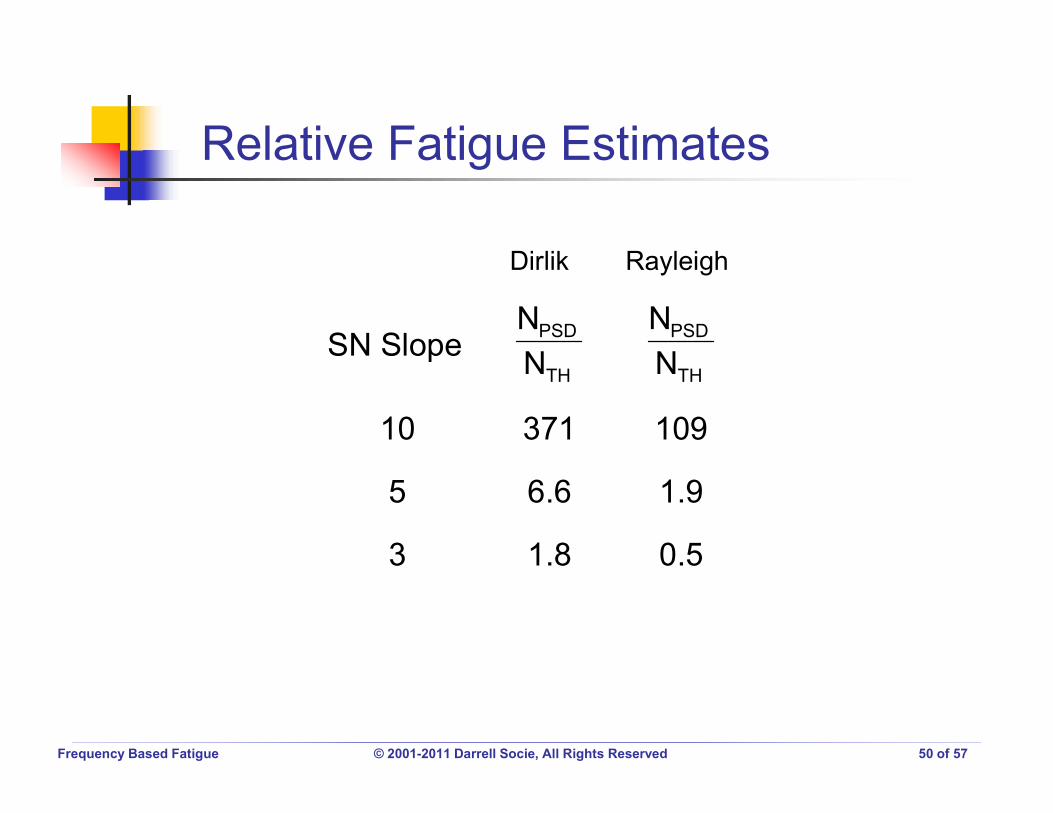
SN SlopeTH
PSD
NN
10 371
5 6.6
3 1.8
TH
PSD
NN
109
1.9
0.5
Dirlik Rayleigh
Frequency Based Fatigue © 2001-2011 Darrell Socie, All Rights Reserved 51 of 57
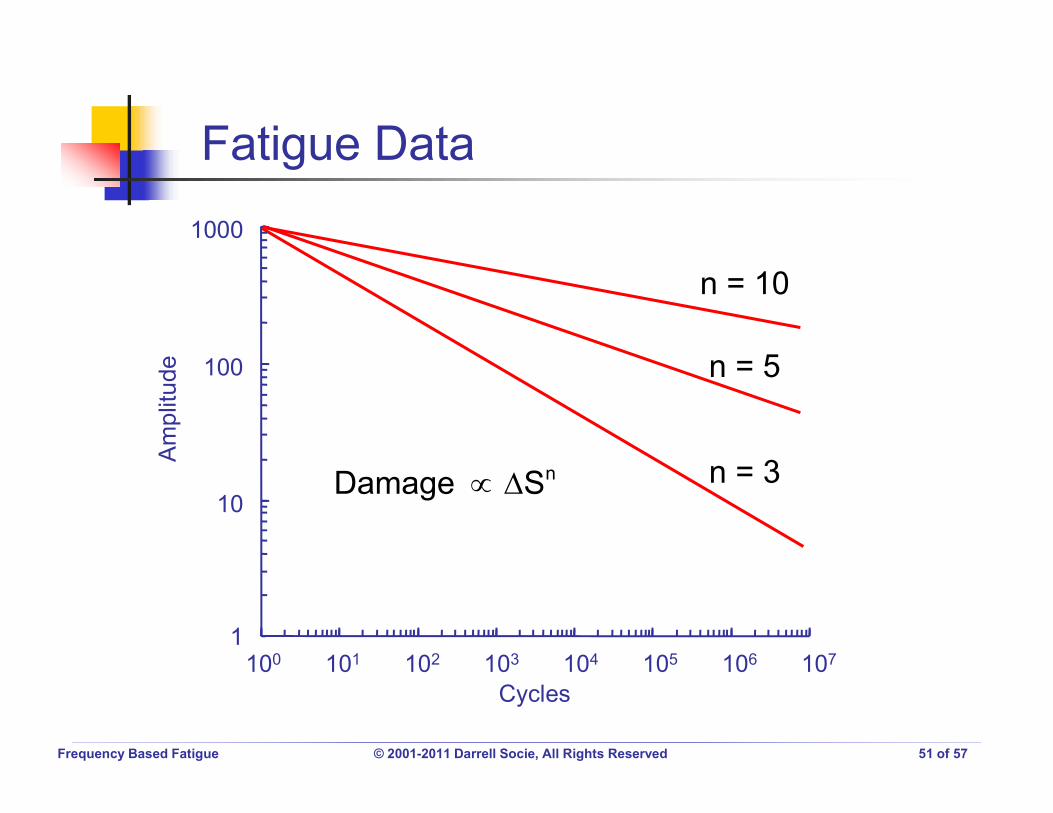
1
10
100
100
Cycles101 102 103 104 105 106 107
1000
n = 10
n = 5
n = 3nSDamage
Frequency Based Fatigue © 2001-2011 Darrell Socie, All Rights Reserved 52 of 57
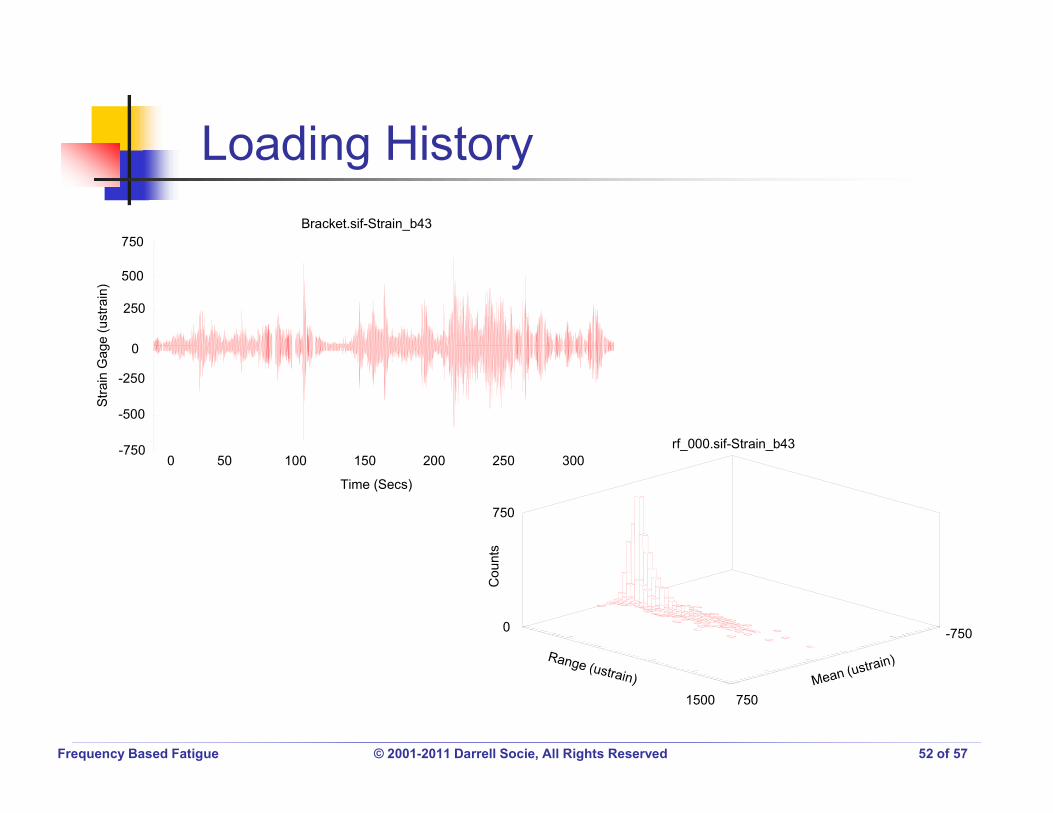
Time (Secs)
50 100 150 200 250 300
750
500
250
0
-250
-500
-750
Bracket.sif-Strain_b43
0
1500
-750
750
0
750
rf_000.sif-Strain_b43

Frequency Based Fatigue © 2001-2011 Darrell Socie, All Rights Reserved 53 of 57
0
1500
-750
750
3.15
Damage

Frequency Based Fatigue © 2001-2011 Darrell Socie, All Rights Reserved 54 of 57
0
1500
-750
750
5.14
Damage

Frequency Based Fatigue © 2001-2011 Darrell Socie, All Rights Reserved 55 of 57
0
1500
-750
750
20.78
Damage

Frequency Based Fatigue