Embed Size (px)
Citation preview

Th
e
Ph
il
ip
pi
ne
s
Domestic Workers in the Philippines:
Profile and Working Conditions
Domestic workers are those who work in and for a household or households in
an employment relationship (Convention No. 189). They perform a range of services and tasks; they may cook, clean the house, wash and iron laundry, watch over young children, take care of the elderly or the sick, take care of the family
This Factsheet presents the profile of domestic workers and their employers in the Philippines, and
provides an insight into two important aspects of domestic work, namely, wages and working hours. The findings are based on an analysis of micro-datasets of the Labor Force Surveys of 2010 and the Family Income and Expenditure Survey 2009. To establish historical trends, data from previous Labor Force Surveys and FIES 2003 and 2006 are cited. The LFS generates data on the number of domestic workers, their characteristics, wages and working hours, while the FIES provides data on the income and expenditure of employers of domestic workers. By providing nationally representative, reliable empirical information on domestic work, this Factsheet aims to promote informed policy dialogue and decision-making on measures that improve the working and living conditions of domestic workers.
garden, drive the family car, guard the house and/or even take care of the family pet. Although domestic workers perform essential services for the well-being of families and the smooth functioning of the national economy, they have long been ignored in labour legislation and social policy.
Identifying domestic workers in the Philippine Labor Force Survey
The two central elements of the definition of domestic work in Convention No. 189 are that it is performed within an employment relationship and in or for a household (i.e. regardless of the specific tasks that the domestic worker performs). Existing statistical classifications, i.e., by occupation, status in employment or industry, were not designed with the primary objective of identifying domestic workers. However, the International Standard Industrial Classification (ISIC), in its still widely-used Revision 3.1, matches this definition well. Its Division 95 “Activities of private households as employers of domestic staff” includes “[…] the activities of households as employers of domestic personnel such as maids, cooks, waiters, valets, butlers, laundresses, gardeners, gatekeepers, stable-lads, chauffeurs, caretakers, governesses, babysitters, tutors, secretaries etc. It allows the domestic personnel employed to state the activity of their employer in censuses or studies, even though the employer is an individual” (ISIC Revision 3.1). Live-in domestic workers are those classified as ‘domestic helpers’ in the variable ‘relationship to household head” in the roster of household members. Live-out domestic workers are those whose occupation falls under ISIC Division 95, and who can have any relationship to the household head or be a household head themselves except “domestic worker”.
Source: ILO, 2011, Global and regional estimates of domestic workers, Domestic Work Policy Brief No.1, Geneva.
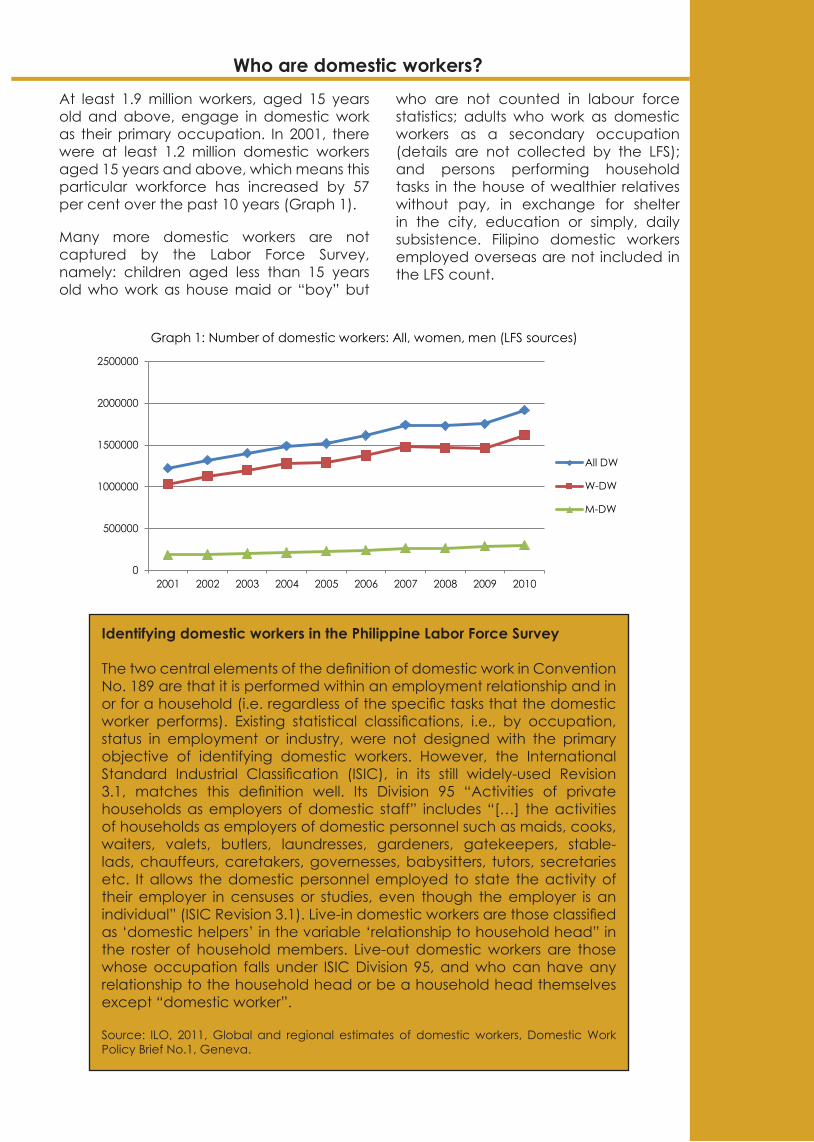
At least 1.9 million workers, aged 15 years old and above, engage in domestic work as their primary occupation. In 2001, there were at least 1.2 million domestic workers aged 15 years and above, which means this particular workforce has increased by 57 per cent over the past 10 years (Graph 1).
Many more domestic workers are not captured by the Labor Force Survey, namely: children aged less than 15 years old who work as house maid or “boy” but
who are not counted in labour force statistics; adults who work as domestic workers as a secondary occupation (details are not collected by the LFS); and persons performing household tasks in the house of wealthier relatives without pay, in exchange for shelter in the city, education or simply, daily subsistence. Filipino domestic workers employed overseas are not included in the LFS count.
Who are domestic workers?
0
500000
1000000
1500000
2000000
2500000
2001 2002 2003 2004 2005 2006 2007 2008 2009 2010
Graph 1: Number of domestic workers: All, women, men (LFS sources)
All DW
W-DW
M-DW
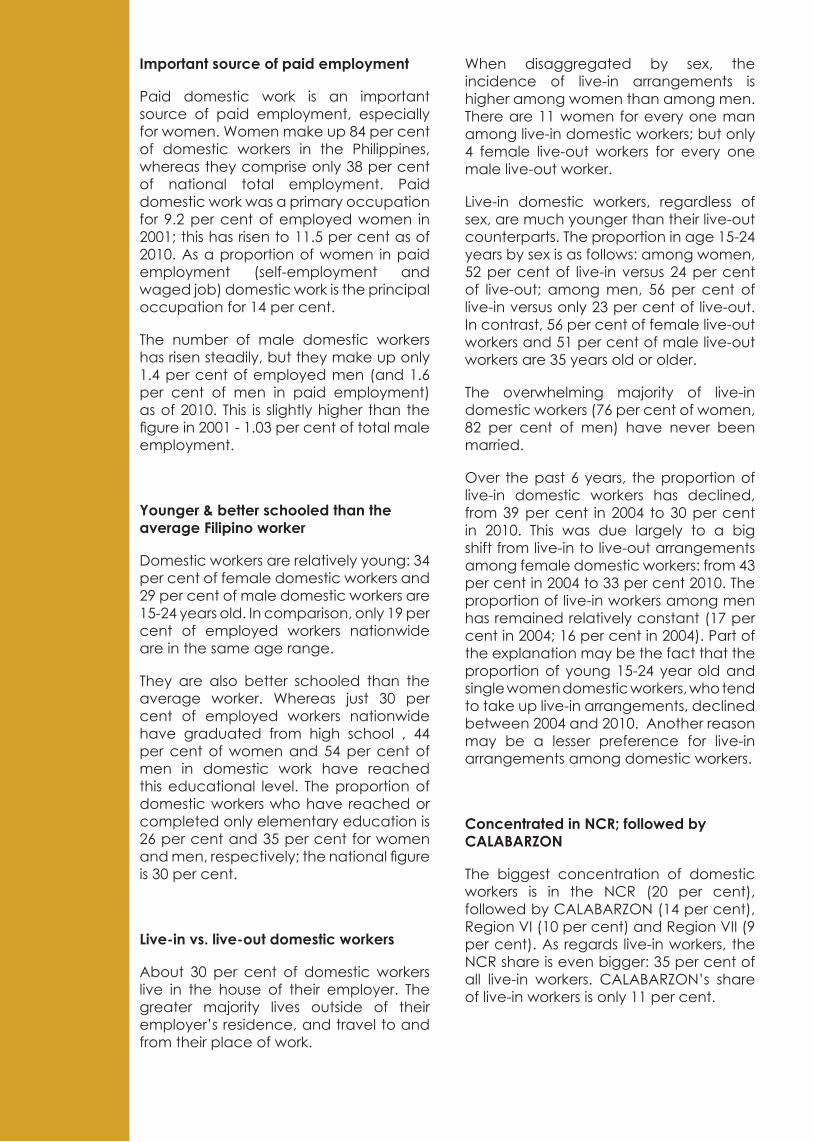
Important source of paid employment
Paid domestic work is an important source of paid employment, especially for women. Women make up 84 per cent of domestic workers in the Philippines, whereas they comprise only 38 per cent of national total employment. Paid domestic work was a primary occupation for 9.2 per cent of employed women in 2001; this has risen to 11.5 per cent as of 2010. As a proportion of women in paid employment (self-employment and waged job) domestic work is the principal occupation for 14 per cent.
The number of male domestic workers has risen steadily, but they make up only 1.4 per cent of employed men (and 1.6 per cent of men in paid employment) as of 2010. This is slightly higher than the figure in 2001 - 1.03 per cent of total male employment.
Younger & better schooled than the average Filipino worker
Domestic workers are relatively young: 34 per cent of female domestic workers and 29 per cent of male domestic workers are 15-24 years old. In comparison, only 19 per cent of employed workers nationwide are in the same age range.
They are also better schooled than the average worker. Whereas just 30 per cent of employed workers nationwide have graduated from high school , 44 per cent of women and 54 per cent of men in domestic work have reached this educational level. The proportion of domestic workers who have reached or completed only elementary education is 26 per cent and 35 per cent for women and men, respectively; the national figure is 30 per cent.
Live-in vs. live-out domestic workers
About 30 per cent of domestic workers live in the house of their employer. The greater majority lives outside of their employer’s residence, and travel to and from their place of work.
When disaggregated by sex, the incidence of live-in arrangements is higher among women than among men. There are 11 women for every one man among live-in domestic workers; but only 4 female live-out workers for every one male live-out worker.
Live-in domestic workers, regardless of sex, are much younger than their live-out counterparts. The proportion in age 15-24 years by sex is as follows: among women, 52 per cent of live-in versus 24 per cent of live-out; among men, 56 per cent of live-in versus only 23 per cent of live-out. In contrast, 56 per cent of female live-out workers and 51 per cent of male live-out workers are 35 years old or older.
The overwhelming majority of live-in domestic workers (76 per cent of women, 82 per cent of men) have never been married.
Over the past 6 years, the proportion of live-in domestic workers has declined, from 39 per cent in 2004 to 30 per cent in 2010. This was due largely to a big shift from live-in to live-out arrangements among female domestic workers: from 43 per cent in 2004 to 33 per cent 2010. The proportion of live-in workers among men has remained relatively constant (17 per cent in 2004; 16 per cent in 2004). Part of the explanation may be the fact that the proportion of young 15-24 year old and single women domestic workers, who tend to take up live-in arrangements, declined between 2004 and 2010. Another reason may be a lesser preference for live-in arrangements among domestic workers.
Concentrated in NCR; followed by CALABARZON
The biggest concentration of domestic workers is in the NCR (20 per cent), followed by CALABARZON (14 per cent), Region VI (10 per cent) and Region VII (9 per cent). As regards live-in workers, the NCR share is even bigger: 35 per cent of all live-in workers. CALABARZON’s share of live-in workers is only 11 per cent.
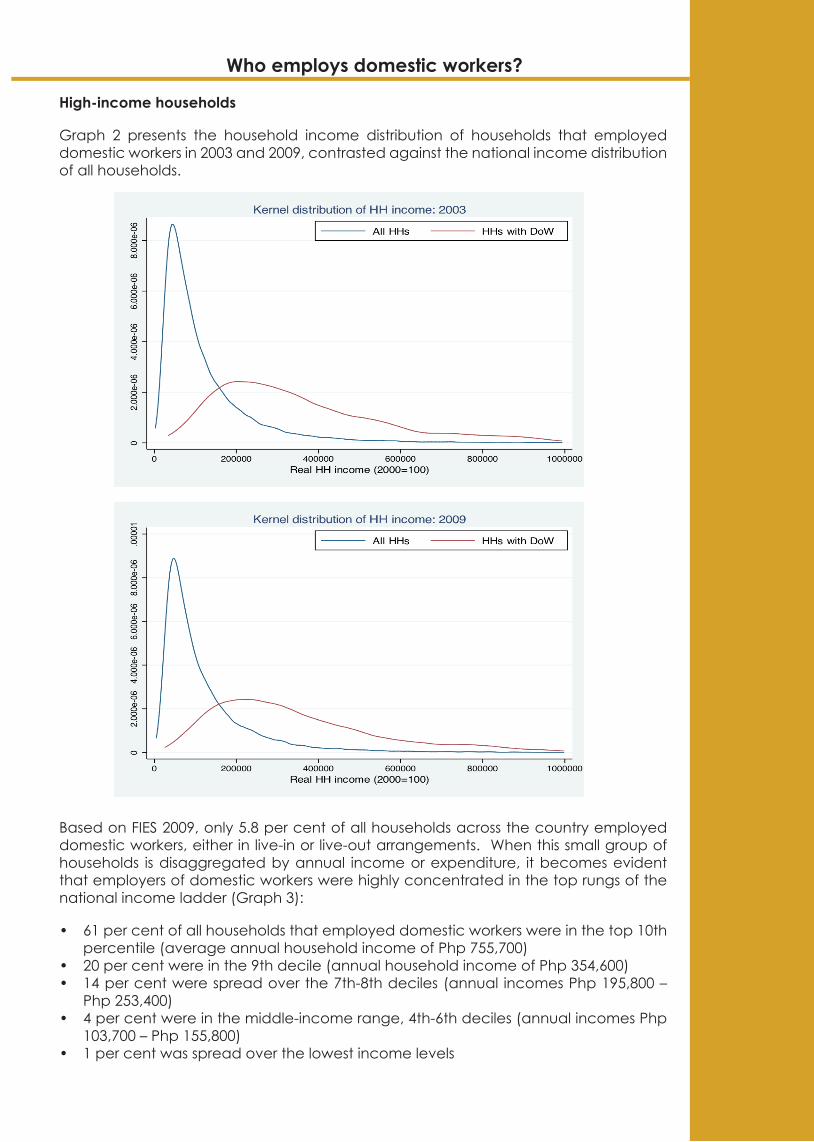
Based on FIES 2009, only 5.8 per cent of all households across the country employed domestic workers, either in live-in or live-out arrangements. When this small group of households is disaggregated by annual income or expenditure, it becomes evident that employers of domestic workers were highly concentrated in the top rungs of the national income ladder (Graph 3):
• 61 per cent of all households that employed domestic workers were in the top 10th percentile (average annual household income of Php 755,700)
• 20 per cent were in the 9th decile (annual household income of Php 354,600)• 14 per cent were spread over the 7th-8th deciles (annual incomes Php 195,800 –
Php 253,400)• 4 per cent were in the middle-income range, 4th-6th deciles (annual incomes Php
103,700 – Php 155,800)• 1 per cent was spread over the lowest income levels
Who employs domestic workers?
High-income households
Graph 2 presents the household income distribution of households that employed domestic workers in 2003 and 2009, contrasted against the national income distribution of all households.
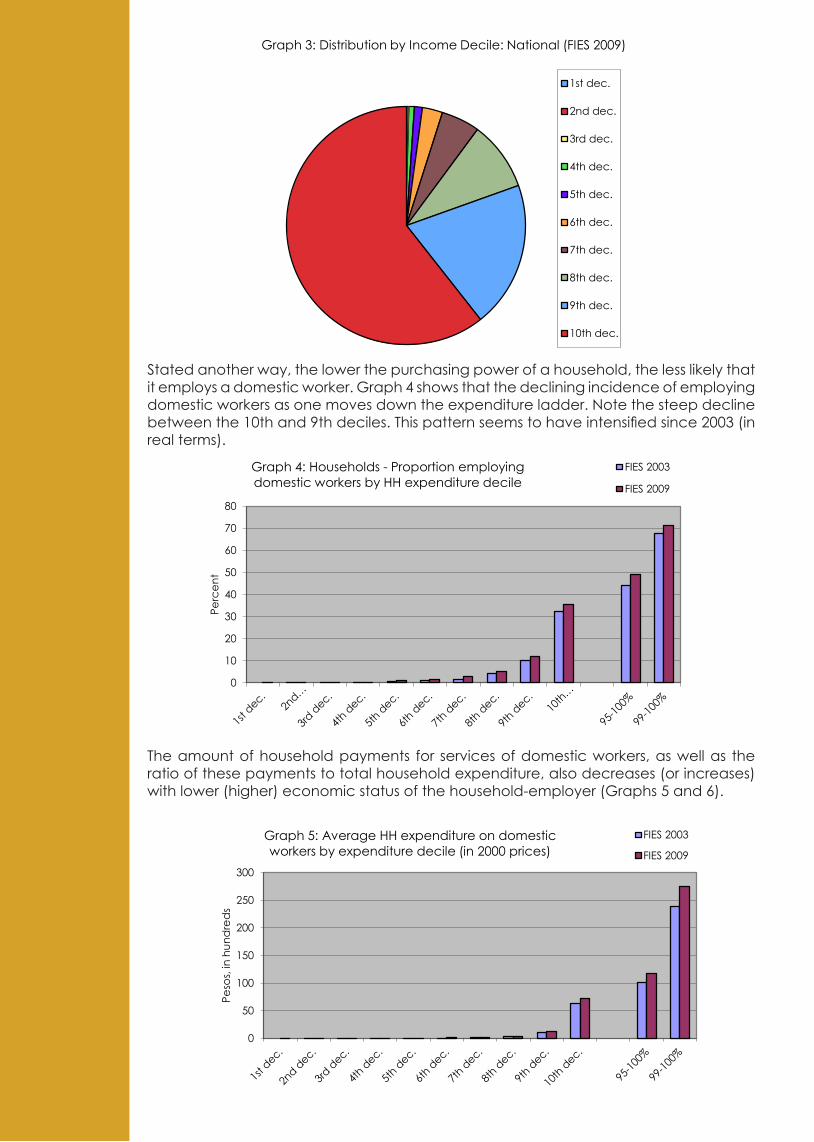
Stated another way, the lower the purchasing power of a household, the less likely that it employs a domestic worker. Graph 4 shows that the declining incidence of employing domestic workers as one moves down the expenditure ladder. Note the steep decline between the 10th and 9th deciles. This pattern seems to have intensified since 2003 (in real terms).
The amount of household payments for services of domestic workers, as well as the ratio of these payments to total household expenditure, also decreases (or increases) with lower (higher) economic status of the household-employer (Graphs 5 and 6).
0
10
20
30
40
50
60
70
80
Perc
ent
Graph 4: Households - Proportion employing domestic workers by HH expenditure decile
FIES 2003
FIES 2009
0
50
100
150
200
250
300
Peso
s, in
hun
dre
ds
Graph 5: Average HH expenditure on domestic workers by expenditure decile (in 2000 prices)
FIES 2003
FIES 2009
Graph 3: Distribution by Income Decile: National (FIES 2009)
1st dec.
2nd dec.
3rd dec.
4th dec.
5th dec.
6th dec.
7th dec.
8th dec.
9th dec.
10th dec.

As regards households that employ live-in workers, the matched LFS-FIES survey of 2006 shows that the proportion of domestic workers in live-in arrangements tends to be more concentrated in the highest income level. Whereas 60 per cent of households with domestic workers (live-in and live-out) were in the top 10 per cent of the national income distribution, 67 per cent of households with live-in domestic workers were in this income bracket. In other words, households in lower income groups largely employed live-out workers.
Average annual household expenditure on domestic workers
Table 1 gives the average expenditure on services of domestic workers for each segment of the population of households that employ domestic workers in 2009, at national level and at regional level, in the NCR and CALABARZON. Each segment is ranked along the household expenditure distribution.
Other characteristics of households that employ domestic workers
One of the reasons households employ domestic workers is to liberate their
time (often, female members of the household) from housework and family care tasks, enabling them to engage in a paid occupation and/or have more time for rest, leisure and family. One might thus expect households that have young children and/or elderly members to be more likely to employ domestic workers than those who have fewer dependent members.
Households that employ domestic workers have average 4.5 members, versus 4.8 members of households that do not. The proportion of households with children aged less than 7 years old, or elderly members (more than 60 years old), and which employ domestic workers is 1-2 percentage points higher than the national figure (Table 2). Households headed by women have a much higher frequency (3 percentage points) of employing domestic workers than men-headed households, who probably had wives, sisters or mothers who did the household tasks. Women heading households tend to be slightly older, with average age at 52 years, than male household heads (50 years old). These are interesting results and may be important especially for households in the 9th and lower income deciles. Further analysis is needed to draw conclusions.
0.0
0.5
1.0
1.5
2.0
2.5
3.0
3.5
4.0
Perc
ent
Graph 6: Expenditure on domestic workers: Share of total HH expenditure, by expenditure decile
FIES 2003
FIES 2009
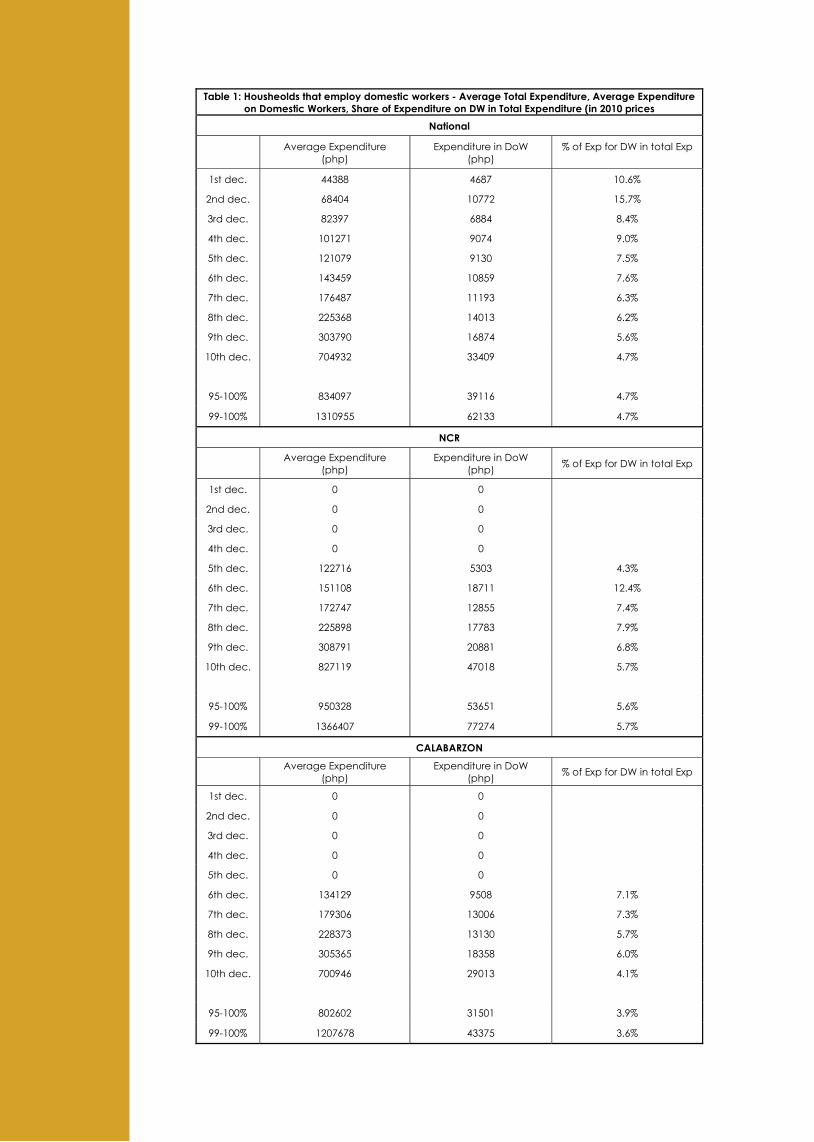
Table 1: Housheolds that employ domestic workers - Average Total Expenditure, Average Expenditure on Domestic Workers, Share of Expenditure on DW in Total Expenditure (in 2010 prices
National
Average Expenditure (php)
Expenditure in DoW (php)
% of Exp for DW in total Exp
1st dec. 44388 4687 10.6%
2nd dec. 68404 10772 15.7%
3rd dec. 82397 6884 8.4%
4th dec. 101271 9074 9.0%
5th dec. 121079 9130 7.5%
6th dec. 143459 10859 7.6%
7th dec. 176487 11193 6.3%
8th dec. 225368 14013 6.2%
9th dec. 303790 16874 5.6%
10th dec. 704932 33409 4.7%
95-100% 834097 39116 4.7%
99-100% 1310955 62133 4.7%
NCR
Average Expenditure (php)
Expenditure in DoW (php) % of Exp for DW in total Exp
1st dec. 0 0
2nd dec. 0 0
3rd dec. 0 0
4th dec. 0 0
5th dec. 122716 5303 4.3%
6th dec. 151108 18711 12.4%
7th dec. 172747 12855 7.4%
8th dec. 225898 17783 7.9%
9th dec. 308791 20881 6.8%
10th dec. 827119 47018 5.7%
95-100% 950328 53651 5.6%
99-100% 1366407 77274 5.7%
CALABARZON
Average Expenditure (php)
Expenditure in DoW (php) % of Exp for DW in total Exp
1st dec. 0 0
2nd dec. 0 0
3rd dec. 0 0
4th dec. 0 0
5th dec. 0 0
6th dec. 134129 9508 7.1%
7th dec. 179306 13006 7.3%
8th dec. 228373 13130 5.7%
9th dec. 305365 18358 6.0%
10th dec. 700946 29013 4.1%
95-100% 802602 31501 3.9%
99-100% 1207678 43375 3.6%
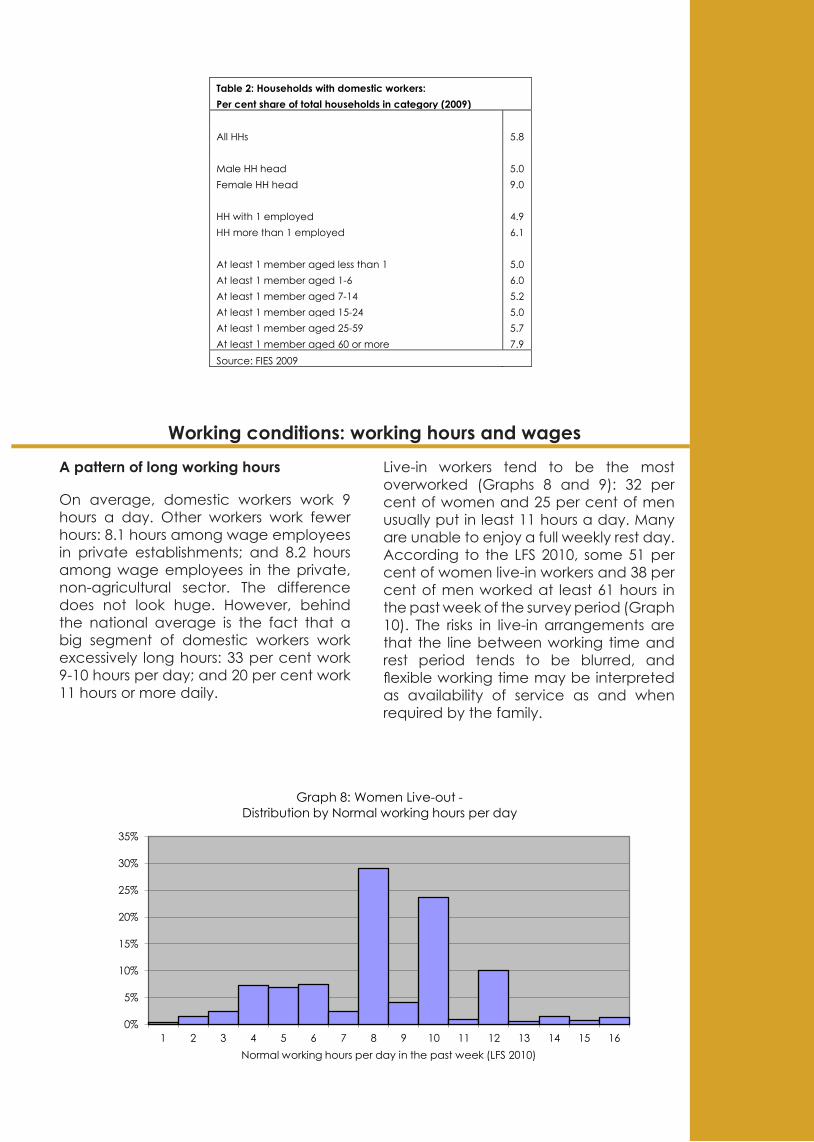
A pattern of long working hours
On average, domestic workers work 9 hours a day. Other workers work fewer hours: 8.1 hours among wage employees in private establishments; and 8.2 hours among wage employees in the private, non-agricultural sector. The difference does not look huge. However, behind the national average is the fact that a big segment of domestic workers work excessively long hours: 33 per cent work 9-10 hours per day; and 20 per cent work 11 hours or more daily.
Working conditions: working hours and wagesLive-in workers tend to be the most overworked (Graphs 8 and 9): 32 per cent of women and 25 per cent of men usually put in least 11 hours a day. Many are unable to enjoy a full weekly rest day. According to the LFS 2010, some 51 per cent of women live-in workers and 38 per cent of men worked at least 61 hours in the past week of the survey period (Graph 10). The risks in live-in arrangements are that the line between working time and rest period tends to be blurred, and flexible working time may be interpreted as availability of service as and when required by the family.
0%
5%
10%
15%
20%
25%
30%
35%
1 2 3 4 5 6 7 8 9 10 11 12 13 14 15 16Normal working hours per day in the past week (LFS 2010)
Graph 8: Women Live-out -Distribution by Normal working hours per day
Table 2: Households with domestic workers: Per cent share of total households in category (2009)
All HHs 5.8
Male HH head 5.0 Female HH head 9.0 HH with 1 employed 4.9 HH more than 1 employed 6.1 At least 1 member aged less than 1 5.0 At least 1 member aged 1-6 6.0 At least 1 member aged 7-14 5.2 At least 1 member aged 15-24 5.0At least 1 member aged 25-59 5.7 At least 1 member aged 60 or more 7.9Source: FIES 2009

Daily wages are low
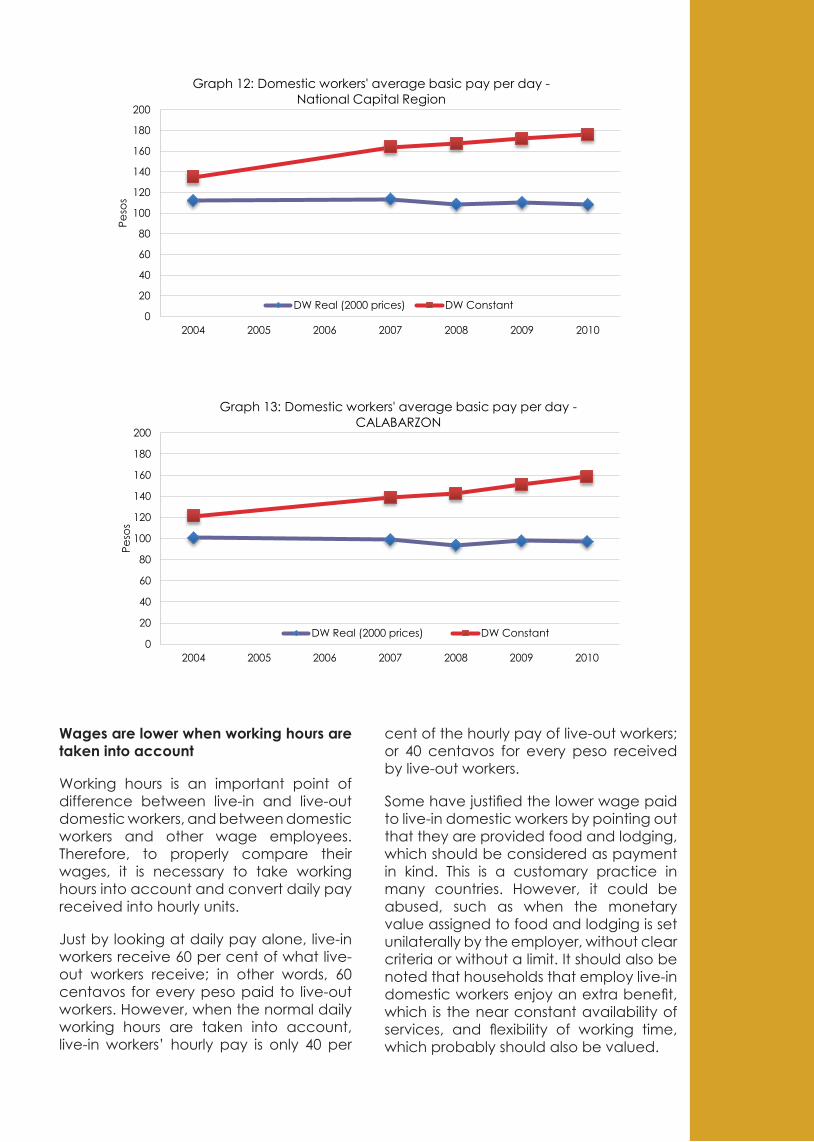
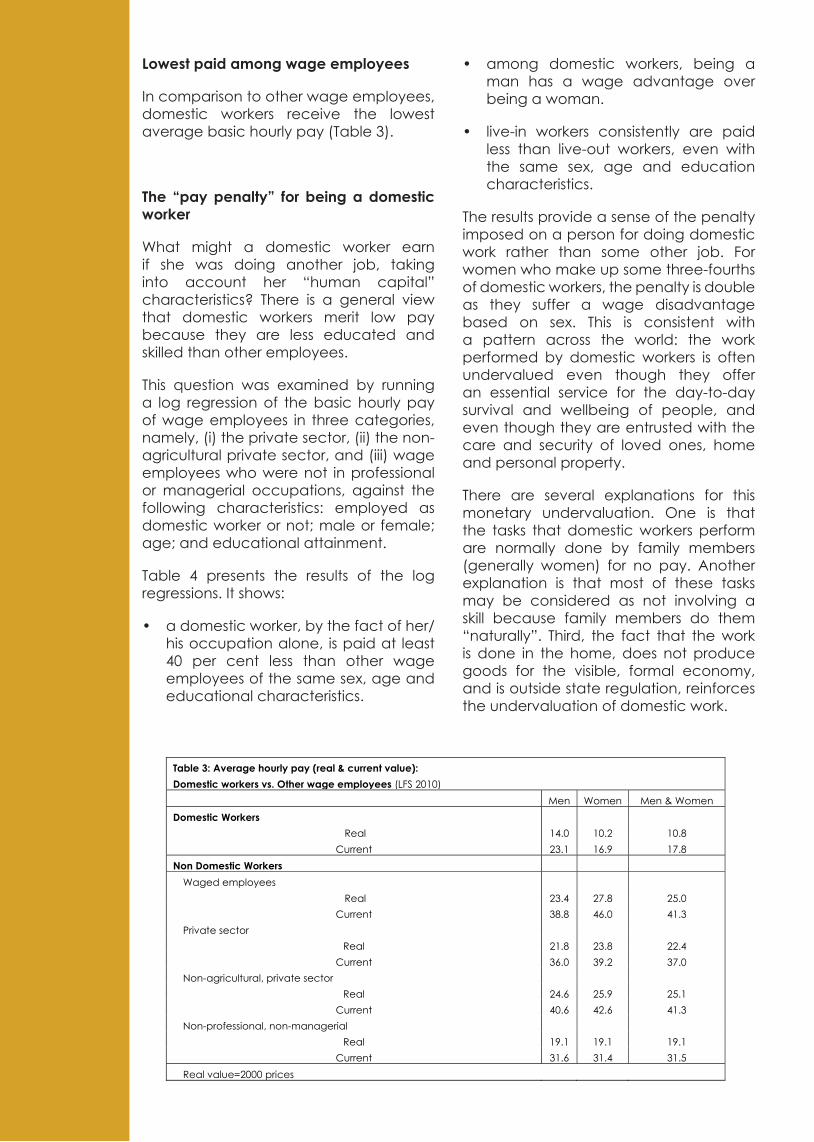
In 2010, the average daily pay received by domestic workers was:
• P132.6 per day for the whole country• P176.2 per day in NCR• P158.3 per day in CALABARZON
Actual pay has risen slightly since 2004, but their real value has barely moved, even declining slightly in the capital region.
0
20
40
60
80
100
120
140
160
180
200
2004 2005 2006 2007 2008 2009 2010
Peso
s
Graph 11: Domestic workers' average basic pay per day National level
DW Real (2000 prices) DW Constant
0%
5%
10%
15%
20%
25%
30%
35%
40%
45%
50%
1 2 3 4 5 6 7 8 9 10 11 12 13 14 15 16Normal working hours per day (LFS 2010)
Graph 9: Women Live-in -Distribution by normal working hours per day
0%
5%
10%
15%
20%
25%
30%
0 3 6 9 12 15 20 24 27 32 36 43 46 49 52 55 59 63 66 72 76 80 86 90 94 98 105
Hours worked in the past week (LFS 2010)
Graph 10: Women Live-in -Distribution by hours worked in the past week
Wages are lower when working hours are taken into account
Working hours is an important point of difference between live-in and live-out domestic workers, and between domestic workers and other wage employees. Therefore, to properly compare their wages, it is necessary to take working hours into account and convert daily pay received into hourly units.
Just by looking at daily pay alone, live-in workers receive 60 per cent of what live-out workers receive; in other words, 60 centavos for every peso paid to live-out workers. However, when the normal daily working hours are taken into account, live-in workers’ hourly pay is only 40 per
cent of the hourly pay of live-out workers; or 40 centavos for every peso received by live-out workers.
Some have justified the lower wage paid to live-in domestic workers by pointing out that they are provided food and lodging, which should be considered as payment in kind. This is a customary practice in many countries. However, it could be abused, such as when the monetary value assigned to food and lodging is set unilaterally by the employer, without clear criteria or without a limit. It should also be noted that households that employ live-in domestic workers enjoy an extra benefit, which is the near constant availability of services, and flexibility of working time, which probably should also be valued.
0
20
40
60
80
100
120
140
160
180
200
2004 2005 2006 2007 2008 2009 2010
Peso
s
Graph 13: Domestic workers' average basic pay per day -CALABARZON
DW Real (2000 prices) DW Constant
0
20
40
60
80
100
120
140
160
180
200
2004 2005 2006 2007 2008 2009 2010
Peso
s
Graph 12: Domestic workers' average basic pay per day -National Capital Region
DW Real (2000 prices) DW Constant
Lowest paid among wage employees
In comparison to other wage employees, domestic workers receive the lowest average basic hourly pay (Table 3).
The “pay penalty” for being a domestic worker
What might a domestic worker earn if she was doing another job, taking into account her “human capital” characteristics? There is a general view that domestic workers merit low pay because they are less educated and skilled than other employees.
This question was examined by running a log regression of the basic hourly pay of wage employees in three categories, namely, (i) the private sector, (ii) the non-agricultural private sector, and (iii) wage employees who were not in professional or managerial occupations, against the following characteristics: employed as domestic worker or not; male or female; age; and educational attainment.
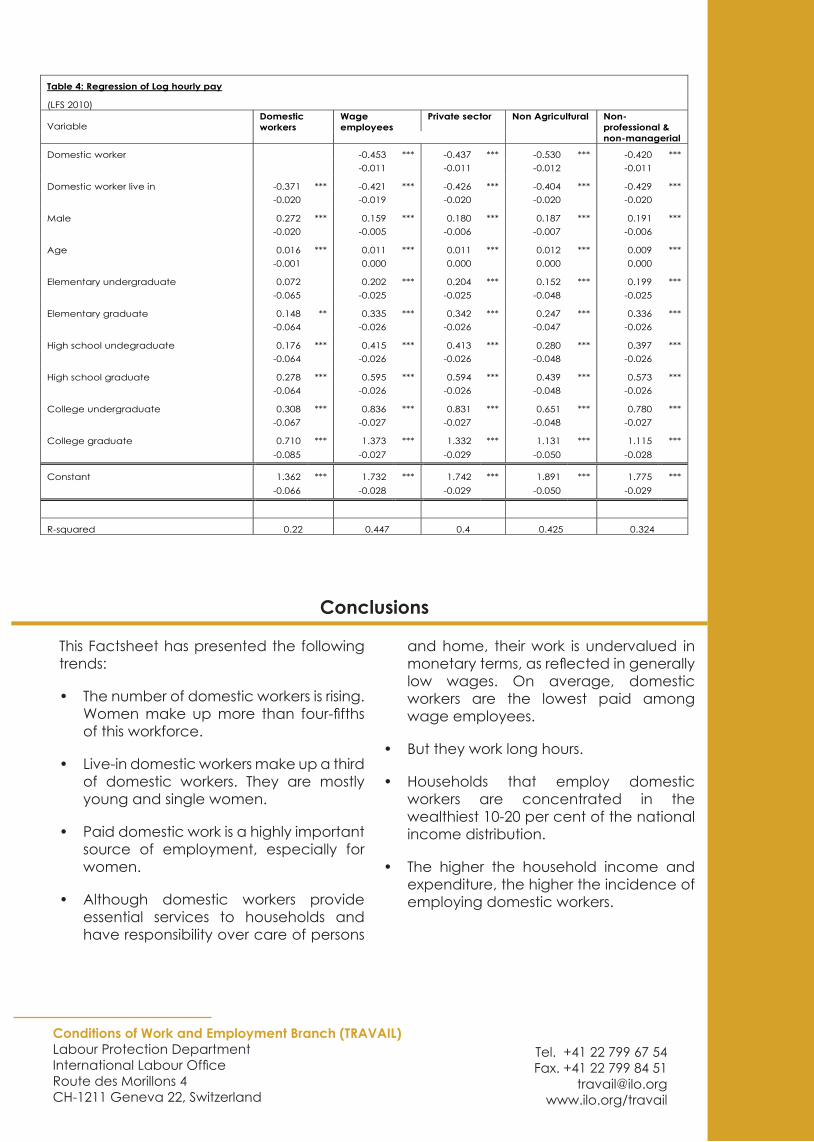
Table 4 presents the results of the log regressions. It shows:
• a domestic worker, by the fact of her/his occupation alone, is paid at least 40 per cent less than other wage employees of the same sex, age and educational characteristics.
• among domestic workers, being a man has a wage advantage over being a woman.
• live-in workers consistently are paid less than live-out workers, even with the same sex, age and education characteristics.
The results provide a sense of the penalty imposed on a person for doing domestic work rather than some other job. For women who make up some three-fourths of domestic workers, the penalty is double as they suffer a wage disadvantage based on sex. This is consistent with a pattern across the world: the work performed by domestic workers is often undervalued even though they offer an essential service for the day-to-day survival and wellbeing of people, and even though they are entrusted with the care and security of loved ones, home and personal property.
There are several explanations for this monetary undervaluation. One is that the tasks that domestic workers perform are normally done by family members (generally women) for no pay. Another explanation is that most of these tasks may be considered as not involving a skill because family members do them “naturally”. Third, the fact that the work is done in the home, does not produce goods for the visible, formal economy, and is outside state regulation, reinforces the undervaluation of domestic work.
Table 3: Average hourly pay (real & current value): Domestic workers vs. Other wage employees (LFS 2010)
Men Women Men & WomenDomestic Workers
Real 14.0 10.2 10.8 Current 23.1 16.9 17.8
Non Domestic Workers Waged employees
Real 23.4 27.8 25.0 Current 38.8 46.0 41.3
Private sector Real 21.8 23.8 22.4
Current 36.0 39.2 37.0 Non-agricultural, private sector
Real 24.6 25.9 25.1 Current 40.6 42.6 41.3
Non-professional, non-managerial Real 19.1 19.1 19.1
Current 31.6 31.4 31.5 Real value=2000 prices
Conditions of Work and Employment Branch (TRAVAIL)Labour Protection DepartmentInternational Labour OfficeRoute des Morillons 4CH-1211 Geneva 22, Switzerland
Tel. +41 22 799 67 54Fax. +41 22 799 84 51
[email protected]/travail
This Factsheet has presented the following trends:
• The number of domestic workers is rising. Women make up more than four-fifths of this workforce.
• Live-in domestic workers make up a third of domestic workers. They are mostly young and single women.
• Paid domestic work is a highly important source of employment, especially for women.
• Although domestic workers provide essential services to households and have responsibility over care of persons
and home, their work is undervalued in monetary terms, as reflected in generally low wages. On average, domestic workers are the lowest paid among wage employees.
• But they work long hours.
• Households that employ domestic workers are concentrated in the wealthiest 10-20 per cent of the national income distribution.
• The higher the household income and expenditure, the higher the incidence of employing domestic workers.
Conclusions
Table 4: Regression of Log hourly pay
(LFS 2010)
Variable Domestic workers
Wage employees
Private sector Non Agricultural Non-professional & non-managerial
Domestic worker -0.453 *** -0.437 *** -0.530 *** -0.420 ***-0.011 -0.011 -0.012 -0.011
Domestic worker live in -0.371 *** -0.421 *** -0.426 *** -0.404 *** -0.429 ***-0.020 -0.019 -0.020 -0.020 -0.020
Male 0.272 *** 0.159 *** 0.180 *** 0.187 *** 0.191 ***-0.020 -0.005 -0.006 -0.007 -0.006
Age 0.016 *** 0.011 *** 0.011 *** 0.012 *** 0.009 ***-0.001 0.000 0.000 0.000 0.000
Elementary undergraduate 0.072 0.202 *** 0.204 *** 0.152 *** 0.199 *** -0.065 -0.025 -0.025 -0.048 -0.025
Elementary graduate 0.148 ** 0.335 *** 0.342 *** 0.247 *** 0.336 *** -0.064 -0.026 -0.026 -0.047 -0.026
High school undegraduate 0.176 *** 0.415 *** 0.413 *** 0.280 *** 0.397 *** -0.064 -0.026 -0.026 -0.048 -0.026
High school graduate 0.278 *** 0.595 *** 0.594 *** 0.439 *** 0.573 *** -0.064 -0.026 -0.026 -0.048 -0.026
College undergraduate 0.308 *** 0.836 *** 0.831 *** 0.651 *** 0.780 ***-0.067 -0.027 -0.027 -0.048 -0.027
College graduate 0.710 *** 1.373 *** 1.332 *** 1.131 *** 1.115 ***-0.085 -0.027 -0.029 -0.050 -0.028
Constant 1.362 *** 1.732 *** 1.742 *** 1.891 *** 1.775 *** -0.066 -0.028 -0.029 -0.050 -0.029
R-squared 0.22 0.447 0.4 0.425 0.324