Embed Size (px)
Citation preview
Profile of Children and Young People in WA
January 2020
Recognising Aboriginal and Torres Strait Islander People
The Commissioner for Children and Young People WA acknowledges the unique culture and heritage of our Aboriginal peoples and the contributions Aboriginal peoples have made and continue to make to Western Australian society. For the purposes of this publication, the term ‘Aboriginal’ is intended to encompass the diverse cultures and identities of the First Peoples of Western Australia and also recognises those of Torres Strait Islander descent who call Western Australia home.
Suggested citation
Commissioner for Children and Young People WA 2020, Profile of Children and Young People in WA – January 2020, Commissioner for Children and Young People WA, Perth
Alternative formats
On request, large print or alternative formats can be obtained from:
Commissioner for Children and Young People Ground Floor, 1 Alvan Street, Subiaco WA 6008 Telephone: (08) 6213 2297 Freecall: 1800 072 444 Email: [email protected] Web: ccyp.wa.gov.au
ISSN: 2652-4694
ContentsPopulation .............................................................................................................6
Gender .........................................................................................................................8
Cultural background .....................................................................................................8
Geographical distribution ..............................................................................................9
Aboriginal children and young people .........................................................................11
Disability .....................................................................................................................13
Births ..........................................................................................................................14
Projected population growth .......................................................................................16
Family, childcare and education .............................................................17
Family composition .....................................................................................................17
Childcare ....................................................................................................................18
Education ...................................................................................................................19
Early development ......................................................................................................21
Vulnerability ......................................................................................................25
Housing and homelessness ........................................................................................25
Child poverty ..............................................................................................................27
Children and young people in the child protection system ...........................................29
Children and young people in the youth justice system ...............................................30
Western Australia’s children and young people
4 Commissioner for Children and Young People Western Australia
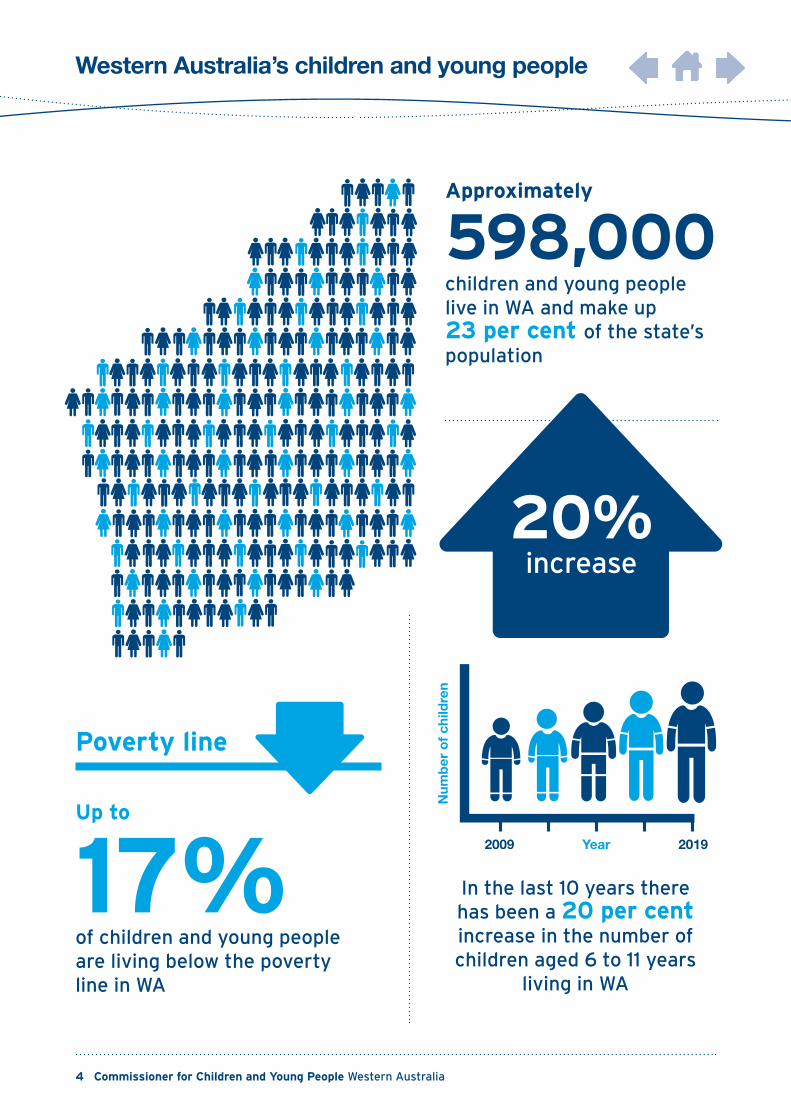
In the last 10 years there has been a 20 per cent increase in the number of children aged 6 to 11 years
living in WA
Up to
17%of children and young people are living below the poverty line in WA
Approximately
598,000children and young people live in WA and make up 23 per cent of the state’s population
Poverty line
Num
ber
of
child
ren
Year2009 2019
20%increase
Western Australia’s children and young people
Profile of Children and Young People in WA 5
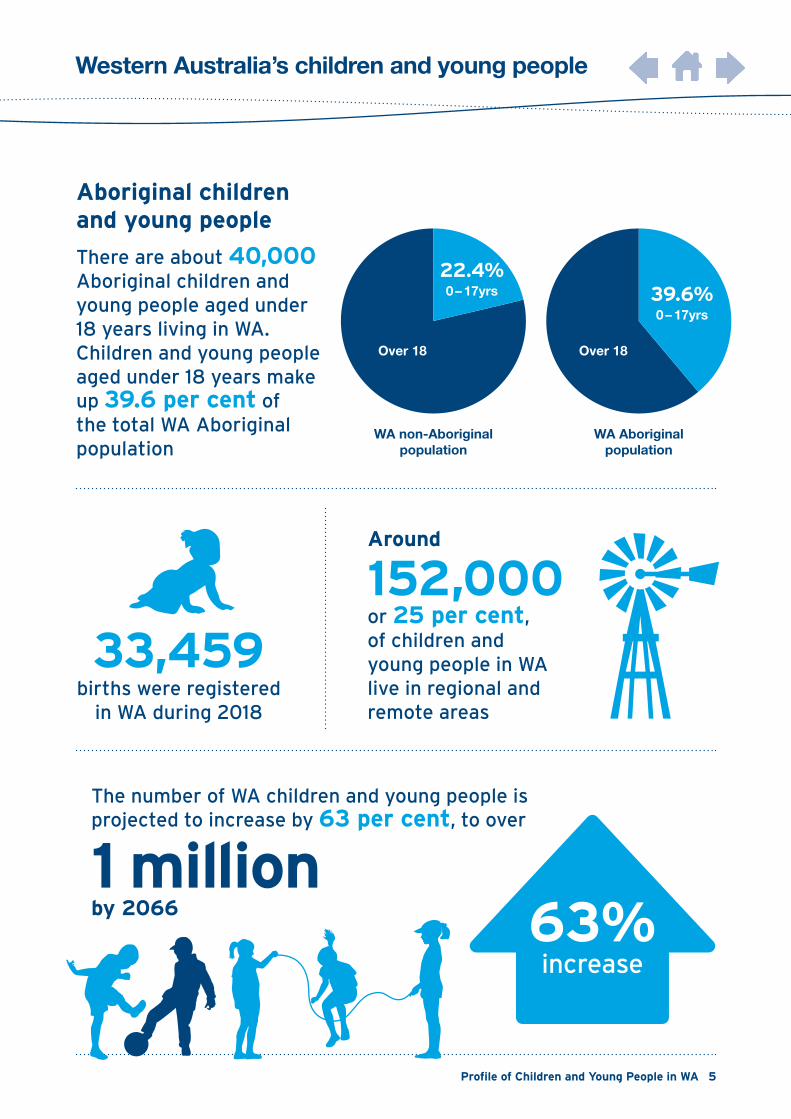
33,459 births were registered
in WA during 2018
The number of WA children and young people is projected to increase by 63 per cent, to over
1 million by 2066
There are about 40,000Aboriginal children andyoung people aged under18 years living in WA.Children and young people aged under 18 years make up 39.6 per cent of the total WA Aboriginal population
Aboriginal childrenand young people
WA Aboriginal population
Over 18
39.6%0 – 17yrs
WA non-Aboriginal population
Over 18
22.4%0 – 17yrs
Around
152,000or 25 per cent, of children and young people in WA live in regional and remote areas
63%increase
6 Commissioner for Children and Young People Western Australia
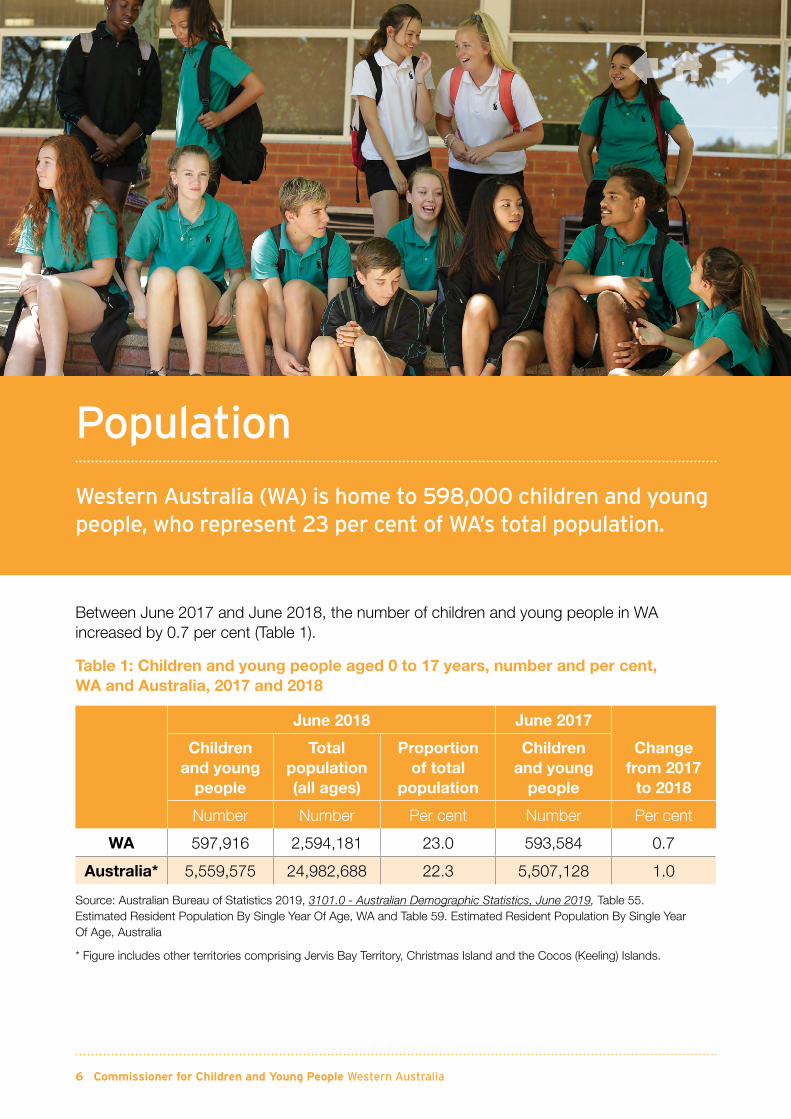
Between June 2017 and June 2018, the number of children and young people in WA increased by 0.7 per cent (Table 1).
Table 1: Children and young people aged 0 to 17 years, number and per cent, WA and Australia, 2017 and 2018
June 2018 June 2017
Change from 2017
to 2018
Children and young
people
Total population (all ages)
Proportion of total
population
Children and young
people
Number Number Per cent Number Per cent
WA 597,916 2,594,181 23.0 593,584 0.7
Australia* 5,559,575 24,982,688 22.3 5,507,128 1.0
Source: Australian Bureau of Statistics 2019, 3101.0 - Australian Demographic Statistics, June 2019, Table 55. Estimated Resident Population By Single Year Of Age, WA and Table 59. Estimated Resident Population By Single Year Of Age, Australia
* Figure includes other territories comprising Jervis Bay Territory, Christmas Island and the Cocos (Keeling) Islands.
Population
Western Australia (WA) is home to 598,000 children and young people, who represent 23 per cent of WA’s total population.
Profile of Children and Young People in WA 7
Population
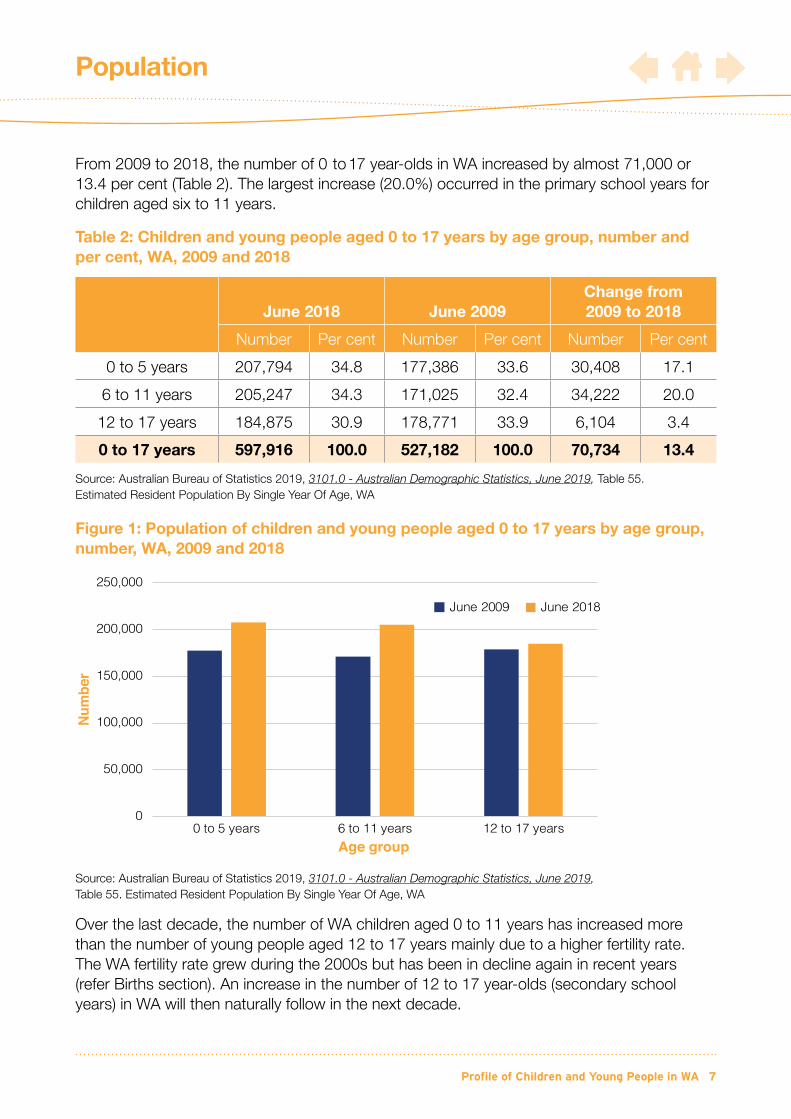
From 2009 to 2018, the number of 0 to 17 year-olds in WA increased by almost 71,000 or 13.4 per cent (Table 2). The largest increase (20.0%) occurred in the primary school years for children aged six to 11 years.
Table 2: Children and young people aged 0 to 17 years by age group, number and per cent, WA, 2009 and 2018
June 2018 June 2009Change from 2009 to 2018
Number Per cent Number Per cent Number Per cent
0 to 5 years 207,794 34.8 177,386 33.6 30,408 17.1
6 to 11 years 205,247 34.3 171,025 32.4 34,222 20.0
12 to 17 years 184,875 30.9 178,771 33.9 6,104 3.4
0 to 17 years 597,916 100.0 527,182 100.0 70,734 13.4
Source: Australian Bureau of Statistics 2019, 3101.0 - Australian Demographic Statistics, June 2019, Table 55. Estimated Resident Population By Single Year Of Age, WA
Figure 1: Population of children and young people aged 0 to 17 years by age group, number, WA, 2009 and 2018
Source: Australian Bureau of Statistics 2019, 3101.0 - Australian Demographic Statistics, June 2019, Table 55. Estimated Resident Population By Single Year Of Age, WA
Over the last decade, the number of WA children aged 0 to 11 years has increased more than the number of young people aged 12 to 17 years mainly due to a higher fertility rate. The WA fertility rate grew during the 2000s but has been in decline again in recent years (refer Births section). An increase in the number of 12 to 17 year-olds (secondary school years) in WA will then naturally follow in the next decade.
0
50,000
100,000
150,000
200,000
250,000
0 to 5 years 6 to 11 years 12 to 17 years
Num
ber
Age group
June 2009 June 2018
8 Commissioner for Children and Young People Western Australia
Population
Gender The gender distribution of children and young people in WA is 51.2 per cent male and 48.8 per cent female, which is consistent with most Australian states and territories and the national distribution.1
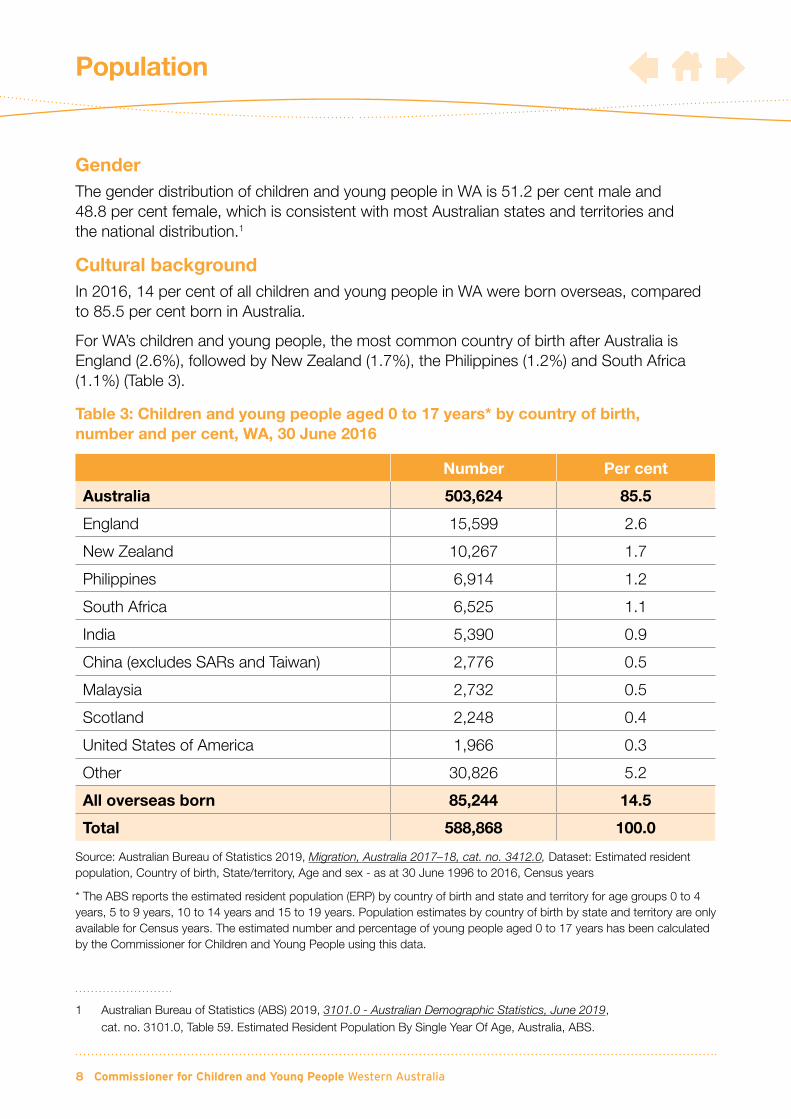
Cultural backgroundIn 2016, 14 per cent of all children and young people in WA were born overseas, compared to 85.5 per cent born in Australia.
For WA’s children and young people, the most common country of birth after Australia is England (2.6%), followed by New Zealand (1.7%), the Philippines (1.2%) and South Africa (1.1%) (Table 3).
Table 3: Children and young people aged 0 to 17 years* by country of birth, number and per cent, WA, 30 June 2016
Number Per cent
Australia 503,624 85.5
England 15,599 2.6
New Zealand 10,267 1.7
Philippines 6,914 1.2
South Africa 6,525 1.1
India 5,390 0.9
China (excludes SARs and Taiwan) 2,776 0.5
Malaysia 2,732 0.5
Scotland 2,248 0.4
United States of America 1,966 0.3
Other 30,826 5.2
All overseas born 85,244 14.5
Total 588,868 100.0
Source: Australian Bureau of Statistics 2019, Migration, Australia 2017–18, cat. no. 3412.0, Dataset: Estimated resident population, Country of birth, State/territory, Age and sex - as at 30 June 1996 to 2016, Census years
* The ABS reports the estimated resident population (ERP) by country of birth and state and territory for age groups 0 to 4 years, 5 to 9 years, 10 to 14 years and 15 to 19 years. Population estimates by country of birth by state and territory are only available for Census years. The estimated number and percentage of young people aged 0 to 17 years has been calculated by the Commissioner for Children and Young People using this data.
1 Australian Bureau of Statistics (ABS) 2019, 3101.0 - Australian Demographic Statistics, June 2019, cat. no. 3101.0, Table 59. Estimated Resident Population By Single Year Of Age, Australia, ABS.
Profile of Children and Young People in WA 9
Population
According to Census 2016 data, the majority of WA children and young people speak English at home (78.5%). The most common other languages spoken at home are Chinese languages (2.0%), Indian languages (1.8%) and South East Asian languages (1.7%).2
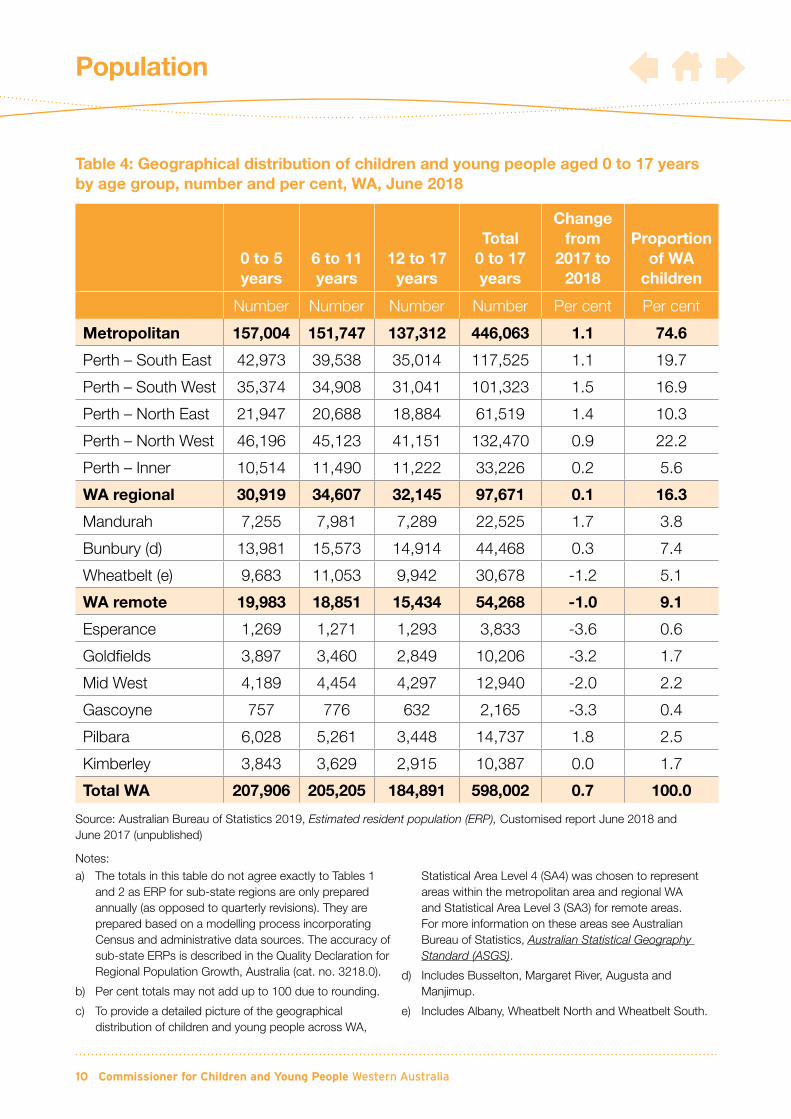
Geographical distributionThe geographical distribution of children and young people across WA remains largely unchanged from previous years. In 2018, around 75 per cent of the population of 0 to 17 year olds resided in the metropolitan area,3 a little less than 17 per cent resided in regional areas and just under 10 per cent in remote areas of WA (Table 4).
In the metropolitan area, Perth – South West and Perth – North East recorded an increase in the number of children and young people (1.5% and 1.4% respectively). Mandurah also recorded an increase of 1.7 per cent. In regional and remote areas, the Pilbara and Mandurah recorded increases (1.8% and 1.7% respectively) while Esperance and the Gascoyne recorded a decrease in the number of children and young people (3.6% and 3.3% respectively) (Table 4).
2 Australian Bureau of Statistics (ABS) 2018, Table-builder: 2016 Census – Cultural Diversity, ABS.
3 The metropolitan area corresponds to the five Perth Statistical Area Level 4s as defined by the Australian Bureau of Statistics. It does not include Mandurah.
10 Commissioner for Children and Young People Western Australia
Population
Table 4: Geographical distribution of children and young people aged 0 to 17 years by age group, number and per cent, WA, June 2018
0 to 5 years
6 to 11 years
12 to 17 years
Total 0 to 17 years
Change from
2017 to 2018
Proportion of WA
children
Number Number Number Number Per cent Per cent
Metropolitan 157,004 151,747 137,312 446,063 1.1 74.6
Perth – South East 42,973 39,538 35,014 117,525 1.1 19.7
Perth – South West 35,374 34,908 31,041 101,323 1.5 16.9
Perth – North East 21,947 20,688 18,884 61,519 1.4 10.3
Perth – North West 46,196 45,123 41,151 132,470 0.9 22.2
Perth – Inner 10,514 11,490 11,222 33,226 0.2 5.6
WA regional 30,919 34,607 32,145 97,671 0.1 16.3
Mandurah 7,255 7,981 7,289 22,525 1.7 3.8
Bunbury (d) 13,981 15,573 14,914 44,468 0.3 7.4
Wheatbelt (e) 9,683 11,053 9,942 30,678 -1.2 5.1
WA remote 19,983 18,851 15,434 54,268 -1.0 9.1
Esperance 1,269 1,271 1,293 3,833 -3.6 0.6
Goldfields 3,897 3,460 2,849 10,206 -3.2 1.7
Mid West 4,189 4,454 4,297 12,940 -2.0 2.2
Gascoyne 757 776 632 2,165 -3.3 0.4
Pilbara 6,028 5,261 3,448 14,737 1.8 2.5
Kimberley 3,843 3,629 2,915 10,387 0.0 1.7
Total WA 207,906 205,205 184,891 598,002 0.7 100.0
Source: Australian Bureau of Statistics 2019, Estimated resident population (ERP), Customised report June 2018 and June 2017 (unpublished)
Notes: a) The totals in this table do not agree exactly to Tables 1
and 2 as ERP for sub-state regions are only prepared annually (as opposed to quarterly revisions). They are prepared based on a modelling process incorporating Census and administrative data sources. The accuracy of sub-state ERPs is described in the Quality Declaration for Regional Population Growth, Australia (cat. no. 3218.0).
b) Per cent totals may not add up to 100 due to rounding.
c) To provide a detailed picture of the geographical distribution of children and young people across WA,
Statistical Area Level 4 (SA4) was chosen to represent areas within the metropolitan area and regional WA and Statistical Area Level 3 (SA3) for remote areas. For more information on these areas see Australian Bureau of Statistics, Australian Statistical Geography Standard (ASGS).
d) Includes Busselton, Margaret River, Augusta and Manjimup.
e) Includes Albany, Wheatbelt North and Wheatbelt South.
Profile of Children and Young People in WA 11
Population
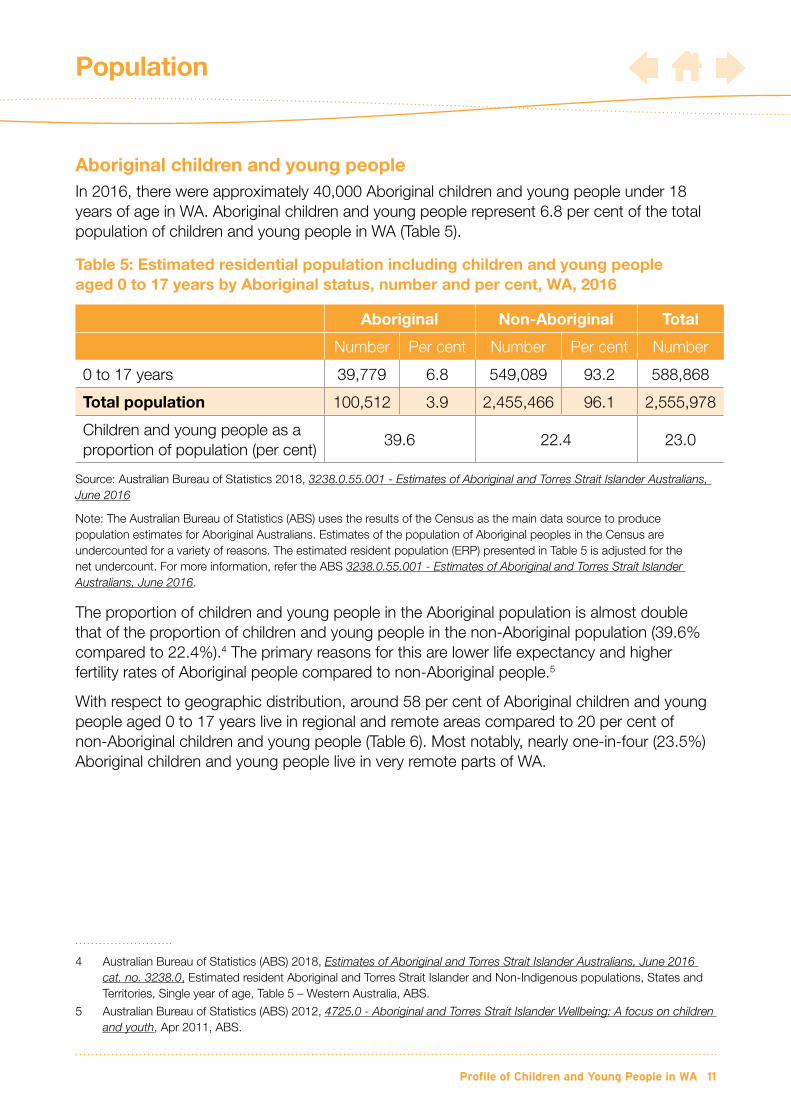
Aboriginal children and young peopleIn 2016, there were approximately 40,000 Aboriginal children and young people under 18 years of age in WA. Aboriginal children and young people represent 6.8 per cent of the total population of children and young people in WA (Table 5).
Table 5: Estimated residential population including children and young people aged 0 to 17 years by Aboriginal status, number and per cent, WA, 2016
Aboriginal Non-Aboriginal Total
Number Per cent Number Per cent Number
0 to 17 years 39,779 6.8 549,089 93.2 588,868
Total population 100,512 3.9 2,455,466 96.1 2,555,978
Children and young people as a proportion of population (per cent)
39.6 22.4 23.0
Source: Australian Bureau of Statistics 2018, 3238.0.55.001 - Estimates of Aboriginal and Torres Strait Islander Australians, June 2016
Note: The Australian Bureau of Statistics (ABS) uses the results of the Census as the main data source to produce population estimates for Aboriginal Australians. Estimates of the population of Aboriginal peoples in the Census are undercounted for a variety of reasons. The estimated resident population (ERP) presented in Table 5 is adjusted for the net undercount. For more information, refer the ABS 3238.0.55.001 - Estimates of Aboriginal and Torres Strait Islander Australians, June 2016.
The proportion of children and young people in the Aboriginal population is almost double that of the proportion of children and young people in the non-Aboriginal population (39.6% compared to 22.4%).4 The primary reasons for this are lower life expectancy and higher fertility rates of Aboriginal people compared to non-Aboriginal people.5
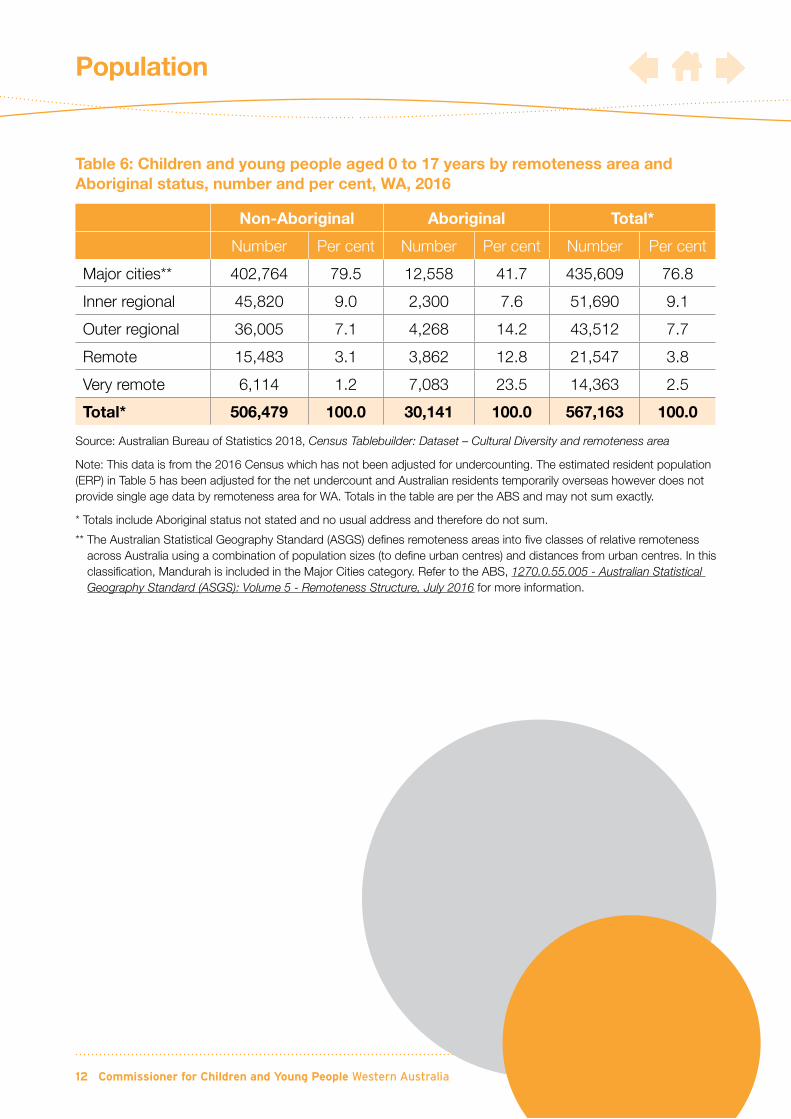
With respect to geographic distribution, around 58 per cent of Aboriginal children and young people aged 0 to 17 years live in regional and remote areas compared to 20 per cent of non-Aboriginal children and young people (Table 6). Most notably, nearly one-in-four (23.5%) Aboriginal children and young people live in very remote parts of WA.
4 Australian Bureau of Statistics (ABS) 2018, Estimates of Aboriginal and Torres Strait Islander Australians, June 2016 cat. no. 3238.0, Estimated resident Aboriginal and Torres Strait Islander and Non-Indigenous populations, States and Territories, Single year of age, Table 5 – Western Australia, ABS.
5 Australian Bureau of Statistics (ABS) 2012, 4725.0 - Aboriginal and Torres Strait Islander Wellbeing: A focus on children and youth, Apr 2011, ABS.
12 Commissioner for Children and Young People Western Australia
Population
Table 6: Children and young people aged 0 to 17 years by remoteness area and Aboriginal status, number and per cent, WA, 2016
Non-Aboriginal Aboriginal Total*
Number Per cent Number Per cent Number Per cent
Major cities** 402,764 79.5 12,558 41.7 435,609 76.8
Inner regional 45,820 9.0 2,300 7.6 51,690 9.1
Outer regional 36,005 7.1 4,268 14.2 43,512 7.7
Remote 15,483 3.1 3,862 12.8 21,547 3.8
Very remote 6,114 1.2 7,083 23.5 14,363 2.5
Total* 506,479 100.0 30,141 100.0 567,163 100.0
Source: Australian Bureau of Statistics 2018, Census Tablebuilder: Dataset – Cultural Diversity and remoteness area
Note: This data is from the 2016 Census which has not been adjusted for undercounting. The estimated resident population (ERP) in Table 5 has been adjusted for the net undercount and Australian residents temporarily overseas however does not provide single age data by remoteness area for WA. Totals in the table are per the ABS and may not sum exactly.
* Totals include Aboriginal status not stated and no usual address and therefore do not sum.
** The Australian Statistical Geography Standard (ASGS) defines remoteness areas into five classes of relative remoteness across Australia using a combination of population sizes (to define urban centres) and distances from urban centres. In this classification, Mandurah is included in the Major Cities category. Refer to the ABS, 1270.0.55.005 - Australian Statistical Geography Standard (ASGS): Volume 5 - Remoteness Structure, July 2016 for more information.
Profile of Children and Young People in WA 13
Population
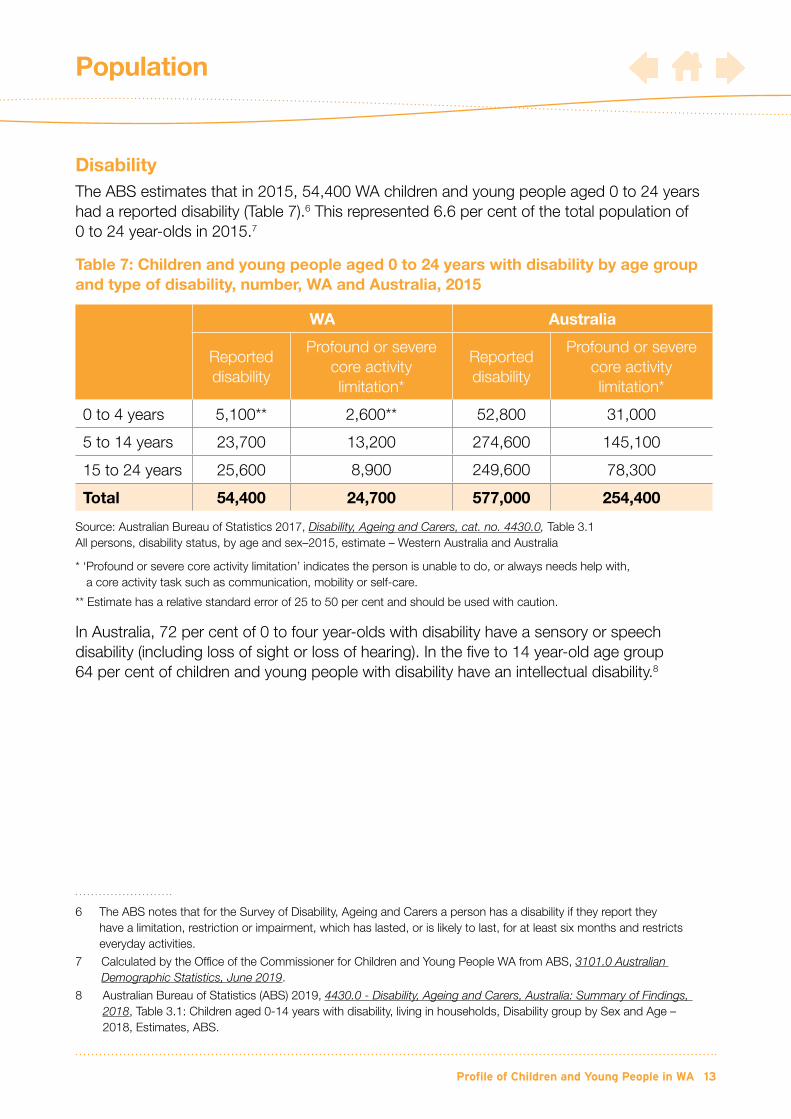
DisabilityThe ABS estimates that in 2015, 54,400 WA children and young people aged 0 to 24 years had a reported disability (Table 7).6 This represented 6.6 per cent of the total population of 0 to 24 year-olds in 2015.7
Table 7: Children and young people aged 0 to 24 years with disability by age group and type of disability, number, WA and Australia, 2015
WA Australia
Reported disability
Profound or severe core activity limitation*
Reported disability
Profound or severe core activity limitation*
0 to 4 years 5,100** 2,600** 52,800 31,000
5 to 14 years 23,700 13,200 274,600 145,100
15 to 24 years 25,600 8,900 249,600 78,300
Total 54,400 24,700 577,000 254,400
Source: Australian Bureau of Statistics 2017, Disability, Ageing and Carers, cat. no. 4430.0, Table 3.1 All persons, disability status, by age and sex–2015, estimate – Western Australia and Australia
* ‘ Profound or severe core activity limitation’ indicates the person is unable to do, or always needs help with, a core activity task such as communication, mobility or self-care.
** Estimate has a relative standard error of 25 to 50 per cent and should be used with caution.
In Australia, 72 per cent of 0 to four year-olds with disability have a sensory or speech disability (including loss of sight or loss of hearing). In the five to 14 year-old age group 64 per cent of children and young people with disability have an intellectual disability.8
6 The ABS notes that for the Survey of Disability, Ageing and Carers a person has a disability if they report they have a limitation, restriction or impairment, which has lasted, or is likely to last, for at least six months and restricts everyday activities.
7 Calculated by the Office of the Commissioner for Children and Young People WA from ABS, 3101.0 Australian Demographic Statistics, June 2019.
8 Australian Bureau of Statistics (ABS) 2019, 4430.0 - Disability, Ageing and Carers, Australia: Summary of Findings, 2018, Table 3.1: Children aged 0-14 years with disability, living in households, Disability group by Sex and Age – 2018, Estimates, ABS.
14 Commissioner for Children and Young People Western Australia
Population
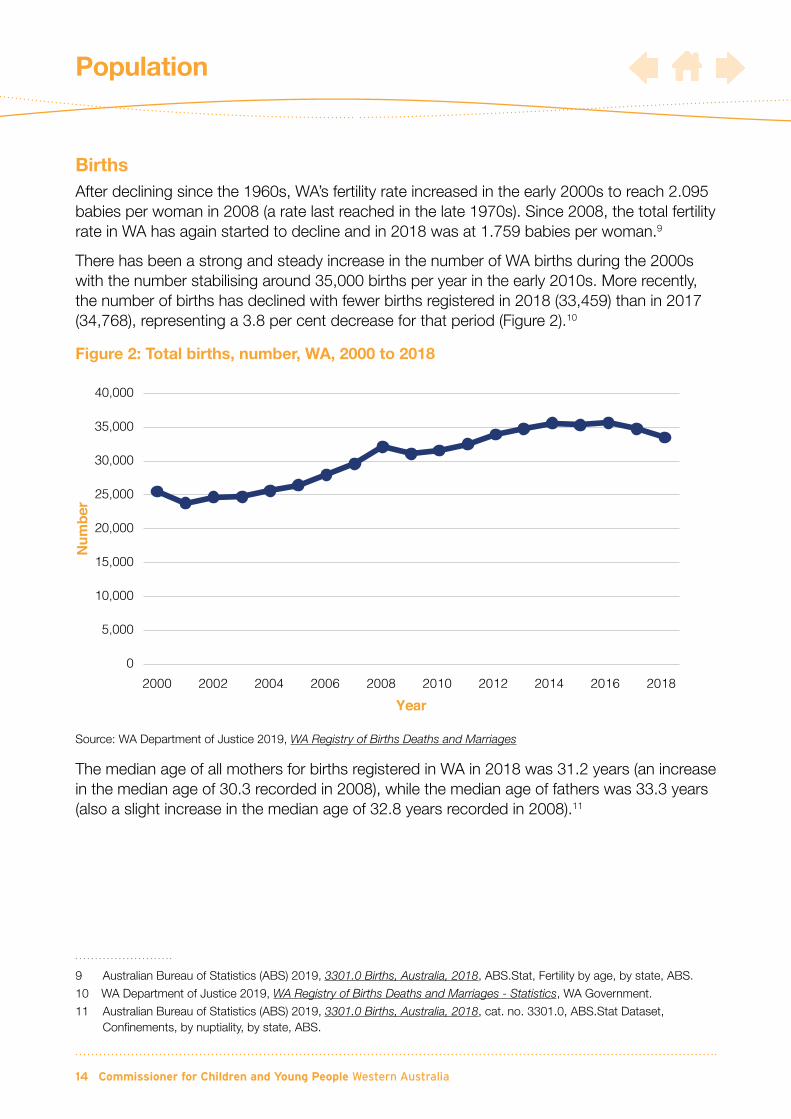
BirthsAfter declining since the 1960s, WA’s fertility rate increased in the early 2000s to reach 2.095 babies per woman in 2008 (a rate last reached in the late 1970s). Since 2008, the total fertility rate in WA has again started to decline and in 2018 was at 1.759 babies per woman.9
There has been a strong and steady increase in the number of WA births during the 2000s with the number stabilising around 35,000 births per year in the early 2010s. More recently, the number of births has declined with fewer births registered in 2018 (33,459) than in 2017 (34,768), representing a 3.8 per cent decrease for that period (Figure 2).10
Figure 2: Total births, number, WA, 2000 to 2018
Source: WA Department of Justice 2019, WA Registry of Births Deaths and Marriages
The median age of all mothers for births registered in WA in 2018 was 31.2 years (an increase in the median age of 30.3 recorded in 2008), while the median age of fathers was 33.3 years (also a slight increase in the median age of 32.8 years recorded in 2008).11
9 Australian Bureau of Statistics (ABS) 2019, 3301.0 Births, Australia, 2018, ABS.Stat, Fertility by age, by state, ABS.
10 WA Department of Justice 2019, WA Registry of Births Deaths and Marriages - Statistics, WA Government.
11 Australian Bureau of Statistics (ABS) 2019, 3301.0 Births, Australia, 2018, cat. no. 3301.0, ABS.Stat Dataset, Confinements, by nuptiality, by state, ABS.
0
5,000
10,000
15,000
20,000
25,000
30,000
35,000
40,000
Num
ber
Year2000 2002 2004 2006 2008 2010 2012 2014 2016 2018
Profile of Children and Young People in WA 15
Population
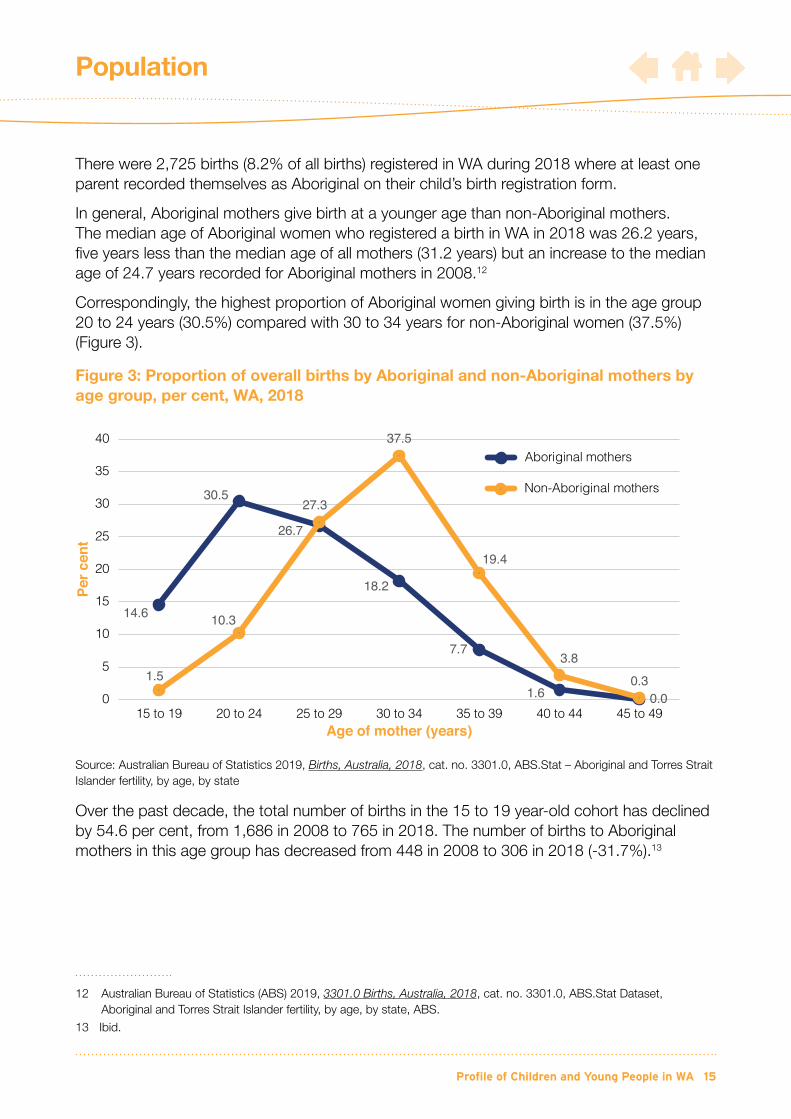
There were 2,725 births (8.2% of all births) registered in WA during 2018 where at least one parent recorded themselves as Aboriginal on their child’s birth registration form.
In general, Aboriginal mothers give birth at a younger age than non-Aboriginal mothers. The median age of Aboriginal women who registered a birth in WA in 2018 was 26.2 years, five years less than the median age of all mothers (31.2 years) but an increase to the median age of 24.7 years recorded for Aboriginal mothers in 2008.12
Correspondingly, the highest proportion of Aboriginal women giving birth is in the age group 20 to 24 years (30.5%) compared with 30 to 34 years for non-Aboriginal women (37.5%) (Figure 3).
Figure 3: Proportion of overall births by Aboriginal and non-Aboriginal mothers by age group, per cent, WA, 2018
Source: Australian Bureau of Statistics 2019, Births, Australia, 2018, cat. no. 3301.0, ABS.Stat – Aboriginal and Torres Strait Islander fertility, by age, by state
Over the past decade, the total number of births in the 15 to 19 year-old cohort has declined by 54.6 per cent, from 1,686 in 2008 to 765 in 2018. The number of births to Aboriginal mothers in this age group has decreased from 448 in 2008 to 306 in 2018 (-31.7%).13
12 Australian Bureau of Statistics (ABS) 2019, 3301.0 Births, Australia, 2018, cat. no. 3301.0, ABS.Stat Dataset, Aboriginal and Torres Strait Islander fertility, by age, by state, ABS.
13 Ibid.
14.6
30.5
26.7
18.2
7.7
1.6 0.0
1.5
10.3
27.3
37.5
19.4
3.8
0.30
5
10
15
20
25
30
35
40
15 to 19 20 to 24 25 to 29 30 to 34 35 to 39 40 to 44 45 to 49
Per c
ent
Age of mother (years)
Aboriginal mothers
Non-Aboriginal mothers
16 Commissioner for Children and Young People Western Australia
Population
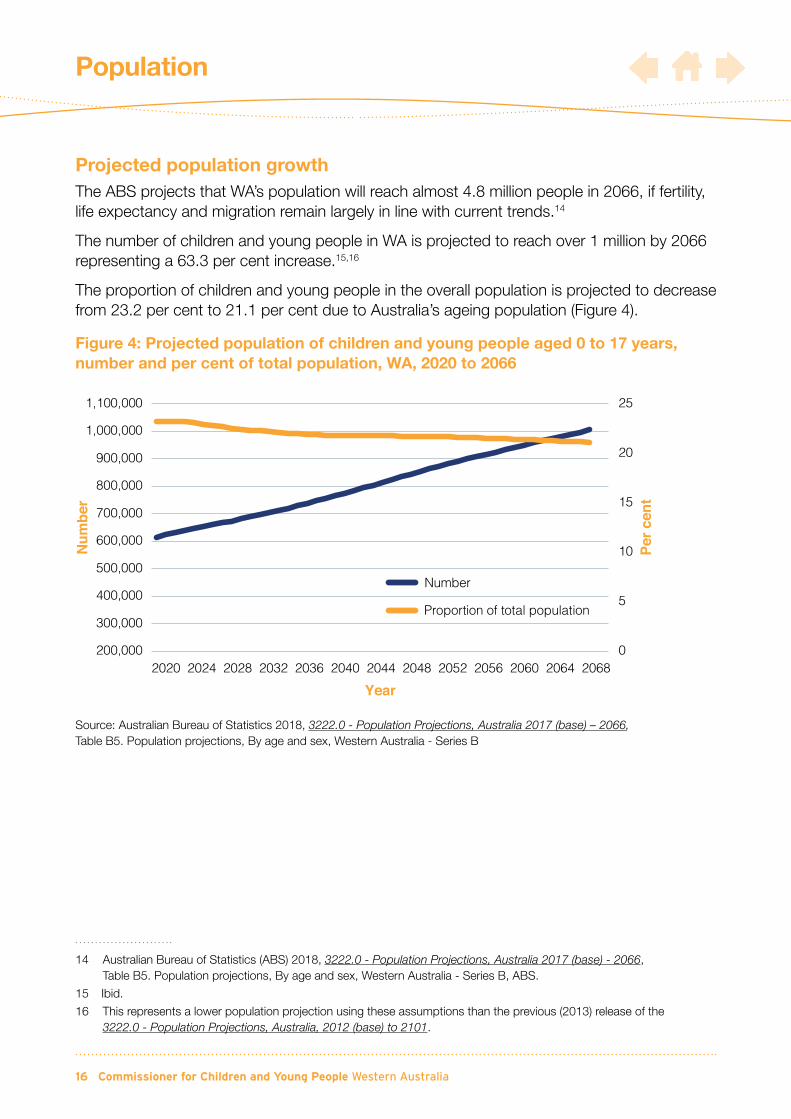
Projected population growthThe ABS projects that WA’s population will reach almost 4.8 million people in 2066, if fertility, life expectancy and migration remain largely in line with current trends.14
The number of children and young people in WA is projected to reach over 1 million by 2066 representing a 63.3 per cent increase.15,16
The proportion of children and young people in the overall population is projected to decrease from 23.2 per cent to 21.1 per cent due to Australia’s ageing population (Figure 4).
Figure 4: Projected population of children and young people aged 0 to 17 years, number and per cent of total population, WA, 2020 to 2066
Source: Australian Bureau of Statistics 2018, 3222.0 - Population Projections, Australia 2017 (base) – 2066, Table B5. Population projections, By age and sex, Western Australia - Series B
14 Australian Bureau of Statistics (ABS) 2018, 3222.0 - Population Projections, Australia 2017 (base) - 2066, Table B5. Population projections, By age and sex, Western Australia - Series B, ABS.
15 Ibid.
16 This represents a lower population projection using these assumptions than the previous (2013) release of the 3222.0 - Population Projections, Australia, 2012 (base) to 2101.
0
5
10
15
20
25
200,000
300,000
400,000
500,000
600,000
700,000
800,000
900,000
1,000,000
1,100,000
Per c
ent
Num
ber
Year
Number
Proportion of total population
2020 2024 2028 2032 2036 2040 2044 2048 2052 2056 2060 2064 2068
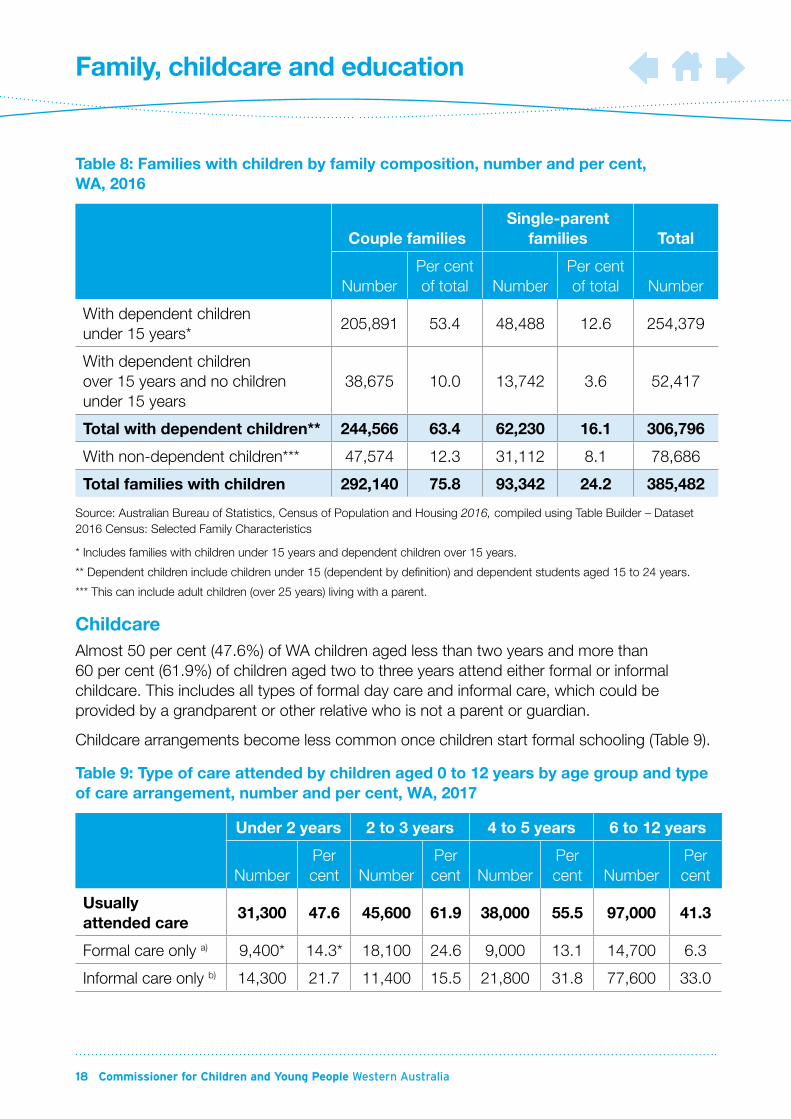
Family compositionThe most recent Census data reports that there were 385,482 households with one or more children in WA in 2016.
Of these households, 244,566 or 63.4 per cent were couple families with dependent children and about 62,230 or 16.1 per cent were single-parent families with dependent children (Table 8).
The majority of single parents in WA are female (81.7 per cent).17
17 Australian Bureau of Statistics (ABS) 2018, ABS Census 2016, Quick Data, WA, ABS.
Family, childcare and education
There are over 380,000 households with children in WA and two-thirds have children under the age of 15.
18 Commissioner for Children and Young People Western Australia
Family, childcare and education
Table 8: Families with children by family composition, number and per cent, WA, 2016
Couple familiesSingle-parent
families Total
NumberPer cent of total Number
Per cent of total Number
With dependent children under 15 years*
205,891 53.4 48,488 12.6 254,379
With dependent children over 15 years and no children under 15 years
38,675 10.0 13,742 3.6 52,417
Total with dependent children** 244,566 63.4 62,230 16.1 306,796
With non-dependent children*** 47,574 12.3 31,112 8.1 78,686
Total families with children 292,140 75.8 93,342 24.2 385,482
Source: Australian Bureau of Statistics, Census of Population and Housing 2016, compiled using Table Builder – Dataset 2016 Census: Selected Family Characteristics
* Includes families with children under 15 years and dependent children over 15 years.
** Dependent children include children under 15 (dependent by definition) and dependent students aged 15 to 24 years.
*** This can include adult children (over 25 years) living with a parent.
ChildcareAlmost 50 per cent (47.6%) of WA children aged less than two years and more than 60 per cent (61.9%) of children aged two to three years attend either formal or informal childcare. This includes all types of formal day care and informal care, which could be provided by a grandparent or other relative who is not a parent or guardian.
Childcare arrangements become less common once children start formal schooling (Table 9).
Table 9: Type of care attended by children aged 0 to 12 years by age group and type of care arrangement, number and per cent, WA, 2017
Under 2 years 2 to 3 years 4 to 5 years 6 to 12 years
NumberPer cent Number
Per cent Number
Per cent Number
Per cent
Usually attended care
31,300 47.6 45,600 61.9 38,000 55.5 97,000 41.3
Formal care only a) 9,400* 14.3* 18,100 24.6 9,000 13.1 14,700 6.3
Informal care only b) 14,300 21.7 11,400 15.5 21,800 31.8 77,600 33.0
Profile of Children and Young People in WA 19
Family, childcare and education
Under 2 years 2 to 3 years 4 to 5 years 6 to 12 years
NumberPer cent Number
Per cent Number
Per cent Number
Per cent
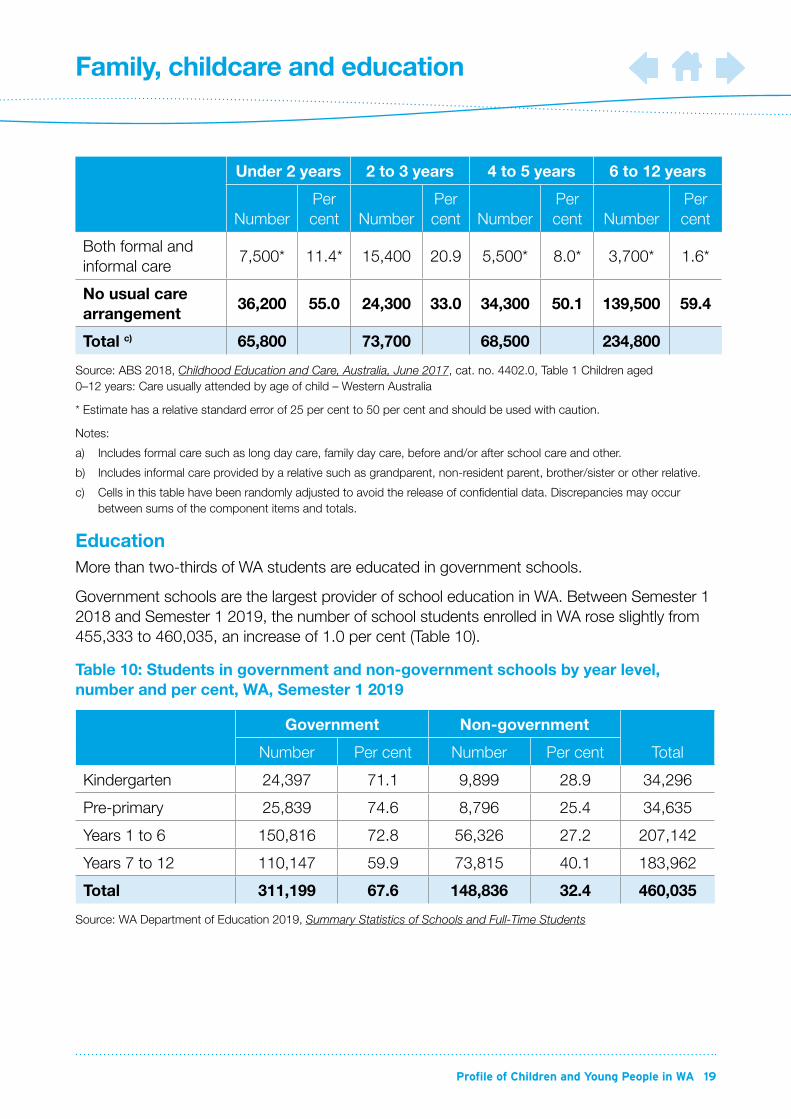
Both formal and informal care
7,500* 11.4* 15,400 20.9 5,500* 8.0* 3,700* 1.6*
No usual care arrangement
36,200 55.0 24,300 33.0 34,300 50.1 139,500 59.4
Total c) 65,800 73,700 68,500 234,800
Source: ABS 2018, Childhood Education and Care, Australia, June 2017, cat. no. 4402.0, Table 1 Children aged 0–12 years: Care usually attended by age of child – Western Australia
* Estimate has a relative standard error of 25 per cent to 50 per cent and should be used with caution.
Notes:
a) Includes formal care such as long day care, family day care, before and/or after school care and other.
b) Includes informal care provided by a relative such as grandparent, non-resident parent, brother/sister or other relative.
c) Cells in this table have been randomly adjusted to avoid the release of confidential data. Discrepancies may occur between sums of the component items and totals.
EducationMore than two-thirds of WA students are educated in government schools.
Government schools are the largest provider of school education in WA. Between Semester 1 2018 and Semester 1 2019, the number of school students enrolled in WA rose slightly from 455,333 to 460,035, an increase of 1.0 per cent (Table 10).
Table 10: Students in government and non-government schools by year level, number and per cent, WA, Semester 1 2019
Government Non-government
TotalNumber Per cent Number Per cent
Kindergarten 24,397 71.1 9,899 28.9 34,296
Pre-primary 25,839 74.6 8,796 25.4 34,635
Years 1 to 6 150,816 72.8 56,326 27.2 207,142
Years 7 to 12 110,147 59.9 73,815 40.1 183,962
Total 311,199 67.6 148,836 32.4 460,035
Source: WA Department of Education 2019, Summary Statistics of Schools and Full-Time Students
20 Commissioner for Children and Young People Western Australia
Family, childcare and education
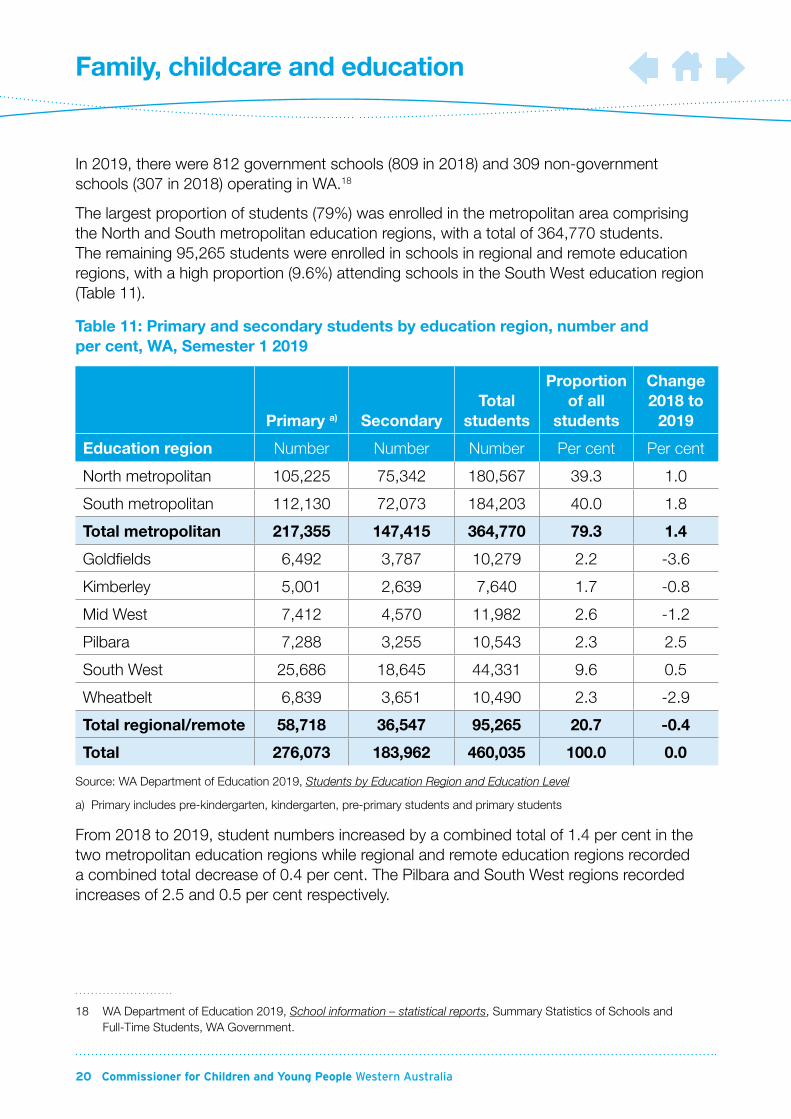
In 2019, there were 812 government schools (809 in 2018) and 309 non-government schools (307 in 2018) operating in WA.18
The largest proportion of students (79%) was enrolled in the metropolitan area comprising the North and South metropolitan education regions, with a total of 364,770 students. The remaining 95,265 students were enrolled in schools in regional and remote education regions, with a high proportion (9.6%) attending schools in the South West education region (Table 11).
Table 11: Primary and secondary students by education region, number and per cent, WA, Semester 1 2019
Primary a) SecondaryTotal
students
Proportion of all
students
Change 2018 to
2019
Education region Number Number Number Per cent Per cent
North metropolitan 105,225 75,342 180,567 39.3 1.0
South metropolitan 112,130 72,073 184,203 40.0 1.8
Total metropolitan 217,355 147,415 364,770 79.3 1.4
Goldfields 6,492 3,787 10,279 2.2 -3.6
Kimberley 5,001 2,639 7,640 1.7 -0.8
Mid West 7,412 4,570 11,982 2.6 -1.2
Pilbara 7,288 3,255 10,543 2.3 2.5
South West 25,686 18,645 44,331 9.6 0.5
Wheatbelt 6,839 3,651 10,490 2.3 -2.9
Total regional/remote 58,718 36,547 95,265 20.7 -0.4
Total 276,073 183,962 460,035 100.0 0.0
Source: WA Department of Education 2019, Students by Education Region and Education Level
a) Primary includes pre-kindergarten, kindergarten, pre-primary students and primary students
From 2018 to 2019, student numbers increased by a combined total of 1.4 per cent in the two metropolitan education regions while regional and remote education regions recorded a combined total decrease of 0.4 per cent. The Pilbara and South West regions recorded increases of 2.5 and 0.5 per cent respectively.
18 WA Department of Education 2019, School information – statistical reports, Summary Statistics of Schools and Full-Time Students, WA Government.
Profile of Children and Young People in WA 21
Family, childcare and education
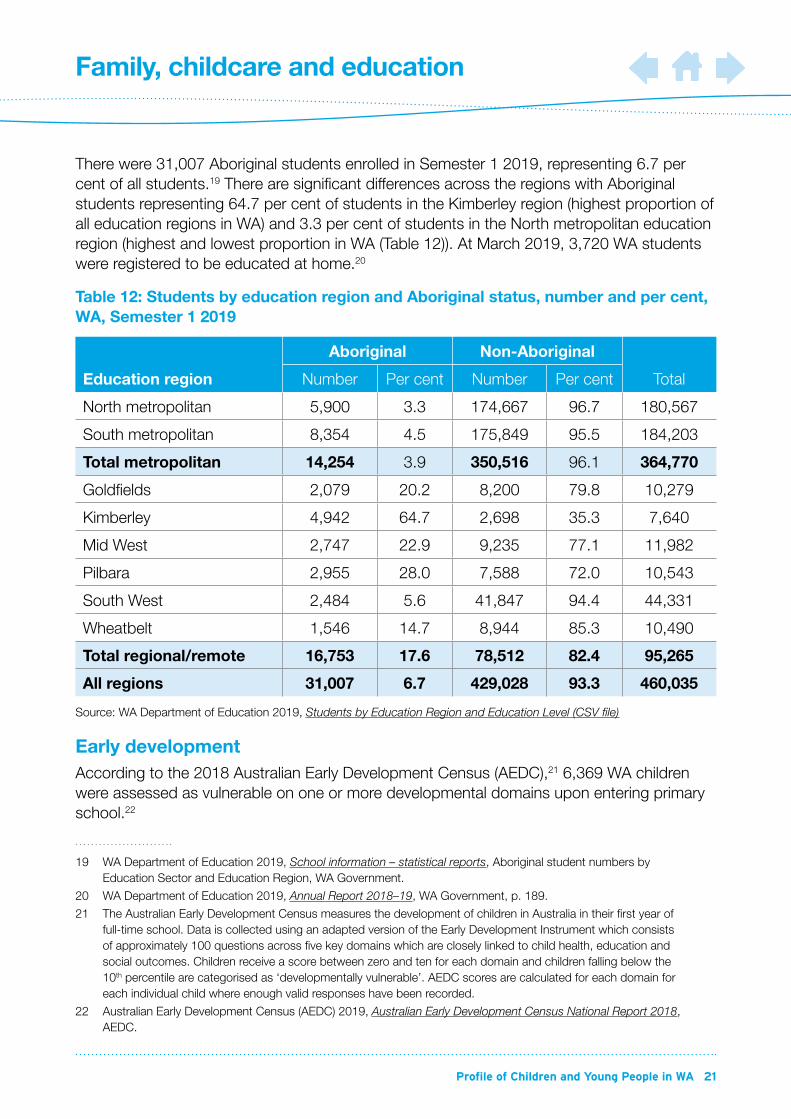
There were 31,007 Aboriginal students enrolled in Semester 1 2019, representing 6.7 per cent of all students.19 There are significant differences across the regions with Aboriginal students representing 64.7 per cent of students in the Kimberley region (highest proportion of all education regions in WA) and 3.3 per cent of students in the North metropolitan education region (highest and lowest proportion in WA (Table 12)). At March 2019, 3,720 WA students were registered to be educated at home.20
Table 12: Students by education region and Aboriginal status, number and per cent, WA, Semester 1 2019
Education region
Aboriginal Non-Aboriginal
TotalNumber Per cent Number Per cent
North metropolitan 5,900 3.3 174,667 96.7 180,567
South metropolitan 8,354 4.5 175,849 95.5 184,203
Total metropolitan 14,254 3.9 350,516 96.1 364,770
Goldfields 2,079 20.2 8,200 79.8 10,279
Kimberley 4,942 64.7 2,698 35.3 7,640
Mid West 2,747 22.9 9,235 77.1 11,982
Pilbara 2,955 28.0 7,588 72.0 10,543
South West 2,484 5.6 41,847 94.4 44,331
Wheatbelt 1,546 14.7 8,944 85.3 10,490
Total regional/remote 16,753 17.6 78,512 82.4 95,265
All regions 31,007 6.7 429,028 93.3 460,035
Source: WA Department of Education 2019, Students by Education Region and Education Level (CSV file)
Early developmentAccording to the 2018 Australian Early Development Census (AEDC),21 6,369 WA children were assessed as vulnerable on one or more developmental domains upon entering primary school.22
19 WA Department of Education 2019, School information – statistical reports, Aboriginal student numbers by Education Sector and Education Region, WA Government.
20 WA Department of Education 2019, Annual Report 2018–19, WA Government, p. 189.
21 The Australian Early Development Census measures the development of children in Australia in their first year of full-time school. Data is collected using an adapted version of the Early Development Instrument which consists of approximately 100 questions across five key domains which are closely linked to child health, education and social outcomes. Children receive a score between zero and ten for each domain and children falling below the 10th percentile are categorised as ‘developmentally vulnerable’. AEDC scores are calculated for each domain for each individual child where enough valid responses have been recorded.
22 Australian Early Development Census (AEDC) 2019, Australian Early Development Census National Report 2018, AEDC.
22 Commissioner for Children and Young People Western Australia
Family, childcare and education
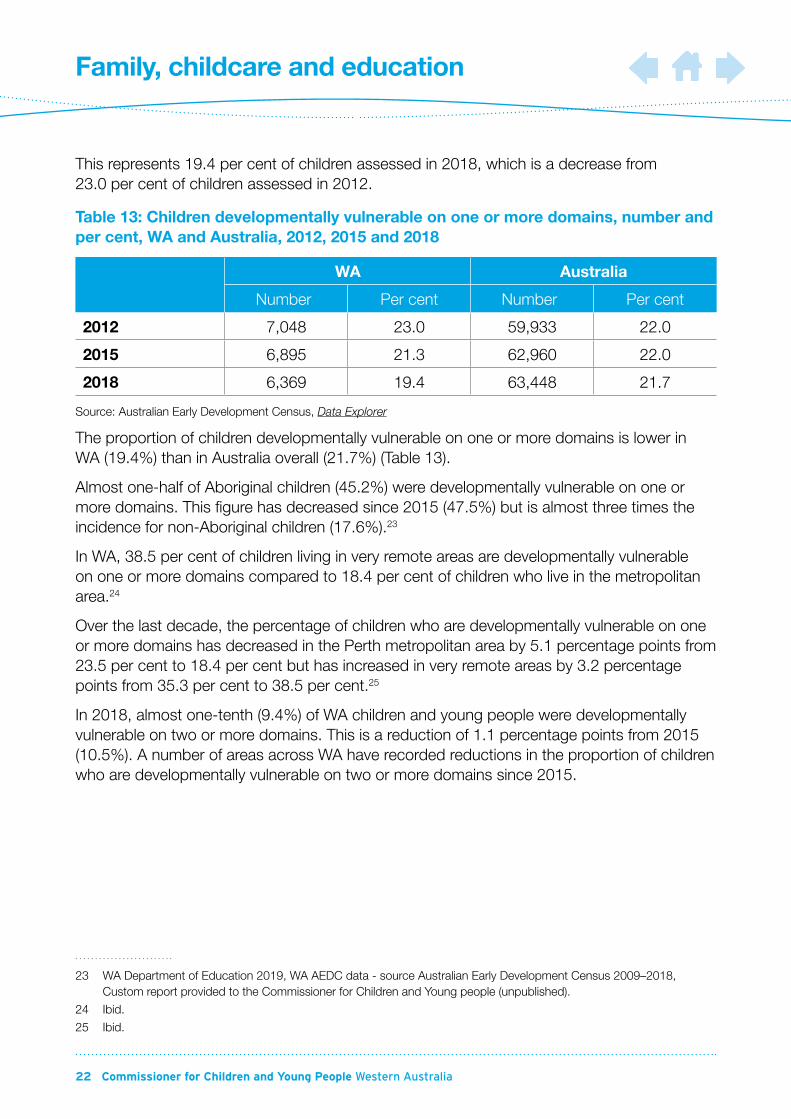
This represents 19.4 per cent of children assessed in 2018, which is a decrease from 23.0 per cent of children assessed in 2012.
Table 13: Children developmentally vulnerable on one or more domains, number and per cent, WA and Australia, 2012, 2015 and 2018
WA Australia
Number Per cent Number Per cent
2012 7,048 23.0 59,933 22.0
2015 6,895 21.3 62,960 22.0
2018 6,369 19.4 63,448 21.7
Source: Australian Early Development Census, Data Explorer
The proportion of children developmentally vulnerable on one or more domains is lower in WA (19.4%) than in Australia overall (21.7%) (Table 13).
Almost one-half of Aboriginal children (45.2%) were developmentally vulnerable on one or more domains. This figure has decreased since 2015 (47.5%) but is almost three times the incidence for non-Aboriginal children (17.6%).23
In WA, 38.5 per cent of children living in very remote areas are developmentally vulnerable on one or more domains compared to 18.4 per cent of children who live in the metropolitan area.24
Over the last decade, the percentage of children who are developmentally vulnerable on one or more domains has decreased in the Perth metropolitan area by 5.1 percentage points from 23.5 per cent to 18.4 per cent but has increased in very remote areas by 3.2 percentage points from 35.3 per cent to 38.5 per cent.25
In 2018, almost one-tenth (9.4%) of WA children and young people were developmentally vulnerable on two or more domains. This is a reduction of 1.1 percentage points from 2015 (10.5%). A number of areas across WA have recorded reductions in the proportion of children who are developmentally vulnerable on two or more domains since 2015.
23 WA Department of Education 2019, WA AEDC data - source Australian Early Development Census 2009–2018, Custom report provided to the Commissioner for Children and Young people (unpublished).
24 Ibid.
25 Ibid.
Profile of Children and Young People in WA 23
Family, childcare and education
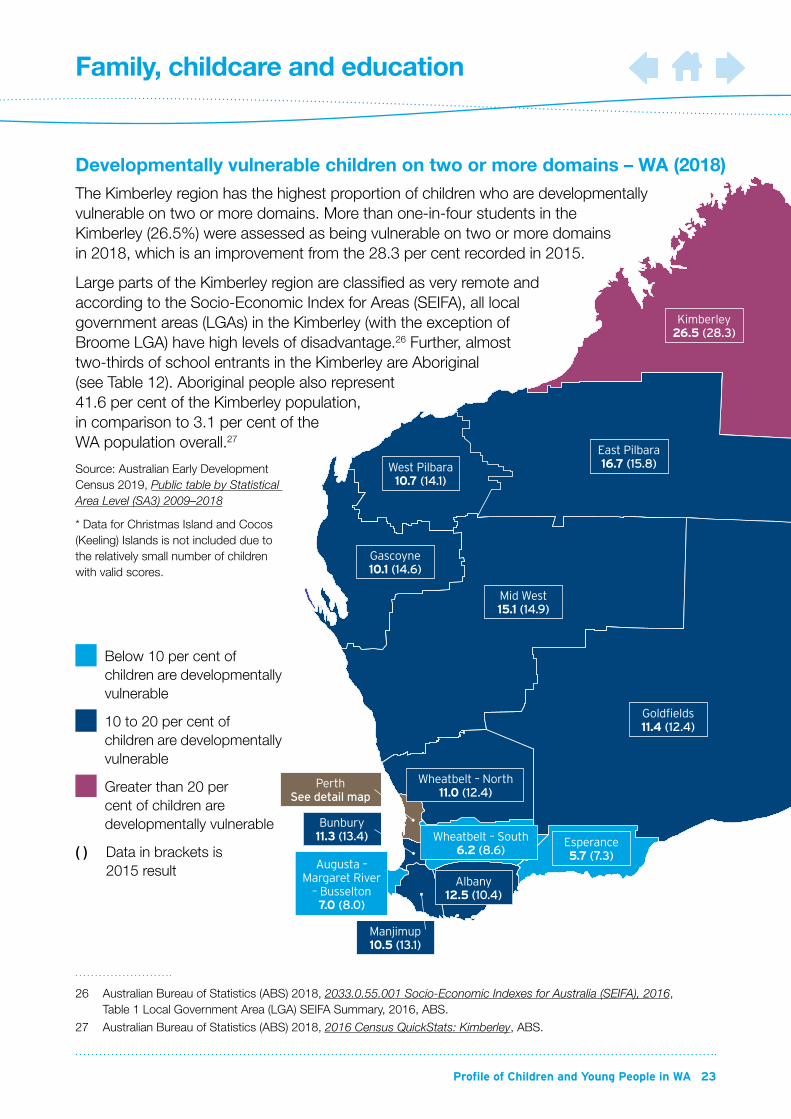
Developmentally vulnerable children on two or more domains – WA (2018)The Kimberley region has the highest proportion of children who are developmentally vulnerable on two or more domains. More than one-in-four students in the Kimberley (26.5%) were assessed as being vulnerable on two or more domains in 2018, which is an improvement from the 28.3 per cent recorded in 2015.
Large parts of the Kimberley region are classified as very remote and according to the Socio-Economic Index for Areas (SEIFA), all local government areas (LGAs) in the Kimberley (with the exception of Broome LGA) have high levels of disadvantage.26 Further, almost two-thirds of school entrants in the Kimberley are Aboriginal (see Table 12). Aboriginal people also represent 41.6 per cent of the Kimberley population, in comparison to 3.1 per cent of the WA population overall.27
Source: Australian Early Development Census 2019, Public table by Statistical Area Level (SA3) 2009–2018
* Data for Christmas Island and Cocos (Keeling) Islands is not included due to the relatively small number of children with valid scores.
26 Australian Bureau of Statistics (ABS) 2018, 2033.0.55.001 Socio-Economic Indexes for Australia (SEIFA), 2016, Table 1 Local Government Area (LGA) SEIFA Summary, 2016, ABS.
27 Australian Bureau of Statistics (ABS) 2018, 2016 Census QuickStats: Kimberley, ABS.
Below 10 per cent of children are developmentally vulnerable
10 to 20 per cent of children are developmentally vulnerable
Greater than 20 per cent of children are developmentally vulnerable
( ) Data in brackets is 2015 result
Bunbury11.3 (13.4)
East Pilbara16.7 (15.8)West Pilbara
10.7 (14.1)
Gascoyne10.1 (14.6)
Mid West15.1 (14.9)
Goldfields11.4 (12.4)
PerthSee detail map
Albany12.5 (10.4)
Kimberley26.5 (28.3)
Wheatbelt – North11.0 (12.4)
Wheatbelt – South6.2 (8.6)
Esperance5.7 (7.3)
Augusta – Margaret River
– Busselton7.0 (8.0)
Manjimup10.5 (13.1)
24 Commissioner for Children and Young People Western Australia
Family, childcare and education
Developmentally vulnerable children on two or more domains – metropolitan area (2018)
Wanneroo9.1 (10.4)
Swan9.3 (11.4)
Mundaring10.4 (12.8)
Stirling7.5 (10.3)
Joondalup5.5 (6.4)
Perth City5.5 (5.9)
Fremantle6.3 (5.9)
Melville6.1 (6.2) Cockburn
8.2 (8.5)
Rockingham9.4 (9.9)
South Perth9.0 (6.2)
Bayswater – Bassendean8.9 (10.3)
Belmont – Victoria Park
8.0 (9.5)
Cottesloe – Claremont3.5 (5.5)
Canning8.9 (11.0)
Gosnells10.3 (11.6)
Kalamunda8.3 (12.9)
Armadale11.7 (11.6)
Kwinana14.7 (11.8)
Serpentine – Jarrahdale8.6 (8.2)
Mandurah9.9 (10.8)
Below 10 per cent of children are developmentally vulnerable
10 to 20 per cent of children are developmentally vulnerable
( ) Data in brackets is 2015 result
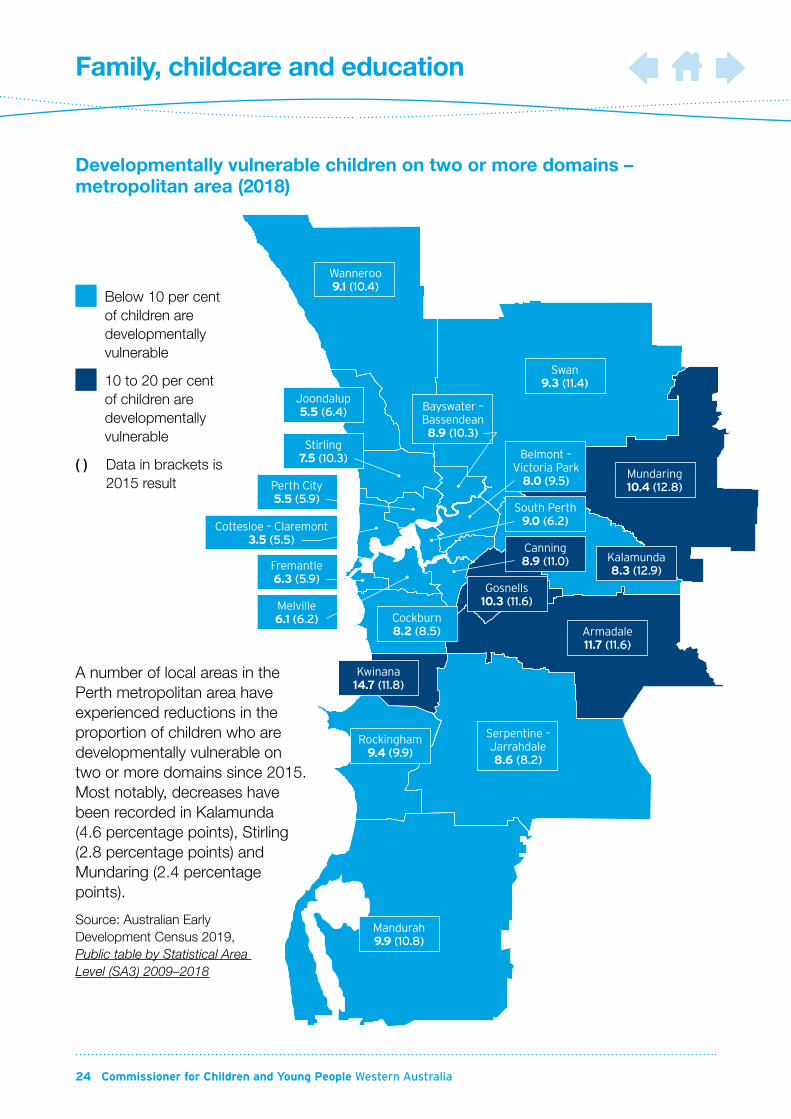
A number of local areas in the Perth metropolitan area have experienced reductions in the proportion of children who are developmentally vulnerable on two or more domains since 2015. Most notably, decreases have been recorded in Kalamunda (4.6 percentage points), Stirling (2.8 percentage points) and Mundaring (2.4 percentage points).
Source: Australian Early Development Census 2019, Public table by Statistical Area Level (SA3) 2009–2018
Housing and homelessnessMore than two-thirds (69.8%) of WA households live in an owner-occupied dwelling and less than one-third (27.8%) of households live in a rented dwelling.28
In 2017–18, 16.8 per cent of WA households spent more than 30 per cent of their gross household income on housing costs. This proportion has increased by 3.5 percentage points since 2007–08 (13.3%).29
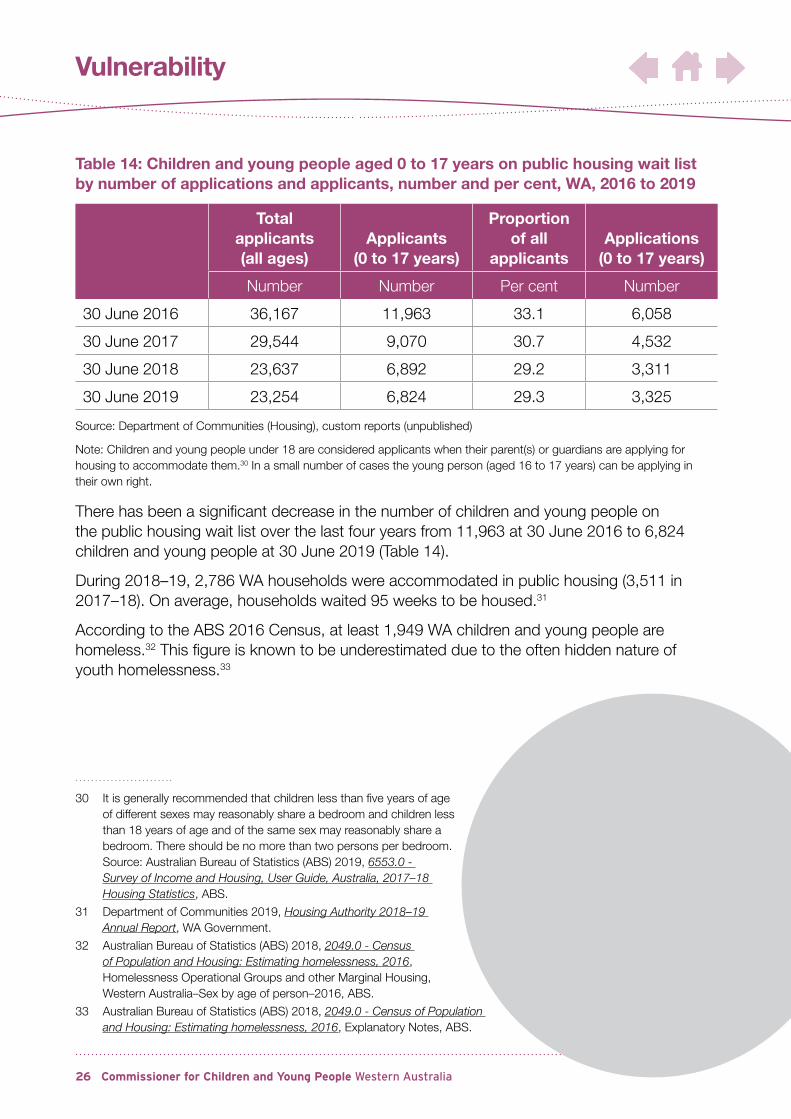
At 30 June 2019, there were 23,254 applicants on the public housing wait list including 6,824 applicants (29.3%) aged 0 to 17 years (Table 14).
28 Australian Bureau of Statistics (ABS) 2019, 4130.0 Housing Occupancy and Costs: 2017-18, Table 17.3 Household Estimates, Selected household characteristics, Western Australia, 1994–95 to 2017–18, ABS.
29 Ibid.
Vulnerability
At 30 June 2019, 6,824 children and young people were on the public housing wait list.
26 Commissioner for Children and Young People Western Australia
Vulnerability
Table 14: Children and young people aged 0 to 17 years on public housing wait list by number of applications and applicants, number and per cent, WA, 2016 to 2019
Total applicants (all ages)
Applicants (0 to 17 years)
Proportion of all
applicantsApplications
(0 to 17 years)
Number Number Per cent Number
30 June 2016 36,167 11,963 33.1 6,058
30 June 2017 29,544 9,070 30.7 4,532
30 June 2018 23,637 6,892 29.2 3,311
30 June 2019 23,254 6,824 29.3 3,325
Source: Department of Communities (Housing), custom reports (unpublished)
Note: Children and young people under 18 are considered applicants when their parent(s) or guardians are applying for housing to accommodate them.30 In a small number of cases the young person (aged 16 to 17 years) can be applying in their own right.
There has been a significant decrease in the number of children and young people on the public housing wait list over the last four years from 11,963 at 30 June 2016 to 6,824 children and young people at 30 June 2019 (Table 14).
During 2018–19, 2,786 WA households were accommodated in public housing (3,511 in 2017–18). On average, households waited 95 weeks to be housed.31
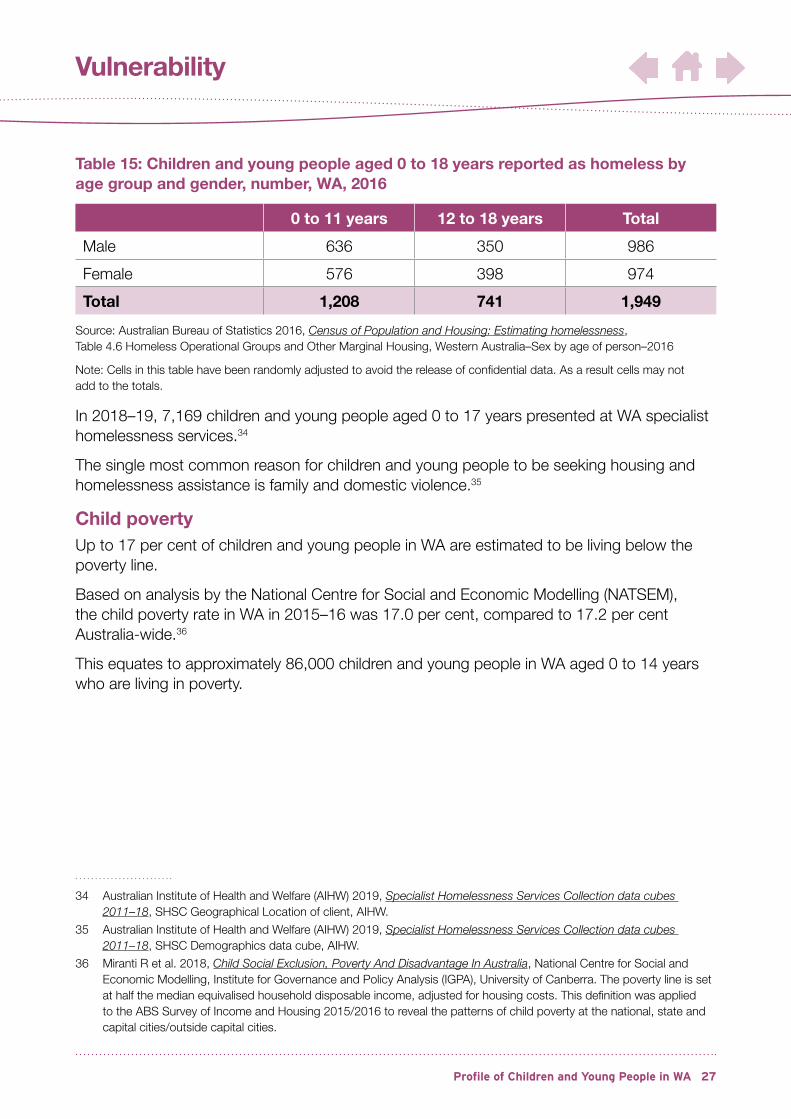
According to the ABS 2016 Census, at least 1,949 WA children and young people are homeless.32 This figure is known to be underestimated due to the often hidden nature of youth homelessness.33
30 It is generally recommended that children less than five years of age of different sexes may reasonably share a bedroom and children less than 18 years of age and of the same sex may reasonably share a bedroom. There should be no more than two persons per bedroom. Source: Australian Bureau of Statistics (ABS) 2019, 6553.0 - Survey of Income and Housing, User Guide, Australia, 2017–18 Housing Statistics, ABS.
31 Department of Communities 2019, Housing Authority 2018–19 Annual Report, WA Government.
32 Australian Bureau of Statistics (ABS) 2018, 2049.0 - Census of Population and Housing: Estimating homelessness, 2016, Homelessness Operational Groups and other Marginal Housing, Western Australia–Sex by age of person–2016, ABS.
33 Australian Bureau of Statistics (ABS) 2018, 2049.0 - Census of Population and Housing: Estimating homelessness, 2016, Explanatory Notes, ABS.
Profile of Children and Young People in WA 27
Vulnerability
Table 15: Children and young people aged 0 to 18 years reported as homeless by age group and gender, number, WA, 2016
0 to 11 years 12 to 18 years Total
Male 636 350 986
Female 576 398 974
Total 1,208 741 1,949
Source: Australian Bureau of Statistics 2016, Census of Population and Housing: Estimating homelessness, Table 4.6 Homeless Operational Groups and Other Marginal Housing, Western Australia–Sex by age of person–2016
Note: Cells in this table have been randomly adjusted to avoid the release of confidential data. As a result cells may not add to the totals.
In 2018–19, 7,169 children and young people aged 0 to 17 years presented at WA specialist homelessness services.34
The single most common reason for children and young people to be seeking housing and homelessness assistance is family and domestic violence.35
Child povertyUp to 17 per cent of children and young people in WA are estimated to be living below the poverty line.
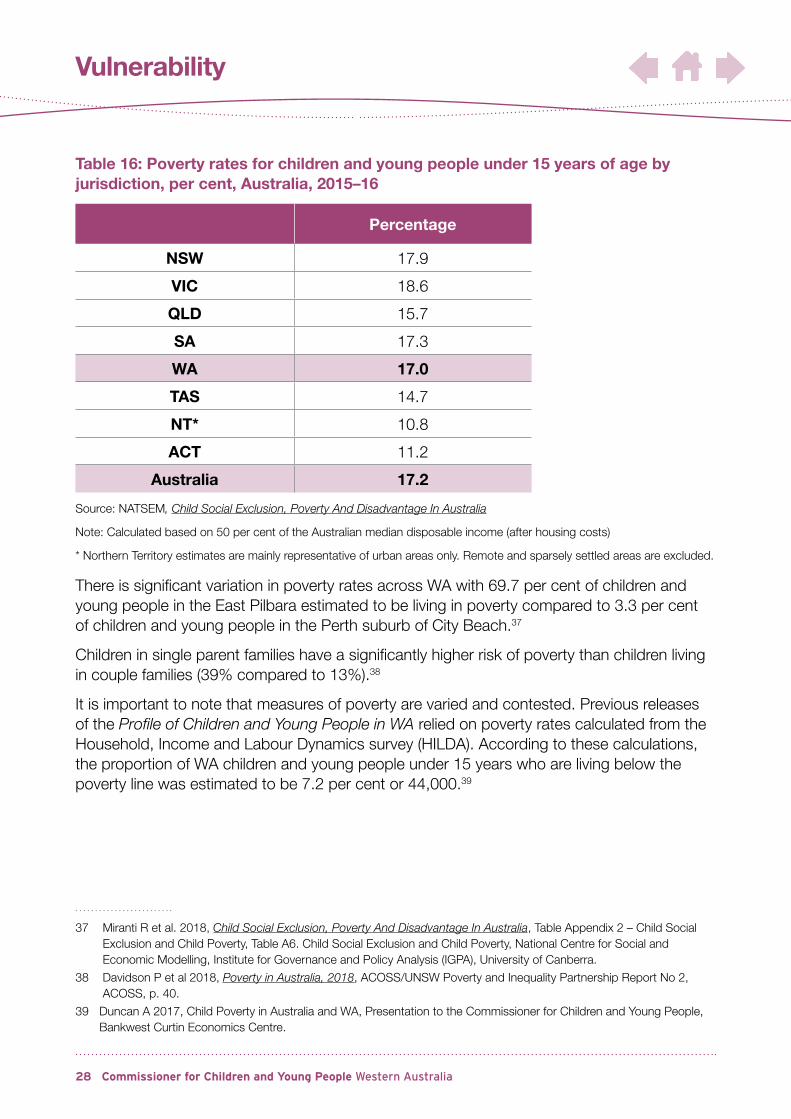
Based on analysis by the National Centre for Social and Economic Modelling (NATSEM), the child poverty rate in WA in 2015–16 was 17.0 per cent, compared to 17.2 per cent Australia-wide.36
This equates to approximately 86,000 children and young people in WA aged 0 to 14 years who are living in poverty.
34 Australian Institute of Health and Welfare (AIHW) 2019, Specialist Homelessness Services Collection data cubes 2011–18, SHSC Geographical Location of client, AIHW.
35 Australian Institute of Health and Welfare (AIHW) 2019, Specialist Homelessness Services Collection data cubes 2011–18, SHSC Demographics data cube, AIHW.
36 Miranti R et al. 2018, Child Social Exclusion, Poverty And Disadvantage In Australia, National Centre for Social and Economic Modelling, Institute for Governance and Policy Analysis (IGPA), University of Canberra. The poverty line is set at half the median equivalised household disposable income, adjusted for housing costs. This definition was applied to the ABS Survey of Income and Housing 2015/2016 to reveal the patterns of child poverty at the national, state and capital cities/outside capital cities.
28 Commissioner for Children and Young People Western Australia
Vulnerability
Table 16: Poverty rates for children and young people under 15 years of age by jurisdiction, per cent, Australia, 2015–16
Percentage
NSW 17.9
VIC 18.6
QLD 15.7
SA 17.3
WA 17.0
TAS 14.7
NT* 10.8
ACT 11.2
Australia 17.2
Source: NATSEM, Child Social Exclusion, Poverty And Disadvantage In Australia
Note: Calculated based on 50 per cent of the Australian median disposable income (after housing costs)
* Northern Territory estimates are mainly representative of urban areas only. Remote and sparsely settled areas are excluded.
There is significant variation in poverty rates across WA with 69.7 per cent of children and young people in the East Pilbara estimated to be living in poverty compared to 3.3 per cent of children and young people in the Perth suburb of City Beach.37
Children in single parent families have a significantly higher risk of poverty than children living in couple families (39% compared to 13%).38
It is important to note that measures of poverty are varied and contested. Previous releases of the Profile of Children and Young People in WA relied on poverty rates calculated from the Household, Income and Labour Dynamics survey (HILDA). According to these calculations, the proportion of WA children and young people under 15 years who are living below the poverty line was estimated to be 7.2 per cent or 44,000.39
37 Miranti R et al. 2018, Child Social Exclusion, Poverty And Disadvantage In Australia, Table Appendix 2 – Child Social Exclusion and Child Poverty, Table A6. Child Social Exclusion and Child Poverty, National Centre for Social and Economic Modelling, Institute for Governance and Policy Analysis (IGPA), University of Canberra.
38 Davidson P et al 2018, Poverty in Australia, 2018, ACOSS/UNSW Poverty and Inequality Partnership Report No 2, ACOSS, p. 40.
39 Duncan A 2017, Child Poverty in Australia and WA, Presentation to the Commissioner for Children and Young People, Bankwest Curtin Economics Centre.
Profile of Children and Young People in WA 29
Vulnerability
The marked difference between these two child poverty measures (17.0% versus 7.2%) for broadly the same reference period (2015/2015–16) is explained by the use of different methodologies and source data and demonstrates the need for continued development of a robust poverty measure. At this point in time, the NATSEM child poverty rate is the most robust publicly available measure of the prevalence of child poverty in WA and nationally.
Children and young people in the child protection systemAboriginal children and young people continue to be over-represented in both the child protection and youth justice systems.
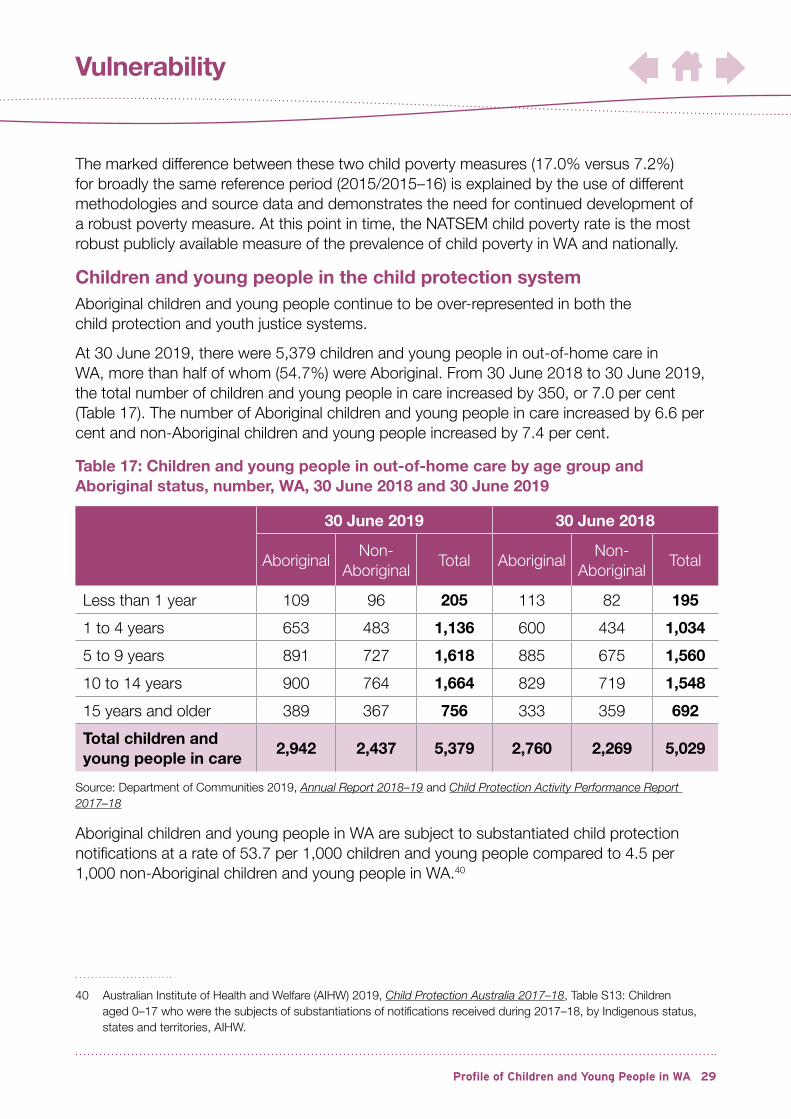
At 30 June 2019, there were 5,379 children and young people in out-of-home care in WA, more than half of whom (54.7%) were Aboriginal. From 30 June 2018 to 30 June 2019, the total number of children and young people in care increased by 350, or 7.0 per cent (Table 17). The number of Aboriginal children and young people in care increased by 6.6 per cent and non-Aboriginal children and young people increased by 7.4 per cent.
Table 17: Children and young people in out-of-home care by age group and Aboriginal status, number, WA, 30 June 2018 and 30 June 2019
30 June 2019 30 June 2018
AboriginalNon-
AboriginalTotal Aboriginal
Non- Aboriginal
Total
Less than 1 year 109 96 205 113 82 195
1 to 4 years 653 483 1,136 600 434 1,034
5 to 9 years 891 727 1,618 885 675 1,560
10 to 14 years 900 764 1,664 829 719 1,548
15 years and older 389 367 756 333 359 692
Total children and young people in care
2,942 2,437 5,379 2,760 2,269 5,029
Source: Department of Communities 2019, Annual Report 2018–19 and Child Protection Activity Performance Report 2017–18
Aboriginal children and young people in WA are subject to substantiated child protection notifications at a rate of 53.7 per 1,000 children and young people compared to 4.5 per 1,000 non-Aboriginal children and young people in WA.40
40 Australian Institute of Health and Welfare (AIHW) 2019, Child Protection Australia 2017–18, Table S13: Children aged 0–17 who were the subjects of substantiations of notifications received during 2017–18, by Indigenous status, states and territories, AIHW.
Vulnerability
30 Commissioner for Children and Young People Western Australia
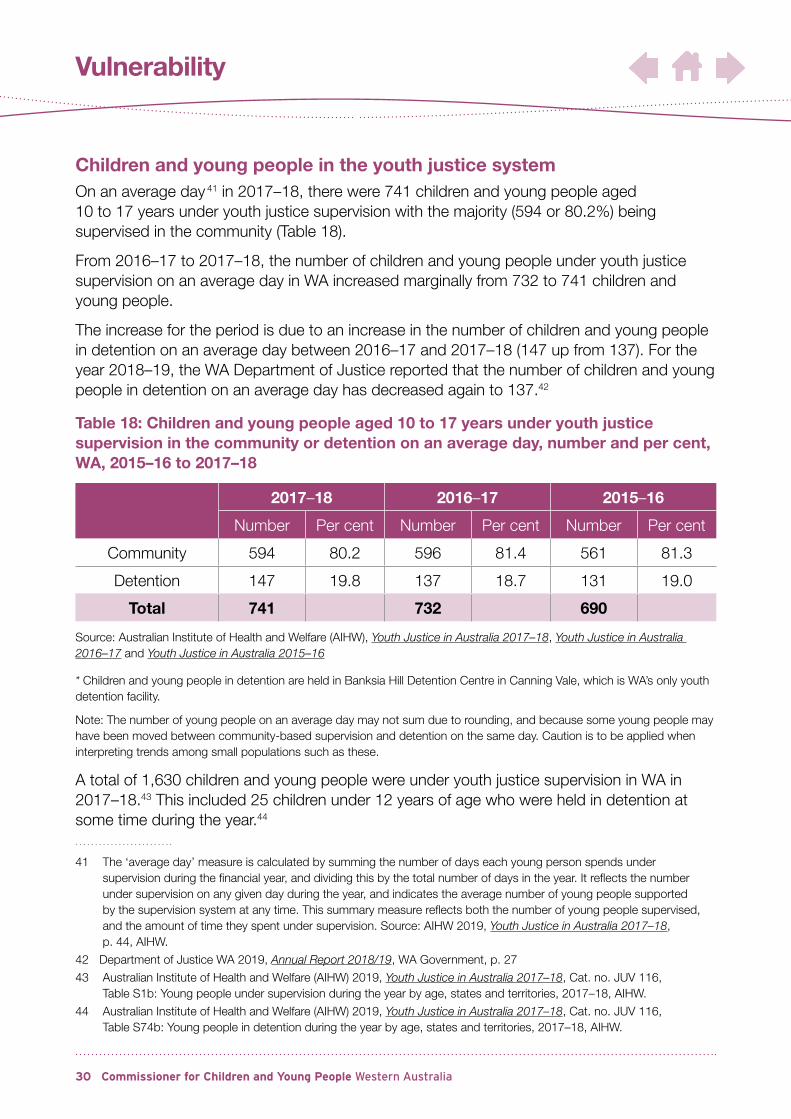
Children and young people in the youth justice systemOn an average day 41 in 2017–18, there were 741 children and young people aged 10 to 17 years under youth justice supervision with the majority (594 or 80.2%) being supervised in the community (Table 18).
From 2016–17 to 2017–18, the number of children and young people under youth justice supervision on an average day in WA increased marginally from 732 to 741 children and young people.
The increase for the period is due to an increase in the number of children and young people in detention on an average day between 2016–17 and 2017–18 (147 up from 137). For the year 2018–19, the WA Department of Justice reported that the number of children and young people in detention on an average day has decreased again to 137.42
Table 18: Children and young people aged 10 to 17 years under youth justice supervision in the community or detention on an average day, number and per cent, WA, 2015–16 to 2017–18
2017–18 2016–17 2015–16
Number Per cent Number Per cent Number Per cent
Community 594 80.2 596 81.4 561 81.3
Detention 147 19.8 137 18.7 131 19.0
Total 741 732 690
Source: Australian Institute of Health and Welfare (AIHW), Youth Justice in Australia 2017–18, Youth Justice in Australia 2016–17 and Youth Justice in Australia 2015–16
* Children and young people in detention are held in Banksia Hill Detention Centre in Canning Vale, which is WA’s only youth detention facility.
Note: The number of young people on an average day may not sum due to rounding, and because some young people may have been moved between community-based supervision and detention on the same day. Caution is to be applied when interpreting trends among small populations such as these.
A total of 1,630 children and young people were under youth justice supervision in WA in 2017–18.43 This included 25 children under 12 years of age who were held in detention at some time during the year.44
41 The ‘average day’ measure is calculated by summing the number of days each young person spends under supervision during the financial year, and dividing this by the total number of days in the year. It reflects the number under supervision on any given day during the year, and indicates the average number of young people supported by the supervision system at any time. This summary measure reflects both the number of young people supervised, and the amount of time they spent under supervision. Source: AIHW 2019, Youth Justice in Australia 2017–18, p. 44, AIHW.
42 Department of Justice WA 2019, Annual Report 2018/19, WA Government, p. 27
43 Australian Institute of Health and Welfare (AIHW) 2019, Youth Justice in Australia 2017–18, Cat. no. JUV 116, Table S1b: Young people under supervision during the year by age, states and territories, 2017–18, AIHW.
44 Australian Institute of Health and Welfare (AIHW) 2019, Youth Justice in Australia 2017–18, Cat. no. JUV 116, Table S74b: Young people in detention during the year by age, states and territories, 2017–18, AIHW.
Vulnerability
Profile of Children and Young People in WA 31
The rate of children and young people aged 10 to 17 years under youth justice supervision (in the community and detention) on an average day in WA has decreased from 37.9 per 10,000 children and young people in 2008–09 to 29.5 in 2017–18.45 The rate of young people aged 10 to 17 years in detention on an average night in WA has also decreased, although less markedly from 6.5 to 5.9 per 10,000 children and young people.46
In 2017–18, Aboriginal children and young people in WA were 27 times more likely than non-Aboriginal children and young people to be under community supervision or in detention (293 Aboriginal children and young people per 10,000 compared with 11 non-Aboriginal children and young people per 10,000).47 Furthermore, WA Aboriginal children and young people were 37 times more likely to be in detention than non-Aboriginal children and young people.48
Female children and young people are significantly less likely to be under youth justice supervision than male children and young people. On an average day in 2017–18, 16.5 per cent of children and young people under community supervision and 5.4 per cent of children and young people in detention were female.49
In 2019, AIHW released an analysis of children and young people in child protection50 and under youth justice supervision. The report found that young people in the youth justice system were nine times more likely to have received child protection services than the general population.51
45 Australian Institute of Health and Welfare (AIHW) 2019, Youth Justice in Australia 2017–18, Cat. no. JUV 116, Table S12a: Young people aged 10–17 under supervision on an average day by Indigenous status, states and territories, 2008–09 to 2017–18 (rate), AIHW.
46 Australian Institute of Health and Welfare (AIHW) 2019, Youth Justice in Australia 2017–18, Cat. no. JUV 116, Table S85a: Young people aged 10–17 in detention on an average day by Indigenous status, states and territories, 2008–09 to 2017–18 (rate), AIHW.
47 Australian Institute of Health and Welfare (AIHW) 2019, Youth Justice in Australia 2017–18, Cat. no. JUV 116, Table S12a: Young people aged 10–17 under supervision on an average day by Indigenous status, states and territories, 2008–09 to 2017–18 (rate), AIHW.
48 Australian Institute of Health and Welfare (AIHW) 2019, Youth Justice in Australia 2017–18, Cat. no. JUV 116, Table S85a: Young people aged 10–17 in detention on an average day by Indigenous status, states and territories, 2008–09 to 2017–18 (rate), AIHW.
49 Australian Institute of Health and Welfare (AIHW) 2019, Youth Justice in Australia 2017–18, Table S76a: Young people aged 10–17 in detention on an average day(a) by sex and Indigenous status, states and territories, 2017–18 and Table S38a: Young people aged 10–17 under community-based supervision on an average day(a) by sex and Indigenous status, states and territories, 2017–18, AIHW.
50 Child protection data includes investigated notifications, children under care and protection orders and children in out-of-home care (AIHW, Youth Justice in Australia 2016–2017, p. 2-3).
51 Australian Institute of Health and Welfare (AIHW) 2019, Young people in child protection and under youth justice supervision: 1 July 2014 to 30 June 2018, AIHW, p. 19.
twitter.com/ccypwa facebook.com/ccypwa instagram.com/ccypwa
Ground Floor, 1 Alvan Street, Subiaco WA 6008Telephone: (08) 6213 2297Country freecall: 1800 072 444Email: [email protected]: ccyp.wa.gov.au
Connect with the Commissioner
All photographs featured in this publication are of Western Australian children and young people and have been taken by or for the Commissioner for Children and Young People.