Embed Size (px)
Citation preview
www.heatroadmap.eu @HeatRoadmapEU
This project has received funding from the European Union's Horizon 2020 research and innovation programme under grant agreement No. 695989.
Profile of heating and cooling demand in 2015
D 3.1
2017
2 @HeatRoadmapEU www.heatroadmap.e
Authors: Tobias Fleiter, Rainer Elsland, Matthias Rehfeldt, Jan Steinbach (Fraunhofer ISI) Ulrich Reiter, Giacomo Catenazzi, Martin Jakob (TEP Energy GmbH) Cathelijne Rutten, Robert Harmsen (University Utrecht) Florian Dittmann, Philippe Rivière, Pascal Stabat (ARMINES) Contact: Tobias Fleiter Fraunhofer Institute for Systems and Innovation Research Breslauer Str. 48 76139 Karlsruhe Germany E-mail: [email protected] Heat Roadmap Europe website: www.heatroadmap.eu
Deliverable No. D 3.1: Report © 2017
This project has received funding from the European Union's Horizon 2020 research and innovation programme under grant agreement No. 695989. The sole responsibility for the content of this document lies with the authors. It does not necessarily reflect the opinion of the funding authorities. The funding authorities are not responsible for any use that may be made of the information contained therein.

3 @HeatRoadmapEU www.heatroadmap.e

1 @HeatRoadmapEU www.heatroadmap.eu
Table of Contents 1. Introduction .......................................................................................... 3
2. Method, definitions and data sources ........................................................ 6
2.1. Method ........................................................................................... 6
2.2. Definitions ...................................................................................... 9
2.3. Data sources ................................................................................. 13
3. Summary of main results ...................................................................... 14
4. References ......................................................................................... 16

2
@HeatRoadmapEU www.heatroadmap.eu
3 @HeatRoadmapEU www.heatroadmap.eu
1. Introduction In Europe, there is a clear long-term objective to decarbonise the energy system, but it is currently unclear how this will be achieved in the heating and cooling sector. The Heat Roadmap Europe (HRE) project will enable new policies and prepare the ground for new investments by creating more certainty regarding the changes that are required. Heat Roadmap Europe is co-funded by the European Union, brings together 24 academic, industrial, governmental and civil society partners, and runs from 2016-2019.
The overall objective of the HRE project is to provide new capacity and skills for lead users in the heating and cooling sector including policymakers, industry, and researchers at local, national, and EU levels by developing the data, tools, and methodologies necessary to quantify the impact of implementing more energy efficiency measures on both the demand and supply sides of the sector.
This WP3 report presents a breakdown of both the demand and supply of heating and cooling energy for the year 2015 and thus provides the starting point for the scenario analyses up until 2050.
Conventional energy balances (both national and Eurostat) generally provide the final energy demand split by sector (residential, industry, tertiary and transport), energy carrier and also by sub-sector for industry. They do not usually provide information on end-uses such as heating, cooling, mechanical energy or useful energy (i.e. the heat that is used by the consumer, e.g. for heating a room). A recent review found that several EU countries provide end-use balances for the residential sector and some for the tertiary sector, but only three countries do so for the industry sector (United Kingdom, Germany and Austria) (Fraunhofer ISI et al. 2016). However, the method and definitions used in the various countries deviate from one another and it is not possible to derive a consistent EU-wide end-use energy balance simply by combining national data (Fraunhofer ISI et al. 2016).
As a consequence, the energy demand for heating and cooling (H/C) cannot be derived from the currently existing official energy balances in a consistent way for all EU countries. Neither is it possible to calculate the share of renewable energies in H/C without simplification as done, for example, in the SHARES project1, which excludes all electricity consumption from H/C energy use. This approach does not provide accurate results in many countries.
Therefore, this deliverable aims to profile the energy demand for H/C by calculating energy balances for all 28 EU countries that include H/C. However, the focus of the analysis and input-data quality checks is on the 14 EU countries with the highest H/C demand as in the other HRE deliverables. The remaining 14 countries were added so
1 http://ec.europa.eu/eurostat/de/web/energy/data/shares
4
@HeatRoadmapEU www.heatroadmap.eu
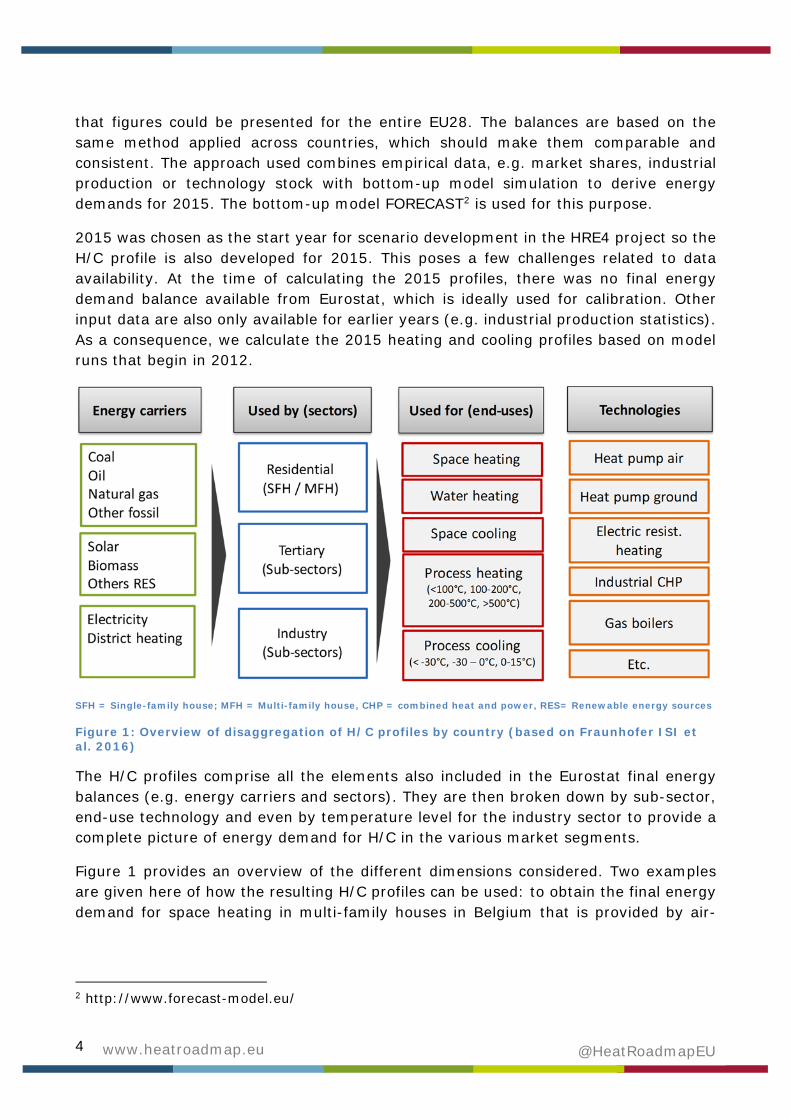
that figures could be presented for the entire EU28. The balances are based on the same method applied across countries, which should make them comparable and consistent. The approach used combines empirical data, e.g. market shares, industrial production or technology stock with bottom-up model simulation to derive energy demands for 2015. The bottom-up model FORECAST2 is used for this purpose.
2015 was chosen as the start year for scenario development in the HRE4 project so the H/C profile is also developed for 2015. This poses a few challenges related to data availability. At the time of calculating the 2015 profiles, there was no final energy demand balance available from Eurostat, which is ideally used for calibration. Other input data are also only available for earlier years (e.g. industrial production statistics). As a consequence, we calculate the 2015 heating and cooling profiles based on model runs that begin in 2012.
SFH = Single-family house; MFH = Multi-family house, CHP = combined heat and power, RES= Renewable energy sources
Figure 1: Overview of disaggregation of H/C profiles by country (based on Fraunhofer ISI et al. 2016)
The H/C profiles comprise all the elements also included in the Eurostat final energy balances (e.g. energy carriers and sectors). They are then broken down by sub-sector, end-use technology and even by temperature level for the industry sector to provide a complete picture of energy demand for H/C in the various market segments.
Figure 1 provides an overview of the different dimensions considered. Two examples are given here of how the resulting H/C profiles can be used: to obtain the final energy demand for space heating in multi-family houses in Belgium that is provided by air-
2 http://www.forecast-model.eu/
5 @HeatRoadmapEU www.heatroadmap.eu
source heat pumps; and to show the coal used to provide process heat in the iron and steel sector in Italy in the temperature range above 500°C.
The profiles include final energy demand as well as useful energy demand. We define useful energy demand as the heat provided by the combined system of a boiler plus storage.
In the following, the definitions and data sources are described, before an overview of the main results is provided. The annex gives a more detailed analysis of the H/C profiles in each sector (industry, residential and tertiary).
6
@HeatRoadmapEU www.heatroadmap.eu
2. Method, definitions and data sources 2.1. Method The approach used combines empirical data with bottom-up modelling of energy demand. The empirical data are taken from official national statistics, surveys as well as various statistics provided e.g. by industrial organisations. An overview of the main data sources is provided in section 0. For the bottom-up modelling, we use the energy demand model FORECAST. A separate bottom-up model based on sales data is used only for space cooling as described below.
2.1.1. Deriving end-use energy balances using the bottom-up model FORECAST
The FORECAST model comprises three individual modules; each represents one sector in line with the Eurostat (or national) energy balances: industry, services/tertiary and residential. While all the sector modules follow a similar bottom-up methodology, they also consider the particularities of each sector like technology structure, actor heterogeneity and data availability. Energy demand is calculated based on technology structure and technology characteristics as well as economic drivers and prices.
In the short term, the most important determinants of energy demand are ambient temperature (affecting mainly space heating) and economic activity (affecting mainly industrial process H/C demand). While the FORECAST model includes a detailed simulation of technological change based on vintage stock models, these effects are more important in the longer term (e.g. towards 2030 and beyond) and less so in the short term.
FORECAST takes ambient temperature into account using the annual average heating/cooling degree days (HDDs/CDDs) as shown in Table 4. Industrial activity is reflected using the annual value added by sub-sector and the physical production per year for major energy-intensive bulk products (e.g. tonnes of oxygen steel produced). 2015 production data were not available for most of the around 60 products considered and forecasts were made based on past time series. Activities in the services sector are driven by the number of employees and the sub-sector-specific energy demand per employee and floor area.
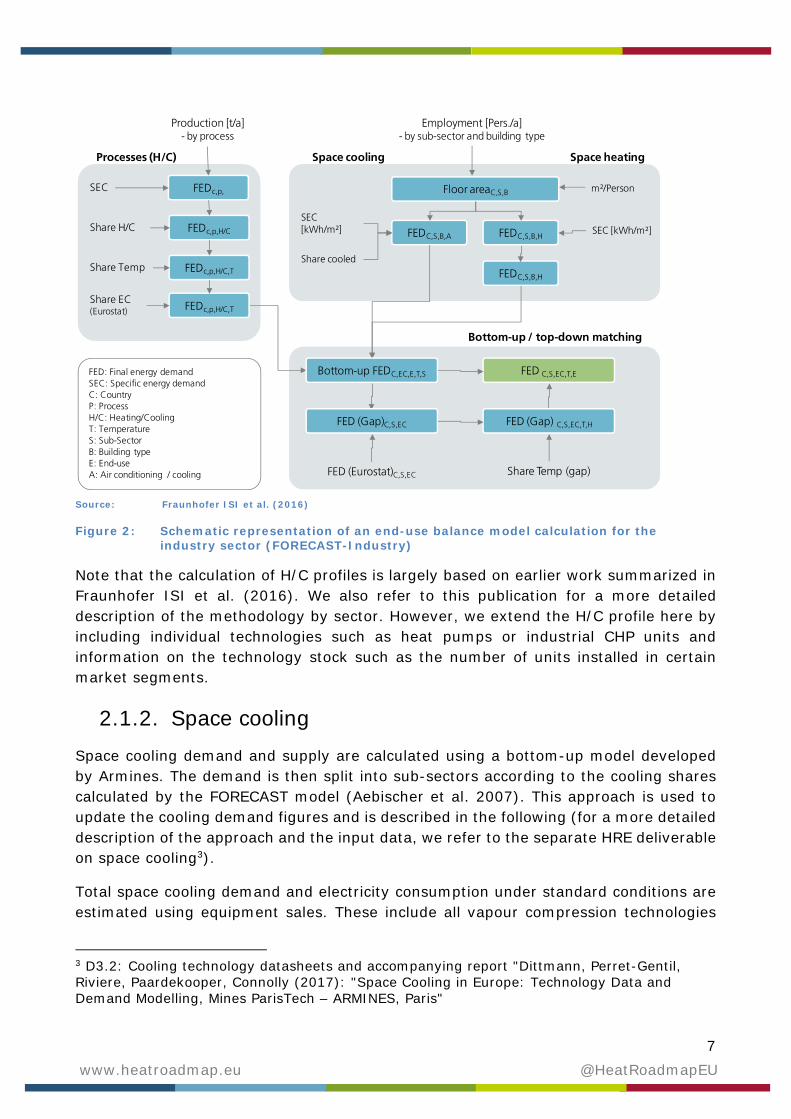
As an example, Figure 2 shows how end-use energy balances are derived in FORECAST-Industry based on bottom-up data by process and end-use. This approach combines activity data such as production and employment with specific energy demand by process/end-use.
7 @HeatRoadmapEU www.heatroadmap.eu
Source: Fraunhofer ISI et al. (2016)
Figure 2: Schematic representation of an end-use balance model calculation for the industry sector (FORECAST-Industry)
Note that the calculation of H/C profiles is largely based on earlier work summarized in Fraunhofer ISI et al. (2016). We also refer to this publication for a more detailed description of the methodology by sector. However, we extend the H/C profile here by including individual technologies such as heat pumps or industrial CHP units and information on the technology stock such as the number of units installed in certain market segments.
2.1.2. Space cooling Space cooling demand and supply are calculated using a bottom-up model developed by Armines. The demand is then split into sub-sectors according to the cooling shares calculated by the FORECAST model (Aebischer et al. 2007). This approach is used to update the cooling demand figures and is described in the following (for a more detailed description of the approach and the input data, we refer to the separate HRE deliverable on space cooling3).
Total space cooling demand and electricity consumption under standard conditions are estimated using equipment sales. These include all vapour compression technologies
3 D3.2: Cooling technology datasheets and accompanying report "Dittmann, Perret-Gentil, Riviere, Paardekooper, Connolly (2017): "Space Cooling in Europe: Technology Data and Demand Modelling, Mines ParisTech – ARMINES, Paris"
Processes (H/C)
Production [t/a]- by process
Employment [Pers./a]- by sub-sector and building type
FEDc,p, Floor areaC,S,BSEC m²/Person
Space heating
FEDc,p,H/CShare H/C
FEDc,p,H/C,TShare Temp
FEDc,p,H/C,TShare EC(Eurostat)
FED: Final energy demandSEC: Specific energy demandC: CountryP: ProcessH/C: Heating/CoolingT: TemperatureS: Sub-SectorB: Building typeE: End-useA: Air conditioning / cooling
FEDC,S,B,HSEC [kWh/m²]
Share Temp (gap)
FEDC,S,B,A
SEC[kWh/m²]
Share cooled
FEDC,S,B,H
Bottom-up FEDC,EC,E,T,S
FED (Gap)C,S,EC
FED C,S,EC,T,E
FED (Gap) C,S,EC,T,H
FED (Eurostat)C,S,EC
Bottom-up / top-down matching
Space cooling
8 @HeatRoadmapEU www.heatroadmap.eu
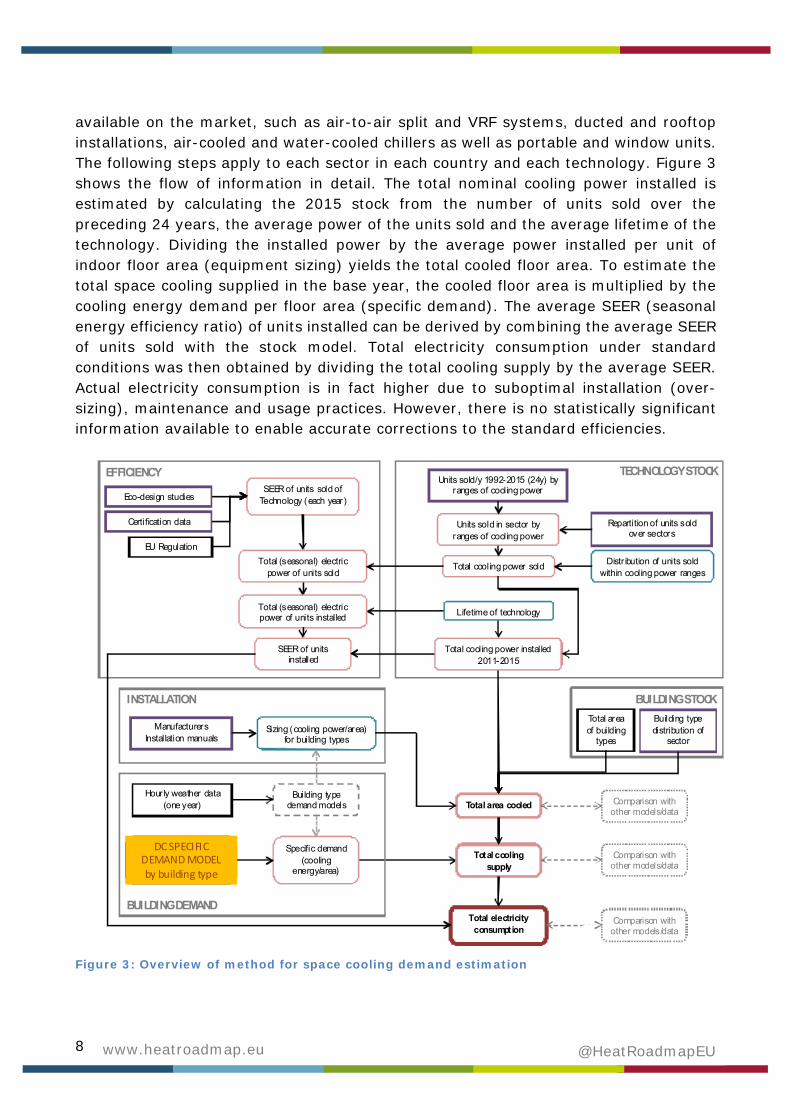
available on the market, such as air-to-air split and VRF systems, ducted and rooftop installations, air-cooled and water-cooled chillers as well as portable and window units. The following steps apply to each sector in each country and each technology. Figure 3 shows the flow of information in detail. The total nominal cooling power installed is estimated by calculating the 2015 stock from the number of units sold over the preceding 24 years, the average power of the units sold and the average lifetime of the technology. Dividing the installed power by the average power installed per unit of indoor floor area (equipment sizing) yields the total cooled floor area. To estimate the total space cooling supplied in the base year, the cooled floor area is multiplied by the cooling energy demand per floor area (specific demand). The average SEER (seasonal energy efficiency ratio) of units installed can be derived by combining the average SEER of units sold with the stock model. Total electricity consumption under standard conditions was then obtained by dividing the total cooling supply by the average SEER. Actual electricity consumption is in fact higher due to suboptimal installation (over-sizing), maintenance and usage practices. However, there is no statistically significant information available to enable accurate corrections to the standard efficiencies.
Total cooling power installed 2011-2015
Units sold in sector by ranges of cooling power
Total cooling power sold
Units sold/y 1992-2015 (24y) by ranges of cooling power
Repartition of units sold over sectors
Distr ibution of units sold within cooling power ranges
Lifetime of technology
Total area of building
typesSizing (cooling power/area)
for building types
Building type distribution of
sector
Manufacturers Installation manuals
TECHNOLOGY STOCK
BUILDING STOCKINSTALLATION
Total cooling supply
Total area cooled
Total electricity consumption
SEER of units sold of Technology (each year)
EU Regulation
Eco-design studies
Certification data
EFFICIENCY
Comparison with other models/data
Comparison with other models/data
Comparison with other models/data
SEER of units installed
Total (seasonal) electricpower of units sold
Total (seasonal) electricpower of units installed
Specific demand (cooling
energy/area)
Building type demand models
Hour ly weather data (one year)
BUILDING DEMAND
DC SPECIFIC DEMAND MODELby building type
Figure 3: Overview of method for space cooling demand estimation
9 @HeatRoadmapEU www.heatroadmap.eu
2.2. Definitions The following summarises the main definitions used for the H/C profiles.
Final energy, delivered heat and useful energy
We define final energy in line with Eurostat as the energy input to the heating unit at the final consumer. Like Eurostat, we also exclude ambient heat used in heat pumps. Only the electricity or gas consumption of heat pumps is included in the final energy.
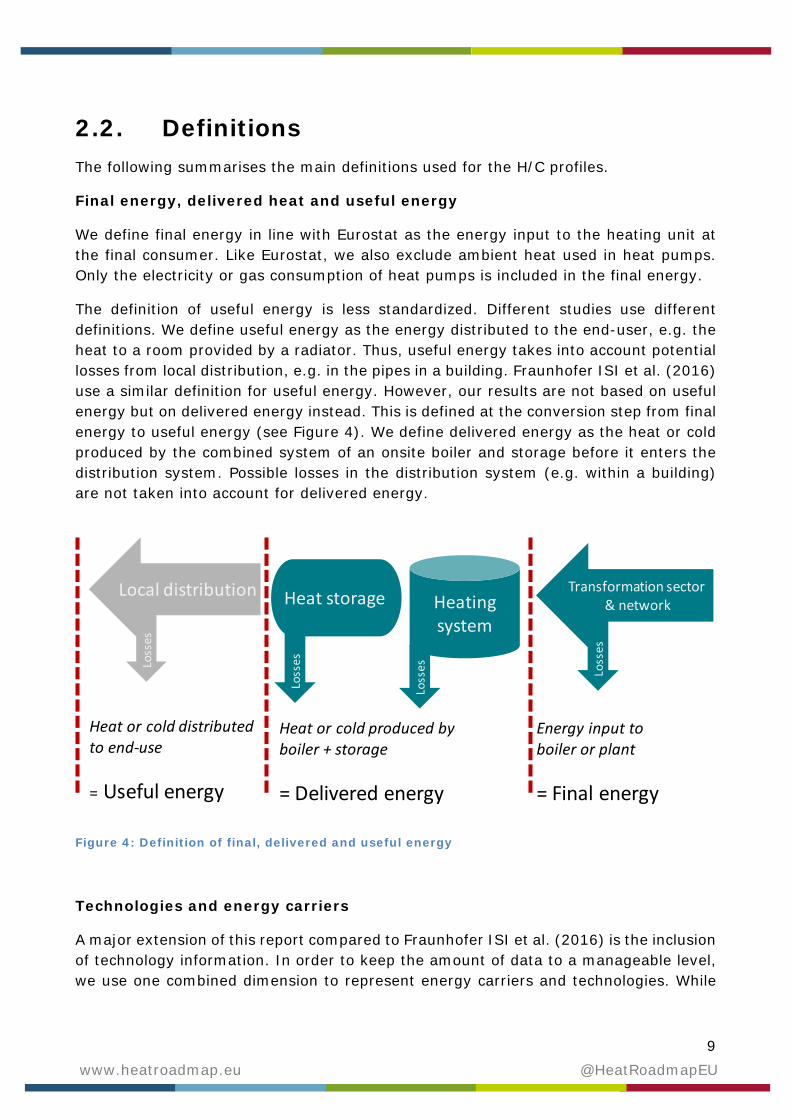
The definition of useful energy is less standardized. Different studies use different definitions. We define useful energy as the energy distributed to the end-user, e.g. the heat to a room provided by a radiator. Thus, useful energy takes into account potential losses from local distribution, e.g. in the pipes in a building. Fraunhofer ISI et al. (2016) use a similar definition for useful energy. However, our results are not based on useful energy but on delivered energy instead. This is defined at the conversion step from final energy to useful energy (see Figure 4). We define delivered energy as the heat or cold produced by the combined system of an onsite boiler and storage before it enters the distribution system. Possible losses in the distribution system (e.g. within a building) are not taken into account for delivered energy.
Figure 4: Definition of final, delivered and useful energy
Technologies and energy carriers
A major extension of this report compared to Fraunhofer ISI et al. (2016) is the inclusion of technology information. In order to keep the amount of data to a manageable level, we use one combined dimension to represent energy carriers and technologies. While
Heating system
Heat storage
Losses
Losses
Local distribution
Losses
Energy input toboiler or plant
= Final energy
Heat or cold produced byboiler + storage
= Delivered energy
Transformation sector & network
Losses
Heat or cold distributed to end‐use
= Useful energy
10
@HeatRoadmapEU www.heatroadmap.eu
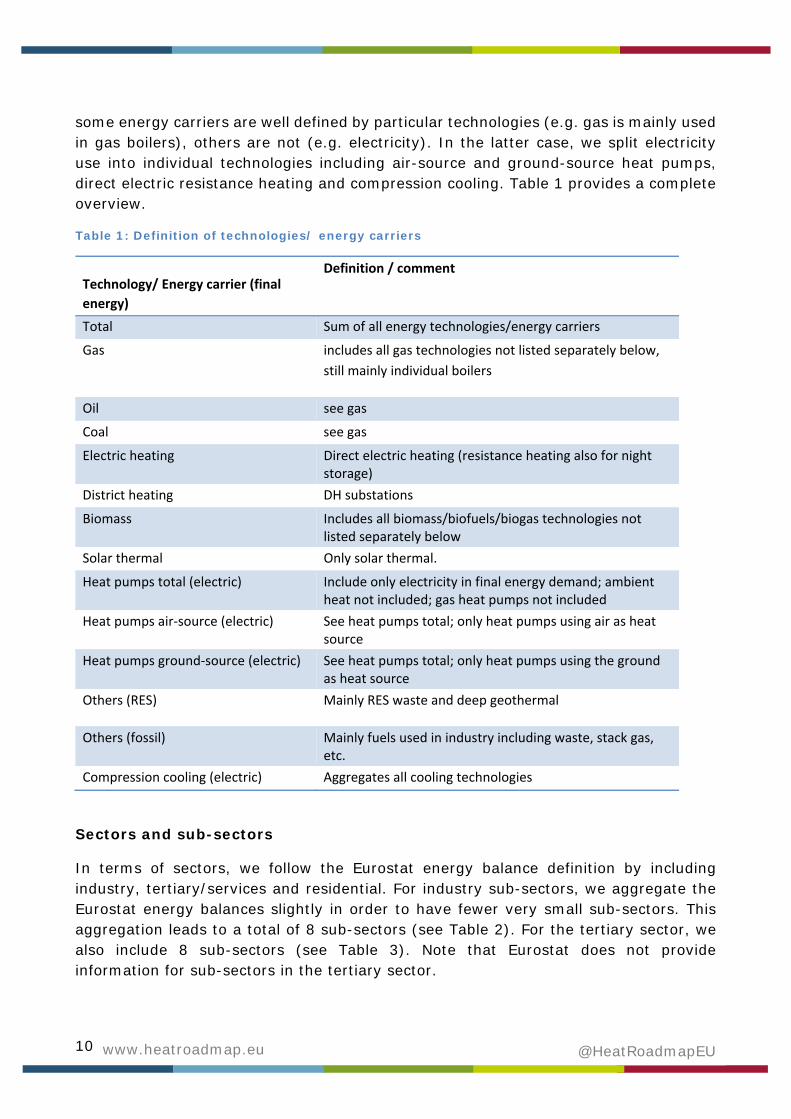
some energy carriers are well defined by particular technologies (e.g. gas is mainly used in gas boilers), others are not (e.g. electricity). In the latter case, we split electricity use into individual technologies including air-source and ground-source heat pumps, direct electric resistance heating and compression cooling. Table 1 provides a complete overview.
Table 1: Definition of technologies/ energy carriers
Technology/ Energy carrier (final
energy)
Definition / comment
Total Sum of all energy technologies/energy carriers
Gas includes all gas technologies not listed separately below,
still mainly individual boilers
Oil see gas
Coal see gas
Electric heating Direct electric heating (resistance heating also for night storage)
District heating DH substations
Biomass Includes all biomass/biofuels/biogas technologies not listed separately below
Solar thermal Only solar thermal.
Heat pumps total (electric) Include only electricity in final energy demand; ambient heat not included; gas heat pumps not included
Heat pumps air‐source (electric) See heat pumps total; only heat pumps using air as heat source
Heat pumps ground‐source (electric) See heat pumps total; only heat pumps using the ground as heat source
Others (RES) Mainly RES waste and deep geothermal
Others (fossil) Mainly fuels used in industry including waste, stack gas, etc.
Compression cooling (electric) Aggregates all cooling technologies
Sectors and sub-sectors
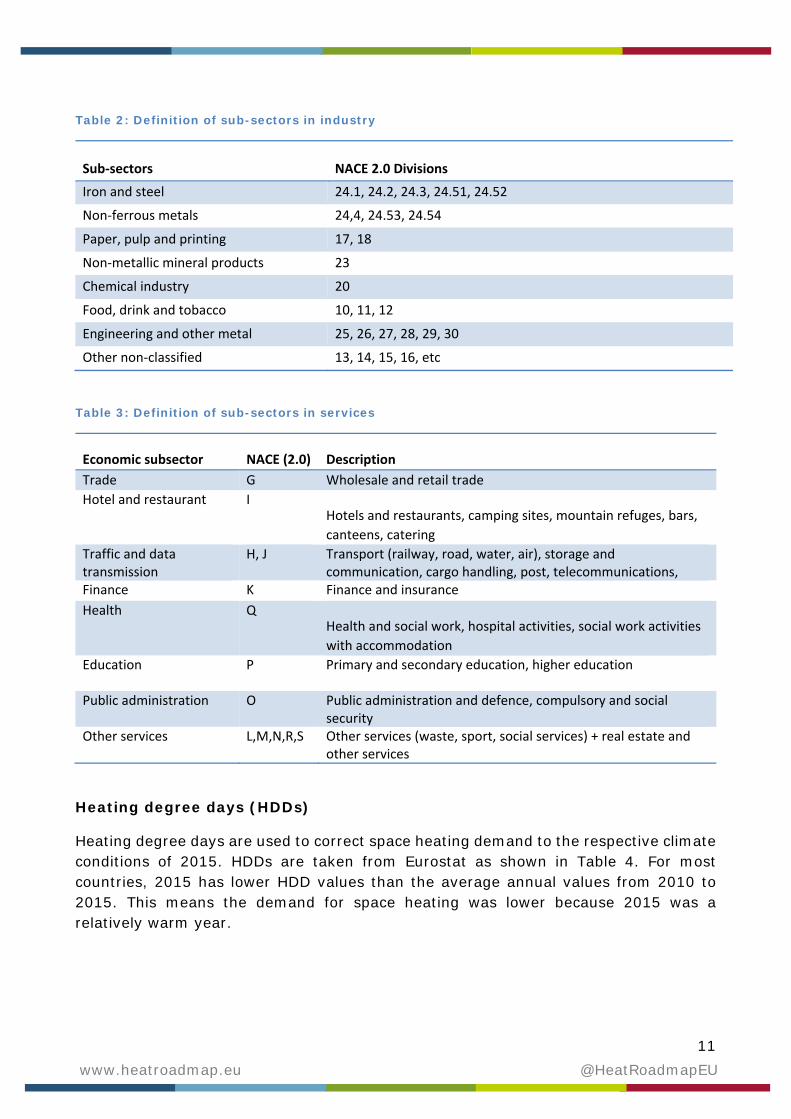
In terms of sectors, we follow the Eurostat energy balance definition by including industry, tertiary/services and residential. For industry sub-sectors, we aggregate the Eurostat energy balances slightly in order to have fewer very small sub-sectors. This aggregation leads to a total of 8 sub-sectors (see Table 2). For the tertiary sector, we also include 8 sub-sectors (see Table 3). Note that Eurostat does not provide information for sub-sectors in the tertiary sector.
11 @HeatRoadmapEU www.heatroadmap.eu
Table 2: Definition of sub-sectors in industry
Sub‐sectors NACE 2.0 Divisions
Iron and steel 24.1, 24.2, 24.3, 24.51, 24.52
Non‐ferrous metals 24,4, 24.53, 24.54
Paper, pulp and printing 17, 18
Non‐metallic mineral products 23
Chemical industry 20
Food, drink and tobacco 10, 11, 12
Engineering and other metal 25, 26, 27, 28, 29, 30
Other non‐classified 13, 14, 15, 16, etc
Table 3: Definition of sub-sectors in services
Economic subsector NACE (2.0) Description
Trade G Wholesale and retail trade
Hotel and restaurant I Hotels and restaurants, camping sites, mountain refuges, bars,
canteens, catering
Traffic and data transmission
H, J Transport (railway, road, water, air), storage and communication, cargo handling, post, telecommunications,
Finance K Finance and insurance
Health Q Health and social work, hospital activities, social work activities
with accommodation
Education P Primary and secondary education, higher education
Public administration O Public administration and defence, compulsory and social security
Other services L,M,N,R,S Other services (waste, sport, social services) + real estate and other services
Heating degree days (HDDs)
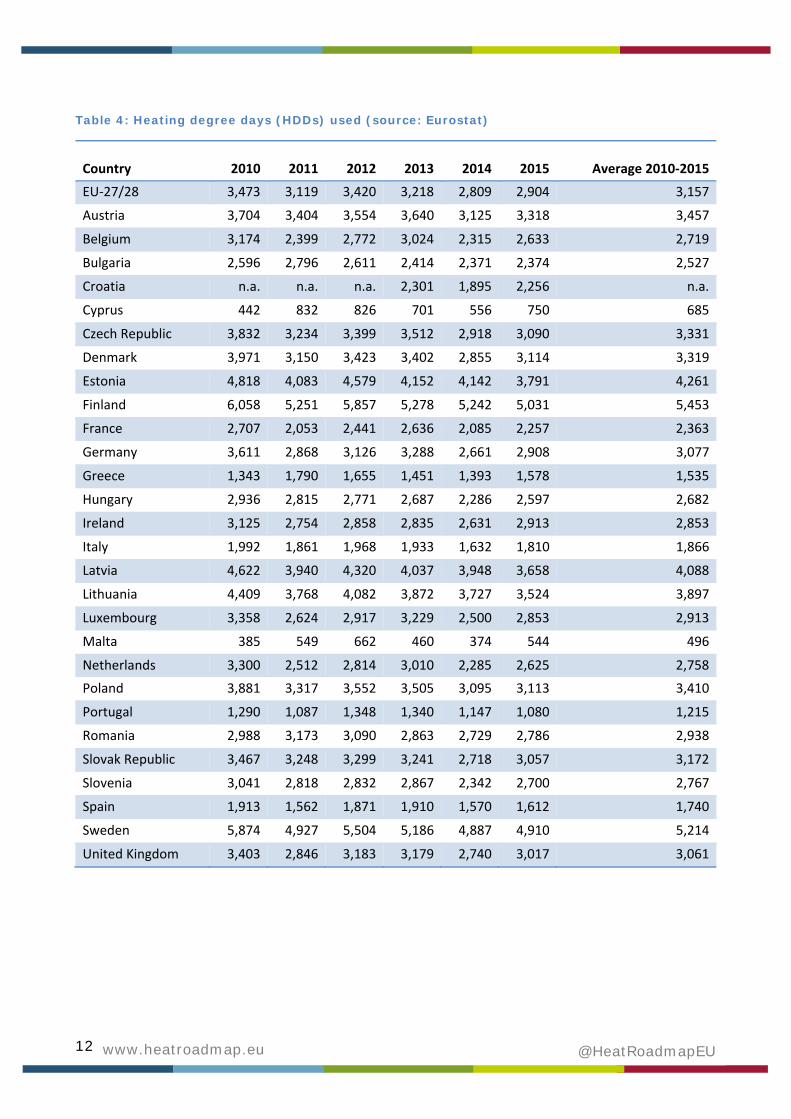
Heating degree days are used to correct space heating demand to the respective climate conditions of 2015. HDDs are taken from Eurostat as shown in Table 4. For most countries, 2015 has lower HDD values than the average annual values from 2010 to 2015. This means the demand for space heating was lower because 2015 was a relatively warm year.
12
@HeatRoadmapEU www.heatroadmap.eu
Table 4: Heating degree days (HDDs) used (source: Eurostat)
Country 2010 2011 2012 2013 2014 2015 Average 2010‐2015
EU‐27/28 3,473 3,119 3,420 3,218 2,809 2,904 3,157
Austria 3,704 3,404 3,554 3,640 3,125 3,318 3,457
Belgium 3,174 2,399 2,772 3,024 2,315 2,633 2,719
Bulgaria 2,596 2,796 2,611 2,414 2,371 2,374 2,527
Croatia n.a. n.a. n.a. 2,301 1,895 2,256 n.a.
Cyprus 442 832 826 701 556 750 685
Czech Republic 3,832 3,234 3,399 3,512 2,918 3,090 3,331
Denmark 3,971 3,150 3,423 3,402 2,855 3,114 3,319
Estonia 4,818 4,083 4,579 4,152 4,142 3,791 4,261
Finland 6,058 5,251 5,857 5,278 5,242 5,031 5,453
France 2,707 2,053 2,441 2,636 2,085 2,257 2,363
Germany 3,611 2,868 3,126 3,288 2,661 2,908 3,077
Greece 1,343 1,790 1,655 1,451 1,393 1,578 1,535
Hungary 2,936 2,815 2,771 2,687 2,286 2,597 2,682
Ireland 3,125 2,754 2,858 2,835 2,631 2,913 2,853
Italy 1,992 1,861 1,968 1,933 1,632 1,810 1,866
Latvia 4,622 3,940 4,320 4,037 3,948 3,658 4,088
Lithuania 4,409 3,768 4,082 3,872 3,727 3,524 3,897
Luxembourg 3,358 2,624 2,917 3,229 2,500 2,853 2,913
Malta 385 549 662 460 374 544 496
Netherlands 3,300 2,512 2,814 3,010 2,285 2,625 2,758
Poland 3,881 3,317 3,552 3,505 3,095 3,113 3,410
Portugal 1,290 1,087 1,348 1,340 1,147 1,080 1,215
Romania 2,988 3,173 3,090 2,863 2,729 2,786 2,938
Slovak Republic 3,467 3,248 3,299 3,241 2,718 3,057 3,172
Slovenia 3,041 2,818 2,832 2,867 2,342 2,700 2,767
Spain 1,913 1,562 1,871 1,910 1,570 1,612 1,740
Sweden 5,874 4,927 5,504 5,186 4,887 4,910 5,214
United Kingdom 3,403 2,846 3,183 3,179 2,740 3,017 3,061
13 @HeatRoadmapEU www.heatroadmap.eu
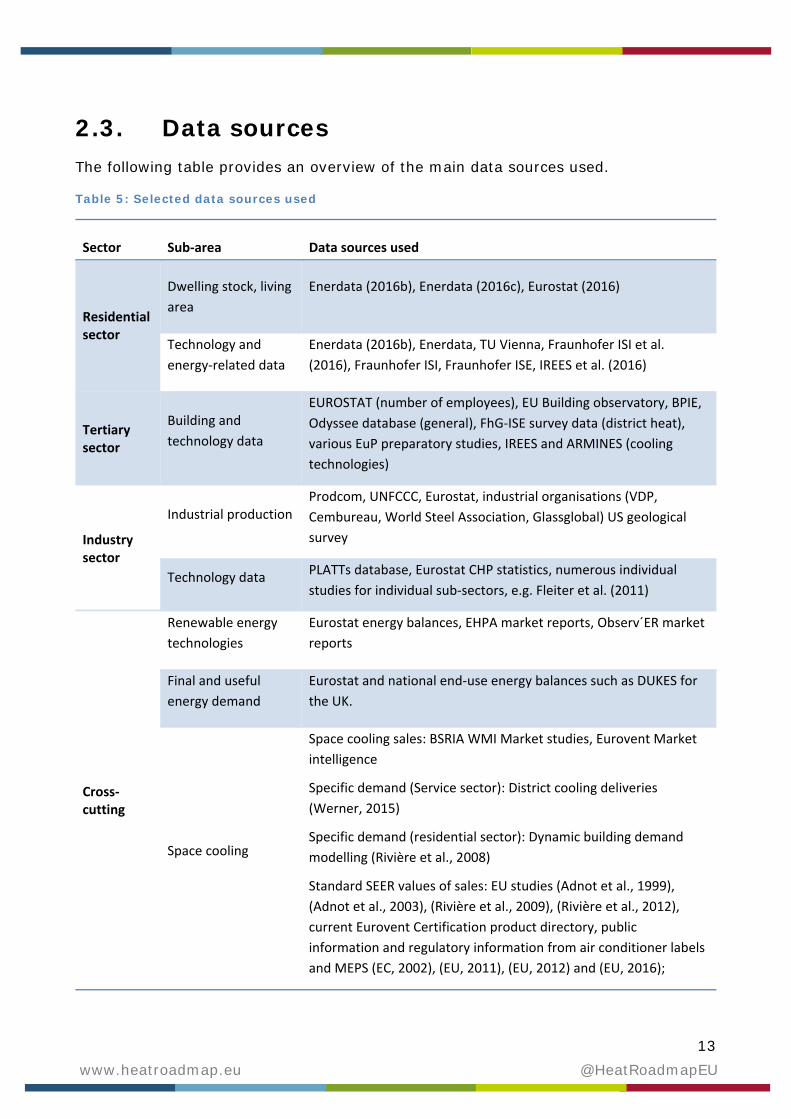
2.3. Data sources The following table provides an overview of the main data sources used.
Table 5: Selected data sources used
Sector Sub‐area Data sources used
Residential sector
Dwelling stock, living
area
Enerdata (2016b), Enerdata (2016c), Eurostat (2016)
Technology and
energy‐related data
Enerdata (2016b), Enerdata, TU Vienna, Fraunhofer ISI et al.
(2016), Fraunhofer ISI, Fraunhofer ISE, IREES et al. (2016)
Tertiary sector
Building and
technology data
EUROSTAT (number of employees), EU Building observatory, BPIE,
Odyssee database (general), FhG‐ISE survey data (district heat),
various EuP preparatory studies, IREES and ARMINES (cooling
technologies)
Industry sector
Industrial production Prodcom, UNFCCC, Eurostat, industrial organisations (VDP,
Cembureau, World Steel Association, Glassglobal) US geological
survey
Technology data PLATTs database, Eurostat CHP statistics, numerous individual
studies for individual sub‐sectors, e.g. Fleiter et al. (2011)
Cross‐cutting
Renewable energy
technologies
Eurostat energy balances, EHPA market reports, Observ´ER market
reports
Final and useful
energy demand
Eurostat and national end‐use energy balances such as DUKES for
the UK.
Space cooling
Space cooling sales: BSRIA WMI Market studies, Eurovent Market
intelligence
Specific demand (Service sector): District cooling deliveries
(Werner, 2015)
Specific demand (residential sector): Dynamic building demand
modelling (Rivière et al., 2008)
Standard SEER values of sales: EU studies (Adnot et al., 1999),
(Adnot et al., 2003), (Rivière et al., 2009), (Rivière et al., 2012),
current Eurovent Certification product directory, public
information and regulatory information from air conditioner labels
and MEPS (EC, 2002), (EU, 2011), (EU, 2012) and (EU, 2016);
14
@HeatRoadmapEU www.heatroadmap.eu
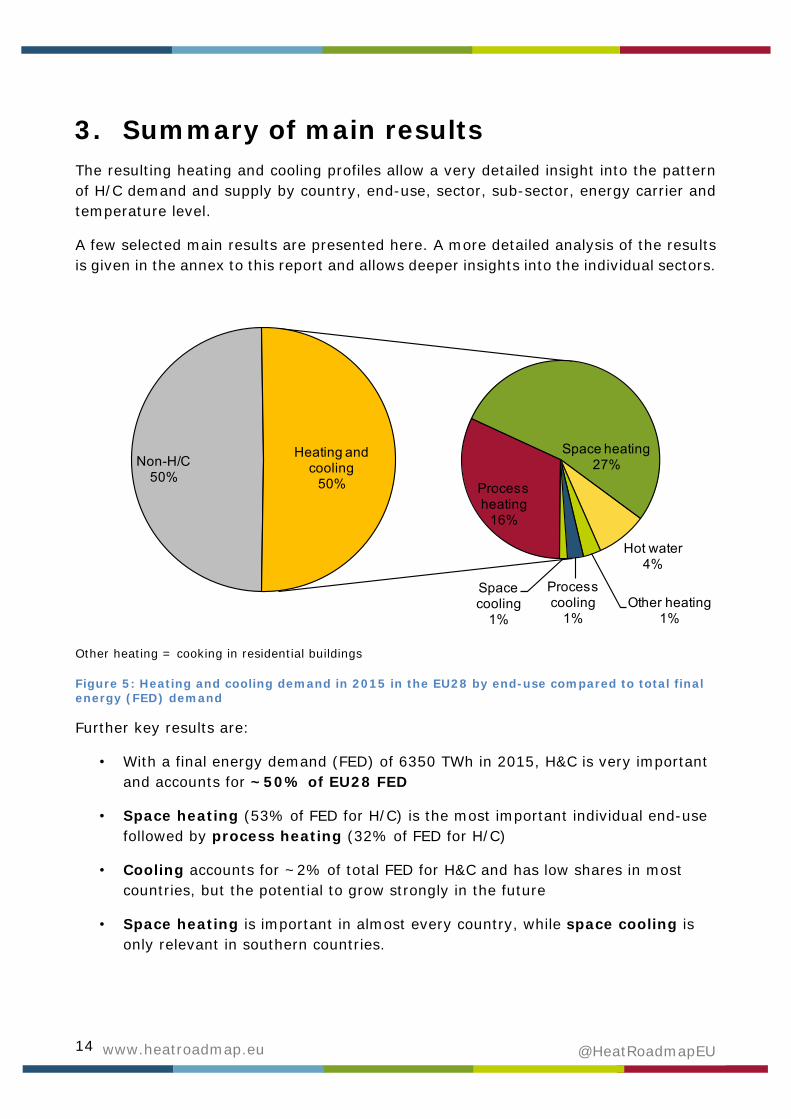
3. Summary of main results The resulting heating and cooling profiles allow a very detailed insight into the pattern of H/C demand and supply by country, end-use, sector, sub-sector, energy carrier and temperature level.
A few selected main results are presented here. A more detailed analysis of the results is given in the annex to this report and allows deeper insights into the individual sectors.
Other heating = cooking in residential buildings
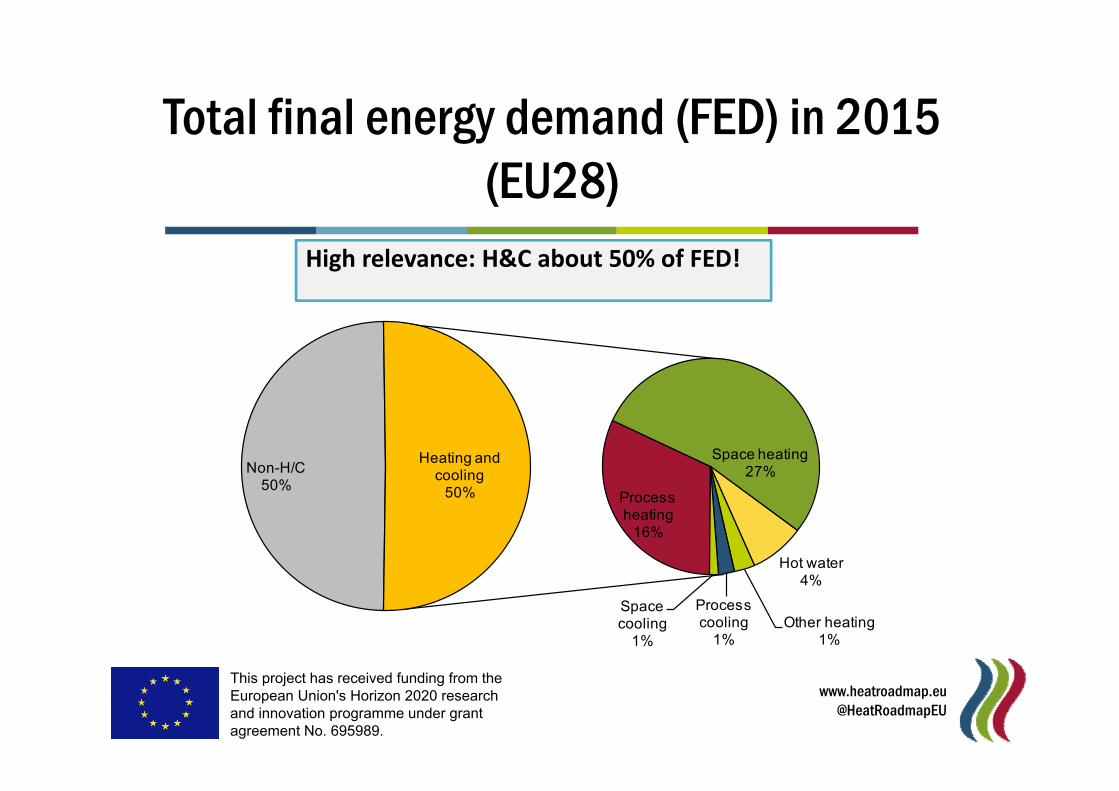
Figure 5: Heating and cooling demand in 2015 in the EU28 by end-use compared to total final energy (FED) demand
Further key results are:
• With a final energy demand (FED) of 6350 TWh in 2015, H&C is very important and accounts for ~50% of EU28 FED
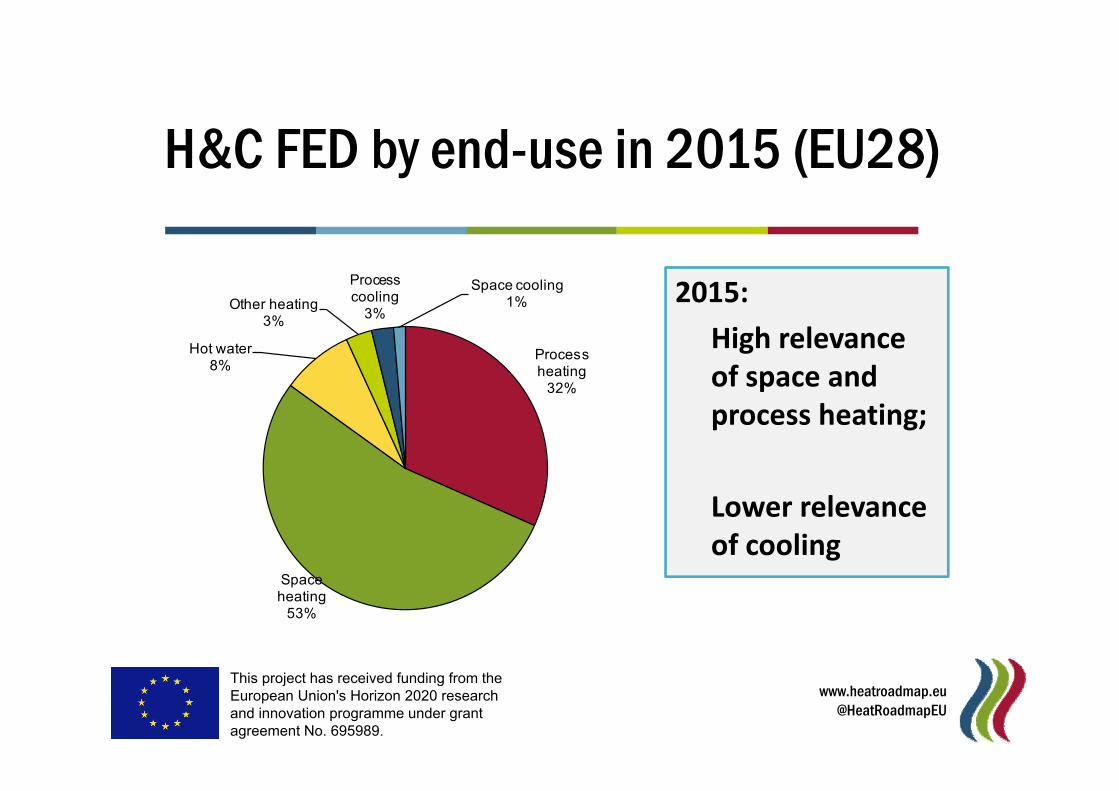
• Space heating (53% of FED for H/C) is the most important individual end-use followed by process heating (32% of FED for H/C)
• Cooling accounts for ~2% of total FED for H&C and has low shares in most countries, but the potential to grow strongly in the future
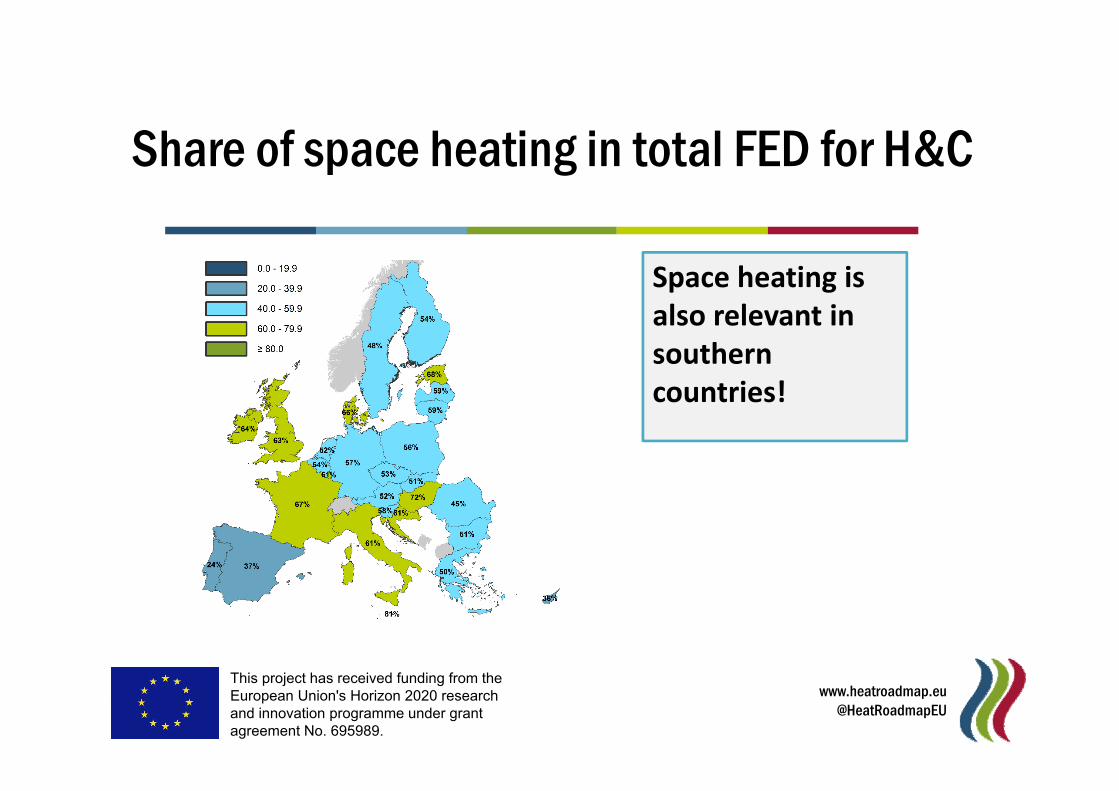
• Space heating is important in almost every country, while space cooling is only relevant in southern countries.
Non-H/C50%
Process heating
16%
Space heating27%
Hot water4%
Other heating1%
Process cooling
1%
Space cooling
1%
Heating and cooling
50%
15 @HeatRoadmapEU www.heatroadmap.eu
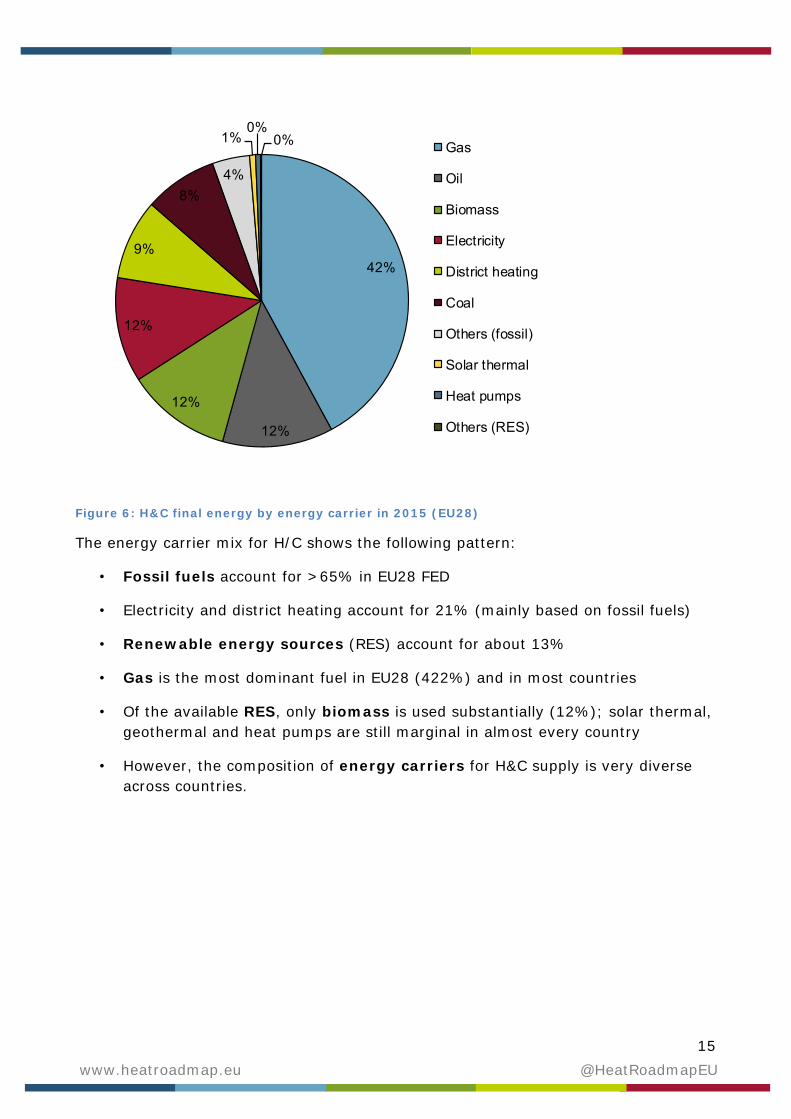
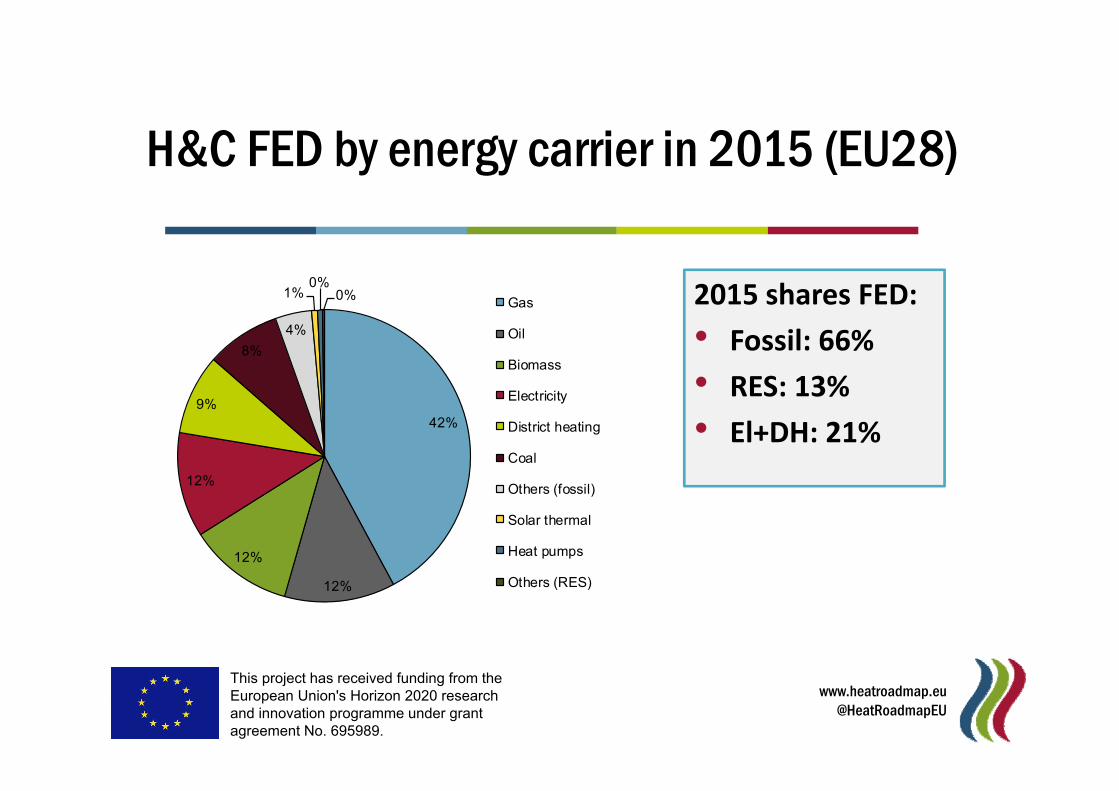
Figure 6: H&C final energy by energy carrier in 2015 (EU28)
The energy carrier mix for H/C shows the following pattern:
• Fossil fuels account for >65% in EU28 FED
• Electricity and district heating account for 21% (mainly based on fossil fuels)
• Renewable energy sources (RES) account for about 13%
• Gas is the most dominant fuel in EU28 (422%) and in most countries
• Of the available RES, only biomass is used substantially (12%); solar thermal, geothermal and heat pumps are still marginal in almost every country
• However, the composition of energy carriers for H&C supply is very diverse across countries.
42%
12%
12%
12%
9%
8%
4%
1%0%
0% Gas
Oil
Biomass
Electricity
District heating
Coal
Others (fossil)
Solar thermal
Heat pumps
Others (RES)
16
@HeatRoadmapEU www.heatroadmap.eu
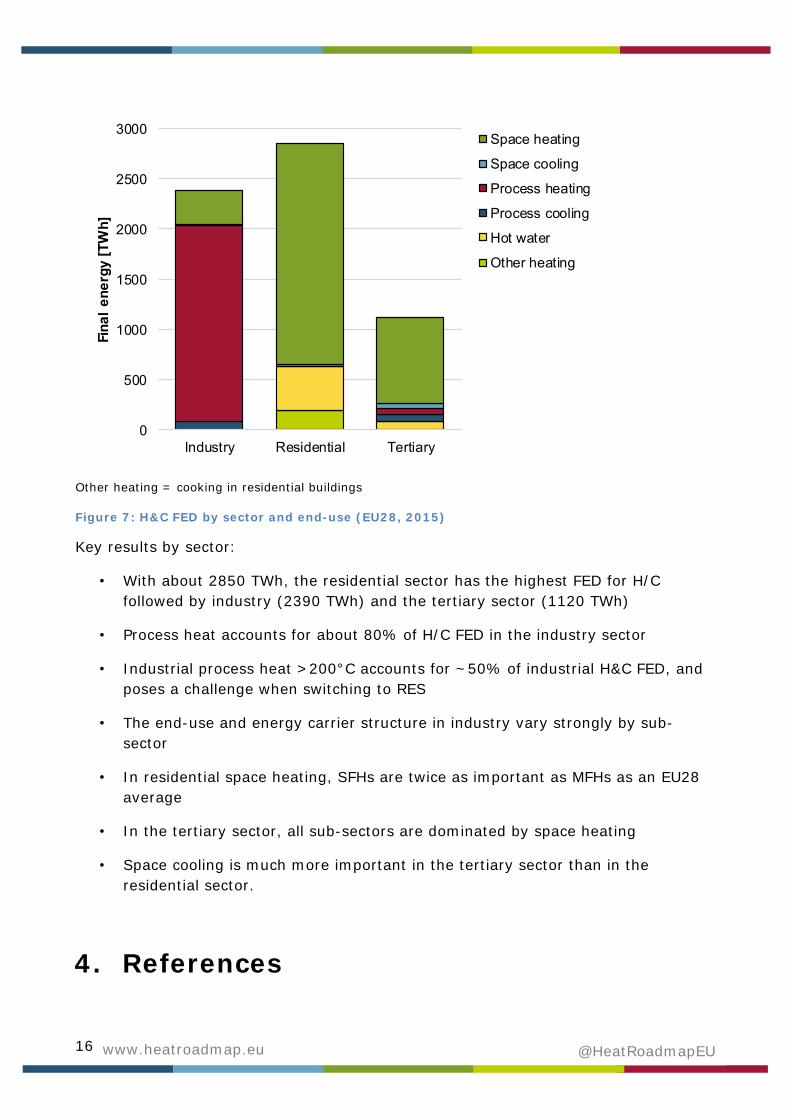
Other heating = cooking in residential buildings
Figure 7: H&C FED by sector and end-use (EU28, 2015)
Key results by sector:
• With about 2850 TWh, the residential sector has the highest FED for H/C followed by industry (2390 TWh) and the tertiary sector (1120 TWh)
• Process heat accounts for about 80% of H/C FED in the industry sector
• Industrial process heat >200°C accounts for ~50% of industrial H&C FED, and poses a challenge when switching to RES
• The end-use and energy carrier structure in industry vary strongly by sub-sector
• In residential space heating, SFHs are twice as important as MFHs as an EU28 average
• In the tertiary sector, all sub-sectors are dominated by space heating
• Space cooling is much more important in the tertiary sector than in the residential sector.
4. References
0
500
1000
1500
2000
2500
3000
Industry Residential Tertiary
Fin
al
en
erg
y [T
Wh
]
Space heating
Space cooling
Process heating
Process cooling
Hot water
Other heating
17 @HeatRoadmapEU www.heatroadmap.eu
Adnot et al. (1999) Energy efficiency of room air-conditioners. Paris: Ecole des Mines de Paris (coord. J. Adnot) et al, for DGTREN, the Commission of the European Communities, SAVE contract DGXVII4.103/D/97.026, May.
Adnot et al. (2003): Efficiency and Certification of Central Air Conditioners (EECCAC). Paris: Ecole des Mines de Paris (coord. J. Adnot) et al, for DGTREN, the Commission of the European Communities, SAVE contract, April.
Aebischer B., Jakob M., Catenazzi The late G., Henderson (2007). Impact of climate change on thermal comfort, heating and cooling energy demand in Europe. Proceedings eceee Summer Study 2007, Colle sur Loup, France, June (ISBN 978-91-633-0899-4).Enerdata (2016a): Odyssee-Mure database, Grenoble, France.
Enerdata (2016b): Stock of single and multifamily dwellings (permanently occupied), Grenoble, France.
Enerdata (2016c): Living area of dwellings, Grenoble, France.
Enerdata, TU Vienna, Fraunhofer ISI, BPIE, Sofena, Seven 7, National Consumer Research Centre, Öko-Institut, Efficiency Research Group, CENER: ENTRANZE - Policies to ENforce the TRAnsition to Nearly Zero Energy buildings in the EU-27, Grenoble, France.
Eurostat (2016): Number of private households by household composition, Luxembourg.
EU (2011): COMMISSION DELEGATED REGULATION (EU) No 626/2011 of 4 May 2011 supplementing Directive 2010/30/EU of the European Parliament and of the Council with regard to energy labelling of air conditioners, OJ L 178, 6.7.2011, p. 1–72.
EU (2012): Commission Regulation (EU) No 206/2012 of 6 March 2012 implementing Directive 2009/125/EC of the European Parliament and of the Council with regard to ecodesign requirements for air conditioners and comfort fans, OJ L 72, 10.3.2012, p. 7–27.
EU (2016): Commission Regulation (EU) 2016/2281 of 30 November 2016 implementing Directive 2009/125/EC of the European Parliament and of the Council establishing a framework for the setting of ecodesign requirements for energy-related products, with regard to ecodesign requirements for air heating products, cooling products, high temperature process chillers and fan coil units, OJ L 346, 20.12.2016, p. 1–50.
Fleiter, Tobias; Schlomann, Barbara; Hirzel, Simon; Arens, Marlene; Hassan, Ali; Idrissova, Farikha et al. (Hg.) (2011): Where are the promising energy-efficient technologies? A comprehensive analysis of the German energy-intensive industries: eceee summer study 2011, June 6-11, Presqu’ile de Giens, France.

18
@HeatRoadmapEU www.heatroadmap.eu
Fraunhofer ISI; Fraunhofer ISE; IREES; Observ’ER; TU Wien; TEP Energy (2016): Mapping and analyses of the current and future (2020 - 2030) heating/cooling fuel deployment (fossil/renewables). Karlsruhe, Freiburg, Paris, Wien, Zürich.
Rivière et al. (2008): Preparatory Study on the Environmental Performance of Residential Room Conditioning Appliances (Airco and Ventilation), Armines, Paris, France, 2008.
Werner (2015): Sven Werner, European space cooling demands, Energy, Volume 110, 1 September 2016, Pages 148-156, ISSN 0360-5442.
This project has received funding from the European Union's Horizon 2020 research and innovation programme under grant agreement No. 695989.
www.heatroadmap.eu@HeatRoadmapEU
Profile of heating and cooling demand in 2015
D3.1 - Detailed results annex
This project has received funding from the European Union's Horizon 2020 research and innovation programme under grant agreement No. 695989.
www.heatroadmap.eu@HeatRoadmapEU
Contents
• Overview• Industry sector• Residential sector• Tertiary sector• Cooling• Conclusions

This project has received funding from the European Union's Horizon 2020 research and innovation programme under grant agreement No. 695989.
www.heatroadmap.eu@HeatRoadmapEU
OVERVIEW
This project has received funding from the European Union's Horizon 2020 research and innovation programme under grant agreement No. 695989.
www.heatroadmap.eu@HeatRoadmapEU
Non-H/C50%
Process heating
16%
Space heating27%
Hot water4%
Other heating1%
Process cooling
1%
Space cooling
1%
Heating and cooling
50%
Total final energy demand (FED) in 2015 (EU28)
High relevance: H&C about 50% of FED!
This project has received funding from the European Union's Horizon 2020 research and innovation programme under grant agreement No. 695989.
www.heatroadmap.eu@HeatRoadmapEU
H&C FED by end-use in 2015 (EU28)
2015:
High relevanceof space andprocess heating;
Lower relevanceof cooling
Process heating
32%
Space heating
53%
Hot water8%
Other heating3%
Process cooling
3%
Space cooling1%

This project has received funding from the European Union's Horizon 2020 research and innovation programme under grant agreement No. 695989.
www.heatroadmap.eu@HeatRoadmapEU
0%
10%
20%
30%
40%
50%
60%
70%
80%
90%
100%Space cooling
Process cooling
Other heating
Process heating
Hot water
Space heating
H&C FED by end-use and country (EU28, 2015)
• Space heating and process heatingimportant in all countries
• Cooling importantin southern countries
This project has received funding from the European Union's Horizon 2020 research and innovation programme under grant agreement No. 695989.
www.heatroadmap.eu@HeatRoadmapEU
Share of space heating in total FED for H&C
Space heating isalso relevant in southern countries!
This project has received funding from the European Union's Horizon 2020 research and innovation programme under grant agreement No. 695989.
www.heatroadmap.eu@HeatRoadmapEU
H&C FED by energy carrier in 2015 (EU28)
2015 shares FED:
• Fossil: 66%
• RES: 13%
• El+DH: 21%42%
12%
12%
12%
9%
8%
4%
1%0%
0% Gas
Oil
Biomass
Electricity
District heating
Coal
Others (fossil)
Solar thermal
Heat pumps
Others (RES)
This project has received funding from the European Union's Horizon 2020 research and innovation programme under grant agreement No. 695989.
www.heatroadmap.eu@HeatRoadmapEU
0
200
400
600
800
1000
1200
1400
1600
0%
10%
20%
30%
40%
50%
60%
70%
80%
90%
100%
Ge
rma
nyF
ran
ceIt
aly
Uni
ted
…P
ola
nd
Sp
ain
Net
herl
and
sB
elg
ium
Sw
ede
nF
inla
nd
Au
stri
aR
oma
nia
Cze
ch R
epu
blic
Hun
gar
yG
ree
ceS
lova
k…P
ort
uga
lD
enm
ark
Ire
lan
dB
ulg
aria
Cro
atia
Lith
ua
nia
Lat
via
Slo
ven
iaE
sto
nia
Lux
em
bou
rgC
ypru
sM
alta
To
tal
fin
al
en
erg
y [T
Wh
]
Others (RES)
Solar thermal
Heat pumps
Biomass
Electricity
District heating
Others (fossil)
Oil
Coal
Gas
Total
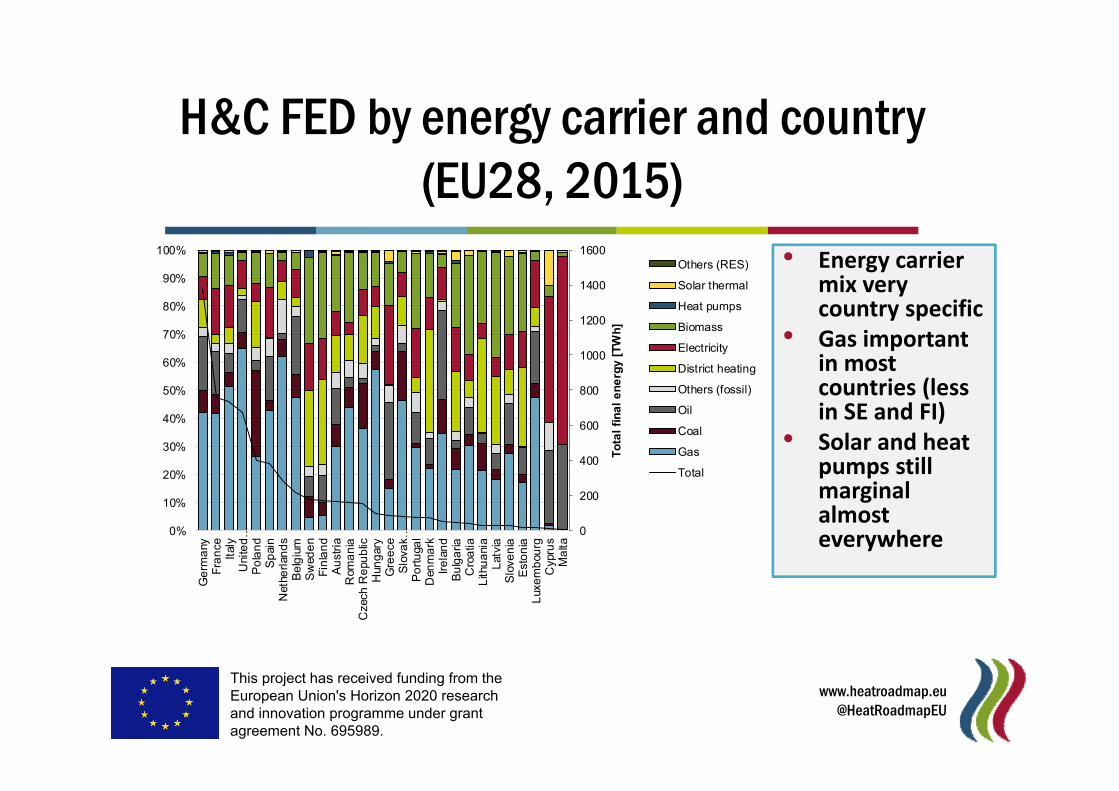
H&C FED by energy carrier and country(EU28, 2015)
• Energy carriermix verycountry specific
• Gas importantin mostcountries (lessin SE and FI)
• Solar and heatpumps still marginal almosteverywhere
This project has received funding from the European Union's Horizon 2020 research and innovation programme under grant agreement No. 695989.
www.heatroadmap.eu@HeatRoadmapEU
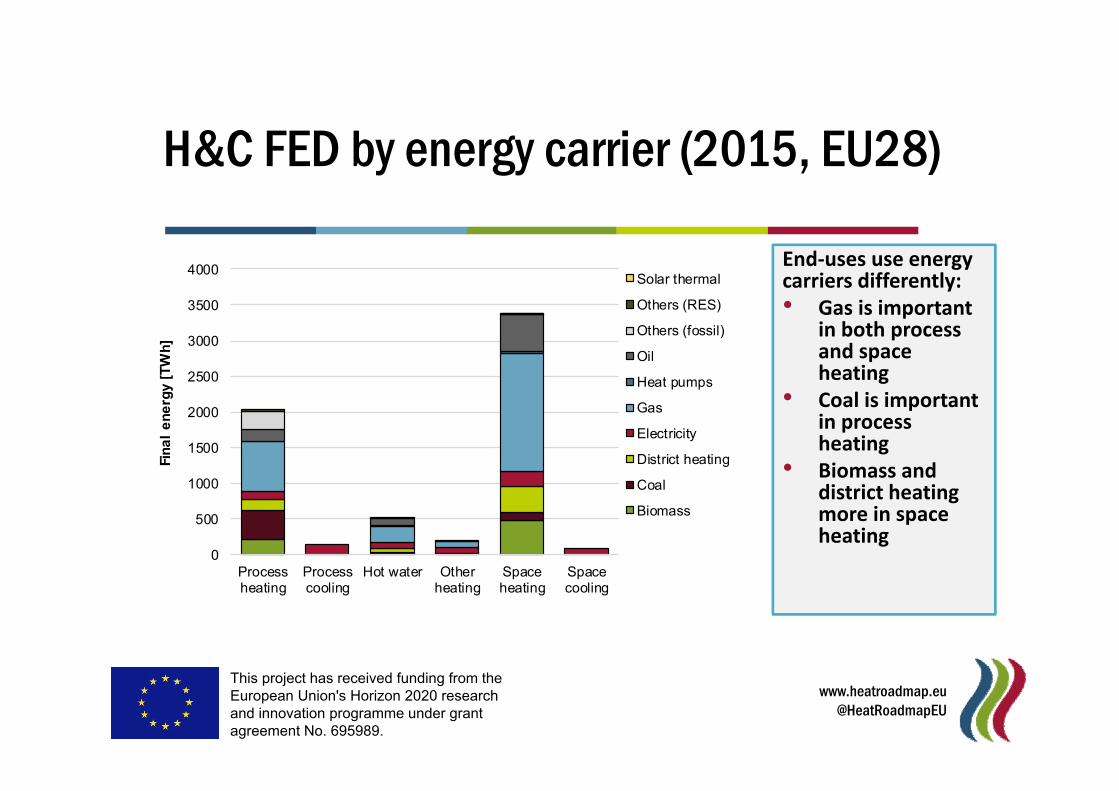
H&C FED by energy carrier (2015, EU28)
0
500
1000
1500
2000
2500
3000
3500
4000
Processheating
Processcooling
Hot water Otherheating
Spaceheating
Spacecooling
Fin
al
en
erg
y [T
Wh
]
Solar thermal
Others (RES)
Others (fossil)
Oil
Heat pumps
Gas
Electricity
District heating
Coal
Biomass
End‐uses use energycarriers differently:• Gas is important
in both processand spaceheating
• Coal is importantin processheating
• Biomass anddistrict heatingmore in spaceheating
This project has received funding from the European Union's Horizon 2020 research and innovation programme under grant agreement No. 695989.
www.heatroadmap.eu@HeatRoadmapEU
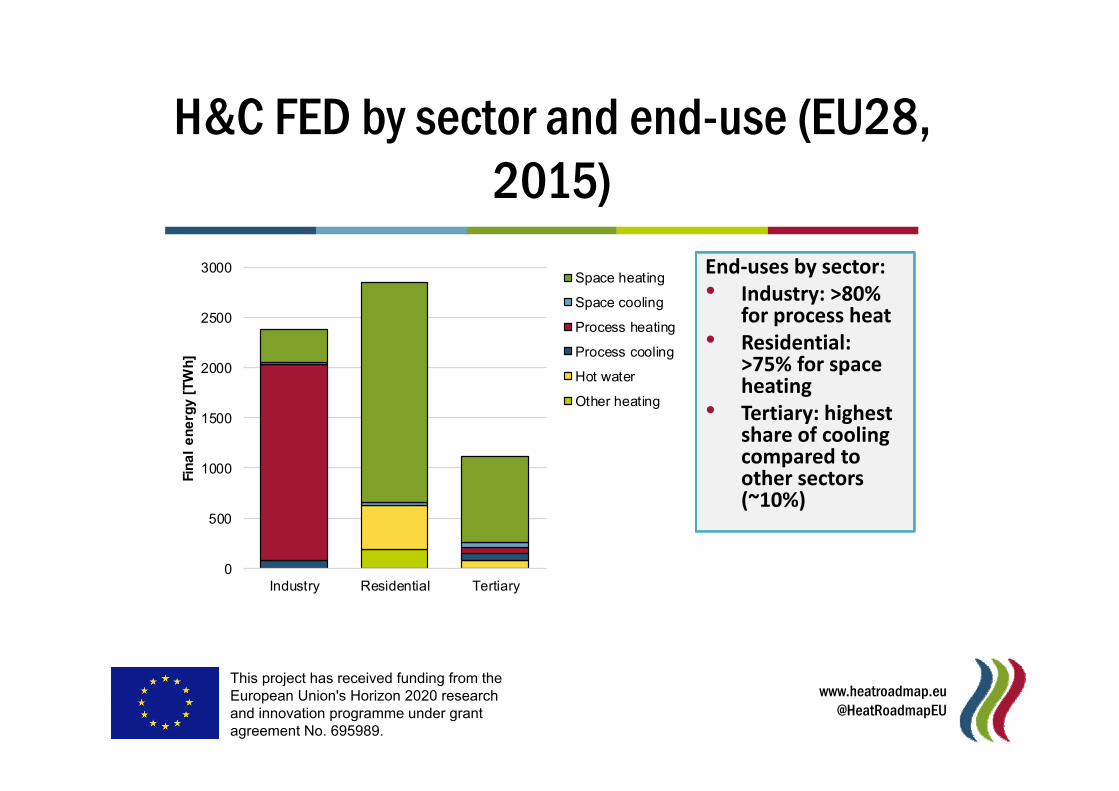
H&C FED by sector and end-use (EU28, 2015)
End‐uses by sector:• Industry: >80%
for process heat• Residential:
>75% for spaceheating
• Tertiary: highestshare of coolingcompared toother sectors(~10%)
0
500
1000
1500
2000
2500
3000
Industry Residential Tertiary
Fin
al
en
erg
y [T
Wh
]
Space heating
Space cooling
Process heating
Process cooling
Hot water
Other heating
This project has received funding from the European Union's Horizon 2020 research and innovation programme under grant agreement No. 695989.
www.heatroadmap.eu@HeatRoadmapEU
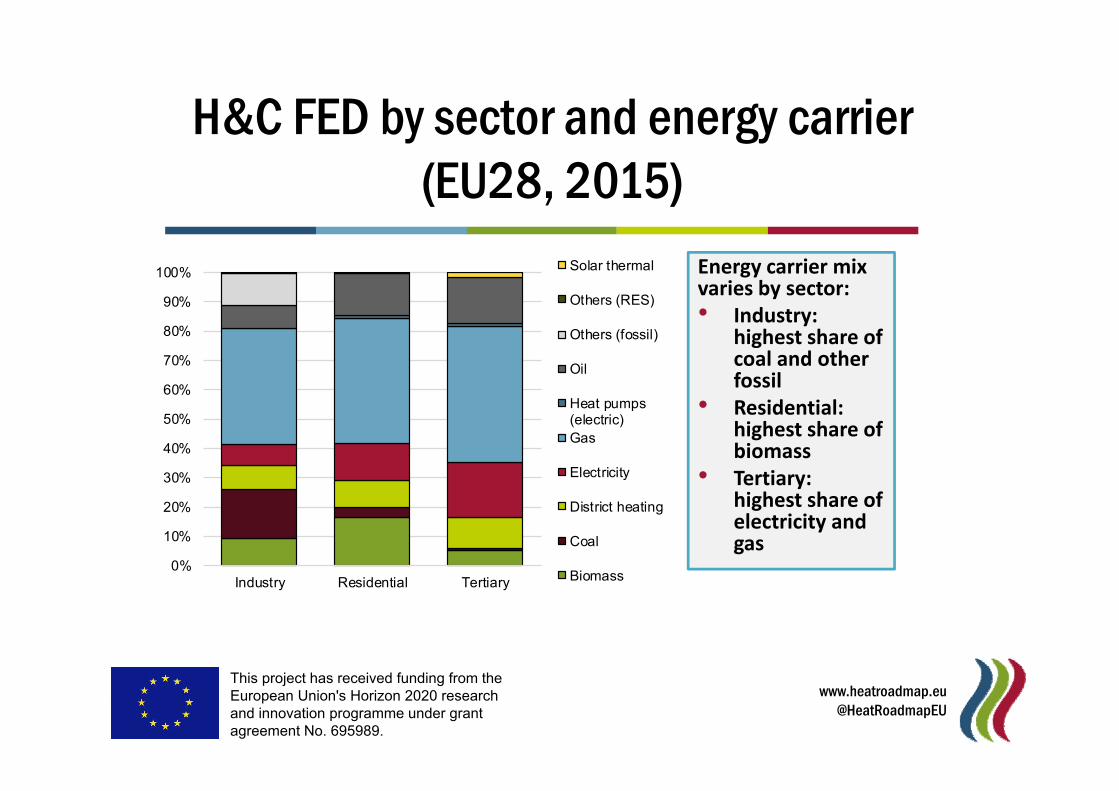
H&C FED by sector and energy carrier(EU28, 2015)
0%
10%
20%
30%
40%
50%
60%
70%
80%
90%
100%
Industry Residential Tertiary
Solar thermal
Others (RES)
Others (fossil)
Oil
Heat pumps(electric)Gas
Electricity
District heating
Coal
Biomass
Energy carrier mix varies by sector:• Industry:
highest share ofcoal and otherfossil
• Residential: highest share ofbiomass
• Tertiary: highest share ofelectricity andgas
This project has received funding from the European Union's Horizon 2020 research and innovation programme under grant agreement No. 695989.
www.heatroadmap.eu@HeatRoadmapEU
INDUSTRY SECTOR
This project has received funding from the European Union's Horizon 2020 research and innovation programme under grant agreement No. 695989.
www.heatroadmap.eu@HeatRoadmapEU
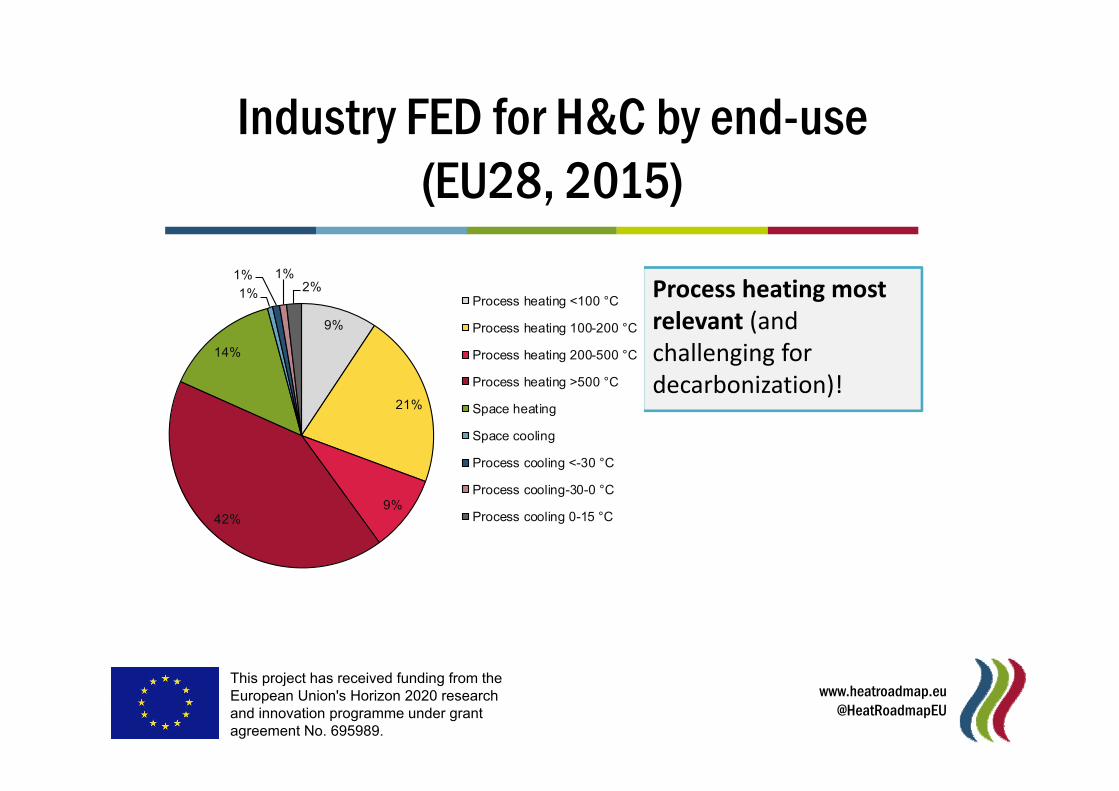
Industry FED for H&C by end-use(EU28, 2015)
Process heating mostrelevant (andchallenging fordecarbonization)!
9%
21%
9%42%
14%
1%
1% 1%2%
Process heating <100 °C
Process heating 100-200 °C
Process heating 200-500 °C
Process heating >500 °C
Space heating
Space cooling
Process cooling <-30 °C
Process cooling-30-0 °C
Process cooling 0-15 °C
This project has received funding from the European Union's Horizon 2020 research and innovation programme under grant agreement No. 695989.
www.heatroadmap.eu@HeatRoadmapEU
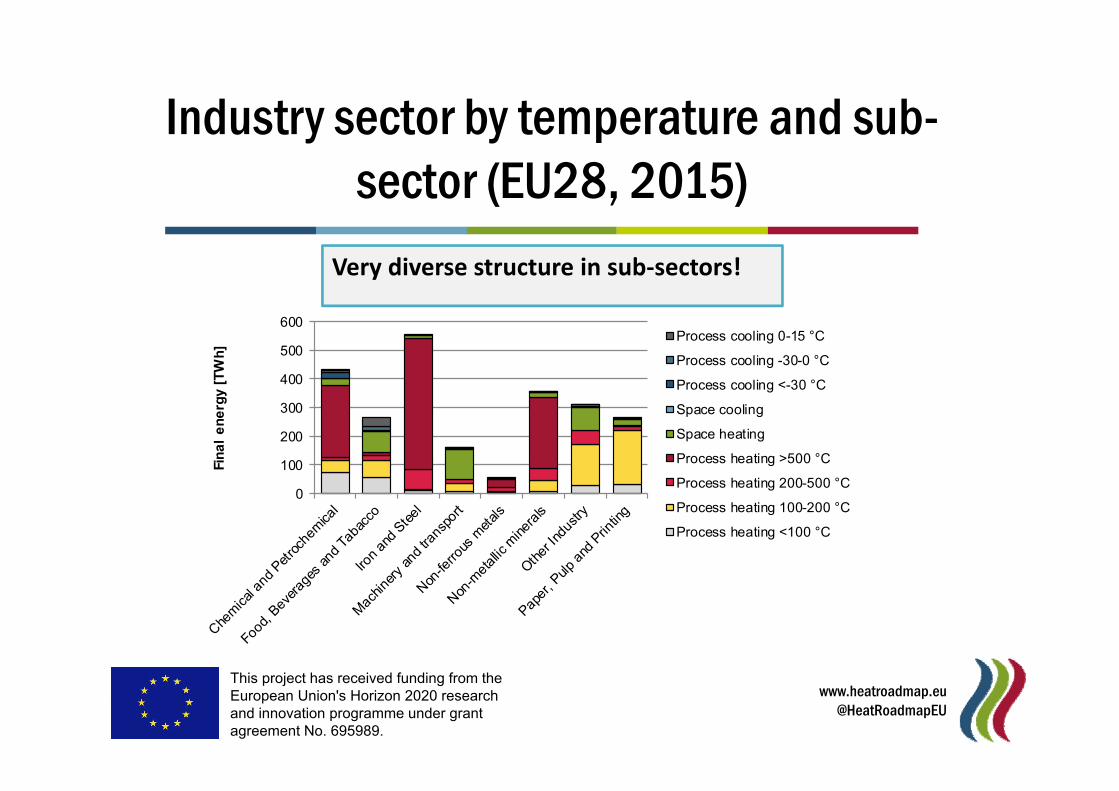
Industry sector by temperature and sub-sector (EU28, 2015)
Very diverse structure in sub‐sectors!
0
100
200
300
400
500
600
Fin
al
en
erg
y [T
Wh
]
Process cooling 0-15 °C
Process cooling -30-0 °C
Process cooling <-30 °C
Space cooling
Space heating
Process heating >500 °C
Process heating 200-500 °C
Process heating 100-200 °C
Process heating <100 °C
This project has received funding from the European Union's Horizon 2020 research and innovation programme under grant agreement No. 695989.
www.heatroadmap.eu@HeatRoadmapEU
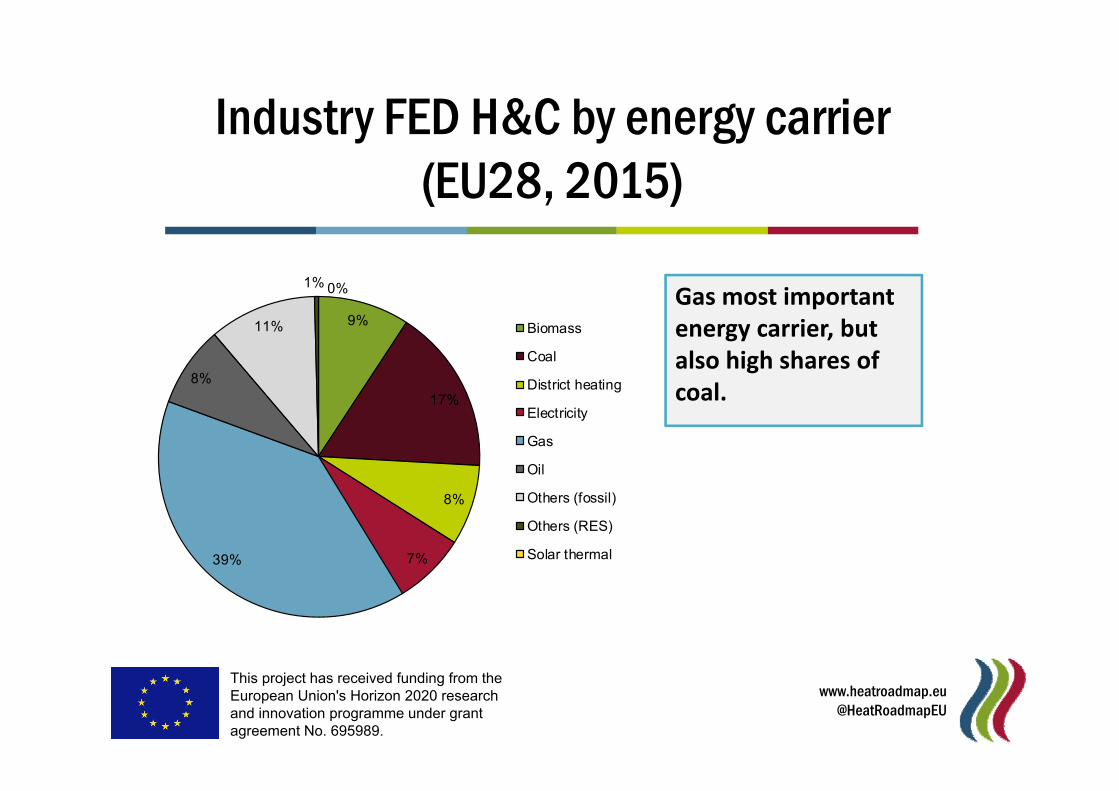
Industry FED H&C by energy carrier(EU28, 2015)
9%
17%
8%
7%39%
8%
11%
1% 0%
Biomass
Coal
District heating
Electricity
Gas
Oil
Others (fossil)
Others (RES)
Solar thermal
Gas most importantenergy carrier, butalso high shares ofcoal.
This project has received funding from the European Union's Horizon 2020 research and innovation programme under grant agreement No. 695989.
www.heatroadmap.eu@HeatRoadmapEU
0
100
200
300
400
500
600
Fin
al E
ne
rgy
[TW
h]
Achsentitel
Solar thermal
Others (RES)
Others (fossil)
Oil
Gas
Electricity
District heating
Coal
Biomass
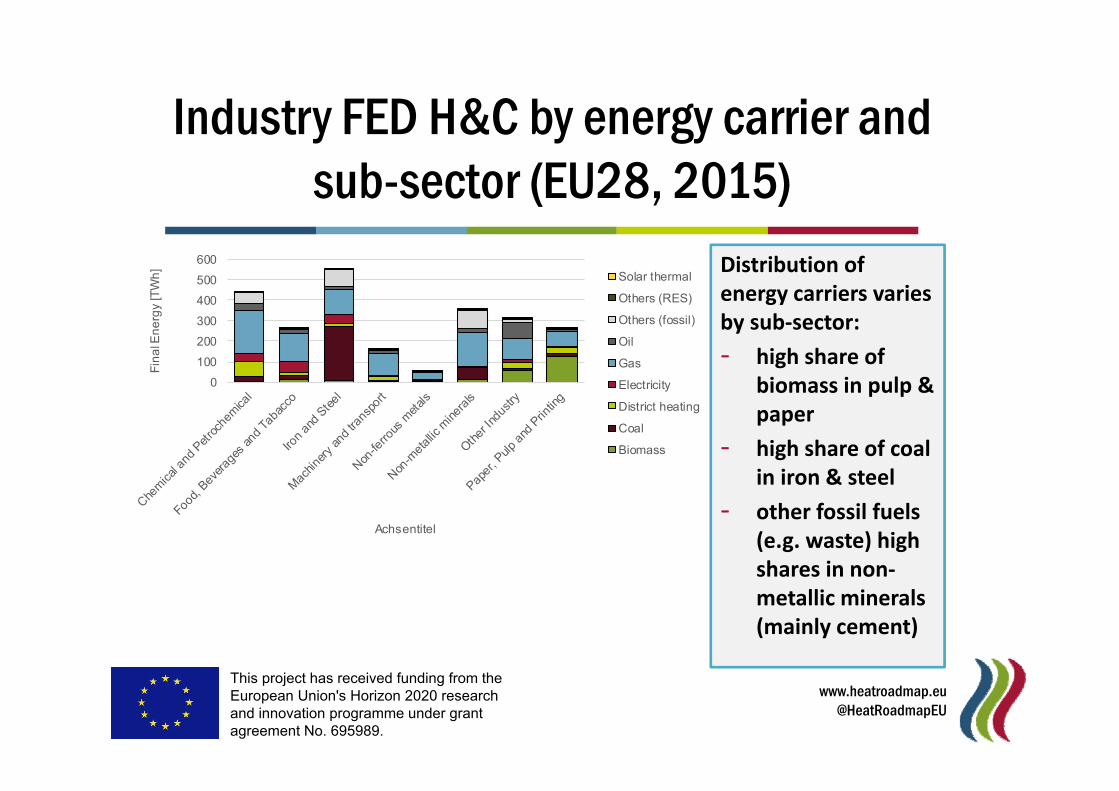
Industry FED H&C by energy carrier andsub-sector (EU28, 2015)
Distribution ofenergy carriers variesby sub‐sector:
‐ high share ofbiomass in pulp & paper
‐ high share of coalin iron & steel
‐ other fossil fuels(e.g. waste) high shares in non‐metallic minerals(mainly cement)
This project has received funding from the European Union's Horizon 2020 research and innovation programme under grant agreement No. 695989.
www.heatroadmap.eu@HeatRoadmapEU
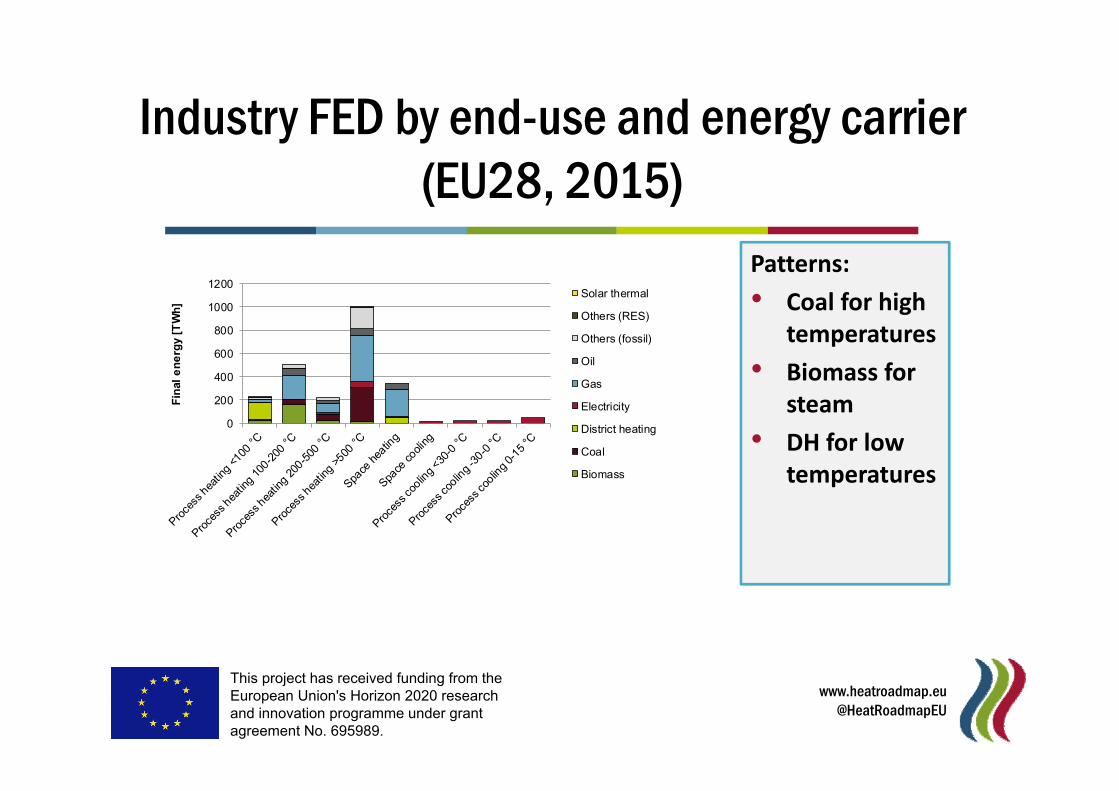
Industry FED by end-use and energy carrier(EU28, 2015)
Patterns:
• Coal for hightemperatures
• Biomass forsteam
• DH for lowtemperatures
0
200
400
600
800
1000
1200
Fin
al e
ne
rgy
[TW
h]
Solar thermal
Others (RES)
Others (fossil)
Oil
Gas
Electricity
District heating
Coal
Biomass
This project has received funding from the European Union's Horizon 2020 research and innovation programme under grant agreement No. 695989.
www.heatroadmap.eu@HeatRoadmapEU
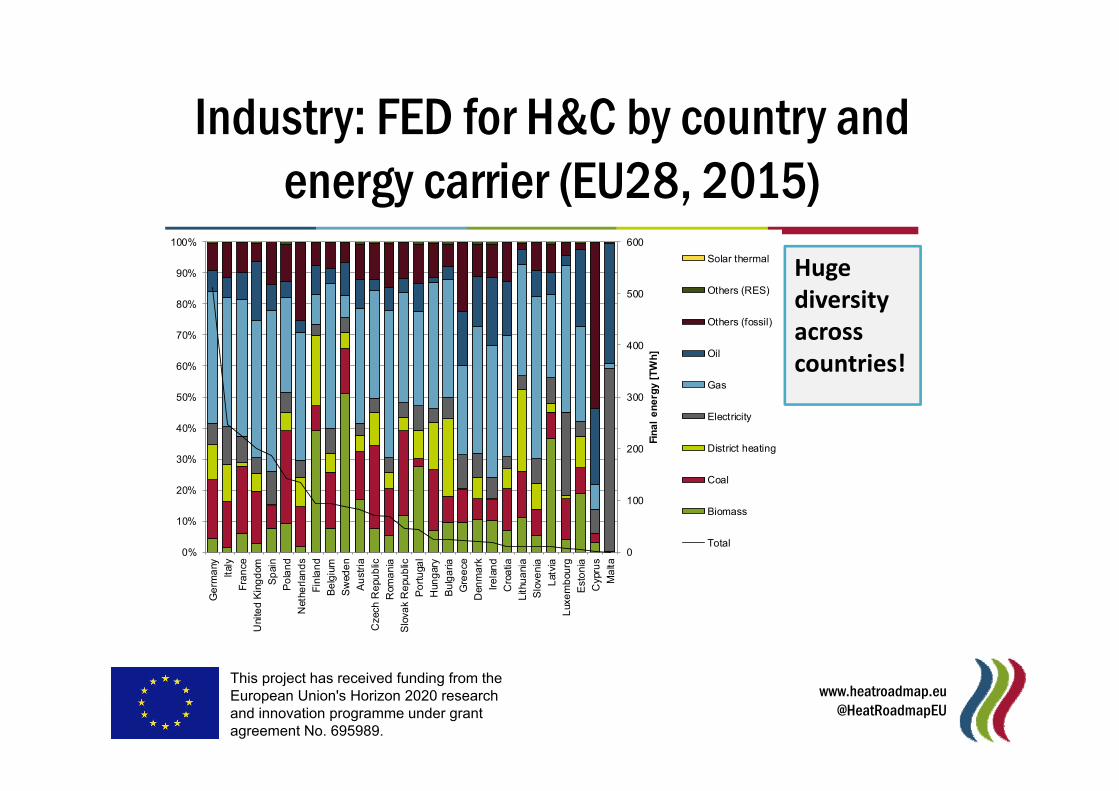
Industry: FED for H&C by country and energy carrier (EU28, 2015)
Hugediversityacrosscountries!
0
100
200
300
400
500
600
0%
10%
20%
30%
40%
50%
60%
70%
80%
90%
100%
Ge
rma
ny
Ital
y
Fra
nce
Uni
ted
Kin
gd
om
Sp
ain
Po
lan
d
Net
herl
and
s
Fin
lan
d
Be
lgiu
m
Sw
ede
n
Au
stri
a
Cze
ch R
epu
blic
Rom
an
ia
Slo
vak
Re
pub
lic
Po
rtu
gal
Hun
gar
y
Bu
lga
ria
Gre
ece
Den
ma
rk
Ire
lan
d
Cro
atia
Lith
ua
nia
Slo
ven
ia
Lat
via
Lux
em
bou
rg
Est
on
ia
Cyp
rus
Ma
lta
Fin
al
en
erg
y [T
Wh
]
Solar thermal
Others (RES)
Others (fossil)
Oil
Gas
Electricity
District heating
Coal
Biomass
Total
This project has received funding from the European Union's Horizon 2020 research and innovation programme under grant agreement No. 695989.
www.heatroadmap.eu@HeatRoadmapEU
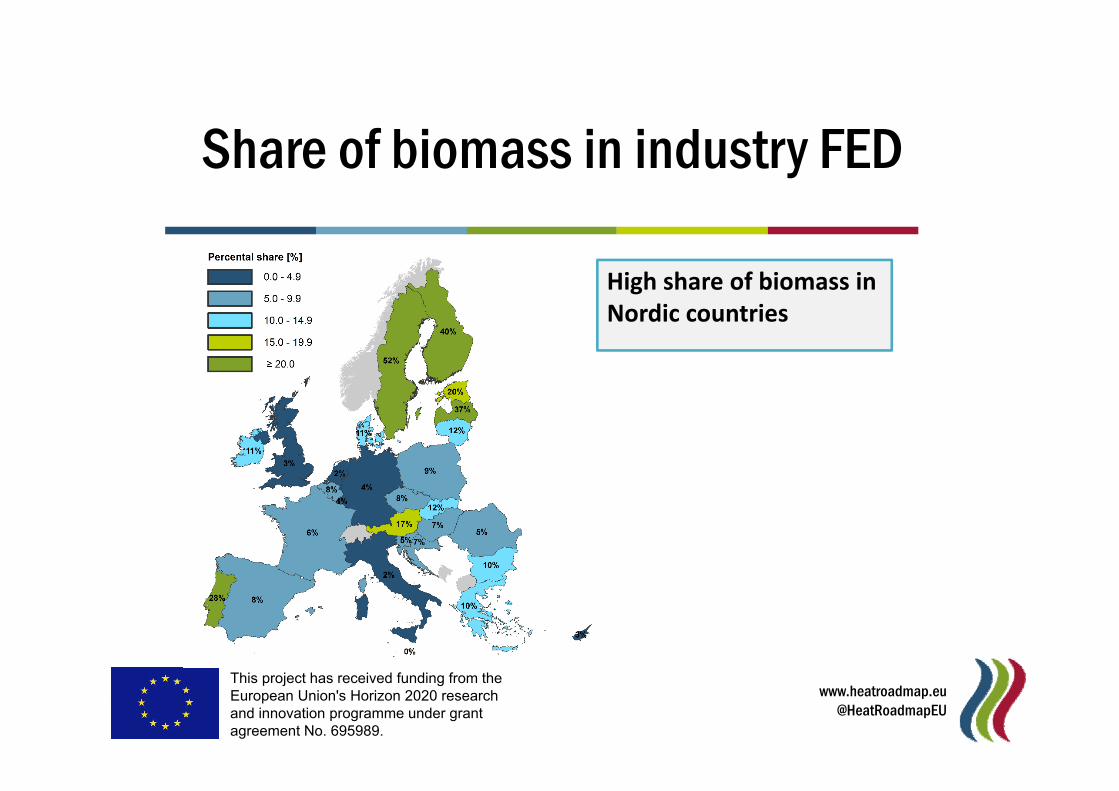
Share of biomass in industry FED
High share of biomass in Nordic countries
This project has received funding from the European Union's Horizon 2020 research and innovation programme under grant agreement No. 695989.
www.heatroadmap.eu@HeatRoadmapEU
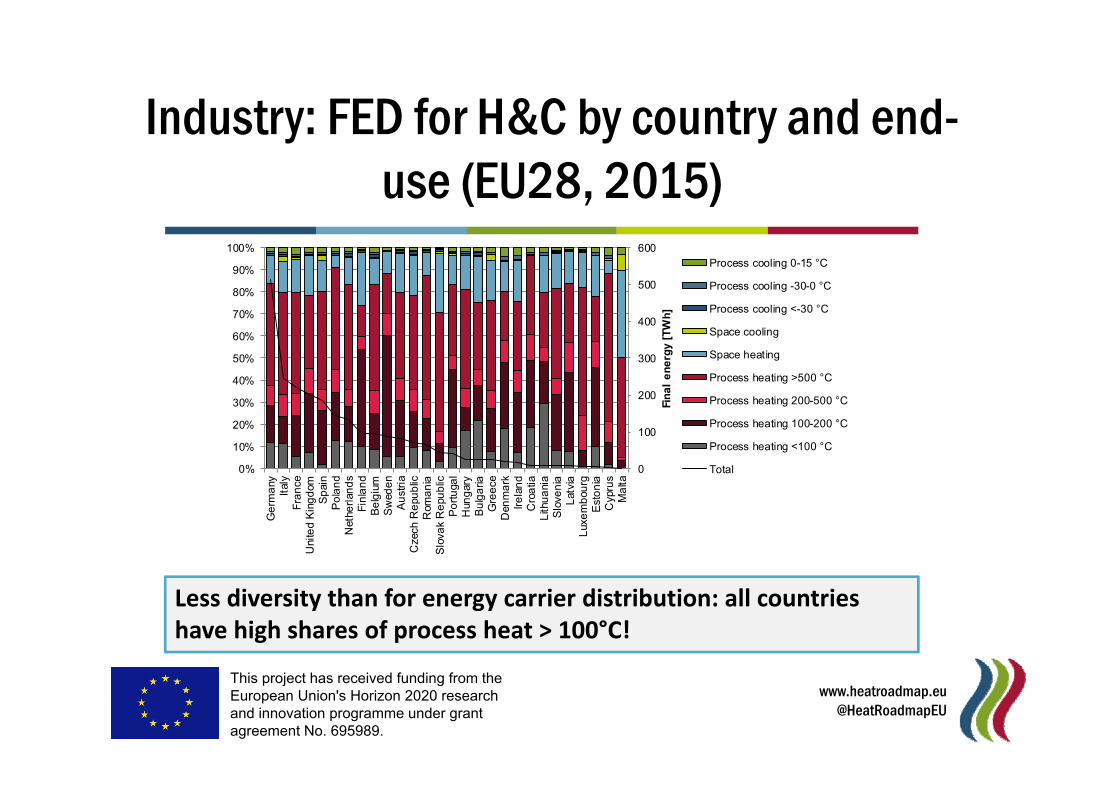
Industry: FED for H&C by country and end-use (EU28, 2015)
Less diversity than for energy carrier distribution: all countries have high shares of process heat > 100°C!
0
100
200
300
400
500
600
0%
10%
20%
30%
40%
50%
60%
70%
80%
90%
100%
Ge
rma
nyIt
aly
Fra
nce
Uni
ted
Kin
gd
omS
pai
nP
ola
nd
Net
herl
and
sF
inla
nd
Be
lgiu
mS
wed
en
Au
stri
aC
zech
Re
pub
licR
oma
nia
Slo
vak
Re
pub
licP
ort
uga
lH
ung
ary
Bu
lga
riaG
ree
ceD
enm
ark
Ire
lan
dC
roa
tiaL
ithu
ani
aS
love
nia
Lat
via
Lux
em
bou
rgE
sto
nia
Cyp
rus
Ma
lta
Fin
al
en
erg
y [T
Wh
]
Process cooling 0-15 °C
Process cooling -30-0 °C
Process cooling <-30 °C
Space cooling
Space heating
Process heating >500 °C
Process heating 200-500 °C
Process heating 100-200 °C
Process heating <100 °C
Total
This project has received funding from the European Union's Horizon 2020 research and innovation programme under grant agreement No. 695989.
www.heatroadmap.eu@HeatRoadmapEU
0
20
40
60
80
100
120
Fin
al
en
erg
y [T
Wh
]
SolarthermalOthers(RES)Others(fossil)Oil
Gas
Electricity
DistrictheatingCoal
Biomass
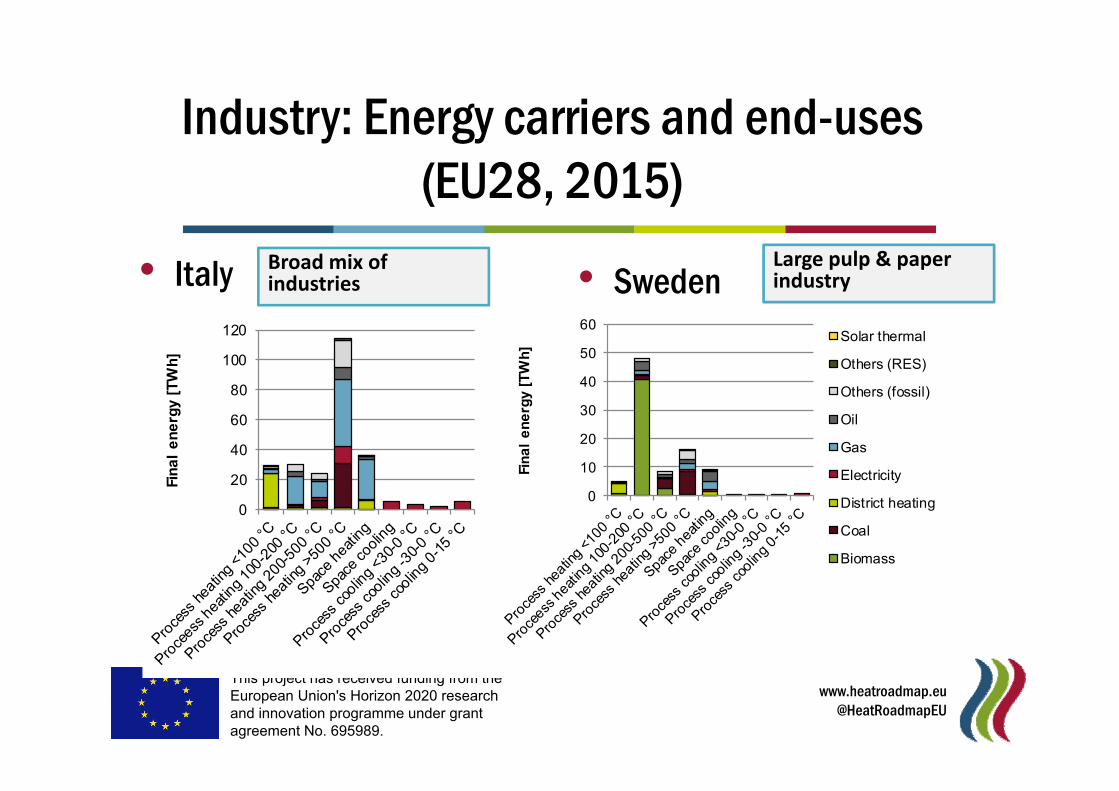
Industry: Energy carriers and end-uses(EU28, 2015)
• Italy • SwedenLarge pulp & paperindustry
Broad mix ofindustries
0
10
20
30
40
50
60
Fin
al
en
erg
y [T
Wh
]
Solar thermal
Others (RES)
Others (fossil)
Oil
Gas
Electricity
District heating
Coal
Biomass
This project has received funding from the European Union's Horizon 2020 research and innovation programme under grant agreement No. 695989.
www.heatroadmap.eu@HeatRoadmapEU
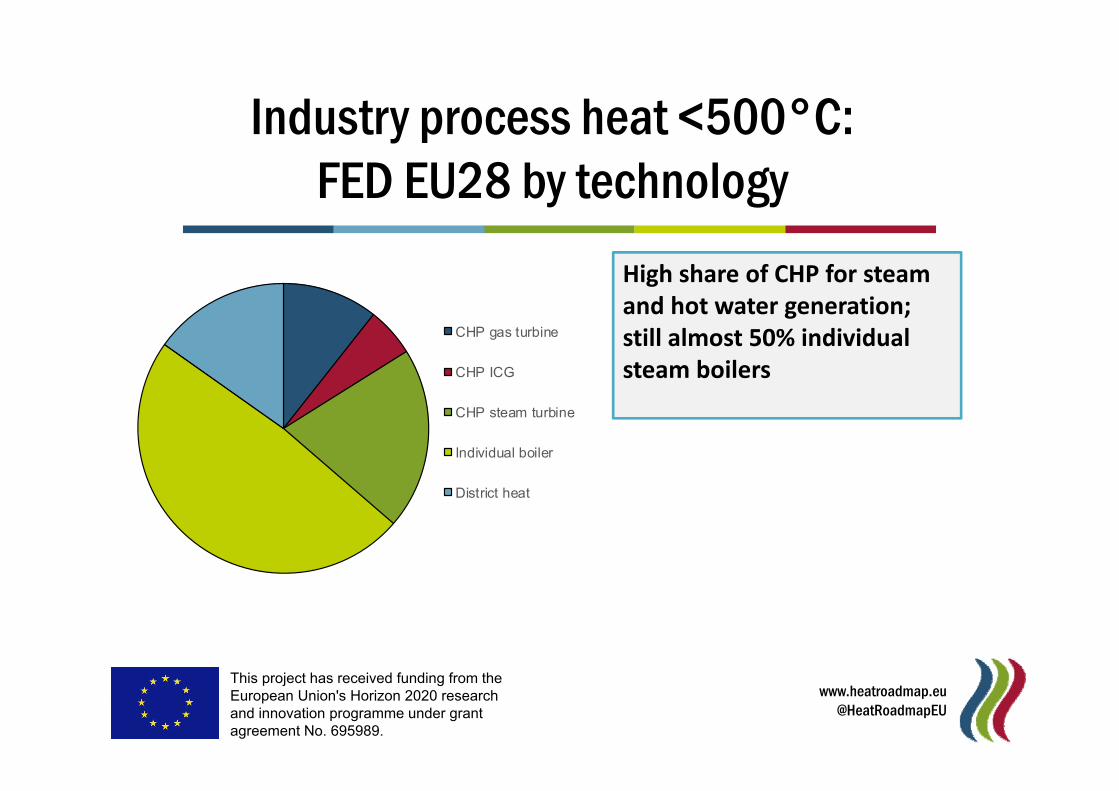
Industry process heat <500°C:FED EU28 by technology
High share of CHP for steamand hot water generation; still almost 50% individual steam boilers
CHP gas turbine
CHP ICG
CHP steam turbine
Individual boiler
District heat
This project has received funding from the European Union's Horizon 2020 research and innovation programme under grant agreement No. 695989.
www.heatroadmap.eu@HeatRoadmapEU
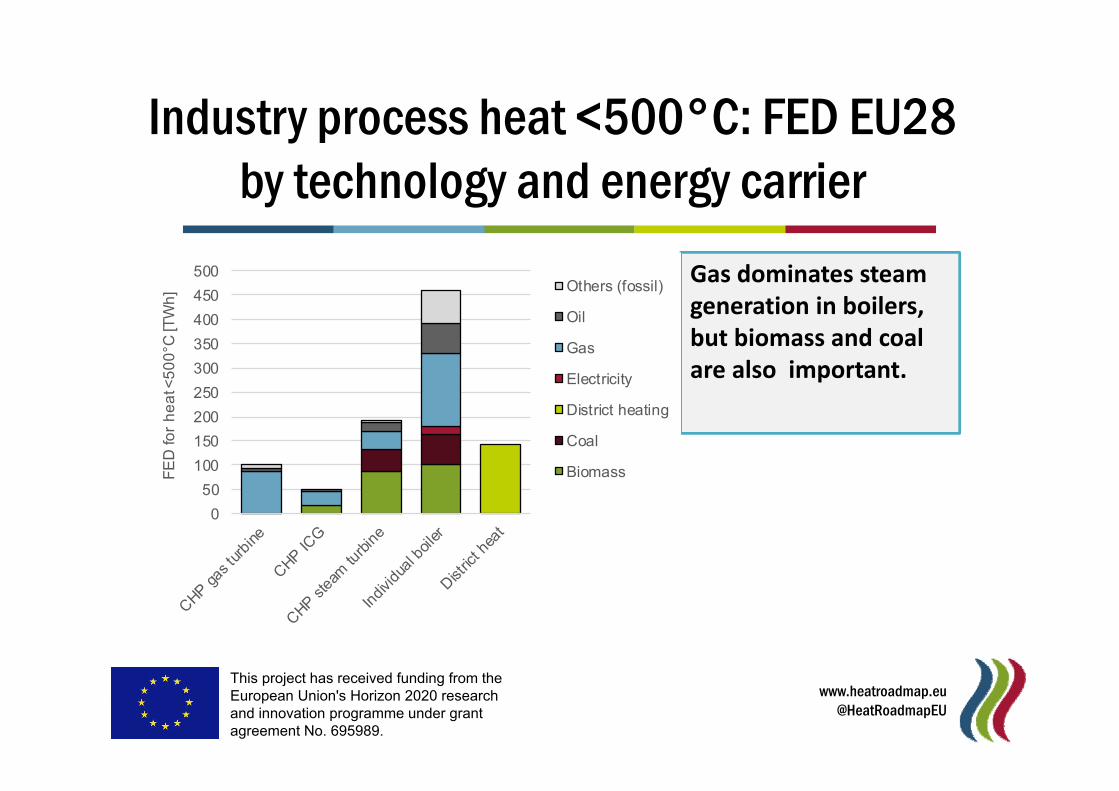
Industry process heat <500°C: FED EU28 by technology and energy carrier
Gas dominates steamgeneration in boilers,but biomass and coalare also important.
0
50
100
150
200
250
300
350
400
450
500
FE
D fo
r h
ea
t <5
00
°C [T
Wh
] Others (fossil)
Oil
Gas
Electricity
District heating
Coal
Biomass
This project has received funding from the European Union's Horizon 2020 research and innovation programme under grant agreement No. 695989.
www.heatroadmap.eu@HeatRoadmapEU
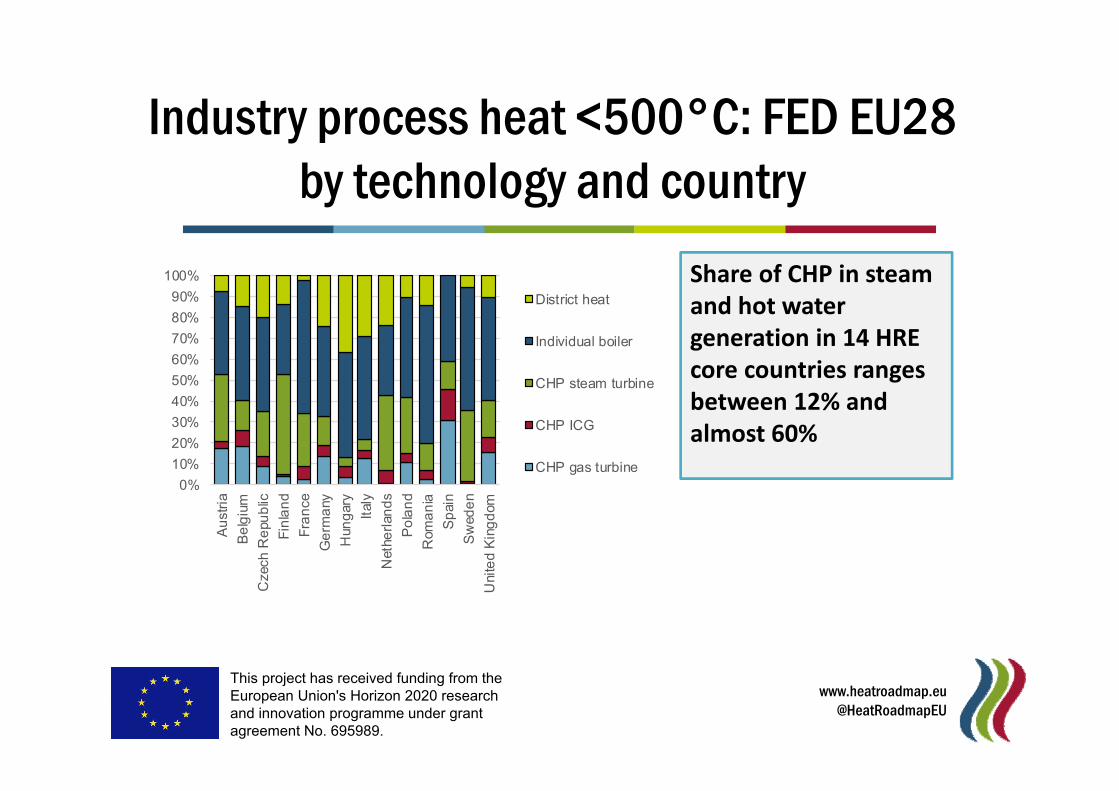
Industry process heat <500°C: FED EU28 by technology and country
Share of CHP in steamand hot watergeneration in 14 HRE core countries rangesbetween 12% andalmost 60%
0%
10%
20%
30%
40%
50%
60%
70%
80%
90%
100%
Au
stri
a
Be
lgiu
m
Cze
ch R
epu
blic
Fin
lan
d
Fra
nce
Ge
rma
ny
Hun
gar
y
Ital
y
Net
herl
and
s
Po
lan
d
Rom
an
ia
Sp
ain
Sw
ede
n
Uni
ted
Kin
gd
om
District heat
Individual boiler
CHP steam turbine
CHP ICG
CHP gas turbine
This project has received funding from the European Union's Horizon 2020 research and innovation programme under grant agreement No. 695989.
www.heatroadmap.eu@HeatRoadmapEU
RESIDENTIAL SECTOR
This project has received funding from the European Union's Horizon 2020 research and innovation programme under grant agreement No. 695989.
www.heatroadmap.eu@HeatRoadmapEU
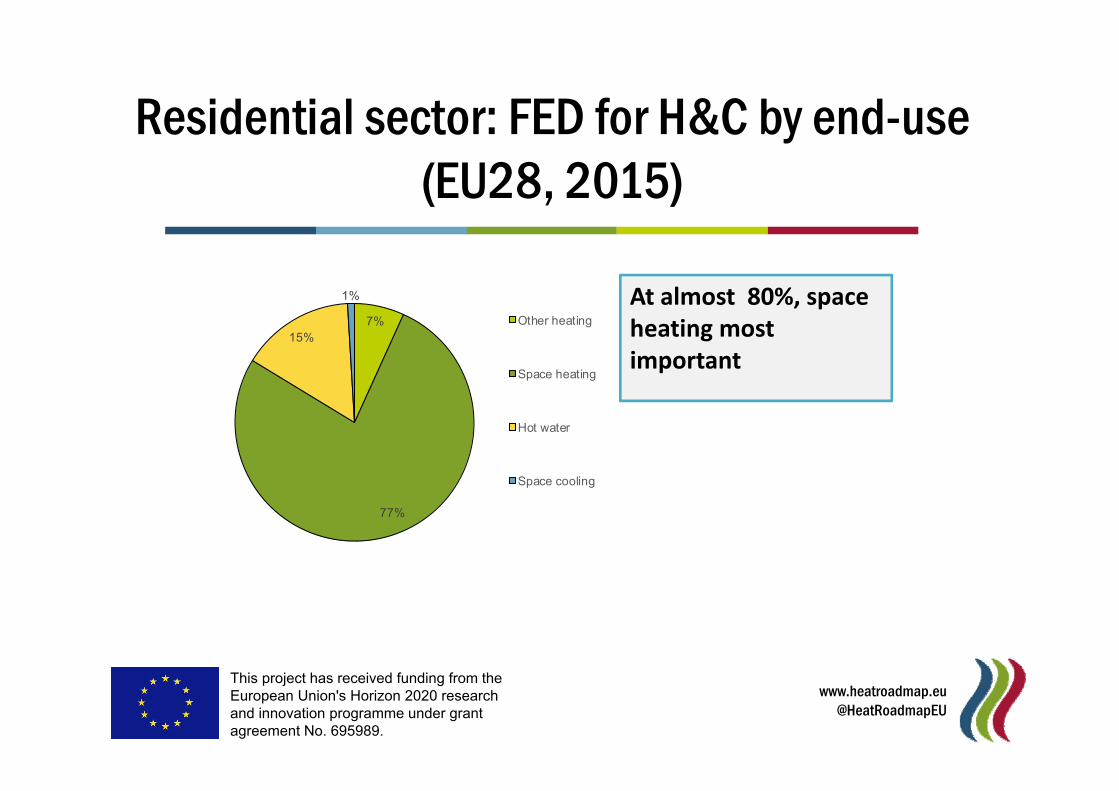
Residential sector: FED for H&C by end-use(EU28, 2015)
7%
77%
15%
1%
Other heating
Space heating
Hot water
Space cooling
At almost 80%, spaceheating mostimportant
This project has received funding from the European Union's Horizon 2020 research and innovation programme under grant agreement No. 695989.
www.heatroadmap.eu@HeatRoadmapEU
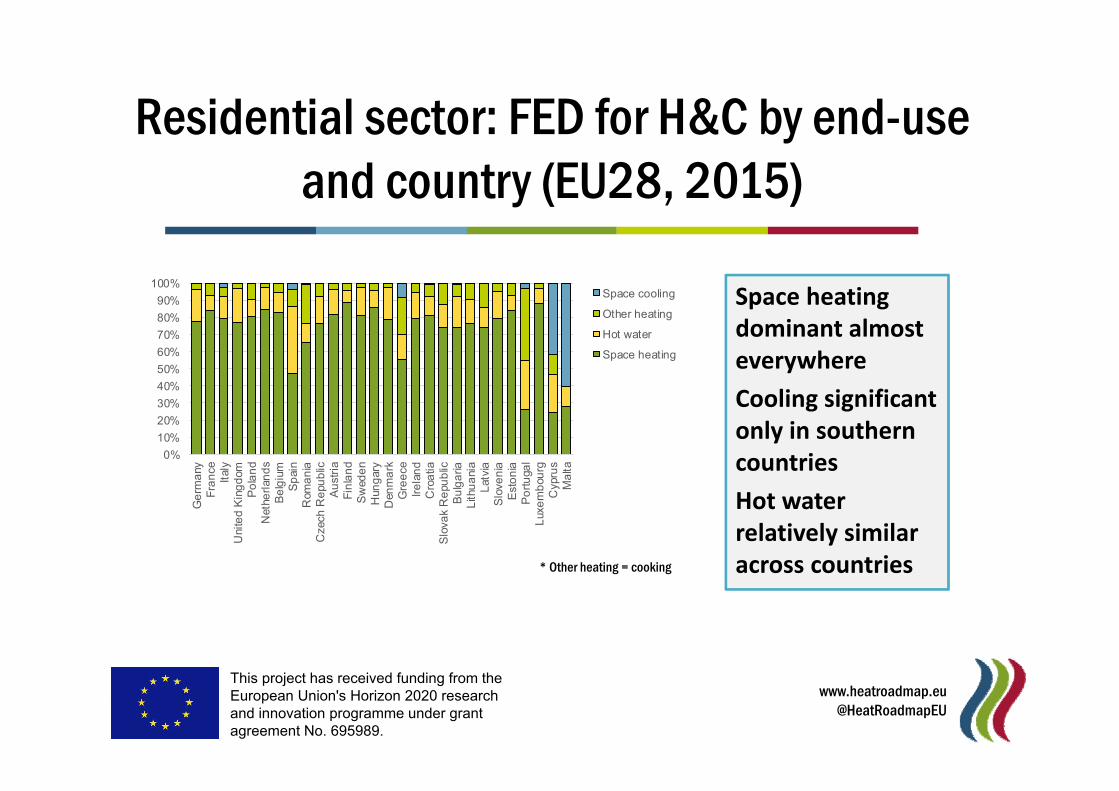
Residential sector: FED for H&C by end-useand country (EU28, 2015)
0%
10%
20%
30%
40%
50%
60%
70%
80%
90%
100%
Ge
rma
nyF
ran
ceIt
aly
Uni
ted
Kin
gd
omP
ola
nd
Net
herl
and
sB
elg
ium
Sp
ain
Rom
an
iaC
zech
Re
pub
licA
ust
ria
Fin
lan
dS
wed
en
Hun
gar
yD
enm
ark
Gre
ece
Ire
lan
dC
roa
tiaS
lova
k R
epu
blic
Bu
lga
riaL
ithu
ani
aL
atvi
aS
love
nia
Est
on
iaP
ort
uga
lL
uxe
mb
ourg
Cyp
rus
Ma
lta
Space cooling
Other heating
Hot water
Space heating
Space heatingdominant almosteverywhere
Cooling significantonly in southern countries
Hot waterrelatively similaracross countries* Other heating = cooking
This project has received funding from the European Union's Horizon 2020 research and innovation programme under grant agreement No. 695989.
www.heatroadmap.eu@HeatRoadmapEU
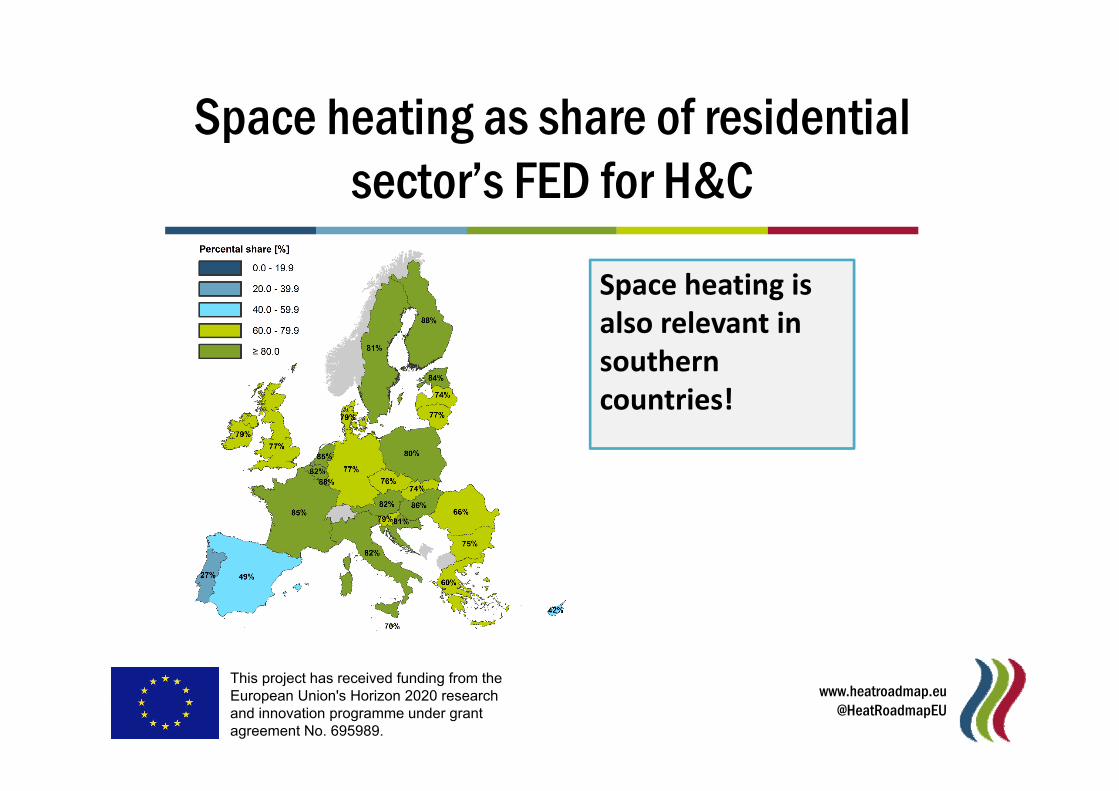
Space heating as share of residentialsector’s FED for H&C
Space heating isalso relevant in southern countries!
This project has received funding from the European Union's Horizon 2020 research and innovation programme under grant agreement No. 695989.
www.heatroadmap.eu@HeatRoadmapEU
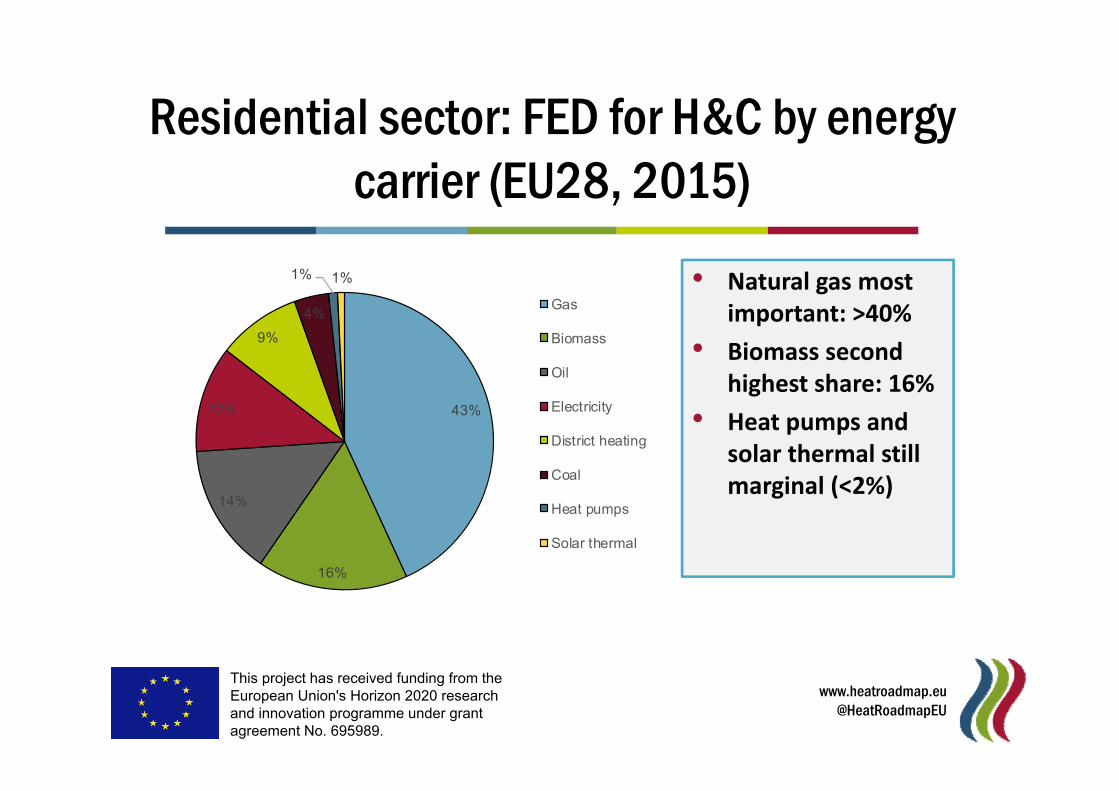
Residential sector: FED for H&C by energycarrier (EU28, 2015)
43%
16%
14%
12%
9%
4%
1% 1%
Gas
Biomass
Oil
Electricity
District heating
Coal
Heat pumps
Solar thermal
• Natural gas mostimportant: >40%
• Biomass secondhighest share: 16%
• Heat pumps andsolar thermal still marginal (<2%)
This project has received funding from the European Union's Horizon 2020 research and innovation programme under grant agreement No. 695989.
www.heatroadmap.eu@HeatRoadmapEU
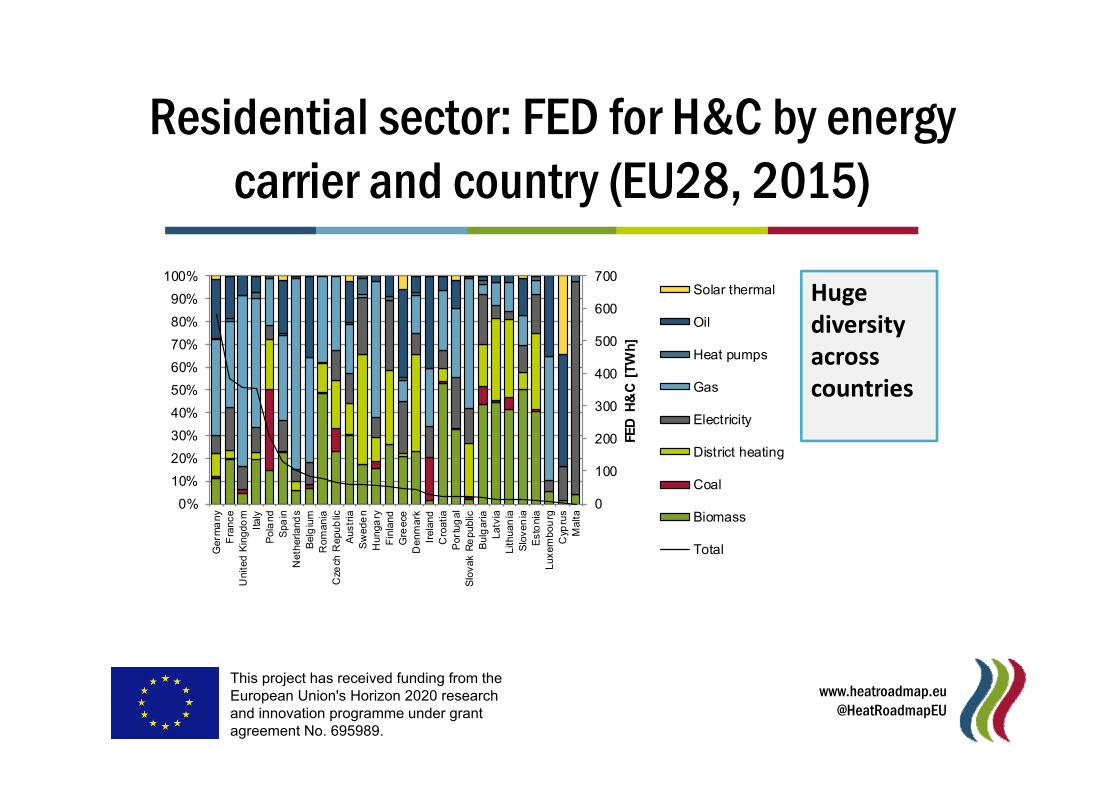
Residential sector: FED for H&C by energycarrier and country (EU28, 2015)
0
100
200
300
400
500
600
700
0%
10%
20%
30%
40%
50%
60%
70%
80%
90%
100%
Ger
ma
ny
Fra
nce
Uni
ted
Kin
gdo
mIta
lyP
ola
nd
Spa
inN
eth
erla
nds
Bel
giu
mR
om
ani
aC
zech
Re
pub
licA
ustr
iaS
wed
en
Hun
gary
Fin
lan
dG
ree
ceD
enm
ark
Irel
and
Cro
atia
Por
tug
alS
lov
ak R
ep
ublic
Bu
lga
riaL
atvi
aLi
thua
nia
Slo
ven
iaE
sto
nia
Lux
embo
urg
Cyp
rus
Ma
lta
FED
H&
C [
TW
h]
Solar thermal
Oil
Heat pumps
Gas
Electricity
District heating
Coal
Biomass
Total
Hugediversityacrosscountries
This project has received funding from the European Union's Horizon 2020 research and innovation programme under grant agreement No. 695989.
www.heatroadmap.eu@HeatRoadmapEU
0
200
400
600
800
1000
1200
1400
1600
Otherheating
Spacecooling
Hot waterSFH
Spaceheating
SFH
Hot waterMFH
Spaceheating
MFH
Fin
al
en
erg
y [T
Wh
] Solar thermal
Oil
Heat pumps
Gas
Electricity
District heating
Coal
Biomass
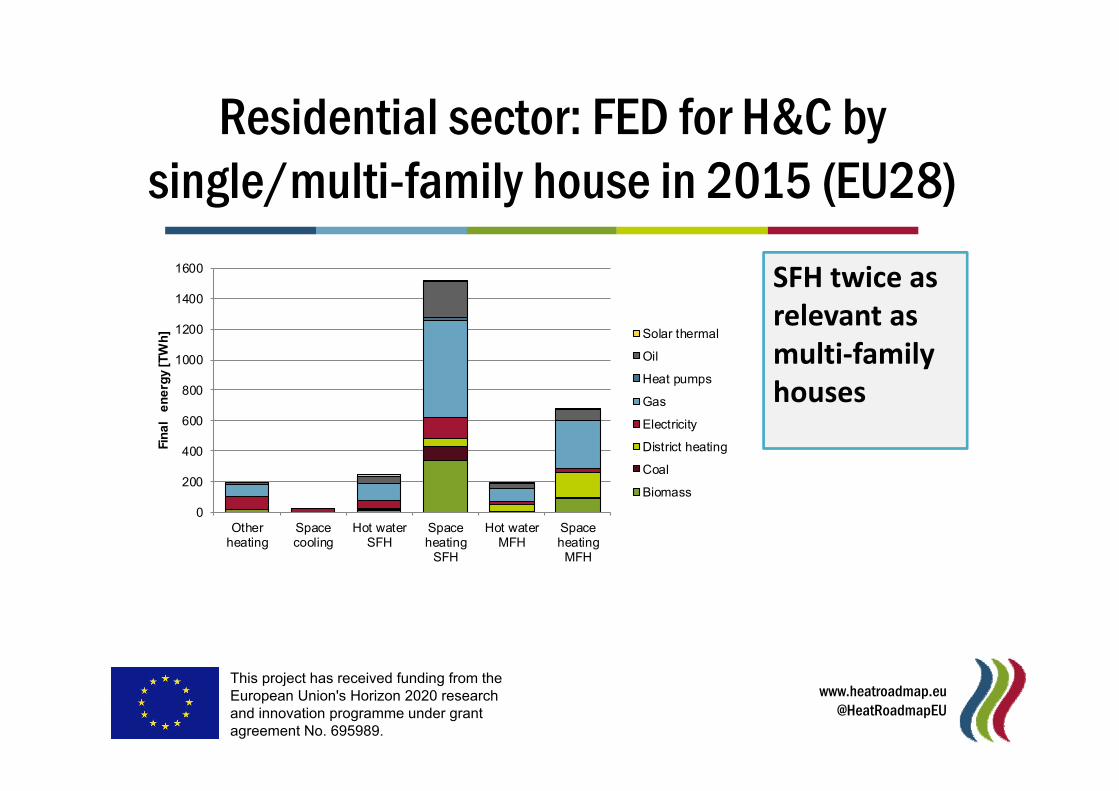
Residential sector: FED for H&C bysingle/multi-family house in 2015 (EU28)
SFH twice as relevant as multi‐family houses
This project has received funding from the European Union's Horizon 2020 research and innovation programme under grant agreement No. 695989.
www.heatroadmap.eu@HeatRoadmapEU
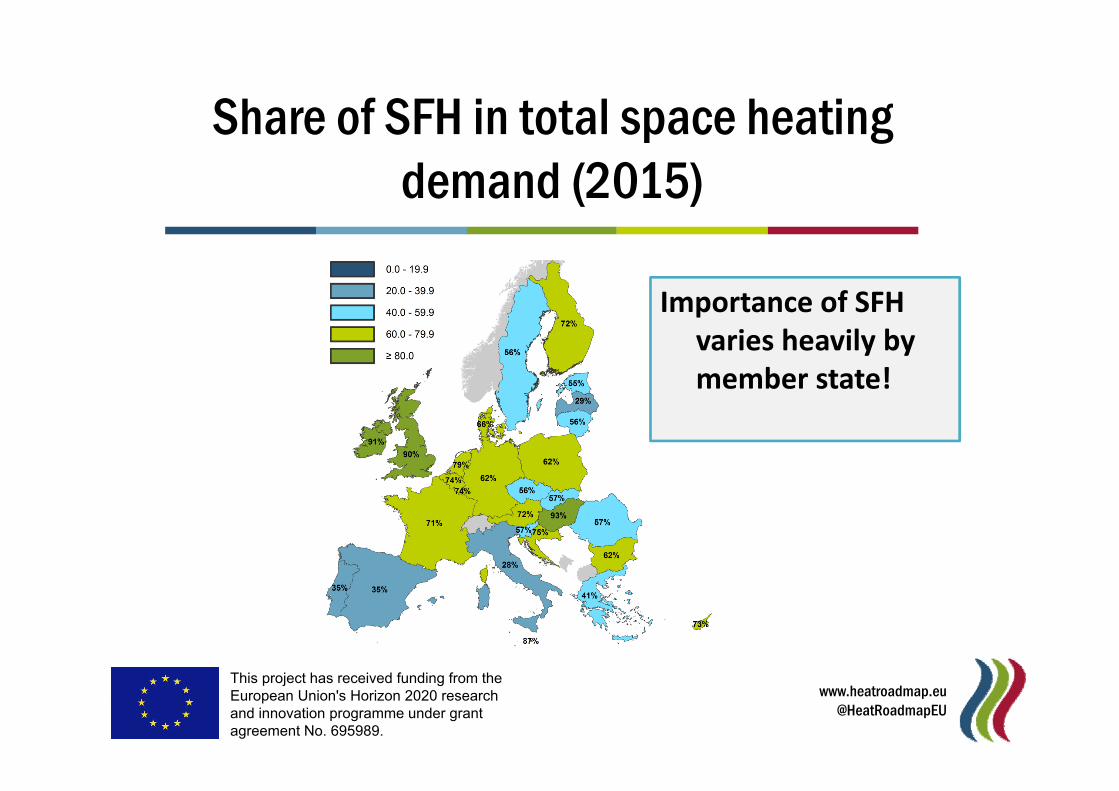
Share of SFH in total space heatingdemand (2015)
Importance of SFH varies heavily by member state!
This project has received funding from the European Union's Horizon 2020 research and innovation programme under grant agreement No. 695989.
www.heatroadmap.eu@HeatRoadmapEU
TERTIARY SECTOR
This project has received funding from the European Union's Horizon 2020 research and innovation programme under grant agreement No. 695989.
www.heatroadmap.eu@HeatRoadmapEU
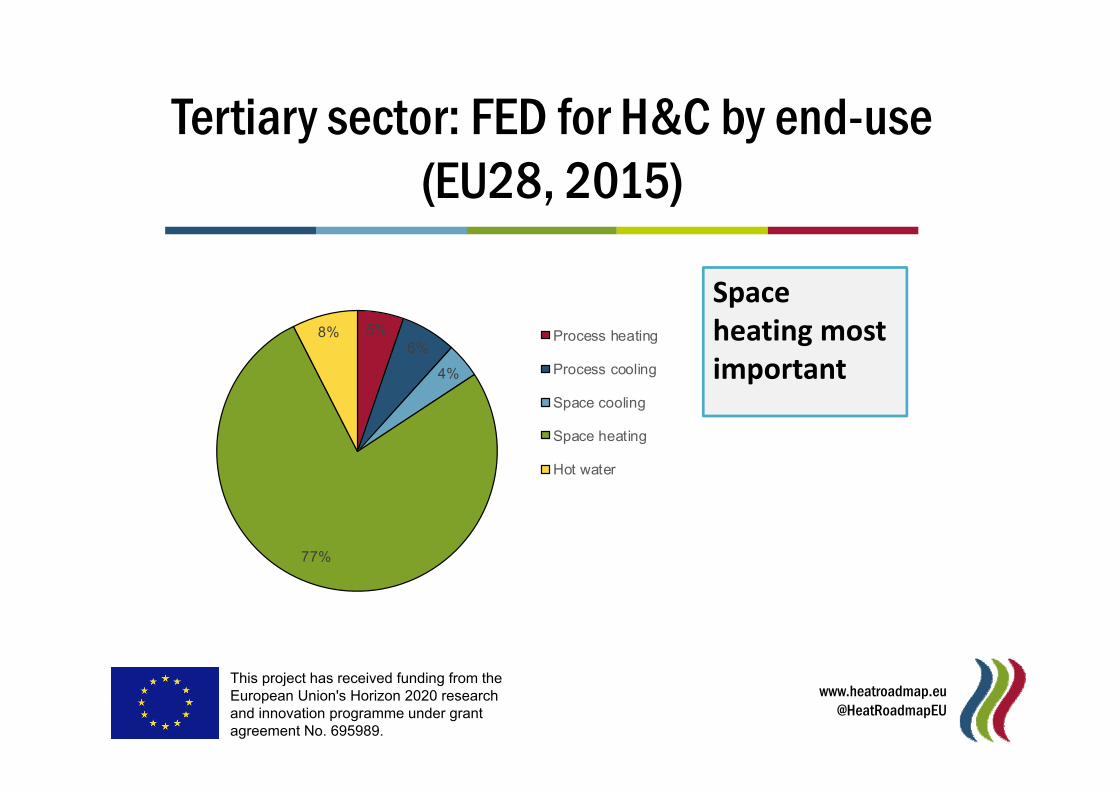
Tertiary sector: FED for H&C by end-use(EU28, 2015)
5%6%
4%
77%
8% Process heating
Process cooling
Space cooling
Space heating
Hot water
Space heating mostimportant
This project has received funding from the European Union's Horizon 2020 research and innovation programme under grant agreement No. 695989.
www.heatroadmap.eu@HeatRoadmapEU
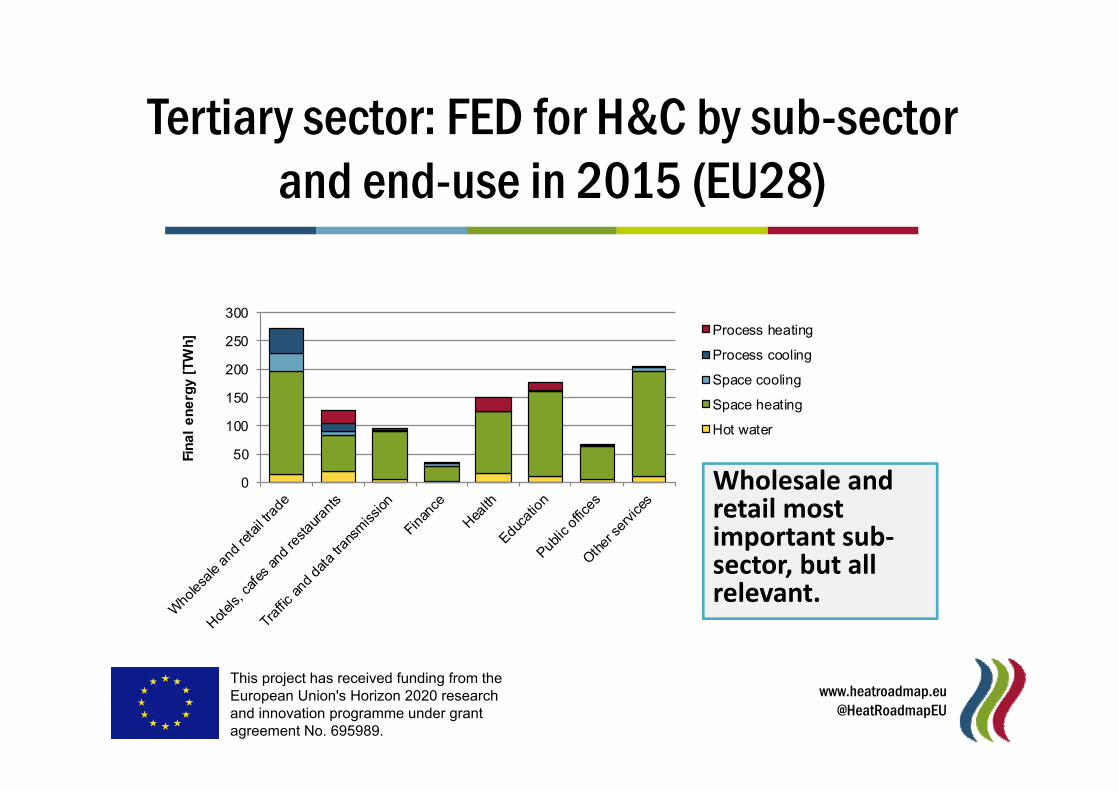
Tertiary sector: FED for H&C by sub-sectorand end-use in 2015 (EU28)
0
50
100
150
200
250
300
Fin
al
en
erg
y [T
Wh
] Process heating
Process cooling
Space cooling
Space heating
Hot water
Wholesale and retail mostimportant sub‐sector, but all relevant.
This project has received funding from the European Union's Horizon 2020 research and innovation programme under grant agreement No. 695989.
www.heatroadmap.eu@HeatRoadmapEU
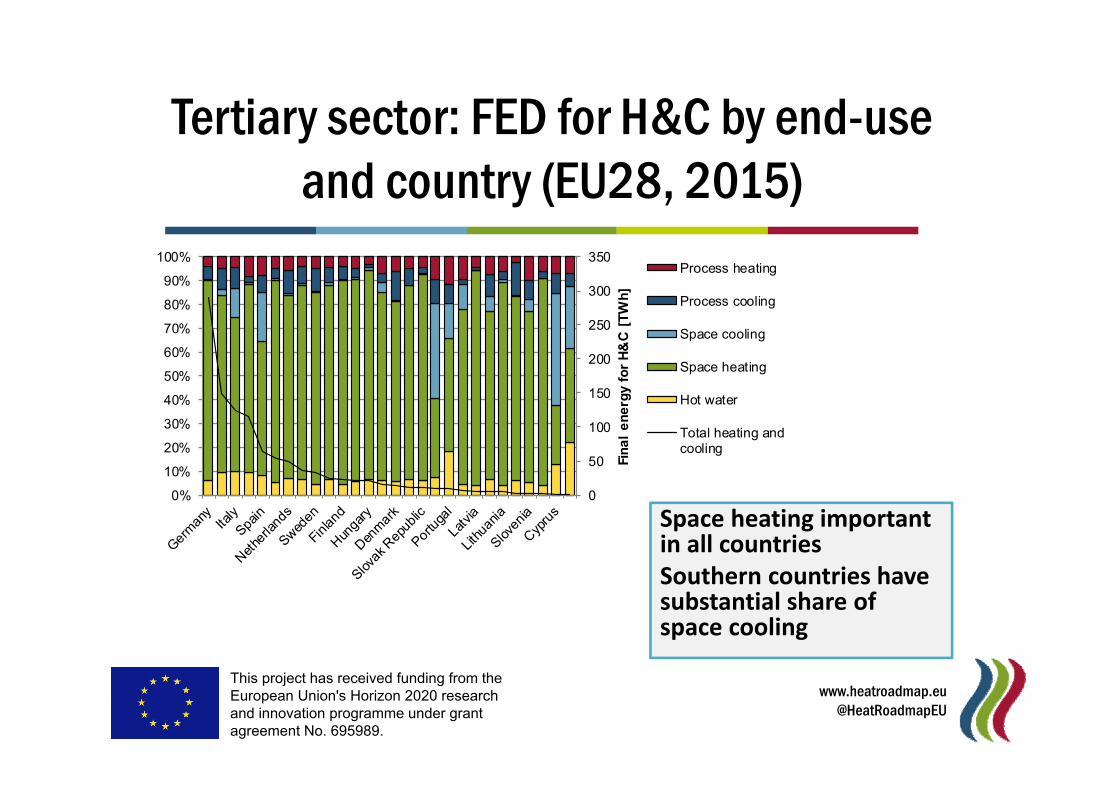
0
50
100
150
200
250
300
350
0%
10%
20%
30%
40%
50%
60%
70%
80%
90%
100%
Fin
al
en
erg
y fo
r H
&C
[T
Wh
]
Process heating
Process cooling
Space cooling
Space heating
Hot water
Total heating andcooling
Tertiary sector: FED for H&C by end-useand country (EU28, 2015)
Space heating importantin all countriesSouthern countries havesubstantial share ofspace cooling
This project has received funding from the European Union's Horizon 2020 research and innovation programme under grant agreement No. 695989.
www.heatroadmap.eu@HeatRoadmapEU
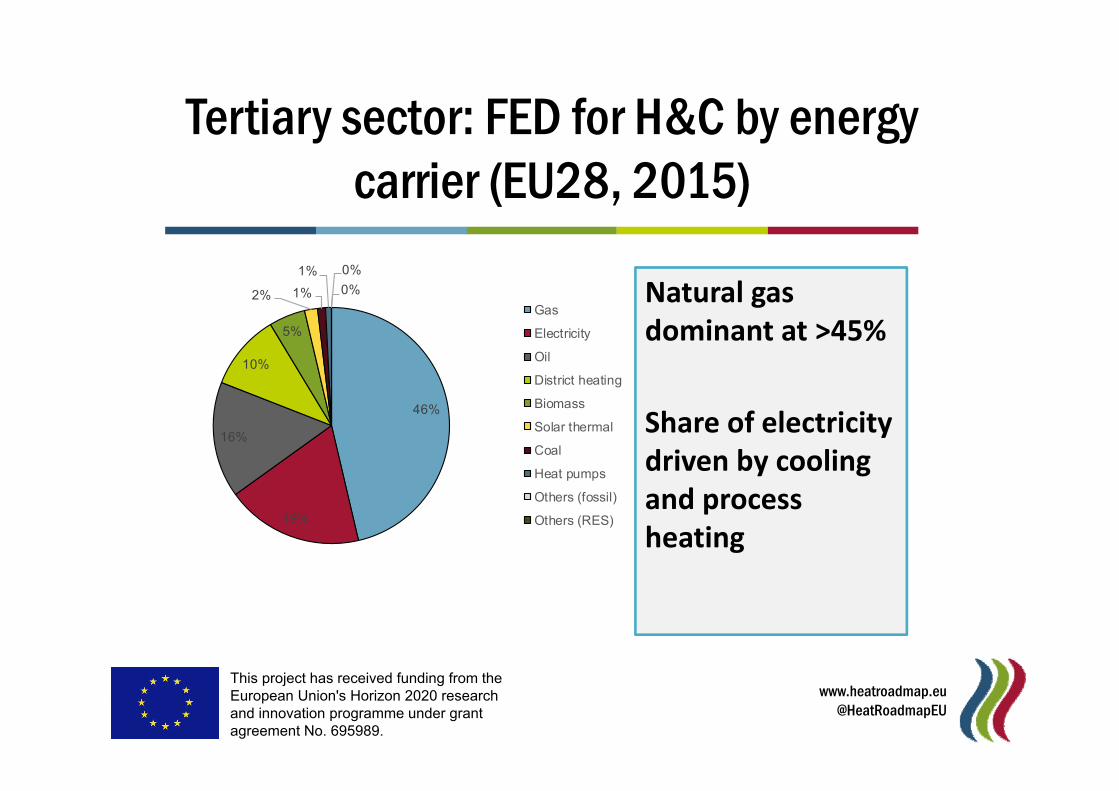
Tertiary sector: FED for H&C by energycarrier (EU28, 2015)
46%
19%
16%
10%
5%
2% 1%
1% 0%
0%
Gas
Electricity
Oil
District heating
Biomass
Solar thermal
Coal
Heat pumps
Others (fossil)
Others (RES)
Natural gas dominant at >45%
Share of electricitydriven by coolingand processheating
This project has received funding from the European Union's Horizon 2020 research and innovation programme under grant agreement No. 695989.
www.heatroadmap.eu@HeatRoadmapEU
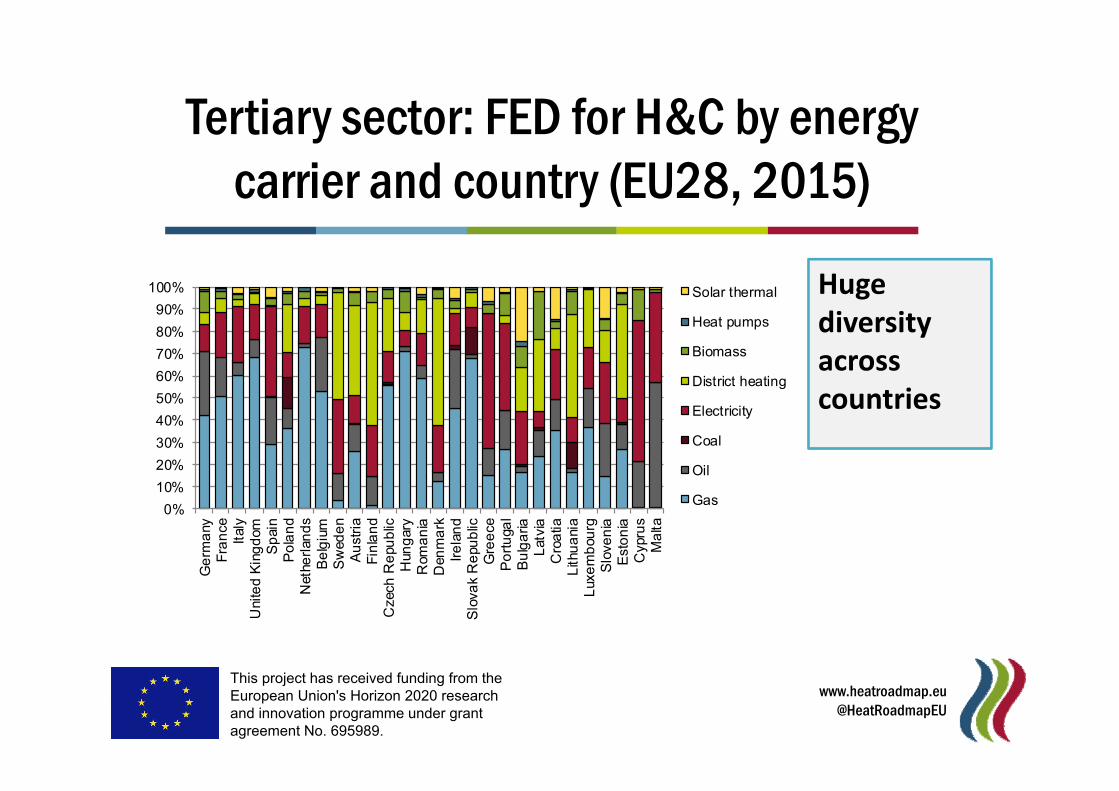
Tertiary sector: FED for H&C by energycarrier and country (EU28, 2015)
0%
10%
20%
30%
40%
50%
60%
70%
80%
90%
100%
Ge
rma
nyF
ran
ceIt
aly
Uni
ted
Kin
gd
omS
pai
nP
ola
nd
Net
herl
and
sB
elg
ium
Sw
ede
nA
ust
ria
Fin
lan
dC
zech
Re
pub
licH
ung
ary
Rom
an
iaD
enm
ark
Ire
lan
dS
lova
k R
epu
blic
Gre
ece
Po
rtu
gal
Bu
lga
riaL
atvi
aC
roa
tiaL
ithu
ani
aL
uxe
mb
ourg
Slo
ven
iaE
sto
nia
Cyp
rus
Ma
lta
Solar thermal
Heat pumps
Biomass
District heating
Electricity
Coal
Oil
Gas
Hugediversityacrosscountries
This project has received funding from the European Union's Horizon 2020 research and innovation programme under grant agreement No. 695989.
www.heatroadmap.eu@HeatRoadmapEU
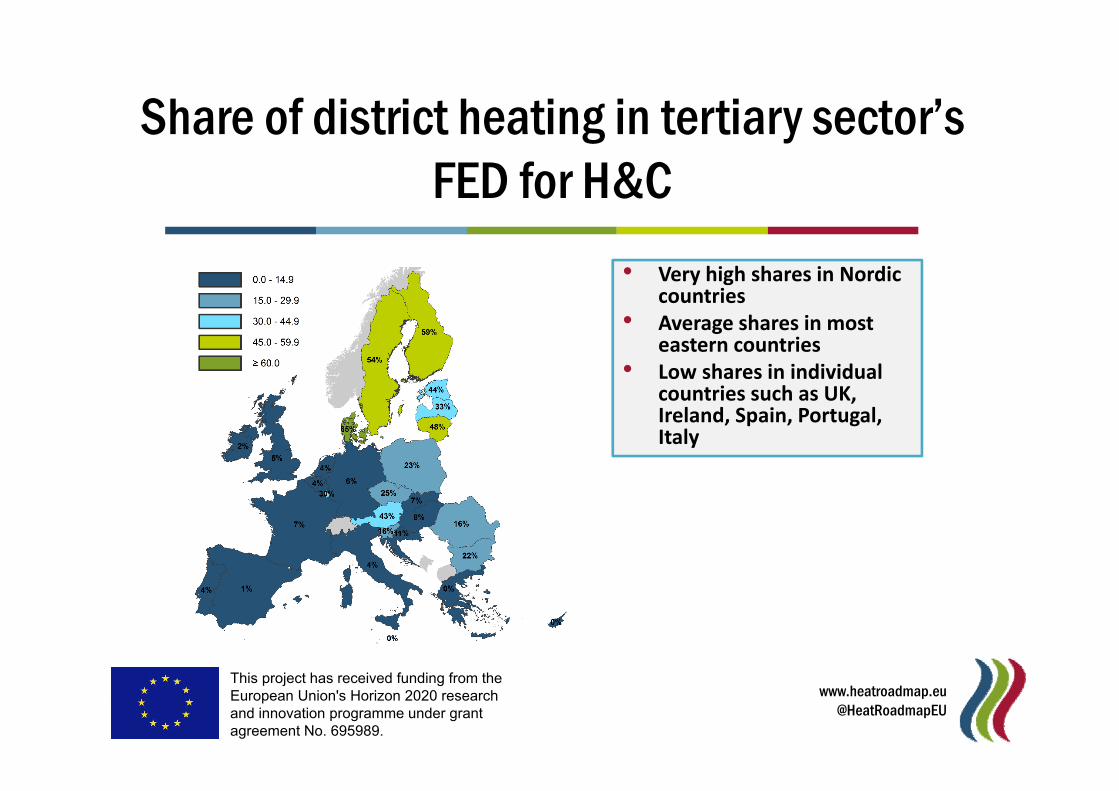
Share of district heating in tertiary sector’sFED for H&C
• Very high shares in Nordic countries
• Average shares in mosteastern countries
• Low shares in individual countries such as UK, Ireland, Spain, Portugal, Italy
This project has received funding from the European Union's Horizon 2020 research and innovation programme under grant agreement No. 695989.
www.heatroadmap.eu@HeatRoadmapEU
COOLING
This project has received funding from the European Union's Horizon 2020 research and innovation programme under grant agreement No. 695989.
www.heatroadmap.eu@HeatRoadmapEU
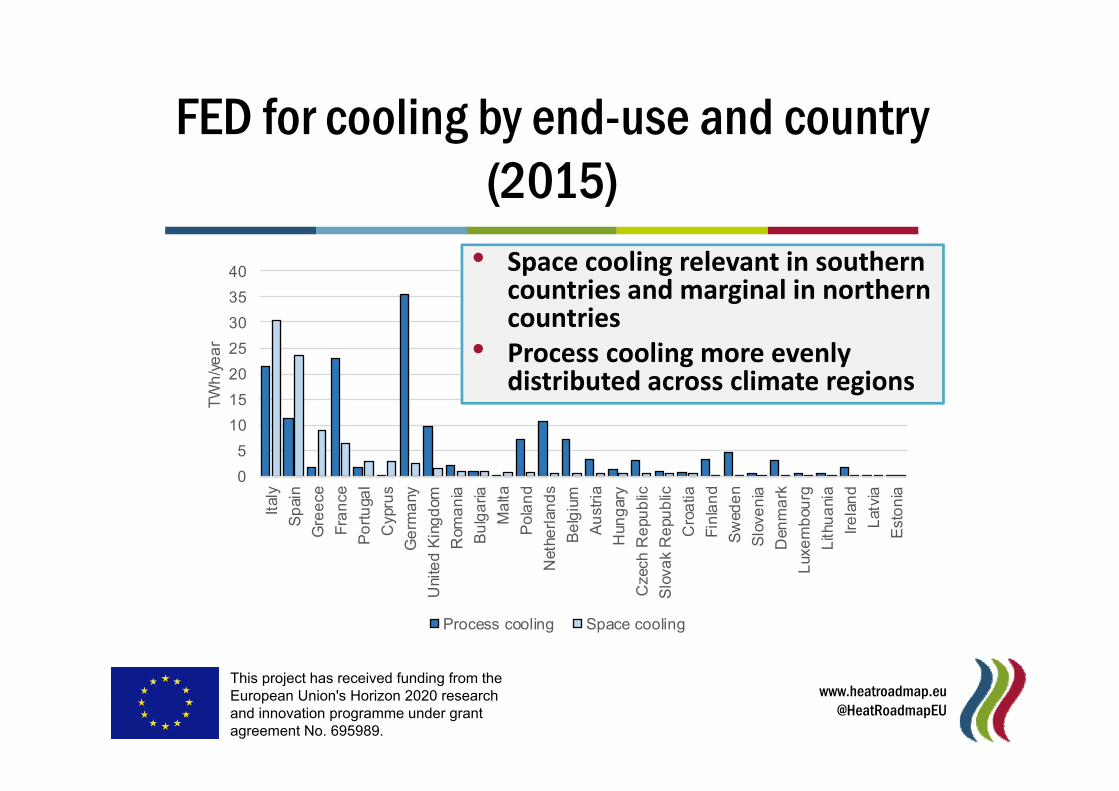
FED for cooling by end-use and country(2015)
0
5
10
15
20
25
30
35
40It
aly
Sp
ain
Gre
ece
Fra
nce
Po
rtu
gal
Cyp
rus
Ge
rma
ny
Uni
ted
Kin
gd
om
Rom
an
ia
Bu
lga
ria
Ma
lta
Po
lan
d
Net
herl
and
s
Be
lgiu
m
Au
stri
a
Hun
gar
y
Cze
ch R
epu
blic
Slo
vak
Re
pub
lic
Cro
atia
Fin
lan
d
Sw
ede
n
Slo
ven
ia
Den
ma
rk
Lux
em
bou
rg
Lith
ua
nia
Ire
lan
d
Lat
via
Est
on
ia
TW
h/y
ea
r
Process cooling Space cooling
• Space cooling relevant in southern countries and marginal in northern countries
• Process cooling more evenly distributed across climate regions
This project has received funding from the European Union's Horizon 2020 research and innovation programme under grant agreement No. 695989.
www.heatroadmap.eu@HeatRoadmapEU
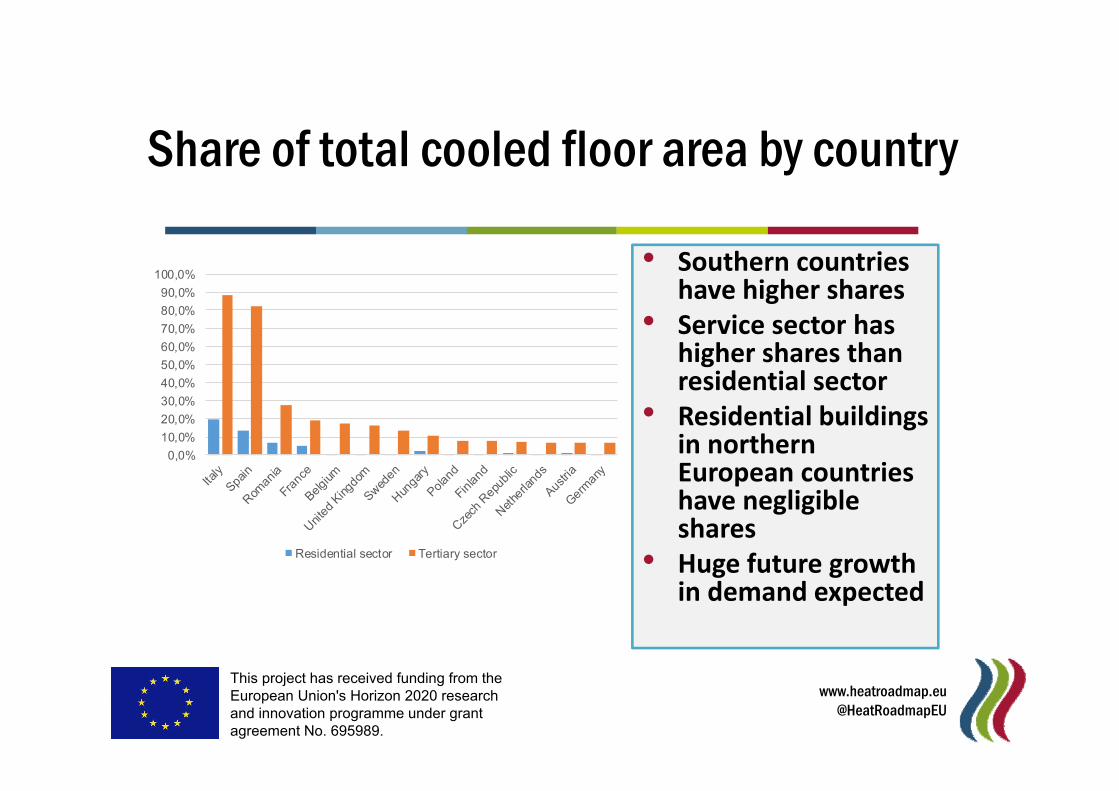
Share of total cooled floor area by country
0,0%
10,0%
20,0%
30,0%
40,0%
50,0%
60,0%
70,0%
80,0%
90,0%
100,0%
Residential sector Tertiary sector
• Southern countries have higher shares
• Service sector has higher shares than residential sector
• Residential buildings in northern European countries have negligible shares
• Huge future growth in demand expected
This project has received funding from the European Union's Horizon 2020 research and innovation programme under grant agreement No. 695989.
www.heatroadmap.eu@HeatRoadmapEU
MAIN CONCLUSIONS
This project has received funding from the European Union's Horizon 2020 research and innovation programme under grant agreement No. 695989.
www.heatroadmap.eu@HeatRoadmapEU
Main conclusions 2015
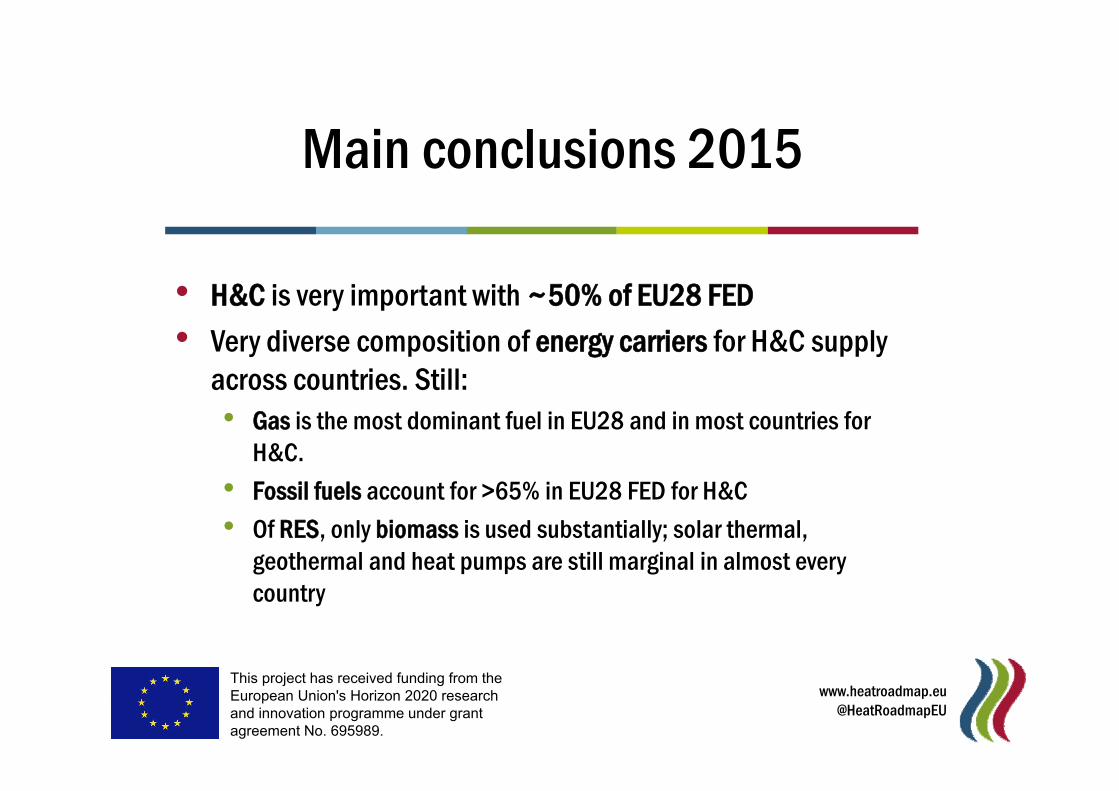
• H&C is very important with ~50% of EU28 FED• Very diverse composition of energy carriers for H&C supply
across countries. Still:• Gas is the most dominant fuel in EU28 and in most countries for
H&C.• Fossil fuels account for >65% in EU28 FED for H&C• Of RES, only biomass is used substantially; solar thermal,
geothermal and heat pumps are still marginal in almost everycountry
This project has received funding from the European Union's Horizon 2020 research and innovation programme under grant agreement No. 695989.
www.heatroadmap.eu@HeatRoadmapEU
Main conclusions 2015
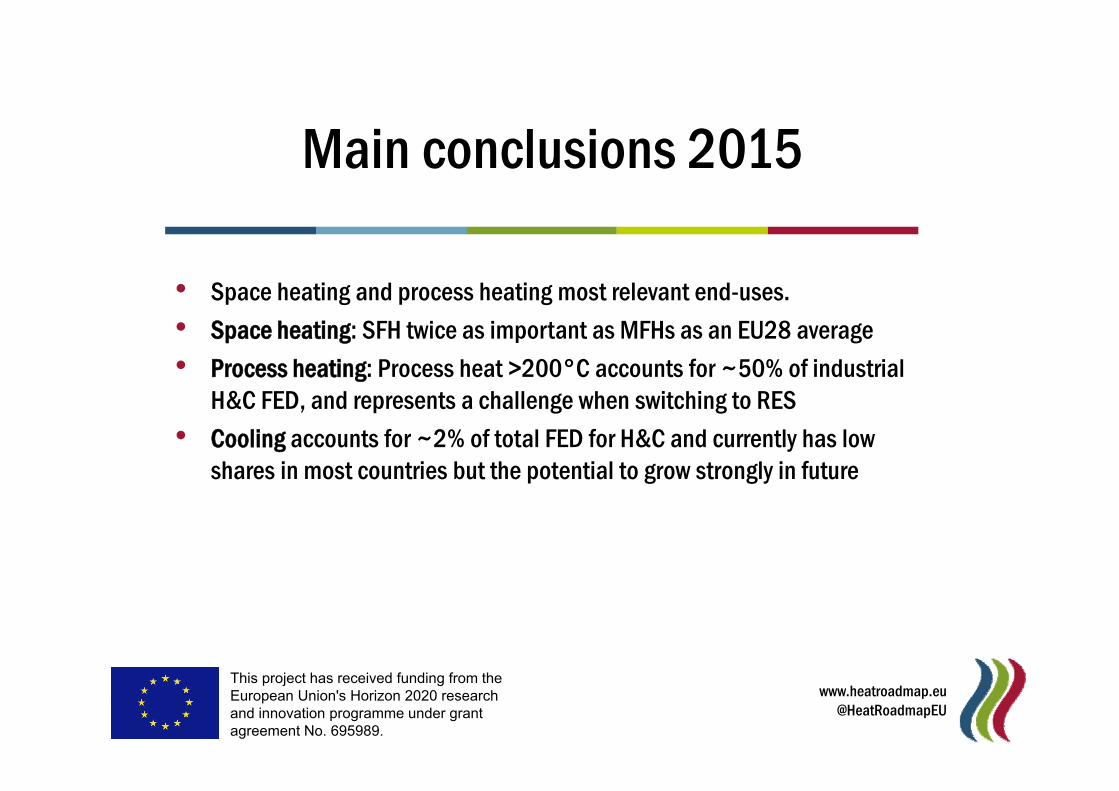
• Space heating and process heating most relevant end-uses.• Space heating: SFH twice as important as MFHs as an EU28 average• Process heating: Process heat >200°C accounts for ~50% of industrial
H&C FED, and represents a challenge when switching to RES• Cooling accounts for ~2% of total FED for H&C and currently has low
shares in most countries but the potential to grow strongly in future
This project has received funding from the European Union's Horizon 2020 research and innovation programme under grant agreement No. 695989.
www.heatroadmap.eu@HeatRoadmapEU
ABBREVIATIONS
This project has received funding from the European Union's Horizon 2020 research and innovation programme under grant agreement No. 695989.
www.heatroadmap.eu@HeatRoadmapEU
Abbreviations
• FED: Final energy demand• CHP: Combined heat and power• HRE: Heat Roadmap Europe• ICG: Internal combustion engine• EU: European Union• SFH: Single-family houses• MFH: Multi-family houses