Embed Size (px)
DESCRIPTION
NATIONAL ASSOCIATION OF REALTORS® Profile of Home Buyers and Sellers 2010
Citation preview

!e Voice for Real Estate®
NATIONAL ASSOCIATION OF REALTORS®
Profile of Home Buyers and Sellers2010
NAR RESEARCH STAFF
Office of the Chief EconomistLawrence Yun, Ph.D.Chief Economist and Senior Vice President
Caroline Van HollenSenior Research and Strategic Planning Coordinator
Survey and Market ResearchPaul C. Bishop, Ph.D.Vice President
Arun BarmanResearch Economist
Stephanie DavisStaff Assistant
Ken FearsManager, Regional Economics
Danielle HaleResearch Economist
Jessica LautzResearch Economist
Selma HeppResearch Economist
Quantitative ResearchJed SmithManaging Director, Quantitative Research
Keunwon ChungStatistical Economist
Wannasiri ChompoopetManager of Housing Statistics
Michael HymanResearch Assistant
George RatiuResearch Economist
Gregg StrattonResearch Economist
Business Operations and CommunicationsThomas DoyleMarketing and Communications Manager
Meredith DunnResearch Communications Representative
Sophia StuartMarketing Associate, Research
2010 OFFICERS
President Vicki Cox Golder, CRB
President-Elect Ron Phipps, ABR, CRS, GRI, GREEN, e-PRO
First Vice President Maurice “Moe” Veissi
Treasurer James L. Helsel, Jr. CCIM, CPM, CRE, SIOR
Immediate Past President Charles McMillan, CIPS, GRI
Vice President & Liaison to CommitteesBrooke Hunt
Vice President & Liaison to Government Affairs Vince Malta
Chief Executive Officer Dale Stinton, CAE, CPA, CMA, RCE
NATIONAL ASSOCIATION OF REALTORS®
Profile of Home Buyers and Sellers2010
©2010 NATIONAL ASSOCIATION OF REALTORS®

3 National Association of REALTORS® | Profile of Home Buyers and Sellers 2010
ContentsIntroduction ..................................................................................................................................4
Highlights ...................................................................................................................................... 6
Chapter 1: Characteristics of Home Buyers .......................................................................... 8
Chapter 2: Characteristics of Homes Purchased ..............................................................23
Chapter 3: The Home Search Process ................................................................................. 41
Chapter 4: Home Buying and Real Estate Professionals .................................................56
Chapter 5: Financing the Home Purchase ...........................................................................67
Chapter 6: Home Sellers and Their Selling Experience ...................................................76
Chapter 7: Home Selling and Real Estate Professionals ..................................................97
Chapter 8: For Sale by Owner Sellers .................................................................................105
Methodology .............................................................................................................................114
List of Exhibits ........................................................................................................................... 115
National Association of REALTORS®
National Association of REALTORS® | Profile of Home Buyers and Sellers 20104
Introduction
Many individuals and families aspire to homeownership while others continue to enjoy both the financial and non-financial benefits of
owning a home. In challenging economic times, the goal of buying a first home can seem daunting, no matter the motivation. Even for experienced homeowners looking to trade up, relocate or purchase a vacation property, buying or selling a home is a complex process. The financial uncertainties that would-be buyers and sellers consider in the best of times are magnified when the economy is only just emerging from a deep recession. There are a number of decisions that are part of the home purchase process and there are unknowns as buyers search for the right home that will meet their needs today as well as in the future.
It is no surprise that a majority of home buyers and sellers rely on the services and expertise of real estate professionals to assist them with their transaction. Buyers and sellers appreciate the knowledge and expertise of real estate professionals who can guide them through each step of the transaction. One indicator of client satisfaction is that a majority of both buyers and sellers report that they would use the same real estate agent again or recommend that agent to others.
The NATIONAL ASSOCIATION OF REALTORS® surveys home buyers and sellers annually to gather detailed information about the home buying and selling process. These surveys provide information on demographics, housing characteristics and the experience of consumers in the housing market. Buyers and sellers also share information on the role that real estate professionals play in home sales transactions.
This report provides real estate professionals with insights into the needs and expectations of their clients.
What do consumers want when choosing a real estate professional? How do home buyers begin the process of searching for a home? Why do some sellers choose to forego the assistance of an agent? The answers to these questions, along with other findings in this report, will help real estate professionals better understand the housing market and also provide the information necessary to address the needs of America’s real estate consumers.
2010 Profile of Home Buyers and Sellers
Paul C. Bishop, Ph.D. Jessica Lautz Arun Barman Danielle Hale
November 2010
5 National Association of REALTORS® | Profile of Home Buyers and Sellers 2010
The Housing Environment
Despite an official end to the Great Recession in June 2009, the economy remains a concern for policy makers, business owners and many families,
largely because the near-term outlook remains very cloudy. Even amid signs of economic growth and recovery, the jobless rate in fall 2010 has hovered between 9 percent and 10 percent with most analysts foreseeing a very slow decline in the number of unemployed. On a more positive note, data from the Federal Reserve show that Americans are beginning to put their financial house in order; debt is being paid down and household net worth has rebounded from the lows reached during the depths of the financial crisis and recession.
While the economy moves forward, the real estate sector is searching for additional signs of stabilization. Late in 2009 and through early 2010, home buyers took advantage of one of several home buyer tax credits. Home sales rose significantly as a result of the credit, pushing purchases of existing single-family and condo properties to an annualized rate of nearly 6.5 million in November 2009. While sales decreased as expected once the tax credit expired in April 2010, home values appear to have found more solid footing with several measures of prices showing little change compared to the year before.
One of the wildcards in the housing recovery is the foreclosure crisis in some communities and shadow inventory. The rise in foreclosures is well known as is the concentration of foreclosures in a small number of states that experienced a rapid rise in prices and sales in the middle of the decade. More recently, investors have snapped up properties, sometimes competing head to head with first-time buyers seeking to take advantage of the now-expired home buyer tax credit. Looking ahead, the number of properties yet to come to the market because they are in foreclosure or are at risk of foreclosures is a much more difficult aspect of the current housing market to quantify. There are numerous estimates of the size of this shadow inventory, the wide range of estimates in part a reflection of the fact that there is no consistent or agreed-upon definition of what constitutes the shadow inventory. While deriving a precise number would be helpful, many
analysts expect the number of repossessed properties or those with mortgages that are severely delinquent to remain a significant headwind for the market for some time to come.
Without a doubt, the past few years have been a stressful period for some homeowners and many that aspire to homeownership. A home purchase is a significant financial commitment, but it also entails many non-financial benefits. For the typical homeowner who purchases a property as their primary residence, they are also buying into a community. A long and distinguished body of academic research has shown that homeownership strengthens the community; homeowners have a stake in the community and are likely to invest through their participation in civic activities such as voting or volunteering their time. Moreover, it is now well documented that homeowners and their families benefit in a number of ways ranging from more positive feeling about the future to better health. Although the financial aspects of homeownership are important, they do not stand alone as the primary motivators for the purchase of a home. As this report shows, the desire to be a homeowner and lifestyle considerations are the dominant reasons for the purchase of a home.
National Association of REALTORS®
National Association of REALTORS® | Profile of Home Buyers and Sellers 20106
Business Activity of NAR’s Commercial MembersHighlightsCharacteristics of Home Buyers• Fifty percent of recent home buyers were first-time
buyers.
• The typical first-time home buyer was 30 years old, while the typical repeat buyer was 49 years old.
• The 2009 median household income of buyers was $72,200. The median income was $59,900 among first-time buyers and $87,000 among repeat buyers.
• Twenty percent of recent home buyers were single females, and 12 percent were single males.
• For one-third of recent home buyers, the primary reason for their recent home purchase was a desire to own a home.
Characteristics of Homes Purchased• New home purchases were at the lowest level in nine
years—down to 15 percent of all recent home purchases.
• The typical home purchased was 1,780 square feet in size, was built in 1990, and had three bedrooms and two bathrooms.
• Seventy-seven percent of home buyers purchased a detached single family home.
• Eleven percent of buyers over 50 purchased senior-related housing or in an active adult community.
• When considering the purchase of a home, commuting costs were considered very or somewhat important by 76 percent of buyers.
The Home Search Process• For more than one-third of home buyers, the first step
in the home-buying process was looking online for properties.
• Nine in ten home buyers used the Internet to search for homes.
• Real estate agents were viewed as a very useful information source by 81 percent of buyers who used an agent while searching for a home.
• The typical home buyer searched for 12 weeks and viewed 12 homes.
Home Buying and Real Estate Professionals• Eighty-three percent of buyers purchased their home
through a real estate agent or broker.
• Four percent of buyers purchased a home in foreclosure and 6 percent of buyers purchased a short sale.
• Forty-eight percent of buyers found their agent through a referral from a friend or family member.
• More than half of buyers most want their agent to help them find the right home to purchase.
• Eighty-seven percent would recommend or use their agent again in the future.
Financing the Home Purchase• Ninety-one percent of home buyers financed their
recent home purchase.
• First-time buyers typically financed 96 percent of their home purchase, while repeat buyers financed 86 percent of their purchase.
• Forty-six percent of home buyers reported they have made some sacrifices such as reducing spending on luxury items, entertainment or clothing.
• More than one-quarter of first-time buyers reported their mortgage application and approval process was somewhat more difficult than they expected, and 14 percent reported it was much more difficult than expected.
• Seventy-one percent of all home buyers and 93 percent of first-time home buyers used the homebuyer tax credit during their home purchase.
Home Sellers and Their Selling Experience• The typical seller lived in their home eight years before
selling.
• Eighty-eight percent of sellers were assisted by a real estate agent when selling their home.
• Recent sellers typically sold their homes for 96 percent of the listing price, and 57 percent reported they reduced the asking price at least once.
• The typical home was on the market eight weeks.
2010 Profile of Home Buyers and Sellers

7 National Association of REALTORS® | Profile of Home Buyers and Sellers 2010
National Association of REALTORS®
• Forty-four percent of sellers offered incentives to attract buyers, most often assistance with home warranty policies and closing costs.
• Eighty-six percent of sellers were at least somewhat satisfied with their selling experience.
Home Selling and Real Estate Professionals• Forty-one percent of sellers who used a real estate agent
found their agents through a referral from friends or family, and 23 percent used the agent they worked with previously to buy or sell a home.
• Ninety-one percent of sellers reported that their home was listed or advertised on the Internet.
• Among recent sellers who used an agent, 83 percent reported they would definitely (63 percent) or probably (21 percent) use that real estate agent again or recommend to others.
For-Sale-by-Owner (FSBO) Sellers• The share of home sellers who sold their home without
the assistance of a real estate agent was 9 percent. Half of them knew the buyer prior to home purchase.
• The primary reason that sellers choose to sell their home without the assistance of a real estate agent to a buyer they did not know was that they did not want to pay a fee or commission (38 percent).
• Twenty-eight percent of FSBO sellers took no action to market their home, and 56 percent did not offer any incentives to attract buyers.
• Twenty-three percent of FSBO sellers reported getting the price right was the most difficult task, while 18 percent reported preparing or fixing up the home for sale was their most difficult task.
Highlights
National Association of REALTORS® | Profile of Home Buyers and Sellers 20108
Chapter 1: Characteristics of Home Buyers
In 2010 the continuation of the first-time home buyer tax credit and improved affordability conditions, along with the wide selection of available homes, continued to increase the share of first-time buyers.
First-time buyers accounted for half of the buyer market, up from 47 percent in 2009.
The increase in first-time buyers reoriented the reasons why buyers now purchased a home and also increased the diversity of buyers. The change in buyers influenced the median household income of home buyers, and brought it slightly lower than in previous years. A buyer’s readiness remains the primary driver of the timing of home purchases, but the first-time home buyer tax credit greatly influenced the buyer’s willingness to purchase a home. The home buyer tax credit was cited as the primary reason to buy now for 13 percent of first-time home buyers and 17 percent of buyers aged 18 to 24.
National Association of REALTORS® | Profile of Home Buyers and Sellers 20108
9 National Association of REALTORS® | Profile of Home Buyers and Sellers 2010
DEMOGRAPHIC CHARACTERISTICS OF HOME BUYERS
• Exhibits 1-1 through 1-4
The largest share of home buyers were aged 25 to 34 and accounted for 36 percent of all buyers in 2010. More than one-fifth of home buyers were 35 to 44 years old. The median age of home buyers is unchanged from 2009 at 39 years old; however in two regions, the Northeast and the Midwest, the median age declined slightly. In the South and West the median age increased slightly.
Median household income of home buyers declined nationally and in all regions for the last two years. The decline in the median household income of home buyers shows how the affordability of homes has opened the market to home buyers who would not otherwise have been financially able to purchase a home.
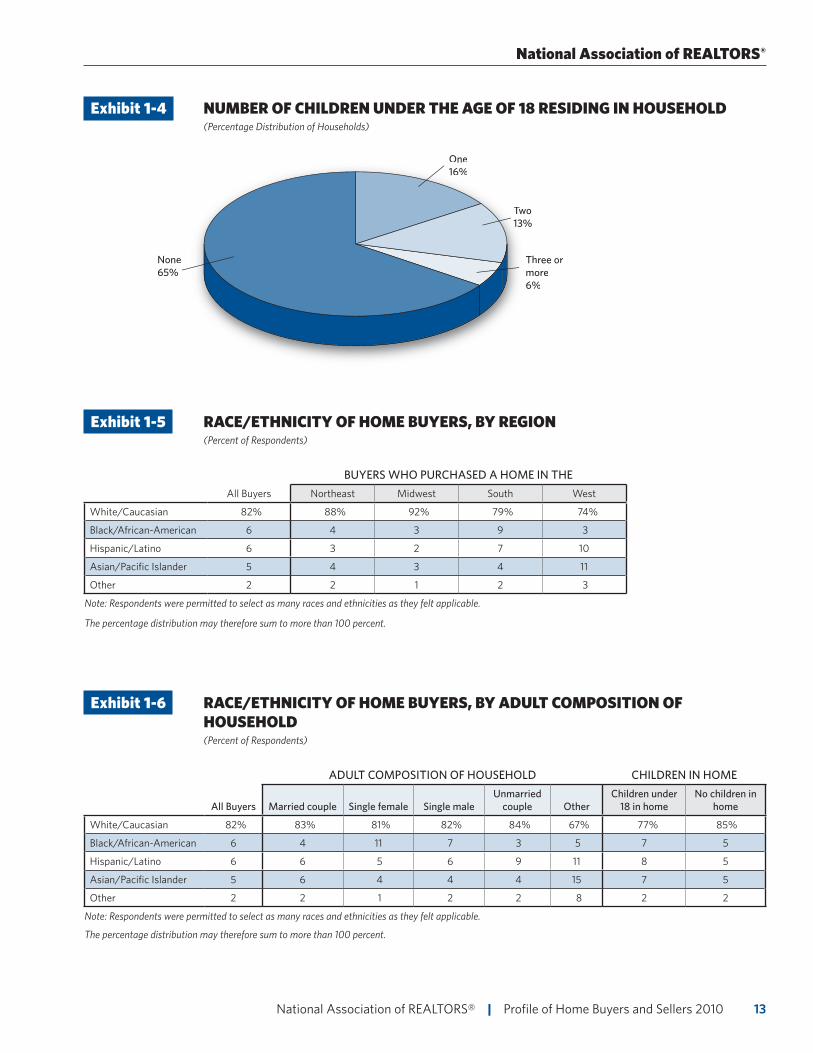
Household composition of recent home buyers continues to evolve as the market opened to a larger share of first-time buyers and improved affordability. The share of married couples has declined to 58 percent in 2010 from 68 percent in 2001. The share of single buyers has increased to 32 percent from 22 percent in 2001. Single female buyers accounted for 15 percent of the market in 2001 and now account for 20 percent of the home buying market. Single male buyers accounted for 7 percent of the market in 2001 and now account for 12 percent of the market in 2010. Thirty-five percent of home buyers had children under the age of 18 in their household.
RACE, ETHNICITY, LANGUAGE AND NATIONAL ORIGIN OF BUYERS
• Exhibits 1-5 through 1-8, and Exhibits 1-15 through 1-17
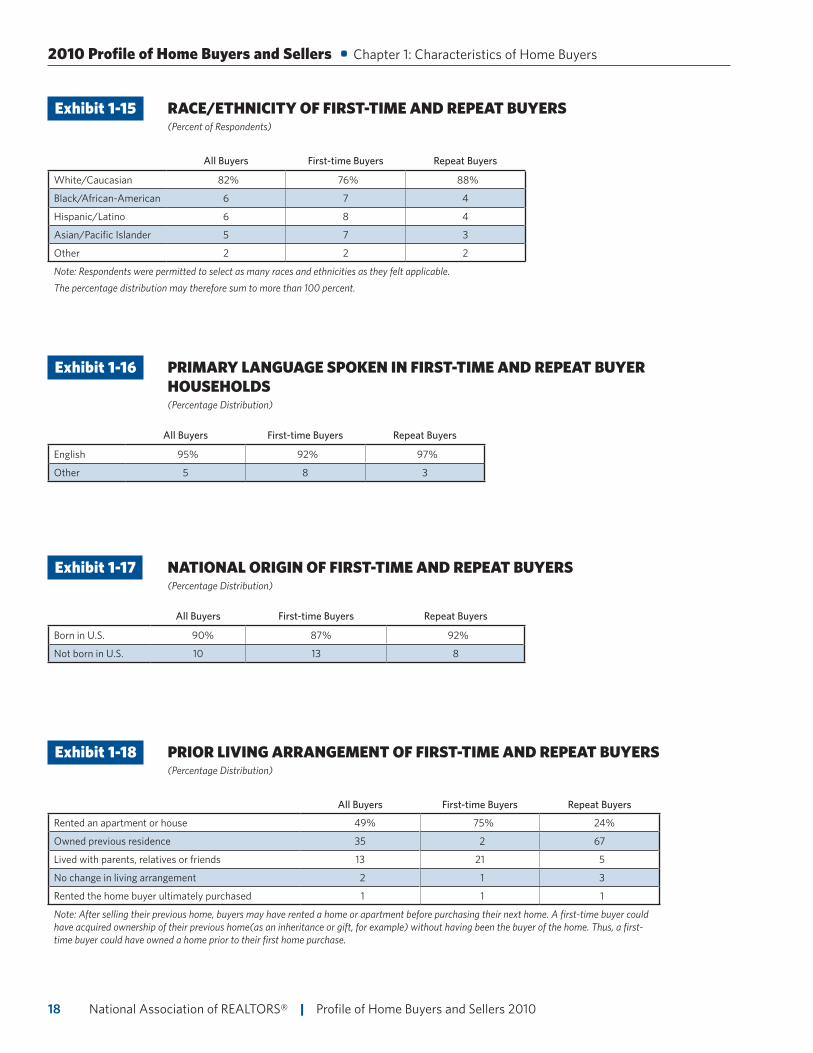
Among all buyers nationwide, 82 percent reported their ethnicity as Caucasian. However, the race and ethnicity of home buyers varies greatly by the region in which they purchased a home.
Home buyers are most diverse in the West. Twenty-two percent of buyers in the West reported that their race was Hispanic or Asian. The South was also more diverse than the U.S. overall. Sixteen percent of home buyers in the South reported there race was Black or Hispanic. By household composition, racial identification does not vary significantly although single female buyers are more racially diverse. The largest difference was among households who had children under 18 in the home and those who did not. Among households who had children they were more diverse than all buyers.
The share of home buyers who speak English at home was 95 percent nationally. Again the West was more diverse and had a continued two-year increase in the share of home buyers who did not speak English, now at 9 percent. Overall the share of home buyers born in the US changed slightly from last year to 90 percent. In the West 83 percent of buyers reported being born in the US while the share in the Midwest was 94 percent.
First-time buyers are more diverse than repeat buyers and an increased share of first-time buyers identify themselves as a race or ethnicity other than Caucasian compared to 2009.First-time buyers are also more likely to speak a language other than English at home and are more likely than repeat buyers to have been born outside of the United States.
National Association of REALTORS®
National Association of REALTORS® | Profile of Home Buyers and Sellers 201010
DEMOGRAPHIC CHARACTERISTICS OF FIRST-TIME AND REPEAT HOME BUYERS
• Exhibits 1-9 through 1-14
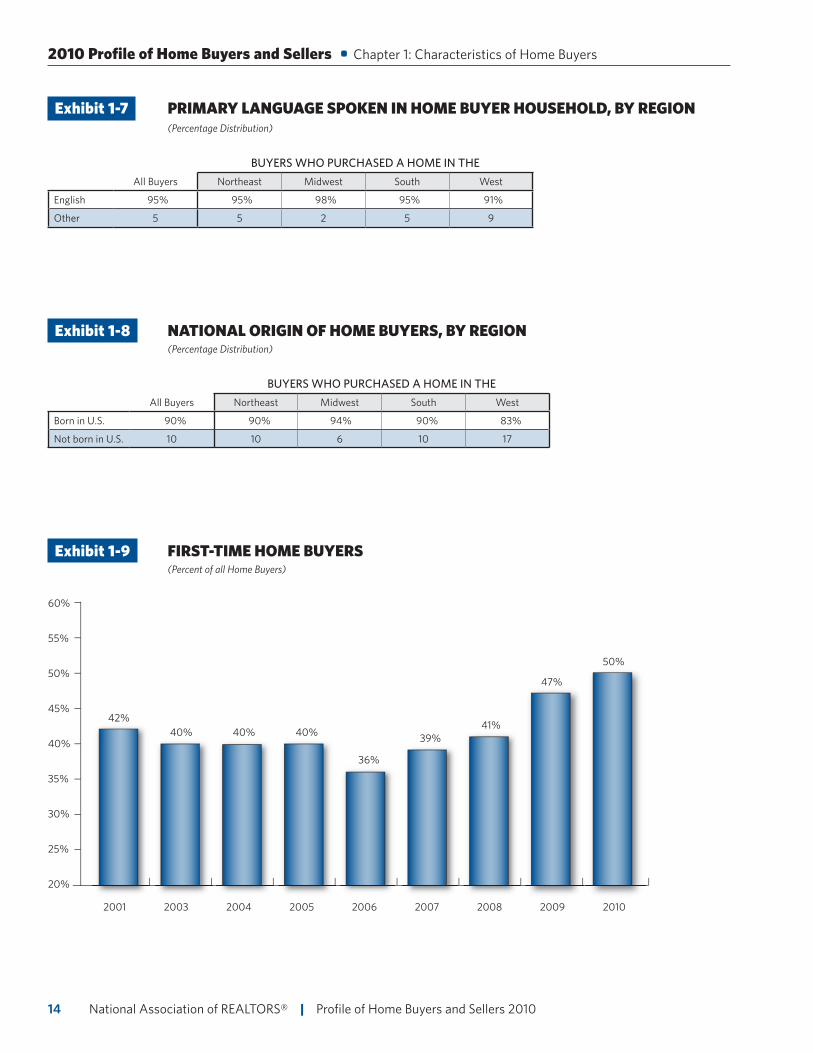
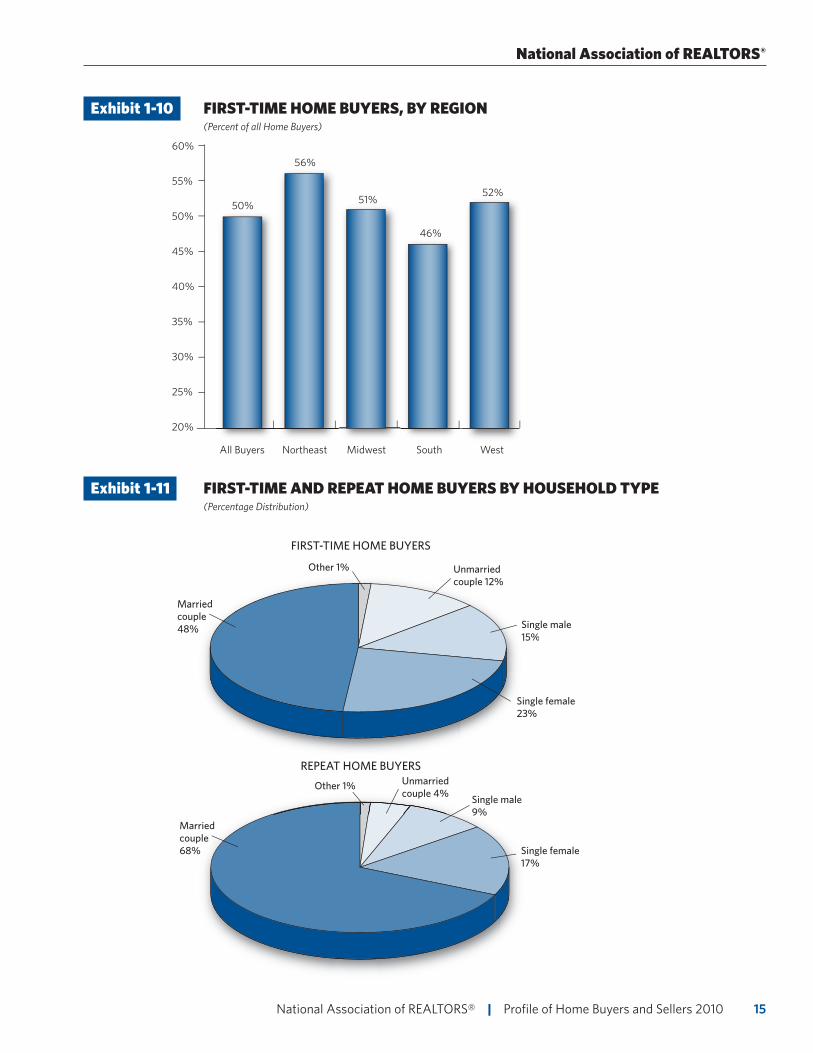
Record affordability and the availability of the first-time home buyer tax credit pushed the share of first-time home buyers to 50 percent from 47 percent in 2009 and 41 percent in 2008. The Northeast had the greatest increase in first-time buyers from 48 percent in 2009 to 56 percent in 2010. The Midwest, South, and West all saw modest increases in the share of first-time buyers.
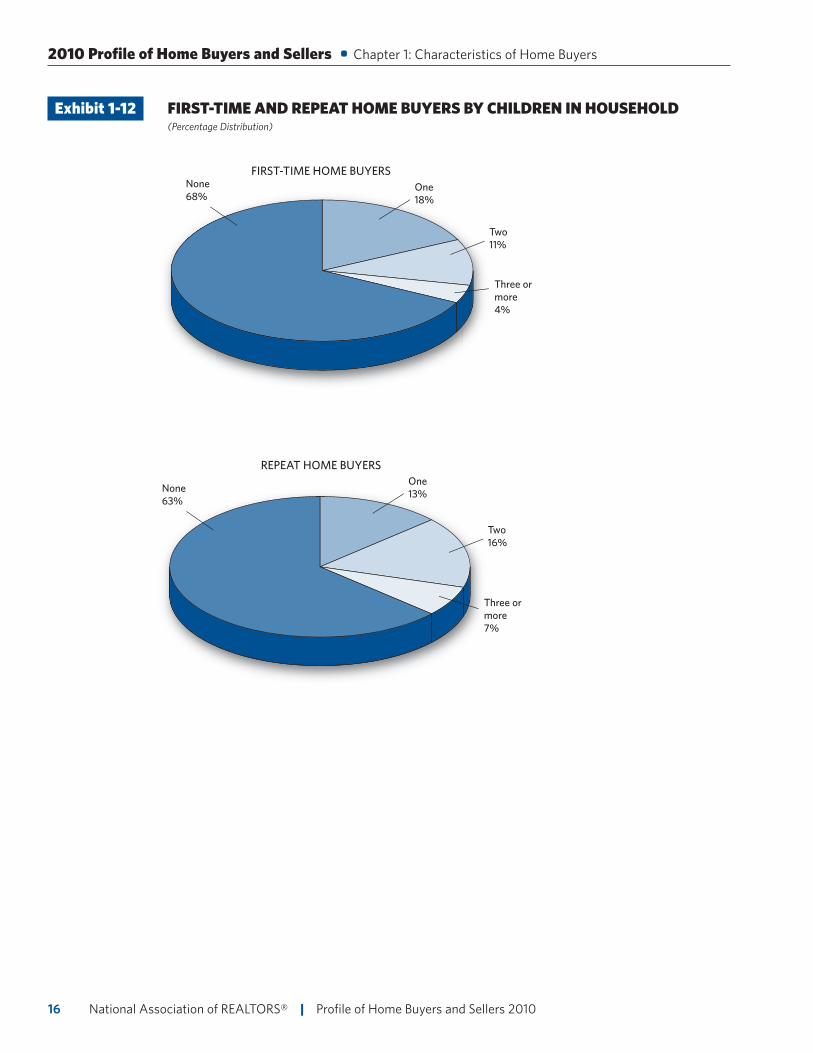
The share of first-time single male buyers increased from 12 percent in 2009 to 15 percent in 2010. Among first-time buyers the share of single female buyers was 23 percent, and the share was 17 percent among repeat buyers. Married couples represent 48 percent of first-time buyers and 68 percent of repeat buyers. Thirty-two percent of first-time buyers had children under the age of 18 in the household, compared to 37 percent of repeat buyers. Repeat buyers were more likely to have more than one child in the home compared to first-time buyers.
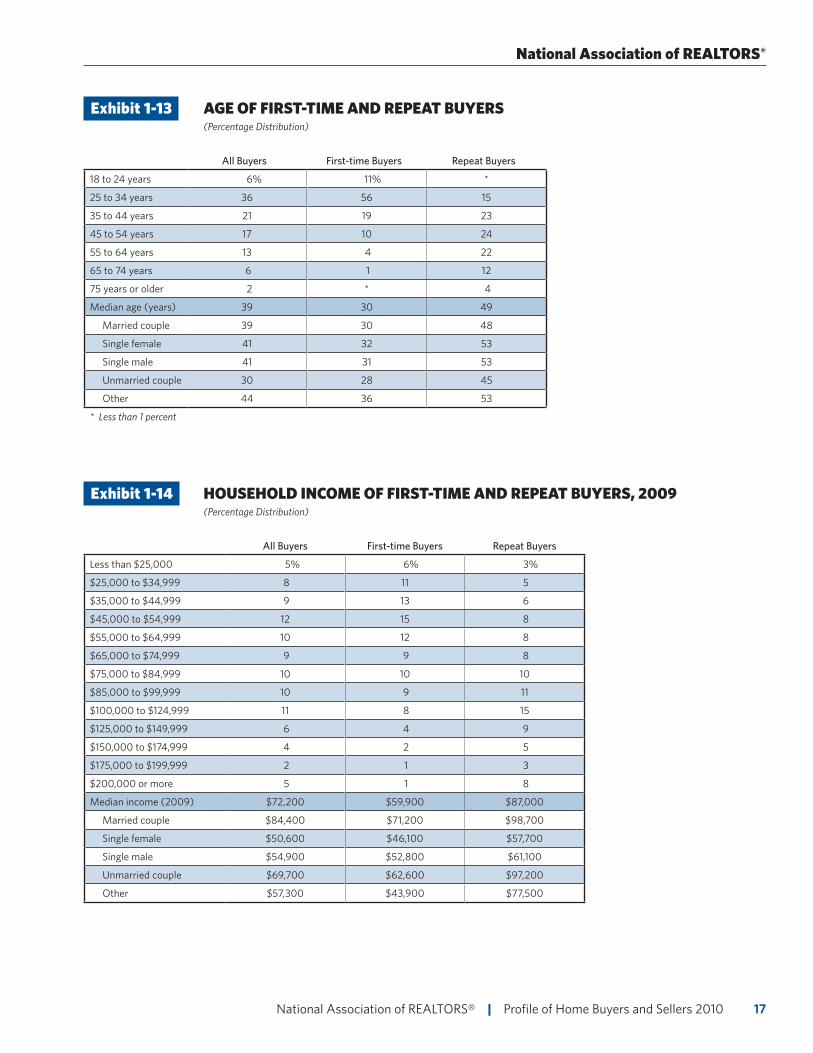
The age of buyers remains nearly unchanged from 2009, with a median age of first-time buyers typically younger than repeat buyers, 30 compared to 49 years. The largest share of first-time buyers was between 25 and 34 years of age. The typical home buyer was 39 years old in 2010—the same age for the last two years.
Overall, the median income of home buyers decreased by $900 in 2009, which reflects a larger share of lower income buyers able to take advantage of improved affordability of homes. The decrease follows the $1,800 decrease in median incomes of home buyers in the last survey. The median income of first-time buyers decreased slightly while the income of repeat buyers increased slightly.
PRIOR LIVING ARRANGEMENT
• Exhibits 1-18 through 1-19
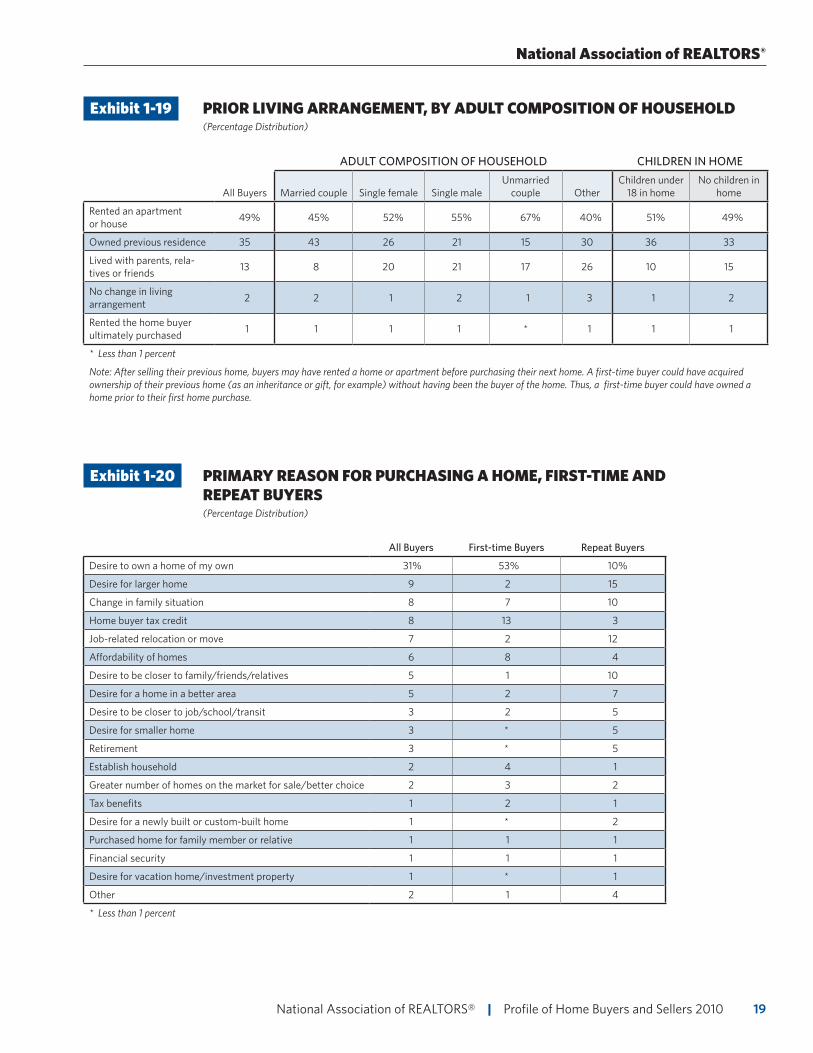
Similar to 2009, about half of all buyers reported renting an apartment or house immediately prior to making their home purchase. Three-quarters of first-time buyers were renters immediately before making their home purchase compared to 24 percent of repeat buyers. When comparing household compositions, married couples were more likely than other household types to own their previous residence before buying. Unmarried couples were the most likely to be renters before buying. Single men and single women were more likely than other household types to live with parents, relatives, or friends before buying.
Record affordability and the availability of the first-time home buyer tax credit pushed the share
of first-time buyers to 50 percent from 41 percent in 2008.
2010 Profile of Home Buyers and Sellers • Chapter 1: Characteristics of Home Buyers
11 National Association of REALTORS® | Profile of Home Buyers and Sellers 2010
PRIMARY REASON FOR HOME PURCHASE AND TIMING OF PURCHASE
• Exhibits 1-20 through 1-24
Consistently among buyers of nearly every age bracket, and every household composition - those with children and those without children, the primary reason for purchasing a home was the desire to own a home. Nearly one-third of all buyers cited this reason in 2010. While this remains the most cited reason among all types of buyers, it decreased in prominence in 2010 as the home buyer tax credit rose steeply.
The primary reason for purchasing a home differs is when looking at repeat buyers. The most important reasons repeat buyers’ purchase a home is the desire for a larger home and a job-related relocation or move. Among first-time buyers, 53 percent reported the most important reason for purchasing a home is the desire to own a home. The home buyer tax credit ranked second among first-time buyers with 13 percent of first-time buyers citing this as their primary reason for purchasing a home, up from 6 percent in 2009.
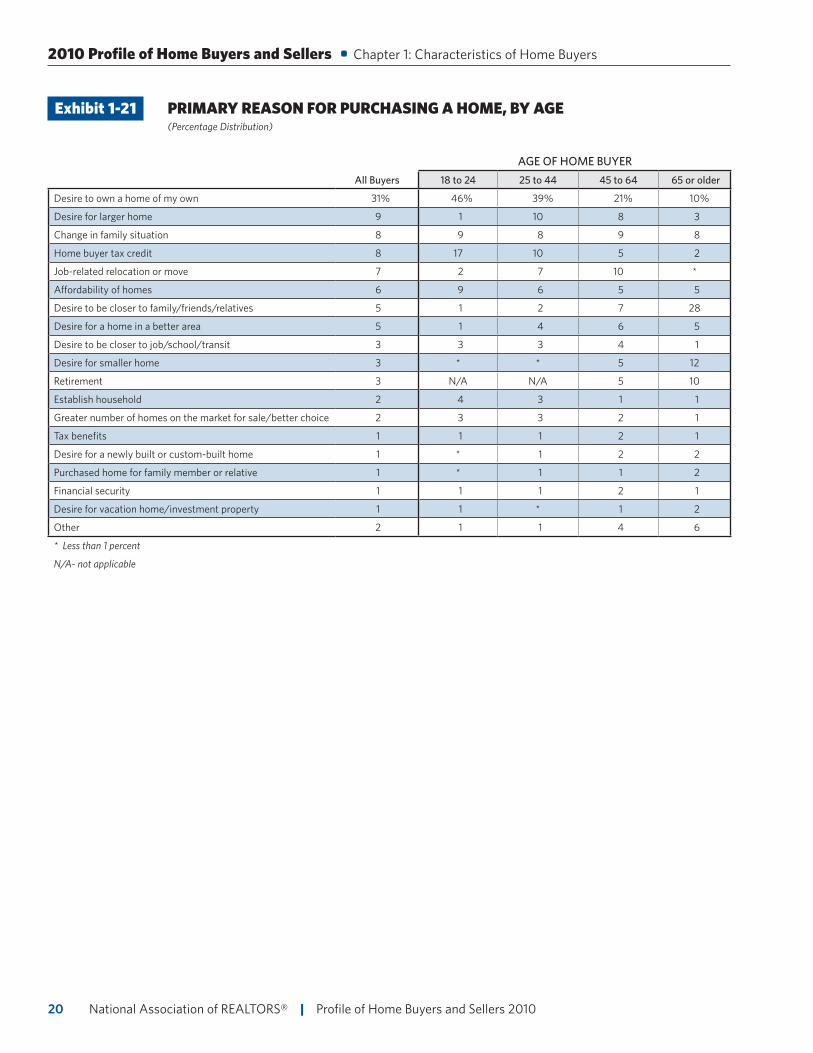
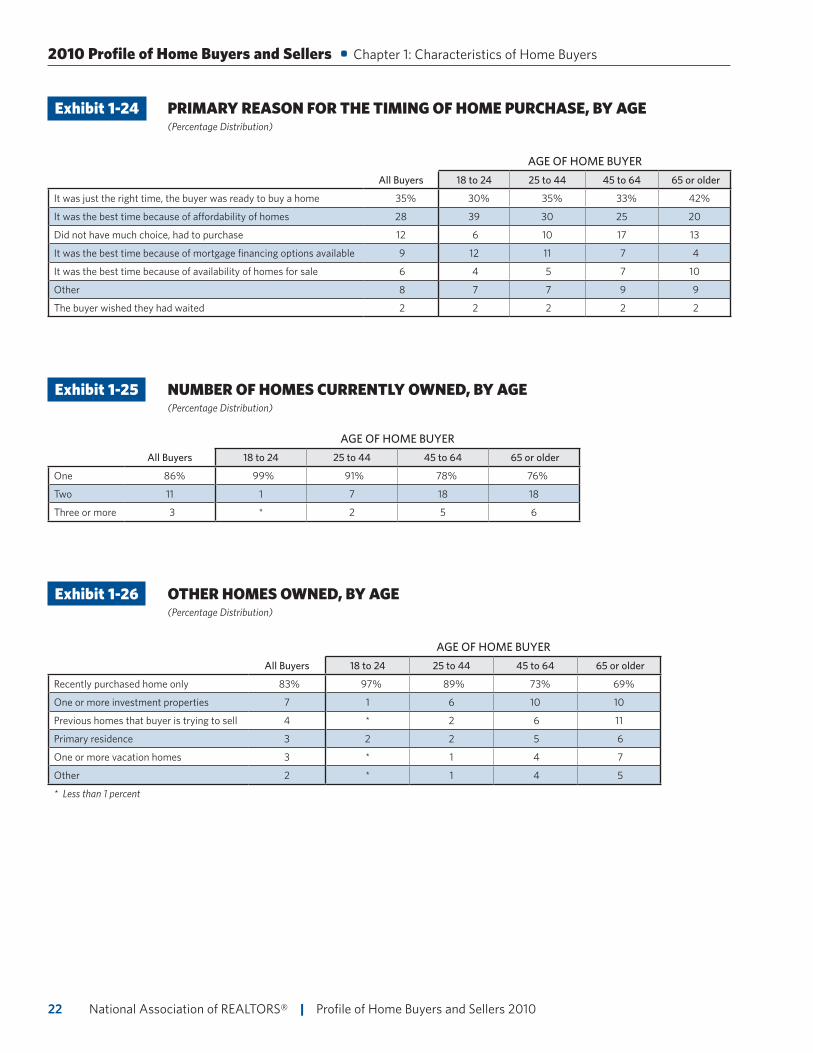
The home buyer tax credit was also a significant motivation for those aged 18 to 24, with 17 percent of buyers citing it as their primary reason for buying a home. For buyers aged 25 to 44, the home buyer tax credit and the desire for a larger home were the primary reasons behind the desire to own a home of their own. For buyers aged 45 to 64, a job-related relocation or move was the second most cited reason for buying a home now. The desire to own a home is the most frequent reason given for a home purchase among all age groups except those 65 or older. Buyers aged 65 or over responded most often that the desire to be closer to family is the primary reason for the purchase.
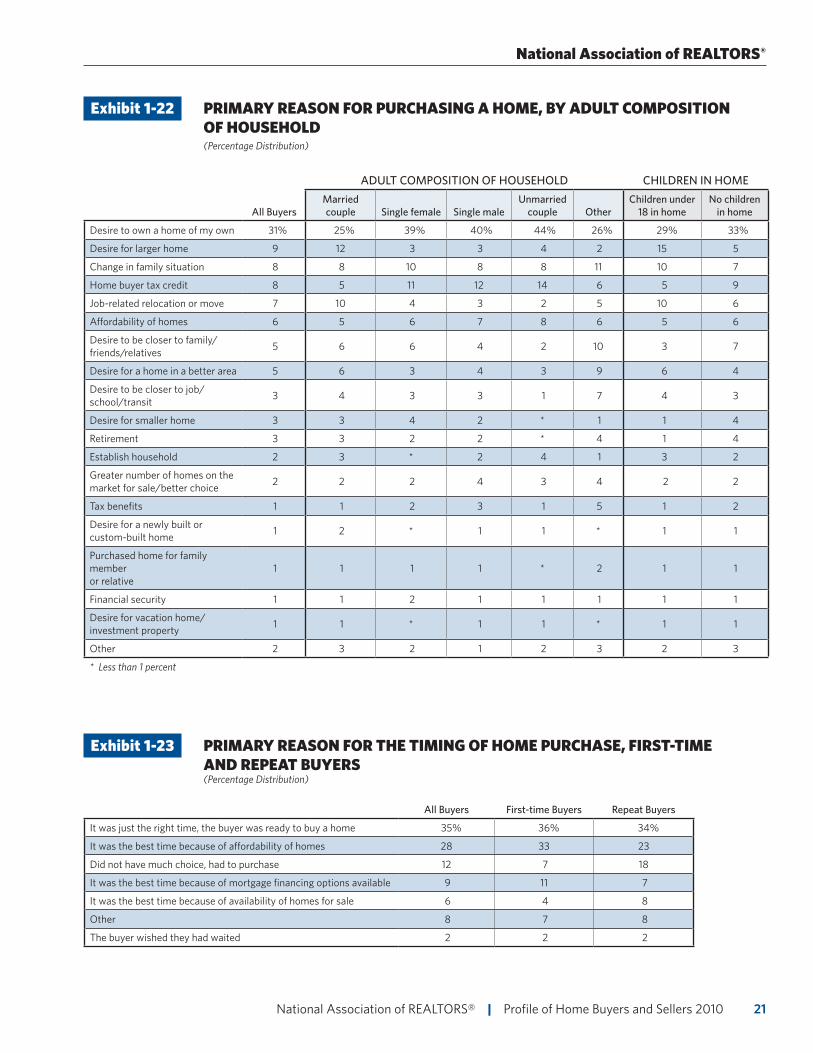
For married couples and families with children under the age of 18 in the home, the desire to own a larger home was the second most frequently reported reason given for a home purchase. For singles, unmarried couples, and those without children in the household, the home buyer tax credit was the second most cited reason for buying a home.
The primary reason for the timing of the home purchase remains that it was just the right time to buy and the buyer was ready to buy a home. Affordability as a motivator has increased among first-time and repeat buyers and for buyers under 44 years of age. Among first-time buyers, especially as the primary reason for the timing of the home purchase, up from 27 percent in 2009. The number one reason for buyers aged 18 to 24 is now affordability of home - 39 percent of buyers cited this reason, up from 26 percent in 2009.
OWNERSHIP OF MULTIPLE HOMES
• Exhibits 1-25 through 1-26
Fourteen percent of recent home buyers own more than one home. Owning a second or third home is most common among buyers aged 65 or older. Ninety-nine percent of buyers aged 18 to 24 own only one home whereas only 76 percent of buyers aged 65 or older own just one home. One in ten buyers 45 or older owns an investment property in addition to the home they recently purchased.
National Association of REALTORS®
National Association of REALTORS® | Profile of Home Buyers and Sellers 201012
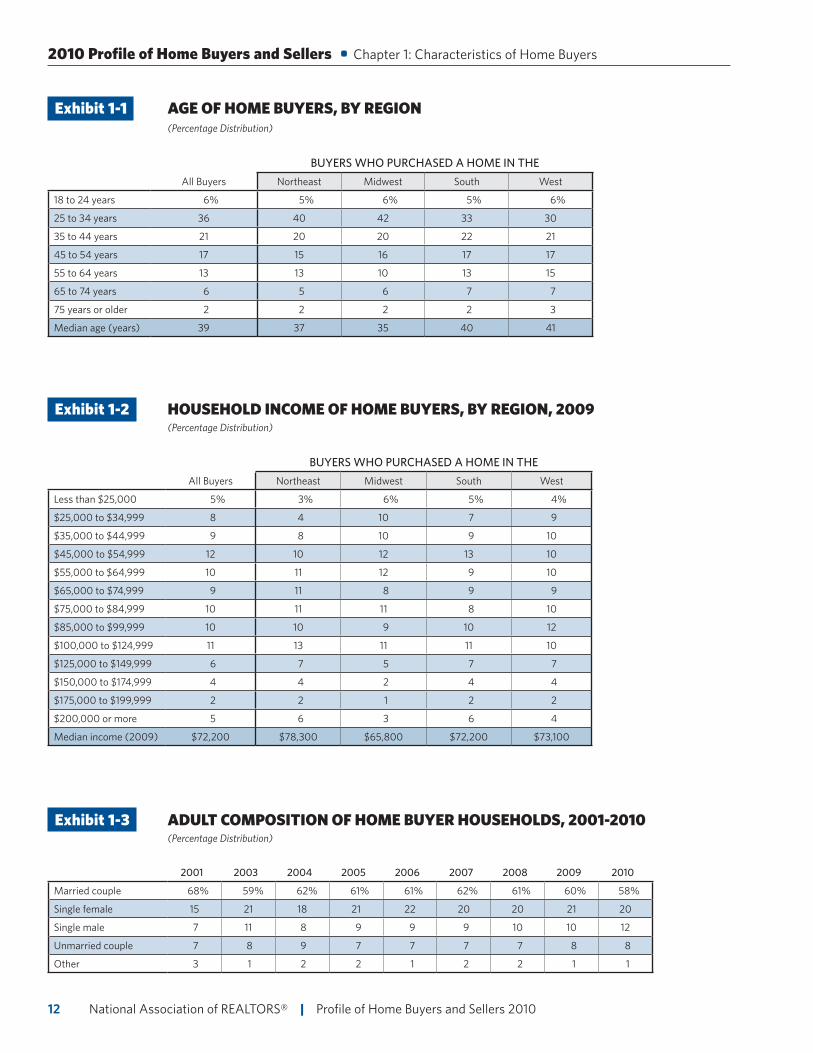
Exhibit 1-1 AGE OF HOME BUYERS, BY REGION (Percentage Distribution)
BUYERS WHO PURCHASED A HOME IN THE
All Buyers Northeast Midwest South West
18 to 24 years 6% 5% 6% 5% 6%
25 to 34 years 36 40 42 33 30
35 to 44 years 21 20 20 22 21
45 to 54 years 17 15 16 17 17
55 to 64 years 13 13 10 13 15
65 to 74 years 6 5 6 7 7
75 years or older 2 2 2 2 3
Median age (years) 39 37 35 40 41
Exhibit 1-2 HOUSEHOLD INCOME OF HOME BUYERS, BY REGION, 2009 (Percentage Distribution)
BUYERS WHO PURCHASED A HOME IN THE
All Buyers Northeast Midwest South West
Less than $25,000 5% 3% 6% 5% 4%
$25,000 to $34,999 8 4 10 7 9
$35,000 to $44,999 9 8 10 9 10
$45,000 to $54,999 12 10 12 13 10
$55,000 to $64,999 10 11 12 9 10
$65,000 to $74,999 9 11 8 9 9
$75,000 to $84,999 10 11 11 8 10
$85,000 to $99,999 10 10 9 10 12
$100,000 to $124,999 11 13 11 11 10
$125,000 to $149,999 6 7 5 7 7
$150,000 to $174,999 4 4 2 4 4
$175,000 to $199,999 2 2 1 2 2
$200,000 or more 5 6 3 6 4
Median income (2009) $72,200 $78,300 $65,800 $72,200 $73,100
Exhibit 1-3 ADULT COMPOSITION OF HOME BUYER HOUSEHOLDS, 2001-2010 (Percentage Distribution)
2001 2003 2004 2005 2006 2007 2008 2009 2010
Married couple 68% 59% 62% 61% 61% 62% 61% 60% 58%
Single female 15 21 18 21 22 20 20 21 20
Single male 7 11 8 9 9 9 10 10 12
Unmarried couple 7 8 9 7 7 7 7 8 8
Other 3 1 2 2 1 2 2 1 1
2010 Profile of Home Buyers and Sellers • Chapter 1: Characteristics of Home Buyers
13 National Association of REALTORS® | Profile of Home Buyers and Sellers 2010
Exhibit 1-4 NUMBER OF CHILDREN UNDER THE AGE OF 18 RESIDING IN HOUSEHOLD (Percentage Distribution of Households)
None65%
Two13%
Three ormore6%
One16%
None65%
Two13%
Three ormore6%
One16%
Exhibit 1-5 RACE/ETHNICITY OF HOME BUYERS, BY REGION (Percent of Respondents)
BUYERS WHO PURCHASED A HOME IN THE
All Buyers Northeast Midwest South West
White/Caucasian 82% 88% 92% 79% 74%
Black/African-American 6 4 3 9 3
Hispanic/Latino 6 3 2 7 10
Asian/Pacific Islander 5 4 3 4 11
Other 2 2 1 2 3
Note: Respondents were permitted to select as many races and ethnicities as they felt applicable.
The percentage distribution may therefore sum to more than 100 percent.
Exhibit 1-6 RACE/ETHNICITY OF HOME BUYERS, BY ADULT COMPOSITION OF HOUSEHOLD (Percent of Respondents)
ADULT COMPOSITION OF HOUSEHOLD CHILDREN IN HOME
All Buyers Married couple Single female Single maleUnmarried
couple OtherChildren under
18 in homeNo children in
home
White/Caucasian 82% 83% 81% 82% 84% 67% 77% 85%
Black/African-American 6 4 11 7 3 5 7 5
Hispanic/Latino 6 6 5 6 9 11 8 5
Asian/Pacific Islander 5 6 4 4 4 15 7 5
Other 2 2 1 2 2 8 2 2
Note: Respondents were permitted to select as many races and ethnicities as they felt applicable.
The percentage distribution may therefore sum to more than 100 percent.
National Association of REALTORS®
National Association of REALTORS® | Profile of Home Buyers and Sellers 201014
Exhibit 1-7 PRIMARY LANGUAGE SPOKEN IN HOME BUYER HOUSEHOLD, BY REGION (Percentage Distribution)
BUYERS WHO PURCHASED A HOME IN THE
All Buyers Northeast Midwest South West
English 95% 95% 98% 95% 91%
Other 5 5 2 5 9
Exhibit 1-8 NATIONAL ORIGIN OF HOME BUYERS, BY REGION (Percentage Distribution)
BUYERS WHO PURCHASED A HOME IN THE
All Buyers Northeast Midwest South West
Born in U.S. 90% 90% 94% 90% 83%
Not born in U.S. 10 10 6 10 17
Exhibit 1-9 FIRST-TIME HOME BUYERS (Percent of all Home Buyers)
55%
50%
45%
40%
35%
2001
30%
25%
20%
60%
2003 2004 2005 2006 2007 2008 2009 2010
42%40% 40% 40%
36%
39%41%
47%
50%
2010 Profile of Home Buyers and Sellers • Chapter 1: Characteristics of Home Buyers
Single male15%
Married couple48% Single male
15%
Married couple48%
Single female23%
Unmarried couple 12%
Other 1%
Single male9%
Married couple68% Single female
17%
Unmarried couple 4%
Other 1%
15 National Association of REALTORS® | Profile of Home Buyers and Sellers 2010
Single male15%
Married couple48% Single male
15%
Married couple48%
Single female23%
Unmarried couple 12%
Other 1%
Single male9%
Married couple68% Single female
17%
Unmarried couple 4%
Other 1%
Exhibit 1-10 FIRST-TIME HOME BUYERS, BY REGION (Percent of all Home Buyers)
55%
50%
45%
40%
35%
All Buyers
30%
25%
20%
60%
Northeast Midwest South West
50%
56%
51%
46%
52% All Buyers 50%Northeast 56%Midwest 51%South 46%West 52%
Exhibit 1-11 FIRST-TIME AND REPEAT HOME BUYERS BY HOUSEHOLD TYPE (Percentage Distribution)
National Association of REALTORS®
FIRST-TIME HOME BUYERS
REPEAT HOME BUYERS
National Association of REALTORS® | Profile of Home Buyers and Sellers 201016
Exhibit 1-12 FIRST-TIME AND REPEAT HOME BUYERS BY CHILDREN IN HOUSEHOLD (Percentage Distribution)
Two11%
One18%
Three ormore4%
None68%
None63%
One13%
Two16%
Three ormore7%
FIRST-TIME HOME BUYERS
REPEAT HOME BUYERS
2010 Profile of Home Buyers and Sellers • Chapter 1: Characteristics of Home Buyers
17 National Association of REALTORS® | Profile of Home Buyers and Sellers 2010
Exhibit 1-13 AGE OF FIRST-TIME AND REPEAT BUYERS (Percentage Distribution)
All Buyers First-time Buyers Repeat Buyers
18 to 24 years 6% 11% *
25 to 34 years 36 56 15
35 to 44 years 21 19 23
45 to 54 years 17 10 24
55 to 64 years 13 4 22
65 to 74 years 6 1 12
75 years or older 2 * 4
Median age (years) 39 30 49
Married couple 39 30 48
Single female 41 32 53
Single male 41 31 53
Unmarried couple 30 28 45
Other 44 36 53
* Less than 1 percent
Exhibit 1-14 HOUSEHOLD INCOME OF FIRST-TIME AND REPEAT BUYERS, 2009 (Percentage Distribution)
All Buyers First-time Buyers Repeat Buyers
Less than $25,000 5% 6% 3%
$25,000 to $34,999 8 11 5
$35,000 to $44,999 9 13 6
$45,000 to $54,999 12 15 8
$55,000 to $64,999 10 12 8
$65,000 to $74,999 9 9 8
$75,000 to $84,999 10 10 10
$85,000 to $99,999 10 9 11
$100,000 to $124,999 11 8 15
$125,000 to $149,999 6 4 9
$150,000 to $174,999 4 2 5
$175,000 to $199,999 2 1 3
$200,000 or more 5 1 8
Median income (2009) $72,200 $59,900 $87,000
Married couple $84,400 $71,200 $98,700
Single female $50,600 $46,100 $57,700
Single male $54,900 $52,800 $61,100
Unmarried couple $69,700 $62,600 $97,200
Other $57,300 $43,900 $77,500
National Association of REALTORS®
National Association of REALTORS® | Profile of Home Buyers and Sellers 201018
Exhibit 1-15 RACE/ETHNICITY OF FIRST-TIME AND REPEAT BUYERS (Percent of Respondents)
All Buyers First-time Buyers Repeat Buyers
White/Caucasian 82% 76% 88%
Black/African-American 6 7 4
Hispanic/Latino 6 8 4
Asian/Pacific Islander 5 7 3
Other 2 2 2
Note: Respondents were permitted to select as many races and ethnicities as they felt applicable.
The percentage distribution may therefore sum to more than 100 percent.
Exhibit 1-16 PRIMARY LANGUAGE SPOKEN IN FIRST-TIME AND REPEAT BUYER HOUSEHOLDS (Percentage Distribution)
All Buyers First-time Buyers Repeat Buyers
English 95% 92% 97%
Other 5 8 3
Exhibit 1-17 NATIONAL ORIGIN OF FIRST-TIME AND REPEAT BUYERS (Percentage Distribution)
All Buyers First-time Buyers Repeat Buyers
Born in U.S. 90% 87% 92%
Not born in U.S. 10 13 8
Exhibit 1-18 PRIOR LIVING ARRANGEMENT OF FIRST-TIME AND REPEAT BUYERS (Percentage Distribution)
All Buyers First-time Buyers Repeat Buyers
Rented an apartment or house 49% 75% 24%
Owned previous residence 35 2 67
Lived with parents, relatives or friends 13 21 5
No change in living arrangement 2 1 3
Rented the home buyer ultimately purchased 1 1 1
Note: After selling their previous home, buyers may have rented a home or apartment before purchasing their next home. A first-time buyer could have acquired ownership of their previous home(as an inheritance or gift, for example) without having been the buyer of the home. Thus, a first-time buyer could have owned a home prior to their first home purchase.
2010 Profile of Home Buyers and Sellers • Chapter 1: Characteristics of Home Buyers
19 National Association of REALTORS® | Profile of Home Buyers and Sellers 2010
Exhibit 1-19 PRIOR LIVING ARRANGEMENT, BY ADULT COMPOSITION OF HOUSEHOLD (Percentage Distribution)
ADULT COMPOSITION OF HOUSEHOLD CHILDREN IN HOME
All Buyers Married couple Single female Single maleUnmarried
couple OtherChildren under
18 in homeNo children in
home
Rented an apartment or house 49% 45% 52% 55% 67% 40% 51% 49%
Owned previous residence 35 43 26 21 15 30 36 33
Lived with parents, rela-tives or friends 13 8 20 21 17 26 10 15
No change in living arrangement 2 2 1 2 1 3 1 2
Rented the home buyer ultimately purchased 1 1 1 1 * 1 1 1
* Less than 1 percent
Note: After selling their previous home, buyers may have rented a home or apartment before purchasing their next home. A first-time buyer could have acquired ownership of their previous home (as an inheritance or gift, for example) without having been the buyer of the home. Thus, a first-time buyer could have owned a home prior to their first home purchase.
Exhibit 1-20 PRIMARY REASON FOR PURCHASING A HOME, FIRST-TIME AND REPEAT BUYERS (Percentage Distribution)
All Buyers First-time Buyers Repeat Buyers
Desire to own a home of my own 31% 53% 10%
Desire for larger home 9 2 15
Change in family situation 8 7 10
Home buyer tax credit 8 13 3
Job-related relocation or move 7 2 12
Affordability of homes 6 8 4
Desire to be closer to family/friends/relatives 5 1 10
Desire for a home in a better area 5 2 7
Desire to be closer to job/school/transit 3 2 5
Desire for smaller home 3 * 5
Retirement 3 * 5
Establish household 2 4 1
Greater number of homes on the market for sale/better choice 2 3 2
Tax benefits 1 2 1
Desire for a newly built or custom-built home 1 * 2
Purchased home for family member or relative 1 1 1
Financial security 1 1 1
Desire for vacation home/investment property 1 * 1
Other 2 1 4
* Less than 1 percent
National Association of REALTORS®
National Association of REALTORS® | Profile of Home Buyers and Sellers 201020
Exhibit 1-21 PRIMARY REASON FOR PURCHASING A HOME, BY AGE (Percentage Distribution)
AGE OF HOME BUYER
All Buyers 18 to 24 25 to 44 45 to 64 65 or older
Desire to own a home of my own 31% 46% 39% 21% 10%
Desire for larger home 9 1 10 8 3
Change in family situation 8 9 8 9 8
Home buyer tax credit 8 17 10 5 2
Job-related relocation or move 7 2 7 10 *
Affordability of homes 6 9 6 5 5
Desire to be closer to family/friends/relatives 5 1 2 7 28
Desire for a home in a better area 5 1 4 6 5
Desire to be closer to job/school/transit 3 3 3 4 1
Desire for smaller home 3 * * 5 12
Retirement 3 N/A N/A 5 10
Establish household 2 4 3 1 1
Greater number of homes on the market for sale/better choice 2 3 3 2 1
Tax benefits 1 1 1 2 1
Desire for a newly built or custom-built home 1 * 1 2 2
Purchased home for family member or relative 1 * 1 1 2
Financial security 1 1 1 2 1
Desire for vacation home/investment property 1 1 * 1 2
Other 2 1 1 4 6
* Less than 1 percent
N/A- not applicable
2010 Profile of Home Buyers and Sellers • Chapter 1: Characteristics of Home Buyers
21 National Association of REALTORS® | Profile of Home Buyers and Sellers 2010
Exhibit 1-22 PRIMARY REASON FOR PURCHASING A HOME, BY ADULT COMPOSITION OF HOUSEHOLD (Percentage Distribution)
ADULT COMPOSITION OF HOUSEHOLD CHILDREN IN HOME
All BuyersMarried couple Single female Single male
Unmarried couple Other
Children under 18 in home
No children in home
Desire to own a home of my own 31% 25% 39% 40% 44% 26% 29% 33%
Desire for larger home 9 12 3 3 4 2 15 5
Change in family situation 8 8 10 8 8 11 10 7
Home buyer tax credit 8 5 11 12 14 6 5 9
Job-related relocation or move 7 10 4 3 2 5 10 6
Affordability of homes 6 5 6 7 8 6 5 6
Desire to be closer to family/friends/relatives 5 6 6 4 2 10 3 7
Desire for a home in a better area 5 6 3 4 3 9 6 4
Desire to be closer to job/ school/transit 3 4 3 3 1 7 4 3
Desire for smaller home 3 3 4 2 * 1 1 4
Retirement 3 3 2 2 * 4 1 4
Establish household 2 3 * 2 4 1 3 2
Greater number of homes on the market for sale/better choice 2 2 2 4 3 4 2 2
Tax benefits 1 1 2 3 1 5 1 2
Desire for a newly built or custom-built home 1 2 * 1 1 * 1 1
Purchased home for family member or relative
1 1 1 1 * 2 1 1
Financial security 1 1 2 1 1 1 1 1
Desire for vacation home/ investment property 1 1 * 1 1 * 1 1
Other 2 3 2 1 2 3 2 3
* Less than 1 percent
Exhibit 1-23 PRIMARY REASON FOR THE TIMING OF HOME PURCHASE, FIRST-TIME AND REPEAT BUYERS (Percentage Distribution)
All Buyers First-time Buyers Repeat Buyers
It was just the right time, the buyer was ready to buy a home 35% 36% 34%
It was the best time because of affordability of homes 28 33 23
Did not have much choice, had to purchase 12 7 18
It was the best time because of mortgage financing options available 9 11 7
It was the best time because of availability of homes for sale 6 4 8
Other 8 7 8
The buyer wished they had waited 2 2 2
National Association of REALTORS®
National Association of REALTORS® | Profile of Home Buyers and Sellers 201022
Exhibit 1-24 PRIMARY REASON FOR THE TIMING OF HOME PURCHASE, BY AGE (Percentage Distribution)
AGE OF HOME BUYER
All Buyers 18 to 24 25 to 44 45 to 64 65 or older
It was just the right time, the buyer was ready to buy a home 35% 30% 35% 33% 42%
It was the best time because of affordability of homes 28 39 30 25 20
Did not have much choice, had to purchase 12 6 10 17 13
It was the best time because of mortgage financing options available 9 12 11 7 4
It was the best time because of availability of homes for sale 6 4 5 7 10
Other 8 7 7 9 9
The buyer wished they had waited 2 2 2 2 2
Exhibit 1-25 NUMBER OF HOMES CURRENTLY OWNED, BY AGE (Percentage Distribution)
AGE OF HOME BUYER
All Buyers 18 to 24 25 to 44 45 to 64 65 or older
One 86% 99% 91% 78% 76%
Two 11 1 7 18 18
Three or more 3 * 2 5 6
Exhibit 1-26 OTHER HOMES OWNED, BY AGE (Percentage Distribution)
AGE OF HOME BUYER
All Buyers 18 to 24 25 to 44 45 to 64 65 or older
Recently purchased home only 83% 97% 89% 73% 69%
One or more investment properties 7 1 6 10 10
Previous homes that buyer is trying to sell 4 * 2 6 11
Primary residence 3 2 2 5 6
One or more vacation homes 3 * 1 4 7
Other 2 * 1 4 5
* Less than 1 percent
2010 Profile of Home Buyers and Sellers • Chapter 1: Characteristics of Home Buyers
23 National Association of REALTORS® | Profile of Home Buyers and Sellers 2010
Chapter 2: Characteristics of Homes Purchased
While the housing market has had many changes due to the recession, the type of home a buyer is looking for has not changed drastically. Most home buyers purchased a detached
single-family home in a suburban area.
One trend that has been affected by the recession is the increase in sales of previously owned homes compared to new homes. The typical home purchased in the survey period of mid-2009 through mid-2010 was smaller and less expensive than homes purchased in past years. However, when looking at the data closer, the trends remain. Repeat buyers purchase larger homes than first-time buyers and new homes are larger than previously owned homes. Eleven percent of recent home buyers over 50 years of age purchased a home in senior housing or an active adult community.
Once the buyer has moved in to their newly purchased home, they expect to live there for 10 years. Repeat buyers expect their tenure will be longer, while younger buyers expect their tenure to be shorter.
National Association of REALTORS® | Profile of Home Buyers and Sellers 201024
2010 Profile of Home Buyers and Sellers • Chapter 2: Characteristics of Homes Purchased
NEW AND PREVIOUSLY OWNED HOMES PURCHASED
• Exhibits 2-1 and 2-2
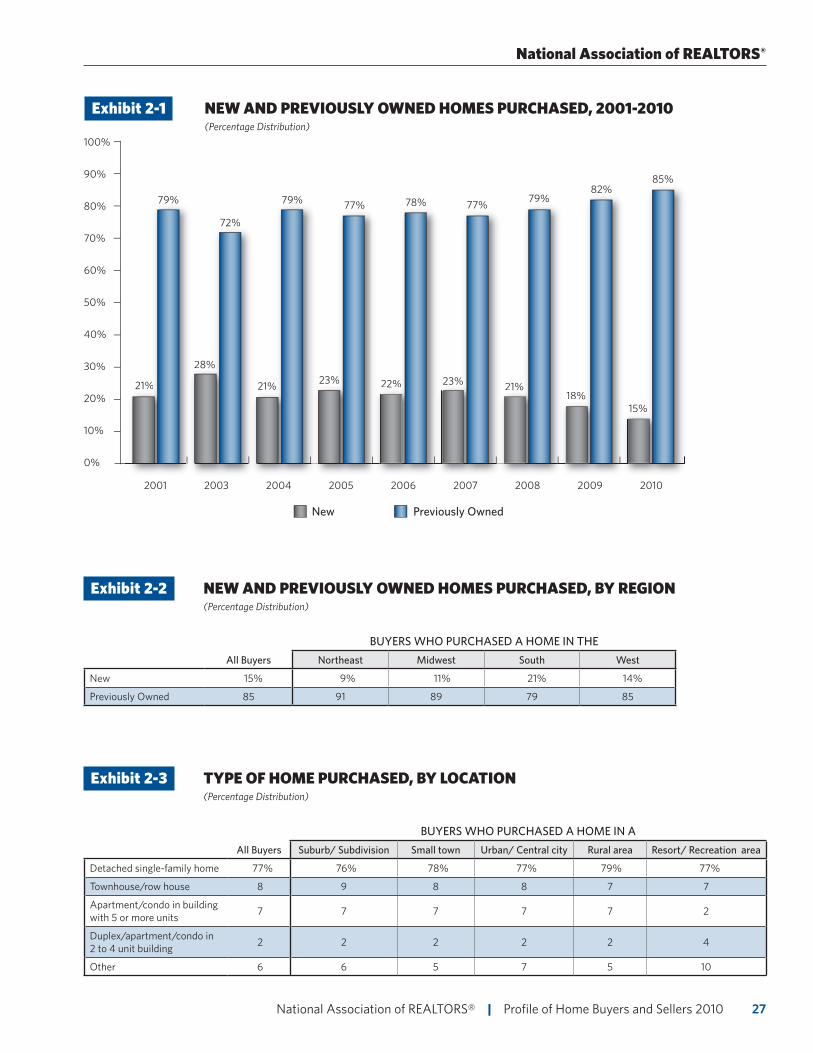
Since 2007, a trend has arisen where new home sales occupy a smaller share of homes sold. New home sales typically accounted for 21 to 28 percent of homes sold, however in the past two years the share has dipped into the teens. In 2010, 15 percent of homes sold were new homes. In part, this is due to declines in new home construction during the recession.
Regionally, the share of previously owned homes varies quite significantly. The South and West, continuing a several-year trend, have higher shares of new homes sold, while the Northeast and Midwest typically fall under the national share.
TYPE OF HOME PURCHASED
• Exhibits 2-3 through 2-5
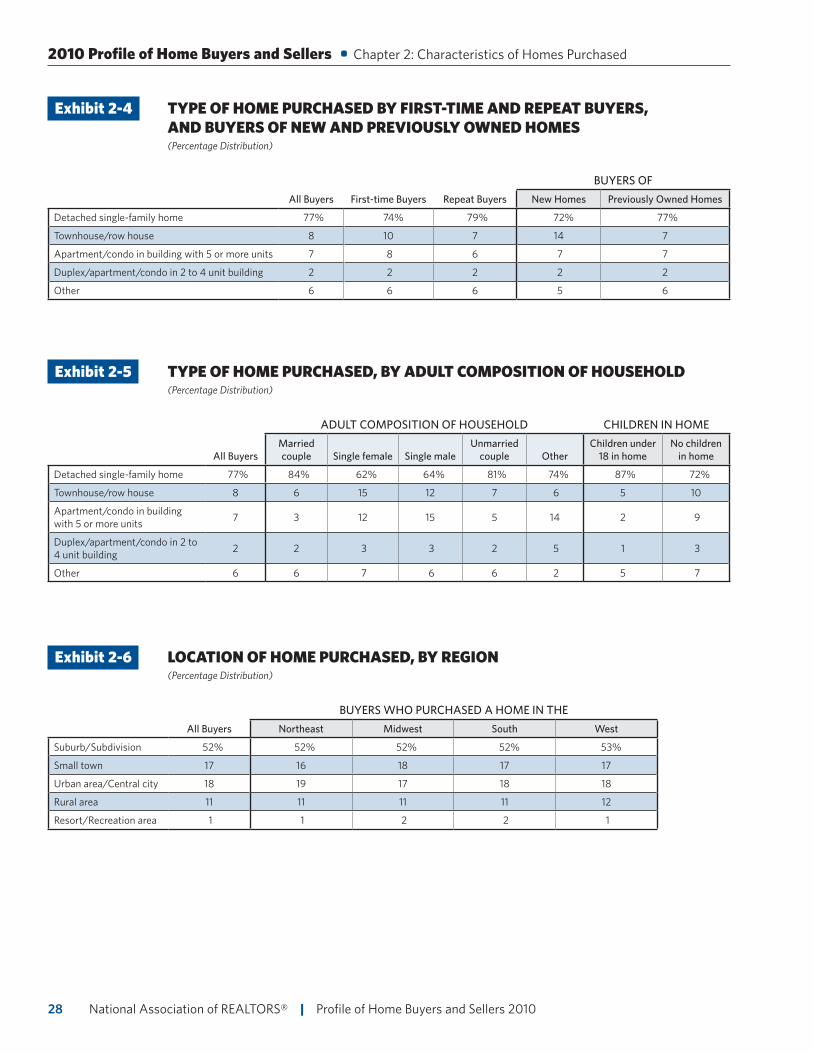
Detached single family homes continue to be the most popular type of home purchased, accounting for 77 percent of the home buying market. Eight percent of buyer households purchased a townhouse or row house and 9 percent purchased a condo.
First-time home buyers and buyers purchasing new homes are slightly more likely to purchase a townhouse than other home buyers. Single buyers and buyers without children in the home are more likely to purchase a townhouse or a condo than other home buyers. More than eight in ten married couples, unmarried couples, and buyers with children under 18 purchase a detached single-family home.
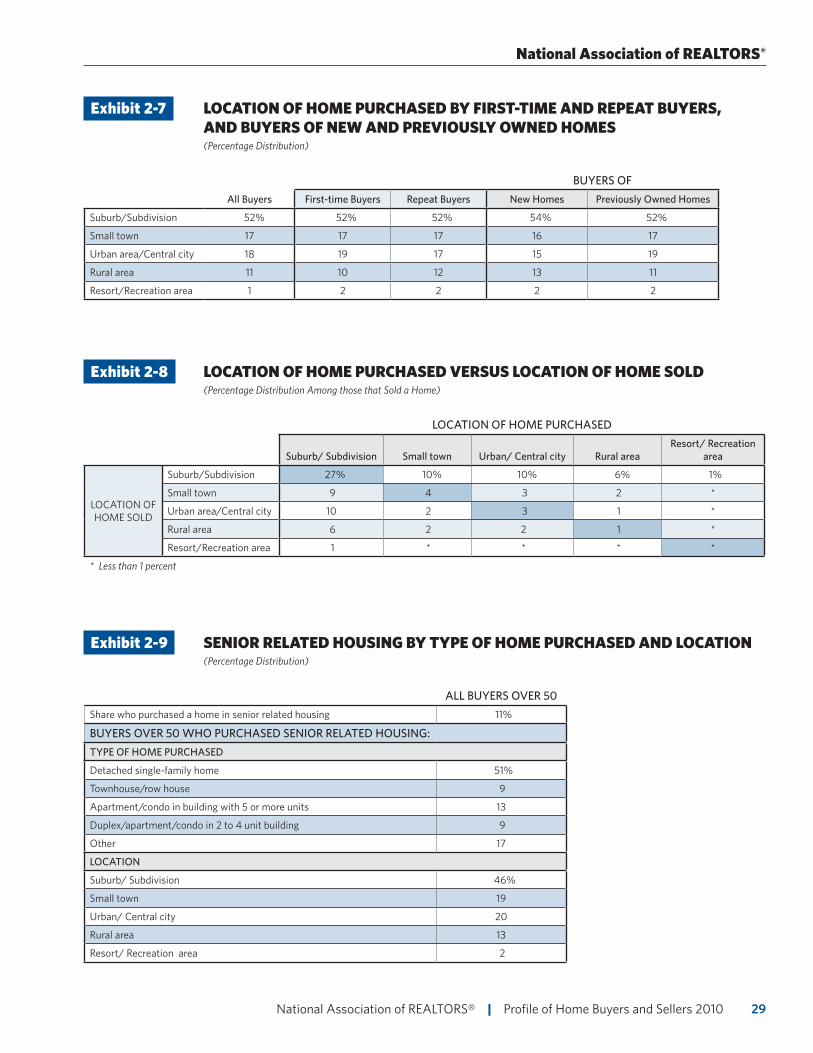
LOCATION OF HOME PURCHASED
• Exhibits 2-6 through 2-8
More than half of buyers purchase a home in a suburb. Eighteen percent of buyers purchased in an urban area, 17 percent in a small town, and 11 percent purchased in a rural area. First-time buyers and buyers of previously owned homes were slightly more likely than other buyers to purchase in an urban area. Buyers of new homes and repeat buyers were slightly more likely to purchase in a rural area.
The highest share of repeat buyers, 27 percent, both purchased a home and sold a home in a suburban area. One in ten repeat buyers purchased in a suburb and sold a home in a urban area, while one in ten purchased in an urban area and sold in a suburb. One in ten repeat buyers sold in a suburb and moved to a small town.
SENIOR HOUSING AND ACTIVE ADULT COMMUNITIES
• Exhibit 2-9
Eleven percent of recent home buyers over 50 years of age purchased a home in senior-related housing or an active adult community. More than half of the homes purchased were detached single-family homes. Almost one-quarter were condos and 9 percent were townhouses. Most of the homes purchased were in the suburbs, but one in five was in a small town and one in five was in an urban area.
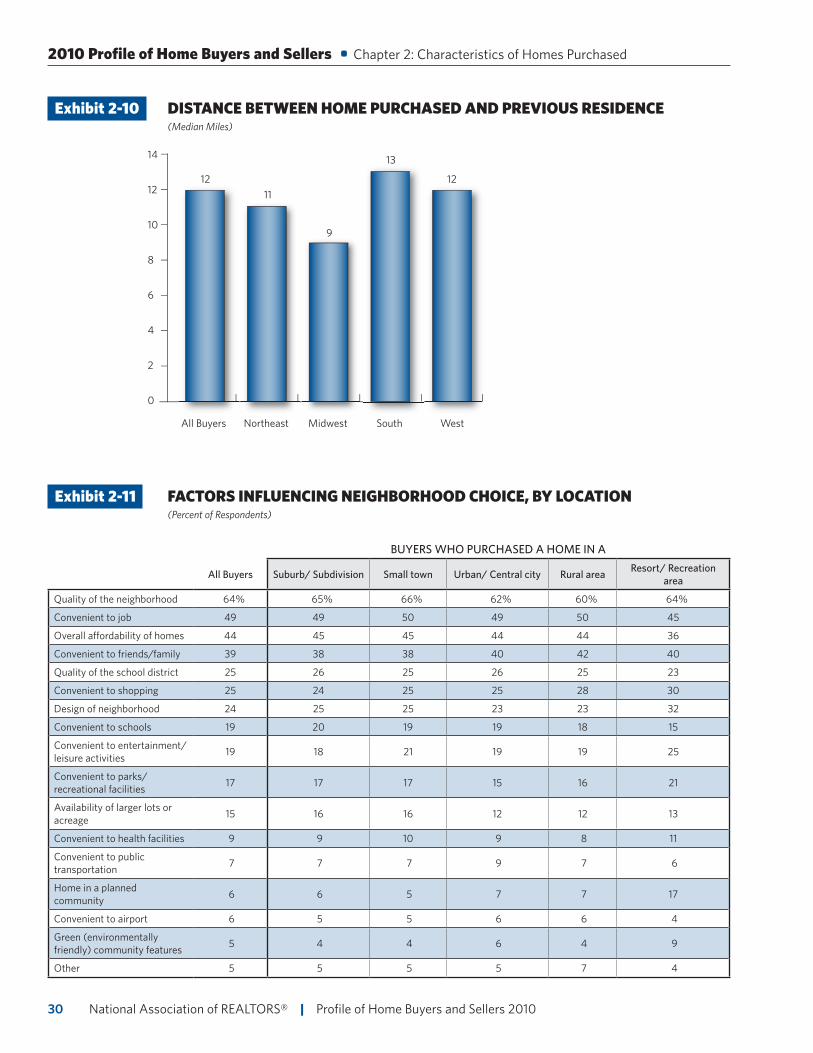
DISTANCE BETWEEN HOME PURCHASED AND PREVIOUS RESIDENCE
• Exhibit 2-10
Nationally, home buyers moved a median of 12 miles from their previous residence. There are slight regional differences. Buyers in the South moved a median of 13 miles from their previous residence, while buyers in the Midwest typically moved 9 miles.
25 National Association of REALTORS® | Profile of Home Buyers and Sellers 2010
National Association of REALTORS®
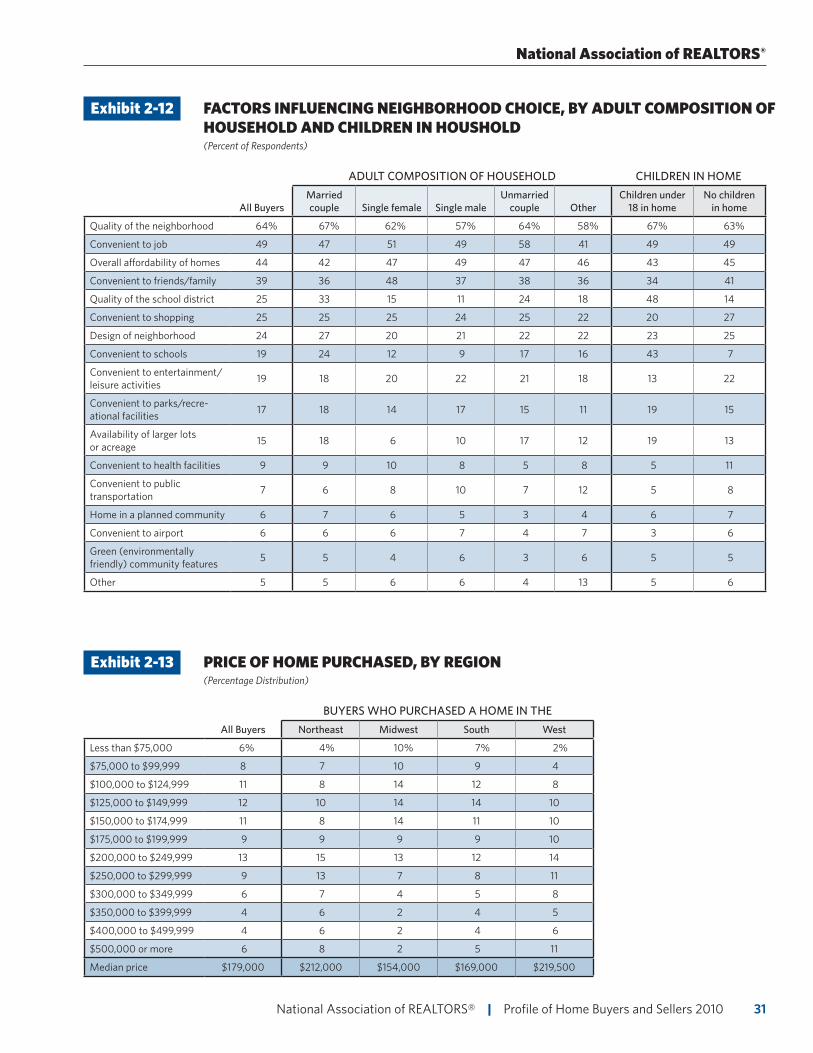
FACTORS INFLUENCING NEIGHBORHOOD CHOICE
• Exhibits 2-11 and 2-12
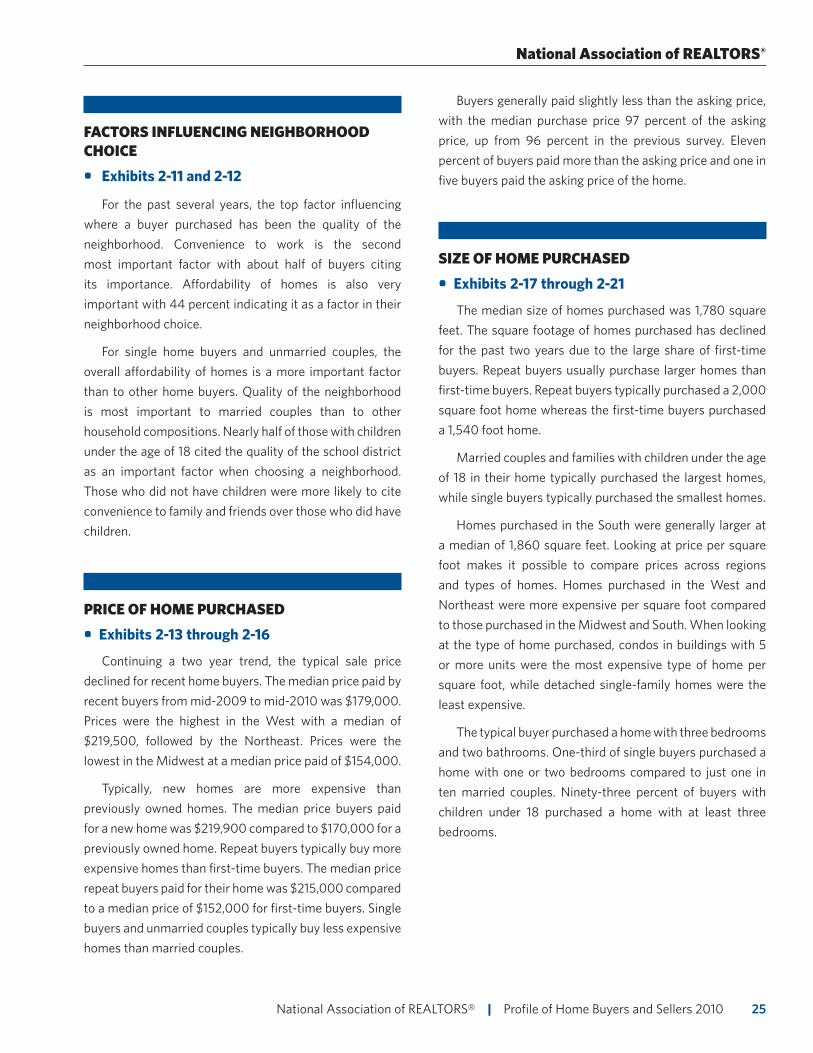
For the past several years, the top factor influencing where a buyer purchased has been the quality of the neighborhood. Convenience to work is the second most important factor with about half of buyers citing its importance. Affordability of homes is also very important with 44 percent indicating it as a factor in their neighborhood choice.
For single home buyers and unmarried couples, the overall affordability of homes is a more important factor than to other home buyers. Quality of the neighborhood is most important to married couples than to other household compositions. Nearly half of those with children under the age of 18 cited the quality of the school district as an important factor when choosing a neighborhood. Those who did not have children were more likely to cite convenience to family and friends over those who did have children.
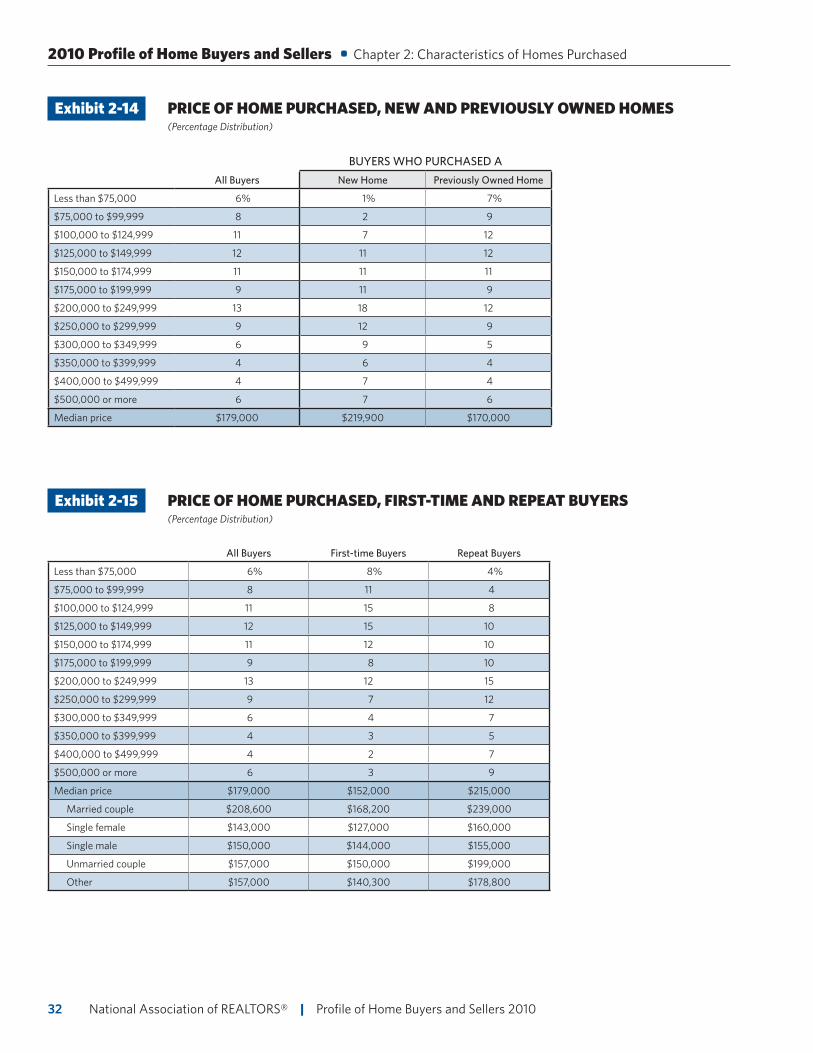
PRICE OF HOME PURCHASED
• Exhibits 2-13 through 2-16
Continuing a two year trend, the typical sale price declined for recent home buyers. The median price paid by recent buyers from mid-2009 to mid-2010 was $179,000. Prices were the highest in the West with a median of $219,500, followed by the Northeast. Prices were the lowest in the Midwest at a median price paid of $154,000.
Typically, new homes are more expensive than previously owned homes. The median price buyers paid for a new home was $219,900 compared to $170,000 for a previously owned home. Repeat buyers typically buy more expensive homes than first-time buyers. The median price repeat buyers paid for their home was $215,000 compared to a median price of $152,000 for first-time buyers. Single buyers and unmarried couples typically buy less expensive homes than married couples.
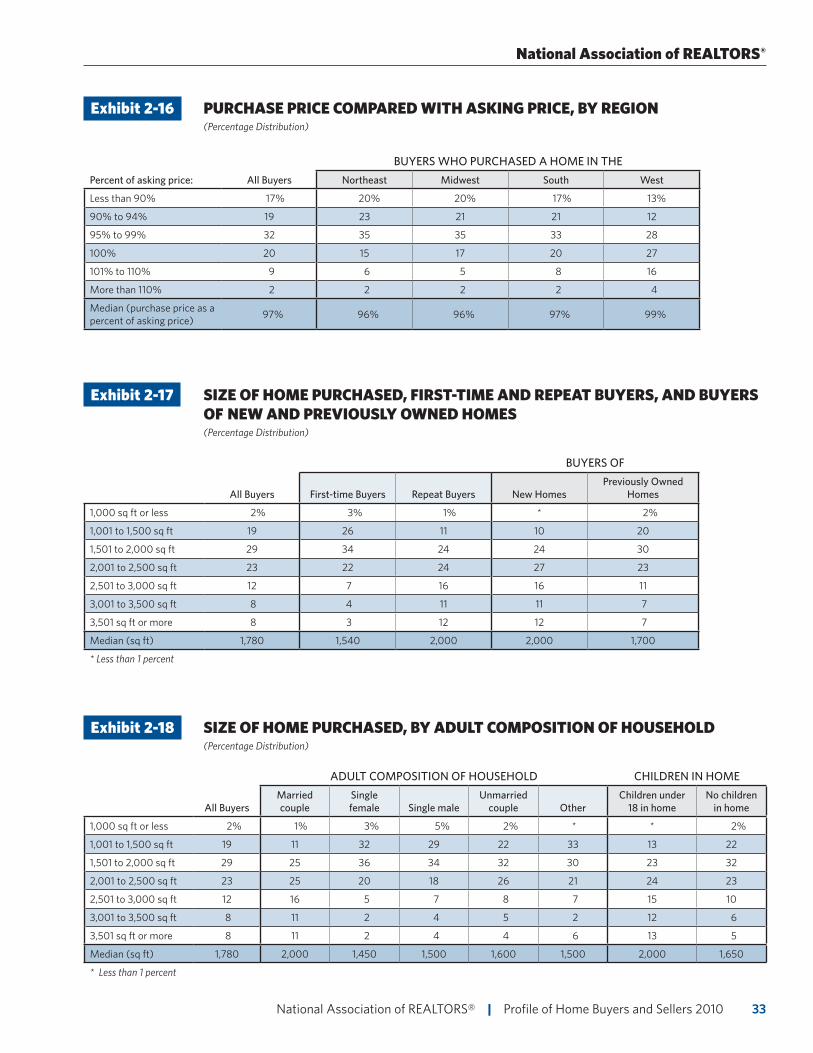
Buyers generally paid slightly less than the asking price, with the median purchase price 97 percent of the asking price, up from 96 percent in the previous survey. Eleven percent of buyers paid more than the asking price and one in five buyers paid the asking price of the home.
SIZE OF HOME PURCHASED
• Exhibits 2-17 through 2-21
The median size of homes purchased was 1,780 square feet. The square footage of homes purchased has declined for the past two years due to the large share of first-time buyers. Repeat buyers usually purchase larger homes than first-time buyers. Repeat buyers typically purchased a 2,000 square foot home whereas the first-time buyers purchased a 1,540 foot home.
Married couples and families with children under the age of 18 in their home typically purchased the largest homes, while single buyers typically purchased the smallest homes.
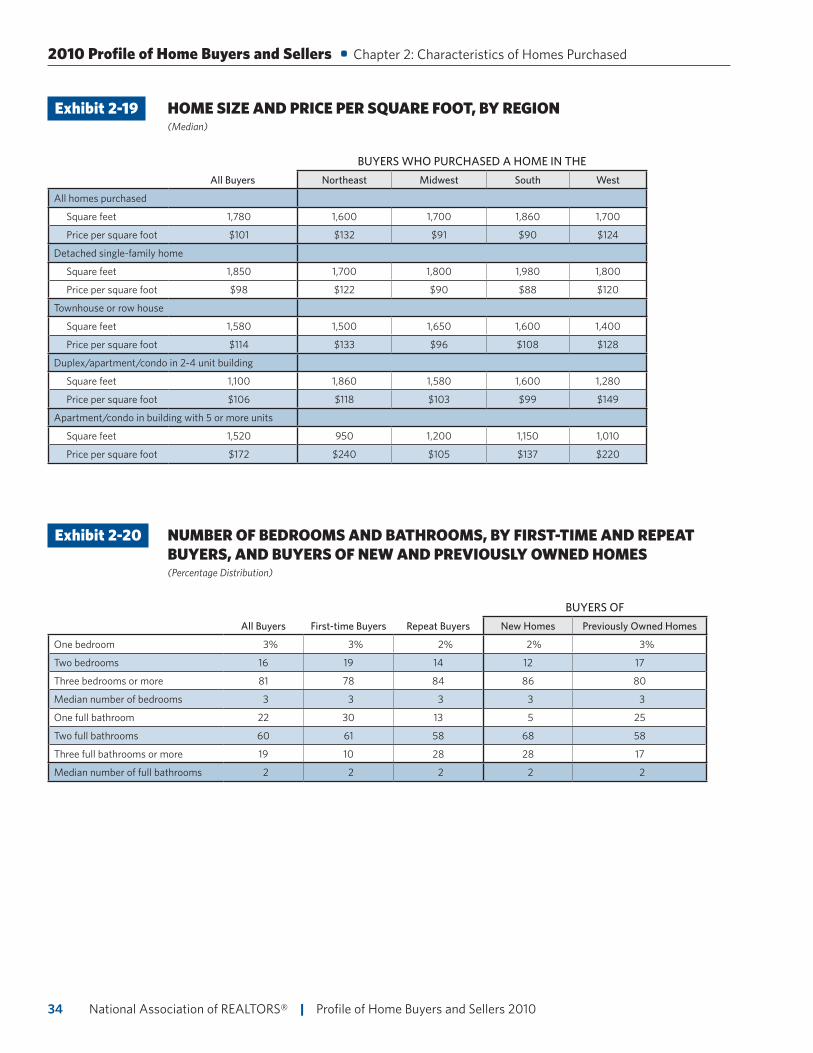
Homes purchased in the South were generally larger at a median of 1,860 square feet. Looking at price per square foot makes it possible to compare prices across regions and types of homes. Homes purchased in the West and Northeast were more expensive per square foot compared to those purchased in the Midwest and South. When looking at the type of home purchased, condos in buildings with 5 or more units were the most expensive type of home per square foot, while detached single-family homes were the least expensive.
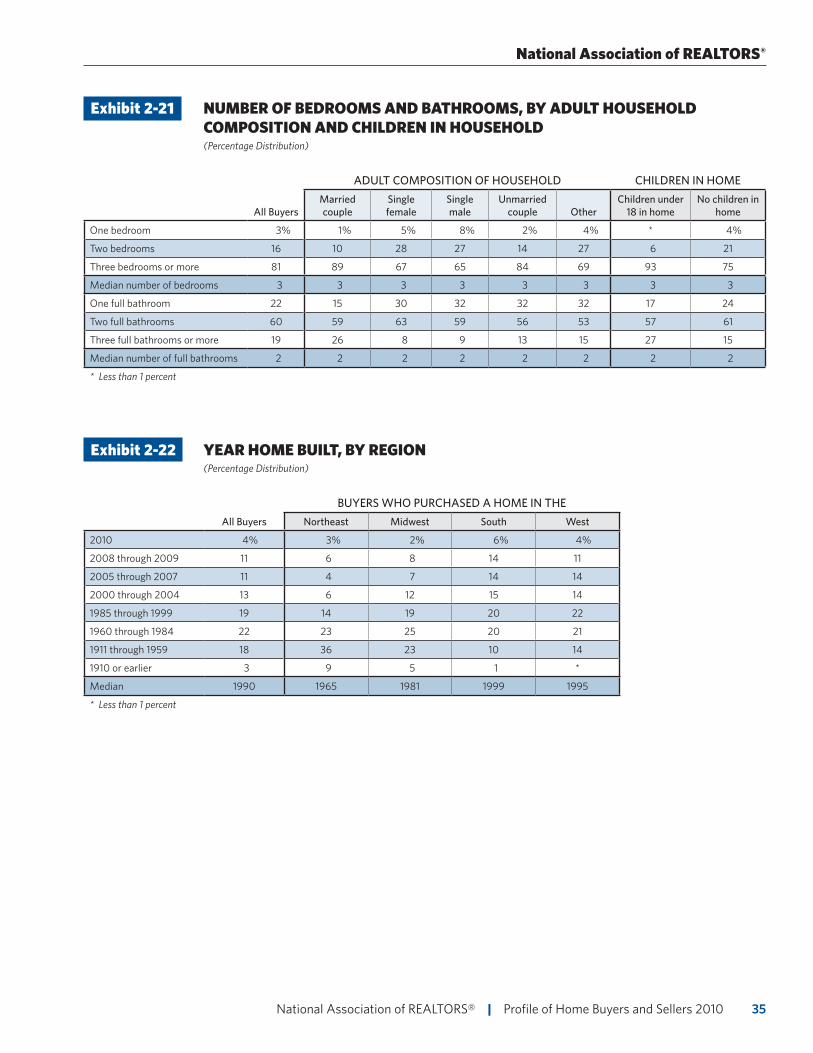
The typical buyer purchased a home with three bedrooms and two bathrooms. One-third of single buyers purchased a home with one or two bedrooms compared to just one in ten married couples. Ninety-three percent of buyers with children under 18 purchased a home with at least three bedrooms.
National Association of REALTORS® | Profile of Home Buyers and Sellers 201026
2010 Profile of Home Buyers and Sellers • Chapter 2: Characteristics of Homes Purchased
YEAR HOME WAS BUILT
• Exhibit 2-22
The typical home purchased was built in 1990. By region the age of homes varies sustainably. Homes in the South were typically the newest homes and built in 1999, which is not surprising due to the high percent of new home sales in the South. Homes in the Northeast were typically the oldest homes and built in 1965. Homes in the Midwest were typically built in 1981 and homes in the West in 1995.
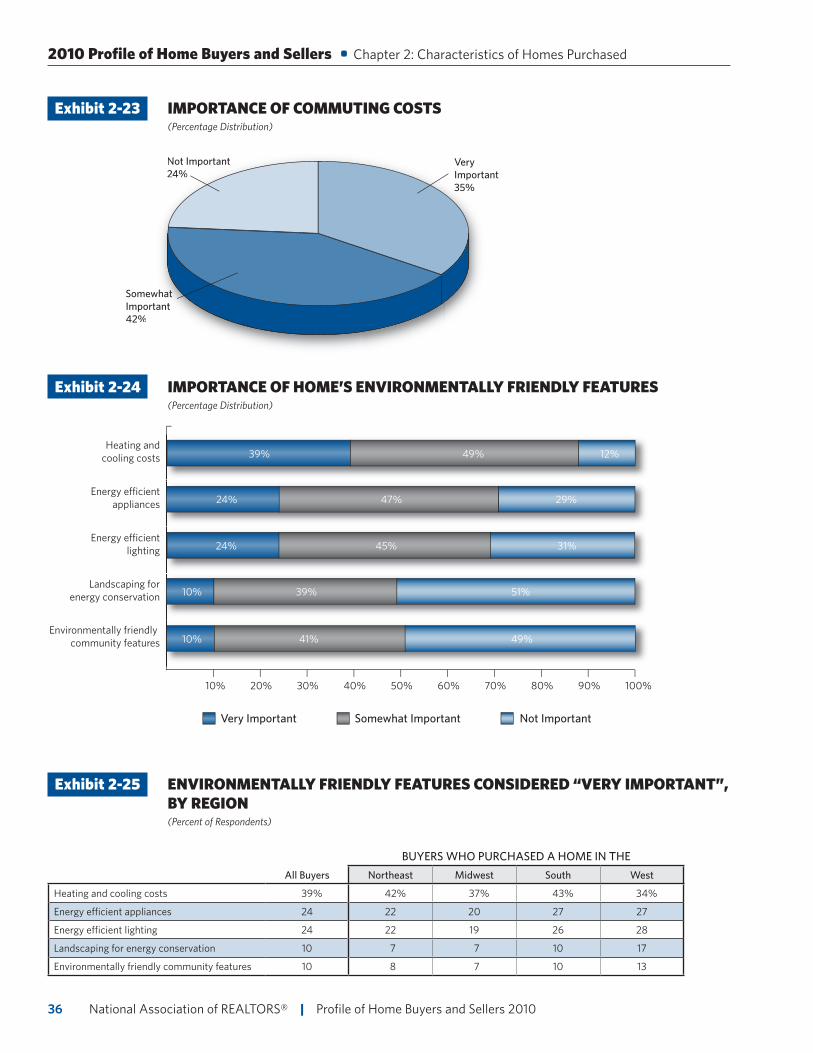
ENVIRONMENT FEATURES AND COMMUTING COSTS
• Exhibits 2-23 through 2-25
Commuting costs and environmental efficiency have increasingly factored into home buying decisions due to higher energy costs, but also as appeal of growing overall concern for the environment. Commuting costs were at least “somewhat” important to 76 percent of home buyers. Heating and cooling costs were at least “somewhat” important to 88 percent of home buyers. Energy efficient appliances and energy efficient lighting were “very” or “somewhat” important to a majority of home buyers.
By region, environmentally friendly features varied in importance. Heating and cooling cost are more important to buyers in the Northeast and the South than other regions. Energy efficient lighting and landscaping for energy conservation are more important to buyers in the West than other regions.
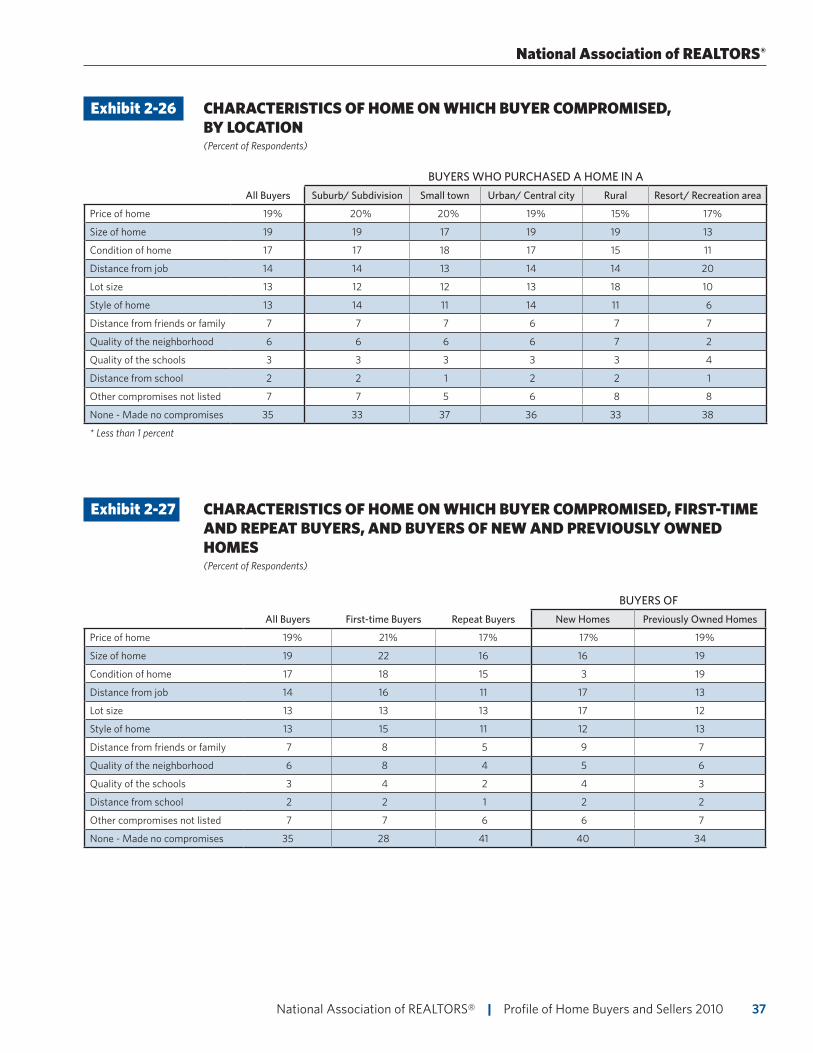
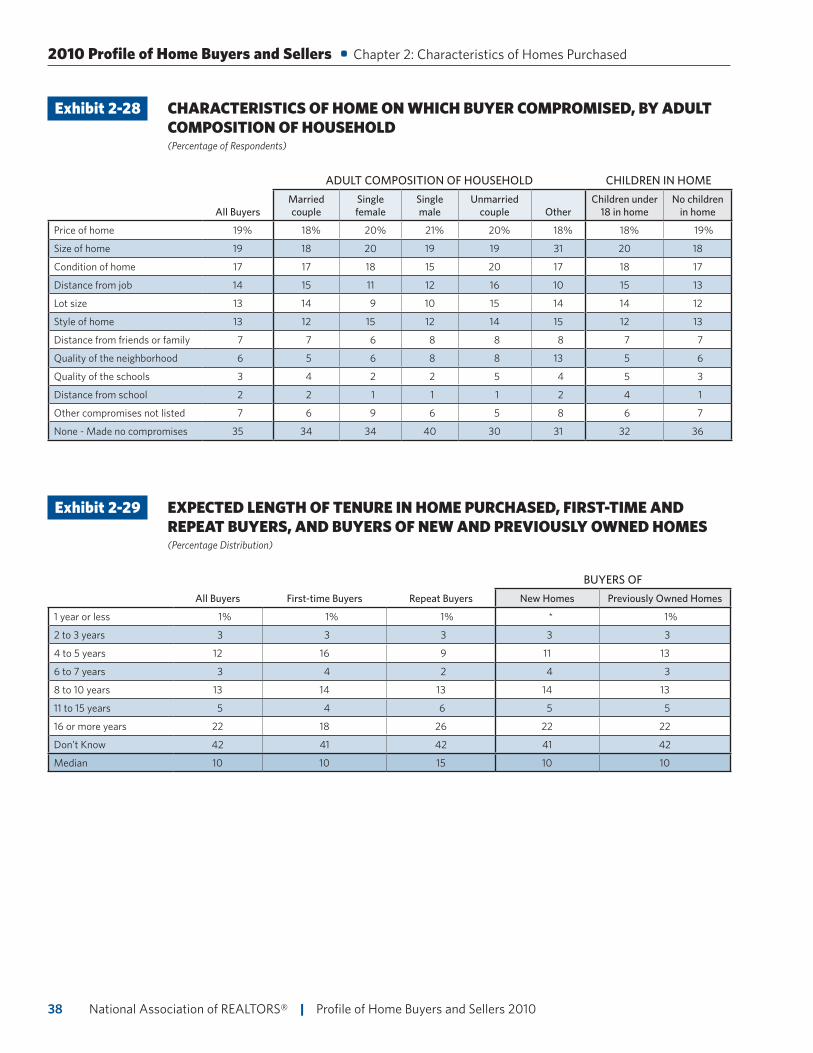
CHARACTERISTICS OF HOME ON WHICH BUYER COMPROMISED
• Exhibits 2-26 through 2-28
More than a third of respondents said that they did not make any compromises when purchasing their home. However, 19 percent of buyers reported that they compromised on the price of the home, and 19 percent said they compromised on the size of their home. First-time buyers and unmarried couples are the most likely to make comprises when purchasing a home. Those with children under the age of 18 are more likely than those without children to make comprises when buying a home.
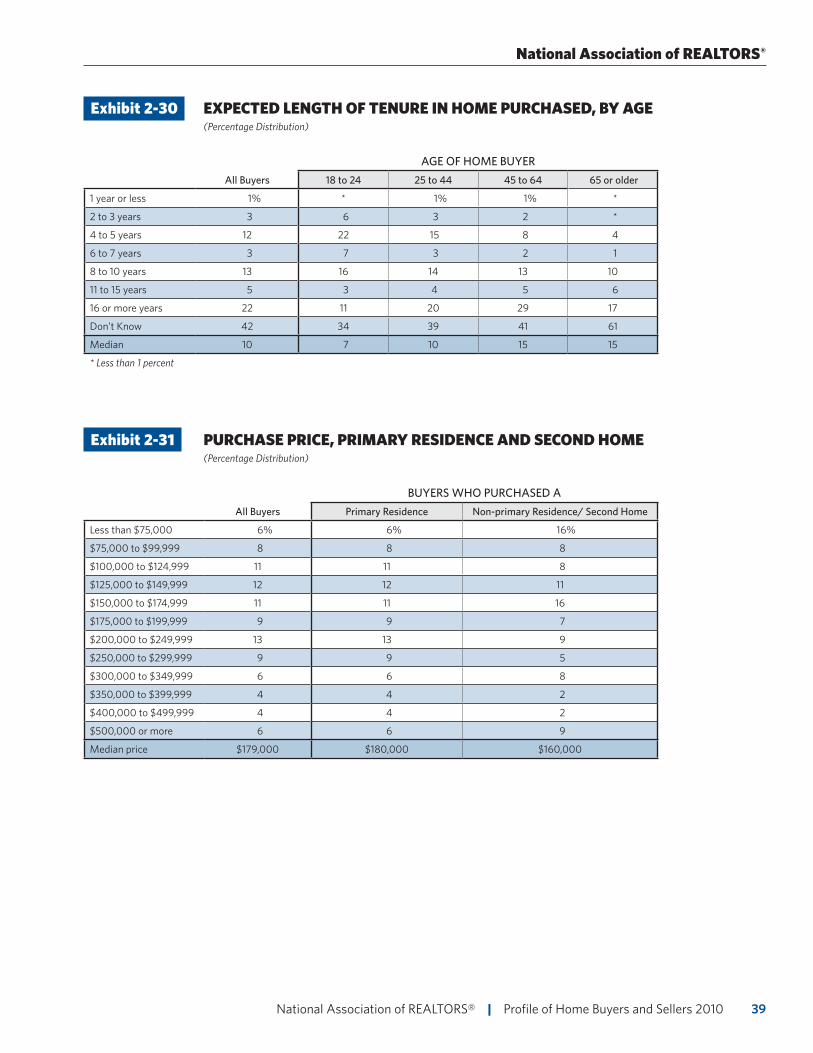
EXPECTED LENGTH OF TENURE IN HOME PURCHASED
• Exhibits 2-29 and 2-30
Forty-two percent of recent buyers were unsure of how long they expected to own their home. The typical buyer estimated they would live in their home for 10 years. Repeat buyers and buyers over the age of 45 estimated they would live in their home for 15 years. Buyers who were 18 to 24 years of age estimated they would live in their home for seven years before moving.
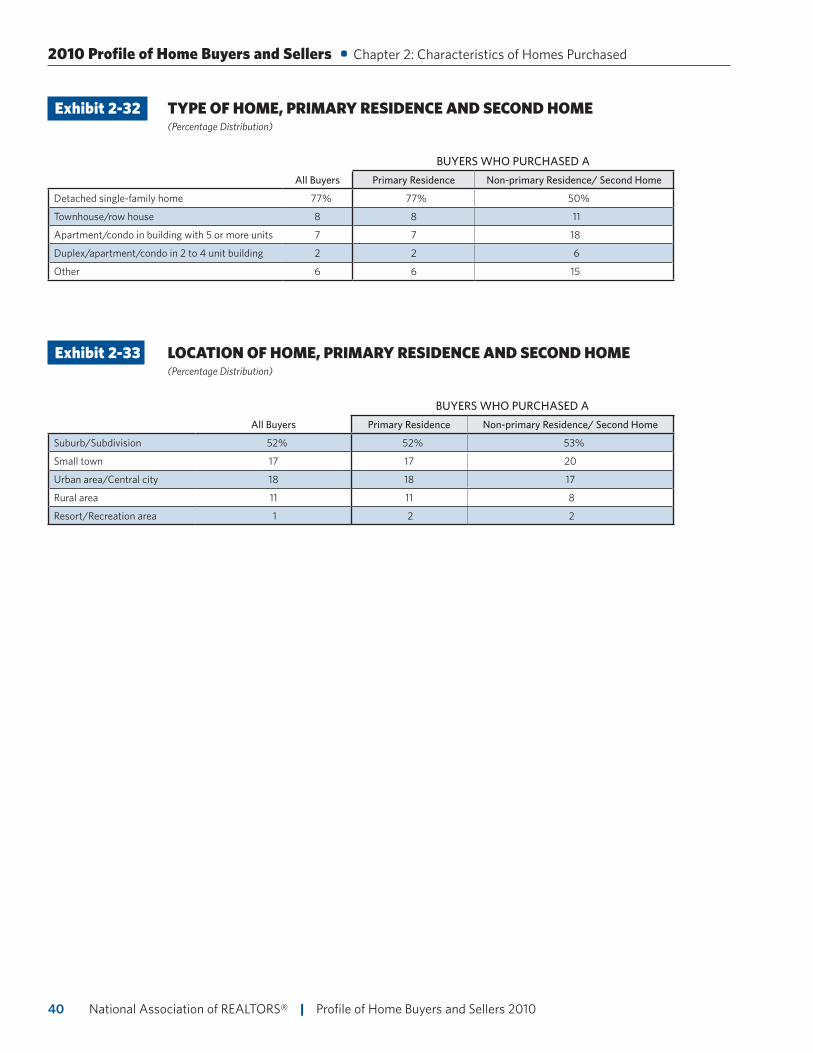
PRIMARY RESIDENCE AND SECOND HOME
• Exhibits 2-31 through 2-33
Second homes are generally less expensive than primary residences; however the disparity between the two has decreased in the past year. The median price of second homes increased to $160,000 from $143,500 and the median price of primary homes decreased to $180,000 from $186,000. Second home buyers more often purchased condos (18 percent) than did primary home buyers (7 percent). The location where second homes were purchased closely reflects those of primary homes.
27 National Association of REALTORS® | Profile of Home Buyers and Sellers 2010
70%
60%
50%
40%
30%
2001
20%
10%
0%
80%
90%
100%
2003 2004 2005 2006 2007 2008 2009 2010
21%
28%
21% 23% 22% 23% 21%18%
15%15%18%
21%23%22%21%
28%2
21% 23%
72%
79% 79% 77% 78% 77% 79%82%
85%
New Previously Owned
National Association of REALTORS®
Exhibit 2-1 NEW AND PREVIOUSLY OWNED HOMES PURCHASED, 2001-2010 (Percentage Distribution)
Exhibit 2-2 NEW AND PREVIOUSLY OWNED HOMES PURCHASED, BY REGION (Percentage Distribution)
BUYERS WHO PURCHASED A HOME IN THE
All Buyers Northeast Midwest South West
New 15% 9% 11% 21% 14%
Previously Owned 85 91 89 79 85
Exhibit 2-3 TYPE OF HOME PURCHASED, BY LOCATION (Percentage Distribution)
BUYERS WHO PURCHASED A HOME IN A
All Buyers Suburb/ Subdivision Small town Urban/ Central city Rural area Resort/ Recreation area
Detached single-family home 77% 76% 78% 77% 79% 77%
Townhouse/row house 8 9 8 8 7 7
Apartment/condo in building with 5 or more units 7 7 7 7 7 2
Duplex/apartment/condo in 2 to 4 unit building 2 2 2 2 2 4
Other 6 6 5 7 5 10
National Association of REALTORS® | Profile of Home Buyers and Sellers 201028
2010 Profile of Home Buyers and Sellers • Chapter 2: Characteristics of Homes Purchased
Exhibit 2-4 TYPE OF HOME PURCHASED BY FIRST-TIME AND REPEAT BUYERS, AND BUYERS OF NEW AND PREVIOUSLY OWNED HOMES (Percentage Distribution)
BUYERS OF
All Buyers First-time Buyers Repeat Buyers New Homes Previously Owned Homes
Detached single-family home 77% 74% 79% 72% 77%
Townhouse/row house 8 10 7 14 7
Apartment/condo in building with 5 or more units 7 8 6 7 7
Duplex/apartment/condo in 2 to 4 unit building 2 2 2 2 2
Other 6 6 6 5 6
Exhibit 2-5 TYPE OF HOME PURCHASED, BY ADULT COMPOSITION OF HOUSEHOLD (Percentage Distribution)
ADULT COMPOSITION OF HOUSEHOLD CHILDREN IN HOME
All BuyersMarried couple Single female Single male
Unmarried couple Other
Children under 18 in home
No children in home
Detached single-family home 77% 84% 62% 64% 81% 74% 87% 72%
Townhouse/row house 8 6 15 12 7 6 5 10
Apartment/condo in building with 5 or more units 7 3 12 15 5 14 2 9
Duplex/apartment/condo in 2 to 4 unit building 2 2 3 3 2 5 1 3
Other 6 6 7 6 6 2 5 7
Exhibit 2-6 LOCATION OF HOME PURCHASED, BY REGION (Percentage Distribution)
BUYERS WHO PURCHASED A HOME IN THE
All Buyers Northeast Midwest South West
Suburb/Subdivision 52% 52% 52% 52% 53%
Small town 17 16 18 17 17
Urban area/Central city 18 19 17 18 18
Rural area 11 11 11 11 12
Resort/Recreation area 1 1 2 2 1
29 National Association of REALTORS® | Profile of Home Buyers and Sellers 2010
National Association of REALTORS®
Exhibit 2-7 LOCATION OF HOME PURCHASED BY FIRST-TIME AND REPEAT BUYERS, AND BUYERS OF NEW AND PREVIOUSLY OWNED HOMES (Percentage Distribution)
BUYERS OF
All Buyers First-time Buyers Repeat Buyers New Homes Previously Owned Homes
Suburb/Subdivision 52% 52% 52% 54% 52%
Small town 17 17 17 16 17
Urban area/Central city 18 19 17 15 19
Rural area 11 10 12 13 11
Resort/Recreation area 1 2 2 2 2
Exhibit 2-8 LOCATION OF HOME PURCHASED VERSUS LOCATION OF HOME SOLD (Percentage Distribution Among those that Sold a Home)
LOCATION OF HOME PURCHASED
Suburb/ Subdivision Small town Urban/ Central city Rural areaResort/ Recreation
area
LOCATION OF HOME SOLD
Suburb/Subdivision 27% 10% 10% 6% 1%
Small town 9 4 3 2 *
Urban area/Central city 10 2 3 1 *
Rural area 6 2 2 1 *
Resort/Recreation area 1 * * * *
* Less than 1 percent
Exhibit 2-9 SENIOR RELATED HOUSING BY TYPE OF HOME PURCHASED AND LOCATION (Percentage Distribution)
ALL BUYERS OVER 50
Share who purchased a home in senior related housing 11%
BUYERS OVER 50 WHO PURCHASED SENIOR RELATED HOUSING:
TYPE OF HOME PURCHASED
Detached single-family home 51%
Townhouse/row house 9
Apartment/condo in building with 5 or more units 13
Duplex/apartment/condo in 2 to 4 unit building 9
Other 17
LOCATION
Suburb/ Subdivision 46%
Small town 19
Urban/ Central city 20
Rural area 13
Resort/ Recreation area 2
National Association of REALTORS® | Profile of Home Buyers and Sellers 201030
14
12
10
8
6
All Buyers
4
2
0
Northeast Midwest South West
1211
9
13
12
2010 Profile of Home Buyers and Sellers • Chapter 2: Characteristics of Homes Purchased
Exhibit 2-10 DISTANCE BETWEEN HOME PURCHASED AND PREVIOUS RESIDENCE (Median Miles)
Exhibit 2-11 FACTORS INFLUENCING NEIGHBORHOOD CHOICE, BY LOCATION (Percent of Respondents)
BUYERS WHO PURCHASED A HOME IN A
All Buyers Suburb/ Subdivision Small town Urban/ Central city Rural area Resort/ Recreation area
Quality of the neighborhood 64% 65% 66% 62% 60% 64%
Convenient to job 49 49 50 49 50 45
Overall affordability of homes 44 45 45 44 44 36
Convenient to friends/family 39 38 38 40 42 40
Quality of the school district 25 26 25 26 25 23
Convenient to shopping 25 24 25 25 28 30
Design of neighborhood 24 25 25 23 23 32
Convenient to schools 19 20 19 19 18 15
Convenient to entertainment/leisure activities 19 18 21 19 19 25
Convenient to parks/ recreational facilities 17 17 17 15 16 21
Availability of larger lots or acreage 15 16 16 12 12 13
Convenient to health facilities 9 9 10 9 8 11
Convenient to public transportation 7 7 7 9 7 6
Home in a planned community 6 6 5 7 7 17
Convenient to airport 6 5 5 6 6 4
Green (environmentally friendly) community features 5 4 4 6 4 9
Other 5 5 5 5 7 4
31 National Association of REALTORS® | Profile of Home Buyers and Sellers 2010
National Association of REALTORS®
Exhibit 2-12 FACTORS INFLUENCING NEIGHBORHOOD CHOICE, BY ADULT COMPOSITION OF HOUSEHOLD AND CHILDREN IN HOUSHOLD (Percent of Respondents)
ADULT COMPOSITION OF HOUSEHOLD CHILDREN IN HOME
All BuyersMarried couple Single female Single male
Unmarried couple Other
Children under 18 in home
No children in home
Quality of the neighborhood 64% 67% 62% 57% 64% 58% 67% 63%
Convenient to job 49 47 51 49 58 41 49 49
Overall affordability of homes 44 42 47 49 47 46 43 45
Convenient to friends/family 39 36 48 37 38 36 34 41
Quality of the school district 25 33 15 11 24 18 48 14
Convenient to shopping 25 25 25 24 25 22 20 27
Design of neighborhood 24 27 20 21 22 22 23 25
Convenient to schools 19 24 12 9 17 16 43 7
Convenient to entertainment/leisure activities 19 18 20 22 21 18 13 22
Convenient to parks/recre-ational facilities 17 18 14 17 15 11 19 15
Availability of larger lots or acreage 15 18 6 10 17 12 19 13
Convenient to health facilities 9 9 10 8 5 8 5 11
Convenient to public transportation 7 6 8 10 7 12 5 8
Home in a planned community 6 7 6 5 3 4 6 7
Convenient to airport 6 6 6 7 4 7 3 6
Green (environmentally friendly) community features 5 5 4 6 3 6 5 5
Other 5 5 6 6 4 13 5 6
Exhibit 2-13 PRICE OF HOME PURCHASED, BY REGION (Percentage Distribution)
BUYERS WHO PURCHASED A HOME IN THE
All Buyers Northeast Midwest South West
Less than $75,000 6% 4% 10% 7% 2%
$75,000 to $99,999 8 7 10 9 4
$100,000 to $124,999 11 8 14 12 8
$125,000 to $149,999 12 10 14 14 10
$150,000 to $174,999 11 8 14 11 10
$175,000 to $199,999 9 9 9 9 10
$200,000 to $249,999 13 15 13 12 14
$250,000 to $299,999 9 13 7 8 11
$300,000 to $349,999 6 7 4 5 8
$350,000 to $399,999 4 6 2 4 5
$400,000 to $499,999 4 6 2 4 6
$500,000 or more 6 8 2 5 11
Median price $179,000 $212,000 $154,000 $169,000 $219,500
National Association of REALTORS® | Profile of Home Buyers and Sellers 201032
2010 Profile of Home Buyers and Sellers • Chapter 2: Characteristics of Homes Purchased
Exhibit 2-14 PRICE OF HOME PURCHASED, NEW AND PREVIOUSLY OWNED HOMES (Percentage Distribution)
BUYERS WHO PURCHASED A
All Buyers New Home Previously Owned Home
Less than $75,000 6% 1% 7%
$75,000 to $99,999 8 2 9
$100,000 to $124,999 11 7 12
$125,000 to $149,999 12 11 12
$150,000 to $174,999 11 11 11
$175,000 to $199,999 9 11 9
$200,000 to $249,999 13 18 12
$250,000 to $299,999 9 12 9
$300,000 to $349,999 6 9 5
$350,000 to $399,999 4 6 4
$400,000 to $499,999 4 7 4
$500,000 or more 6 7 6
Median price $179,000 $219,900 $170,000
Exhibit 2-15 PRICE OF HOME PURCHASED, FIRST-TIME AND REPEAT BUYERS (Percentage Distribution)
All Buyers First-time Buyers Repeat Buyers
Less than $75,000 6% 8% 4%
$75,000 to $99,999 8 11 4
$100,000 to $124,999 11 15 8
$125,000 to $149,999 12 15 10
$150,000 to $174,999 11 12 10
$175,000 to $199,999 9 8 10
$200,000 to $249,999 13 12 15
$250,000 to $299,999 9 7 12
$300,000 to $349,999 6 4 7
$350,000 to $399,999 4 3 5
$400,000 to $499,999 4 2 7
$500,000 or more 6 3 9
Median price $179,000 $152,000 $215,000
Married couple $208,600 $168,200 $239,000
Single female $143,000 $127,000 $160,000
Single male $150,000 $144,000 $155,000
Unmarried couple $157,000 $150,000 $199,000
Other $157,000 $140,300 $178,800
33 National Association of REALTORS® | Profile of Home Buyers and Sellers 2010
National Association of REALTORS®
Exhibit 2-16 PURCHASE PRICE COMPARED WITH ASKING PRICE, BY REGION (Percentage Distribution)
BUYERS WHO PURCHASED A HOME IN THE
Percent of asking price: All Buyers Northeast Midwest South West
Less than 90% 17% 20% 20% 17% 13%
90% to 94% 19 23 21 21 12
95% to 99% 32 35 35 33 28
100% 20 15 17 20 27
101% to 110% 9 6 5 8 16
More than 110% 2 2 2 2 4
Median (purchase price as a percent of asking price) 97% 96% 96% 97% 99%
Exhibit 2-17 SIZE OF HOME PURCHASED, FIRST-TIME AND REPEAT BUYERS, AND BUYERS OF NEW AND PREVIOUSLY OWNED HOMES (Percentage Distribution)
BUYERS OF
All Buyers First-time Buyers Repeat Buyers New HomesPreviously Owned
Homes
1,000 sq ft or less 2% 3% 1% * 2%
1,001 to 1,500 sq ft 19 26 11 10 20
1,501 to 2,000 sq ft 29 34 24 24 30
2,001 to 2,500 sq ft 23 22 24 27 23
2,501 to 3,000 sq ft 12 7 16 16 11
3,001 to 3,500 sq ft 8 4 11 11 7
3,501 sq ft or more 8 3 12 12 7
Median (sq ft) 1,780 1,540 2,000 2,000 1,700
* Less than 1 percent
Exhibit 2-18 SIZE OF HOME PURCHASED, BY ADULT COMPOSITION OF HOUSEHOLD (Percentage Distribution)
ADULT COMPOSITION OF HOUSEHOLD CHILDREN IN HOME
All BuyersMarried couple
Single female Single male
Unmarried couple Other
Children under 18 in home
No children in home
1,000 sq ft or less 2% 1% 3% 5% 2% * * 2%
1,001 to 1,500 sq ft 19 11 32 29 22 33 13 22
1,501 to 2,000 sq ft 29 25 36 34 32 30 23 32
2,001 to 2,500 sq ft 23 25 20 18 26 21 24 23
2,501 to 3,000 sq ft 12 16 5 7 8 7 15 10
3,001 to 3,500 sq ft 8 11 2 4 5 2 12 6
3,501 sq ft or more 8 11 2 4 4 6 13 5
Median (sq ft) 1,780 2,000 1,450 1,500 1,600 1,500 2,000 1,650
* Less than 1 percent
National Association of REALTORS® | Profile of Home Buyers and Sellers 201034
Exhibit 2-19 HOME SIZE AND PRICE PER SQUARE FOOT, BY REGION (Median)
BUYERS WHO PURCHASED A HOME IN THE
All Buyers Northeast Midwest South West
All homes purchased
Square feet 1,780 1,600 1,700 1,860 1,700
Price per square foot $101 $132 $91 $90 $124
Detached single-family home
Square feet 1,850 1,700 1,800 1,980 1,800
Price per square foot $98 $122 $90 $88 $120
Townhouse or row house
Square feet 1,580 1,500 1,650 1,600 1,400
Price per square foot $114 $133 $96 $108 $128
Duplex/apartment/condo in 2-4 unit building
Square feet 1,100 1,860 1,580 1,600 1,280
Price per square foot $106 $118 $103 $99 $149
Apartment/condo in building with 5 or more units
Square feet 1,520 950 1,200 1,150 1,010
Price per square foot $172 $240 $105 $137 $220
Exhibit 2-20 NUMBER OF BEDROOMS AND BATHROOMS, BY FIRST-TIME AND REPEAT BUYERS, AND BUYERS OF NEW AND PREVIOUSLY OWNED HOMES (Percentage Distribution)
BUYERS OF
All Buyers First-time Buyers Repeat Buyers New Homes Previously Owned Homes
One bedroom 3% 3% 2% 2% 3%
Two bedrooms 16 19 14 12 17
Three bedrooms or more 81 78 84 86 80
Median number of bedrooms 3 3 3 3 3
One full bathroom 22 30 13 5 25
Two full bathrooms 60 61 58 68 58
Three full bathrooms or more 19 10 28 28 17
Median number of full bathrooms 2 2 2 2 2
2010 Profile of Home Buyers and Sellers • Chapter 2: Characteristics of Homes Purchased
35 National Association of REALTORS® | Profile of Home Buyers and Sellers 2010
Exhibit 2-21 NUMBER OF BEDROOMS AND BATHROOMS, BY ADULT HOUSEHOLD COMPOSITION AND CHILDREN IN HOUSEHOLD (Percentage Distribution)
ADULT COMPOSITION OF HOUSEHOLD CHILDREN IN HOME
All BuyersMarried couple
Single female
Single male
Unmarried couple Other
Children under 18 in home
No children in home
One bedroom 3% 1% 5% 8% 2% 4% * 4%
Two bedrooms 16 10 28 27 14 27 6 21
Three bedrooms or more 81 89 67 65 84 69 93 75
Median number of bedrooms 3 3 3 3 3 3 3 3
One full bathroom 22 15 30 32 32 32 17 24
Two full bathrooms 60 59 63 59 56 53 57 61
Three full bathrooms or more 19 26 8 9 13 15 27 15
Median number of full bathrooms 2 2 2 2 2 2 2 2
* Less than 1 percent
Exhibit 2-22 YEAR HOME BUILT, BY REGION (Percentage Distribution)
BUYERS WHO PURCHASED A HOME IN THE
All Buyers Northeast Midwest South West
2010 4% 3% 2% 6% 4%
2008 through 2009 11 6 8 14 11
2005 through 2007 11 4 7 14 14
2000 through 2004 13 6 12 15 14
1985 through 1999 19 14 19 20 22
1960 through 1984 22 23 25 20 21
1911 through 1959 18 36 23 10 14
1910 or earlier 3 9 5 1 *
Median 1990 1965 1981 1999 1995
* Less than 1 percent
National Association of REALTORS®
National Association of REALTORS® | Profile of Home Buyers and Sellers 201036
2010 Profile of Home Buyers and Sellers • Chapter 2: Characteristics of Homes Purchased
Exhibit 2-23 IMPORTANCE OF COMMUTING COSTS (Percentage Distribution)
SomewhatImportant42%
Not Important24%
SomewhatImportant42%
Not Important24%
Very Important35%
Exhibit 2-24 IMPORTANCE OF HOME’S ENVIRONMENTALLY FRIENDLY FEATURES (Percentage Distribution)
80% 90%20%10% 70%40% 60%50% 100%30%
Heating andcooling costs 39% 49% 12%
Energy efficientappliances 24% 47% 29%
Energy efficientlighting 24% 45% 31%
Landscaping forenergy conservation 10% 39% 51%
Environmentally friendly community features 10% 41% 49%
Very Important Somewhat Important Not Important
Exhibit 2-25 ENVIRONMENTALLY FRIENDLY FEATURES CONSIDERED “VERY IMPORTANT”, BY REGION (Percent of Respondents)
BUYERS WHO PURCHASED A HOME IN THE
All Buyers Northeast Midwest South West
Heating and cooling costs 39% 42% 37% 43% 34%
Energy efficient appliances 24 22 20 27 27
Energy efficient lighting 24 22 19 26 28
Landscaping for energy conservation 10 7 7 10 17
Environmentally friendly community features 10 8 7 10 13
37 National Association of REALTORS® | Profile of Home Buyers and Sellers 2010
National Association of REALTORS®
Exhibit 2-26 CHARACTERISTICS OF HOME ON WHICH BUYER COMPROMISED, BY LOCATION (Percent of Respondents)
BUYERS WHO PURCHASED A HOME IN A
All Buyers Suburb/ Subdivision Small town Urban/ Central city Rural Resort/ Recreation area
Price of home 19% 20% 20% 19% 15% 17%
Size of home 19 19 17 19 19 13
Condition of home 17 17 18 17 15 11
Distance from job 14 14 13 14 14 20
Lot size 13 12 12 13 18 10
Style of home 13 14 11 14 11 6
Distance from friends or family 7 7 7 6 7 7
Quality of the neighborhood 6 6 6 6 7 2
Quality of the schools 3 3 3 3 3 4
Distance from school 2 2 1 2 2 1
Other compromises not listed 7 7 5 6 8 8
None - Made no compromises 35 33 37 36 33 38
* Less than 1 percent
Exhibit 2-27 CHARACTERISTICS OF HOME ON WHICH BUYER COMPROMISED, FIRST-TIME AND REPEAT BUYERS, AND BUYERS OF NEW AND PREVIOUSLY OWNED HOMES (Percent of Respondents)
BUYERS OF
All Buyers First-time Buyers Repeat Buyers New Homes Previously Owned Homes
Price of home 19% 21% 17% 17% 19%
Size of home 19 22 16 16 19
Condition of home 17 18 15 3 19
Distance from job 14 16 11 17 13
Lot size 13 13 13 17 12
Style of home 13 15 11 12 13
Distance from friends or family 7 8 5 9 7
Quality of the neighborhood 6 8 4 5 6
Quality of the schools 3 4 2 4 3
Distance from school 2 2 1 2 2
Other compromises not listed 7 7 6 6 7
None - Made no compromises 35 28 41 40 34
National Association of REALTORS® | Profile of Home Buyers and Sellers 201038
2010 Profile of Home Buyers and Sellers • Chapter 2: Characteristics of Homes Purchased
Exhibit 2-28 CHARACTERISTICS OF HOME ON WHICH BUYER COMPROMISED, BY ADULT COMPOSITION OF HOUSEHOLD (Percentage of Respondents)
ADULT COMPOSITION OF HOUSEHOLD CHILDREN IN HOME
All BuyersMarried couple
Single female
Single male
Unmarried couple Other
Children under 18 in home
No children in home
Price of home 19% 18% 20% 21% 20% 18% 18% 19%
Size of home 19 18 20 19 19 31 20 18
Condition of home 17 17 18 15 20 17 18 17
Distance from job 14 15 11 12 16 10 15 13
Lot size 13 14 9 10 15 14 14 12
Style of home 13 12 15 12 14 15 12 13
Distance from friends or family 7 7 6 8 8 8 7 7
Quality of the neighborhood 6 5 6 8 8 13 5 6
Quality of the schools 3 4 2 2 5 4 5 3
Distance from school 2 2 1 1 1 2 4 1
Other compromises not listed 7 6 9 6 5 8 6 7
None - Made no compromises 35 34 34 40 30 31 32 36
Exhibit 2-29 EXPECTED LENGTH OF TENURE IN HOME PURCHASED, FIRST-TIME AND REPEAT BUYERS, AND BUYERS OF NEW AND PREVIOUSLY OWNED HOMES (Percentage Distribution)
BUYERS OF
All Buyers First-time Buyers Repeat Buyers New Homes Previously Owned Homes
1 year or less 1% 1% 1% * 1%
2 to 3 years 3 3 3 3 3
4 to 5 years 12 16 9 11 13
6 to 7 years 3 4 2 4 3
8 to 10 years 13 14 13 14 13
11 to 15 years 5 4 6 5 5
16 or more years 22 18 26 22 22
Don’t Know 42 41 42 41 42
Median 10 10 15 10 10
39 National Association of REALTORS® | Profile of Home Buyers and Sellers 2010
National Association of REALTORS®
Exhibit 2-30 EXPECTED LENGTH OF TENURE IN HOME PURCHASED, BY AGE (Percentage Distribution)
AGE OF HOME BUYER
All Buyers 18 to 24 25 to 44 45 to 64 65 or older
1 year or less 1% * 1% 1% *
2 to 3 years 3 6 3 2 *
4 to 5 years 12 22 15 8 4
6 to 7 years 3 7 3 2 1
8 to 10 years 13 16 14 13 10
11 to 15 years 5 3 4 5 6
16 or more years 22 11 20 29 17
Don’t Know 42 34 39 41 61
Median 10 7 10 15 15
* Less than 1 percent
Exhibit 2-31 PURCHASE PRICE, PRIMARY RESIDENCE AND SECOND HOME (Percentage Distribution)
BUYERS WHO PURCHASED A
All Buyers Primary Residence Non-primary Residence/ Second Home
Less than $75,000 6% 6% 16%
$75,000 to $99,999 8 8 8
$100,000 to $124,999 11 11 8
$125,000 to $149,999 12 12 11
$150,000 to $174,999 11 11 16
$175,000 to $199,999 9 9 7
$200,000 to $249,999 13 13 9
$250,000 to $299,999 9 9 5
$300,000 to $349,999 6 6 8
$350,000 to $399,999 4 4 2
$400,000 to $499,999 4 4 2
$500,000 or more 6 6 9
Median price $179,000 $180,000 $160,000
National Association of REALTORS® | Profile of Home Buyers and Sellers 201040
Exhibit 2-32 TYPE OF HOME, PRIMARY RESIDENCE AND SECOND HOME (Percentage Distribution)
BUYERS WHO PURCHASED A
All Buyers Primary Residence Non-primary Residence/ Second Home
Detached single-family home 77% 77% 50%
Townhouse/row house 8 8 11
Apartment/condo in building with 5 or more units 7 7 18
Duplex/apartment/condo in 2 to 4 unit building 2 2 6
Other 6 6 15
Exhibit 2-33 LOCATION OF HOME, PRIMARY RESIDENCE AND SECOND HOME (Percentage Distribution)
BUYERS WHO PURCHASED A
All Buyers Primary Residence Non-primary Residence/ Second Home
Suburb/Subdivision 52% 52% 53%
Small town 17 17 20
Urban area/Central city 18 18 17
Rural area 11 11 8
Resort/Recreation area 1 2 2
2010 Profile of Home Buyers and Sellers • Chapter 2: Characteristics of Homes Purchased
41 National Association of REALTORS® | Profile of Home Buyers and Sellers 2010
Chapter 3: The Home Search Process
Real estate agents and the Internet continue to be the most important resources in the home search process. While the usage of the Internet has increased in the search process, it does not diminish the use of
the agent, but rather provides a complimentary relationship: home buyers who used the Internet to search are more likely to buy their home through a real estate agent and often take steps to look at a particular property they saw online.
The most difficult part of the search process is finding the right property for the buyer. It is a process that increased in the length of the search from 2008 to 2009 and remains longer in 2010. The typical buyer searches for 12 weeks and views 12 homes during the process. Buyers find visuals on the Internet particularly useful—pictures of the property, detailed information about the property for sale, and virtual tours all aid buyers. Overall, 91 percent of buyers were very satisfied or somewhat satisfied with their home buying process.
National Association of REALTORS® | Profile of Home Buyers and Sellers 201042
2010 Profile of Home Buyers and Sellers • Chapter 3: The Home Search Process
THE FIRST STEP IN THE HOME BUYING PROCESS
• Exhibits 3-1 and 3-2
When starting the home buying process, the Internet plays an ever increasing role. Thirty-six percent of buyers looked online for properties for sale as their first step. An additional 11 percent began by finding information online about the home buying process and 19 percent started by talking to an agent.
About one-third of first-time buyers first went online to look at properties for sale when starting their home search. First-time buyers were more likely than repeat buyers to look online for information about the home buying process and talk with a friend or relative about the process. Repeat buyers were more likely than first-time buyers to contact a real estate agent and drive by homes and neighborhoods as a first step.
Buyers in each age group between 18 to 64 were all most likely to look online for properties for sale as a first step in the home buying process. Buyers who were 65 or older were most likely to contact a real estate agent as their first step. In 2010, the percent of buyers ages 18 to 44 that contacted a real estate agent as their first step agent increased from 2009.
INFORMATION SOURCES
• Exhibits 3-3 through 3-6
Eighty-nine percent of home buyers used the Internet as one of the information sources in their home search process. First-time home buyers and buyers under 44 years of age were most likely to use the Internet during their home search.
The second most used information source was the real estate agent. Eighty-eight percent of buyers used real estate agents during their home search process. Buyers of previously owned homes and buyers aged 18 to 24 were most likely to report using a real estate agent.
The third most commonly used information source was a yard sign. Fifty-seven percent of home buyers used yard signs in their search. Repeat buyers, buyers of previously owned homes, and buyers ages 45 to 64 were most likely to use yard signs in their home search.
The Internet and real estate agents have remained the two highest-ranking sources by usefulness consistently for several years. Eighty-one percent of buyers ranked both real estate agents and the Internet as very useful in their search process. The third ranked source is home builders with 42 percent of buyers finding them very useful during their search. While 57 percent of buyers use yard signs, fewer buyers find them very useful.
The Internet and real estate agents have remained the two highest-ranking sources by
usefulness consistently for several years.
43 National Association of REALTORS® | Profile of Home Buyers and Sellers 2010
National Association of REALTORS®
THE SEARCH PROCESS
• Exhibits 3-7 through 3-12
The length of the typical home search has remained the same at 12 weeks since 2009. While searching, buyers on average looked at 12 homes before deciding on their purchase. Buyers usually spent two weeks searching before they contacted an agent. First-time buyers searched longer for their first home, 12 weeks, compared with repeat buyers who spent 10 weeks in the process.
While the real estate agent and the Internet remain the top sources used in the home search, others are declining in prominence. The real estate agent remains the top source through which the buyer first learned that the home they ultimately purchase was for sale, at 38 percent. Thirty-seven percent of buyers reported that they found their home online. All other sources have decreased since 2001. About one in ten buyers found their home through a yard sign or open house sign, compared to 16 percent in 2004.
In some buying areas there are high levels of distressed sales. Half of all buyers and 57 percent of first-time buyers considered purchasing a foreclosed home but did not. The majority of these buyers could not find the right home or thought the process was too difficult or complex. Four percent of all buyers purchased a foreclosed home. Additionally, six percent of recent buyers purchased a short sale.
The home buying process involves many steps, from finding the house to financing and closing. For recent home buyers, 56 percent said the most difficult step in the process as finding the right property. Finding the right property is more difficult for first-time buyers and buyers of previously owned homes. Eighteen percent reported no difficult steps—repeat buyers and buyers of new homes were more likely than other buyers to fall into this category. For 14 percent of recent buyers, getting a mortgage was the hardest step in the process, especially for first-time buyers.
INTERNET USAGE TRENDS
• Exhibits 3-13 and 3-14
For the last three years, about 90 percent of home buyers used the Internet in their home search. Among buyers who reported using the Internet, 74 percent reported using it frequently. The Internet has become a way to add to and supplement the search process. Furthermore, as a result of searching online, buyers often walked through the home viewed online, found an agent, and drove by and viewed the home.
CHARACTERISTICS OF INTERNET SEARCHERS
• Exhibit 3-15
Buyers who use the Internet in their home search, compared to those who do not, vary demographically. The typical buyer who used the Internet in their home search was 37 years-old and had a median 2009 household income of $74,200. The typical buyer who did not use the Internet to search for home was 57 and had a median 2009 household income of $55,200. Additionally, the typical buyer who used the Internet searched for a home double the number of weeks and visited more than twice as many homes as the non-Internet searcher.
SOURCES OF INFORMATION
• Exhibit 3-16
Buyers who used the Internet to search for a home used other sources with higher frequency than those who did not use the Internet to search. Ninety percent of those who used the Internet used an agent compared to 73 percent of those who did not use the Internet. Fifty-eight percent of buyers who used the Internet also used yard signs compared to 43 percent of those who did not use the Internet. Additionally, 47 percent of those who used the Internet used open houses as an information source, compared to 30 percent of those who did not use the Internet.
National Association of REALTORS® | Profile of Home Buyers and Sellers 201044
2010 Profile of Home Buyers and Sellers • Chapter 3: The Home Search Process
FINDING A HOME
• Exhibit 3-17
Forty-one percent of buyers who used the Internet in their search first found the home through the Internet, five percent higher than in 2009. For buyers who used the Internet, 37 percent of them first found their home through their agent. In comparison, among buyers who did not use the Internet, 47 percent found their home through an agent. Buyers who did not use the Internet found their home more frequently through a yard sign or through a friend, relative or neighbor, or directly through the sellers than those who used the Internet to search.
METHOD OF PURCHASE
• Exhibit 3-18
While the vast majority of buyers use the Internet during the home buying process, the Internet does not replace the real estate agent in the transaction. Eighty-five percent of home buyers who used the Internet to search for homes purchased their home through an agent. In fact, buyers who used the Internet were more likely than those who did not use the Internet to purchase their home through an agent.
WEB SITES
• Exhibits 3-19 through 3-21
Visuals of the properties for sale are increasingly useful to buyers as more buyers use the Internet in their search process. Eighty-five percent of home buyers found photos very useful on websites. Eighty-three percent of buyers found detailed information about the property very useful when searching for a home. The least useful features include information about upcoming open houses or about recently sold properties, however both features were rated more useful in 2010 than in 2009.
Nearly sixty percent of home buyers used multiple listing service (MLS) websites, the most frequently used online resource. MLS is the most used website among first-time and repeat buyers and also amongst all age categories of buyers. REALTOR.com was the second most used site among repeat buyers and buyers of every age category. First-time buyers used real estate company websites and real estate agent websites more often than repeat buyers.
SATISFACTION IN BUYING PROCESS
• Exhibit 3-22
Fifty-seven percent of buyers were very satisfied with their recent home buying process. More than one-third of buyers were somewhat satisfied with the process. Ten percent were somewhat to very dissatisfied.
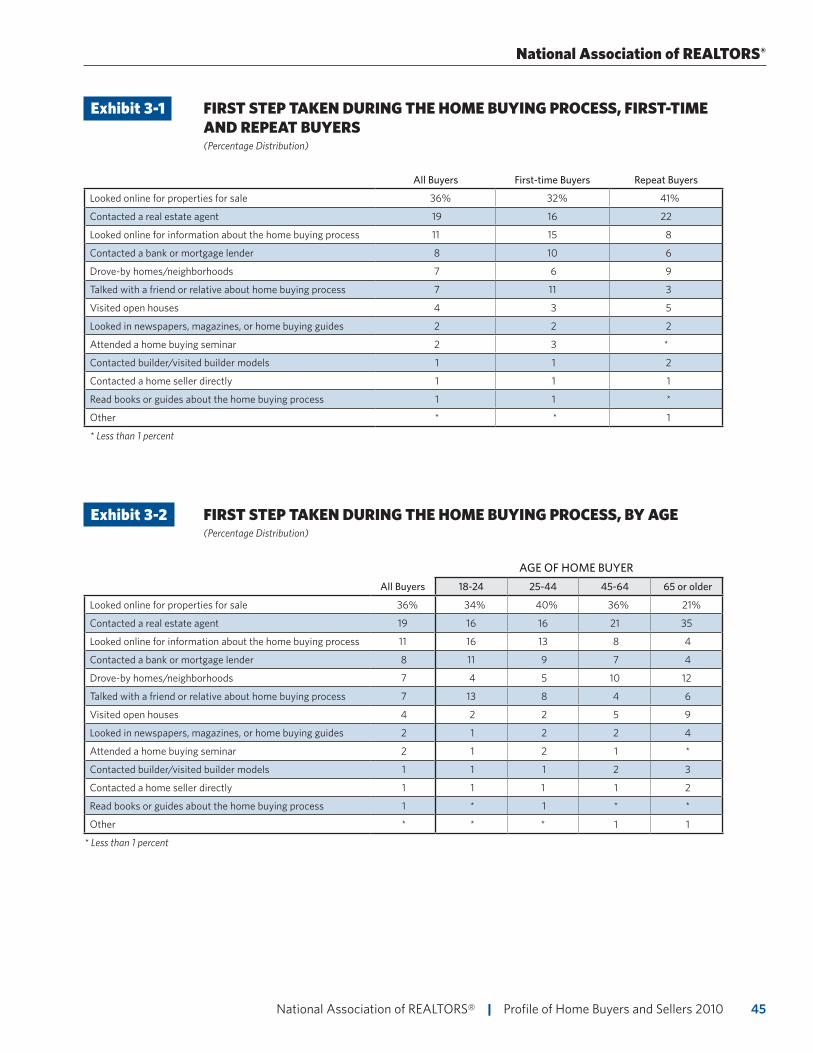
45 National Association of REALTORS® | Profile of Home Buyers and Sellers 2010
National Association of REALTORS®
Exhibit 3-1 FIRST STEP TAKEN DURING THE HOME BUYING PROCESS, FIRST-TIME AND REPEAT BUYERS (Percentage Distribution)
All Buyers First-time Buyers Repeat Buyers
Looked online for properties for sale 36% 32% 41%
Contacted a real estate agent 19 16 22
Looked online for information about the home buying process 11 15 8
Contacted a bank or mortgage lender 8 10 6
Drove-by homes/neighborhoods 7 6 9
Talked with a friend or relative about home buying process 7 11 3
Visited open houses 4 3 5
Looked in newspapers, magazines, or home buying guides 2 2 2
Attended a home buying seminar 2 3 *
Contacted builder/visited builder models 1 1 2
Contacted a home seller directly 1 1 1
Read books or guides about the home buying process 1 1 *
Other * * 1
* Less than 1 percent
Exhibit 3-2 FIRST STEP TAKEN DURING THE HOME BUYING PROCESS, BY AGE (Percentage Distribution)
AGE OF HOME BUYER
All Buyers 18-24 25-44 45-64 65 or older
Looked online for properties for sale 36% 34% 40% 36% 21%
Contacted a real estate agent 19 16 16 21 35
Looked online for information about the home buying process 11 16 13 8 4
Contacted a bank or mortgage lender 8 11 9 7 4
Drove-by homes/neighborhoods 7 4 5 10 12
Talked with a friend or relative about home buying process 7 13 8 4 6
Visited open houses 4 2 2 5 9
Looked in newspapers, magazines, or home buying guides 2 1 2 2 4
Attended a home buying seminar 2 1 2 1 *
Contacted builder/visited builder models 1 1 1 2 3
Contacted a home seller directly 1 1 1 1 2
Read books or guides about the home buying process 1 * 1 * *
Other * * * 1 1
* Less than 1 percent
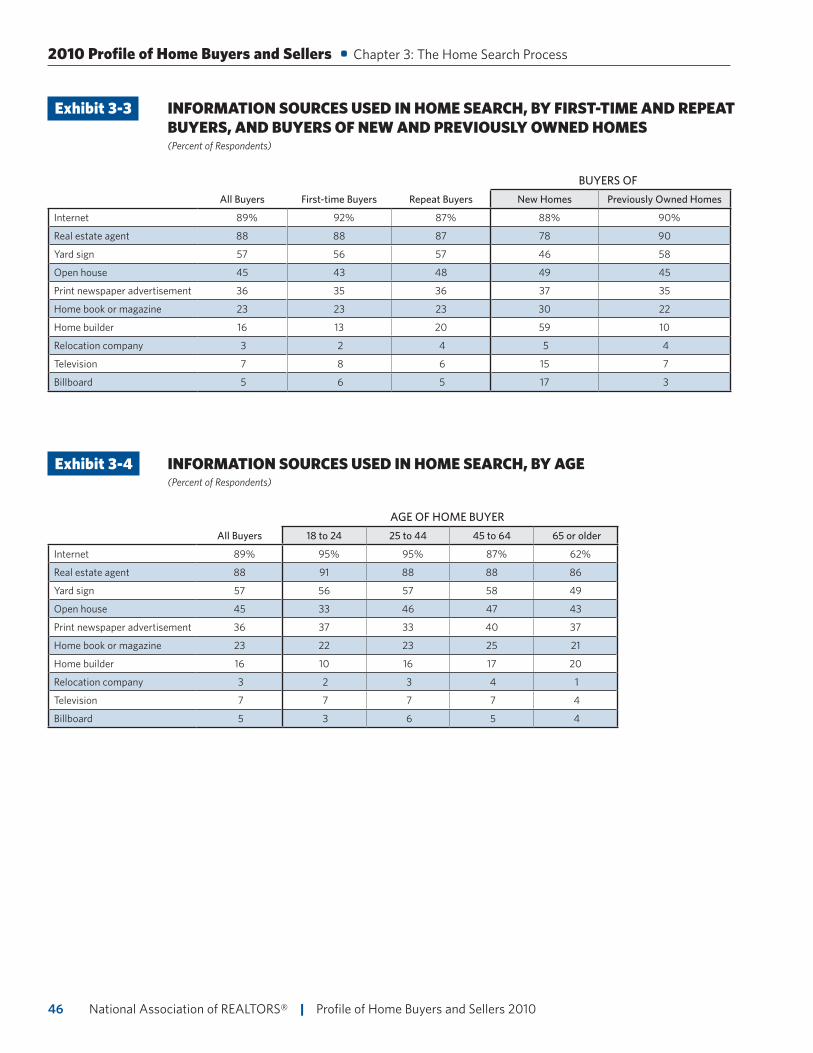
National Association of REALTORS® | Profile of Home Buyers and Sellers 201046
2010 Profile of Home Buyers and Sellers • Chapter 3: The Home Search Process
Exhibit 3-3 INFORMATION SOURCES USED IN HOME SEARCH, BY FIRST-TIME AND REPEAT BUYERS, AND BUYERS OF NEW AND PREVIOUSLY OWNED HOMES (Percent of Respondents)
BUYERS OF
All Buyers First-time Buyers Repeat Buyers New Homes Previously Owned Homes
Internet 89% 92% 87% 88% 90%
Real estate agent 88 88 87 78 90
Yard sign 57 56 57 46 58
Open house 45 43 48 49 45
Print newspaper advertisement 36 35 36 37 35
Home book or magazine 23 23 23 30 22
Home builder 16 13 20 59 10
Relocation company 3 2 4 5 4
Television 7 8 6 15 7
Billboard 5 6 5 17 3
Exhibit 3-4 INFORMATION SOURCES USED IN HOME SEARCH, BY AGE (Percent of Respondents)
AGE OF HOME BUYER
All Buyers 18 to 24 25 to 44 45 to 64 65 or older
Internet 89% 95% 95% 87% 62%
Real estate agent 88 91 88 88 86
Yard sign 57 56 57 58 49
Open house 45 33 46 47 43
Print newspaper advertisement 36 37 33 40 37
Home book or magazine 23 22 23 25 21
Home builder 16 10 16 17 20
Relocation company 3 2 3 4 1
Television 7 7 7 7 4
Billboard 5 3 6 5 4
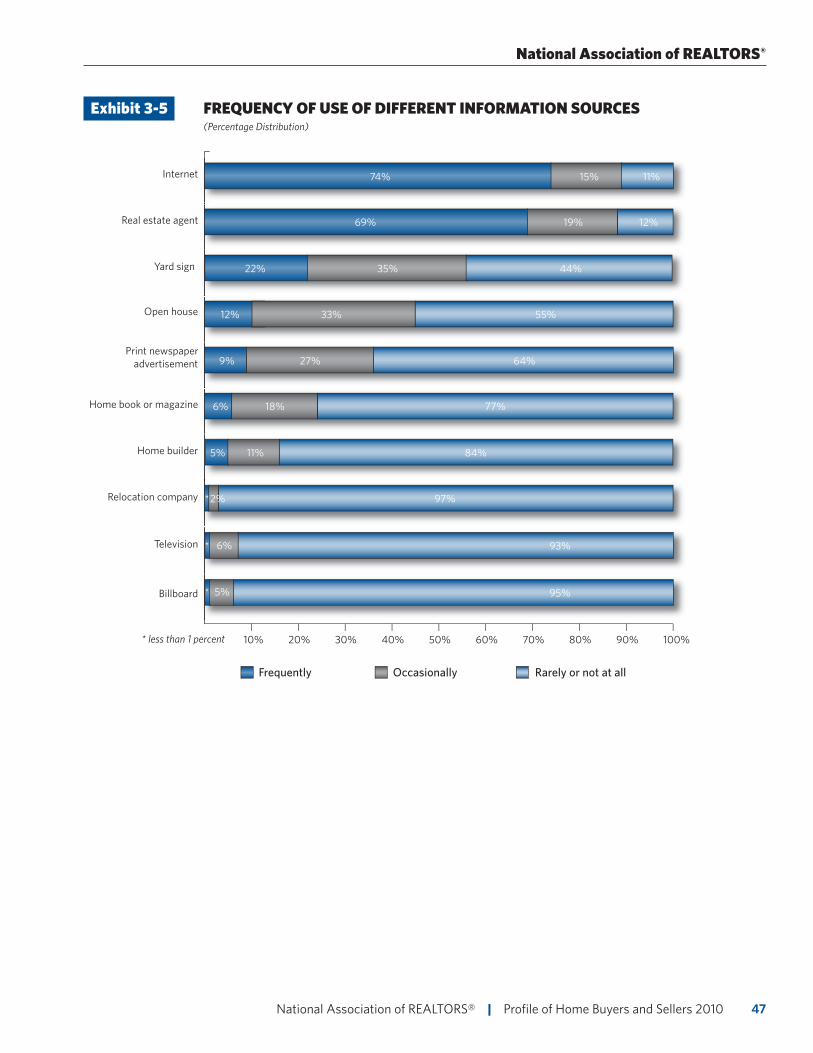
47 National Association of REALTORS® | Profile of Home Buyers and Sellers 2010
National Association of REALTORS®
Exhibit 3-5 FREQUENCY OF USE OF DIFFERENT INFORMATION SOURCES (Percentage Distribution)
80% 90%20%10% 70%40% 60%50% 100%30%
Print newspaper advertisement 9% 27% 64%
Home book or magazine 6% 18% 77%
Home builder 5% 11% 84%
Relocation company *2% 97%
Internet 74% 15% 11%
Real estate agent 69% 19% 12%
Yard sign 22% 35% 44%
Open house 12% 33% 55%
Billboard * 5% 95%
Television * 6% 93%
Frequently Occasionally Rarely or not at all
* less than 1 percent
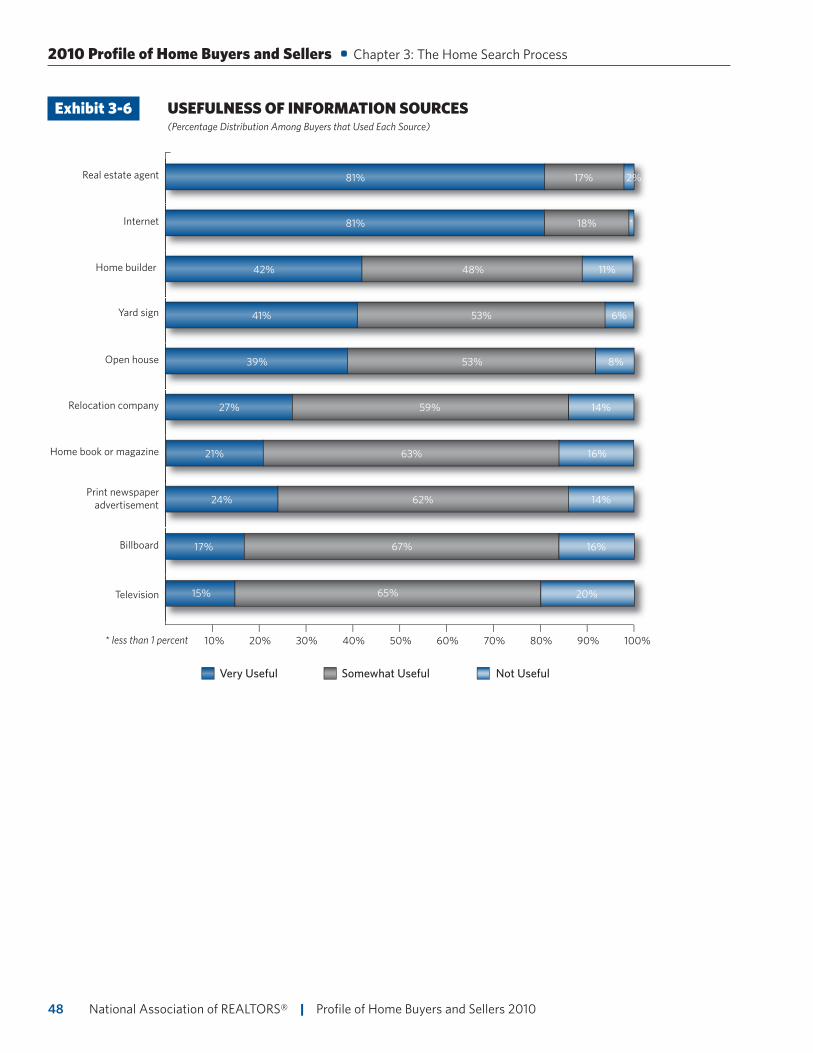
National Association of REALTORS® | Profile of Home Buyers and Sellers 201048
2010 Profile of Home Buyers and Sellers • Chapter 3: The Home Search Process
Exhibit 3-6 USEFULNESS OF INFORMATION SOURCES (Percentage Distribution Among Buyers that Used Each Source)
80% 90%20%10% 70%40% 60%50% 100%30%
Print newspaper advertisement
39% 53% 8%
Relocation company 27% 59% 14%
Home book or magazine 21% 63% 16%
Open house
24% 62% 14%
Real estate agent 81% 17% 2%
Internet 81% 18% *
Home builder 42% 48% 11%
Yard sign 41% 53% 6%
Television 15% 65% 20%
Billboard 17% 67% 16%
Very Useful Somewhat Useful Not Useful
* less than 1 percent
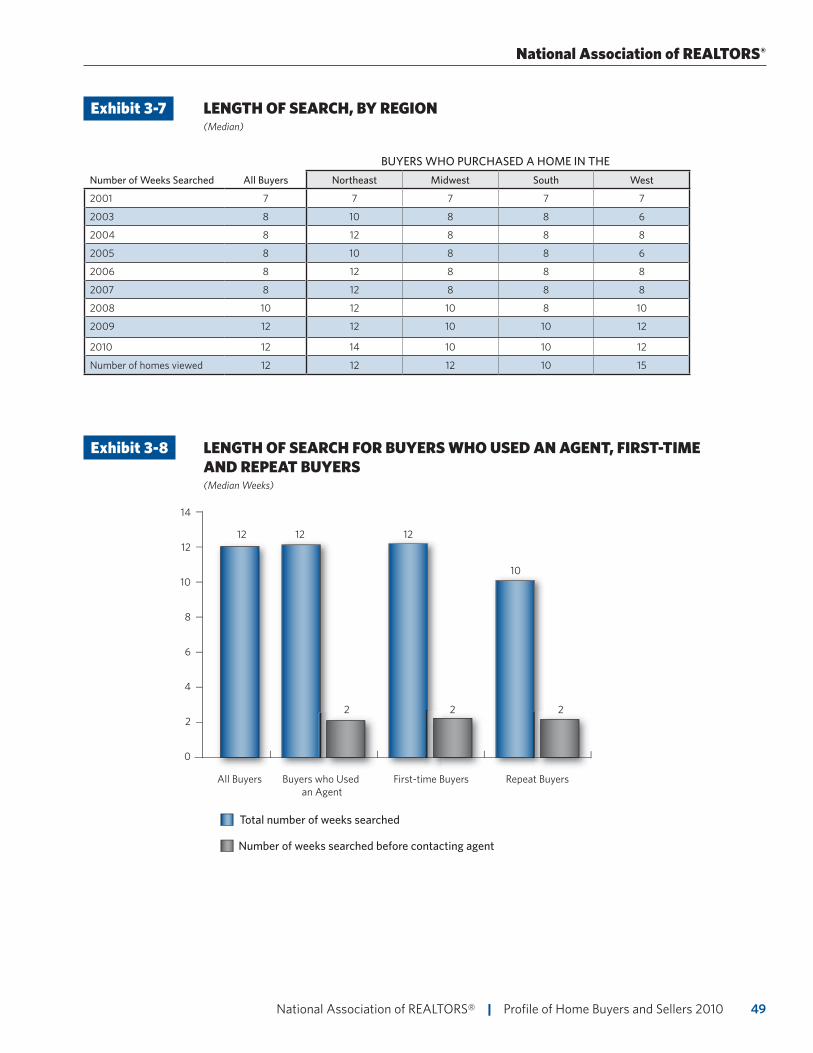
49 National Association of REALTORS® | Profile of Home Buyers and Sellers 2010
National Association of REALTORS®
Exhibit 3-7 LENGTH OF SEARCH, BY REGION (Median)
BUYERS WHO PURCHASED A HOME IN THE
Number of Weeks Searched All Buyers Northeast Midwest South West
2001 7 7 7 7 7
2003 8 10 8 8 6
2004 8 12 8 8 8
2005 8 10 8 8 6
2006 8 12 8 8 8
2007 8 12 8 8 8
2008 10 12 10 8 10
2009 12 12 10 10 12
2010 12 14 10 10 12
Number of homes viewed 12 12 12 10 15
Exhibit 3-8 LENGTH OF SEARCH FOR BUYERS WHO USED AN AGENT, FIRST-TIME AND REPEAT BUYERS (Median Weeks)
14
12
10
8
6
All Buyers
4
2
0
Buyers who Used an Agent
First-time Buyers Repeat Buyers
12 12 12
10
222
Total number of weeks searched
Number of weeks searched before contacting agent
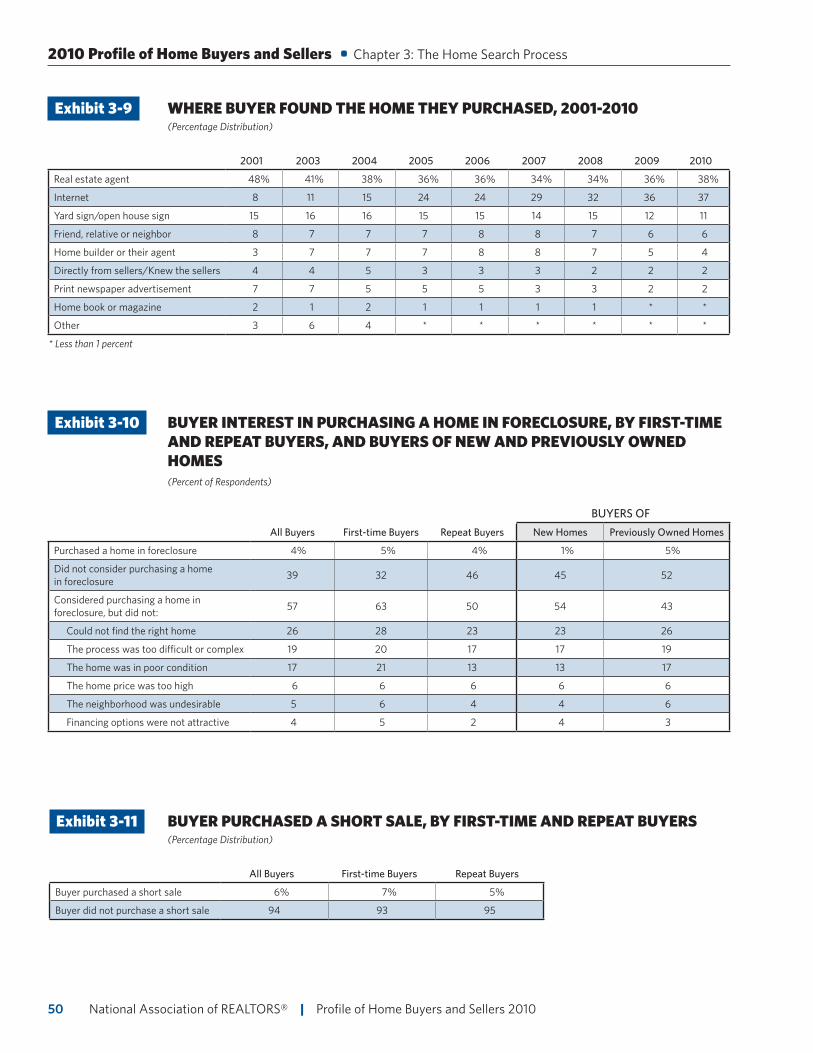
National Association of REALTORS® | Profile of Home Buyers and Sellers 201050
2010 Profile of Home Buyers and Sellers • Chapter 3: The Home Search Process
Exhibit 3-9 WHERE BUYER FOUND THE HOME THEY PURCHASED, 2001-2010 (Percentage Distribution)
2001 2003 2004 2005 2006 2007 2008 2009 2010
Real estate agent 48% 41% 38% 36% 36% 34% 34% 36% 38%
Internet 8 11 15 24 24 29 32 36 37
Yard sign/open house sign 15 16 16 15 15 14 15 12 11
Friend, relative or neighbor 8 7 7 7 8 8 7 6 6
Home builder or their agent 3 7 7 7 8 8 7 5 4
Directly from sellers/Knew the sellers 4 4 5 3 3 3 2 2 2
Print newspaper advertisement 7 7 5 5 5 3 3 2 2
Home book or magazine 2 1 2 1 1 1 1 * *
Other 3 6 4 * * * * * *
* Less than 1 percent
Exhibit 3-10 BUYER INTEREST IN PURCHASING A HOME IN FORECLOSURE, BY FIRST-TIME AND REPEAT BUYERS, AND BUYERS OF NEW AND PREVIOUSLY OWNED HOMES (Percent of Respondents)
BUYERS OF
All Buyers First-time Buyers Repeat Buyers New Homes Previously Owned Homes
Purchased a home in foreclosure 4% 5% 4% 1% 5%
Did not consider purchasing a home in foreclosure 39 32 46 45 52
Considered purchasing a home in foreclosure, but did not: 57 63 50 54 43
Could not find the right home 26 28 23 23 26
The process was too difficult or complex 19 20 17 17 19
The home was in poor condition 17 21 13 13 17
The home price was too high 6 6 6 6 6
The neighborhood was undesirable 5 6 4 4 6
Financing options were not attractive 4 5 2 4 3
Exhibit 3-11 BUYER PURCHASED A SHORT SALE, BY FIRST-TIME AND REPEAT BUYERS (Percentage Distribution)
All Buyers First-time Buyers Repeat Buyers
Buyer purchased a short sale 6% 7% 5%
Buyer did not purchase a short sale 94 93 95
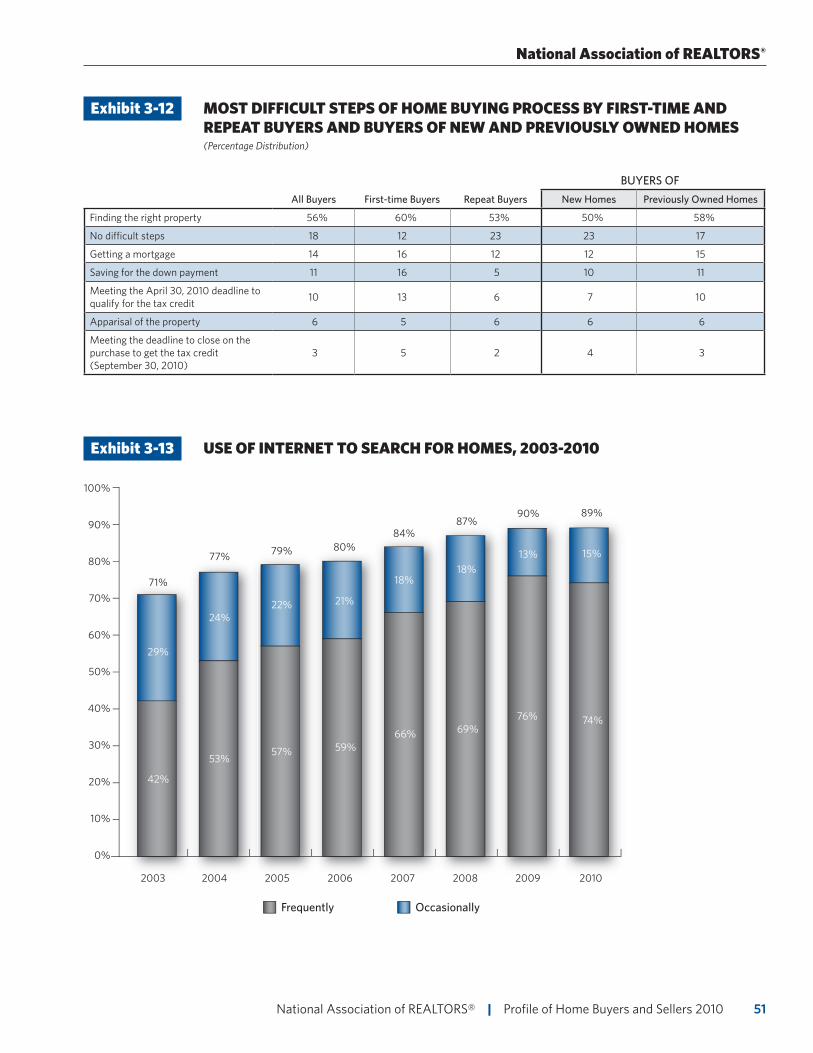
51 National Association of REALTORS® | Profile of Home Buyers and Sellers 2010
National Association of REALTORS®
Exhibit 3-12 MOST DIFFICULT STEPS OF HOME BUYING PROCESS BY FIRST-TIME AND REPEAT BUYERS AND BUYERS OF NEW AND PREVIOUSLY OWNED HOMES (Percentage Distribution)
BUYERS OF
All Buyers First-time Buyers Repeat Buyers New Homes Previously Owned Homes
Finding the right property 56% 60% 53% 50% 58%
No difficult steps 18 12 23 23 17
Getting a mortgage 14 16 12 12 15
Saving for the down payment 11 16 5 10 11
Meeting the April 30, 2010 deadline to qualify for the tax credit 10 13 6 7 10
Apparisal of the property 6 5 6 6 6
Meeting the deadline to close on the purchase to get the tax credit (September 30, 2010)
3 5 2 4 3
Exhibit 3-13 USE OF INTERNET TO SEARCH FOR HOMES, 2003-2010
70%
60%
50%
40%
30%
2003
20%
10%
0%
80%
90%
2004 2005 2006 2007 2008 2009 2010
21%
59%57%
42%
29%
22%24%
53%
100%
18%
66%
18%
69%
13%
76%
15%80%
71%
79%77%
84%87%
90% 89%
74%
Frequently Occasionally
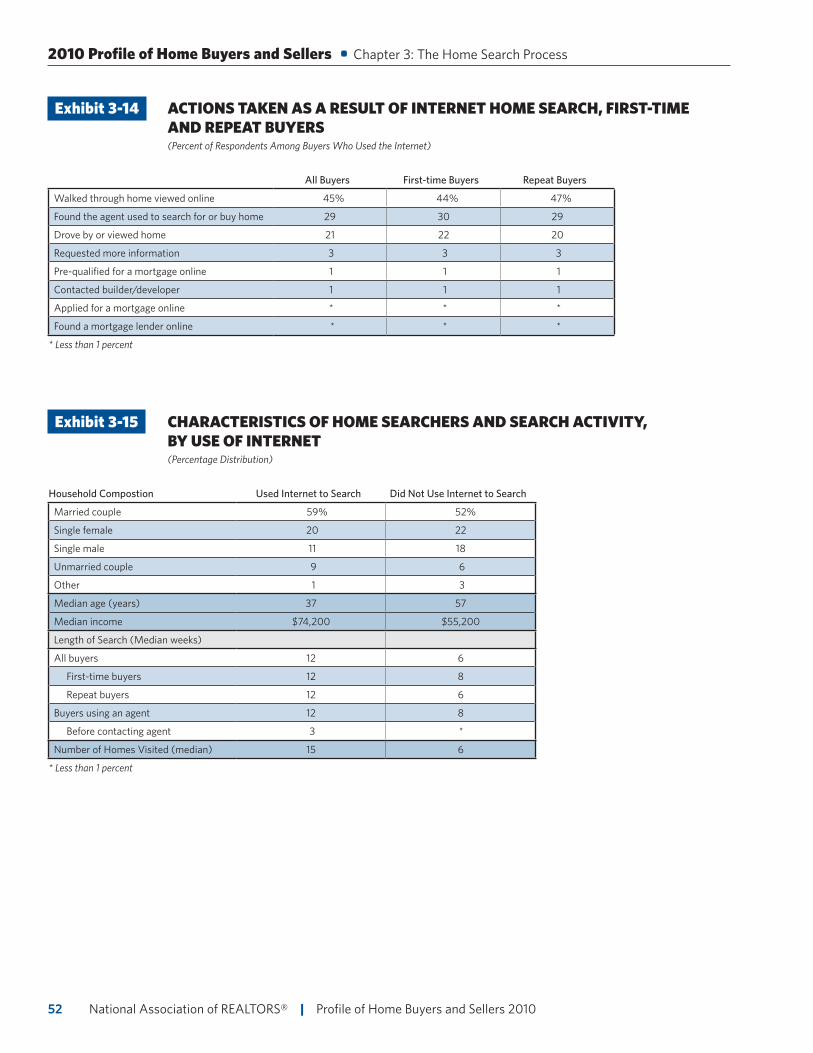
National Association of REALTORS® | Profile of Home Buyers and Sellers 201052
2010 Profile of Home Buyers and Sellers • Chapter 3: The Home Search Process
Exhibit 3-14 ACTIONS TAKEN AS A RESULT OF INTERNET HOME SEARCH, FIRST-TIME AND REPEAT BUYERS (Percent of Respondents Among Buyers Who Used the Internet)
All Buyers First-time Buyers Repeat Buyers
Walked through home viewed online 45% 44% 47%
Found the agent used to search for or buy home 29 30 29
Drove by or viewed home 21 22 20
Requested more information 3 3 3
Pre-qualified for a mortgage online 1 1 1
Contacted builder/developer 1 1 1
Applied for a mortgage online * * *
Found a mortgage lender online * * *
* Less than 1 percent
Exhibit 3-15 CHARACTERISTICS OF HOME SEARCHERS AND SEARCH ACTIVITY, BY USE OF INTERNET (Percentage Distribution)
Household Compostion Used Internet to Search Did Not Use Internet to Search
Married couple 59% 52%
Single female 20 22
Single male 11 18
Unmarried couple 9 6
Other 1 3
Median age (years) 37 57
Median income $74,200 $55,200
Length of Search (Median weeks)
All buyers 12 6
First-time buyers 12 8
Repeat buyers 12 6
Buyers using an agent 12 8
Before contacting agent 3 *
Number of Homes Visited (median) 15 6
* Less than 1 percent
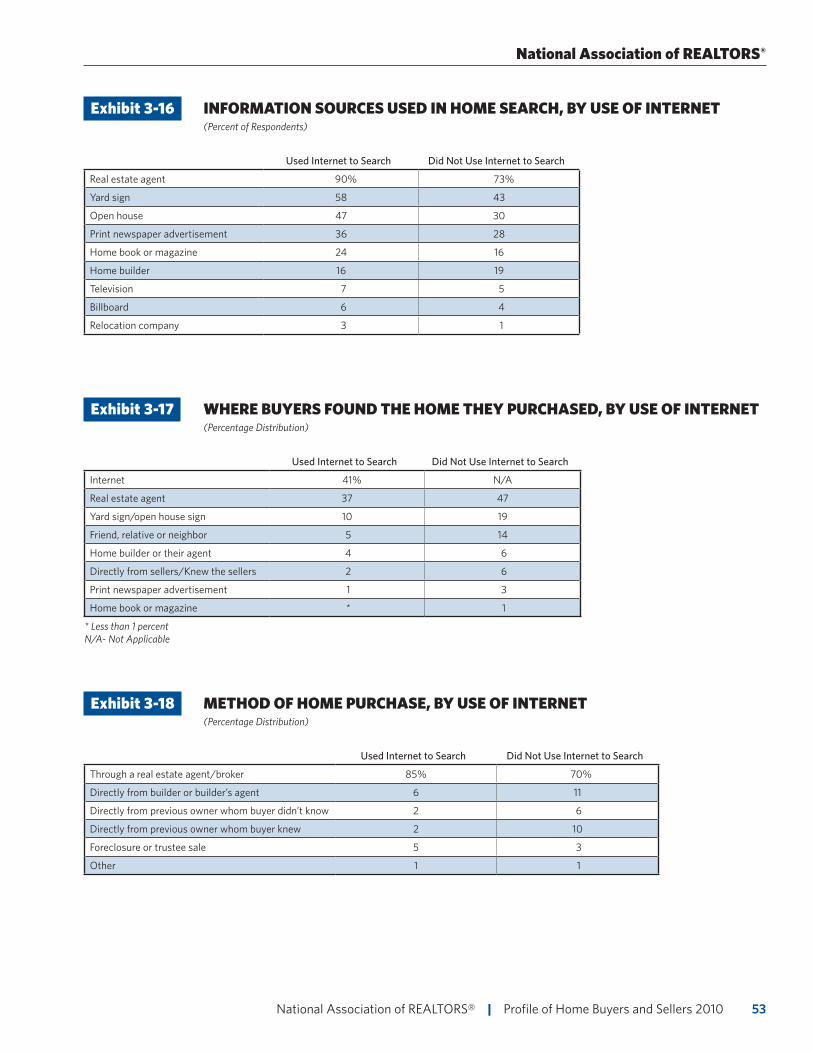
53 National Association of REALTORS® | Profile of Home Buyers and Sellers 2010
National Association of REALTORS®
Exhibit 3-16 INFORMATION SOURCES USED IN HOME SEARCH, BY USE OF INTERNET (Percent of Respondents)
Used Internet to Search Did Not Use Internet to Search
Real estate agent 90% 73%
Yard sign 58 43
Open house 47 30
Print newspaper advertisement 36 28
Home book or magazine 24 16
Home builder 16 19
Television 7 5
Billboard 6 4
Relocation company 3 1
Exhibit 3-17 WHERE BUYERS FOUND THE HOME THEY PURCHASED, BY USE OF INTERNET (Percentage Distribution)
Used Internet to Search Did Not Use Internet to Search
Internet 41% N/A
Real estate agent 37 47
Yard sign/open house sign 10 19
Friend, relative or neighbor 5 14
Home builder or their agent 4 6
Directly from sellers/Knew the sellers 2 6
Print newspaper advertisement 1 3
Home book or magazine * 1
* Less than 1 percent N/A- Not Applicable
Exhibit 3-18 METHOD OF HOME PURCHASE, BY USE OF INTERNET (Percentage Distribution)
Used Internet to Search Did Not Use Internet to Search
Through a real estate agent/broker 85% 70%
Directly from builder or builder’s agent 6 11
Directly from previous owner whom buyer didn’t know 2 6
Directly from previous owner whom buyer knew 2 10
Foreclosure or trustee sale 5 3
Other 1 1
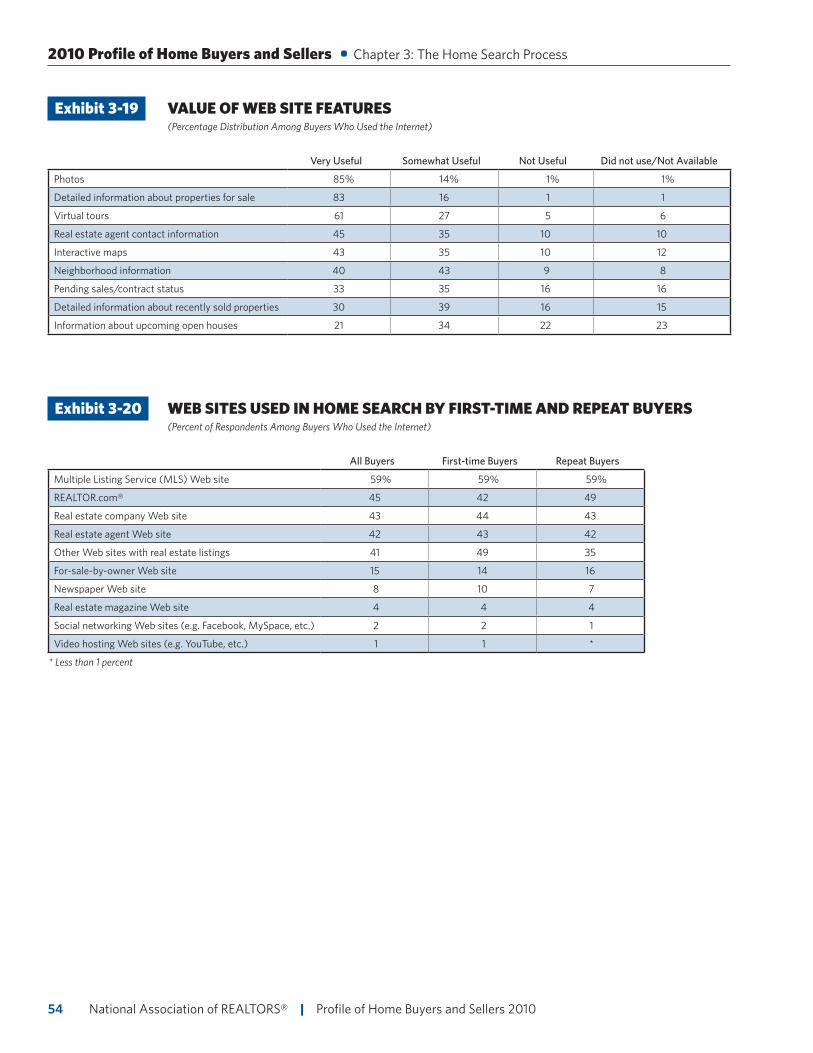
National Association of REALTORS® | Profile of Home Buyers and Sellers 201054
Exhibit 3-19 VALUE OF WEB SITE FEATURES (Percentage Distribution Among Buyers Who Used the Internet)
Very Useful Somewhat Useful Not Useful Did not use/Not Available
Photos 85% 14% 1% 1%
Detailed information about properties for sale 83 16 1 1
Virtual tours 61 27 5 6
Real estate agent contact information 45 35 10 10
Interactive maps 43 35 10 12
Neighborhood information 40 43 9 8
Pending sales/contract status 33 35 16 16
Detailed information about recently sold properties 30 39 16 15
Information about upcoming open houses 21 34 22 23
Exhibit 3-20 WEB SITES USED IN HOME SEARCH BY FIRST-TIME AND REPEAT BUYERS (Percent of Respondents Among Buyers Who Used the Internet)
All Buyers First-time Buyers Repeat Buyers
Multiple Listing Service (MLS) Web site 59% 59% 59%
REALTOR.com® 45 42 49
Real estate company Web site 43 44 43
Real estate agent Web site 42 43 42
Other Web sites with real estate listings 41 49 35
For-sale-by-owner Web site 15 14 16
Newspaper Web site 8 10 7
Real estate magazine Web site 4 4 4
Social networking Web sites (e.g. Facebook, MySpace, etc.) 2 2 1
Video hosting Web sites (e.g. YouTube, etc.) 1 1 *
* Less than 1 percent
2010 Profile of Home Buyers and Sellers • Chapter 3: The Home Search Process
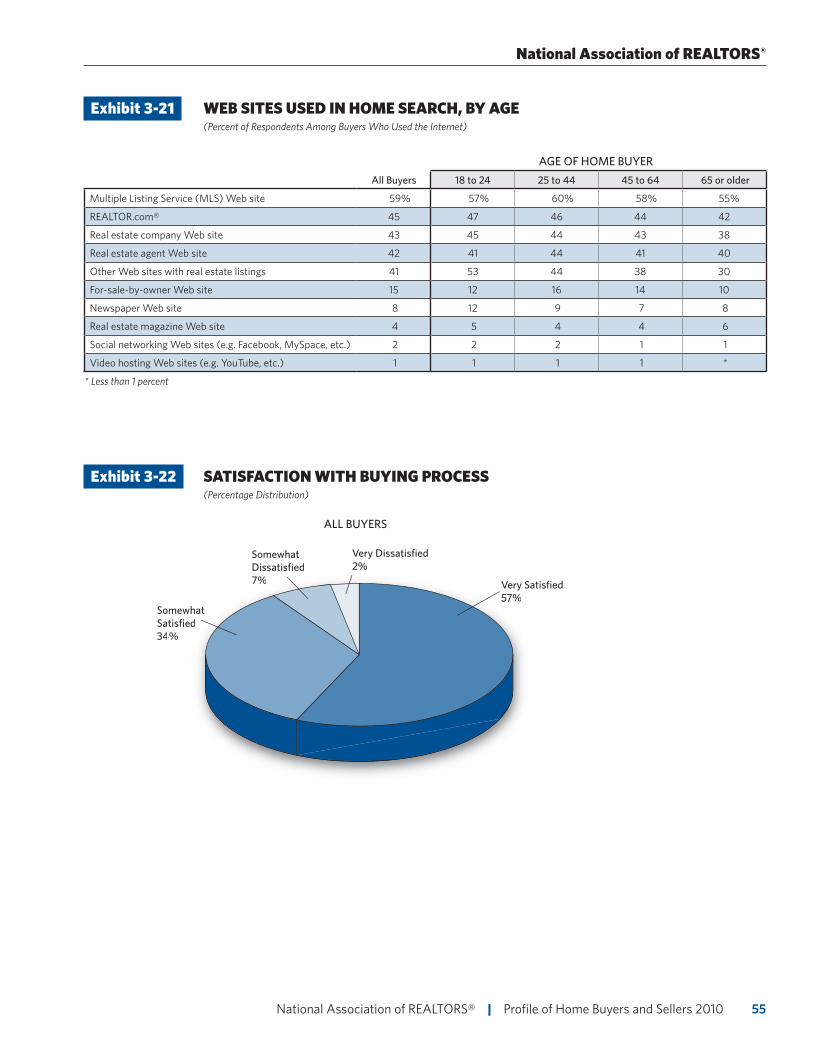
55 National Association of REALTORS® | Profile of Home Buyers and Sellers 2010
National Association of REALTORS®
Exhibit 3-21 WEB SITES USED IN HOME SEARCH, BY AGE (Percent of Respondents Among Buyers Who Used the Internet)
AGE OF HOME BUYER
All Buyers 18 to 24 25 to 44 45 to 64 65 or older
Multiple Listing Service (MLS) Web site 59% 57% 60% 58% 55%
REALTOR.com® 45 47 46 44 42
Real estate company Web site 43 45 44 43 38
Real estate agent Web site 42 41 44 41 40
Other Web sites with real estate listings 41 53 44 38 30
For-sale-by-owner Web site 15 12 16 14 10
Newspaper Web site 8 12 9 7 8
Real estate magazine Web site 4 5 4 4 6
Social networking Web sites (e.g. Facebook, MySpace, etc.) 2 2 2 1 1
Video hosting Web sites (e.g. YouTube, etc.) 1 1 1 1 *
* Less than 1 percent
Exhibit 3-22 SATISFACTION WITH BUYING PROCESS (Percentage Distribution)
Somewhat Dissatisfied7% Very Satisfied
57%Somewhat Satisfied34%
Very Dissatisfied2%
Somewhat Dissatisfied7% Very Satisfie
57%mewhat tisfied
4%
Very Dissatisfied2%
ALL BUYERS
56
Chapter 4: Home Buying and Real Estate Professionals
Most buyers purchase their homes through a real estate agent or broker. While nearly all buyers of previously owned homes use real estate agents, a sizeable portion of new home buyers
purchase their homes through developers. During this current downturn in housing, the portion of new homes is down significantly, so the share of buyers using agents is up noticeably.
Agents and buyers share a lot of critical information, so most agents have their buyers sign disclosure agreements. Buyer representative arrangements are sometimes less formal agreements between buyers and agents. In the past year, the sellers compensated the real estate agents in the majority of transactions.
Buyers are most often looking for real estate agents to help them find the right home. Buyers also want help with the negotiation and the paperwork. Some stand-out benefits that buyers received beyond their primary needs: help understanding the process and help pointing out unnoticed features or faults with a property.
Referrals are the primary method for finding an agent for most buyers. Most buyers only interviewed one agent during their search process. Buyers tend to look for agents with a good reputation who are honest and trustworthy. In the end, most buyers are satisfied with their agent and would recommend their agent to others.
National Association of REALTORS® | Profile of Home Buyers and Sellers 2010
57 National Association of REALTORS® | Profile of Home Buyers and Sellers 2010
METHOD OF HOME PURCHASE
• Exhibits 4-1 through 4-4
A majority of buyers purchase their home through a real estate agent or broker. In 2010, 83 percent of buyers used a real estate agent, up steadily from the 69 percent share in 2001. With new home sales declining, a smaller share of buyers purchased their home directly from a builder or builder’s agent. One in twenty purchased a home directly from the previous owner.
Regionally, there are some differences. A greater share of buyers in the Northeast used a real estate agent compared with the South, which has a larger share of new homes and more buyers purchasing their homes directly from builders. Roughly six in ten buyers of new homes used a real estate agent, while almost nine in ten buyers of previously owned homes used a real estate agent. A similar share of buyers use a real estate agent or broker across various types of households.
AGENT REPRESENTATION AND COMPENSATION
• Exhibits 4-5 through 4-7
Due to the nature of the information that agents and buyers share, disclosure agreements are important. Roughly six in ten buyers sign a disclosure statement, with about a quarter of buyers signing one at their first meeting with an agent. A slightly larger share of repeat buyers signs a disclosure agreement than first-time buyers. Less than one in five buyers (17 percent) signed a written buyer representative arrangement. Four in ten buyers had an oral buyer representative arrangement.
Real estate agents were compensated by the seller only in about two in three transactions. The buyer alone paid in about one in seven instances, while in just under one in ten occurrences the buyer and seller both paid.
WHAT BUYERS WANT FROM AGENTS AND BENEFITS PROVIDED
• Exhibits 4-8 through 4-11
Buyers look to real estate agents to help with many aspects of the purchase. Just over half of buyers said that what they want most from their agent was help finding the right home. About one in seven wanted real estate agents to help negotiate terms of the sale, twelve percent wanted help with price negotiations, and one in ten wanted help with the paperwork. These percentages are similar among first-time and repeat buyers, new and previously owned home buyers, and various types of households.
Real estate agents serve many functions during the home purchase process. Buyers most often noted that the benefit of having an agent was helping them understand the process (66 percent), more so for first-time buyers. Also, about half of buyers noted that real estate agents pointed out unnoticed features or faults with a property, while more than four in ten said real estate agents negotiated better sales contract terms, improved buyers’ knowledge of search areas, and provided a better list of service providers.
National Association of REALTORS®
National Association of REALTORS® | Profile of Home Buyers and Sellers 201058
FINDING A REAL ESTATE AGENT
• Exhibits 4-12 through 4-14
Roughly half of buyers find their real estate agent through a referral from a friend, neighbor, or relative. First-time buyers are more likely to find their real estate agent from a referral. Repeat buyers more often use an agent they previously used to buy or sell a home. One in ten buyers found their real estate agent through a web site. There is little difference across type of households; however, unmarried couples tended to rely on referrals slightly more than other types of households.
Most buyers (64 percent) only interviewed one real estate agent in their search. Only one in six buyers interviewed three or more real estate agents before finding the best match. The search for a real estate agent was similar in terms of number of interviews for both repeat and first-time buyers.
FACTORS WHEN CHOOSING AN AGENT
• Exhibits 4-15 through 4-18
The personal connection a buyer has with an agent is very important. The most important factor for buyers choosing an agent is whether the agent is honest and trustworthy. The reputation of an agent is also a significant factor for buyers, as is whether or not the agent is a friend or family member. Less important are an agent’s association with a particular firm and professional designations held.
Aside from personal characteristics like honesty, integrity and responsiveness, which are very important skills and qualities that buyers look for in agents, knowledge of the real estate market and purchase process are very important qualities for more than nine in ten buyers. Buyers’ preferences for real estate agents skills and qualities don’t differ much between first-time or repeat buyers and buyers of new or previously owned homes. A greater share of single female buyers prefer agents with strong communication and negotiation skills in comparison to single male buyers.
SATISFACTION WITH AGENT
• Exhibits 4-19 and 4-20
Most buyers are satisfied with their agents. Almost nine in ten (87 percent) buyers would probably recommend their agent to others. Buyers are most often very satisfied with their agents’ knowledge of the purchase process and their agents’ honesty and integrity. Buyers tend to have slightly less satisfaction overall with agents’ negotiation and technology skills.
Aside from personal characteristics like honesty, integrity and responsiveness which are very important skills and qualities that
buyers look for in agents, knowledge of the real estate market and purchase process are very
important qualities for over nine in ten buyers.
2010 Profile of Home Buyers and Sellers • Chapter 4: Home Buying and Real Estate Professionals
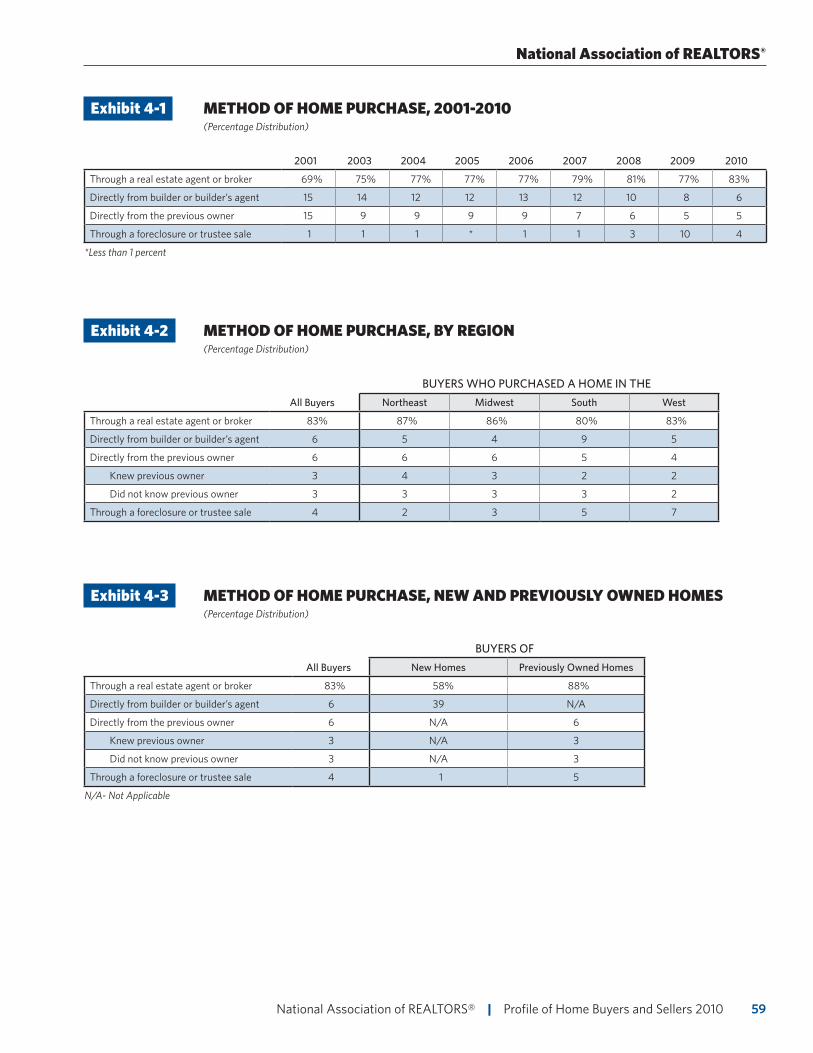
59 National Association of REALTORS® | Profile of Home Buyers and Sellers 2010
Exhibit 4-1 METHOD OF HOME PURCHASE, 2001-2010 (Percentage Distribution)
2001 2003 2004 2005 2006 2007 2008 2009 2010
Through a real estate agent or broker 69% 75% 77% 77% 77% 79% 81% 77% 83%
Directly from builder or builder’s agent 15 14 12 12 13 12 10 8 6
Directly from the previous owner 15 9 9 9 9 7 6 5 5
Through a foreclosure or trustee sale 1 1 1 * 1 1 3 10 4
*Less than 1 percent
Exhibit 4-2 METHOD OF HOME PURCHASE, BY REGION (Percentage Distribution)
BUYERS WHO PURCHASED A HOME IN THE
All Buyers Northeast Midwest South West
Through a real estate agent or broker 83% 87% 86% 80% 83%
Directly from builder or builder’s agent 6 5 4 9 5
Directly from the previous owner 6 6 6 5 4
Knew previous owner 3 4 3 2 2
Did not know previous owner 3 3 3 3 2
Through a foreclosure or trustee sale 4 2 3 5 7
Exhibit 4-3 METHOD OF HOME PURCHASE, NEW AND PREVIOUSLY OWNED HOMES (Percentage Distribution)
BUYERS OF
All Buyers New Homes Previously Owned Homes
Through a real estate agent or broker 83% 58% 88%
Directly from builder or builder’s agent 6 39 N/A
Directly from the previous owner 6 N/A 6
Knew previous owner 3 N/A 3
Did not know previous owner 3 N/A 3
Through a foreclosure or trustee sale 4 1 5
N/A- Not Applicable
National Association of REALTORS®
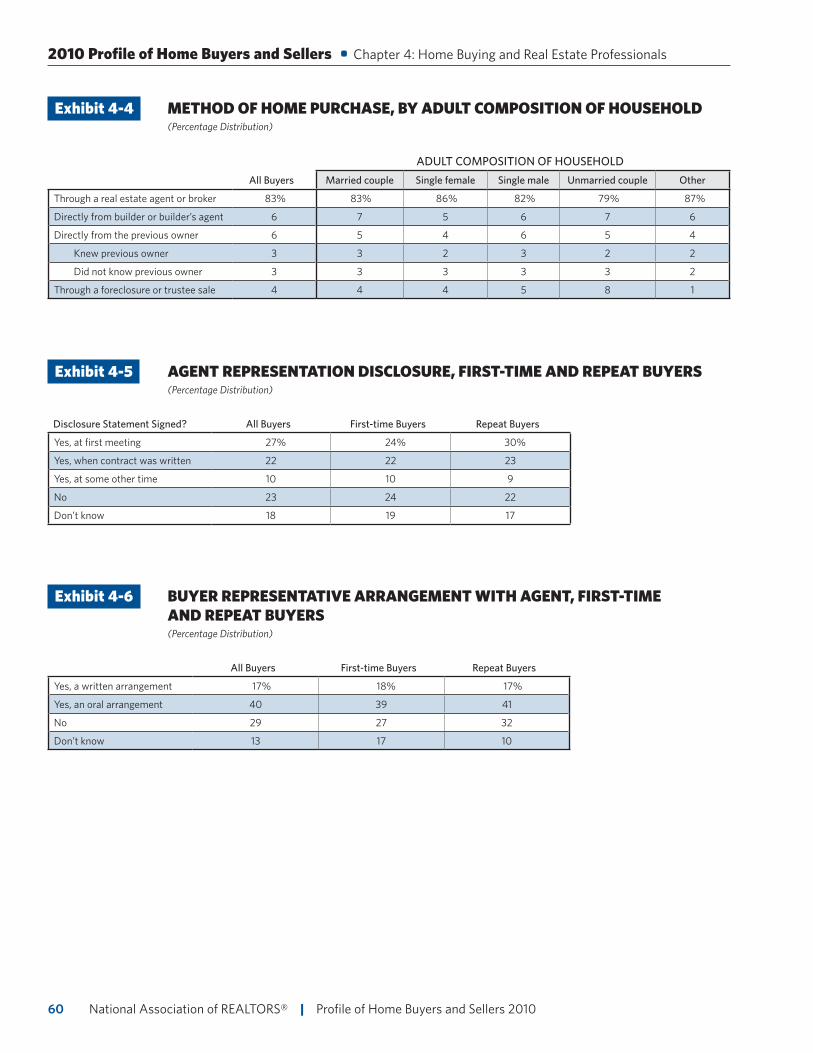
National Association of REALTORS® | Profile of Home Buyers and Sellers 201060
Exhibit 4-4 METHOD OF HOME PURCHASE, BY ADULT COMPOSITION OF HOUSEHOLD (Percentage Distribution)
ADULT COMPOSITION OF HOUSEHOLD
All Buyers Married couple Single female Single male Unmarried couple Other
Through a real estate agent or broker 83% 83% 86% 82% 79% 87%
Directly from builder or builder’s agent 6 7 5 6 7 6
Directly from the previous owner 6 5 4 6 5 4
Knew previous owner 3 3 2 3 2 2
Did not know previous owner 3 3 3 3 3 2
Through a foreclosure or trustee sale 4 4 4 5 8 1
Exhibit 4-5 AGENT REPRESENTATION DISCLOSURE, FIRST-TIME AND REPEAT BUYERS (Percentage Distribution)
Disclosure Statement Signed? All Buyers First-time Buyers Repeat Buyers
Yes, at first meeting 27% 24% 30%
Yes, when contract was written 22 22 23
Yes, at some other time 10 10 9
No 23 24 22
Don’t know 18 19 17
Exhibit 4-6 BUYER REPRESENTATIVE ARRANGEMENT WITH AGENT, FIRST-TIME AND REPEAT BUYERS (Percentage Distribution)
All Buyers First-time Buyers Repeat Buyers
Yes, a written arrangement 17% 18% 17%
Yes, an oral arrangement 40 39 41
No 29 27 32
Don’t know 13 17 10
2010 Profile of Home Buyers and Sellers • Chapter 4: Home Buying and Real Estate Professionals
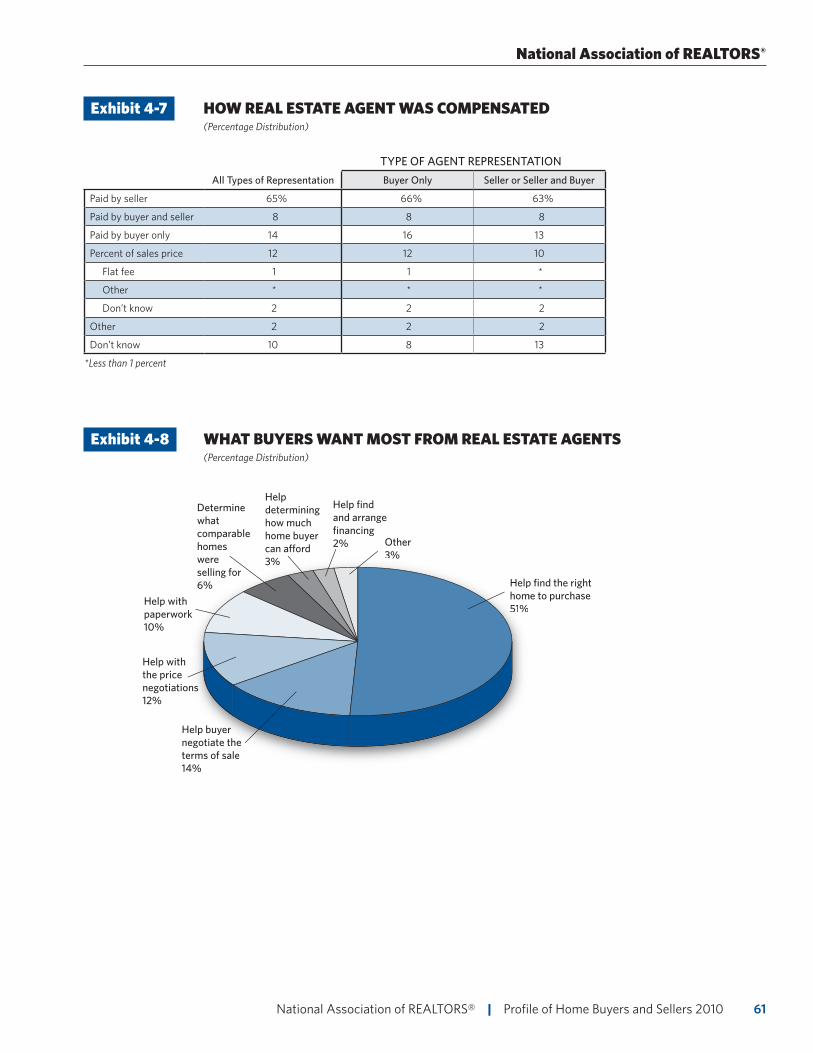
61 National Association of REALTORS® | Profile of Home Buyers and Sellers 2010
Exhibit 4-7 HOW REAL ESTATE AGENT WAS COMPENSATED (Percentage Distribution)
TYPE OF AGENT REPRESENTATION
All Types of Representation Buyer Only Seller or Seller and Buyer
Paid by seller 65% 66% 63%
Paid by buyer and seller 8 8 8
Paid by buyer only 14 16 13
Percent of sales price 12 12 10
Flat fee 1 1 *
Other * * *
Don’t know 2 2 2
Other 2 2 2
Don’t know 10 8 13
*Less than 1 percent
Exhibit 4-8 WHAT BUYERS WANT MOST FROM REAL ESTATE AGENTS (Percentage Distribution)
Help buyer negotiate the terms of sale14%
Other3%
Help find the right home to purchase51%
Help buyer negotiate theterms of sale14%
Other3%
Helphom51%
Help with the price negotiations12%
Help with paperwork10%
Determine what comparable homes were selling for6%
Help determining how much home buyer can afford3%
Help find and arrange financing2%
National Association of REALTORS®
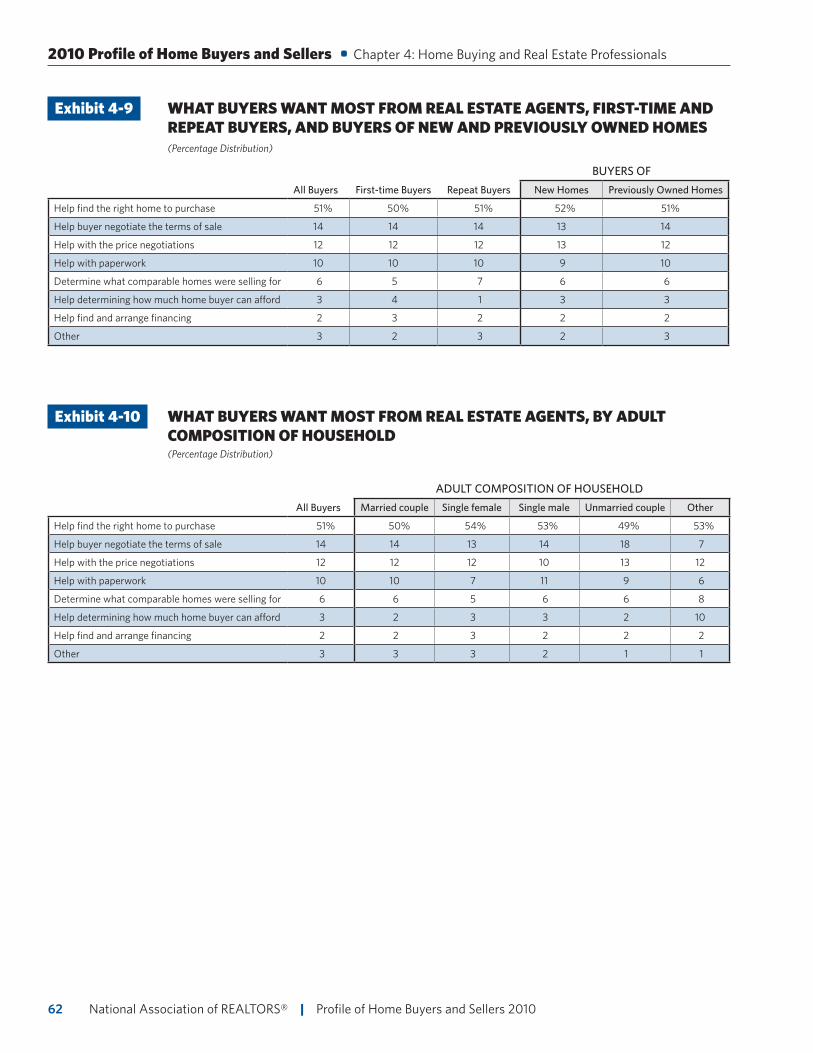
National Association of REALTORS® | Profile of Home Buyers and Sellers 201062
Exhibit 4-9 WHAT BUYERS WANT MOST FROM REAL ESTATE AGENTS, FIRST-TIME AND REPEAT BUYERS, AND BUYERS OF NEW AND PREVIOUSLY OWNED HOMES (Percentage Distribution)
BUYERS OF
All Buyers First-time Buyers Repeat Buyers New Homes Previously Owned Homes
Help find the right home to purchase 51% 50% 51% 52% 51%
Help buyer negotiate the terms of sale 14 14 14 13 14
Help with the price negotiations 12 12 12 13 12
Help with paperwork 10 10 10 9 10
Determine what comparable homes were selling for 6 5 7 6 6
Help determining how much home buyer can afford 3 4 1 3 3
Help find and arrange financing 2 3 2 2 2
Other 3 2 3 2 3
Exhibit 4-10 WHAT BUYERS WANT MOST FROM REAL ESTATE AGENTS, BY ADULT COMPOSITION OF HOUSEHOLD (Percentage Distribution)
ADULT COMPOSITION OF HOUSEHOLD
All Buyers Married couple Single female Single male Unmarried couple Other
Help find the right home to purchase 51% 50% 54% 53% 49% 53%
Help buyer negotiate the terms of sale 14 14 13 14 18 7
Help with the price negotiations 12 12 12 10 13 12
Help with paperwork 10 10 7 11 9 6
Determine what comparable homes were selling for 6 6 5 6 6 8
Help determining how much home buyer can afford 3 2 3 3 2 10
Help find and arrange financing 2 2 3 2 2 2
Other 3 3 3 2 1 1
2010 Profile of Home Buyers and Sellers • Chapter 4: Home Buying and Real Estate Professionals
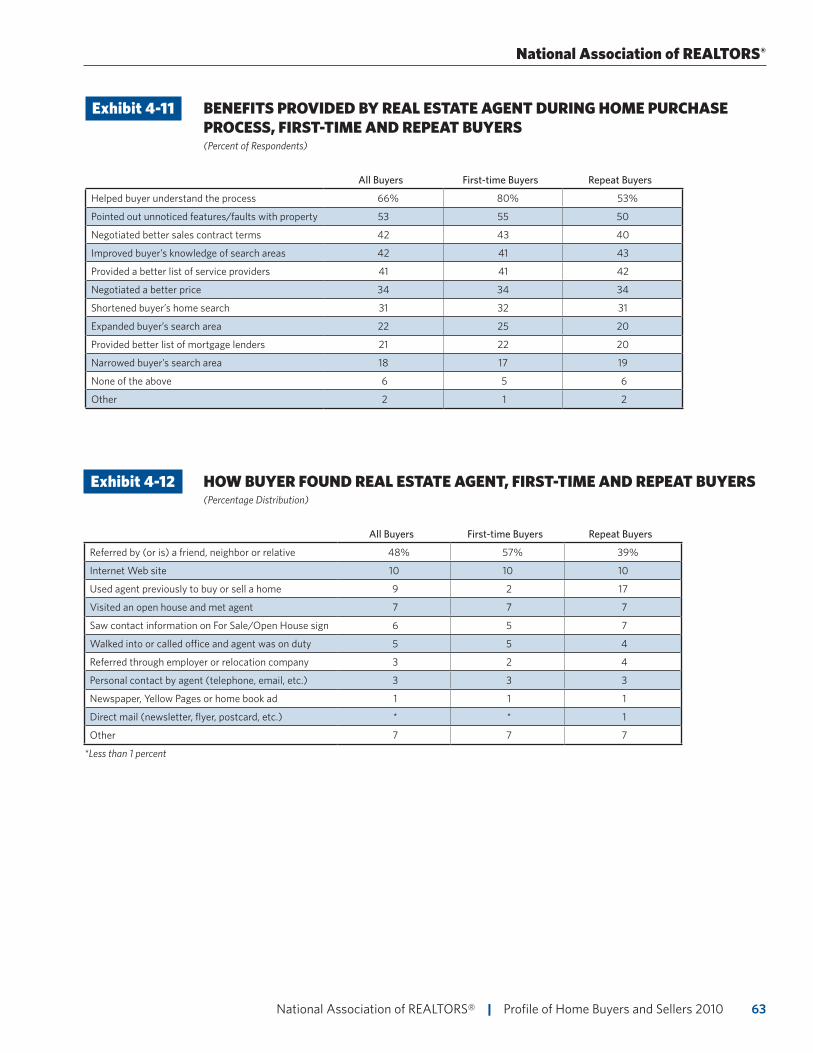
63 National Association of REALTORS® | Profile of Home Buyers and Sellers 2010
Exhibit 4-12 HOW BUYER FOUND REAL ESTATE AGENT, FIRST-TIME AND REPEAT BUYERS (Percentage Distribution)
All Buyers First-time Buyers Repeat Buyers
Referred by (or is) a friend, neighbor or relative 48% 57% 39%
Internet Web site 10 10 10
Used agent previously to buy or sell a home 9 2 17
Visited an open house and met agent 7 7 7
Saw contact information on For Sale/Open House sign 6 5 7
Walked into or called office and agent was on duty 5 5 4
Referred through employer or relocation company 3 2 4
Personal contact by agent (telephone, email, etc.) 3 3 3
Newspaper, Yellow Pages or home book ad 1 1 1
Direct mail (newsletter, flyer, postcard, etc.) * * 1
Other 7 7 7
*Less than 1 percent
Exhibit 4-11 BENEFITS PROVIDED BY REAL ESTATE AGENT DURING HOME PURCHASE PROCESS, FIRST-TIME AND REPEAT BUYERS (Percent of Respondents)
All Buyers First-time Buyers Repeat Buyers
Helped buyer understand the process 66% 80% 53%
Pointed out unnoticed features/faults with property 53 55 50
Negotiated better sales contract terms 42 43 40
Improved buyer’s knowledge of search areas 42 41 43
Provided a better list of service providers 41 41 42
Negotiated a better price 34 34 34
Shortened buyer’s home search 31 32 31
Expanded buyer’s search area 22 25 20
Provided better list of mortgage lenders 21 22 20
Narrowed buyer’s search area 18 17 19
None of the above 6 5 6
Other 2 1 2
National Association of REALTORS®
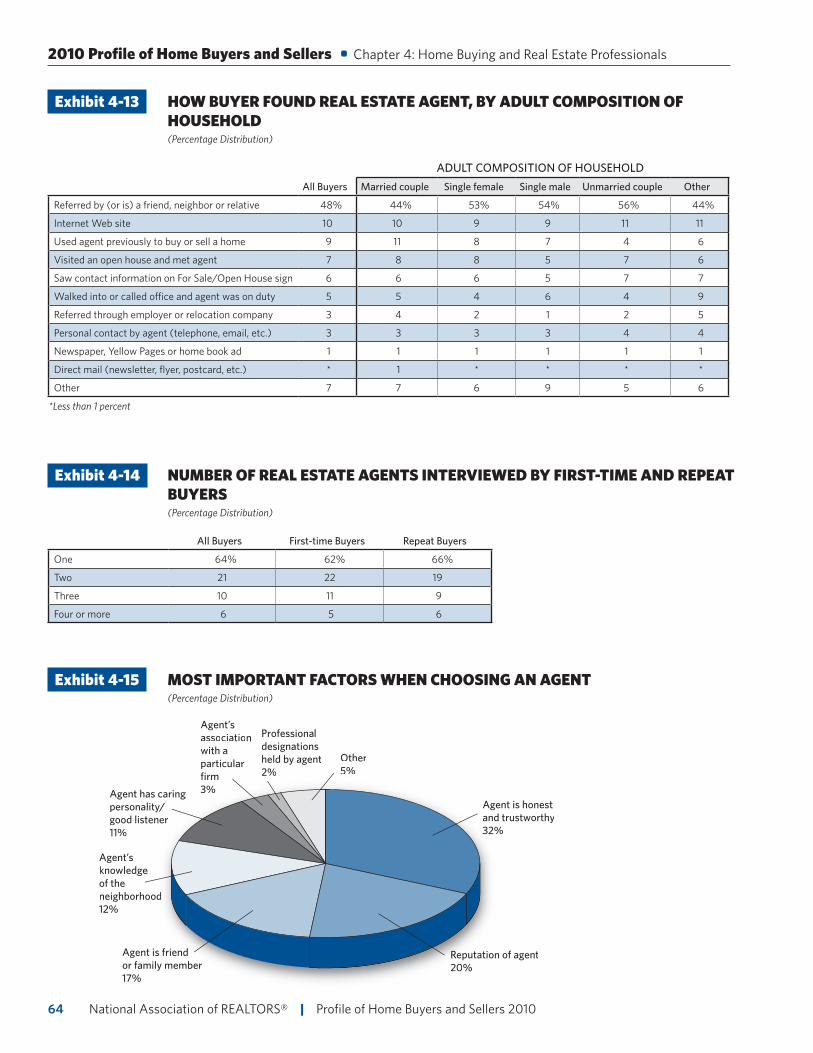
National Association of REALTORS® | Profile of Home Buyers and Sellers 201064
Exhibit 4-13 HOW BUYER FOUND REAL ESTATE AGENT, BY ADULT COMPOSITION OF HOUSEHOLD (Percentage Distribution)
ADULT COMPOSITION OF HOUSEHOLD
All Buyers Married couple Single female Single male Unmarried couple Other
Referred by (or is) a friend, neighbor or relative 48% 44% 53% 54% 56% 44%
Internet Web site 10 10 9 9 11 11
Used agent previously to buy or sell a home 9 11 8 7 4 6
Visited an open house and met agent 7 8 8 5 7 6
Saw contact information on For Sale/Open House sign 6 6 6 5 7 7
Walked into or called office and agent was on duty 5 5 4 6 4 9
Referred through employer or relocation company 3 4 2 1 2 5
Personal contact by agent (telephone, email, etc.) 3 3 3 3 4 4
Newspaper, Yellow Pages or home book ad 1 1 1 1 1 1
Direct mail (newsletter, flyer, postcard, etc.) * 1 * * * *
Other 7 7 6 9 5 6
*Less than 1 percent
Exhibit 4-14 NUMBER OF REAL ESTATE AGENTS INTERVIEWED BY FIRST-TIME AND REPEAT BUYERS (Percentage Distribution)
All Buyers First-time Buyers Repeat Buyers
One 64% 62% 66%
Two 21 22 19
Three 10 11 9
Four or more 6 5 6
Exhibit 4-15 MOST IMPORTANT FACTORS WHEN CHOOSING AN AGENT (Percentage Distribution)
Agent is friend or family member17%
Other5%
Agent is honest and trustworthy32%
Agent’s knowledge of the neighborhood12%
Agent has caring personality/good listener11%
Reputation of agent20%
Agent’s association with a particular firm3%
Professional designations held by agent2%
Agent is friend or family member17%
Other5%
Agent is honest and trustworthy32%
Agent’sknowledge of the neighborhood12%
Agent has caring personality/good listener11%
Reputation of agent20%
Agent’sassociationwith a particular firm3%
Professional designations held by agent2%
2010 Profile of Home Buyers and Sellers • Chapter 4: Home Buying and Real Estate Professionals
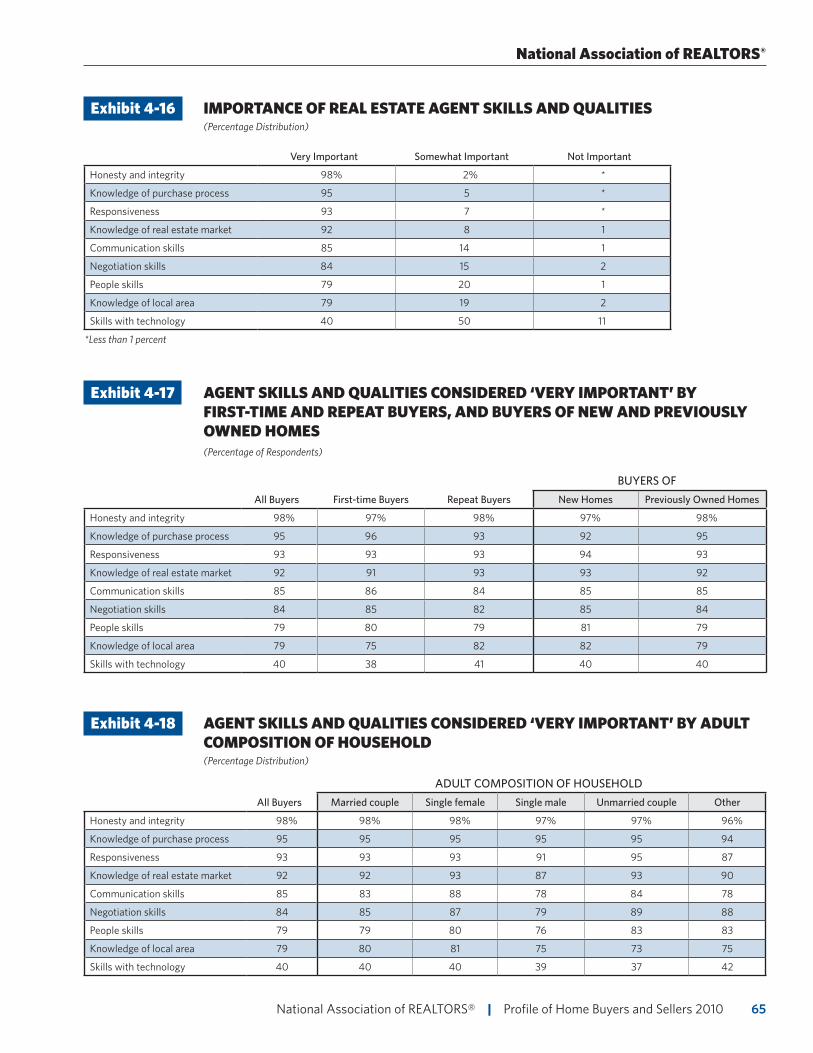
65 National Association of REALTORS® | Profile of Home Buyers and Sellers 2010
Exhibit 4-17 AGENT SKILLS AND QUALITIES CONSIDERED ‘VERY IMPORTANT’ BY FIRST-TIME AND REPEAT BUYERS, AND BUYERS OF NEW AND PREVIOUSLY OWNED HOMES (Percentage of Respondents)
BUYERS OF
All Buyers First-time Buyers Repeat Buyers New Homes Previously Owned Homes
Honesty and integrity 98% 97% 98% 97% 98%
Knowledge of purchase process 95 96 93 92 95
Responsiveness 93 93 93 94 93
Knowledge of real estate market 92 91 93 93 92
Communication skills 85 86 84 85 85
Negotiation skills 84 85 82 85 84
People skills 79 80 79 81 79
Knowledge of local area 79 75 82 82 79
Skills with technology 40 38 41 40 40
Exhibit 4-16 IMPORTANCE OF REAL ESTATE AGENT SKILLS AND QUALITIES (Percentage Distribution)
Very Important Somewhat Important Not Important
Honesty and integrity 98% 2% *
Knowledge of purchase process 95 5 *
Responsiveness 93 7 *
Knowledge of real estate market 92 8 1
Communication skills 85 14 1
Negotiation skills 84 15 2
People skills 79 20 1
Knowledge of local area 79 19 2
Skills with technology 40 50 11
*Less than 1 percent
Exhibit 4-18 AGENT SKILLS AND QUALITIES CONSIDERED ‘VERY IMPORTANT’ BY ADULT COMPOSITION OF HOUSEHOLD (Percentage Distribution)
ADULT COMPOSITION OF HOUSEHOLD
All Buyers Married couple Single female Single male Unmarried couple Other
Honesty and integrity 98% 98% 98% 97% 97% 96%
Knowledge of purchase process 95 95 95 95 95 94
Responsiveness 93 93 93 91 95 87
Knowledge of real estate market 92 92 93 87 93 90
Communication skills 85 83 88 78 84 78
Negotiation skills 84 85 87 79 89 88
People skills 79 79 80 76 83 83
Knowledge of local area 79 80 81 75 73 75
Skills with technology 40 40 40 39 37 42
National Association of REALTORS®
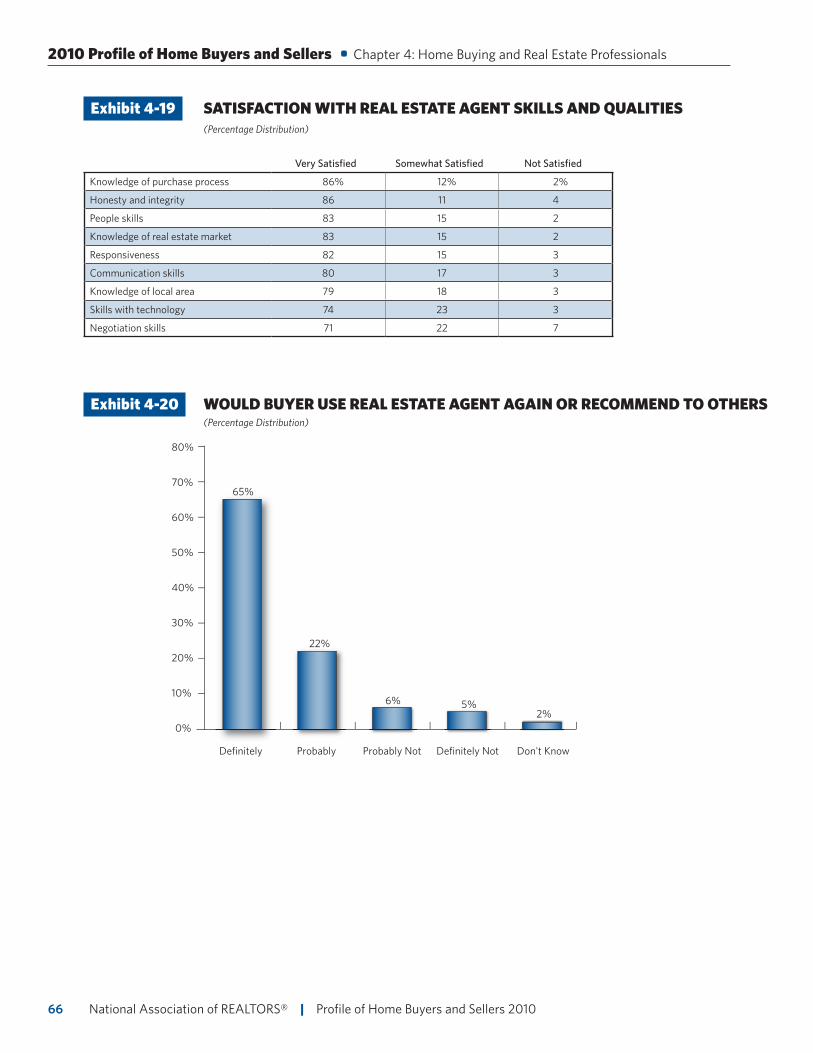
National Association of REALTORS® | Profile of Home Buyers and Sellers 201066
Exhibit 4-19 SATISFACTION WITH REAL ESTATE AGENT SKILLS AND QUALITIES (Percentage Distribution)
Very Satisfied Somewhat Satisfied Not Satisfied
Knowledge of purchase process 86% 12% 2%
Honesty and integrity 86 11 4
People skills 83 15 2
Knowledge of real estate market 83 15 2
Responsiveness 82 15 3
Communication skills 80 17 3
Knowledge of local area 79 18 3
Skills with technology 74 23 3
Negotiation skills 71 22 7
Exhibit 4-20 WOULD BUYER USE REAL ESTATE AGENT AGAIN OR RECOMMEND TO OTHERS (Percentage Distribution)
70%
60%
50%
40%
30%
Definitely
20%
10%
0%
80%
Probably Probably Not Definitely Not Don't Know
65%
22%
6% 5%2%
2010 Profile of Home Buyers and Sellers • Chapter 4: Home Buying and Real Estate Professionals
67 National Association of REALTORS® | Profile of Home Buyers and Sellers 2010
Chapter 5: Financing the Home Purchase
Despite the ongoing weakness in the housing market, many home buyers continue to finance their home purchase in a similar fashion compared to previous years. Ninety-one percent of home buyers
used some sort of mortgage financing, similar to the previous year’s survey. Older buyers tended to use financing less often, most likely due to equity from other homes’ they may have owned.
Homeowners continued to make sacrifices in order to reap the benefits of homeownership, giving up some luxury goods and some of their savings in order to invest in a home purchase. While the mortgage market has been tighter, the overwhelming majority of home buyers had little or no difficulty obtaining mortgage financing. Of those obtaining a mortgage, a considerable share (43 percent) turned to FHA loans that offered much smaller down payments. Also, ninety-three percent of first home buyers and just under half of repeat buyers took advantage of the home buyer tax credit, which offered a credit of up to $8,000 on a home purchase.
Home buyers continue to see homes as a very important investment in their future. Most indicated that homes were as good or better an investment than stocks as in past surveys.
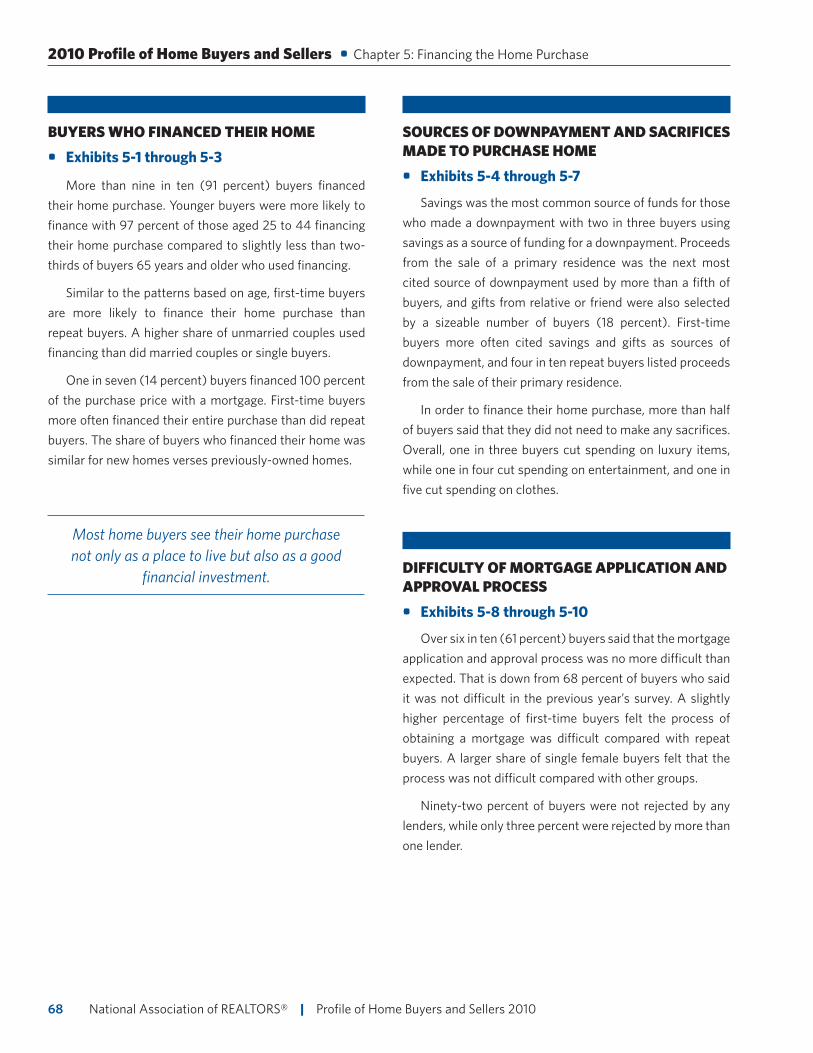
National Association of REALTORS® | Profile of Home Buyers and Sellers 201068
2010 Profile of Home Buyers and Sellers • Chapter 5: Financing the Home Purchase
BUYERS WHO FINANCED THEIR HOME
• Exhibits 5-1 through 5-3
More than nine in ten (91 percent) buyers financed their home purchase. Younger buyers were more likely to finance with 97 percent of those aged 25 to 44 financing their home purchase compared to slightly less than two-thirds of buyers 65 years and older who used financing.
Similar to the patterns based on age, first-time buyers are more likely to finance their home purchase than repeat buyers. A higher share of unmarried couples used financing than did married couples or single buyers.
One in seven (14 percent) buyers financed 100 percent of the purchase price with a mortgage. First-time buyers more often financed their entire purchase than did repeat buyers. The share of buyers who financed their home was similar for new homes verses previously-owned homes.
SOURCES OF DOWNPAYMENT AND SACRIFICES MADE TO PURCHASE HOME
• Exhibits 5-4 through 5-7
Savings was the most common source of funds for those who made a downpayment with two in three buyers using savings as a source of funding for a downpayment. Proceeds from the sale of a primary residence was the next most cited source of downpayment used by more than a fifth of buyers, and gifts from relative or friend were also selected by a sizeable number of buyers (18 percent). First-time buyers more often cited savings and gifts as sources of downpayment, and four in ten repeat buyers listed proceeds from the sale of their primary residence.
In order to finance their home purchase, more than half of buyers said that they did not need to make any sacrifices. Overall, one in three buyers cut spending on luxury items, while one in four cut spending on entertainment, and one in five cut spending on clothes.
DIFFICULTY OF MORTGAGE APPLICATION AND APPROVAL PROCESS
• Exhibits 5-8 through 5-10
Over six in ten (61 percent) buyers said that the mortgage application and approval process was no more difficult than expected. That is down from 68 percent of buyers who said it was not difficult in the previous year’s survey. A slightly higher percentage of first-time buyers felt the process of obtaining a mortgage was difficult compared with repeat buyers. A larger share of single female buyers felt that the process was not difficult compared with other groups.
Ninety-two percent of buyers were not rejected by any lenders, while only three percent were rejected by more than one lender.
Most home buyers see their home purchase not only as a place to live but also as a good
financial investment.
69 National Association of REALTORS® | Profile of Home Buyers and Sellers 2010
National Association of REALTORS®
TYPE OF MORTGAGE LOAN
• Exhibits 5-11 and 5-12
With historically low mortgage rates, almost all buyers (95 percent) chose fixed rate mortgages. There was very little difference between first-time and repeat buyers in their choice of mortgage. FHA loans were the most common type of loan, with 43 percent of buyers choosing this option, slightly above conventional loans. FHA loans were much more prevalent among first-time buyers compared with repeat buyers. More than half of first-time buyers (56 percent) chose FHA loans, while a similar share of repeat buyers used conventional loans.
HOME BUYER TAX CREDIT EXPERIENCE
• Exhibit 5-13
Roughly seven in ten buyers used the home buyer tax credit, another quarter of buyers did not qualify, and a small fraction was unaware of the tax credit. More than nine in ten first-time buyers used the tax credit for their home purchase. The tax credit, which was initially targeted towards first-time buyers, was expanded to repeat buyers during the time covered by the survey. However, only half of repeat buyers surveyed used the tax credit, while the other half did not qualify at the time they purchased their home. Some buyers were not eligible due to income restrictions.
BUYERS’ VIEW OF HOMES AS A FINANCIAL INVESTMENT
• Exhibit 5-14 and 5-15
Most home buyers see their home purchase not only as a place to live but also as a good financial investment. Eighty-five percent of buyers feel that their home purchase is a good financial investment, while only four percent felt it was not a good investment. More than three in four believe that a home purchase is as good or better an investment as stocks. Looking across groups, a similar share of first-time, repeat, buyers of new or previously owned homes, and various types of households felt that their home purchase was a good investment.
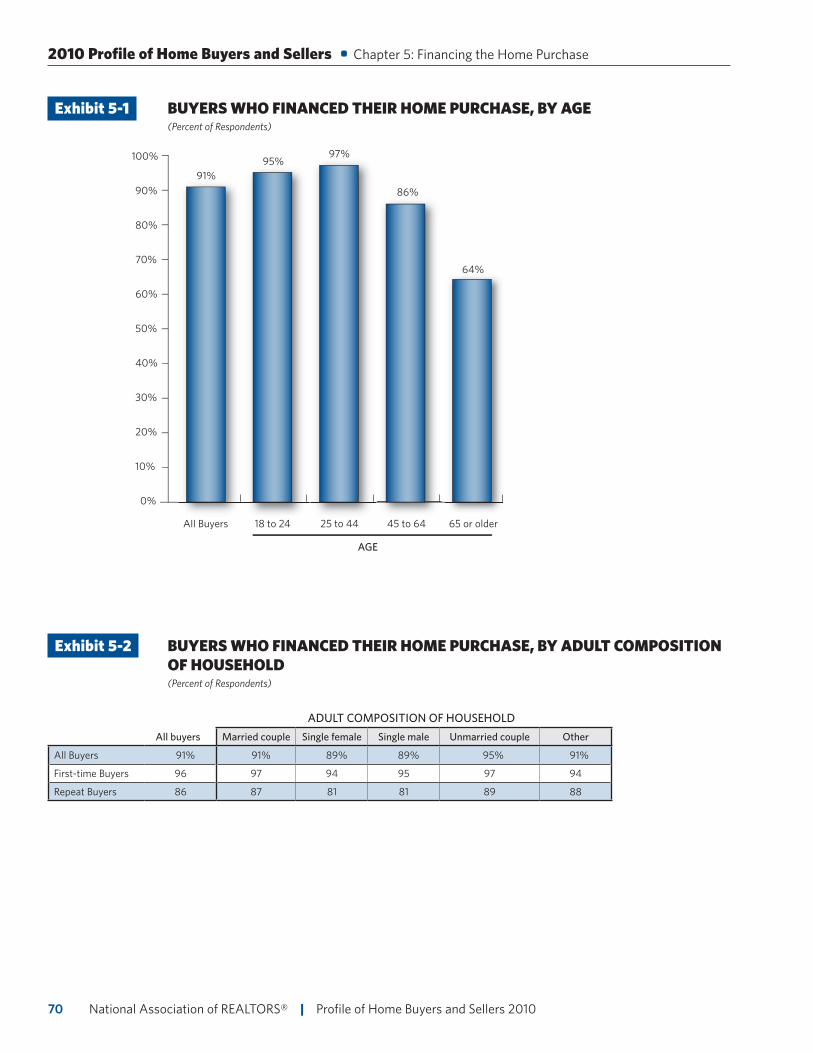
National Association of REALTORS® | Profile of Home Buyers and Sellers 201070
2010 Profile of Home Buyers and Sellers • Chapter 5: Financing the Home Purchase
Exhibit 5-1 BUYERS WHO FINANCED THEIR HOME PURCHASE, BY AGE (Percent of Respondents)
70%
60%
50%
40%
30%
All Buyers
20%
10%
0%
80%
ll 18 to 24 25 to 44 45 to 64 65 or older
91%95%
97%
86%
64%
90%
100%
AGE
Exhibit 5-2 BUYERS WHO FINANCED THEIR HOME PURCHASE, BY ADULT COMPOSITION OF HOUSEHOLD (Percent of Respondents)
ADULT COMPOSITION OF HOUSEHOLD
All buyers Married couple Single female Single male Unmarried couple Other
All Buyers 91% 91% 89% 89% 95% 91%
First-time Buyers 96 97 94 95 97 94
Repeat Buyers 86 87 81 81 89 88
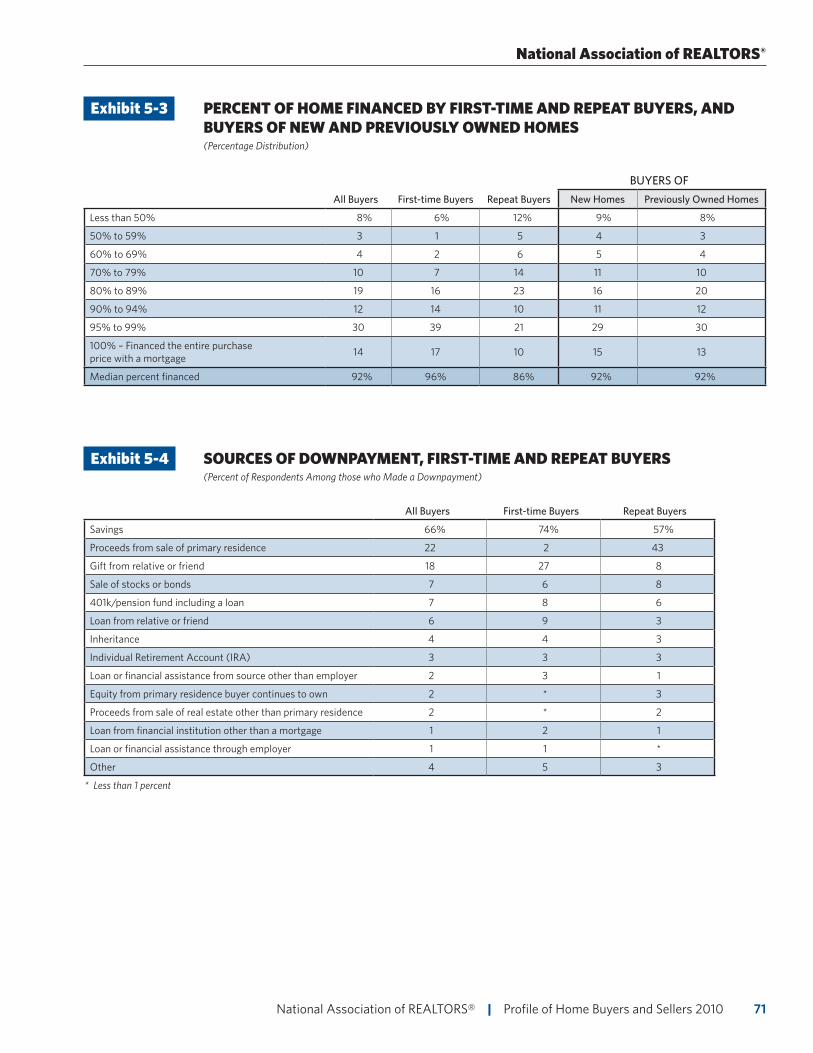
71 National Association of REALTORS® | Profile of Home Buyers and Sellers 2010
National Association of REALTORS®
Exhibit 5-3 PERCENT OF HOME FINANCED BY FIRST-TIME AND REPEAT BUYERS, AND BUYERS OF NEW AND PREVIOUSLY OWNED HOMES (Percentage Distribution)
BUYERS OF
All Buyers First-time Buyers Repeat Buyers New Homes Previously Owned Homes
Less than 50% 8% 6% 12% 9% 8%
50% to 59% 3 1 5 4 3
60% to 69% 4 2 6 5 4
70% to 79% 10 7 14 11 10
80% to 89% 19 16 23 16 20
90% to 94% 12 14 10 11 12
95% to 99% 30 39 21 29 30
100% – Financed the entire purchase price with a mortgage 14 17 10 15 13
Median percent financed 92% 96% 86% 92% 92%
Exhibit 5-4 SOURCES OF DOWNPAYMENT, FIRST-TIME AND REPEAT BUYERS (Percent of Respondents Among those who Made a Downpayment)
All Buyers First-time Buyers Repeat Buyers
Savings 66% 74% 57%
Proceeds from sale of primary residence 22 2 43
Gift from relative or friend 18 27 8
Sale of stocks or bonds 7 6 8
401k/pension fund including a loan 7 8 6
Loan from relative or friend 6 9 3
Inheritance 4 4 3
Individual Retirement Account (IRA) 3 3 3
Loan or financial assistance from source other than employer 2 3 1
Equity from primary residence buyer continues to own 2 * 3
Proceeds from sale of real estate other than primary residence 2 * 2
Loan from financial institution other than a mortgage 1 2 1
Loan or financial assistance through employer 1 1 *
Other 4 5 3
* Less than 1 percent
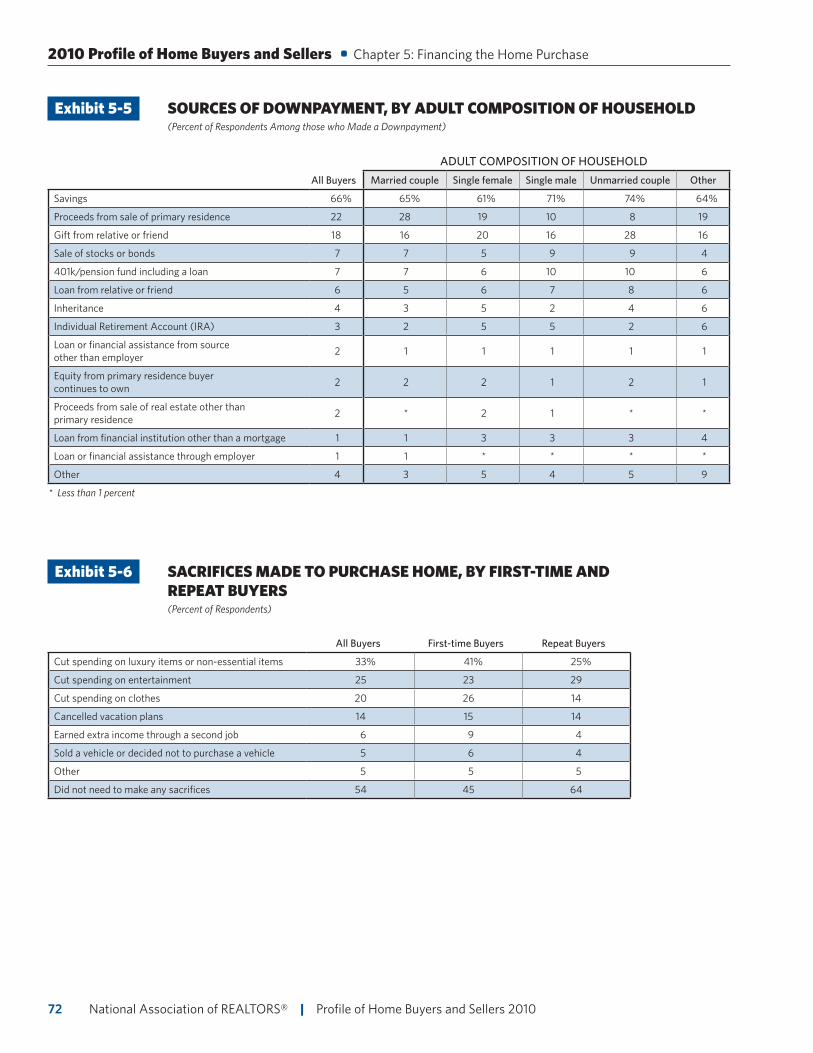
National Association of REALTORS® | Profile of Home Buyers and Sellers 201072
2010 Profile of Home Buyers and Sellers • Chapter 5: Financing the Home Purchase
Exhibit 5-5 SOURCES OF DOWNPAYMENT, BY ADULT COMPOSITION OF HOUSEHOLD (Percent of Respondents Among those who Made a Downpayment)
ADULT COMPOSITION OF HOUSEHOLD
All Buyers Married couple Single female Single male Unmarried couple Other
Savings 66% 65% 61% 71% 74% 64%
Proceeds from sale of primary residence 22 28 19 10 8 19
Gift from relative or friend 18 16 20 16 28 16
Sale of stocks or bonds 7 7 5 9 9 4
401k/pension fund including a loan 7 7 6 10 10 6
Loan from relative or friend 6 5 6 7 8 6
Inheritance 4 3 5 2 4 6
Individual Retirement Account (IRA) 3 2 5 5 2 6
Loan or financial assistance from source other than employer 2 1 1 1 1 1
Equity from primary residence buyer continues to own 2 2 2 1 2 1
Proceeds from sale of real estate other than primary residence 2 * 2 1 * *
Loan from financial institution other than a mortgage 1 1 3 3 3 4
Loan or financial assistance through employer 1 1 * * * *
Other 4 3 5 4 5 9
* Less than 1 percent
Exhibit 5-6 SACRIFICES MADE TO PURCHASE HOME, BY FIRST-TIME AND REPEAT BUYERS (Percent of Respondents)
All Buyers First-time Buyers Repeat Buyers
Cut spending on luxury items or non-essential items 33% 41% 25%
Cut spending on entertainment 25 23 29
Cut spending on clothes 20 26 14
Cancelled vacation plans 14 15 14
Earned extra income through a second job 6 9 4
Sold a vehicle or decided not to purchase a vehicle 5 6 4
Other 5 5 5
Did not need to make any sacrifices 54 45 64
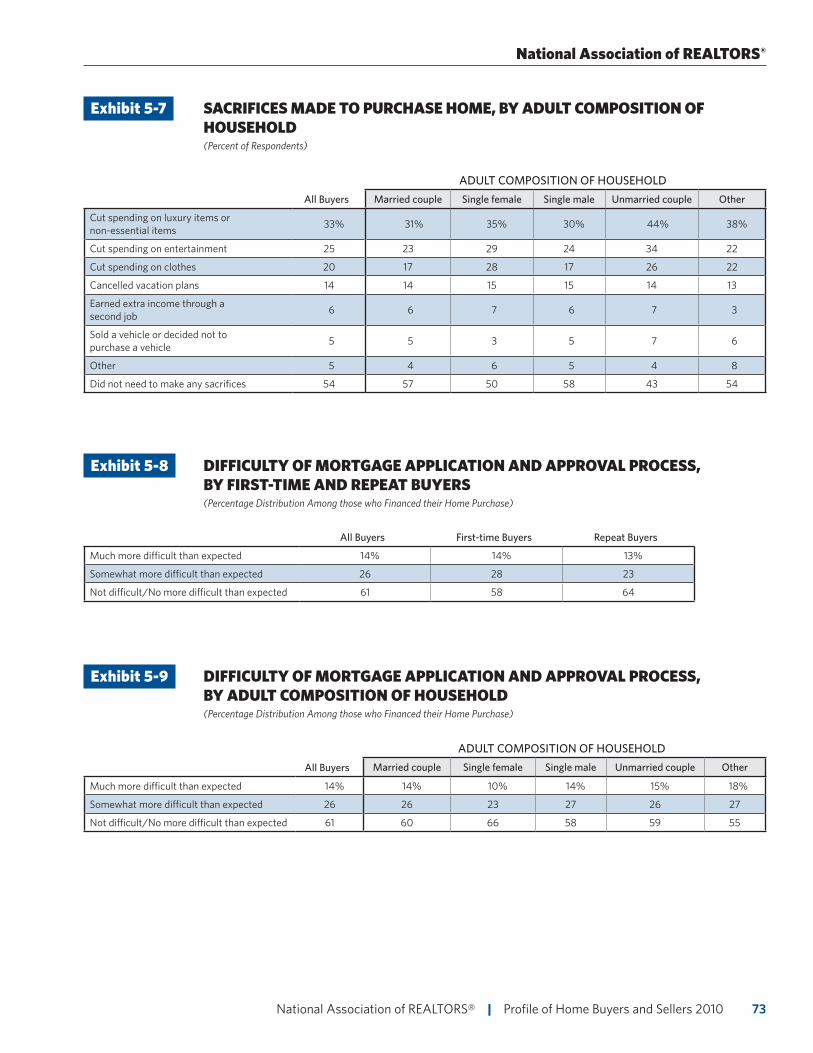
73 National Association of REALTORS® | Profile of Home Buyers and Sellers 2010
National Association of REALTORS®
Exhibit 5-7 SACRIFICES MADE TO PURCHASE HOME, BY ADULT COMPOSITION OF HOUSEHOLD (Percent of Respondents)
ADULT COMPOSITION OF HOUSEHOLD
All Buyers Married couple Single female Single male Unmarried couple Other
Cut spending on luxury items or non-essential items 33% 31% 35% 30% 44% 38%
Cut spending on entertainment 25 23 29 24 34 22
Cut spending on clothes 20 17 28 17 26 22
Cancelled vacation plans 14 14 15 15 14 13
Earned extra income through a second job 6 6 7 6 7 3
Sold a vehicle or decided not to purchase a vehicle 5 5 3 5 7 6
Other 5 4 6 5 4 8
Did not need to make any sacrifices 54 57 50 58 43 54
Exhibit 5-8 DIFFICULTY OF MORTGAGE APPLICATION AND APPROVAL PROCESS, BY FIRST-TIME AND REPEAT BUYERS (Percentage Distribution Among those who Financed their Home Purchase)
All Buyers First-time Buyers Repeat Buyers
Much more difficult than expected 14% 14% 13%
Somewhat more difficult than expected 26 28 23
Not difficult/No more difficult than expected 61 58 64
Exhibit 5-9 DIFFICULTY OF MORTGAGE APPLICATION AND APPROVAL PROCESS, BY ADULT COMPOSITION OF HOUSEHOLD (Percentage Distribution Among those who Financed their Home Purchase)
ADULT COMPOSITION OF HOUSEHOLD
All Buyers Married couple Single female Single male Unmarried couple Other
Much more difficult than expected 14% 14% 10% 14% 15% 18%
Somewhat more difficult than expected 26 26 23 27 26 27
Not difficult/No more difficult than expected 61 60 66 58 59 55
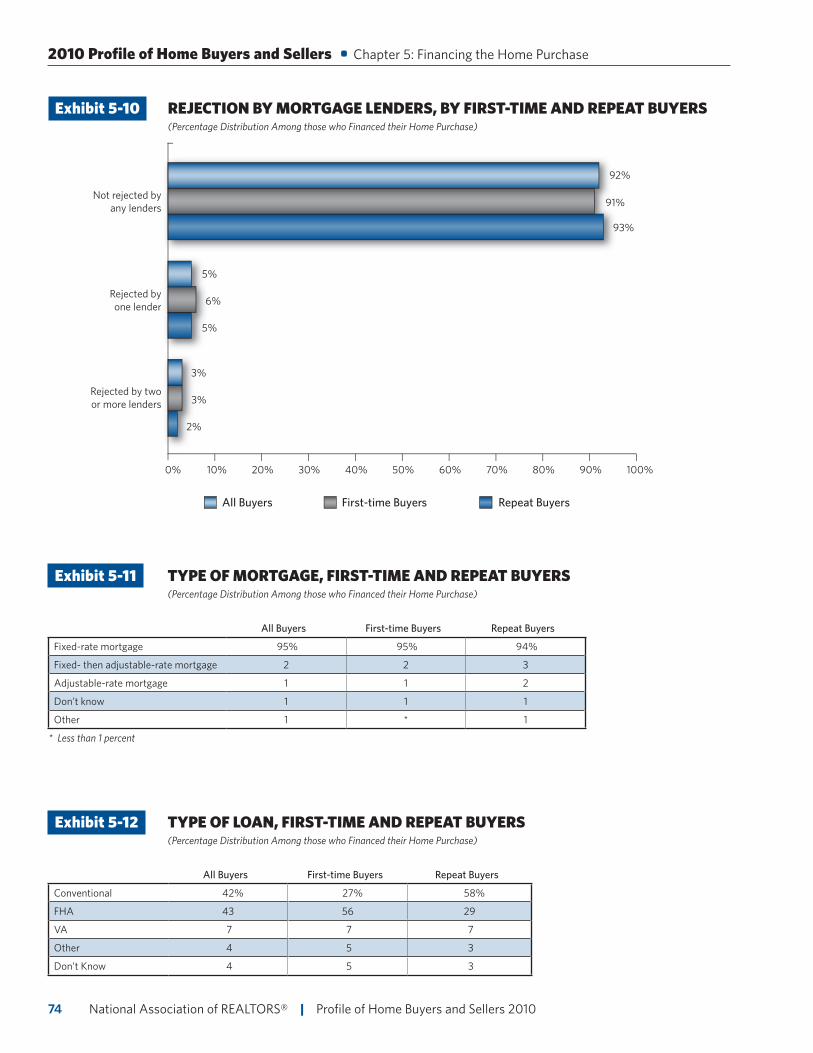
National Association of REALTORS® | Profile of Home Buyers and Sellers 201074
2010 Profile of Home Buyers and Sellers • Chapter 5: Financing the Home Purchase
Exhibit 5-10 REJECTION BY MORTGAGE LENDERS, BY FIRST-TIME AND REPEAT BUYERS (Percentage Distribution Among those who Financed their Home Purchase)
80% 90%20%10% 70%40% 60%50% 100%30%
Not rejected byany lenders
Rejected by twoor more lenders
Rejected byone lender
All Buyers First-time Buyers Repeat Buyers
os
yr
ys
0%
5%
92%
91%
93%
5%
6%
2%
3%
3%
Exhibit 5-11 TYPE OF MORTGAGE, FIRST-TIME AND REPEAT BUYERS (Percentage Distribution Among those who Financed their Home Purchase)
All Buyers First-time Buyers Repeat Buyers
Fixed-rate mortgage 95% 95% 94%
Fixed- then adjustable-rate mortgage 2 2 3
Adjustable-rate mortgage 1 1 2
Don’t know 1 1 1
Other 1 * 1
* Less than 1 percent
Exhibit 5-12 TYPE OF LOAN, FIRST-TIME AND REPEAT BUYERS (Percentage Distribution Among those who Financed their Home Purchase)
All Buyers First-time Buyers Repeat Buyers
Conventional 42% 27% 58%
FHA 43 56 29
VA 7 7 7
Other 4 5 3
Don’t Know 4 5 3
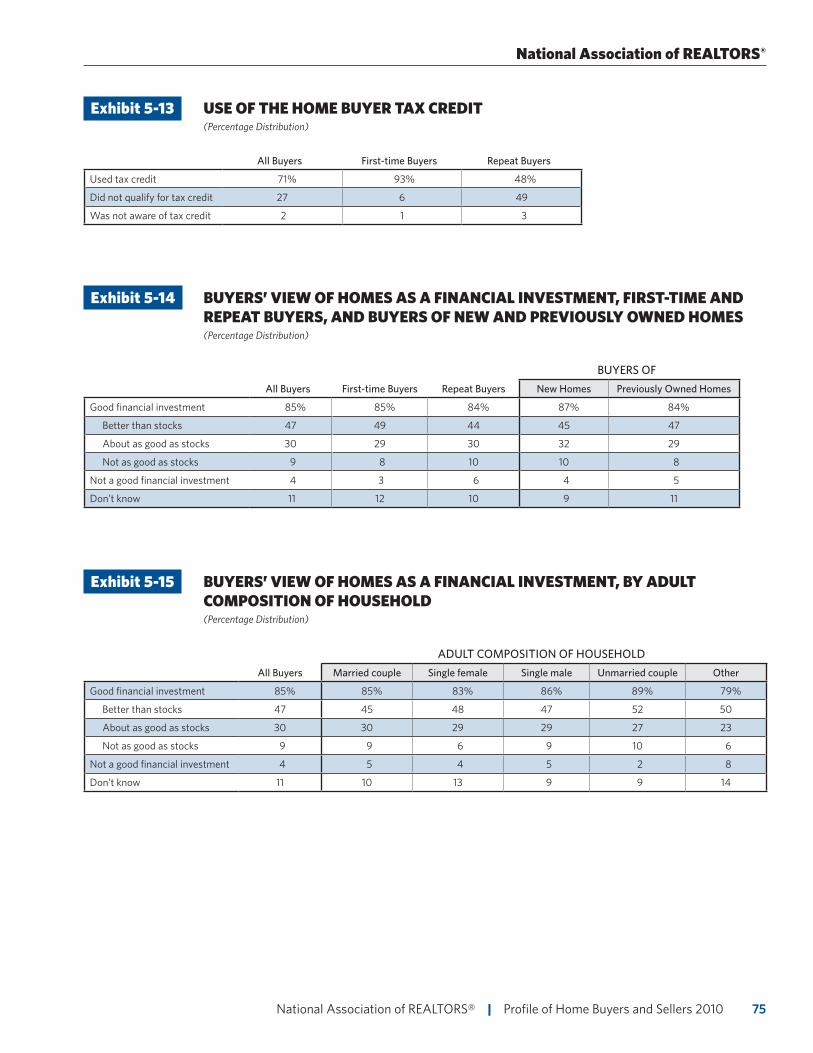
75 National Association of REALTORS® | Profile of Home Buyers and Sellers 2010
National Association of REALTORS®
Exhibit 5-13 USE OF THE HOME BUYER TAX CREDIT (Percentage Distribution)
All Buyers First-time Buyers Repeat Buyers
Used tax credit 71% 93% 48%
Did not qualify for tax credit 27 6 49
Was not aware of tax credit 2 1 3
Exhibit 5-14 BUYERS’ VIEW OF HOMES AS A FINANCIAL INVESTMENT, FIRST-TIME AND REPEAT BUYERS, AND BUYERS OF NEW AND PREVIOUSLY OWNED HOMES (Percentage Distribution)
BUYERS OF
All Buyers First-time Buyers Repeat Buyers New Homes Previously Owned Homes
Good financial investment 85% 85% 84% 87% 84%
Better than stocks 47 49 44 45 47
About as good as stocks 30 29 30 32 29
Not as good as stocks 9 8 10 10 8
Not a good financial investment 4 3 6 4 5
Don’t know 11 12 10 9 11
Exhibit 5-15 BUYERS’ VIEW OF HOMES AS A FINANCIAL INVESTMENT, BY ADULT COMPOSITION OF HOUSEHOLD (Percentage Distribution)
ADULT COMPOSITION OF HOUSEHOLD
All Buyers Married couple Single female Single male Unmarried couple Other
Good financial investment 85% 85% 83% 86% 89% 79%
Better than stocks 47 45 48 47 52 50
About as good as stocks 30 30 29 29 27 23
Not as good as stocks 9 9 6 9 10 6
Not a good financial investment 4 5 4 5 2 8
Don’t know 11 10 13 9 9 14
Chapter 6: Home Sellers and Their Selling Experience
As market conditions stabilized, sellers continued to turn to real estate agents to guide them through the sales process. Sellers in 2010 were somewhat older than sellers in 2009. Still, nearly two-
fifths were selling a home for the first time.
Sellers move for a variety of reasons, but a few reasons stand out: the previous home was too small, a job relocation requires a move, or because the seller wants to be closer to family and friends. Roughly half of all sellers cite one of these reasons as the primary motivation for their move. The differences in characteristics of the new home compared to the old home, such as size and price, vary with the age of seller; younger sellers are more likely to upgrade to larger, more expensive homes. Among all sellers, a majority purchase homes that are newer, larger, and more expensive than the homes sold.
During the sales process, a longer time on market is correlated with reduced sales price relative to asking price, an increased number of listing price reductions, and a greater likelihood of incentives. Thus, correctly pricing the home from the start may be an important key to a swift sale. As prices in the housing market have stabilized, seller expectations have become better aligned with buyer willingness to pay. The typical sales price during the period surveyed was a median 96 percent of the listing price, the first increase since this ratio began falling in 2006. While the majority of sellers do not use incentives, among those who do a home warranty policy and assistance with closing costs were the two most reported incentives.
Most sellers remain very satisfied with the home sales process.
National Association of REALTORS® | Profile of Home Buyers and Sellers 201076
77 National Association of REALTORS® | Profile of Home Buyers and Sellers 2010
HOME SELLER CHARACTERISTICS
• Exhibits 6-1 through 6-6
While the change in age of buyers by region was mixed, home sellers were older in 2010 than 2009. The median age of sellers who sold a home between mid-2009 and mid-2010 was 49 as opposed to 46 the previous year. Sellers in each region were older than in 2009, but the increase in median age in the West was so large that it supersedes the Northeast as the region with the oldest median seller age in 2010. The median 2009 income of recent home sellers was $90,000, a 1 percent or $1,100 decline from the previous year. While most regions saw declines, the median seller income in the South increased, replacing the Northeast as the region with the top median income at $94,000. The relative position of the other regions was unchanged.
As has been the case for the last several years, married couple households account for three-quarters of home sellers. Single person households represented about one in five recent sellers, with single females accounting for more than 2.5 times as many sellers as single males. Reversing a trend from recent years, the proportion of single female sellers increased in 2010. Two-fifths of seller households have a least one child under 18; this is slightly more than the share of home buyer households with children (35 percent).
Ninety-three percent of recent home sellers were white. The largest share of minority sellers in 2010 was in the South where nearly one in ten described themselves as non-White. Nearly all home sellers indicated that the primary language they speak is English.
HOME SELLING SITUATION
• Exhibits 6-7 through 6-10
A majority of repeat buyers (69 percent) reported that they had already sold their previous home. Among the quarter of repeat buyers who have not sold their previous home, nearly half do not intend to sell. Eight percent of repeat buyers did not own their previous home. For the first time, we asked sellers if this was their first selling experience. Nearly two-fifths of sellers were selling for the first-time while a little more than three-fifths were repeat sellers.
The share of homes that remain unsold varies by region and type of location. Using the share of homes sold by region as a benchmark, sellers with unsold homes are more concentrated in the South and West than in the Northeast or Midwest. Further, the share of rented unsold homes in the South is much larger than both its share of vacant homes and sold homes. The share of rented unsold homes in the West is larger than its share of sold homes but equal to the region’s share of vacant unsold homes. Just as most of the recently sold homes are in the suburbs, most unsold homes are also in the suburbs. Sixty-five percent of vacant unsold homes and a smaller share (52 percent) of unsold homes now being rented are in the suburbs. This compares with 49 percent of recently sold homes in this area.
National Association of REALTORS®
National Association of REALTORS® | Profile of Home Buyers and Sellers 201078
HOME SOLD VS. HOME PURCHASED
• Exhibits 6-11 through 6-19
Most home sellers (71 percent) remain in the same state when they purchase their next home. Long distance moves to another region are somewhat more common (17 percent of sellers) than those to another state within the same region (13 percent of sellers).
Eighty-one percent of sellers sold a detached single-family home; and the townhouse or row house was the second most frequent type of home sold. Sales of detached single-family homes accounted for the largest share of sales in all areas though were not as dominant in the resort area markets.
Home size reflects financial and lifestyle considerations as well as the life-cycle of homeowners. Just over half of recent sellers purchased a home that was larger than the home they sold while 28 percent purchased a home in the same size range. The greatest share of sellers whose purchase was in the same size range (9 percent) sold and purchased homes of 3,000 square feet or more. Nearly two in five trade-up buyers purchased a home of at least 3,000 square feet. Consistent with previous Profiles, when purchasing their next home, younger home sellers tend to purchase larger homes, while older sellers generally purchase smaller homes. The median size of home purchased is highest for the 35 to 44 year age group while the median size of home sold is greatest for the 55 to 64 year age group. Overall, sellers in the 45 to 54 year age group reported little difference in the median size of home sold compared to the median size of home purchased. The bedroom/bathroom composition of homes sold at the median is the same regardless of household composition or number of children under age 18. The typical home sold has three bedrooms and two bathrooms. However, more than one-fifth of single and unmarried couple sellers had fewer than three bedrooms in the home they sold. One-quarter or more of single female and unmarried couple sellers had only one bathroom.
In terms of home age, 57 percent of recent sellers purchased a home that was newer than the home they sold while 20 percent purchased an older home. Nearly
a third of those purchasing newer homes purchased one built at least as recently as 2008. The greatest share of those purchasing older homes bought homes built between 1985 and 1999, and the second largest share bought homes built between 2000 and 2004. A larger share of sellers purchased a newer home, and 55 percent purchased a home that was more expensive than the one they sold. Younger sellers, who are often looking to trade up to a larger home, purchase homes that are relatively more expensive than the home they sold. For example, home sellers under 34 years old purchased a home for a median of $253,300 and sold a home for a median of $155,000—an difference of 63 percent.
Sellers have many reasons for moving, and these reasons vary by age. Selling a home because it was too small was the motivation for 21 percent of recent sellers, the most frequently cited reason among all sellers, especially younger sellers. Selling a home for a job relocation was the primary reason given by 15 percent of sellers, a decrease over the 21 percent of sellers who gave this reason in the 2009 Profile. Moving closer to friends and family was the chief reason for selling a home among those 55 or older, and it becomes an even more commonly cited reason among older groups.
TENURE IN HOME
• Exhibits 6-20 and 6-21
The typical home seller has owned their home for eight years. Sellers of detached single-family homes, which account for the largest share of homes sold, owned their home for a median of nine years. Sellers of condos in buildings with five or more units had the shortest tenure at the median—6 years. Age of the home owner also corresponds with tenure. Sellers under age 34 have typically lived in their home for 5 years before selling compared with a 12-year tenure for those sellers 55 to 64 years old.
2010 Profile of Home Buyers and Sellers • Chapter 6: Home Sellers and Their Selling Experience
79 National Association of REALTORS® | Profile of Home Buyers and Sellers 2010
DISTANCE MOVED
• Exhibits 6-22 and 6-23
Home sellers in mid-2009 to mid-2010 moved a median of 18 miles, one mile less than the year before. By region, those in the West still moved the furthest at the median (20 miles), but this distance is nearly half the median distance Western sellers moved the year before (41 miles). Age is also correlated with the distance home sellers move. While only about one in ten sellers under 44 years old moved 1001 miles or more, among sellers 65 years or older the proportion was nearly one in five. Still, many moves are local. Regardless of age group, the most common distance moved was 5 miles or less.
METHOD OF SALE
• Exhibits 6-24 through 6-27
In a stabilizing housing market sellers understand the importance of working with real estate professionals. Eighty-eight percent of home sellers sold their home with the assistance of a real estate agent, an increase of 3 percent due to fewer for-sale-by-owner (FSBO) sales. FSBOs declined in the Midwest and South while sellers’ use of agents increased in every region except the Northeast where 89 percent of sellers used an agent, unchanged for each year.
The level of urgency with which sellers must complete the sale of their home does not correspond with the method of sale in an intuitive way. Regardless of urgency, more than 82 percent of sellers were assisted by an agent. Sellers with the greatest urgency were least likely to use an agent and most likely to try a FSBO sale, sell to a home buying company, or some other method.
The method of sale tends to differ in conjunction with the relationship between the buyer and seller. If the buyer and seller know each other, the sale can be either an arms-length transaction consistent with local market conditions or it may involve considerations that would be not be relevant in the absence of a prior relationship.
Among all home sellers, 8 percent reported that they knew the buyer of their home compared with 9 percent in the 2009 Profile. Among those sellers that were assisted by an agent, just 3 percent knew the buyer. In contrast, more than half of FSBO sellers indicated that they knew the buyer of their home before the transaction. In one in ten transactions where the seller knew the buyer an agent listed the home, but it was ultimately a FSBO sale. However, an agent was employed in three in ten transactions where the seller knew the buyer.
In a stabilizing housing market sellers understand the importance of working with
real estate professionals. Eighty-eight percent of home sellers sold their home with the
assistance of a real estate agent, an increase of 3 percent due to fewer for-sale-by-owner
(FSBO) sales.
National Association of REALTORS®
National Association of REALTORS® | Profile of Home Buyers and Sellers 201080
SALES PRICE AND TIME ON THE MARKET
• Exhibits 6-28 through 6-32
Among recently sold homes, the sales price was a median 96 percent of the listing price. This is a slight increase over the figure in the 2009 Profile (95 percent) and marks the first year of increase since the ratio began falling in 2006. While the market has seen price stabilization, sellers have not fully adjusted to buyers’ expectations or are building in room to negotiate. Regardless of region, most sellers, between 76 and 81 percent, received less than their asking price and the greatest share of those receiving less, between 46 and 52 percent depending on the region, sold for between 95 and 99 percent of their asking price. One-fifth of sellers in the South received exactly what they asked for. Five percent of sellers in the South and Midwest and eight percent of sellers in the Northeast and Midwest received more than their asking price. Sellers who reported needing to sell very urgently were more likely to accept a price that was less than 90 percent of the asking price while those who reported less urgency were more likely to receive 95 to 99 percent of the original asking price. However, the median sales price to asking price ratio differed little if at all with the sellers who need to sell urgently.
The median time on the market for recently sold homes was 8 weeks—down from 10 weeks in 2009. More than a quarter of sellers reported that their home was on the market for two weeks or less. Lowered median time on market was seen across regions, and the most significant reduction was in the West where time on the market fell from 12 to 6 weeks.
Time on the market and the ratio of sales price to listing price are highly correlated; generally, the longer a home is on the market the greater the discount from the listing price upon sale. This generality is seen in the decreasing median sales to asking price ratio as time on market increases, for example, from 100 percent for homes on the market for less than one week to 91 percent for homes on the market 17 weeks or longer. Among homes on the market less than one week, more than half (56 percent) were sold at the listing price and only 2 percent were sold
at less than 90 percent of the asking price. Among homes that were on the market for at least 17 weeks, the shares are nearly reversed; 45 percent of these sellers accept less than 90 percent of the asking price while only 5 percent sell at the listing price.
As the relative magnitude of the price reduction grows with the length of time on the market, so does the number of times the price is reduced from the original asking price. Overall, 43 percent of sellers noted that they did not reduce their asking price while 27 percent reduced it only once. For homes on the market two weeks or less, 83 percent did not reduce the asking price. For homes on the market at least 17 weeks, 88 percent reduced the price at least once and a quarter of those reducing the price at least once reduced the price at least 4 times. Working with an agent to correctly price a home for sale from the beginning is likely to result in fewer price reductions and if the sale is like typical sales, reduced with time on market.
INCENTIVES TO PROSPECTIVE BUYERS
• Exhibits 6-33 and 6-34
Sellers occasionally add incentives to attract buyers though there are regional variations. Incentives are least common in the Northeast and, in 2010, the West. The most frequently offered incentive regardless of region is a home warranty policy. The second most commonly offered incentive is assistance with closing costs. Not surprisingly, the longer a home is on the market, the more frequently sellers offer incentives. However, regardless of time on market, home warranty policies and assistance with closing costs remain the top two incentives most frequently offered by sellers.
2010 Profile of Home Buyers and Sellers • Chapter 6: Home Sellers and Their Selling Experience
81 National Association of REALTORS® | Profile of Home Buyers and Sellers 2010
EQUITY BY TENURE
• Exhibit 6-35
Home sellers reported that they typically sold the home they purchased for $33,000 more than they purchased it—about a 24 percent price gain. Generally, the longer a seller is in the home the greater the increase attributable to price appreciation; however, the recent path of home prices has resulted in the level of equity in homes with seller tenures of 1 to 5 years varies from that trend. Sellers who owned a home for one year or less typically reported greater gains than those who owned a home for 2 to 3 or 4 to 5 years. One explanation for these large gains is that they result from the rehabilitation and resale of formerly distressed properties.
SATISFACTION WITH SALES PROCESS
• Exhibit 6-36
As the housing market has stabilized, sellers’ overall satisfaction with the selling process has improved slightly. Fifty-five percent of sellers reported that they were very satisfied with the process, up from 53 percent in last year’s Profile and equal to the 2008 share though not quite on par with the 63 percent who were very satisfied in 2007. The same share of recent sellers as in 2009, 14 percent, indicated that they were dissatisfied with the process.
National Association of REALTORS®
Working with an agent to correctly price a home for sale from the beginning is likely to
result in fewer price reductions and if the sale is like typical sales, reduced with time on market.
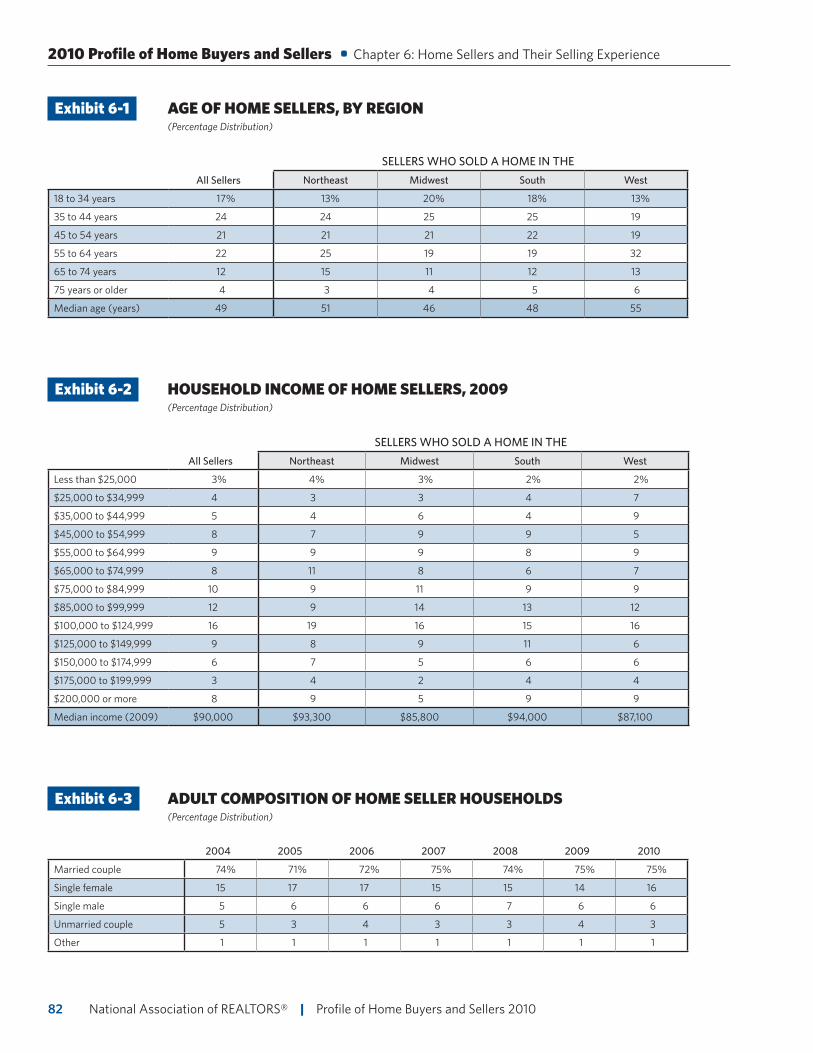
National Association of REALTORS® | Profile of Home Buyers and Sellers 201082
Exhibit 6-1 AGE OF HOME SELLERS, BY REGION (Percentage Distribution)
SELLERS WHO SOLD A HOME IN THE
All Sellers Northeast Midwest South West
18 to 34 years 17% 13% 20% 18% 13%
35 to 44 years 24 24 25 25 19
45 to 54 years 21 21 21 22 19
55 to 64 years 22 25 19 19 32
65 to 74 years 12 15 11 12 13
75 years or older 4 3 4 5 6
Median age (years) 49 51 46 48 55
Exhibit 6-2 HOUSEHOLD INCOME OF HOME SELLERS, 2009 (Percentage Distribution)
SELLERS WHO SOLD A HOME IN THE
All Sellers Northeast Midwest South West
Less than $25,000 3% 4% 3% 2% 2%
$25,000 to $34,999 4 3 3 4 7
$35,000 to $44,999 5 4 6 4 9
$45,000 to $54,999 8 7 9 9 5
$55,000 to $64,999 9 9 9 8 9
$65,000 to $74,999 8 11 8 6 7
$75,000 to $84,999 10 9 11 9 9
$85,000 to $99,999 12 9 14 13 12
$100,000 to $124,999 16 19 16 15 16
$125,000 to $149,999 9 8 9 11 6
$150,000 to $174,999 6 7 5 6 6
$175,000 to $199,999 3 4 2 4 4
$200,000 or more 8 9 5 9 9
Median income (2009) $90,000 $93,300 $85,800 $94,000 $87,100
Exhibit 6-3 ADULT COMPOSITION OF HOME SELLER HOUSEHOLDS (Percentage Distribution)
2004 2005 2006 2007 2008 2009 2010
Married couple 74% 71% 72% 75% 74% 75% 75%
Single female 15 17 17 15 15 14 16
Single male 5 6 6 6 7 6 6
Unmarried couple 5 3 4 3 3 4 3
Other 1 1 1 1 1 1 1
2010 Profile of Home Buyers and Sellers • Chapter 6: Home Sellers and Their Selling Experience
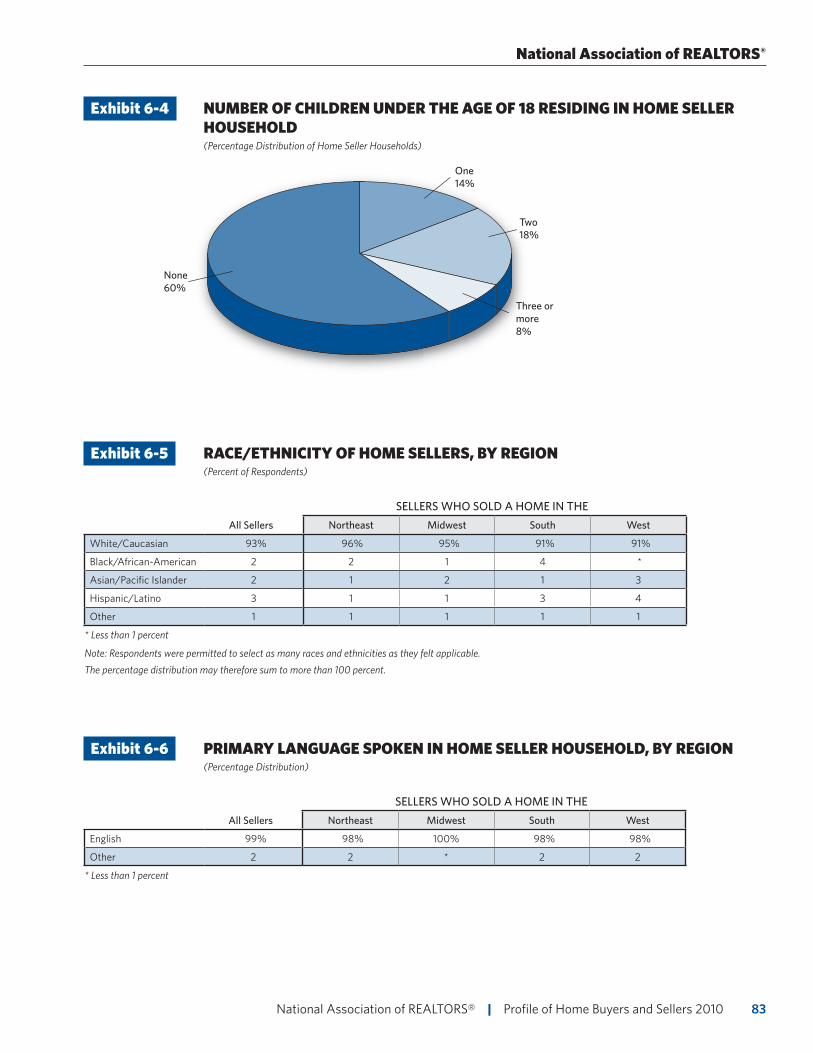
83 National Association of REALTORS® | Profile of Home Buyers and Sellers 2010
Exhibit 6-4 NUMBER OF CHILDREN UNDER THE AGE OF 18 RESIDING IN HOME SELLER HOUSEHOLD (Percentage Distribution of Home Seller Households)
None60%
Two18%
Three ormore8%
One14%
Exhibit 6-5 RACE/ETHNICITY OF HOME SELLERS, BY REGION (Percent of Respondents)
SELLERS WHO SOLD A HOME IN THE
All Sellers Northeast Midwest South West
White/Caucasian 93% 96% 95% 91% 91%
Black/African-American 2 2 1 4 *
Asian/Pacific Islander 2 1 2 1 3
Hispanic/Latino 3 1 1 3 4
Other 1 1 1 1 1
* Less than 1 percent
Note: Respondents were permitted to select as many races and ethnicities as they felt applicable.
The percentage distribution may therefore sum to more than 100 percent.
Exhibit 6-6 PRIMARY LANGUAGE SPOKEN IN HOME SELLER HOUSEHOLD, BY REGION (Percentage Distribution)
SELLERS WHO SOLD A HOME IN THE
All Sellers Northeast Midwest South West
English 99% 98% 100% 98% 98%
Other 2 2 * 2 2
* Less than 1 percent
National Association of REALTORS®
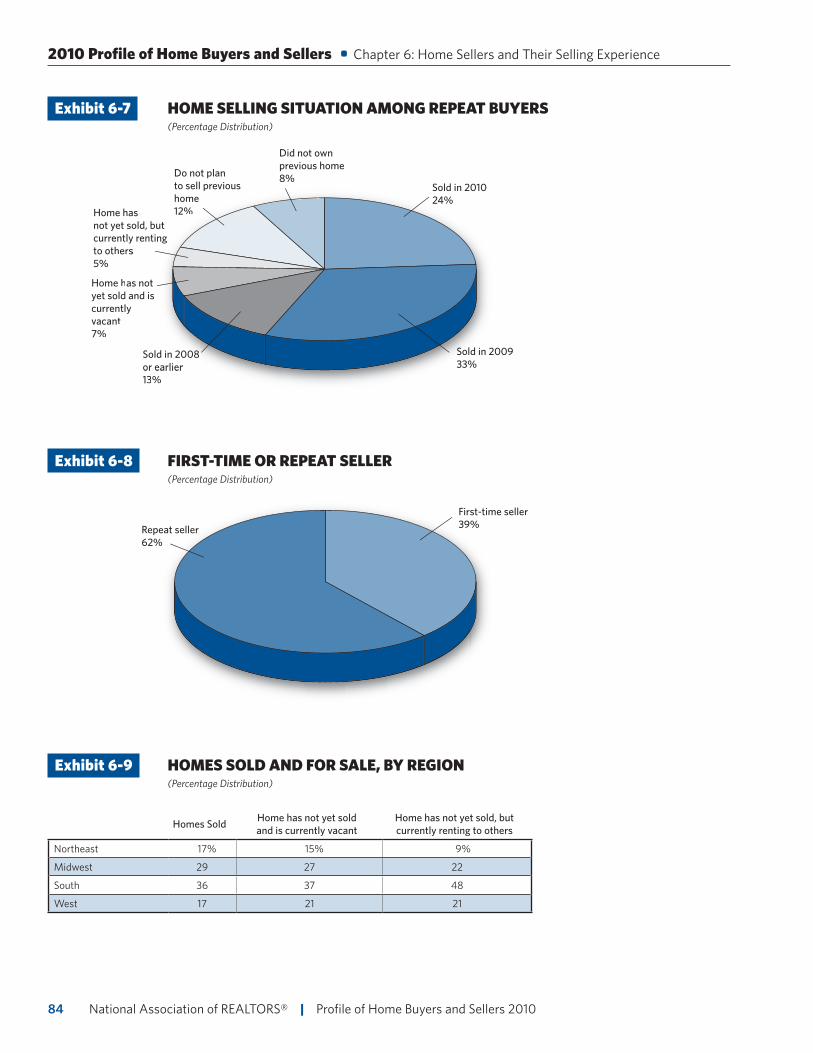
National Association of REALTORS® | Profile of Home Buyers and Sellers 201084
Exhibit 6-7 HOME SELLING SITUATION AMONG REPEAT BUYERS (Percentage Distribution)
Sold in 2008 or earlier13%
Home has not yet sold, but currently renting to others5%
Home has not yet sold and is currently vacant7%
Do not plan to sell previous home12%
Sold in 2008 or earlier13%
Home has not yet sold, but currently rentingto others5%
Home has not yet sold and iscurrently vacant7%
Do not planto sell previous home12%
Did not own previous home8%
Sold in 201024%
Sold in 200933%
Exhibit 6-8 FIRST-TIME OR REPEAT SELLER (Percentage Distribution)
First-time seller39%Repeat seller
62%
Exhibit 6-9 HOMES SOLD AND FOR SALE, BY REGION (Percentage Distribution)
Homes Sold Home has not yet sold and is currently vacant
Home has not yet sold, but currently renting to others
Northeast 17% 15% 9%
Midwest 29 27 22
South 36 37 48
West 17 21 21
2010 Profile of Home Buyers and Sellers • Chapter 6: Home Sellers and Their Selling Experience
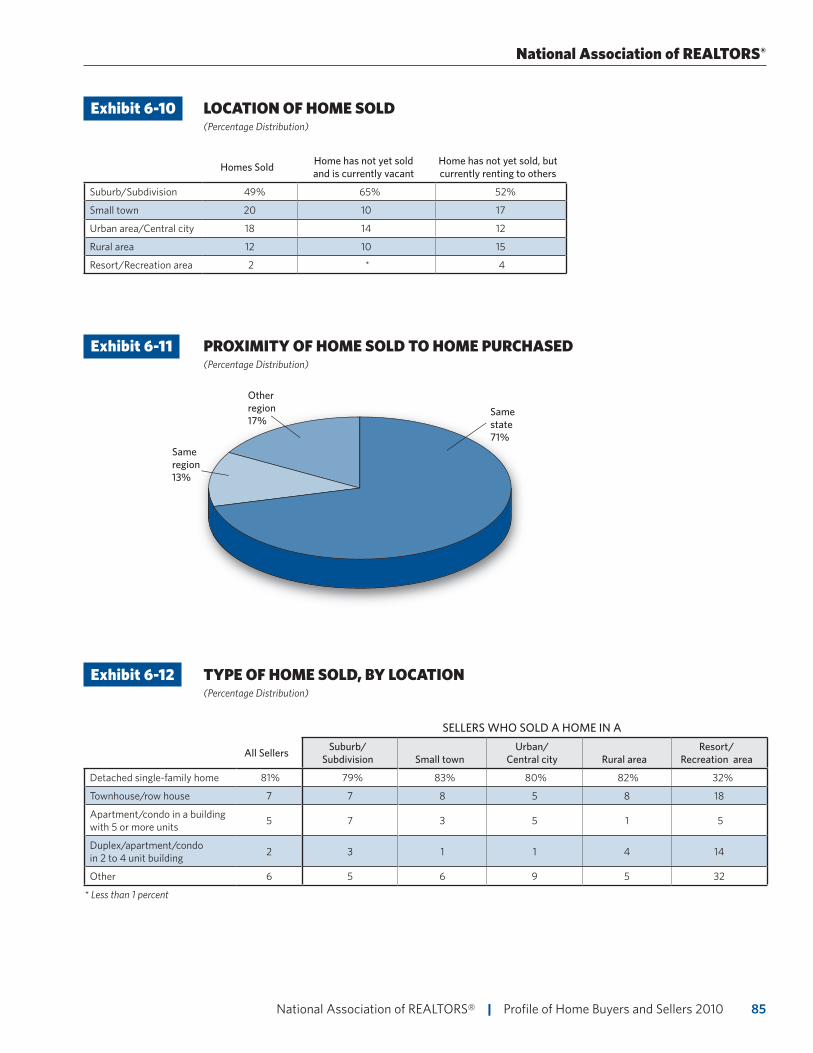
85 National Association of REALTORS® | Profile of Home Buyers and Sellers 2010
Exhibit 6-10 LOCATION OF HOME SOLD (Percentage Distribution)
Homes Sold Home has not yet sold and is currently vacant
Home has not yet sold, but currently renting to others
Suburb/Subdivision 49% 65% 52%
Small town 20 10 17
Urban area/Central city 18 14 12
Rural area 12 10 15
Resort/Recreation area 2 * 4
Same state71%
Same region13%
Other region17%
Exhibit 6-11 PROXIMITY OF HOME SOLD TO HOME PURCHASED (Percentage Distribution)
Exhibit 6-12 TYPE OF HOME SOLD, BY LOCATION (Percentage Distribution)
SELLERS WHO SOLD A HOME IN A
All Sellers Suburb/ Subdivision Small town
Urban/ Central city Rural area
Resort/ Recreation area
Detached single-family home 81% 79% 83% 80% 82% 32%
Townhouse/row house 7 7 8 5 8 18
Apartment/condo in a building with 5 or more units 5 7 3 5 1 5
Duplex/apartment/condo in 2 to 4 unit building 2 3 1 1 4 14
Other 6 5 6 9 5 32
* Less than 1 percent
National Association of REALTORS®
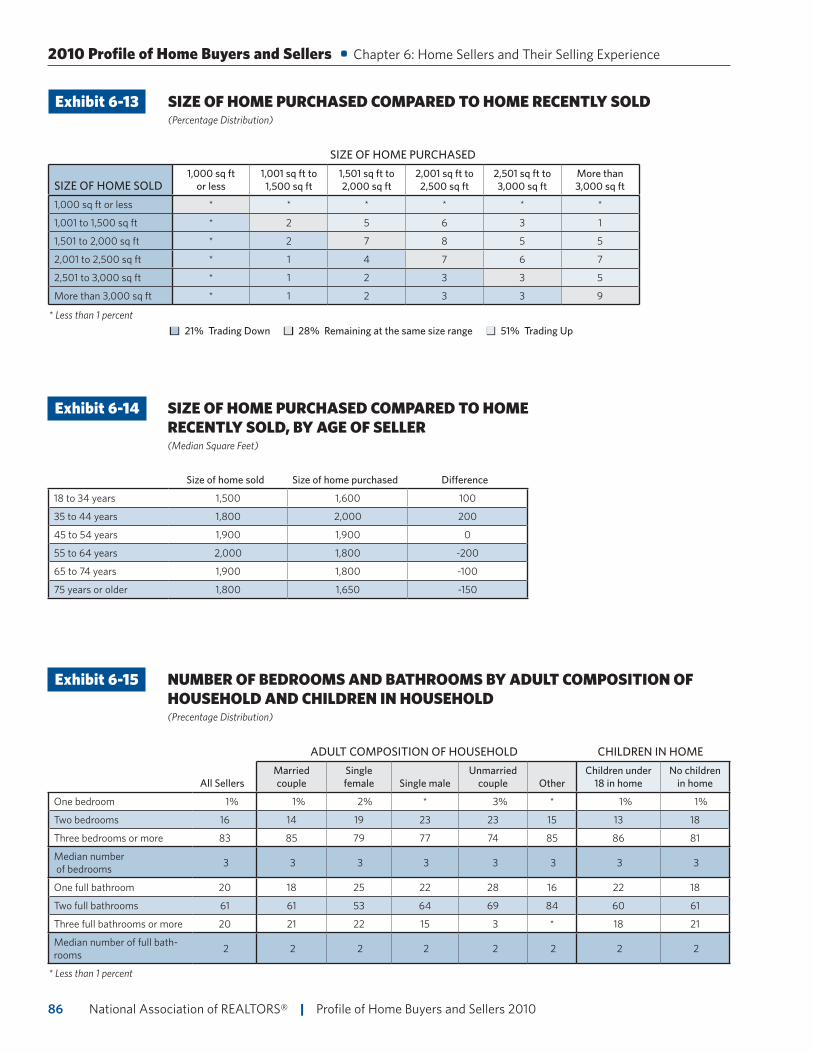
National Association of REALTORS® | Profile of Home Buyers and Sellers 201086
Exhibit 6-13 SIZE OF HOME PURCHASED COMPARED TO HOME RECENTLY SOLD (Percentage Distribution)
SIZE OF HOME PURCHASED
SIZE OF HOME SOLD1,000 sq ft
or less1,001 sq ft to
1,500 sq ft1,501 sq ft to 2,000 sq ft
2,001 sq ft to 2,500 sq ft
2,501 sq ft to 3,000 sq ft
More than 3,000 sq ft
1,000 sq ft or less * * * * * *
1,001 to 1,500 sq ft * 2 5 6 3 1
1,501 to 2,000 sq ft * 2 7 8 5 5
2,001 to 2,500 sq ft * 1 4 7 6 7
2,501 to 3,000 sq ft * 1 2 3 3 5
More than 3,000 sq ft * 1 2 3 3 9
* Less than 1 percent! 21% Trading Down ! 28% Remaining at the same size range ! 51% Trading Up
Exhibit 6-14 SIZE OF HOME PURCHASED COMPARED TO HOME RECENTLY SOLD, BY AGE OF SELLER (Median Square Feet)
Size of home sold Size of home purchased Difference
18 to 34 years 1,500 1,600 100
35 to 44 years 1,800 2,000 200
45 to 54 years 1,900 1,900 0
55 to 64 years 2,000 1,800 -200
65 to 74 years 1,900 1,800 -100
75 years or older 1,800 1,650 -150
Exhibit 6-15 NUMBER OF BEDROOMS AND BATHROOMS BY ADULT COMPOSITION OF HOUSEHOLD AND CHILDREN IN HOUSEHOLD (Precentage Distribution)
ADULT COMPOSITION OF HOUSEHOLD CHILDREN IN HOME
All SellersMarried couple
Single female Single male
Unmarried couple Other
Children under 18 in home
No children in home
One bedroom 1% 1% 2% * 3% * 1% 1%
Two bedrooms 16 14 19 23 23 15 13 18
Three bedrooms or more 83 85 79 77 74 85 86 81
Median number of bedrooms 3 3 3 3 3 3 3 3
One full bathroom 20 18 25 22 28 16 22 18
Two full bathrooms 61 61 53 64 69 84 60 61
Three full bathrooms or more 20 21 22 15 3 * 18 21
Median number of full bath-rooms 2 2 2 2 2 2 2 2
* Less than 1 percent
2010 Profile of Home Buyers and Sellers • Chapter 6: Home Sellers and Their Selling Experience
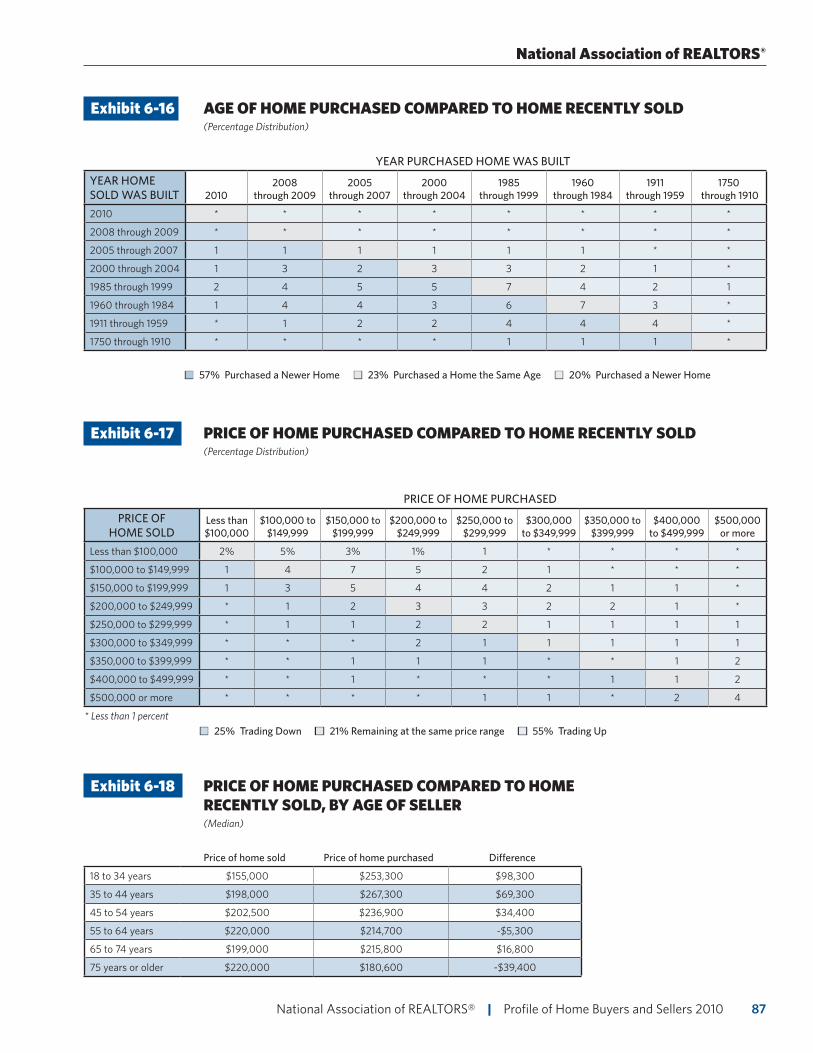
87 National Association of REALTORS® | Profile of Home Buyers and Sellers 2010
Exhibit 6-16 AGE OF HOME PURCHASED COMPARED TO HOME RECENTLY SOLD (Percentage Distribution)
YEAR PURCHASED HOME WAS BUILT
YEAR HOME SOLD WAS BUILT 2010
2008 through 2009
2005 through 2007
2000 through 2004
1985 through 1999
1960 through 1984
1911 through 1959
1750 through 1910
2010 * * * * * * * *
2008 through 2009 * * * * * * * *
2005 through 2007 1 1 1 1 1 1 * *
2000 through 2004 1 3 2 3 3 2 1 *
1985 through 1999 2 4 5 5 7 4 2 1
1960 through 1984 1 4 4 3 6 7 3 *
1911 through 1959 * 1 2 2 4 4 4 *
1750 through 1910 * * * * 1 1 1 *
! 57% Purchased a Newer Home ! 23% Purchased a Home the Same Age ! 20% Purchased a Newer Home
Exhibit 6-17 PRICE OF HOME PURCHASED COMPARED TO HOME RECENTLY SOLD (Percentage Distribution)
PRICE OF HOME PURCHASED
PRICE OF HOME SOLD
Less than $100,000
$100,000 to $149,999
$150,000 to $199,999
$200,000 to $249,999
$250,000 to $299,999
$300,000 to $349,999
$350,000 to $399,999
$400,000 to $499,999
$500,000 or more
Less than $100,000 2% 5% 3% 1% 1 * * * *
$100,000 to $149,999 1 4 7 5 2 1 * * *
$150,000 to $199,999 1 3 5 4 4 2 1 1 *
$200,000 to $249,999 * 1 2 3 3 2 2 1 *
$250,000 to $299,999 * 1 1 2 2 1 1 1 1
$300,000 to $349,999 * * * 2 1 1 1 1 1
$350,000 to $399,999 * * 1 1 1 * * 1 2
$400,000 to $499,999 * * 1 * * * 1 1 2
$500,000 or more * * * * 1 1 * 2 4
* Less than 1 percent! 25% Trading Down ! 21% Remaining at the same price range ! 55% Trading Up
Exhibit 6-18 PRICE OF HOME PURCHASED COMPARED TO HOME RECENTLY SOLD, BY AGE OF SELLER (Median)
Price of home sold Price of home purchased Difference
18 to 34 years $155,000 $253,300 $98,300
35 to 44 years $198,000 $267,300 $69,300
45 to 54 years $202,500 $236,900 $34,400
55 to 64 years $220,000 $214,700 -$5,300
65 to 74 years $199,000 $215,800 $16,800
75 years or older $220,000 $180,600 -$39,400
National Association of REALTORS®
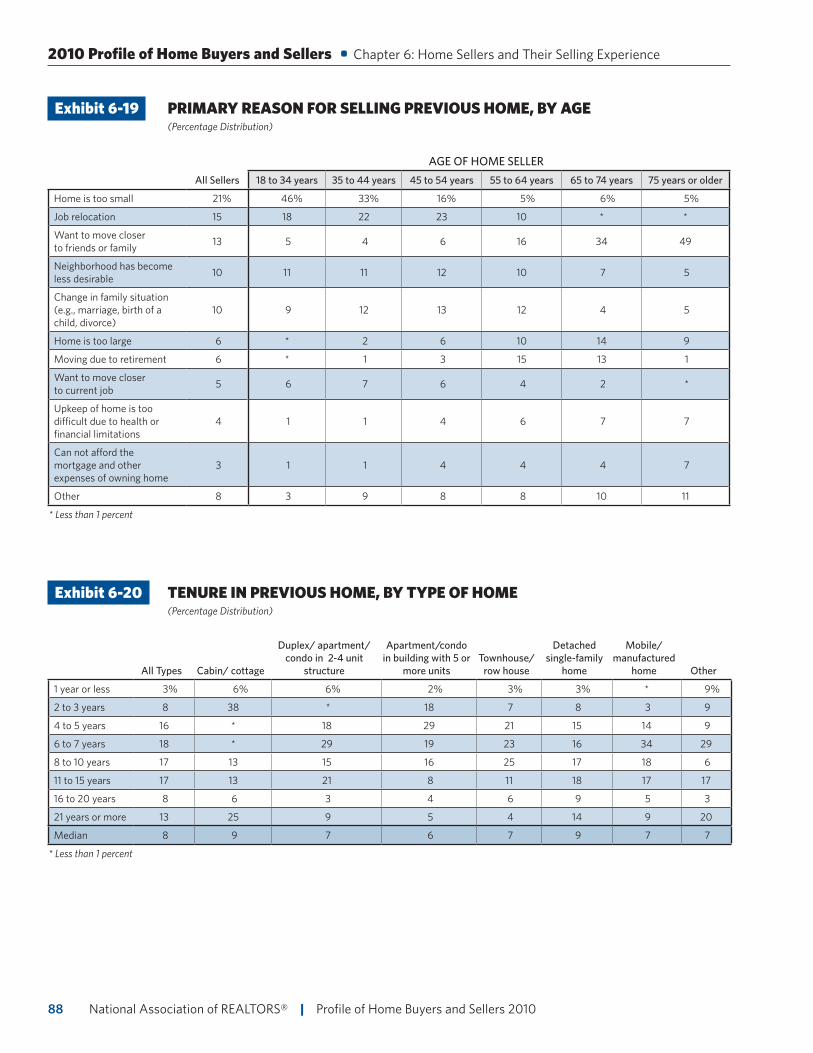
National Association of REALTORS® | Profile of Home Buyers and Sellers 201088
Exhibit 6-19 PRIMARY REASON FOR SELLING PREVIOUS HOME, BY AGE (Percentage Distribution)
AGE OF HOME SELLER
All Sellers 18 to 34 years 35 to 44 years 45 to 54 years 55 to 64 years 65 to 74 years 75 years or older
Home is too small 21% 46% 33% 16% 5% 6% 5%
Job relocation 15 18 22 23 10 * *
Want to move closer to friends or family 13 5 4 6 16 34 49
Neighborhood has become less desirable 10 11 11 12 10 7 5
Change in family situation (e.g., marriage, birth of a child, divorce)
10 9 12 13 12 4 5
Home is too large 6 * 2 6 10 14 9
Moving due to retirement 6 * 1 3 15 13 1
Want to move closer to current job 5 6 7 6 4 2 *
Upkeep of home is too difficult due to health or financial limitations
4 1 1 4 6 7 7
Can not afford the mortgage and other expenses of owning home
3 1 1 4 4 4 7
Other 8 3 9 8 8 10 11
* Less than 1 percent
Exhibit 6-20 TENURE IN PREVIOUS HOME, BY TYPE OF HOME (Percentage Distribution)
All Types Cabin/ cottage
Duplex/ apartment/condo in 2-4 unit
structure
Apartment/condo in building with 5 or
more unitsTownhouse/
row house
Detached single-family
home
Mobile/ manufactured
home Other
1 year or less 3% 6% 6% 2% 3% 3% * 9%
2 to 3 years 8 38 * 18 7 8 3 9
4 to 5 years 16 * 18 29 21 15 14 9
6 to 7 years 18 * 29 19 23 16 34 29
8 to 10 years 17 13 15 16 25 17 18 6
11 to 15 years 17 13 21 8 11 18 17 17
16 to 20 years 8 6 3 4 6 9 5 3
21 years or more 13 25 9 5 4 14 9 20
Median 8 9 7 6 7 9 7 7
* Less than 1 percent
2010 Profile of Home Buyers and Sellers • Chapter 6: Home Sellers and Their Selling Experience
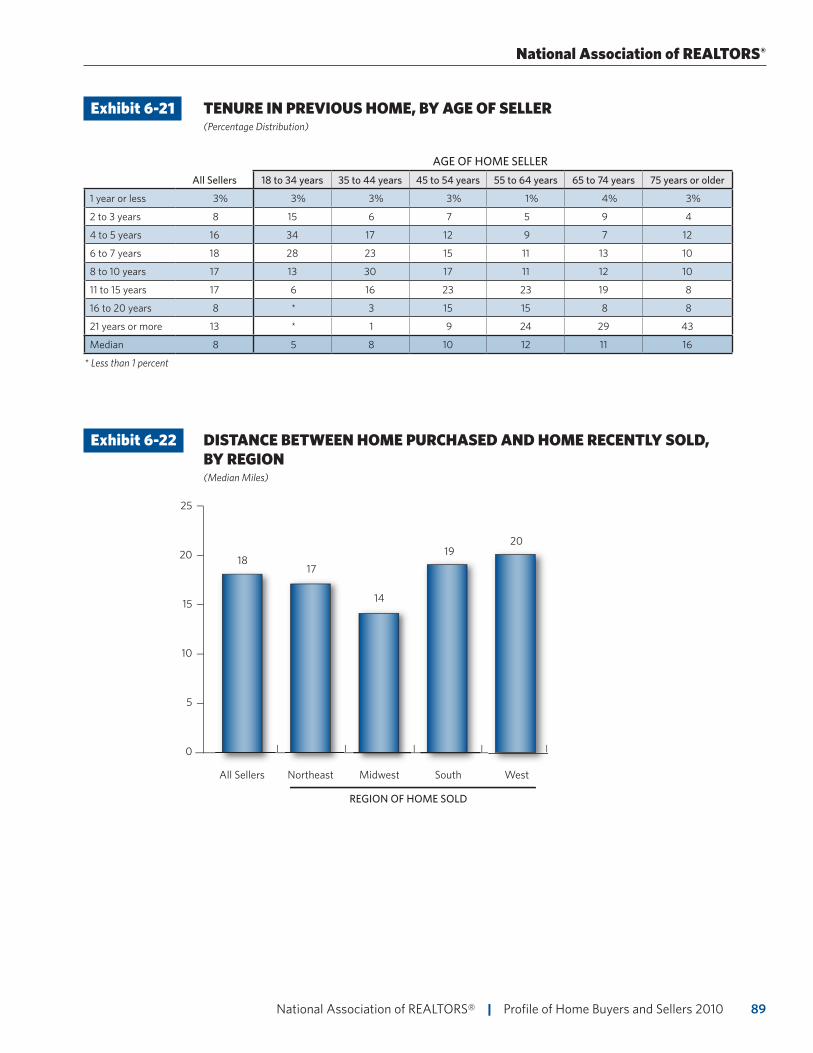
89 National Association of REALTORS® | Profile of Home Buyers and Sellers 2010
Exhibit 6-21 TENURE IN PREVIOUS HOME, BY AGE OF SELLER (Percentage Distribution)
AGE OF HOME SELLER
All Sellers 18 to 34 years 35 to 44 years 45 to 54 years 55 to 64 years 65 to 74 years 75 years or older
1 year or less 3% 3% 3% 3% 1% 4% 3%
2 to 3 years 8 15 6 7 5 9 4
4 to 5 years 16 34 17 12 9 7 12
6 to 7 years 18 28 23 15 11 13 10
8 to 10 years 17 13 30 17 11 12 10
11 to 15 years 17 6 16 23 23 19 8
16 to 20 years 8 * 3 15 15 8 8
21 years or more 13 * 1 9 24 29 43
Median 8 5 8 10 12 11 16
* Less than 1 percent
Exhibit 6-22 DISTANCE BETWEEN HOME PURCHASED AND HOME RECENTLY SOLD, BY REGION (Median Miles)
25
20
15
All Sellers
10
5
0
Northeast Midwest South West
1817
14
1920
REGION OF HOME SOLD
National Association of REALTORS®
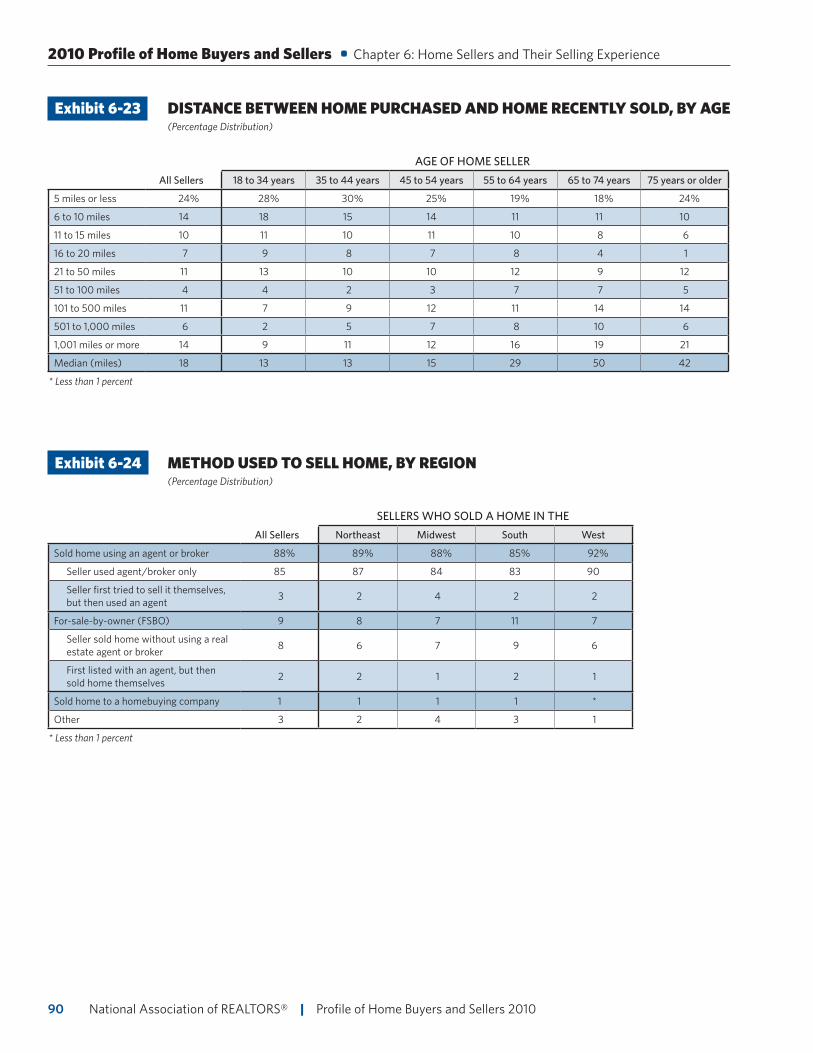
National Association of REALTORS® | Profile of Home Buyers and Sellers 201090
Exhibit 6-23 DISTANCE BETWEEN HOME PURCHASED AND HOME RECENTLY SOLD, BY AGE (Percentage Distribution)
AGE OF HOME SELLER
All Sellers 18 to 34 years 35 to 44 years 45 to 54 years 55 to 64 years 65 to 74 years 75 years or older
5 miles or less 24% 28% 30% 25% 19% 18% 24%
6 to 10 miles 14 18 15 14 11 11 10
11 to 15 miles 10 11 10 11 10 8 6
16 to 20 miles 7 9 8 7 8 4 1
21 to 50 miles 11 13 10 10 12 9 12
51 to 100 miles 4 4 2 3 7 7 5
101 to 500 miles 11 7 9 12 11 14 14
501 to 1,000 miles 6 2 5 7 8 10 6
1,001 miles or more 14 9 11 12 16 19 21
Median (miles) 18 13 13 15 29 50 42
* Less than 1 percent
Exhibit 6-24 METHOD USED TO SELL HOME, BY REGION (Percentage Distribution)
SELLERS WHO SOLD A HOME IN THE
All Sellers Northeast Midwest South West
Sold home using an agent or broker 88% 89% 88% 85% 92%
Seller used agent/broker only 85 87 84 83 90
Seller first tried to sell it themselves, but then used an agent 3 2 4 2 2
For-sale-by-owner (FSBO) 9 8 7 11 7
Seller sold home without using a real estate agent or broker 8 6 7 9 6
First listed with an agent, but then sold home themselves 2 2 1 2 1
Sold home to a homebuying company 1 1 1 1 *
Other 3 2 4 3 1
* Less than 1 percent
2010 Profile of Home Buyers and Sellers • Chapter 6: Home Sellers and Their Selling Experience
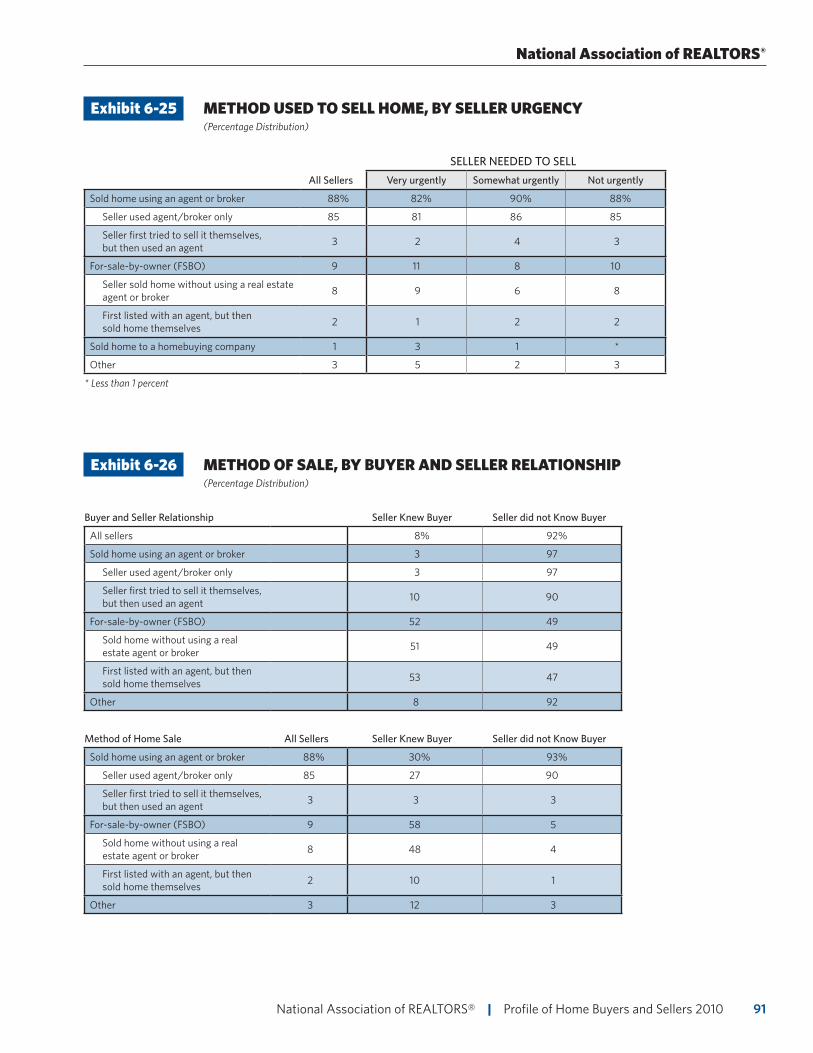
91 National Association of REALTORS® | Profile of Home Buyers and Sellers 2010
Exhibit 6-25 METHOD USED TO SELL HOME, BY SELLER URGENCY (Percentage Distribution)
SELLER NEEDED TO SELL
All Sellers Very urgently Somewhat urgently Not urgently
Sold home using an agent or broker 88% 82% 90% 88%
Seller used agent/broker only 85 81 86 85
Seller first tried to sell it themselves, but then used an agent 3 2 4 3
For-sale-by-owner (FSBO) 9 11 8 10
Seller sold home without using a real estate agent or broker 8 9 6 8
First listed with an agent, but then sold home themselves 2 1 2 2
Sold home to a homebuying company 1 3 1 *
Other 3 5 2 3
* Less than 1 percent
Exhibit 6-26 METHOD OF SALE, BY BUYER AND SELLER RELATIONSHIP (Percentage Distribution)
Buyer and Seller Relationship Seller Knew Buyer Seller did not Know Buyer
All sellers 8% 92%
Sold home using an agent or broker 3 97
Seller used agent/broker only 3 97
Seller first tried to sell it themselves, but then used an agent 10 90
For-sale-by-owner (FSBO) 52 49
Sold home without using a real estate agent or broker 51 49
First listed with an agent, but then sold home themselves 53 47
Other 8 92
Method of Home Sale All Sellers Seller Knew Buyer Seller did not Know Buyer
Sold home using an agent or broker 88% 30% 93%
Seller used agent/broker only 85 27 90
Seller first tried to sell it themselves, but then used an agent 3 3 3
For-sale-by-owner (FSBO) 9 58 5
Sold home without using a real estate agent or broker 8 48 4
First listed with an agent, but then sold home themselves 2 10 1
Other 3 12 3
National Association of REALTORS®
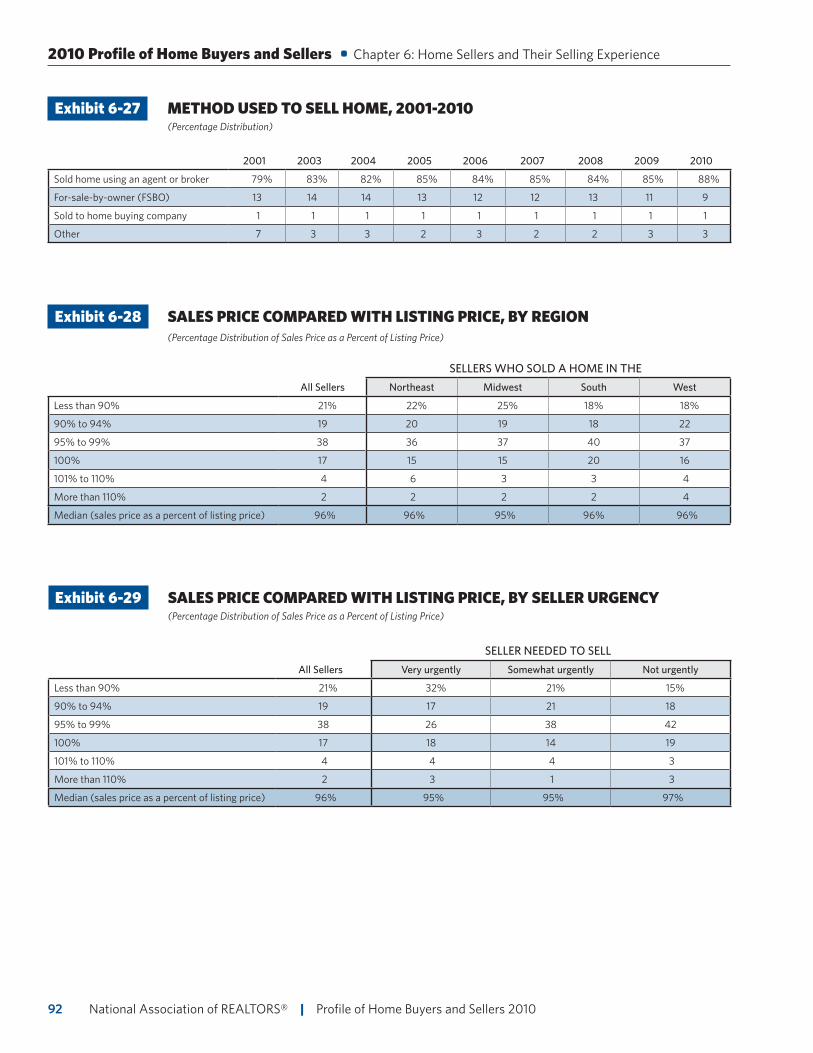
National Association of REALTORS® | Profile of Home Buyers and Sellers 201092
Exhibit 6-27 METHOD USED TO SELL HOME, 2001-2010 (Percentage Distribution)
2001 2003 2004 2005 2006 2007 2008 2009 2010
Sold home using an agent or broker 79% 83% 82% 85% 84% 85% 84% 85% 88%
For-sale-by-owner (FSBO) 13 14 14 13 12 12 13 11 9
Sold to home buying company 1 1 1 1 1 1 1 1 1
Other 7 3 3 2 3 2 2 3 3
Exhibit 6-28 SALES PRICE COMPARED WITH LISTING PRICE, BY REGION (Percentage Distribution of Sales Price as a Percent of Listing Price)
SELLERS WHO SOLD A HOME IN THE
All Sellers Northeast Midwest South West
Less than 90% 21% 22% 25% 18% 18%
90% to 94% 19 20 19 18 22
95% to 99% 38 36 37 40 37
100% 17 15 15 20 16
101% to 110% 4 6 3 3 4
More than 110% 2 2 2 2 4
Median (sales price as a percent of listing price) 96% 96% 95% 96% 96%
Exhibit 6-29 SALES PRICE COMPARED WITH LISTING PRICE, BY SELLER URGENCY (Percentage Distribution of Sales Price as a Percent of Listing Price)
SELLER NEEDED TO SELL
All Sellers Very urgently Somewhat urgently Not urgently
Less than 90% 21% 32% 21% 15%
90% to 94% 19 17 21 18
95% to 99% 38 26 38 42
100% 17 18 14 19
101% to 110% 4 4 4 3
More than 110% 2 3 1 3
Median (sales price as a percent of listing price) 96% 95% 95% 97%
2010 Profile of Home Buyers and Sellers • Chapter 6: Home Sellers and Their Selling Experience
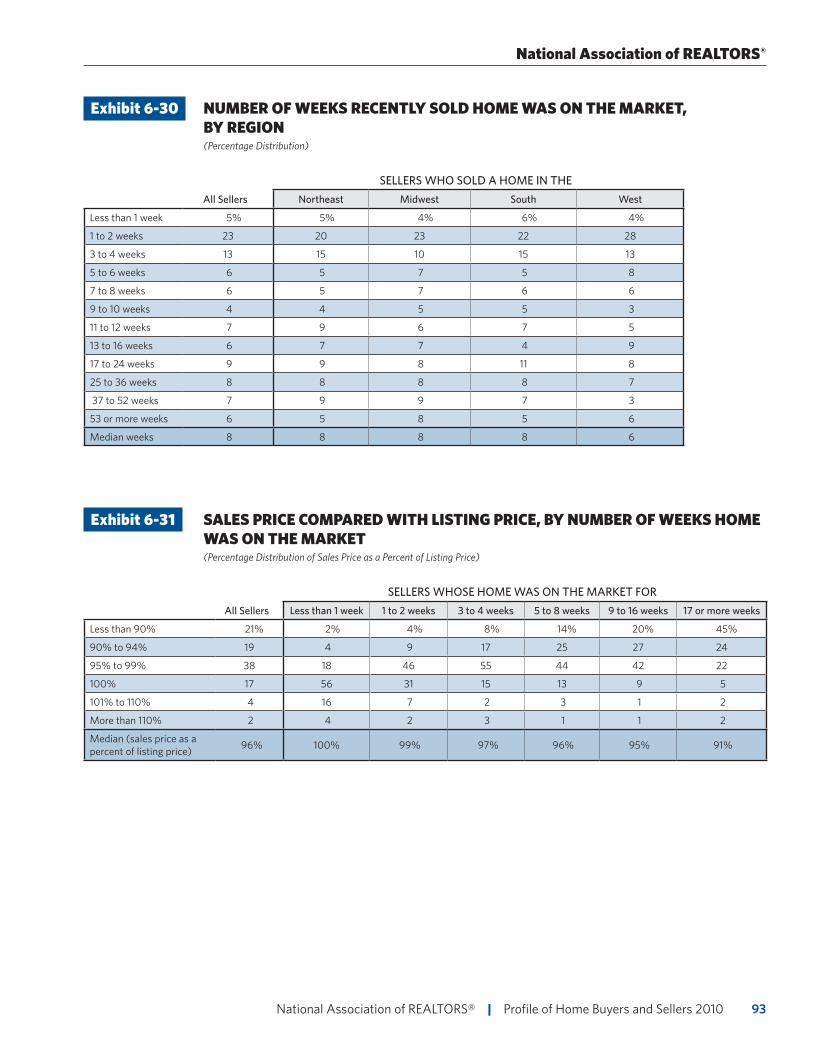
93 National Association of REALTORS® | Profile of Home Buyers and Sellers 2010
Exhibit 6-30 NUMBER OF WEEKS RECENTLY SOLD HOME WAS ON THE MARKET, BY REGION (Percentage Distribution)
SELLERS WHO SOLD A HOME IN THE
All Sellers Northeast Midwest South West
Less than 1 week 5% 5% 4% 6% 4%
1 to 2 weeks 23 20 23 22 28
3 to 4 weeks 13 15 10 15 13
5 to 6 weeks 6 5 7 5 8
7 to 8 weeks 6 5 7 6 6
9 to 10 weeks 4 4 5 5 3
11 to 12 weeks 7 9 6 7 5
13 to 16 weeks 6 7 7 4 9
17 to 24 weeks 9 9 8 11 8
25 to 36 weeks 8 8 8 8 7
37 to 52 weeks 7 9 9 7 3
53 or more weeks 6 5 8 5 6
Median weeks 8 8 8 8 6
Exhibit 6-31 SALES PRICE COMPARED WITH LISTING PRICE, BY NUMBER OF WEEKS HOME WAS ON THE MARKET (Percentage Distribution of Sales Price as a Percent of Listing Price)
SELLERS WHOSE HOME WAS ON THE MARKET FOR
All Sellers Less than 1 week 1 to 2 weeks 3 to 4 weeks 5 to 8 weeks 9 to 16 weeks 17 or more weeks
Less than 90% 21% 2% 4% 8% 14% 20% 45%
90% to 94% 19 4 9 17 25 27 24
95% to 99% 38 18 46 55 44 42 22
100% 17 56 31 15 13 9 5
101% to 110% 4 16 7 2 3 1 2
More than 110% 2 4 2 3 1 1 2
Median (sales price as a percent of listing price) 96% 100% 99% 97% 96% 95% 91%
National Association of REALTORS®
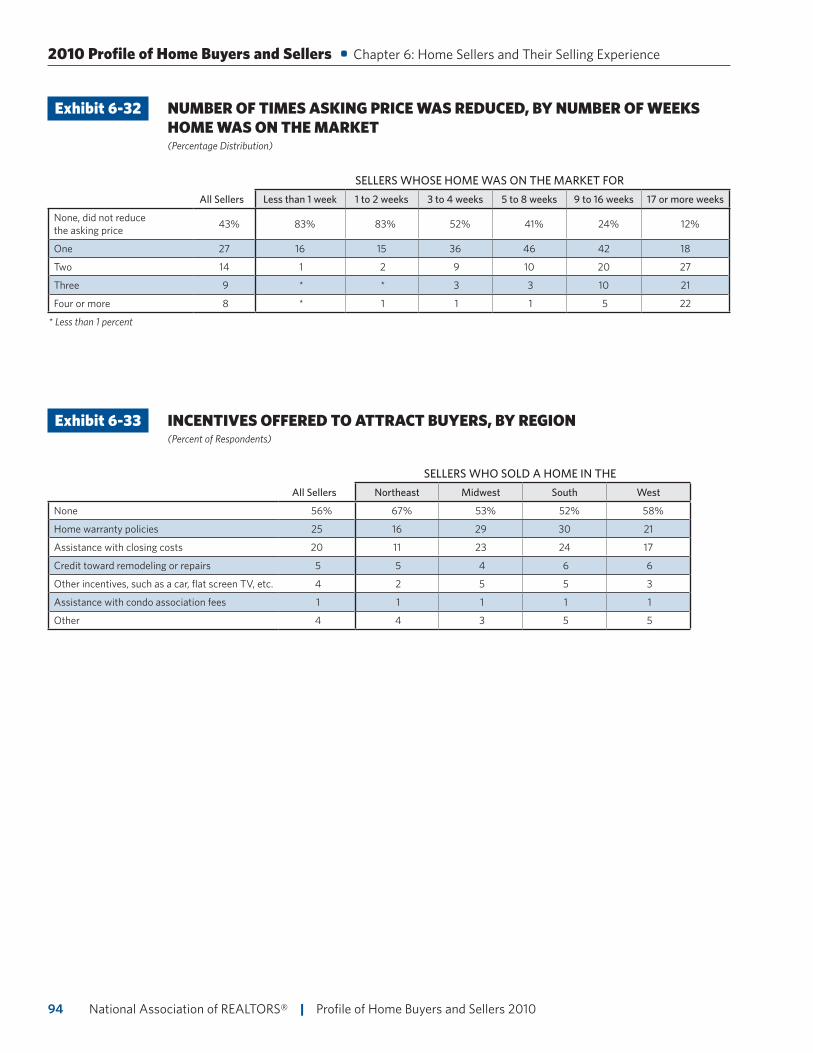
National Association of REALTORS® | Profile of Home Buyers and Sellers 201094
Exhibit 6-32 NUMBER OF TIMES ASKING PRICE WAS REDUCED, BY NUMBER OF WEEKS HOME WAS ON THE MARKET (Percentage Distribution)
SELLERS WHOSE HOME WAS ON THE MARKET FOR
All Sellers Less than 1 week 1 to 2 weeks 3 to 4 weeks 5 to 8 weeks 9 to 16 weeks 17 or more weeks
None, did not reduce the asking price 43% 83% 83% 52% 41% 24% 12%
One 27 16 15 36 46 42 18
Two 14 1 2 9 10 20 27
Three 9 * * 3 3 10 21
Four or more 8 * 1 1 1 5 22
* Less than 1 percent
Exhibit 6-33 INCENTIVES OFFERED TO ATTRACT BUYERS, BY REGION (Percent of Respondents)
SELLERS WHO SOLD A HOME IN THE
All Sellers Northeast Midwest South West
None 56% 67% 53% 52% 58%
Home warranty policies 25 16 29 30 21
Assistance with closing costs 20 11 23 24 17
Credit toward remodeling or repairs 5 5 4 6 6
Other incentives, such as a car, flat screen TV, etc. 4 2 5 5 3
Assistance with condo association fees 1 1 1 1 1
Other 4 4 3 5 5
2010 Profile of Home Buyers and Sellers • Chapter 6: Home Sellers and Their Selling Experience
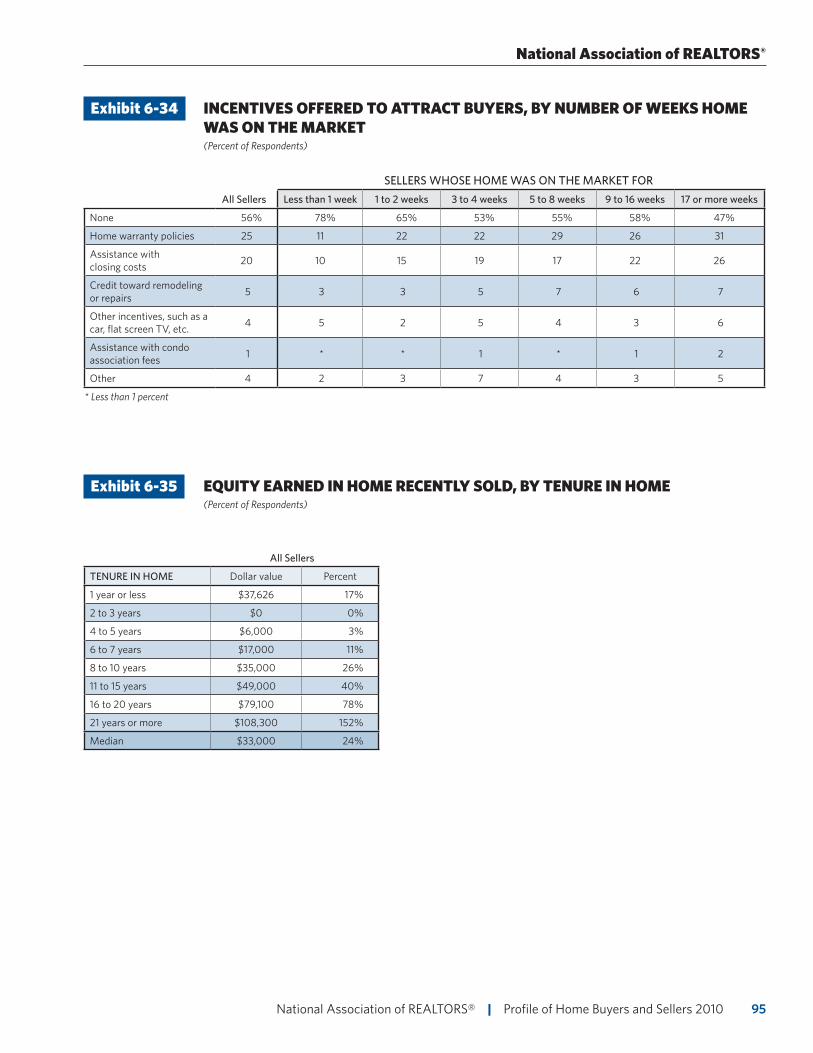
95 National Association of REALTORS® | Profile of Home Buyers and Sellers 2010
Exhibit 6-34 INCENTIVES OFFERED TO ATTRACT BUYERS, BY NUMBER OF WEEKS HOME WAS ON THE MARKET (Percent of Respondents)
SELLERS WHOSE HOME WAS ON THE MARKET FOR
All Sellers Less than 1 week 1 to 2 weeks 3 to 4 weeks 5 to 8 weeks 9 to 16 weeks 17 or more weeks
None 56% 78% 65% 53% 55% 58% 47%
Home warranty policies 25 11 22 22 29 26 31
Assistance with closing costs 20 10 15 19 17 22 26
Credit toward remodeling or repairs 5 3 3 5 7 6 7
Other incentives, such as a car, flat screen TV, etc. 4 5 2 5 4 3 6
Assistance with condo association fees 1 * * 1 * 1 2
Other 4 2 3 7 4 3 5
* Less than 1 percent
Exhibit 6-35 EQUITY EARNED IN HOME RECENTLY SOLD, BY TENURE IN HOME (Percent of Respondents)
All Sellers
TENURE IN HOME Dollar value Percent
1 year or less $37,626 17%
2 to 3 years $0 0%
4 to 5 years $6,000 3%
6 to 7 years $17,000 11%
8 to 10 years $35,000 26%
11 to 15 years $49,000 40%
16 to 20 years $79,100 78%
21 years or more $108,300 152%
Median $33,000 24%
National Association of REALTORS®
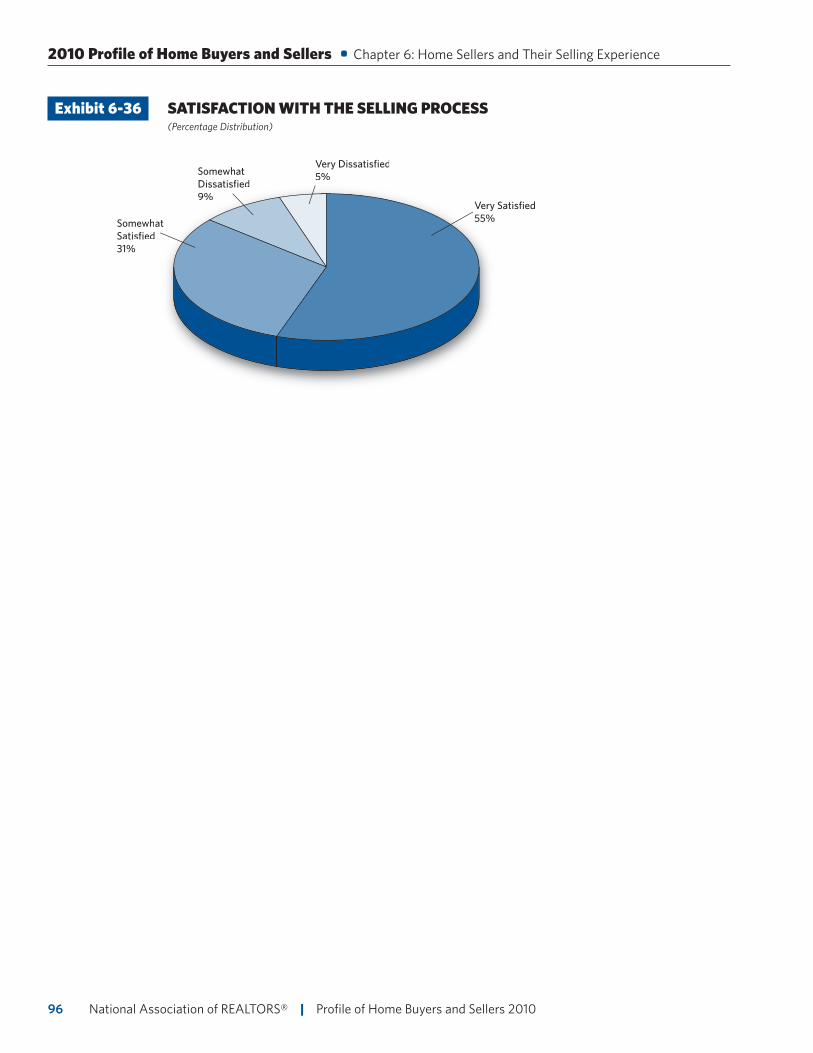
National Association of REALTORS® | Profile of Home Buyers and Sellers 201096
Somewhat Dissatisfied9%
Very Satisfied55%Somewhat
Satisfied31%
Very Dissatisfied5%Somewhat
Dissatisfied9%
Very Satisfied55%Somewhat
Satisfied31%
Very Dissatisfied5%
Exhibit 6-36 SATISFACTION WITH THE SELLING PROCESS (Percentage Distribution)
2010 Profile of Home Buyers and Sellers • Chapter 6: Home Sellers and Their Selling Experience
97 National Association of REALTORS® | Profile of Home Buyers and Sellers 2010
Chapter 7: Home Selling and Real Estate Professionals
Relationships play a key role in the real estate transaction and generate future business. Referrals from friends and family and repeat business continue to be the top methods home sellers use to find a real estate
agent. Given the importance of referrals and repeat business relationships, two-thirds of sellers contacted only one agent to assist with their home sale and one-half who used an agent to sell their home used the same agent to buy a new home. Home sellers place high emphasis on relational qualities such as strong reputation, evidence of honesty and integrity, and look to friends or family members when choosing an agent. The skilled sellers most often cited as an important influence on agent selection was the agent’s knowledge of the neighborhood. Most sellers (four-fifths) have a comprehensive relationship with their agent, working with an agent who provides a broad range of services rather than an agent who offers a limited set of services. Sellers were even more satisfied with their agents in 2010 than in 2009; 84 percent of sellers indicated that they would recommend their agent or use the agent’s services in the future as opposed to 81 percent a year ago.
Marketing of real estate continues to undergo changes. While the share of those using some types of traditional marketing media remains high, such as yard signs and print newspaper ads, these shares are decreasing. Real estate agents are making greater use of the Internet, social media, and video hosting web sites. The Internet remains the most dominant marketing tool with 91 percent of agent- assisted sellers reporting that the agent listed their home on the Internet. All Internet-related marketing methods were more prevalent in 2010, while most non-Internet tools were less prevalent.
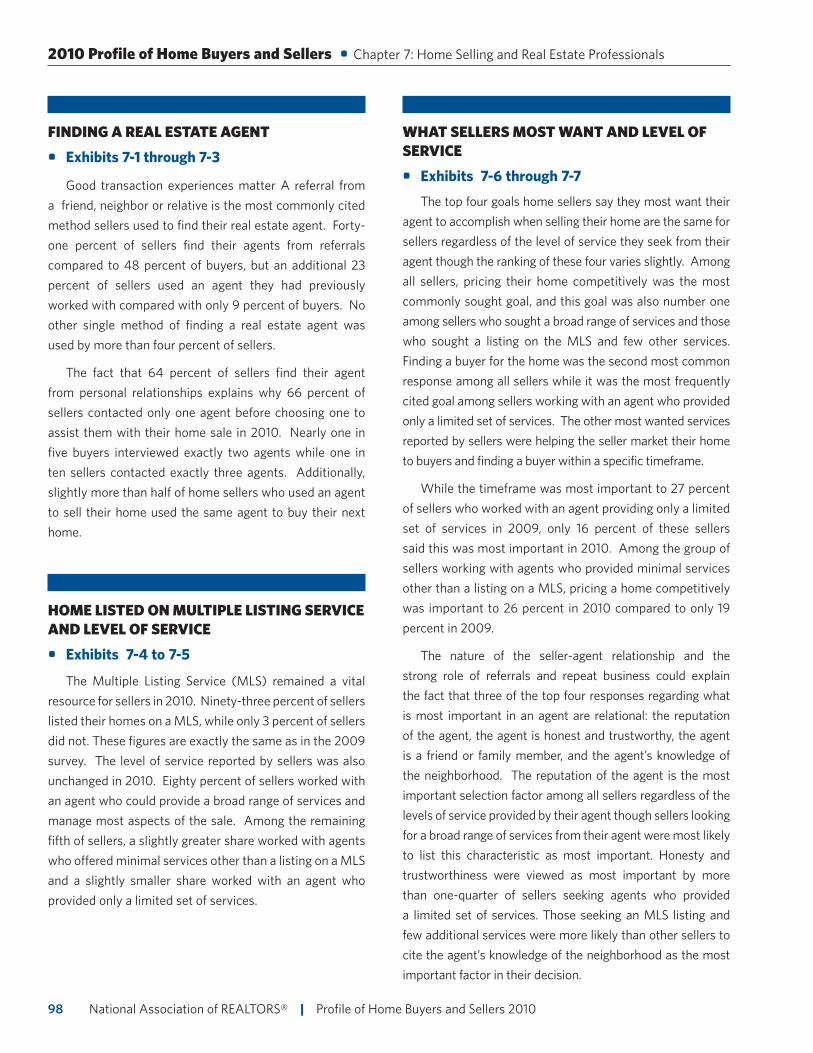
National Association of REALTORS® | Profile of Home Buyers and Sellers 201098
2010 Profile of Home Buyers and Sellers • Chapter 7: Home Selling and Real Estate Professionals
FINDING A REAL ESTATE AGENT
• Exhibits 7-1 through 7-3
Good transaction experiences matter A referral from a friend, neighbor or relative is the most commonly cited method sellers used to find their real estate agent. Forty-one percent of sellers find their agents from referrals compared to 48 percent of buyers, but an additional 23 percent of sellers used an agent they had previously worked with compared with only 9 percent of buyers. No other single method of finding a real estate agent was used by more than four percent of sellers.
The fact that 64 percent of sellers find their agent from personal relationships explains why 66 percent of sellers contacted only one agent before choosing one to assist them with their home sale in 2010. Nearly one in five buyers interviewed exactly two agents while one in ten sellers contacted exactly three agents. Additionally, slightly more than half of home sellers who used an agent to sell their home used the same agent to buy their next home.
HOME LISTED ON MULTIPLE LISTING SERVICE AND LEVEL OF SERVICE
• Exhibits 7-4 to 7-5
The Multiple Listing Service (MLS) remained a vital resource for sellers in 2010. Ninety-three percent of sellers listed their homes on a MLS, while only 3 percent of sellers did not. These figures are exactly the same as in the 2009 survey. The level of service reported by sellers was also unchanged in 2010. Eighty percent of sellers worked with an agent who could provide a broad range of services and manage most aspects of the sale. Among the remaining fifth of sellers, a slightly greater share worked with agents who offered minimal services other than a listing on a MLS and a slightly smaller share worked with an agent who provided only a limited set of services.
WHAT SELLERS MOST WANT AND LEVEL OF SERVICE
• Exhibits 7-6 through 7-7
The top four goals home sellers say they most want their agent to accomplish when selling their home are the same for sellers regardless of the level of service they seek from their agent though the ranking of these four varies slightly. Among all sellers, pricing their home competitively was the most commonly sought goal, and this goal was also number one among sellers who sought a broad range of services and those who sought a listing on the MLS and few other services. Finding a buyer for the home was the second most common response among all sellers while it was the most frequently cited goal among sellers working with an agent who provided only a limited set of services. The other most wanted services reported by sellers were helping the seller market their home to buyers and finding a buyer within a specific timeframe.
While the timeframe was most important to 27 percent of sellers who worked with an agent providing only a limited set of services in 2009, only 16 percent of these sellers said this was most important in 2010. Among the group of sellers working with agents who provided minimal services other than a listing on a MLS, pricing a home competitively was important to 26 percent in 2010 compared to only 19 percent in 2009.
The nature of the seller-agent relationship and the strong role of referrals and repeat business could explain the fact that three of the top four responses regarding what is most important in an agent are relational: the reputation of the agent, the agent is honest and trustworthy, the agent is a friend or family member, and the agent’s knowledge of the neighborhood. The reputation of the agent is the most important selection factor among all sellers regardless of the levels of service provided by their agent though sellers looking for a broad range of services from their agent were most likely to list this characteristic as most important. Honesty and trustworthiness were viewed as most important by more than one-quarter of sellers seeking agents who provided a limited set of services. Those seeking an MLS listing and few additional services were more likely than other sellers to cite the agent’s knowledge of the neighborhood as the most important factor in their decision.
99 National Association of REALTORS® | Profile of Home Buyers and Sellers 2010
National Association of REALTORS®
METHODS USED TO MARKET THE HOME
• Exhibit 7-8
The Internet and related marketing methods (including other web sites with real estate listings, social networking web sites, and web sites with video hosting services) saw gains in 2010, a year when other, more expensive marketing methods were less frequently used. Ninety-one percent of sellers using an agent reported that the agent listed their home on the Internet, up from 90 percent in 2009. Conventional marketing methods, while losing ground, have not disappeared. A yard sign remained the second most frequent marketing method used by 79 percent of sellers as opposed to 82 percent in 2009. The share of sellers who used an agent and held an open house remained third most common, slipping from 59 percent in 2009 to 56 percent in 2010. Other marketing methods were much less frequently used.
While other web sites with real estate listings, social networking web sites, and web sites with video hosting services are not yet as frequently used as print newspaper advertisements, these marketing outlets saw gains. Social networking websites more than doubled their prevalence as a resource increasing the 2 percent share of 2009 to 5 percent in 2010. In the same period, print newspaper advertisement use among sellers using an agent declined from 37 percent to 28 percent.
AGENT’S PERFORMANCE AND COMPENSATION
• Exhibits 7-9 through 7-11
Little has changed in who compensates the agent, the structure of compensation, and negotiation of compensation from 2009. Most agents, 81 percent, are paid by the sellers in full. Smaller yet increasing shares of agents are paid by the buyers in part or in full, 9 and 5 percent respectively, up from 6 and 4 percent in 2009. As was the case in 2009, three-quarters of sellers pay the agent’s fee as a percent of the sales price; only 3 percent paid a flat fee to the agent.
Most negotiations of compensation are agent-initiated discussions. A majority of sellers are aware that the agent’s fees are negotiable. In more than one of every four client-initiated conversations the agent was unwilling to negotiate. One in ten sellers was aware that the commission and fees were negotiable but did not bring up the issue, and a similar share reported being unaware that compensation was negotiable.
With repeat business and referrals being the strongest sign of client satisfaction, most sellers, 84 percent, reported that they would recommend their agent or use the agent’s services in the future. This is an increase from 81 percent in 2009.
Good transaction experiences matter A referral from a friend, neighbor or relative is the most
commonly cited method sellers used to find their real estate agent
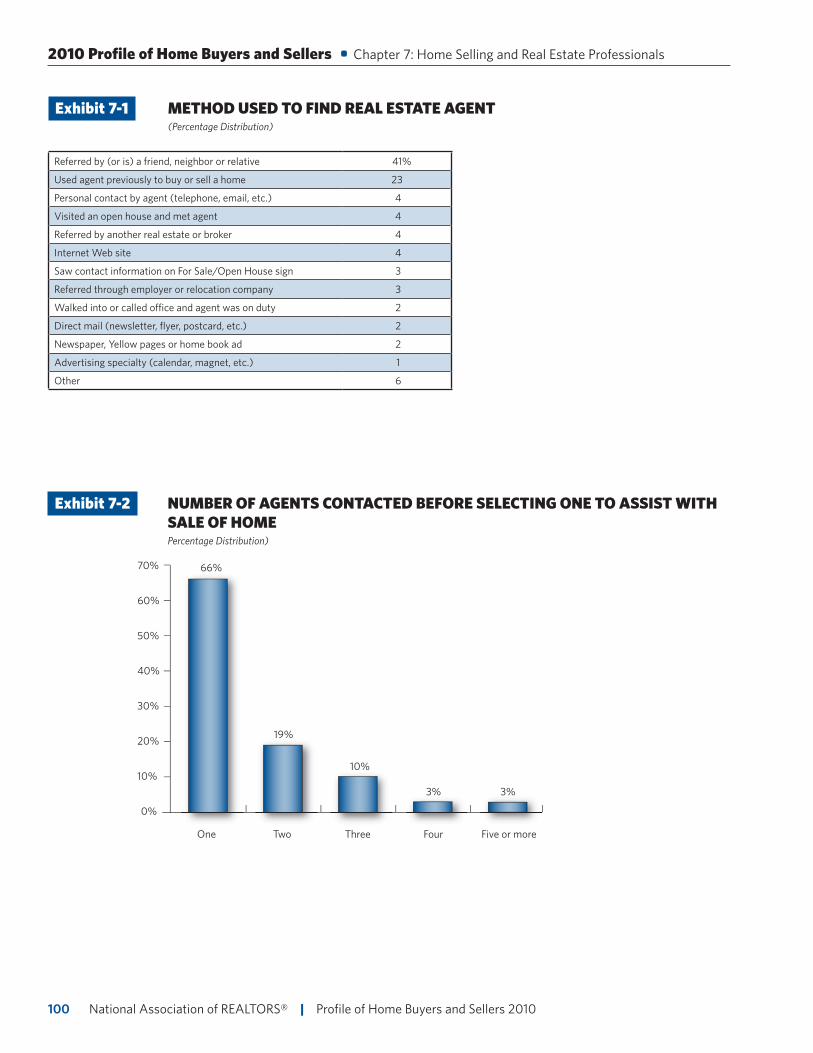
National Association of REALTORS® | Profile of Home Buyers and Sellers 2010100
2010 Profile of Home Buyers and Sellers • Chapter 7: Home Selling and Real Estate Professionals
Exhibit 7-1 METHOD USED TO FIND REAL ESTATE AGENT (Percentage Distribution)
Referred by (or is) a friend, neighbor or relative 41%
Used agent previously to buy or sell a home 23
Personal contact by agent (telephone, email, etc.) 4
Visited an open house and met agent 4
Referred by another real estate or broker 4
Internet Web site 4
Saw contact information on For Sale/Open House sign 3
Referred through employer or relocation company 3
Walked into or called office and agent was on duty 2
Direct mail (newsletter, flyer, postcard, etc.) 2
Newspaper, Yellow pages or home book ad 2
Advertising specialty (calendar, magnet, etc.) 1
Other 6
Exhibit 7-2 NUMBER OF AGENTS CONTACTED BEFORE SELECTING ONE TO ASSIST WITH SALE OF HOME Percentage Distribution)
70%
60%
50%
40%
30%
One
20%
10%
0%
Two Three Four Five or more
66%
19%
10%
3% 3%
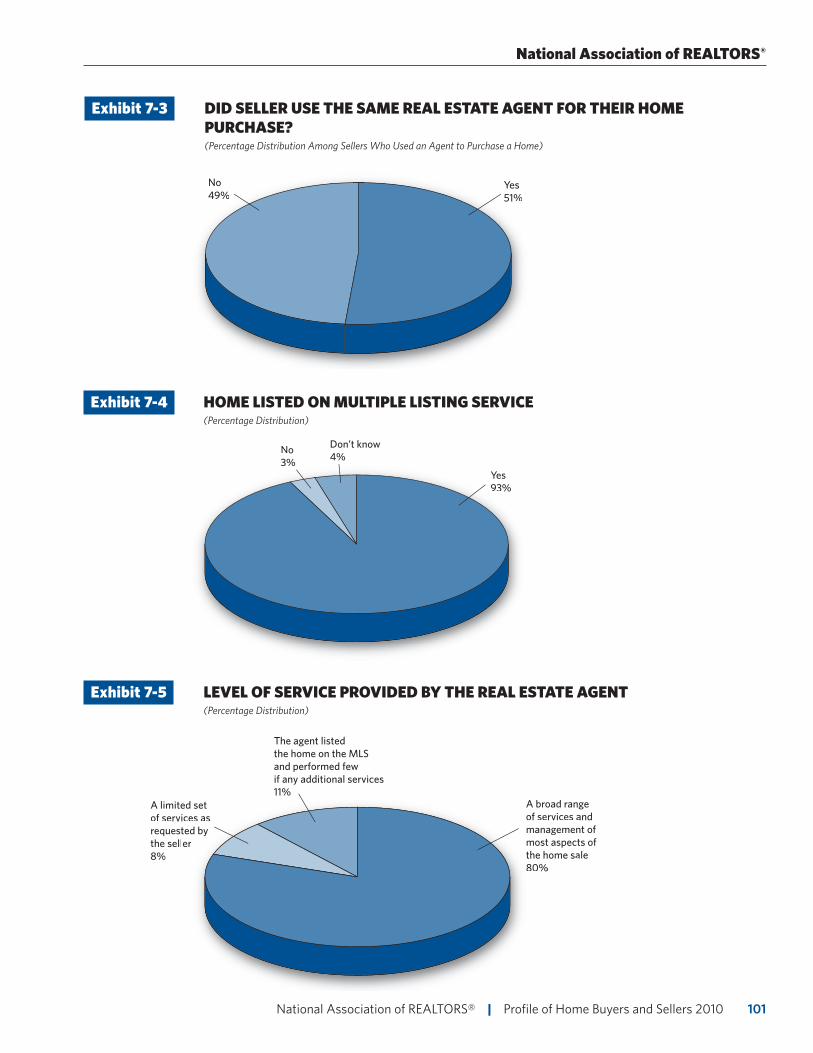
101 National Association of REALTORS® | Profile of Home Buyers and Sellers 2010
A limited set of services as requested by the seller8%
A broad range of services and management of most aspects of the home sale80%
A limited set of services as requested by the seller8%
A broad rangof services amanagemenmost aspectthe home sa80%
The agent listed the home on the MLS and performed few if any additional services11%
No3%
Yes93%
No3%
Yes93%
Don’t know4%
National Association of REALTORS®
Exhibit 7-3 DID SELLER USE THE SAME REAL ESTATE AGENT FOR THEIR HOME PURCHASE? (Percentage Distribution Among Sellers Who Used an Agent to Purchase a Home)
No49%
Yes51%
No49%
Yes51%
Exhibit 7-4 HOME LISTED ON MULTIPLE LISTING SERVICE (Percentage Distribution)
Exhibit 7-5 LEVEL OF SERVICE PROVIDED BY THE REAL ESTATE AGENT (Percentage Distribution)
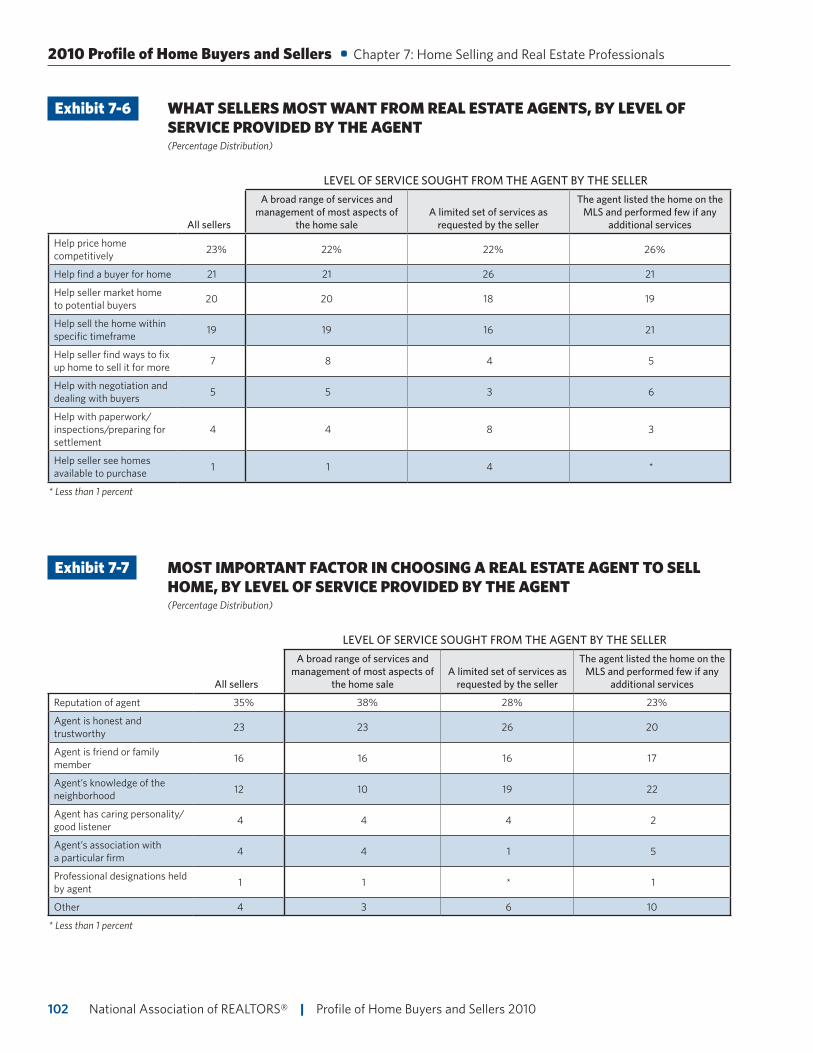
National Association of REALTORS® | Profile of Home Buyers and Sellers 2010102
2010 Profile of Home Buyers and Sellers • Chapter 7: Home Selling and Real Estate Professionals
Exhibit 7-6 WHAT SELLERS MOST WANT FROM REAL ESTATE AGENTS, BY LEVEL OF SERVICE PROVIDED BY THE AGENT (Percentage Distribution)
LEVEL OF SERVICE SOUGHT FROM THE AGENT BY THE SELLER
All sellers
A broad range of services and management of most aspects of
the home saleA limited set of services as
requested by the seller
The agent listed the home on the MLS and performed few if any
additional services
Help price home competitively 23% 22% 22% 26%
Help find a buyer for home 21 21 26 21
Help seller market home to potential buyers 20 20 18 19
Help sell the home within specific timeframe 19 19 16 21
Help seller find ways to fix up home to sell it for more 7 8 4 5
Help with negotiation and dealing with buyers 5 5 3 6
Help with paperwork/inspections/preparing for settlement
4 4 8 3
Help seller see homes available to purchase 1 1 4 *
* Less than 1 percent
Exhibit 7-7 MOST IMPORTANT FACTOR IN CHOOSING A REAL ESTATE AGENT TO SELL HOME, BY LEVEL OF SERVICE PROVIDED BY THE AGENT (Percentage Distribution)
LEVEL OF SERVICE SOUGHT FROM THE AGENT BY THE SELLER
All sellers
A broad range of services and management of most aspects of
the home saleA limited set of services as
requested by the seller
The agent listed the home on the MLS and performed few if any
additional services
Reputation of agent 35% 38% 28% 23%
Agent is honest and trustworthy 23 23 26 20
Agent is friend or family member 16 16 16 17
Agent’s knowledge of the neighborhood 12 10 19 22
Agent has caring personality/good listener 4 4 4 2
Agent’s association with a particular firm 4 4 1 5
Professional designations held by agent 1 1 * 1
Other 4 3 6 10
* Less than 1 percent
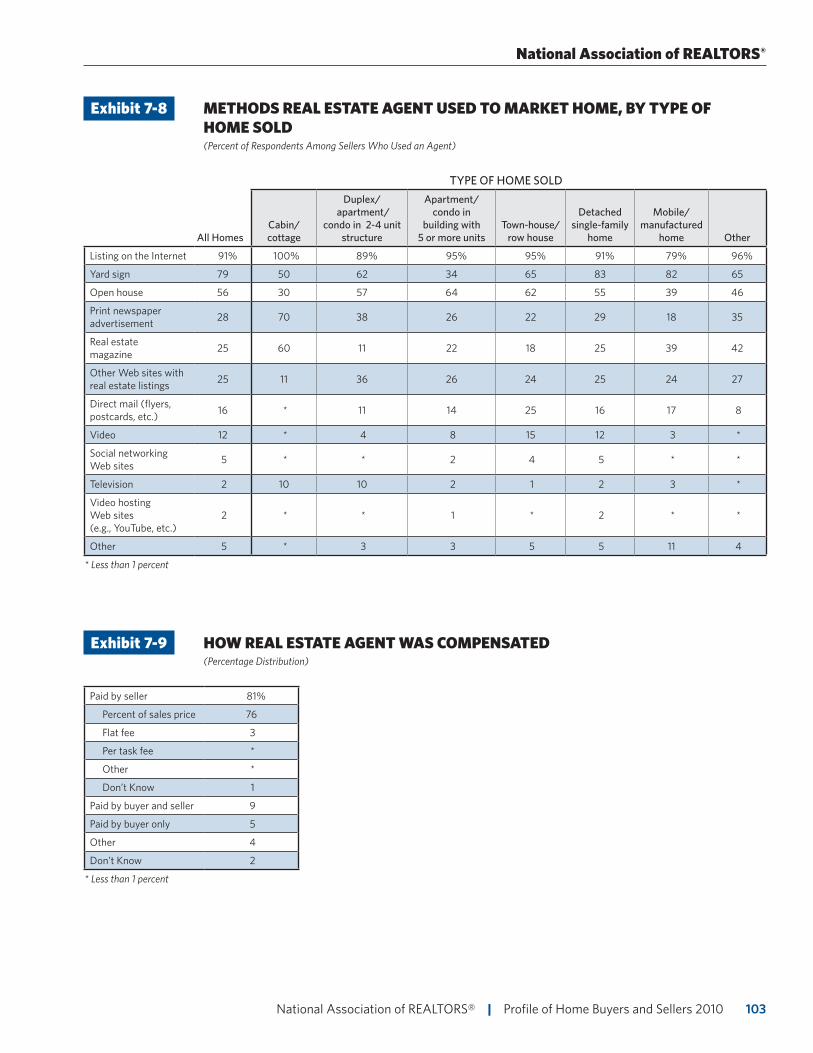
103 National Association of REALTORS® | Profile of Home Buyers and Sellers 2010
National Association of REALTORS®
Exhibit 7-8 METHODS REAL ESTATE AGENT USED TO MARKET HOME, BY TYPE OF HOME SOLD (Percent of Respondents Among Sellers Who Used an Agent)
TYPE OF HOME SOLD
All HomesCabin/ cottage
Duplex/ apartment/
condo in 2-4 unit structure
Apartment/ condo in
building with 5 or more units
Town-house/row house
Detached single-family
home
Mobile/ manufactured
home Other
Listing on the Internet 91% 100% 89% 95% 95% 91% 79% 96%
Yard sign 79 50 62 34 65 83 82 65
Open house 56 30 57 64 62 55 39 46
Print newspaper advertisement 28 70 38 26 22 29 18 35
Real estate magazine 25 60 11 22 18 25 39 42
Other Web sites with real estate listings 25 11 36 26 24 25 24 27
Direct mail (flyers, postcards, etc.) 16 * 11 14 25 16 17 8
Video 12 * 4 8 15 12 3 *
Social networking Web sites 5 * * 2 4 5 * *
Television 2 10 10 2 1 2 3 *
Video hosting Web sites (e.g., YouTube, etc.)
2 * * 1 * 2 * *
Other 5 * 3 3 5 5 11 4
* Less than 1 percent
Exhibit 7-9 HOW REAL ESTATE AGENT WAS COMPENSATED (Percentage Distribution)
Paid by seller 81%
Percent of sales price 76
Flat fee 3
Per task fee *
Other *
Don’t Know 1
Paid by buyer and seller 9
Paid by buyer only 5
Other 4
Don’t Know 2
* Less than 1 percent
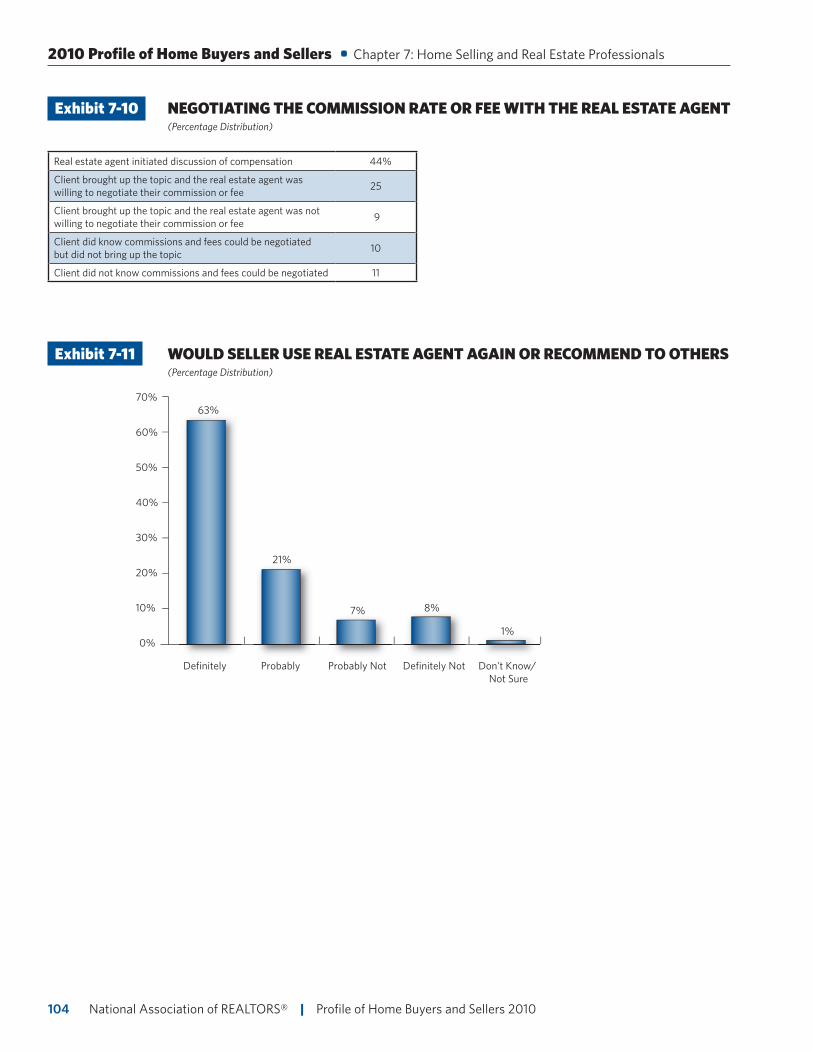
National Association of REALTORS® | Profile of Home Buyers and Sellers 2010104
2010 Profile of Home Buyers and Sellers • Chapter 7: Home Selling and Real Estate Professionals
Exhibit 7-10 NEGOTIATING THE COMMISSION RATE OR FEE WITH THE REAL ESTATE AGENT (Percentage Distribution)
Real estate agent initiated discussion of compensation 44%
Client brought up the topic and the real estate agent was willing to negotiate their commission or fee 25
Client brought up the topic and the real estate agent was not willing to negotiate their commission or fee 9
Client did know commissions and fees could be negotiated but did not bring up the topic 10
Client did not know commissions and fees could be negotiated 11
Exhibit 7-11 WOULD SELLER USE REAL ESTATE AGENT AGAIN OR RECOMMEND TO OTHERS (Percentage Distribution)
70%
60%
50%
40%
30%
Definitely
20%
10%
0%
Probably Probably Not Definitely Not Don't Know/ Not Sure
63%
21%
7% 8%
1%
105 National Association of REALTORS® | Profile of Home Buyers and Sellers 2010 105 National Association of REALTORS® | Profile of Home Buyers and Sellers 2010
Chapter 8: For Sale By Owner Sellers
For-Sale-By-Owner (FSBO) sellers decreased in 2010, continuing a trend in declines downward. Fourteen percent of sales were FSBOs in 2003 and 2004, compared to just nine percent in 2010. In this tough
market, a greater share of sellers are turning to agents to help them sell their homes.
FSBOs are more popular in rural areas and center cities. Typically FSBO sellers have lower median incomes and are more often singles. FSBOs are also more common for mobile home sales.
Many sellers who opt for FSBOs are selling their property to someone they know like a friend, relative, or neighbor. This helps keep FSBOs on the market for less time and more often sellers receive 100 percent of the asking price. FSBOs are less likely to use incentives. Yard signs and Internet listings are the most popular method of marketing FSBOs. FSBO sellers most often struggle with pricing and preparing homes for sale. Of those who used FSBOs to sell to someone they knew, a greater share would use a real estate agent when selling their current home.
National Association of REALTORS® | Profile of Home Buyers and Sellers 2010106
2010 Profile of Home Buyers and Sellers • Chapter 8: For Sale By Owner Sellers
FSBO AND AGENT ASSISTED SALES, BY LOCATION AND OVER TIME
• Exhibits 8-1 to 8-2
FSBO sales declined to less than one in ten sales transactions in 2010, down from around one in seven sales in 2004. About half of FSBO sales typically occur when the seller knows the buyer, since a real estate agent is not usually needed in those types of transactions. In this difficult market agents are being more frequently called on to assist sellers.
Resort areas, rural areas and central cities tend to have the highest rates of FSBO sales, with only 6 percent of suburban area transactions being FSBOs.
CHARACTERISTICS OF FSBO AND AGENT-ASSISTED SELLERS
• Exhibit 8-3
FSBO sellers are typically younger and have lower median incomes than agent-assisted sellers. About two in three FSBO sellers are married couples, compared to three in four agent-assisted sellers. A higher share of FSBO sellers is single.
CHARACTERISTICS OF HOMES SOLD BY FSBO AND AGENT-ASSISTED SELLERS
• Exhibits 8-4 through 8-6
Two in three homes sold as a FSBO are detached single-family homes compared with 83 percent of agent-assisted sales. FSBOs are more common for sellers of mobile or manufactured homes. One in five FSBO home sales transactions is a mobile or manufactured home. On the other hand, townhouses and row homes make up a higher share of agent-assisted sales (8 percent versus 3 percent).
The majority (54 percent) of agent-assisted sales occurred in suburban areas. A smaller share (40 percent) of FSBOs is located in suburban areas. One quarter of FSBOs take place in an urban area—higher than the share of agent-assisted sales.
FSBOs typically have a lower median selling price, though FSBOs typically received 100 percent of their asking price, whereas agent-assisted sales typically received 96 percent of their asking price. Some of the explanation for this is that among FSBO sales when the seller knew the buyer, more than two-thirds of the time the sales price was equal to the asking price.
107 National Association of REALTORS® | Profile of Home Buyers and Sellers 2010
National Association of REALTORS®
THE SELLING PROCESS FOR FSBO SALES
• Exhibits 8-7 through 8-9
FSBOs were typically on the market less than agent-assisted homes. This is especially true of FSBOs where the seller knew the buyer. The median time on the market for FSBOs was four weeks compared to eight weeks for agent-assisted sales. Among FSBOs where the buyer knew the seller, the median time on the market was one week. Agents seemed to help in circumstances where homes were difficult to sell. Those who first tried a FSBO then sought out an agent had a median number of weeks on the market of 16.
A higher share of FSBO sellers needed to sell their homes very urgently, more so in cases where the sellers did not know the buyers. The sellers with the least urgency were FSBO sellers who knew the buyers.
REASONS OF FSBOS, MARKETING, AND SELLERS EXPERIENCE
• Exhibits 8-10 through 8-13
Of FSBO sellers, roughly two in five used this route because they did not want to pay commission or a fee. Another one in three sold their property to a relative, friend or neighbor. In instances where the seller knew the buyer, sixty percent sold it to a relative, friend or neighbor. When the seller did not know the buyer, slightly less than six in ten sellers did not want to pay commission or a fee.
Yard signs, word of mouth to friends, relatives and neighbors, and Internet listings were the most common marketing methods for FSBOs. When the seller knew the buyer, 44 percent of the time the seller did not actively market the home. When the seller did not know the buyer 62 percent used a yard sign, and 41 percent marketed the home by the property on the Internet.
Pricing was the most difficult task for FSBO sellers. Almost one in four struggled getting the price right. Preparing the home for sale was their next most difficult task for FSBO sellers. Among those who knew the buyer, helping the buyer obtain financing was also a big challenge for the seller.
A larger share of FSBO sellers who knew the buyer would use a real estate agent rather than sell their current home themselves. However, among those who did not know the buyer, a larger share would attempt to sell their homes themselves rather than use an agent.
About half of FSBO sales typically occur when the seller knows the buyer, since a real estate agent is not usually needed in those
types of transactions. In this difficult market agents are being more frequently called on
to assist sellers.
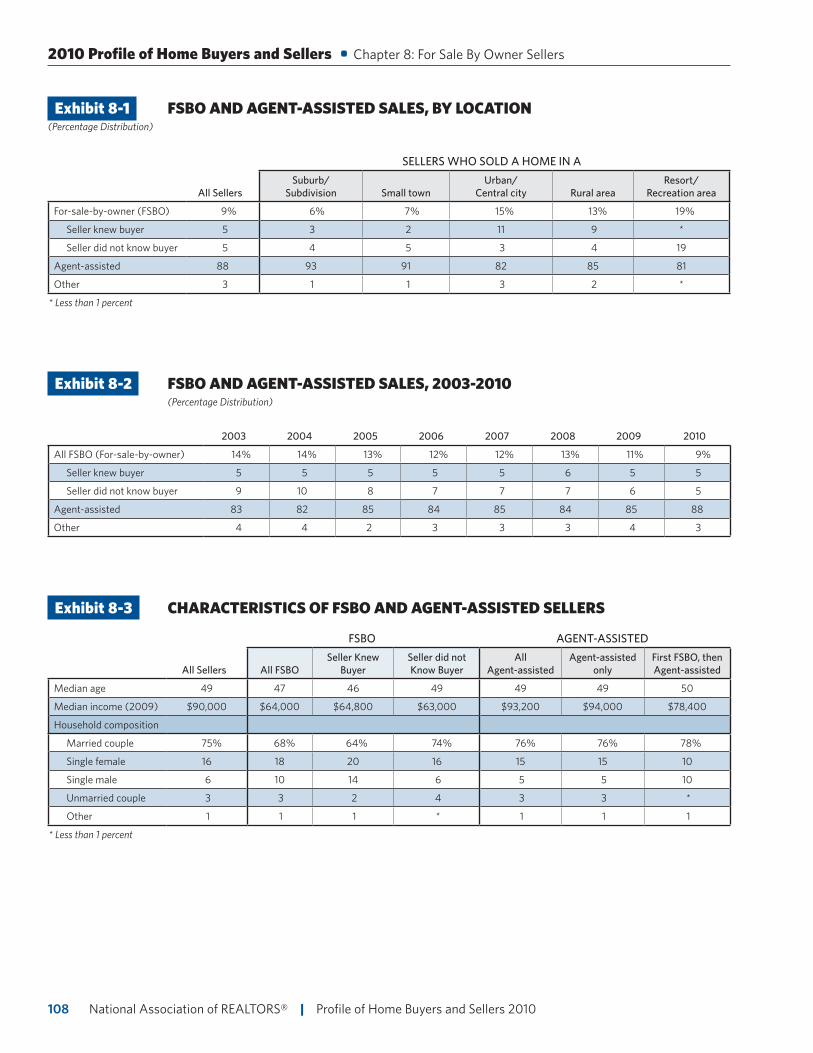
National Association of REALTORS® | Profile of Home Buyers and Sellers 2010108
2010 Profile of Home Buyers and Sellers • Chapter 8: For Sale By Owner Sellers
Exhibit 8-1 FSBO AND AGENT-ASSISTED SALES, BY LOCATION(Percentage Distribution)
SELLERS WHO SOLD A HOME IN A
All SellersSuburb/
Subdivision Small townUrban/
Central city Rural areaResort/
Recreation area
For-sale-by-owner (FSBO) 9% 6% 7% 15% 13% 19%
Seller knew buyer 5 3 2 11 9 *
Seller did not know buyer 5 4 5 3 4 19
Agent-assisted 88 93 91 82 85 81
Other 3 1 1 3 2 *
* Less than 1 percent
Exhibit 8-2 FSBO AND AGENT-ASSISTED SALES, 2003-2010 (Percentage Distribution)
2003 2004 2005 2006 2007 2008 2009 2010
All FSBO (For-sale-by-owner) 14% 14% 13% 12% 12% 13% 11% 9%
Seller knew buyer 5 5 5 5 5 6 5 5
Seller did not know buyer 9 10 8 7 7 7 6 5
Agent-assisted 83 82 85 84 85 84 85 88
Other 4 4 2 3 3 3 4 3
Exhibit 8-3 CHARACTERISTICS OF FSBO AND AGENT-ASSISTED SELLERS
FSBO AGENT-ASSISTED
All Sellers All FSBOSeller Knew
BuyerSeller did not Know Buyer
All Agent-assisted
Agent-assisted only
First FSBO, then Agent-assisted
Median age 49 47 46 49 49 49 50
Median income (2009) $90,000 $64,000 $64,800 $63,000 $93,200 $94,000 $78,400
Household composition
Married couple 75% 68% 64% 74% 76% 76% 78%
Single female 16 18 20 16 15 15 10
Single male 6 10 14 6 5 5 10
Unmarried couple 3 3 2 4 3 3 *
Other 1 1 1 * 1 1 1
* Less than 1 percent
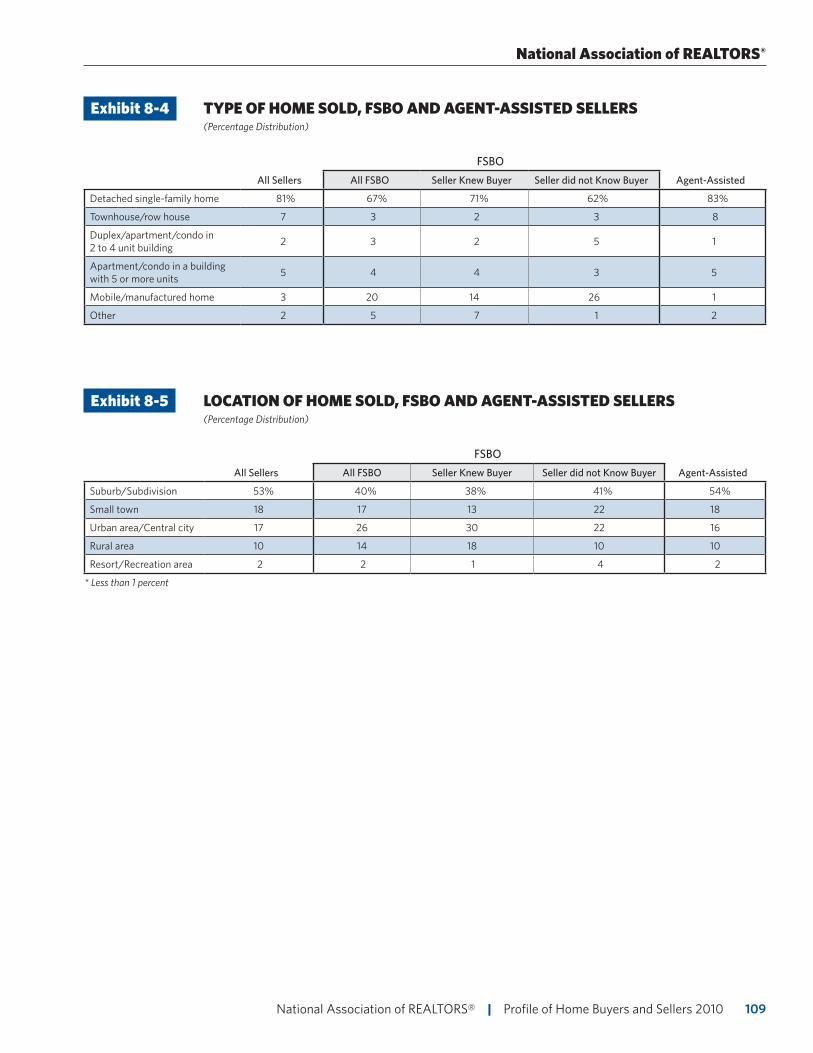
109 National Association of REALTORS® | Profile of Home Buyers and Sellers 2010
National Association of REALTORS®
Exhibit 8-4 TYPE OF HOME SOLD, FSBO AND AGENT-ASSISTED SELLERS (Percentage Distribution)
FSBO
All Sellers All FSBO Seller Knew Buyer Seller did not Know Buyer Agent-Assisted
Detached single-family home 81% 67% 71% 62% 83%
Townhouse/row house 7 3 2 3 8
Duplex/apartment/condo in 2 to 4 unit building 2 3 2 5 1
Apartment/condo in a building with 5 or more units 5 4 4 3 5
Mobile/manufactured home 3 20 14 26 1
Other 2 5 7 1 2
Exhibit 8-5 LOCATION OF HOME SOLD, FSBO AND AGENT-ASSISTED SELLERS (Percentage Distribution)
FSBO
All Sellers All FSBO Seller Knew Buyer Seller did not Know Buyer Agent-Assisted
Suburb/Subdivision 53% 40% 38% 41% 54%
Small town 18 17 13 22 18
Urban area/Central city 17 26 30 22 16
Rural area 10 14 18 10 10
Resort/Recreation area 2 2 1 4 2
* Less than 1 percent
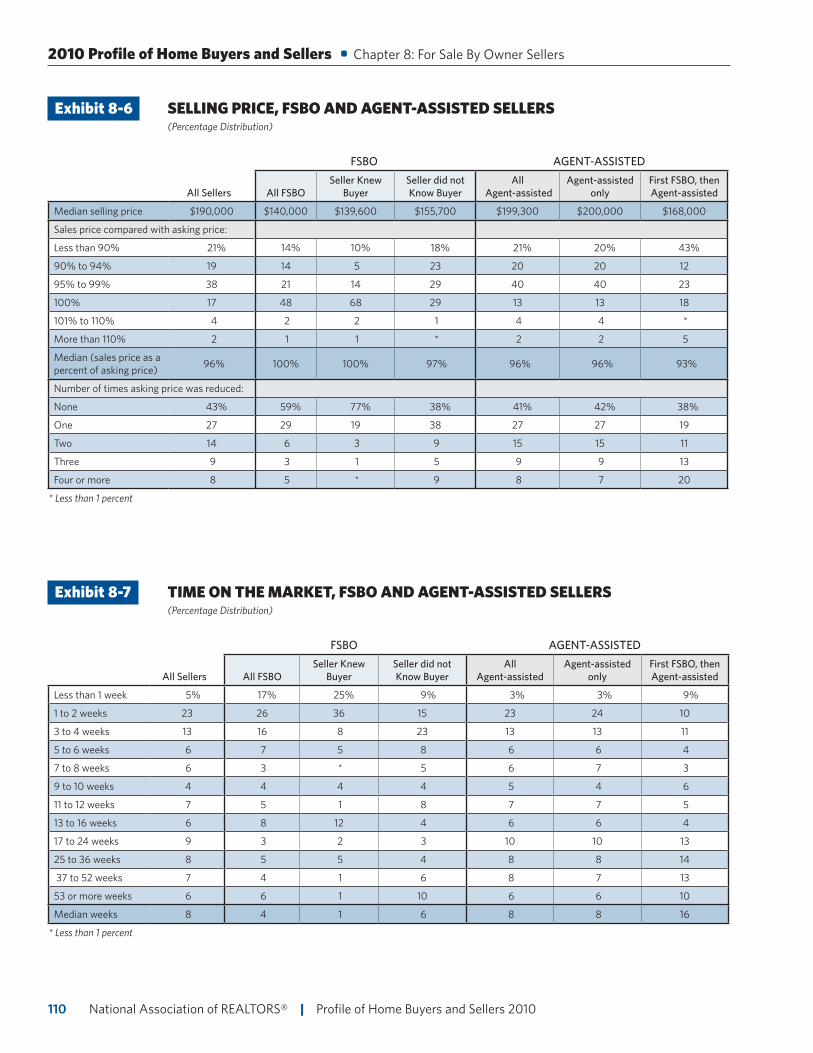
National Association of REALTORS® | Profile of Home Buyers and Sellers 2010110
2010 Profile of Home Buyers and Sellers • Chapter 8: For Sale By Owner Sellers
Exhibit 8-6 SELLING PRICE, FSBO AND AGENT-ASSISTED SELLERS (Percentage Distribution)
FSBO AGENT-ASSISTED
All Sellers All FSBOSeller Knew
BuyerSeller did not Know Buyer
All Agent-assisted
Agent-assisted only
First FSBO, then Agent-assisted
Median selling price $190,000 $140,000 $139,600 $155,700 $199,300 $200,000 $168,000
Sales price compared with asking price:
Less than 90% 21% 14% 10% 18% 21% 20% 43%
90% to 94% 19 14 5 23 20 20 12
95% to 99% 38 21 14 29 40 40 23
100% 17 48 68 29 13 13 18
101% to 110% 4 2 2 1 4 4 *
More than 110% 2 1 1 * 2 2 5
Median (sales price as a percent of asking price) 96% 100% 100% 97% 96% 96% 93%
Number of times asking price was reduced:
None 43% 59% 77% 38% 41% 42% 38%
One 27 29 19 38 27 27 19
Two 14 6 3 9 15 15 11
Three 9 3 1 5 9 9 13
Four or more 8 5 * 9 8 7 20
* Less than 1 percent
Exhibit 8-7 TIME ON THE MARKET, FSBO AND AGENT-ASSISTED SELLERS (Percentage Distribution)
FSBO AGENT-ASSISTED
All Sellers All FSBOSeller Knew
BuyerSeller did not Know Buyer
All Agent-assisted
Agent-assisted only
First FSBO, then Agent-assisted
Less than 1 week 5% 17% 25% 9% 3% 3% 9%
1 to 2 weeks 23 26 36 15 23 24 10
3 to 4 weeks 13 16 8 23 13 13 11
5 to 6 weeks 6 7 5 8 6 6 4
7 to 8 weeks 6 3 * 5 6 7 3
9 to 10 weeks 4 4 4 4 5 4 6
11 to 12 weeks 7 5 1 8 7 7 5
13 to 16 weeks 6 8 12 4 6 6 4
17 to 24 weeks 9 3 2 3 10 10 13
25 to 36 weeks 8 5 5 4 8 8 14
37 to 52 weeks 7 4 1 6 8 7 13
53 or more weeks 6 6 1 10 6 6 10
Median weeks 8 4 1 6 8 8 16
* Less than 1 percent
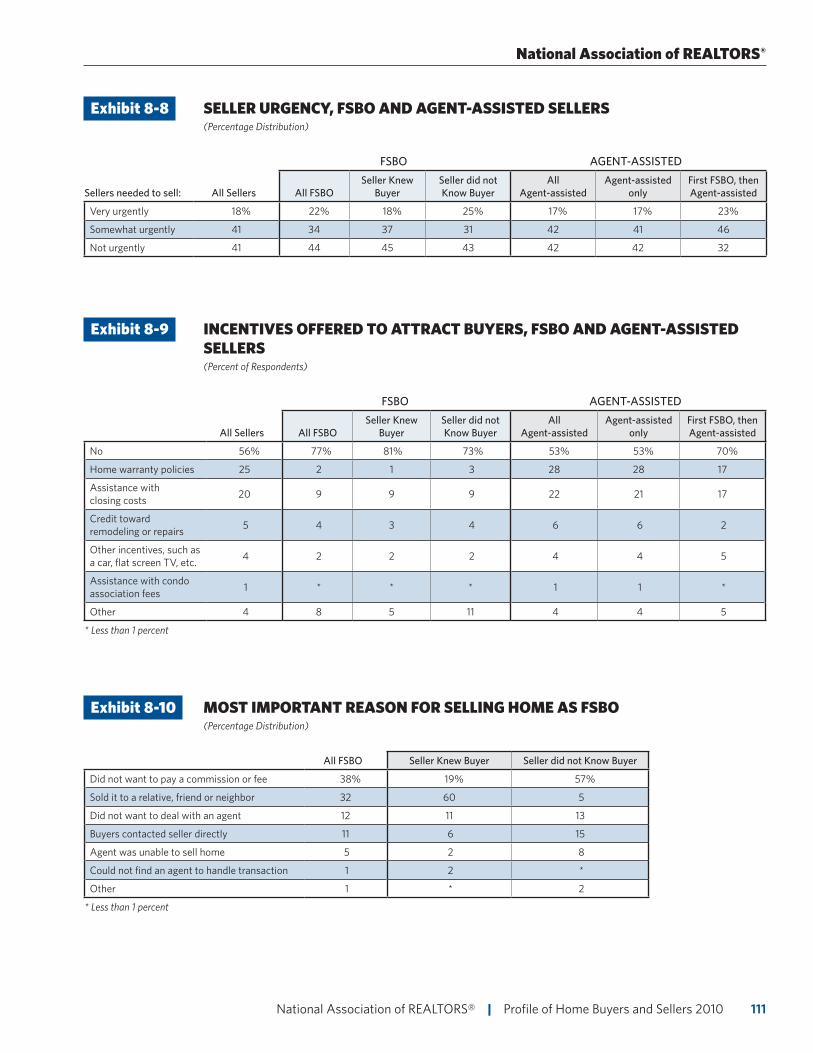
111 National Association of REALTORS® | Profile of Home Buyers and Sellers 2010
National Association of REALTORS®
Exhibit 8-8 SELLER URGENCY, FSBO AND AGENT-ASSISTED SELLERS (Percentage Distribution)
FSBO AGENT-ASSISTED
Sellers needed to sell: All Sellers All FSBOSeller Knew
BuyerSeller did not Know Buyer
All Agent-assisted
Agent-assisted only
First FSBO, then Agent-assisted
Very urgently 18% 22% 18% 25% 17% 17% 23%
Somewhat urgently 41 34 37 31 42 41 46
Not urgently 41 44 45 43 42 42 32
Exhibit 8-9 INCENTIVES OFFERED TO ATTRACT BUYERS, FSBO AND AGENT-ASSISTED SELLERS (Percent of Respondents)
FSBO AGENT-ASSISTED
All Sellers All FSBOSeller Knew
BuyerSeller did not Know Buyer
All Agent-assisted
Agent-assisted only
First FSBO, then Agent-assisted
No 56% 77% 81% 73% 53% 53% 70%
Home warranty policies 25 2 1 3 28 28 17
Assistance with closing costs 20 9 9 9 22 21 17
Credit toward remodeling or repairs 5 4 3 4 6 6 2
Other incentives, such as a car, flat screen TV, etc. 4 2 2 2 4 4 5
Assistance with condo association fees 1 * * * 1 1 *
Other 4 8 5 11 4 4 5
* Less than 1 percent
Exhibit 8-10 MOST IMPORTANT REASON FOR SELLING HOME AS FSBO (Percentage Distribution)
All FSBO Seller Knew Buyer Seller did not Know Buyer
Did not want to pay a commission or fee 38% 19% 57%
Sold it to a relative, friend or neighbor 32 60 5
Did not want to deal with an agent 12 11 13
Buyers contacted seller directly 11 6 15
Agent was unable to sell home 5 2 8
Could not find an agent to handle transaction 1 2 *
Other 1 * 2
* Less than 1 percent
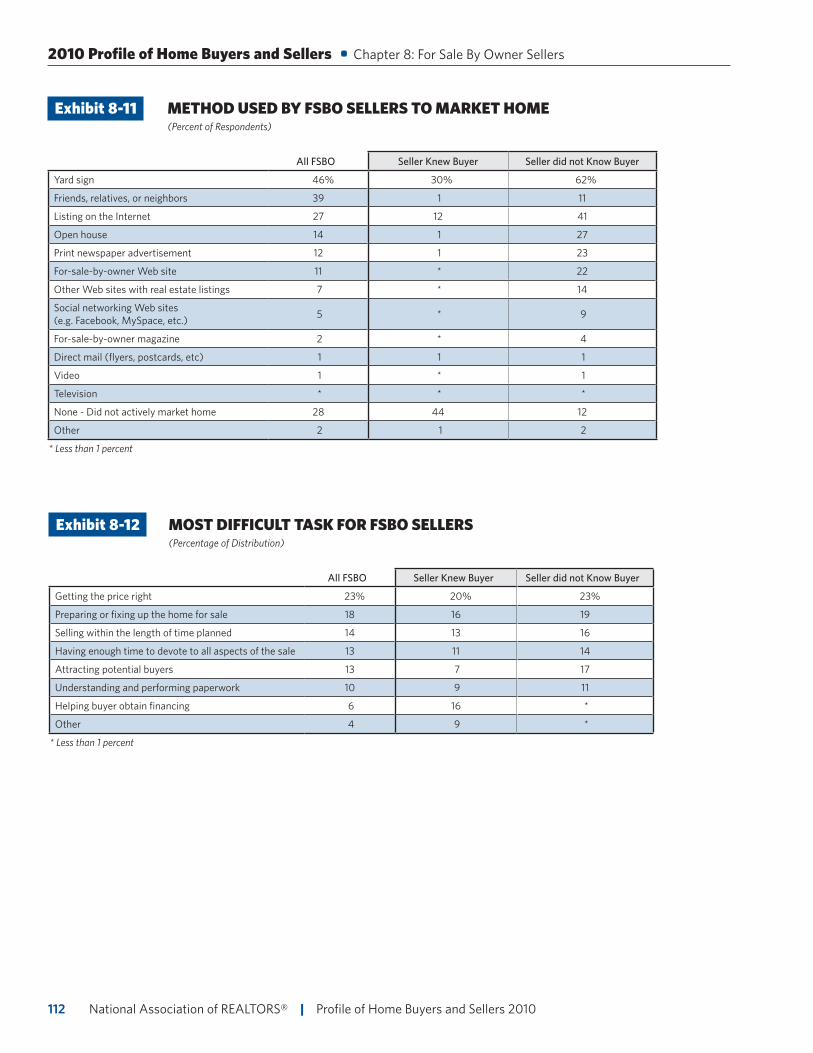
National Association of REALTORS® | Profile of Home Buyers and Sellers 2010112
2010 Profile of Home Buyers and Sellers • Chapter 8: For Sale By Owner Sellers
Exhibit 8-11 METHOD USED BY FSBO SELLERS TO MARKET HOME (Percent of Respondents)
All FSBO Seller Knew Buyer Seller did not Know Buyer
Yard sign 46% 30% 62%
Friends, relatives, or neighbors 39 1 11
Listing on the Internet 27 12 41
Open house 14 1 27
Print newspaper advertisement 12 1 23
For-sale-by-owner Web site 11 * 22
Other Web sites with real estate listings 7 * 14
Social networking Web sites (e.g. Facebook, MySpace, etc.) 5 * 9
For-sale-by-owner magazine 2 * 4
Direct mail (flyers, postcards, etc) 1 1 1
Video 1 * 1
Television * * *
None - Did not actively market home 28 44 12
Other 2 1 2
* Less than 1 percent
Exhibit 8-12 MOST DIFFICULT TASK FOR FSBO SELLERS (Percentage of Distribution)
All FSBO Seller Knew Buyer Seller did not Know Buyer
Getting the price right 23% 20% 23%
Preparing or fixing up the home for sale 18 16 19
Selling within the length of time planned 14 13 16
Having enough time to devote to all aspects of the sale 13 11 14
Attracting potential buyers 13 7 17
Understanding and performing paperwork 10 9 11
Helping buyer obtain financing 6 16 *
Other 4 9 *
* Less than 1 percent
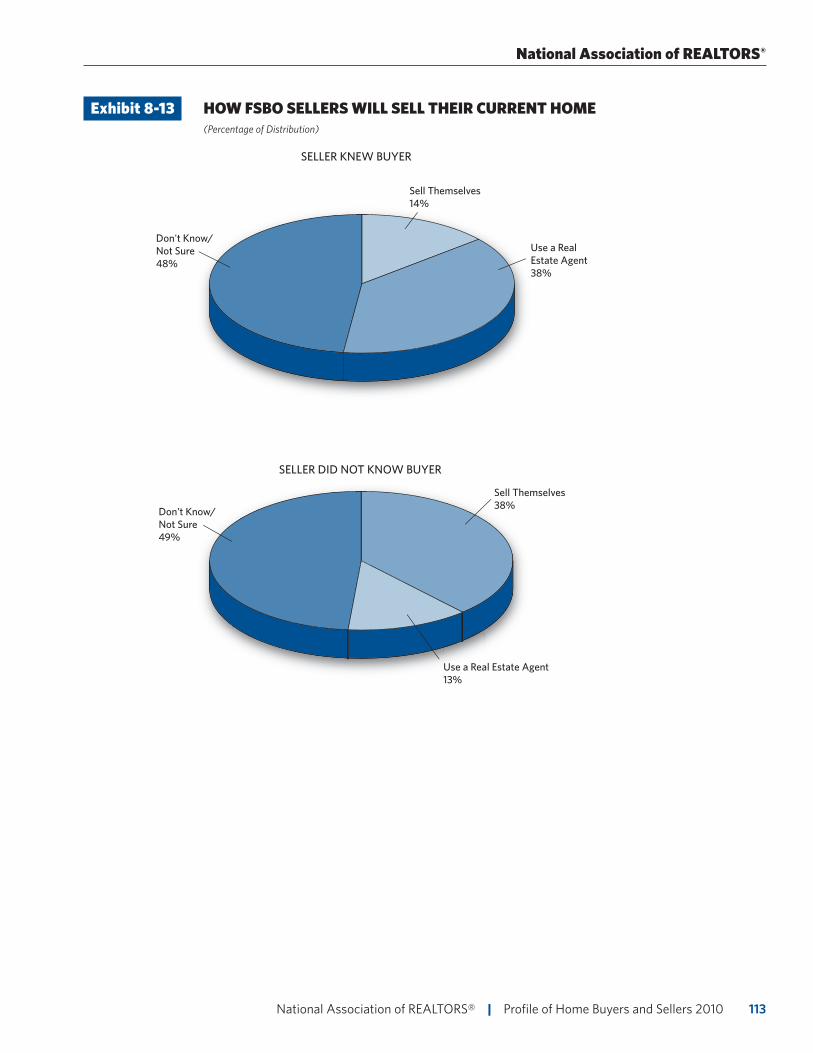
113 National Association of REALTORS® | Profile of Home Buyers and Sellers 2010
National Association of REALTORS®
Sell Themselves38%Sell Themselves38%
Sell Themselves14%
Don't Know/ Not Sure48%
Use a Real Estate Agent13%
Use a Real Estate Agent38%
Don't Know/ Not Sure49%
Exhibit 8-13 HOW FSBO SELLERS WILL SELL THEIR CURRENT HOME (Percentage of Distribution)
SELLER KNEW BUYER
SELLER DID NOT KNOW BUYER
Sell Themselves38%Sell Themselves38%
Sell Themselves14%
Don't Know/ Not Sure48%
Use a Real Estate Agent13%
Use a Real Estate Agent38%
Don't Know/ Not Sure49%
National Association of REALTORS® | Profile of Home Buyers and Sellers 2010114
Methodolgy
In July 2010, the NATIONAL ASSOCIATION OF REALTORS® mailed an eight – page questionnaire to 111,004 consumers who purchased a home between
July 2009 and June 2010. The survey yielded 8,449 usable responses with a response rate, after adjusting for undeliverable addresses, of 7.9 percent. Consumer names and addresses were obtained from Experian, a firm that maintains an extensive database of recent home buyers derived from county records. Information about sellers comes from those buyers who also sold a home. All information in this Profile is characteristic of the 12-month period ending June 2010, with the exception of income data, which are reported for 2009. In some sections comparisons are also given for results obtained in previous surveys. Not all results are directly comparable due to changes in questionnaire design and sample size. Some results are presented for the four U.S. Census regions: Northeast, Midwest, South and West. The median is the primary statistical measure used throughout this report. Due to rounding and omissions for space, percentage distributions may not add to 100 percent.
2010 Profile of Home Buyers and Sellers
115 National Association of REALTORS® | Profile of Home Buyers and Sellers 2010
National Association of REALTORS®
List of ExhibitsCHAPTER 1: CHARACTERISTICS OF HOME BUYERS
Exhibit 1-1 AGE OF HOME BUYERS, BY REGION
Exhibit 1-2 HOUSEHOLD INCOME OF HOME BUYERS, BY REGION, 2009
Exhibit 1-3 ADULT COMPOSITION OF HOME BUYER HOUSEHOLDS, 2001-2010
Exhibit 1-4 NUMBER OF CHILDREN UNDER THE AGE OF 18 RESIDING IN HOUSEHOLD
Exhibit 1-5 RACE/ETHNICITY OF HOME BUYERS, BY REGION
Exhibit 1-6 RACE/ETHNICITY OF HOME BUYERS, BY ADULT COMPOSITION OF HOUSEHOLD
Exhibit 1-7 PRIMARY LANGUAGE SPOKEN IN HOME BUYER HOUSEHOLD, BY REGION
Exhibit 1-8 NATIONAL ORIGIN OF HOME BUYERS, BY REGION
Exhibit 1-9 FIRST-TIME HOME BUYERS
Exhibit 1-10 FIRST-TIME HOME BUYERS, BY REGION
Exhibit 1-11 FIRST-TIME AND REPEAT HOME BUYERS BY HOUSEHOLD TYPE
Exhibit 1-12 FIRST-TIME AND REPEAT HOME BUYERS BY CHILDREN IN HOUSEHOLD
Exhibit 1-13 AGE OF FIRST-TIME AND REPEAT BUYERS
Exhibit 1-14 HOUSEHOLD INCOME OF FIRST-TIME AND REPEAT BUYERS, 2009
Exhibit 1-15 RACE/ETHNICITY OF FIRST-TIME AND REPEAT BUYERS
Exhibit 1-16 PRIMARY LANGUAGE SPOKEN IN FIRST-TIME AND REPEAT BUYER HOUSEHOLDS
Exhibit 1-17 NATIONAL ORIGIN OF FIRST-TIME AND REPEAT BUYERS
Exhibit 1-18 PRIOR LIVING ARRANGEMENT OF FIRST-TIME AND REPEAT BUYERS
Exhibit 1-18 PRIOR LIVING ARRANGEMENT, BY ADULT COMPOSITION OF HOUSEHOLD
Exhibit 1-20 PRIMARY REASON FOR PURCHASING A HOME, FIRST-TIME AND REPEAT BUYERS
Exhibit 1-21 PRIMARY REASON FOR PURCHASING A HOME, BY AGE
Exhibit 1-22 PRIMARY REASON FOR PURCHASING A HOME, BY ADULT COMPOSITION OF HOUSEHOLD
Exhibit 1-23 PRIMARY REASON FOR THE TIMING OF HOME PURCHASE, FIRST-TIME AND REPEAT BUYERS
Exhibit 1-24 PRIMARY REASON FOR THE TIMING OF HOME PURCHASE, BY AGE
Exhibit 1-25 NUMBER OF HOMES CURRENTLY OWNED, BY AGE
Exhibit 1-26 OTHER HOMES OWNED, BY AGE
CHAPTER 2: CHARACTERISTICS OF HOMES PURCHASED
Exhibit 2-1 NEW AND PREVIOUSLY OWNED HOMES PURCHASED, 2001-2010
Exhibit 2-2 NEW AND PREVIOUSLY OWNED HOMES PURCHASED, BY REGION
Exhibit 2-3 TYPE OF HOME PURCHASED, BY LOCATION
Exhibit 2-4 TYPE OF HOME PURCHASED BY FIRST-TIME AND REPEAT BUYERS, AND BUYERS OF NEW AND PREVIOUSLY OWNED HOMES
Exhibit 2-5 TYPE OF HOME PURCHASED, BY ADULT COMPOSITION OF HOUSEHOLD
Exhibit 2-6 LOCATION OF HOME PURCHASED, BY REGION
National Association of REALTORS® | Profile of Home Buyers and Sellers 2010116
Exhibit 2-7 LOCATION OF HOME PURCHASED BY FIRST-TIME AND REPEAT BUYERS, AND BUYERS OF NEW AND PREVIOUSLY OWNED HOMES
Exhibit 2-8 LOCATION OF HOME PURCHASED VERSUS LOCATION OF HOME SOLD
Exhibit 2-9 SENIOR RELATED HOUSING BY TYPE OF HOME PURCHASED AND LOCATION
Exhibit 2-10 DISTANCE BETWEEN HOME PURCHASED AND PREVIOUS RESIDENCE
Exhibit 2-11 FACTORS INFLUENCING NEIGHBORHOOD CHOICE, BY LOCATION
Exhibit 2-12 FACTORS INFLUENCING NEIGHBORHOOD CHOICE, BY ADULT COMPOSITION OF HOUSEHOLD AND CHILDREN IN HOUSHOLD
Exhibit 2-13 PRICE OF HOME PURCHASED, BY REGION
Exhibit 2-14 PRICE OF HOME PURCHASED, NEW AND PREVIOUSLY OWNED HOMES
Exhibit 2-15 PRICE OF HOME PURCHASED, FIRST-TIME AND REPEAT BUYERS
Exhibit 2-16 PURCHASE PRICE COMPARED WITH ASKING PRICE, BY REGION
Exhibit 2-17 SIZE OF HOME PURCHASED, FIRST-TIME AND REPEAT BUYERS, AND BUYERS OF NEW AND PREVIOUSLY OWNED HOMES
Exhibit 2-18 SIZE OF HOME PURCHASED, BY ADULT COMPOSITION OF HOUSEHOLD
Exhibit 2-19 HOME SIZE AND PRICE PER SQUARE FOOT, BY REGION
Exhibit 2-20 NUMBER OF BEDROOMS AND BATHROOMS, BY FIRST-TIME AND REPEAT BUYERS, AND BUYERS OF NEW AND PREVIOUSLY OWNED HOMES
Exhibit 2-21 NUMBER OF BEDROOMS AND BATHROOMS, BY ADULT HOUSEHOLD COMPOSITION AND CHILDREN IN HOUSEHOLD
Exhibit 2-22 YEAR HOME BUILT, BY REGION
Exhibit 2-23 IMPORTANCE OF COMMUTING COSTS
Exhibit 2-24 IMPORTANCE OF HOME'S ENVIRONMENTALLY FRIENDLY FEATURES
Exhibit 2-25 ENVIRONMENTALLY FRIENDLY FEATURES CONSIDERED "VERY IMPORTANT", BY REGION
Exhibit 2-26 CHARACTERISTICS OF HOME ON WHICH BUYER COMPROMISED, BY LOCATION
Exhibit 2-27 CHARACTERISTICS OF HOME ON WHICH BUYER COMPROMISED, FIRST-TIME AND REPEAT BUYERS, AND BUYERS OF NEW AND PREVIOUSLY OWNED HOMES
Exhibit 2-28 CHARACTERISTICS OF HOME ON WHICH BUYER COMPROMISED, BY ADULT COMPOSITION OF HOUSEHOLD
Exhibit 2-29 EXPECTED LENGTH OF TENURE IN HOME PURCHASED, FIRST-TIME AND REPEAT BUYERS, AND BUYERS OF NEW AND PREVIOUSLY OWNED HOMES
Exhibit 2-30 EXPECTED LENGTH OF TENURE IN HOME PURCHASED, BY AGE
Exhibit 2-31 PURCHASE PRICE, PRIMARY RESIDENCE AND SECOND HOME
Exhibit 2-32 TYPE OF HOME, PRIMARY RESIDENCE AND SECOND HOME
Exhibit 2-33 LOCATION OF HOME, PRIMARY RESIDENCE AND SECOND HOME
List of Exhibits
2010 Profile of Home Buyers and Sellers
117 National Association of REALTORS® | Profile of Home Buyers and Sellers 2010
National Association of REALTORS®
CHAPTER 3: THE HOME SEARCH PROCESS
Exhibit 3-1 FIRST STEP TAKEN DURING THE HOME BUYING PROCESS, FIRST-TIME AND REPEAT BUYERS
Exhibit 3-2 FIRST STEP TAKEN DURING THE HOME BUYING PROCESS, BY AGE
Exhibit 3-3 INFORMATION SOURCES USED IN HOME SEARCH, BY FIRST-TIME AND REPEAT BUYERS, AND BUYERS OF NEW AND PREVIOUSLY OWNED HOMES
Exhibit 3-4 INFORMATION SOURCES USED IN HOME SEARCH, BY AGE
Exhibit 3-5 FREQUENCY OF USE OF DIFFERENT INFORMATION SOURCES
Exhibit 3-6 USEFULNESS OF INFORMATION SOURCES
Exhibit 3-7 LENGTH OF SEARCH, BY REGION
Exhibit 3-8 LENGTH OF SEARCH FOR BUYERS WHO USED AN AGENT, FIRST-TIME AND REPEAT BUYERS
Exhibit 3-09 WHERE BUYER FOUND THE HOME THEY PURCHASED, 2001-2010
Exhibit 3-10 BUYER INTEREST IN PURCHASING A HOME IN FORECLOSURE, BY FIRST-TIME AND REPEAT BUYERS, AND BUYERS OF NEW AND PREVIOUSLY OWNED HOMES
Exhibit 3-11 BUYER PURCHASED A SHORT SALE, BY FIRST-TIME AND REPEAT BUYERS
Exhibit 3-12 MOST DIFFICULT STEPS OF HOME BUYING PROCESS BY FIRST-TIME AND REPEAT BUYERS AND BUYERS OF NEW AND PREVIOUSLY OWNED HOMES
Exhibit 3-13 USE OF INTERNET TO SEARCH FOR HOMES, 2003-2010
Exhibit 3-14 ACTIONS TAKEN AS A RESULT OF INTERNET HOME SEARCH, FIRST-TIME AND REPEAT BUYERS
Exhibit 3-15 CHARACTERISTICS OF HOME SEARCHERS AND SEARCH ACTIVITY, BY USE OF INTERNET
Exhibit 3-16 INFORMATION SOURCES USED IN HOME SEARCH, BY USE OF INTERNET
Exhibit 3-17 WHERE BUYERS FOUND THE HOME THEY PURCHASED, BY USE OF INTERNET
Exhibit 3-18 METHOD OF HOME PURCHASE, BY USE OF INTERNET
Exhibit 3-19 VALUE OF WEB SITE FEATURES
Exhibit 3-20 WEB SITES USED IN HOME SEARCH BY FIRST-TIME AND REPEAT BUYERS
Exhibit 3-21 WEB SITES USED IN HOME SEARCH, BY AGE
Exhibit 3-22 SATISFACTION IN BUYING PROCESS
CHAPTER 4: HOME BUYING AND REAL ESTATE PROFESSIONALS
Exhibit 4-1 METHOD OF HOME PURCHASE, 2001-2010
Exhibit 4-2 METHOD OF HOME PURCHASE, BY REGION
Exhibit 4-3 METHOD OF HOME PURCHASE, NEW AND PREVIOUSLY OWNED HOMES
Exhibit 4-4 METHOD OF HOME PURCHASE, BY ADULT COMPOSITION OF HOUSEHOLD
Exhibit 4-5 AGENT REPRESENTATION DISCLOSURE, FIRST-TIME AND REPEAT BUYERS
Exhibit 4-6 BUYER REPRESENTATIVE ARRANGEMENT WITH AGENT, FIRST-TIME AND REPEAT BUYERS
Exhibit 4-7 HOW REAL ESTATE AGENT WAS COMPENSATED
Exhibit 4-8 WHAT BUYERS WANT MOST FROM REAL ESTATE AGENTS
List of Exhibits
National Association of REALTORS® | Profile of Home Buyers and Sellers 2010118
2010 Profile of Home Buyers and Sellers
Exhibit 4-9 WHAT BUYERS WANT MOST FROM REAL ESTATE AGENTS, FIRST-TIME AND REPEAT BUYERS, AND BUYERS OF NEW AND PREVIOUSLY OWNED HOMES
Exhibit 4-10 WHAT BUYERS WANT MOST FROM REAL ESTATE AGENTS, BY ADULT COMPOSITION OF HOUSEHOLD
Exhibit 4-11 BENEFITS PROVIDED BY REAL ESTATE AGENT DURING HOME PURCHASE PROCESS, FIRST-TIME AND REPEAT BUYERS
Exhibit 4-12 HOW BUYER FOUND REAL ESTATE AGENT, FIRST-TIME AND REPEAT BUYERS
Exhibit 4-13 HOW BUYER FOUND REAL ESTATE AGENT, BY ADULT COMPOSITION OF HOUSEHOLD
Exhibit 4-14 NUMBER OF REAL ESTATE AGENTS INTERVIEWED BY FIRST-TIME AND REPEAT BUYERS
Exhibit 4-15 MOST IMPORTANT FACTORS WHEN CHOOSING AN AGENT
Exhibit 4-16 IMPORTANCE OF REAL ESTATE AGENT SKILLS AND QUALITIES
Exhibit 4-17 AGENT SKILLS AND QUALITIES CONSIDERED 'VERY IMPORTANT' BY FIRST-TIME AND REPEAT BUYERS, AND BUYERS OF NEW AND PREVIOUSLY OWNED HOMES
Exhibit 4-18 AGENT SKILLS AND QUALITIES CONSIDERED 'VERY IMPORTANT' BY ADULT COMPOSITION OF HOUSEHOLD
Exhibit 4-19 SATISFACTION WITH REAL ESTATE AGENT SKILLS AND QUALITIES
Exhibit 4-20 WOULD BUYER USE REAL ESTATE AGENT AGAIN OR RECOMMEND TO OTHERS
CHAPTER 5: FINANCING THE HOME PURCHASE
Exhibit 5-1 BUYERS WHO FINANCED THEIR HOME PURCHASE, BY AGE
Exhibit 5-2 BUYERS WHO FINANCED THEIR HOME PURCHASE, BY ADULT COMPOSITION OF HOUSEHOLD
Exhibit 5-3 PERCENT OF HOME FINANCED BY FIRST-TIME AND REPEAT BUYERS, AND BUYERS OF NEW AND PREVIOUSLY OWNED HOMES
Exhibit 5-4 SOURCES OF DOWNPAYMENT, FIRST-TIME AND REPEAT BUYERS
Exhibit 5-5 SOURCES OF DOWNPAYMENT, BY ADULT COMPOSITION OF HOUSEHOLD
Exhibit 5-6 SACRIFICES MADE TO PURCHASE HOME, BY FIRST-TIME AND REPEAT BUYERS
Exhibit 5-7 SACRIFICES MADE TO PURCHASE HOME, BY ADULT COMPOSITION OF HOUSEHOLD
Exhibit 5-8 DIFFICULTY OF MORTGAGE APPLICATION AND APPROVAL PROCESS, BY FIRST-TIME AND REPEAT BUYERS
Exhibit 5-9 DIFFICULTY OF MORTGAGE APPLICATION AND APPROVAL PROCESS, BY ADULT COMPOSITION OF HOUSEHOLD
Exhibit 5-10 REJECTION BY MORTGAGE LENDERS, BY FIRST-TIME AND REPEAT BUYERS
Exhibit 5-11 TYPE OF MORTGAGE, FIRST-TIME AND REPEAT BUYERS
Exhibit 5-12 TYPE OF LOAN, FIRST-TIME AND REPEAT BUYERS
Exhibit 5-13 USE OF HOME BUYER TAX CREDIT
Exhibit 5-14 BUYERS' VIEW OF HOMES AS A FINANCIAL INVESTMENT, FIRST-TIME AND REPEAT BUYERS, AND BUYERS OF NEW AND PREVIOUSLY OWNED HOMES
Exhibit 5-15 BUYERS' VIEW OF HOMES AS A FINANCIAL INVESTMENT, BY ADULT COMPOSITION OF HOUSEHOLD
List of Exhibits
119 National Association of REALTORS® | Profile of Home Buyers and Sellers 2010
National Association of REALTORS®
CHAPTER 6: HOME SELLERS AND THEIR SELLING EXPERIENCE
Exhibit 6-1 AGE OF HOME SELLERS, BY REGION
Exhibit 6-2 HOUSEHOLD INCOME OF HOME SELLERS, 2009
Exhibit 6-3 ADULT COMPOSITION OF HOME SELLER HOUSEHOLDS
Exhibit 6-4 NUMBER OF CHILDREN UNDER THE AGE OF 18 RESIDING IN HOME SELLER HOUSEHOLD
Exhibit 6-5 RACE/ETHNICITY OF HOME SELLERS, BY REGION
Exhibit 6-6 PRIMARY LANGUAGE SPOKEN IN HOME SELLER HOUSEHOLD, BY REGION
Exhibit 6-7 HOME SELLING SITUATION AMONG REPEAT BUYERS
Exhibit 6-8 FIRST-TIME OR REPEAT SELLER
Exhibit 6-9 HOMES SOLD AND FOR SALE, BY REGION
Exhibit 6-10 LOCATION OF HOME SOLD
Exhibit 6-11 PROXIMITY OF HOME SOLD TO HOME PURCHASED
Exhibit 6-12 TYPE OF HOME SOLD, BY LOCATION
Exhibit 6-13 SIZE OF HOME PURCHASED COMPARED TO HOME RECENTLY SOLD
Exhibit 6-14 SIZE OF HOME PURCHASED COMPARED TO HOME RECENTLY SOLD, BY AGE OF SELLER
Exhibit 6-16 AGE OF HOME PURCHASED COMPARED TO HOME RECENTLY SOLD
Exhibit 6-15 NUMBER OF BEDROOMS AND BATHROOMS BY ADULT COMPOSITION OF HOUSEHOLD AND CHILDREN IN HOUSEHOLD
Exhibit 6-17 PRICE OF HOME PURCHASED COMPARED TO HOME RECENTLY SOLD
Exhibit 6-18 PRICE OF HOME PURCHASED COMPARED TO HOME RECENTLY SOLD, BY AGE OF SELLER
Exhibit 6-19 PRIMARY REASON FOR SELLING PREVIOUS HOME, BY AGE
Exhibit 6-20 TENURE IN PREVIOUS HOME, BY TYPE OF HOME
Exhibit 6-21 TENURE IN PREVIOUS HOME, BY AGE OF SELLER
Exhibit 6-22 DISTANCE BETWEEN HOME PURCHASED AND HOME RECENTLY SOLD, BY REGION
Exhibit 6-23 DISTANCE BETWEEN HOME PURCHASED AND HOME RECENTLY SOLD, BY AGE
Exhibit 6-24 METHOD USED TO SELL HOME, BY REGION
Exhibit 6-25 METHOD USED TO SELL HOME, BY SELLER URGENCY
Exhibit 6-26 METHOD OF SALE, BY BUYER AND SELLER RELATIONSHIP
Exhibit 6-27 METHOD USED TO SELL HOME, 2001-2010
Exhibit 6-28 SALES PRICE COMPARED WITH LISTING PRICE, BY REGION
Exhibit 6-29 SALES PRICE COMPARED WITH LISTING PRICE, BY SELLER URGENCY
Exhibit 6-30 NUMBER OF WEEKS RECENTLY SOLD HOME WAS ON THE MARKET, BY REGION
Exhibit 6-31 SALES PRICE COMPARED WITH LISTING PRICE, BY NUMBER OF WEEKS HOME WAS ON THE MARKET
Exhibit 6-32 NUMBER OF TIMES ASKING PRICE WAS REDUCED, BY NUMBER OF WEEKS HOME WAS ON THE MARKET
Exhibit 6-33 INCENTIVES OFFERED TO ATTRACT BUYERS, BY REGION
List of Exhibits
National Association of REALTORS® | Profile of Home Buyers and Sellers 2010120
2010 Profile of Home Buyers and Sellers
Exhibit 6-34 INCENTIVES OFFERED TO ATTRACT BUYERS, BY NUMBER OF WEEKS HOME WAS ON THE MARKET
Exhibit 6-35 EQUITY EARNED IN HOME RECENTLY SOLD, BY TENURE IN HOME
Exhibit 6-36 SATISFACTION WITH THE SELLING PROCESS
CHAPTER 7: HOME SELLING AND REAL ESTATE PROFESSIONALS
Exhibit 7-1 METHOD USED TO FIND REAL ESTATE AGENT
Exhibit 7-2 NUMBER OF AGENTS CONTACTED BEFORE SELECTING ONE TO ASSIST WITH SALE OF HOME
Exhibit 7-3 DID SELLER USE THE SAME REAL ESTATE AGENT FOR THEIR HOME PURCHASE?
Exhibit 7-4 HOME LISTED ON MULTIPLE LISTING SERVICE
Exhibit 7-5 LEVEL OF SERVICE PROVIDED BY THE REAL ESTATE AGENT
Exhibit 7-6 WHAT SELLERS MOST WANT FROM REAL ESTATE AGENTS, BY LEVEL OF SERVICE PROVIDED BY THE AGENT
Exhibit 7-7 MOST IMPORTANT FACTOR IN CHOOSING A REAL ESTATE AGENT TO SELL HOME, BY LEVEL OF SERVICE PROVIDED BY THE AGENT
Exhibit 7-8 METHODS REAL ESTATE AGENT USED TO MARKET HOME, BY TYPE OF HOME SOLD
Exhibit 7-9 HOW REAL ESTATE AGENT WAS COMPENSATED
Exhibit 7-10 NEGOTIATING THE COMMISSION RATE OR FEE WITH THE REAL ESTATE AGENT
Exhibit 7-11 WOULD SELLER USE REAL ESTATE AGENT AGAIN OR RECOMMEND TO OTHERS
CHAPTER 8: FOR SALE BY OWNER SELLERS
Exhibit 8-1 FSBO AND AGENT-ASSISTED SALES, BY LOCATION
Exhibit 8-2 FSBO AND AGENT-ASSISTED SALES, 2003-2010
Exhibit 8-3 CHARACTERISTICS OF FSBO AND AGENT-ASSISTED SELLERS
Exhibit 8-4 TYPE OF HOME SOLD, FSBO AND AGENT-ASSISTED SELLERS
Exhibit 8-5 LOCATION OF HOME SOLD, FSBO AND AGENT-ASSISTED SELLERS
Exhibit 8-6 SELLING PRICE, FSBO AND AGENT-ASSISTED SELLERS
Exhibit 8-7 TIME ON THE MARKET, FSBO AND AGENT-ASSISTED SELLERS
Exhibit 8-8 SELLER URGENCY, FSBO AND AGENT-ASSISTED SELLERS
Exhibit 8-9 INCENTIVES OFFERED TO ATTRACT BUYERS, FSBO AND AGENT-ASSISTED SELLERS
Exhibit 8-10 MOST IMPORTANT REASON FOR SELLING HOME AS FSBO
Exhibit 8-11 METHOD USED BY FSBO SELLERS TO MARKET HOME
Exhibit 8-12 MOST DIFFICULT TASK FOR FSBO SELLERS
Exhibit 8-13 HOW FSBO SELLERS WILL SELL THEIR CURRENT HOME
List of Exhibits
The NATIONAL ASSOCIATION OF REALTORS®, “The Voice for Real Estate,” is America’s largest trade association, representing 1.1 million members, including NAR’s institutes, societies and councils, involved in all aspects of the real estate industry. NAR membership includes brokers, salespeople, property managers, appraisers, counselors and others engaged in both residential and commercial real estate.
The term REALTOR® is a registered collective membership mark that identifies a real estate professional who is a member of the NATIONAL ASSOCIATION OF REALTORS® and subscribes to its strict Code of Ethics.
Working for America's property owners, the National Association provides a facility for professional development, research and exchange of information among its members and to the public and government for the purpose of preserving the free enterprise system and the right to own real property.
NATIONAL ASSOCIATION OF REALTORS®RESEARCH DIVISION
The Mission of the NATIONAL ASSOCIATION OF REALTORS® Research Division is to collect and disseminate timely, accurate and comprehensive real estate data and to conduct economic analysis in order to inform and engage members, consumers, and policymakers and the media in a professional and accessible manner.
To find out about other products from NAR’s Research Division, visit www.REALTOR.org/research.
NATIONAL ASSOCIATION OF REALTORS®Research Division500 New Jersey Avenue, NWWashington, DC [email protected]

500 New Jersey Avenue, NW • Washington, DC 20001-2020 800.874.6500 • www.REALTOR.org