Embed Size (px)
Citation preview

Profile Report - State
Graduating Class 2017
Minnesota
ACT, INC. -- CONFIDENTIAL*070058110*

ACT PROFILE REPORT- State
Graduating Class 2017 Code 249999
Minnesota
Total Students in Report: 61,101
New to your 2017 Profile Report
Though ACT will continue to report English, mathematics, reading, and science subject scores, beginning in September 2016, subscores such as rhetorical skills and arts/literature will be omitted. Instead, a comprehensive set of reporting categories aligned with ACT College and Career Readiness Standards and other standards that target college and career readiness will be included. This change will make it easier for students, parents, and educators to gain deeper insight into students’ performance and better understand strengths and areas for improvement in each subject. In this report, reporting category outcomes indicate the percentage of students with reporting category scores falling within associated ACT Readiness Ranges. These ranges reflect where a student who as met an associated ACT College Readiness Benchmark would typically perform in each reporting category.

ACT PROFILE REPORT - State PAGE 1
Graduating Class 2017 Code 249999
Minnesota
Total Students in Report: 61,101
Table of Contents
Section I: Executive Summary Page 5 Section III: College Readiness & Impact of Course Rigor Page 17
Average Composite Scores: 5 Years of Testing Percent of Students Meeting 3 or 4 College Readiness
Percent Meeting 3 or 4 Benchmarks: 5 Years of Testing Benchmarks by Core College Curriculum Status
Percent Meeting STEM Benchmark: 5 Years of Testing Percent of Students in College and Career Readiness Standards (CCRS)
Percent Taking A Core Curriculum: 5 Years of Testing Score Ranges
Five Year Trends—Percent of Students Who Met Percent of Students Who Met ACT College Readiness Benchmark Scores
College Readiness Benchmarks by Gender
Five Year Trends—Average ACT Scores Percent of Students Who Met ACT College Readiness Benchmark Scores
Five Year Trends—Average ACT Scores by Level of Preparation by Race/Ethnicity
Five Year Trends—Percent and Average Composite Score Likely ACT National Career Readiness Certificate (NCRC) Level
by Race/Ethnicity Based Upon ACT Composite Score
Five Year Trends—Achievement in STEM College Readiness Benchmark Percent and Average ACT Scores
Proficiency Toward Understanding Complex Text by Overall High School Curriculum
Average ACT College Reportable Scores by Test Session Duration College Readiness Benchmark Percent and Average ACT Scores
Percent of Students Who Met College Readiness Benchmark Scores by Content-Specific Curriculum
by Test Session Duration College Readiness Benchmark Percent and Average ACT Scores
by Common Course Patterns
Section II: Academic Achievement Page 11 College Readiness Benchmark Percent and Average ACT Scores
Average ACT Composite Scores by Race and Core Curriculum Status for Gender by Common Course Patterns
ACT Score Distributions, Cumulative Percents, and Averages
Subject Area Reporting Categories Section IV: Career and Educational Aspirations Page 25
Average ACT Composite Scores for Race/Ethnicity Average ACT Composite Scores
by Level of Preparation by Race and Student Postsecondary Aspirations
Average ACT Scores by Race/Ethnicity Distribution of Planned Educational Majors for All Students
Average ACT Composite Scores for Gender by Level of Preparation by College Plans
Average ACT Scores by Gender Average ACT Composite Scores for Racial/Ethnic Groups
ACT Score Quartile Values by Post-Secondary Educational Aspirations
Students' Score Report Preferences at Time of Testing
Section V: Optional Writing Test Results Page 31
Average ACT Writing Scores by Race/Ethnicity
Average ACT Writing and English/Language Arts Scores
by Race/Ethnicity and Gender for students who took ACT Writing

ACT PROFILE REPORT - State PAGE 2
Graduating Class 2017 Code 249999
Minnesota
Total Students in Report: 61,101
This report focuses on:
Performance - student test performance in the context of college readiness
Access - number of your graduates exposed to college entrance testing and the percent of race/ethnicity participation
Course Selection - percent of students pursuing a core curriculum
Course Rigor - impact of rigorous coursework on achievement
College Readiness - percent of students meeting ACT College Readiness Benchmark Scores in each content area
Awareness - extent to which student aspirations match performance
Articulation - colleges and universities to which your students send test results
We are pleased to provide this 2017 Graduating Class ACT Profile Report. This report summarizes the preparation and
performance of your 2017 graduates who took the ACT as sophomores, juniors, or seniors under standard- or extended-
time conditions and achieved a college reportable composite score. The most recent set of test information is used in your
report for students testing more than once.
Each year, test data for a school, district, and the state represents a different cohort of students. ACT encourages
educators to focus on trends (3, 5, 10 years), not year-to-year changes. Such changes can represent normal – even
expected – fluctuations. On the other hand, trend lines offer more insight into what is happening in a school, district, or
the state.
Furthermore, ACT encourages educators to measure student performance in the context of college readiness measures.
The focus should be on the number and percentage of students who met or exceeded ACT’s College Readiness
Benchmark Scores, a measure that is much more meaningful and understandable than an average composite score for a
group of students.

ACT PROFILE REPORT - State PAGE 3
Graduating Class 2017 Code 249999
Minnesota
Total Students in Report: 61,101
The ACT is a curriculum-based measure of college readiness. ACT components include:
Tests of academic achievement in English, math, reading, science, STEM, and writing (optional)
High school grade and course information
Student Profile Section
Career Interest Inventory
The ACT:
College Course/Course Area ACT Score Benchmark Score
English Composition English 18
Algebra Mathematics 22
Social Sciences Reading 22
Biology Science 23
STEM STEM 26
For more information, go to www.act.org
Every few years, ACT conducts the ACT National Curriculum Survey to ensure its curriculum-based assessment tools accurately
measure the skills high school teachers teach and instructors of entry-level college courses expect. The ACT is the only college
readiness test designed to reflect the results of such a survey.
ACT’s College and Career Readiness Standards are sets of statements intended to help students, parents and educators
understand the meaning of test scores. The standards relate test scores to the types of skills needed for success in high school and
beyond. They serve as a direct link between what students have learned and what they are ready to do next. The ACT is the only
college readiness test for which scores can be tied directly to standards. College and Career Readiness Standards to the Classroom
interpretive guides can be found at www.act.org/content/act/en/education-and-career-planning/college-and-career-readiness-
standards.html.
Only the ACT reports College Readiness Benchmark Scores – A benchmark score is the minimum score needed on an ACT
subject-area test to indicate a 50% chance of obtaining a B or higher or about a 75% chance of obtaining a C or higher in the
corresponding credit-bearing college courses, which include English Composition, Algebra, Social Science, Biology and STEM.
These scores were empirically derived based on the actual performance of students in college.

ACT PROFILE REPORT - State PAGE 4
Graduating Class 2017 Code 249999
Minnesota
Total Students in Report: 61,101
How to Improve Scores and Increase College Readiness
#1430
For more information on interpreting data in this report, or to learn how ACT can help your students improve their readiness for college and the
workplace, contact ACT Customer Service at 319-337-1365 or [email protected].
PLAN GUIDANCE ACTIVITIES BASED ON STUDENTS' CAREER AND COLLEGE ASPIRATIONS: Data in Tables 4.1 and 4.2 enable the reader to
determine if aspirations are consistent with academic performance and whether, among students with similar aspirations, academic performance is
consistent across racial/ethnic groups.
EVALUATING RIGOR OF COURSES: Table 3.1 reports the percentage of students falling in each of the ACT College and Career Readiness
Standards score ranges. For example, approximately 43% of the cohort fall into the lowest three Mathematics score ranges. To increase these
students' achievement, identify the standards they should focus on next by accessing ACT's College and Career Readiness Standards at at
www.act.org/content/act/en/education-and-career-planning/college-and-career-readiness-standards.html.
31% of your students met all four ACT College Readiness Benchmark Scores (Table 1.1). To improve students' scores and increase the percentage
of students identified as college ready, ACT suggests:
PROVIDING ACCESS FOR ALL STUDENTS TO TAKE THE ACT: 61,101 of your students are included in this report (the 'cohort'). Increasing
access insures that more students have the opportunity to consider college and allows the reader to use this report to evaluate how well courses and
instructional programs are preparing students for college and work.
MAKING CORE CURRICULUM A PRIORITY: Emphasize the need for all students to develop college and work ready skills, regardless of
postsecondary aspirations. 70% of the students in the cohort reported taking courses that would be considered 'Core or More' (Table 1.4).
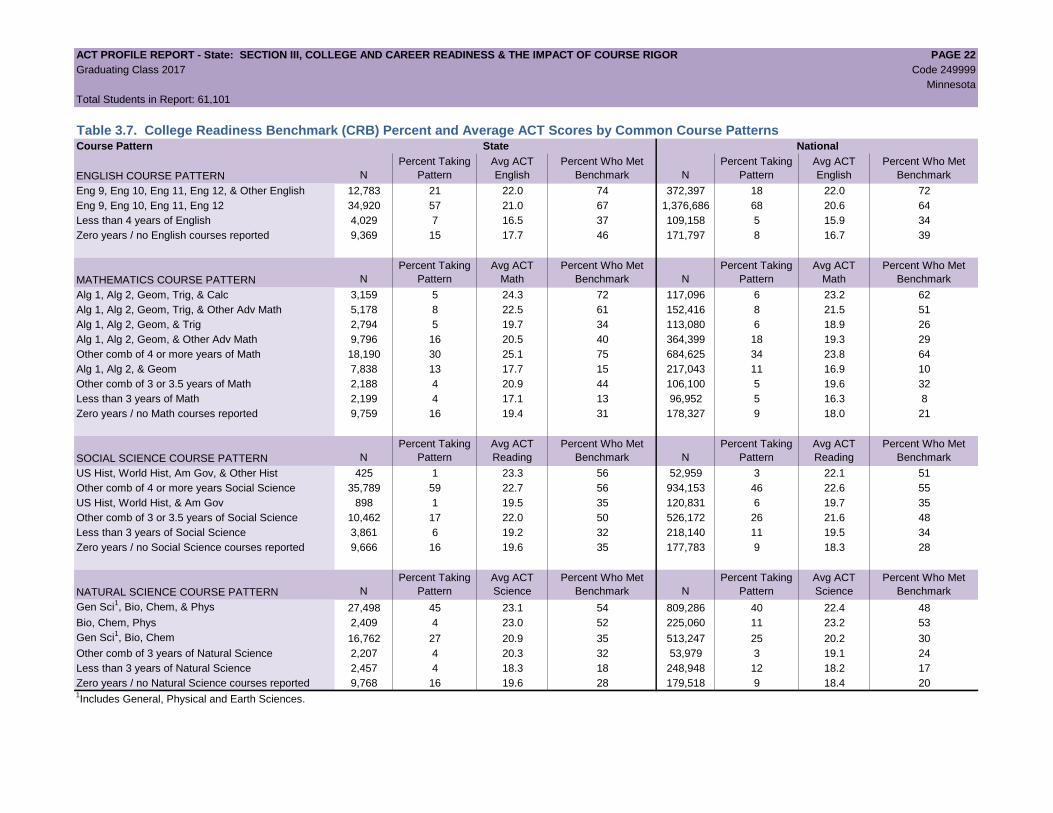
MAKING SURE STUDENTS ARE TAKING THE RIGHT KINDS OF COURSES: Table 3.8 reports 4% of the cohort took less than three years of
math courses. Of these students, 13% were college ready. 13% of the cohort reported taking a course sequence of Algebra I, Algebra II, and
Geometry. 15% of these students were college ready. In comparison, 60% of the students who took 3 or more years of math beyond Algebra I,
Algebra II, and Geometry were college ready. Getting more students ready for Algebra prior to 9th grade will increase the chances that students will
be prepared for and take advanced-level math courses.
Similarly, Table 3.8 reports 4% of the cohort took less than three years of natural science courses. 18% of these students were college ready. In
comparison, 46% of students who took at least three years of science coursework were college ready.

ACT PROFILE REPORT - State: SECTION I, EXECUTIVE SUMMARY PAGE 5
Graduating Class 2017 Code 249999
Minnesota
Total Students in Report: 61,101
Section I
Executive Summary
To find the results of only standard time or extended time test takers, refer to Tables 1.8 and 1.9 on page 10.
Beginning in August of 2013, all students whose scores are college reportable, both standard and extended time tests, are now included.
Also beginning in August 2013 Graduating Class data, College Readiness Benchmarks for Reading and Science were updated to reflect the most recent
college coursework research.

ACT PROFILE REPORT - State: SECTION I, EXECUTIVE SUMMARY PAGE 6
Graduating Class 2017 Code 249999
Minnesota
Total Students in Report: 61,101
Figure 1.1. Average Composite Scores: 5 Years of Testing* Figure 1.2. Percent Meeting 3 or 4 Benchmarks: 5 Years of Testing*
Figure 1.3. Percent Meeting STEM Benchmark: 5 Years of Testing* Figure 1.4. Percent Taking A Core Curriculum: 5 Years of Testing*
* Missing columns in above graphs reflect years in which no students were tested.
23.0 22.9 22.7 21.1 21.5 20.9 21.0 21.0 20.8 21.0
1
6
11
16
21
26
31
36
2012-2013 2013-2014 2014-2015 2015-2016 2016-2017
Avera
ge A
CT
Score
State National
56 55 54
42 44 39 39 40 38 39
0
10
20
30
40
50
60
70
80
90
100
2012-2013 2013-2014 2014-2015 2015-2016 2016-2017
Perc
ent
State National
30 31 30
23 24 19 20 20 20 21
0
10
20
30
40
50
60
70
80
90
100
2012-2013 2013-2014 2014-2015 2015-2016 2016-2017
Perc
ent
State National
87
12
86
12
87
8
74
16
70
13
74
22
73
22
72
22
69
23
68
23
0
10
20
30
40
50
60
70
80
90
100
Core LessThanCore
Core LessThanCore
Core LessThanCore
Core LessThanCore
Core LessThanCore
Perc
ent
State National
2012-2013 2013-2014 2014-2015 2015-2016 2016-2017

ACT PROFILE REPORT - State: SECTION I, EXECUTIVE SUMMARY PAGE 7
Graduating Class 2017 Code 249999
Minnesota
Total Students in Report: 61,101
Table 1.1. Five Year Trends—Percent of Students Who Met College Readiness Benchmarks
Percent Who Met Benchmarks
English Mathematics Reading Science Met All Four
Year State National State National State National State National State National State National
2013 44,676 1,799,243 78 64 62 44 57 44 52 36 39 26
2014 45,305 1,845,787 77 64 61 43 56 44 53 37 39 26
2015 46,862 1,924,436 74 64 58 42 57 46 53 38 39 28
2016 64,145 2,090,342 61 61 46 41 45 44 40 36 29 26
2017 61,101 2,030,038 63 61 48 41 50 47 42 37 31 27
Table 1.2. Five Year Trends—Average ACT Scores
Average ACT Scores
English Mathematics Reading Science Composite
Year State National State National State National State National State National State National
2013 44,676 1,799,243 22.2 20.2 23.1 20.9 23.1 21.1 22.9 20.7 23.0 20.9
2014 45,305 1,845,787 22.1 20.3 23.0 20.9 23.1 21.3 22.9 20.8 22.9 21.0
2015 46,862 1,924,436 21.8 20.4 22.8 20.8 23.0 21.4 22.7 20.9 22.7 21.0
2016 64,145 2,090,342 20.0 20.1 21.2 20.6 21.3 21.3 21.3 20.8 21.1 20.8
2017 61,101 2,030,038 20.4 20.3 21.5 20.7 21.8 21.4 21.6 21.0 21.5 21.0
Table 1.3. Five Year Trends—Average ACT Scores Nationwide
Average ACT Scores
Year English Mathematics Reading Science Composite
2013 1,799,243 20.2 20.9 21.1 20.7 20.9
2014 1,845,787 20.3 20.9 21.3 20.8 21.0
2015 1,924,436 20.4 20.8 21.4 20.9 21.0
2016 2,090,342 20.1 20.6 21.3 20.8 20.8
2017 2,030,038 20.3 20.7 21.4 21.0 21.0
Number of Students
Tested
Number of Students
Tested
Number of Students
Tested

ACT PROFILE REPORT - State: SECTION I, EXECUTIVE SUMMARY PAGE 8
Graduating Class 2017 Code 249999
Minnesota
Total Students in Report: 61,101
Table 1.4. Five Year Trends—Average ACT Scores by Level of Preparation
Average ACT Scores
Number of
Students Tested Percent2
English Mathematics Reading Science Composite
Year
Core or
More1
Less than
Core
Core
or
More
Less
than
Core
Core or
More
Less than
Core
Core or
More
Less than
Core
Core or
More
Less than
Core
Core or
More
Less than
Core
Core or
More
Less than
Core
2013 38,746 5,367 87 12 22.6 19.6 23.4 20.7 23.5 21.0 23.2 20.8 23.3 20.6
2014 38,813 5,430 86 12 22.6 19.6 23.4 20.5 23.5 21.0 23.3 20.6 23.3 20.6
2015 40,868 3,757 87 8 22.3 19.7 23.2 20.8 23.5 21.1 23.1 20.9 23.2 20.8
2016 47,165 10,164 74 16 21.3 16.7 22.2 18.6 22.4 18.6 22.3 18.6 22.2 18.2
2017 42,765 8,110 70 13 21.6 17.5 22.5 19.1 22.9 19.3 22.6 19.3 22.5 18.91"Core or More" results correspond to students taking four or more years of English AND three or more years each of math, social studies, and natural science.
2Percent of all students tested. Numbers will not add up to 100% due to student non-response.
Table 1.5. Five Year Trends—Percent and Average Composite Score by Race/Ethnicity
2013 2014 2015 2016 2017
Race/Ethnicity N % Avg N % Avg N % Avg N % Avg N % Avg
All Students 44,676 100 23.0 45,305 100 22.9 46,862 100 22.7 64,145 100 21.1 61,101 100 21.5
Black/African American 2,140 5 18.0 2,412 5 17.9 2,744 6 17.6 3,812 6 16.5 3,863 6 17.0
American Indian/Alaska Native 210 0 19.7 208 0 19.9 220 0 19.3 520 1 16.6 453 1 17.0
White 34,279 77 23.6 33,895 75 23.7 33,796 72 23.7 42,495 66 22.2 39,798 65 22.6
Hispanic/Latino 1,913 4 20.2 2,204 5 19.8 2,562 5 19.8 4,271 7 17.9 4,301 7 18.4
Asian 2,535 6 20.7 2,790 6 20.7 2,913 6 20.7 3,354 5 20.2 3,412 6 20.6
Native Hawaiian/Other Pacific Islander 35 0 20.4 34 0 20.0 34 0 20.1 82 0 18.4 67 0 18.9
Two or more races 1,557 3 22.3 1,675 4 22.3 1,683 4 22.2 2,710 4 20.4 2,533 4 20.8
Prefer not to respond/No response 2,007 4 23.5 2,087 5 23.0 2,910 6 21.3 6,901 11 19.8 6,674 11 20.3

ACT PROFILE REPORT - State: SECTION I, EXECUTIVE SUMMARY PAGE 9
Graduating Class 2017 Code 249999
Minnesota
Total Students in Report: 61,101
Table 1.6. Five Year Trends—Achievement in STEM1
All Tested Students Students Meeting STEM Benchmarks
Number of
Students Tested Avg. STEM Score Percent Meeting STEM Benchmark Avg. Mathematics Score Avg. Science Score
Year State National State National State National State National State National
2013 44,676 1,799,243 23.2 21.1 30 19 28.6 28.7 28.1 28.0
2014 45,305 1,845,787 23.2 21.1 31 20 28.7 28.7 28.3 28.3
2015 46,862 1,924,436 23.0 21.1 30 20 28.7 28.7 28.3 28.4
2016 64,145 2,090,342 21.5 20.9 23 20 28.6 28.7 28.4 28.6
2017 61,101 2,030,038 21.8 21.1 24 21 28.7 28.7 28.5 28.71The STEM score describes students' overall proficiency in mathematics and science.
Table 1.7. Proficiency In Understanding Complex Texts1
Text Complexity Proficiency Level
Below Proficient Proficient Above Proficient
N Percent Avg. Reading N Percent Avg. Reading N Percent Avg. Reading
Year State National State National State National State National State National State National State National State National State National
2013 0 0 . . . . 0 0 . . . . 0 0 . . . .
2014 0 0 . . . . 0 0 . . . . 0 0 . . . .
2015 0 0 . . . . 0 0 . . . . 0 0 . . . .
2016 8,556 485,762 13 23 17.6 17.0 7,036 322,548 11 15 23.8 23.6 5,017 235,380 8 11 30.2 30.3
2017 29,063 999,708 48 49 16.5 16.2 18,620 596,096 30 29 23.6 23.4 13,272 427,075 22 21 30.8 30.81The text complexity indicator, beginning in Fall 2015, represents students' progress toward understanding complex written material often encountered in college and careers.

ACT PROFILE REPORT - State: SECTION I, EXECUTIVE SUMMARY PAGE 10
Graduating Class 2017 Code 249999
Minnesota
Total Students in Report: 61,101
Table 1.8. Average ACT College Reportable Scores by Test Session Duration
Average ACT Scores
N Percent English Mathematics Reading Science Composite
Standard Time 57,377 94 20.6 21.7 21.9 21.8 21.6
Extended Time 3,724 6 17.8 19.1 19.9 19.6 19.2
Total 61,101 100 20.4 21.5 21.8 21.6 21.5
Standard Time 1,927,386 95 20.5 20.8 21.5 21.1 21.1
Extended Time 102,652 5 17.5 18.5 19.5 18.9 18.7
Total 2,030,038 100 20.3 20.7 21.4 21.0 21.0
Table 1.9. Percent of Students Who Met College Readiness Benchmark Scores by Test Session Duration
Percent of Students Met
English Mathematics Reading Science All Four
Standard Time 64 49 50 43 32
Extended Time 45 29 39 29 21
Total 63 48 50 42 31
Standard Time 63 41 48 38 28
Extended Time 42 25 36 26 19
Total 61 41 47 37 27
State
National
Student GroupTest Session
Duration
State
National
Student GroupTest Session
Duration

ACT PROFILE REPORT- State: SECTION II, ACADEMIC ACHIEVEMENT PAGE 11
Graduating Class 2017 Code 249999
Minnesota
Total Students in Report: 61,101
Section II
Academic Achievement
Beginning with the Graduating Class of 2013, all students whose scores are college reportable, both standard and extended time tests, are now included.
Also beginning with the 2013 Graduating Class data, College Readiness Benchmarks for Reading and Science were updated to reflect the most recent
college coursework research.
ACT PROFILE REPORT - State: SECTION II, ACADEMIC ACHIEVEMENT PAGE 12
Graduating Class 2017 Code 249999
Minnesota
Total Students in Report: 61,101
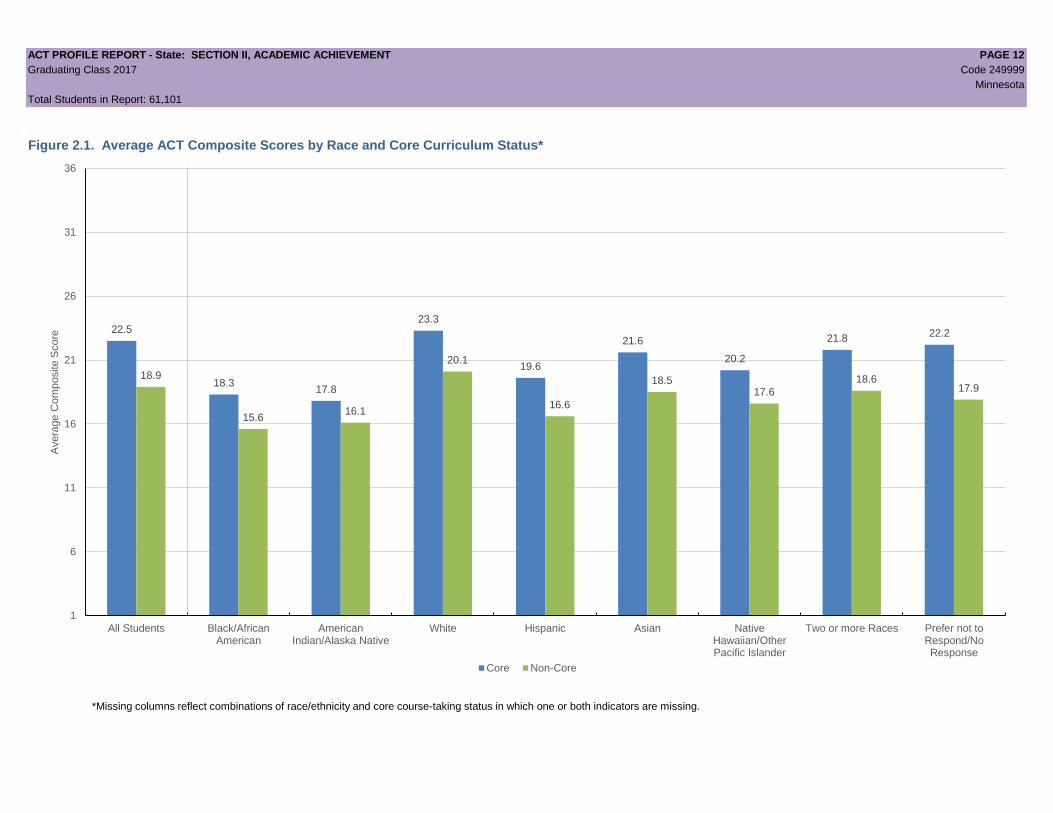
Figure 2.1. Average ACT Composite Scores by Race and Core Curriculum Status*
22.5
18.3 17.8
23.3
19.6
21.6
20.2
21.8 22.2
18.9
15.6 16.1
20.1
16.6
18.5 17.6
18.6 17.9
1
6
11
16
21
26
31
36
All Students Black/AfricanAmerican
AmericanIndian/Alaska Native
White Hispanic Asian NativeHawaiian/OtherPacific Islander
Two or more Races Prefer not toRespond/NoResponse
Avera
ge C
om
posite S
core
Core Non-Core
*Missing columns reflect combinations of race/ethnicity and core course-taking status in which one or both indicators are missing.

ACT PROFILE REPORT- State: SECTION II, ACADEMIC ACHIEVEMENT PAGE 13
Graduating Class 2017 Code 249999
Minnesota
Total Students in Report: 61,101
Table 2.1. ACT Score Distributions, Cumulative Percents (CP1), and Score Averages
English Mathematics Reading Science Composite STEM
N CP N CP N CP N CP N CP N CP
36 425 100 152 100 618 100 433 100 79 100 196 100 36
35 1,357 99 549 99 1,037 99 478 99 331 99 369 99 35
34 869 97 434 99 1,203 97 699 99 616 99 557 99 34
33 944 96 849 98 1,308 95 961 97 817 98 686 98 33
32 660 94 753 97 1,975 93 554 96 991 97 827 97 32
31 887 93 784 96 1,843 90 1,066 95 1,254 95 1,106 96 31
30 1,545 92 1,296 94 1,663 87 835 93 1,528 93 1,303 94 30
29 1,054 89 1,561 92 1,766 84 1,235 92 1,726 91 1,551 92 29
28 1,418 87 2,745 90 1,923 81 1,532 90 2,048 88 2,046 89 28
27 1,821 85 3,132 85 1,508 78 2,188 87 2,352 85 2,619 86 27
26 1,731 82 3,613 80 2,051 76 2,615 84 2,741 81 3,320 82 26
25 2,830 79 3,843 74 2,075 72 3,278 79 3,197 76 3,934 76 25
24 3,142 75 4,130 68 3,634 69 5,016 74 3,556 71 4,278 70 24
23 3,534 69 3,138 61 3,191 63 4,945 66 3,847 65 4,008 63 23
22 3,488 64 2,471 56 4,532 58 5,704 58 3,995 59 3,858 56 22
21 3,752 58 2,677 52 2,923 50 3,591 48 3,991 52 3,904 50 21
20 3,587 52 2,456 47 4,123 46 5,101 43 4,025 46 4,079 43 20
19 2,740 46 3,246 43 2,969 39 3,361 34 3,866 39 4,225 37 19
18 2,746 41 4,573 38 4,264 34 3,350 29 3,831 33 4,238 30 18
17 2,723 37 4,949 31 2,610 27 4,041 23 3,617 27 3,974 23 17
16 3,015 32 5,765 23 2,415 23 2,269 17 3,317 21 3,422 16 16
15 4,710 28 4,072 13 2,587 19 2,156 13 2,979 15 2,876 11 15
14 2,793 20 2,446 6 2,115 15 1,671 9 2,665 10 2,064 6 14
13 2,141 15 876 2 2,871 11 1,916 7 2,038 6 1,030 3 13
12 2,042 12 379 1 1,412 6 955 3 1,140 3 427 1 12
11 1,919 8 112 1 1,433 4 505 2 378 1 118 1 11
10 1,725 5 52 1 532 2 328 1 109 1 44 1 10
9 686 2 26 1 276 1 179 1 38 1 21 1 9
8 415 1 1 1 139 1 85 1 13 1 11 1 8
7 258 1 9 1 19 1 5 1 11 1 6 1 7
6 86 1 4 1 30 1 31 1 2 1 0 1 6
5 31 1 2 1 24 1 9 1 0 1 1 1 5
4 17 1 4 1 18 1 0 1 3 1 3 1 4
3 4 1 1 1 6 1 4 1 0 1 0 1 3
2 4 1 0 1 4 1 3 1 0 1 0 1 2
1 2 1 1 1 4 1 2 1 0 1 0 1 1
Avg (SD) 20.4 (6.6) 21.5 (5.4) 21.8 (6.5) 21.6 (5.4) 21.5 (5.5) 21.8 (5.1) Avg (SD)1CP is the cumulative percent of students at or below a score point.
Note: Shaded portions of columns identify the students who met/exceeded the ACT College Readiness Benchmark Scores.
ACT Scale
Score
ACT Scale
Score

ACT PROFILE REPORT - State: SECTION II, ACADEMIC ACHIEVEMENT PAGE 14
Graduating Class 2017 Code 249999
Minnesota
Total Students in Report: 61,101
Figure 2.2. English Reporting Categories1
Figure 2.3. Math Reporting Categories1
Figure 2.4. Reading Reporting Categories1
Figure 2.5. Science Reporting Categories1
71
77
73
65
68
67
0 10 20 30 40 50 60 70 80 90 100
Production of Writing
Knowledge of Language
Conventions of Standard English
Percent in ACT Readiness Range State National
55
47
55
50
55
64
56
53
42
41
45
41
43
53
43
41
0 10 20 30 40 50 60 70 80 90 100
Preparing for Higher Math (PHM)
PHM-Number and Quantity
PHM-Algebra
PHM-Functions
PHM-Geometry
PHM-Statistics and Probability
Integrating Essential Skills
Modeling
Percent in ACT Readiness Range State National
The charts on this page show the percent of students whose reporting category scores fall within associated ACT Readiness Ranges. ACT Readiness Ranges reflect where a student who has met a particular subject area's ACT College Readiness Benchmark would typically perform within the associated reporting category. 1Reporting Categories are reported only for testing events beginning September 2016.
55
58
51
50
52
47
0 10 20 30 40 50 60 70 80 90 100
Key Ideas and Details
Craft and Structure
Integration of Knowledge and Ideas
Percent in ACT Readiness Range State National
53
48
48
43
40
41
0 10 20 30 40 50 60 70 80 90 100
Interpretation of Data
Scientific Investigation
Evaluation of Models/Inferences
Percent in ACT Readiness Range State National

ACT PROFILE REPORT- State: SECTION II, ACADEMIC ACHIEVEMENT PAGE 15
Graduating Class 2017 Code 249999
Minnesota
Total Students in Report: 61,101
Table 2.2. Average ACT Composite Scores for Race/Ethnicity by Level of Preparation
Student Number of Percent Taking Average ACT Composite Score
Group Race/Ethnicity Students Tested Core or More1
Core or More Less Than CoreAll Students 61,101 70 22.5 18.9
Black/African American 3,863 58 18.3 15.6
American Indian/Alaska Native 453 57 17.8 16.1
White 39,798 77 23.3 20.1
Hispanic/Latino 4,301 62 19.6 16.6
Asian 3,412 72 21.6 18.5
Native Hawaiian/Other Pac. Isl. 67 61 20.2 17.6
Two or More Races 2,533 68 21.8 18.6
Prefer not/No Response 6,674 41 22.2 17.9
All Students 2,030,038 68 22.1 18.9
Black/African American 256,756 63 17.9 16.0
American Indian/Alaska Native 16,135 54 18.7 16.4
White 1,062,439 72 23.4 20.2
Hispanic/Latino 347,906 66 19.8 17.4
Asian 96,097 78 25.0 22.5
Native Hawaiian/Other Pac. Isl. 6,503 58 20.0 16.5
Two or More Races 86,119 68 22.2 19.3
Prefer not/No Response 158,083 46 22.6 18.31"Core or More" results correspond to students taking four or more years of English AND three or more years each of math, social studies, and natural science.
Table 2.3. Average ACT Scores by Race/Ethnicity
Student
Group Race/Ethnicity N Percent English Mathematics Reading Science Composite STEMAll Students 61,101 100 20.4 21.5 21.8 21.6 21.5 21.8
Black/African American 3,863 6 15.5 17.3 17.3 17.4 17.0 17.6
American Indian/Alaska Native 453 1 15.3 17.3 17.3 17.7 17.0 17.7
White 39,798 65 21.7 22.6 23.0 22.7 22.6 22.9
Hispanic/Latino 4,301 7 16.9 18.7 18.7 18.8 18.4 19.0
Asian 3,412 6 19.2 21.5 20.2 21.0 20.6 21.5
Native Hawaiian/Other Pac. Isl. 67 0 17.2 19.0 19.5 19.3 18.9 19.4
Two or More Races 2,533 4 19.7 20.7 21.3 21.0 20.8 21.1
Prefer not/No Response 6,674 11 19.0 20.4 20.7 20.6 20.3 20.7
All Students 2,030,038 100 20.3 20.7 21.4 21.0 21.0 21.1
Black/African American 256,756 13 16.0 17.1 17.4 17.4 17.1 17.5
American Indian/Alaska Native 16,135 1 16.1 17.6 18.0 18.0 17.5 18.0
White 1,062,439 52 22.1 21.9 23.0 22.3 22.4 22.3
Hispanic/Latino 347,906 17 17.7 18.9 19.3 19.1 18.9 19.2
Asian 96,097 5 23.7 25.2 23.9 24.0 24.3 24.9
Native Hawaiian/Other Pac. Isl. 6,503 0 17.2 18.6 18.6 18.7 18.4 18.9
Two or More Races 86,119 4 20.6 20.7 21.9 21.2 21.2 21.2
Prefer not/No Response 158,083 8 19.5 20.1 20.8 20.3 20.3 20.5
National
State
National
State

ACT PROFILE REPORT- State: SECTION II, ACADEMIC ACHIEVEMENT PAGE 16
Graduating Class 2017 Code 249999
Minnesota
Total Students in Report: 61,101
Table 2.4. Average ACT Composite Scores for Gender by Level of Preparation
Number of Percent Taking Average ACT Composite Score
Students Tested Core or More1
Core or More Less Than Core
Males 28,795 68 22.6 18.8
Females 29,274 76 22.5 19.2
No Response 3,032 27 20.6 17.4
Males 939,730 66 22.3 18.7
Females 1,047,170 71 21.9 19.3
No Response 43,138 27 19.0 16.51"Core or More" results correspond to students taking four or more years of English AND three or more years each of math, social studies, and natural science.
Table 2.5. Average ACT Scores by Gender
Student Group Gender N Percent English Mathematics Reading Science Composite STEM
Males 28,795 47 19.9 22.0 21.5 21.9 21.5 22.2
Females 29,274 48 21.2 21.3 22.3 21.5 21.7 21.7
No Response 3,032 5 17.5 19.5 19.4 19.5 19.1 19.8
Males 939,730 46 19.9 21.2 21.2 21.3 21.0 21.5
Females 1,047,170 52 20.8 20.4 21.8 20.8 21.1 20.8
No Response 43,138 2 16.4 17.8 17.9 18.1 17.7 18.2
Table 2.6. ACT Score Quartile Values
Quartile English Mathematics Reading Science Composite
Q3 (75th Percentile) 25 26 26 25 25
Q2 (50th Percentile) 20 21 21 22 21
Q1 (25th Percentile) 15 17 17 18 17
National
Student Group Gender
State
National
State

ACT PROFILE REPORT - State: SECTION III, COLLEGE AND CAREER READINESS & THE IMPACT OF COURSE RIGOR PAGE 17
Graduating Class 2017 Code 249999
Minnesota
Total Students in Report: 61,101
Section III
College and Career Readiness
and the Impact of Course Rigor
Beginning with the Graduating Class of 2013, all students whose scores are college reportable, both standard and extended time tests, are now included.
Also beginning with the 2013 Graduating Class data, College Readiness Benchmarks for Reading and Science were updated to reflect the most recent
college coursework research.

ACT PROFILE REPORT - State: SECTION III, COLLEGE AND CAREER READINESS AND THE IMPACT OF COURSE RIGOR PAGE 18
Graduating Class 2017 Code 249999
Minnesota
Total Students in Report: 61,101
Figure 3.1. Percent of Students Meeting 3 or 4 College Readiness Benchmarks by Core College Curriculum Status*
52
20
17
58
27
41
34
44
49
25
6 7
32
11
23 24
20 20
0
10
20
30
40
50
60
70
80
90
100
All Students Black/AfricanAmerican
AmericanIndian/Alaska Native
White Hispanic Asian NativeHawaiian/OtherPacific Islander
Two or more Races Prefer not toRespond/NoResponse
Perc
ent
Core Non-Core
*Missing columns reflect combinations of race/ethnicity and core course-taking status in which one or both indicators are missing.

ACT PROFILE REPORT - State: SECTION III, COLLEGE AND CAREER READINESS & THE IMPACT OF COURSE RIGOR PAGE 19
Graduating Class 2017 Code 249999
Minnesota
Total Students in Report: 61,101
Table 3.1. Percent of Students in College and Career Readiness Standards (CCRS) Score Ranges
Student English Mathematics Reading Science
Group N % N % N % N %
33 to 36 3,595 6 1,984 3 4,166 7 2,571 4
28 to 32 5,564 9 7,139 12 9,170 15 5,222 9
24 to 27 9,524 16 14,718 24 9,268 15 13,097 21
20 to 23 14,361 24 10,742 18 14,769 24 19,341 32
16 to 19 11,224 18 18,533 30 12,258 20 13,021 21
13 to 15 9,644 16 7,394 12 7,573 12 5,743 9
01 to 12 7,189 12 591 1 3,897 6 2,106 3
33 to 36 136,676 7 61,071 3 141,382 7 79,636 4
28 to 32 180,218 9 192,088 9 276,868 14 159,638 8
24 to 27 304,755 15 404,500 20 287,704 14 371,660 18
20 to 23 454,612 22 329,804 16 472,133 23 580,793 29
16 to 19 372,731 18 686,547 34 426,969 21 513,876 25
13 to 15 307,497 15 332,337 16 274,775 14 227,206 11
01 to 12 273,549 13 23,691 1 150,207 7 97,229 5
Table 3.2. Percent of Students Who Met College Readiness Benchmark Scores by Gender
Percent of Students Met
English Mathematics Reading Science All Four
Males 60 51 48 45 33
Females 68 47 53 41 31
No Response 45 32 34 27 18
Males 59 44 46 40 29
Females 65 39 49 35 26
No Response 37 19 24 18 10
National
Student Group
CCRS
Range
State
National
Gender
State

ACT PROFILE REPORT - State: SECTION III, COLLEGE AND CAREER READINESS & THE IMPACT OF COURSE RIGOR PAGE 20
Graduating Class 2017 Code 249999
Minnesota
Total Students in Report: 61,101
Table 3.3. Percent of Students Who Met ACT College Readiness Benchmark Scores by Race/Ethnicity
English Mathematics Reading Science All Four STEM
Student Benchmark=18 Benchmark=22 Benchmark=22 Benchmark=23 Benchmark=26
Group Race/Ethnicity N % % % % % %
All Students 61,101 63 48 50 42 31 24
Black/African American 3,863 30 16 21 12 7 5
American Indian/Alaska Native 453 26 15 21 12 7 2
White 39,798 73 57 58 50 38 29
Hispanic/Latino 4,301 39 24 29 21 13 9
Asian 3,412 49 44 37 34 25 23
Native Hawaiian/Other Pac. Isl 67 37 31 36 24 16 13
Two or More Races 2,533 58 40 46 36 26 18
Prefer Not to Respond 6,674 53 39 42 36 25 20
All Students 2,030,038 61 41 47 37 27 21
Black/African American 256,756 33 13 20 11 6 4
American Indian/Alaska Native 16,135 34 16 25 15 8 5
White 1,062,439 74 51 58 47 35 26
Hispanic/Latino 347,906 46 26 33 22 14 10
Asian 96,097 76 70 62 58 48 46
Native Hawaiian/Other Pac. Isl 6,503 43 26 29 21 15 11
Two or More Races 86,119 64 40 50 38 27 20
Prefer Not to Respond 158,083 54 36 42 34 25 20
Table 3.4. Likely ACT National Career Readiness Certificate (NCRC) Level Based Upon ACT Composite Score1
Student Average
Group ACT NCRC Level2
N % Composite
Gold or Higher 17,680 29 28.3
Silver 30,728 50 20.5
Bronze 10,999 18 14.7
Needs Improvement 1,694 3 11.5
Gold or Higher 538,392 27 28.5
Silver 984,772 49 20.3
Bronze 440,158 22 14.7
Needs Improvement 66,716 3 11.51
The ACT Composite scores associated with a 50% chance of earning each ACT NCRC level or higher are: 13 for Bronze, 17 for Silver, 25 for Gold,
and 35 for Platinum. Based on those cut scores, students who earned an ACT Composite score of less than 13 would be classified as ‘Needs
Improvement’, 13 to 16 as ‘Bronze’, 17 to 24 as ‘Silver’, and 25 or above as ‘Gold or Higher’ in the table above. For comparison, individual
student score reports classify those who scored 12-13, 14-17, and 18 and higher as making progress toward Bronze, Silver, and Gold certificates.2 Additional information on the ACT NCRC can be found at www.act.org.
State
National
State
National

ACT PROFILE REPORT - State: SECTION III, COLLEGE AND CAREER READINESS & THE IMPACT OF COURSE RIGOR PAGE 21
Graduating Class 2017 Code 249999
Minnesota
Total Students in Report: 61,101
Table 3.5. College Readiness Benchmark Percent and Average ACT Scores by Overall High School Curriculum
Student Curriculum English Mathematics Reading Science Composite4
STEM
Group Taken1 % Avg % Avg % Avg % Avg % Avg % Avg
Core or More2
42,765 71 21.6 56 22.5 57 22.9 49 22.6 37 22.5 29 22.8
Less than Core 8,110 43 17.5 29 19.1 32 19.3 25 19.3 16 18.9 12 19.5
Missing3
10,226 44 17.5 31 19.3 34 19.4 28 19.5 18 19.1 13 19.6
Core or More 1,376,479 70 21.6 48 21.7 54 22.6 44 21.9 33 22.1 25 22.1
Less than Core 464,989 46 17.9 26 18.8 33 19.3 24 19.1 16 18.9 11 19.2
Missing 188,570 37 16.5 20 17.9 27 18.2 20 18.3 12 17.9 9 18.31 "Curriculum Taken" reflects overall high school curriculum in this table.
2 "Core or More" results correspond to students taking four or more years of English AND three or more years each of math, social studies, and natural science.
3 Zero years or no coursework information reported in one or more content areas.
4 Composite College Readiness Benchmark % results reflect students who met all four subject-area benchmarks.
Table 3.6. College Readiness Benchmark Percent and Average ACT Scores by Content-Specific Curriculum
Student Curriculum English Mathematics Reading Science
Group Taken1 N % Avg N % Avg N % Avg N % Avg
Core or More2
47,703 69 21.2 49,143 53 22.2 47,574 54 22.5 48,876 46 22.2
Less than Core 4,029 37 16.5 2,199 13 17.1 3,861 32 19.2 2,457 18 18.3
Missing3
9,369 46 17.7 9,759 31 19.4 9,666 35 19.6 9,768 28 19.6
Core or More 1,749,083 65 20.9 1,754,759 44 21.2 1,634,115 51 22.0 1,601,572 42 21.7
Less than Core 109,158 34 15.9 96,952 8 16.3 218,140 34 19.5 248,948 17 18.2
Missing 171,797 39 16.7 178,327 21 18.0 177,783 28 18.3 179,518 20 18.41
"Curriculum Taken" reflects content-specific curriculum in this table.2 "Core or More" results correspond to students taking four or more years of English or three or more years of math, social studies, or natural science, respectively.
For instance, Reading "Core or More" results correspond to students taking three or more years of social studies, regardless of courses taken in other content areas.3 Zero years or no coursework information reported in the specified content area.
National
N
State
National
State
ACT PROFILE REPORT - State: SECTION III, COLLEGE AND CAREER READINESS & THE IMPACT OF COURSE RIGOR PAGE 22
Graduating Class 2017 Code 249999
Minnesota
Total Students in Report: 61,101
Table 3.7. College Readiness Benchmark (CRB) Percent and Average ACT Scores by Common Course PatternsCourse Pattern State National
ENGLISH COURSE PATTERN N
Percent Taking
Pattern
Avg ACT
English
Percent Who Met
Benchmark N
Percent Taking
Pattern
Avg ACT
English
Percent Who Met
Benchmark
Eng 9, Eng 10, Eng 11, Eng 12, & Other English 12,783 21 22.0 74 372,397 18 22.0 72
Eng 9, Eng 10, Eng 11, Eng 12 34,920 57 21.0 67 1,376,686 68 20.6 64
Less than 4 years of English 4,029 7 16.5 37 109,158 5 15.9 34
Zero years / no English courses reported 9,369 15 17.7 46 171,797 8 16.7 39
MATHEMATICS COURSE PATTERN N
Percent Taking
Pattern
Avg ACT
Math
Percent Who Met
Benchmark N
Percent Taking
Pattern
Avg ACT
Math
Percent Who Met
Benchmark
Alg 1, Alg 2, Geom, Trig, & Calc 3,159 5 24.3 72 117,096 6 23.2 62
Alg 1, Alg 2, Geom, Trig, & Other Adv Math 5,178 8 22.5 61 152,416 8 21.5 51
Alg 1, Alg 2, Geom, & Trig 2,794 5 19.7 34 113,080 6 18.9 26
Alg 1, Alg 2, Geom, & Other Adv Math 9,796 16 20.5 40 364,399 18 19.3 29
Other comb of 4 or more years of Math 18,190 30 25.1 75 684,625 34 23.8 64
Alg 1, Alg 2, & Geom 7,838 13 17.7 15 217,043 11 16.9 10
Other comb of 3 or 3.5 years of Math 2,188 4 20.9 44 106,100 5 19.6 32
Less than 3 years of Math 2,199 4 17.1 13 96,952 5 16.3 8
Zero years / no Math courses reported 9,759 16 19.4 31 178,327 9 18.0 21
SOCIAL SCIENCE COURSE PATTERN N
Percent Taking
Pattern
Avg ACT
Reading
Percent Who Met
Benchmark N
Percent Taking
Pattern
Avg ACT
Reading
Percent Who Met
Benchmark
US Hist, World Hist, Am Gov, & Other Hist 425 1 23.3 56 52,959 3 22.1 51
Other comb of 4 or more years Social Science 35,789 59 22.7 56 934,153 46 22.6 55
US Hist, World Hist, & Am Gov 898 1 19.5 35 120,831 6 19.7 35
Other comb of 3 or 3.5 years of Social Science 10,462 17 22.0 50 526,172 26 21.6 48
Less than 3 years of Social Science 3,861 6 19.2 32 218,140 11 19.5 34
Zero years / no Social Science courses reported 9,666 16 19.6 35 177,783 9 18.3 28
NATURAL SCIENCE COURSE PATTERN N
Percent Taking
Pattern
Avg ACT
Science
Percent Who Met
Benchmark N
Percent Taking
Pattern
Avg ACT
Science
Percent Who Met
Benchmark
Gen Sci1, Bio, Chem, & Phys 27,498 45 23.1 54 809,286 40 22.4 48
Bio, Chem, Phys 2,409 4 23.0 52 225,060 11 23.2 53
Gen Sci1, Bio, Chem 16,762 27 20.9 35 513,247 25 20.2 30
Other comb of 3 years of Natural Science 2,207 4 20.3 32 53,979 3 19.1 24
Less than 3 years of Natural Science 2,457 4 18.3 18 248,948 12 18.2 17
Zero years / no Natural Science courses reported 9,768 16 19.6 28 179,518 9 18.4 201Includes General, Physical and Earth Sciences.

ACT PROFILE REPORT - State: SECTION III, COLLEGE AND CAREER READINESS & THE IMPACT OF COURSE RIGOR PAGE 23
Graduating Class 2017 Code 249999
Minnesota
Total Students in Report: 61,101
Table 3.8. College Readiness Benchmark (CRB) Percent and Average ACT Scores for Gender by Common Course PatternsCourse Pattern All Students Males Females
ENGLISH COURSE PATTERN N Percent
ACT
English
% Who Met
Benchmark N Percent
ACT
English
% Who Met
Benchmark N Percent
ACT
English
% Who Met
Benchmark
Eng 9, Eng 10, Eng 11, Eng 12, & Other English 12,783 21 22.0 74 5,286 18 21.5 71 7,292 25 22.4 77
Eng 9, Eng 10, Eng 11, Eng 12 34,920 57 21.0 67 17,060 59 20.5 64 17,058 58 21.6 71
Less than 4 years of English 4,029 7 16.5 37 2,255 8 16.1 34 1,590 5 17.2 42
Zero years / no English courses reported 9,369 15 17.7 46 4,194 15 17.3 42 3,334 11 18.5 51
MATHEMATICS COURSE PATTERN N Percent
ACT
Math
% Who Met
Benchmark N Percent
ACT
Math
% Who Met
Benchmark N Percent
ACT
Math
% Who Met
Benchmark
Alg 1, Alg 2, Geom, Trig, & Calc 3,159 5 24.3 72 1,478 5 25.1 77 1,636 6 23.7 69
Alg 1, Alg 2, Geom, Trig, & Other Adv Math 5,178 8 22.5 61 2,148 7 23.0 66 2,941 10 22.2 57
Alg 1, Alg 2, Geom, & Trig 2,794 5 19.7 34 1,328 5 20.0 36 1,407 5 19.5 32
Alg 1, Alg 2, Geom, & Other Adv Math 9,796 16 20.5 40 3,963 14 20.8 44 5,572 19 20.2 37
Other comb of 4 or more years of Math 18,190 30 25.1 75 9,172 32 25.6 77 8,755 30 24.6 73
Alg 1, Alg 2, & Geom 7,838 13 17.7 15 4,048 14 18.0 17 3,482 12 17.6 13
Other comb of 3 or 3.5 years of Math 2,188 4 20.9 44 1,095 4 21.3 46 1,052 4 20.6 42
Less than 3 years of Math 2,199 4 17.1 13 1,178 4 17.1 14 924 3 17.1 13
Zero years / no Math courses reported 9,759 16 19.4 31 4,385 15 19.7 34 3,505 12 19.1 29
SOCIAL SCIENCE COURSE PATTERN N Percent
ACT
Reading
% Who Met
Benchmark N Percent
ACT
Reading
% Who Met
Benchmark N Percent
ACT
Reading
% Who Met
Benchmark
US Hist, World Hist, Am Gov, & Other Hist 425 1 23.3 56 219 1 22.7 51 192 1 24.3 64
Other comb of 4 or more years Social Science 35,789 59 22.7 56 16,066 56 22.4 54 19,066 65 22.9 58
US Hist, World Hist, & Am Gov 898 1 19.5 35 563 2 19.3 33 307 1 20.2 39
Other comb of 3 or 3.5 years of Social Science 10,462 17 22.0 50 5,399 19 21.7 48 4,763 16 22.5 52
Less than 3 years of Social Science 3,861 6 19.2 32 2,197 8 19.0 31 1,496 5 19.8 36
Zero years / no Social Science courses reported 9,666 16 19.6 35 4,351 15 19.3 33 3,450 12 20.2 38
NATURAL SCIENCE COURSE PATTERN N Percent
ACT
Science
% Who Met
Benchmark N Percent
ACT
Science
% Who Met
Benchmark N Percent
ACT
Science
% Who Met
Benchmark
Gen Sci1, Bio, Chem, & Phys 27,498 45 23.1 54 13,654 47 23.6 57 13,363 46 22.6 50
Bio, Chem, Phys 2,409 4 23.0 52 1,187 4 23.7 56 1,160 4 22.4 49
Gen Sci2, Bio, Chem 16,762 27 20.9 35 6,891 24 20.7 35 9,406 32 21.0 36
Other comb of 3 years of Natural Science 2,207 4 20.3 32 1,318 5 20.7 35 808 3 19.8 28
Less than 3 years of Natural Science 2,457 4 18.3 18 1,336 5 18.2 19 1,044 4 18.5 19
Zero years / no Natural Science courses reported 9,768 16 19.6 28 4,409 15 19.7 30 3,493 12 19.6 281Includes General, Physical and Earth Sciences.

ACT PROFILE REPORT - State: SECTION III, COLLEGE AND CAREER READINESS & THE IMPACT OF COURSE RIGOR PAGE 24
Graduating Class 2017 Code 249999
Minnesota
Total Students in Report: 61,101
This page intentionally left blank.

ACT PROFILE REPORT - State: SECTION IV, CAREER AND EDUCATIONAL ASPIRATIONS PAGE 25
Graduating Class 2017 Code 249999
Minnesota
Total Students in Report: 61,101
Section IV
Career and Educational Aspirations
Beginning with the Graduating Class of 2013, all students whose scores are college reportable, both standard and extended time tests, are now included.
Also beginning with the 2013 Graduating Class data, College Readiness Benchmarks for Reading and Science were updated to reflect the most recent
college coursework research.

ACT PROFILE REPORT - State: SECTION IV, CAREER AND EDUCATIONAL ASPIRATIONS PAGE 26
Graduating Class 2017 Code 249999
Minnesota
Total Students in Report: 61,101
Figure 4.1. Average ACT Composite Scores by Race and Student Postsecondary Aspirations*
13.7
15.8
17.9
14.8
16.3 16.5
14.3 15.0
18.0
15.9 15.1
16.3 17.1 17.4
22.3
18.7
19.8 19.6 19.5 19.6
25.5
22.2
24.4
18.8
19.8 20.2
25.4
21.5
25.0
26.3
1
6
11
16
21
26
31
Black/African American American Indian/Alaska Native White Hispanic/Latino Asian Native Hawaiian/Pacific Islander
Avera
ge C
om
posite S
core
Voc-Tech 2-yr College Degree Bachelors Degree Graduate Study Prof. Level Degree
*Missing columns reflect combinations of race/ethnicity and postsecondary aspiration in which one or both indicators are missing.

ACT PROFILE REPORT - State: SECTION IV, CAREER AND EDUCATIONAL ASPIRATIONS PAGE 27
Graduating Class 2017 Code 249999
Minnesota
Total Students in Report: 61,101
Table 4.1. Distribution of Planned Educational Majors for All Students by College Plans
All Students Plan on 2 Years or Less of College Plan on 4 Years or More of College
Planned Educational Major N1
Percent2
Avg ACT
Comp N Percent
Avg ACT
Comp N Percent
Avg ACT
Comp
Agriculture & Natural Resources Conservation 1,265 2 20.3 303 6 17.4 902 2 21.4
Architecture 492 1 21.5 48 1 16.4 420 1 22.2
Area, Ethnic, & Multidisciplinary Studies 95 0 20.7 13 0 14.8 72 0 22.3
Arts: Visual & Performing 2,962 5 20.9 433 8 17.6 2,329 6 21.6
Business 5,054 8 22.1 337 7 17.5 4,460 11 22.6
Communications 727 1 22.7 36 1 18.6 654 2 23.0
Community, Family, & Personal Services 1,762 3 18.6 458 9 16.8 1,190 3 19.5
Computer Science & Mathematics 1,850 3 24.1 168 3 19.3 1,593 4 24.8
Education 2,550 4 21.4 115 2 16.8 2,342 6 21.7
Engineering 4,123 7 24.4 269 5 17.3 3,651 9 25.1
Engineering Technology & Drafting 835 1 20.8 201 4 17.5 587 1 22.2
English & Foreign Languages 600 1 24.4 22 0 19.5 546 1 24.7
Health Administration & Assisting 982 2 19.2 108 2 16.8 800 2 19.7
Health Sciences & Technologies 9,002 15 21.9 438 9 17.6 8,214 20 22.2
Philosophy, Religion, & Theology 182 0 22.1 13 0 16.6 155 0 22.9
Repair, Production, & Construction 1,403 2 18.3 871 17 17.7 460 1 19.6
Sciences: Biological & Physical 3,239 5 25.0 64 1 18.5 3,035 7 25.3
Social Sciences & Law 3,351 5 22.4 104 2 17.8 3,087 8 22.7
Undecided 7,412 12 22.4 576 11 17.3 5,883 14 23.3
No Response 13,043 21 19.0 447 9 15.6 692 2 18.312-Year and 4-Year "N" counts do not reflect "Missing" and "Other" college plans, therefore they may not add up to the N count for All Students.
2Percent of students tested within College Plan groups (All Students, 2-Year, 4-Year).

ACT PROFILE REPORT - State: SECTION IV, CAREER AND EDUCATIONAL ASPIRATIONS PAGE 28
Graduating Class 2017 Code 249999
Minnesota
Total Students in Report: 61,101
Table 4.2. Average ACT Composite Scores for Racial/Ethnic Groups by Post-Secondary Educational Aspirations
All Racial/Ethnic Groups
Combined Black/African American American Indian/ Alaska Native White Hispanic/Latino
N Average N Average N Average N Average N Average
Voc-Tech 1,271 17.2 58 13.7 18 15.8 871 17.9 113 14.8
2-yr College Degree 3,824 17.3 175 14.3 59 15.0 2,616 18.0 361 15.9
Bachelors Degree 25,319 21.6 1,232 17.1 165 17.4 18,704 22.3 1,547 18.7
Graduate Study 7,055 24.9 332 19.5 31 19.6 5,282 25.5 363 22.2
Prof. Level Degree 8,786 24.5 689 19.8 43 20.2 5,852 25.4 568 21.5
Other 897 18.1 54 15.3 13 15.2 549 18.9 76 16.1
No Response 13,949 19.4 1,323 15.4 124 16.1 5,924 21.1 1,273 16.8
All Racial/Ethnic Groups
Combined Asian
Native Hawaiian/
Pacific Islander Two or more races
Prefer not to respond/
No Response
N Average N Average N Average N Average N Average
Voc-Tech 1,271 17.2 40 16.3 2 16.5 32 18.2 137 16.6
2-yr College Degree 3,824 17.3 154 15.1 8 16.3 140 17.1 311 16.6
Bachelors Degree 25,319 21.6 1,229 19.8 27 19.6 1,027 20.4 1,388 21.0
Graduate Study 7,055 24.9 347 24.4 9 18.8 265 24.5 426 24.5
Prof. Level Degree 8,786 24.5 675 25.0 6 26.3 428 23.6 525 24.6
Other 897 18.1 55 17.4 5 16.2 35 18.2 110 17.3
No Response 13,949 19.4 912 18.2 10 16.6 606 19.1 3,777 19.5
Educational Degree
Aspirations
Educational Degree
Aspirations

ACT PROFILE REPORT - State: SECTION IV, CAREER AND EDUCATIONAL ASPIRATIONS PAGE 29
Graduating Class 2017 Code 249999
Minnesota
Total Students in Report: 61,101
Table 4.3. Students' Score Report Preferences at Time of Testing
Percent of Students in
Number of Students College Readiness Standards Ranges
Name State Total 1st Choice
2nd-6th
Choice 01-12 13-15 16-19 20-23 24-27 28-32 33-36
UNIVERSITY OF MINNESOTA-TWIN CITIES Minnesota 14,177 5,851 8,326 1 7 18 27 25 18 4
UNIVERSITY OF MINNESOTA-DULUTH Minnesota 8,666 2,476 6,190 1 6 22 35 26 11 1
MINNESOTA STATE UNIVERSITY MANKATO Minnesota 6,122 1,993 4,129 1 11 32 33 18 5 0
ST CLOUD STATE UNIVERSITY Minnesota 5,113 1,485 3,628 2 13 32 32 15 5 0
NORTH DAKOTA STATE UNIVERSITY North Dakota 4,907 1,471 3,436 0 5 23 34 25 11 1
WINONA STATE UNIVERSITY Minnesota 4,098 1,079 3,019 1 9 31 34 20 6 0
UNIVERSITY OF SAINT THOMAS-MN Minnesota 2,958 643 2,315 1 6 17 29 29 16 2
BEMIDJI STATE UNIVERSITY Minnesota 2,953 952 2,001 1 9 33 36 16 5 0
UNIVERSITY OF NORTH DAKOTA North Dakota 2,922 850 2,072 1 5 20 35 26 12 1
UNIV OF WISCONSIN-MADISON Wisconsin 2,853 676 2,177 0 1 6 18 32 35 8
AUGSBURG COLLEGE Minnesota 2,165 497 1,668 4 21 33 25 12 5 1
STATE-NO COLLEGE PLANS Iowa 1,876 1,876 0 9 33 33 16 7 2 0
IOWA STATE UNIVERSITY Iowa 1,831 467 1,364 0 2 14 26 32 21 4
MINNESOTA STATE UNIVERSITY MOORHEAD Minnesota 1,677 466 1,211 1 8 28 36 20 7 0
SOUTH DAKOTA STATE UNIVERSITY South Dakota 1,650 509 1,141 0 6 24 35 24 10 1
UNIV OF WISCONSIN-RIVER FALLS Wisconsin 1,596 473 1,123 1 7 30 33 21 6 1
UNIV OF WISCONSIN-EAU CLAIRE Wisconsin 1,581 384 1,197 0 2 18 37 28 13 1
HAMLINE UNIVERSITY Minnesota 1,211 262 949 2 14 23 29 21 11 1
BETHEL UNIVERSITY Minnesota 1,209 394 815 1 7 18 31 27 14 2
ALEXANDRIA TECHNICAL & COMMUNITY COLL Minnesota 1,161 509 652 2 23 44 24 6 1 0
ST CLOUD TECHNICAL & COMMUNITY COLLEGE Minnesota 1,120 316 804 5 25 38 22 8 1 0
UNIVERSITY OF MINNESOTA-MORRIS Minnesota 1,113 281 832 1 7 22 32 24 14 1
GUSTAVUS ADOLPHUS COLLEGE Minnesota 1,029 256 773 0 4 15 29 27 22 3
UNIVERSITY OF MINNESOTA ROCHESTER Minnesota 1,026 205 821 2 11 25 32 20 10 1
UNIVERSITY OF NORTHWESTERN-ST PAUL Minnesota 1,020 312 708 1 8 21 31 24 14 1
CONCORDIA COLLEGE-MOORHEAD Minnesota 971 274 697 1 6 19 31 27 14 2
COLLEGE OF SAINT SCHOLASTICA Minnesota 966 280 686 1 4 22 36 26 10 1
UNIV OF WISCONSIN-LA CROSSE Wisconsin 932 186 746 0 2 16 37 29 14 1
ST OLAF COLLEGE Minnesota 921 215 706 1 7 14 20 24 28 7
UNIVERSITY OF IOWA Iowa 916 210 706 0 4 12 29 33 19 2
All Other Institutions 65,539 18,838 46,701 3 14 26 25 17 12 3
Total 146,279 44,686 101,593 2 11 25 28 20 12 2

ACT PROFILE REPORT - State : SECTION IV, CAREER AND EDUCATIONAL ASPIRATIONS PAGE 30
Graduating Class 2017 Code 249999
Minnesota
Total Students in Report: 61,101
This page intentionally left blank.

ACT PROFILE REPORT - State: SECTION V, OPTIONAL WRITING TEST RESULTS PAGE 31
Graduating Class 2017 Code 249999
Minnesota
Total Students in Report: 61,101
Section V
Optional Writing Test Results
Beginning with the Graduating Class of 2013, all students whose scores are college reportable, both standard and extended time tests, are now included.
Also beginning with the 2013 Graduating Class data, College Readiness Benchmarks for Reading and Science were updated to reflect the most recent
college coursework research.

ACT PROFILE REPORT - State: SECTION V, OPTIONAL WRITING TEST RESULTS PAGE 32
Graduating Class 2017 Code 249999
Minnesota
Total Students in Report: 61,101
Figure 5.1. Average ACT Writing Scores by Race/Ethnicity*
6.4
5.5
5.2
6.6
5.9
6.5
6.1
6.4 6.5
5.6 5.5
6.8
6.3
7.4
6.1
6.7
2
3
4
5
6
7
8
9
10
11
12
All Students Black/African American American Indian/AlaskaNative
White Hispanic/Latino Asian Native Hawaiian/OtherPac. Isl.
Two or More Races
Avera
ge W
ritin
g S
core
State National
*Missing columns reflect race/ethnicity groupings that are missing. Results based on students with ACT Writing scores from test events beginning September 2015. Score scale is 2-12.

ACT PROFILE REPORT - State: SECTION V, OPTIONAL WRITING TEST RESULTS PAGE 33
Graduating Class 2017 Code 249999
Minnesota
Total Students in Report: 61,101
Table 5.1. Average ACT English Language Arts and Constituent Scores by Race/Ethnicity and Gender for Students Who Took ACT Writing1
Average ACT Scores
English
N Writing English Reading Language Arts
State National State National State National State National State National
All Students 48,481 1,090,621 6.4 6.5 20.1 20.9 21.6 22.0 19.7 20.2
Black/African American 3,269 125,357 5.5 5.6 15.2 16.2 17.1 17.7 15.5 16.0
American Indian/Alaska Native 402 7,357 5.2 5.5 15.1 15.9 17.1 17.9 15.0 16.0
White 30,124 525,822 6.6 6.8 21.5 22.8 22.9 23.8 20.9 21.8
Hispanic/Latino 3,699 218,012 5.9 6.3 16.6 18.1 18.5 19.7 16.9 18.1
Asian 2,895 72,490 6.5 7.4 19.0 24.5 20.2 24.7 18.9 23.3
Native Hawaiian/Other Pac. Isl. 59 4,270 6.1 6.1 16.7 17.5 19.4 18.8 17.5 17.5
Two or More Races 2,107 48,148 6.4 6.7 19.5 21.2 21.2 22.5 19.4 20.6
Prefer not/No Response 5,926 89,165 6.1 6.4 18.8 20.6 20.4 21.7 18.5 19.8
Males 22,858 496,038 6.1 6.3 19.5 20.6 21.3 21.8 19.1 19.8
Females 22,665 568,720 6.7 6.8 20.9 21.4 22.2 22.4 20.6 20.8
No Response 2,958 25,863 5.9 5.5 17.6 16.4 19.5 18.0 17.6 16.31Results based on students with ACT writing scores with test events beginning September 2015. The writing score range is 2-12 (i.e., the rounded average of the four domain scores).
Table 5.2. Average ACT English and Writing Scores by Race/Ethnicity and Gender for Students Who Took ACT Writing1
Average ACT Scores
English /
N English Writing Writing Combined
State National State National State National State National
All Students 71 3,655 26.3 23.5 6.8 6.8 23.9 22.0
Black/African American 1 200 21.0 18.5 7.0 6.1 20.0 17.6
American Indian/Alaska Native 1 14 20.0 19.9 5.0 5.9 18.0 18.6
White 46 2,049 26.1 24.1 6.8 6.9 23.8 22.5
Hispanic/Latino 3 588 23.0 18.4 6.0 5.8 21.0 17.2
Asian 5 367 28.2 29.5 7.6 8.1 26.0 27.5
Native Hawaiian/Other Pac. Isl. 0 2 . 21.5 . 6.0 . 20.0
Two or More Races 4 123 26.0 24.6 5.5 6.9 22.5 22.8
Prefer not/No Response 11 312 28.5 25.5 7.2 6.9 25.6 23.5
Males 28 1,700 25.1 23.6 6.4 6.6 22.6 21.9
Females 43 1,955 27.1 23.5 7.1 6.9 24.8 22.0
No Response 0 0 . . . . . .1Results based on students with ACT writing scores with test events prior to September 2015. The writing score range is 2-12.