Embed Size (px)
Citation preview
Sci.Int (Lahore), 25(4),531-537, 2013 ISSN 1013-5316; CODEN: SINTE 8 531
PROFILING AND ZONING OF GEOTECHNICAL SUB-SOIL DATA USING GEOGRAPHIC INFORMATION SYSTEM
Mahmood Ahmad*, Qaiser Iqbal and Fayaz Ahmad Khan Department of Civil Engineering, University of Engineering and Technology Peshawar, Pakistan
*Contact: [email protected]
ABSTRACT: This research paper presents a compendium of the geotechnical sub-soil data profiling and
zoning of the major urban settlements of Peshawar using Geographic Information System. Significant
geotechnical properties of the under study area soils i.e., Zone 5 & 6 in Peshawar were assessed through
one hundred and three different standard penetration test reports up to the depth of 1 m and 3 m. The
qualitative description of the sub-soil data was manipulated into the quantitative figures by means of
coding in order to interpolate the soil class distribution for the preparation of geotechnical zonation maps.
This work is helpful for balancing of cost and acquiring the significant reliable data regarding soil class
distribution, classification charactrestics, shear strength charactrestics and bearing capacity of soils
during feasibility and preliminary design stage of the project.
Keywords: Geotechnical properties, Geotechnical zonation maps, Interpolation and Urban settlements.
List of symboles/abbrevations
CL-ML Silty Clay or Clayey Silt
CL Clay
c Cohesion or Inter-Particle Attraction
DEM Digital Elevation Model
GZMs Geotechnical Zonation Maps
GIS Geographic Information System
GW Well Graded Gravel
GP Poorly Graded Gravel GC Clayey Gravel
GTS General Topographic Sheet
GPS Global Positioning System
GM Silty Gravel
IDW Inverse Distance Weighted Interpolation
LL Liquid Limit of Soil
ML Silt
NSL Natural Surface Level
PL Plastic Limit of Soil
PI Plastic Index of Soil = LL – PL
PCF Pounds per Cubic Foot
SPT Standard Penetration Test SP Poorly Graded Sand
SM Silty Sand
SRTM Shuttle Radar Topographic Mission
TSF Tons per Square Foot
USCS Unified Soil Classification System
ϕ Angle of Internal Friction
1. INTRODUCTION The profiling and zoning of geotechnical sub-soil data is
often considered as one of the very important information
for the planning and a construction projects in civil engineering works. Data availability can cut the expense of
the projects and also reduce time, particularly during
feasibility and planning stage. In past few years, the numbers
of construction projects in Peshawar have increased rapidly.
Consequently, the number of soil boring reports has been
accrued largely. The presentation of already available sub-
soil data in a user friendly format will enable the geo-
technical and civil engineers beforehand to plan the detail
geotechnical investigation based on the provided soil profile
and Geotechnical Zonation Maps (GZMs). The GZMs and
sub-soil profile will facilitate the geotechnical engineers for
preliminary design of foundations, feasibility study and
preparation of rough cost estimates for the proposed
projects. The geographic information system (GIS) is a
valuable tool for geotechnical engineers, not only for non-
data area prediction but also used to interpret the complex
data area with reliability and accuracy [1].
The GZMs have not yet been prepared by any group, agency or individual at Khyber Pakhtunkhwa level and this work is
the first step in this perspective. Establishing a GZMs and
soil profile of Peshawar urban settlement can be very useful
during preliminary planning, designing and feasibility
studies of various engineering projects in Peshawar. In
several countries of the world, proper guidelines are already
available to practicing engineers and forerunner geotechnical
engineers in the form of maps for geotechnical design
purposes [2]. This research is focused for general
establishment of geotechnical appraisal for construction
projects in Peshawar urban settlements. Geotechnical sub-
soil data currently available at Soil mechanics and Highway Engineering Laboratory, University of Engineering and
Technology Peshawar is utilized for preparation of these
maps.
2. OBJECTIVIES OF THE STUDY
The research study is designed to prepare sub-soil profile,
GZMs and to furnish sufficient necessary reliable data
regarding percentage of soil class distribution, classification
charactrestics, shear strength charactrestics and bearing
capacity of soils in the selected under study area of the
Peshawar urban settlements. This research work will assist
the geotechnical and civil engineers beforehand to plan the detail geotechnical investigation based on the provided sub-
soil profile and GZMs.
3. DESCRIPTION OF THE STUDY AREA
The study area consists of Peshawar urban settlements i.e.
Zone 5 and 6 having two hundred and eighty nine square
kilometers area located within Latitudes 33° 54′ to 34° 4′ N
and Longitudes 71° 23′ to 71° 43′ E (Fig. 1). The study area
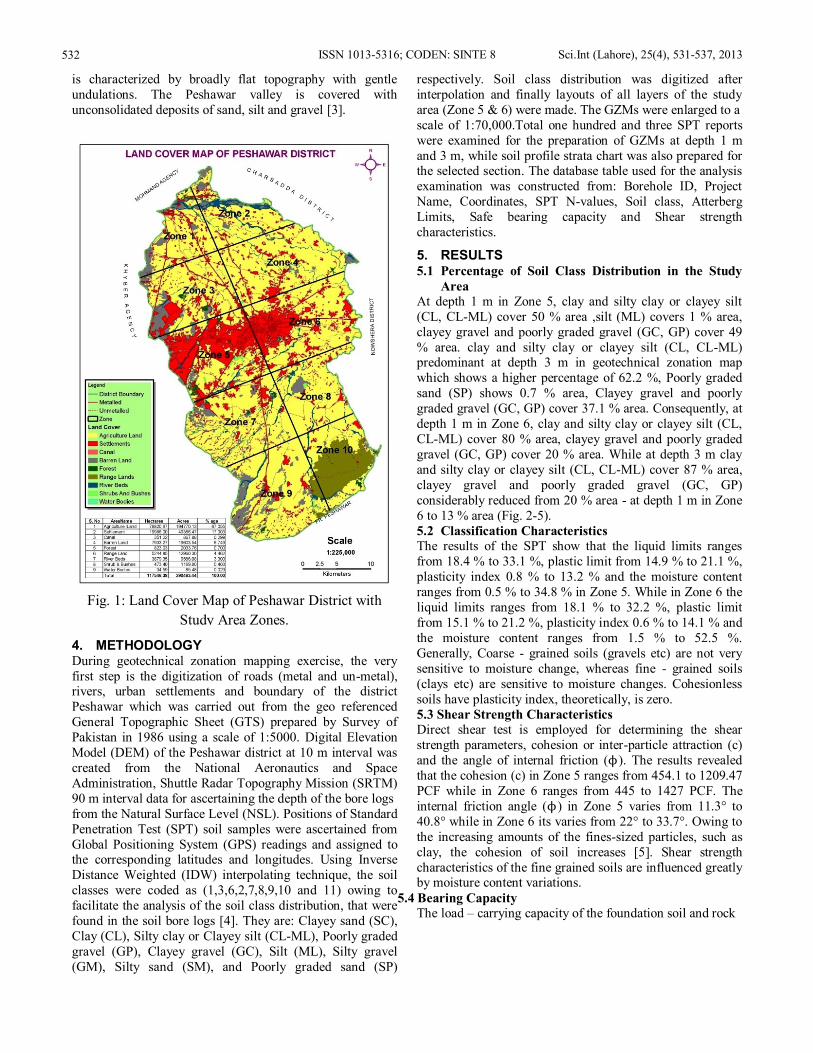
ISSN 1013-5316; CODEN: SINTE 8 Sci.Int (Lahore), 25(4), 531-537, 2013 532
is characterized by broadly flat topography with gentle
undulations. The Peshawar valley is covered with
unconsolidated deposits of sand, silt and gravel [3].
4. METHODOLOGY During geotechnical zonation mapping exercise, the very
first step is the digitization of roads (metal and un-metal), rivers, urban settlements and boundary of the district
Peshawar which was carried out from the geo referenced
General Topographic Sheet (GTS) prepared by Survey of
Pakistan in 1986 using a scale of 1:5000. Digital Elevation
Model (DEM) of the Peshawar district at 10 m interval was
created from the National Aeronautics and Space
Administration, Shuttle Radar Topography Mission (SRTM)
90 m interval data for ascertaining the depth of the bore logs
from the Natural Surface Level (NSL). Positions of Standard
Penetration Test (SPT) soil samples were ascertained from
Global Positioning System (GPS) readings and assigned to the corresponding latitudes and longitudes. Using Inverse
Distance Weighted (IDW) interpolating technique, the soil
classes were coded as (1,3,6,2,7,8,9,10 and 11) owing to
facilitate the analysis of the soil class distribution, that were
found in the soil bore logs [4]. They are: Clayey sand (SC),
Clay (CL), Silty clay or Clayey silt (CL-ML), Poorly graded
gravel (GP), Clayey gravel (GC), Silt (ML), Silty gravel
(GM), Silty sand (SM), and Poorly graded sand (SP)
respectively. Soil class distribution was digitized after
interpolation and finally layouts of all layers of the study
area (Zone 5 & 6) were made. The GZMs were enlarged to a
scale of 1:70,000.Total one hundred and three SPT reports
were examined for the preparation of GZMs at depth 1 m
and 3 m, while soil profile strata chart was also prepared for the selected section. The database table used for the analysis
examination was constructed from: Borehole ID, Project
Name, Coordinates, SPT N-values, Soil class, Atterberg
Limits, Safe bearing capacity and Shear strength
characteristics.
5. RESULTS 5.1 Percentage of Soil Class Distribution in the Study
Area
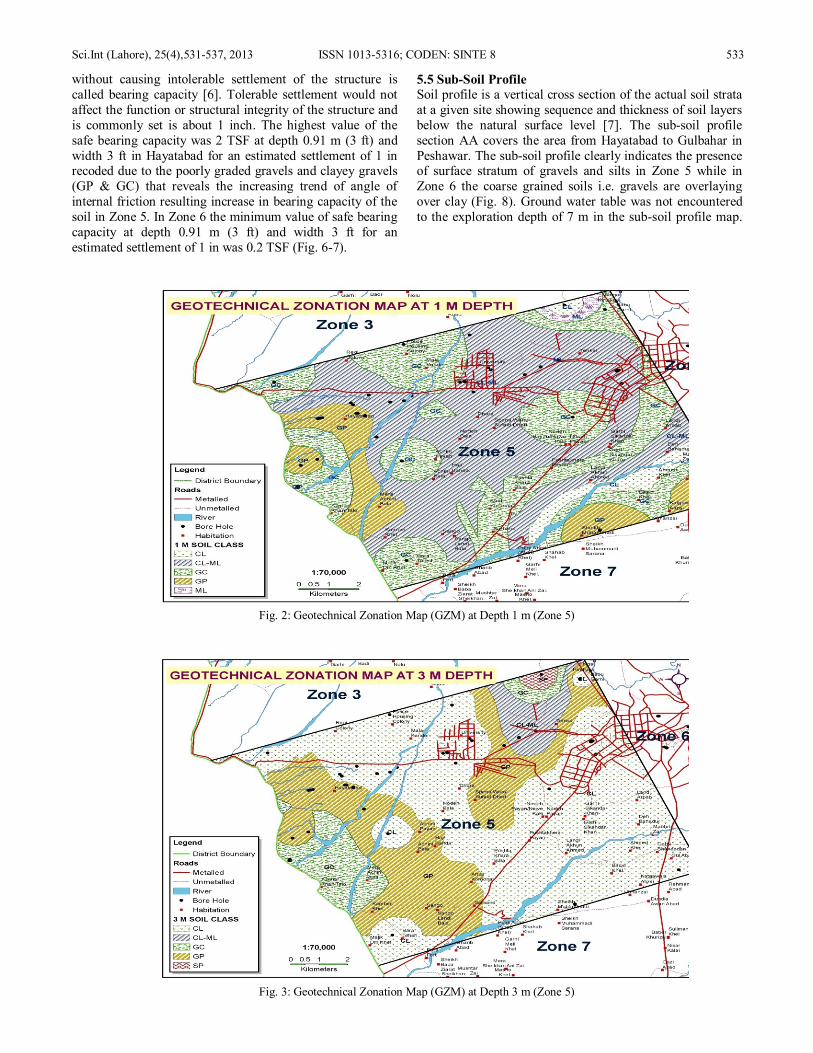
At depth 1 m in Zone 5, clay and silty clay or clayey silt
(CL, CL-ML) cover 50 % area ,silt (ML) covers 1 % area,
clayey gravel and poorly graded gravel (GC, GP) cover 49
% area. clay and silty clay or clayey silt (CL, CL-ML) predominant at depth 3 m in geotechnical zonation map
which shows a higher percentage of 62.2 %, Poorly graded
sand (SP) shows 0.7 % area, Clayey gravel and poorly
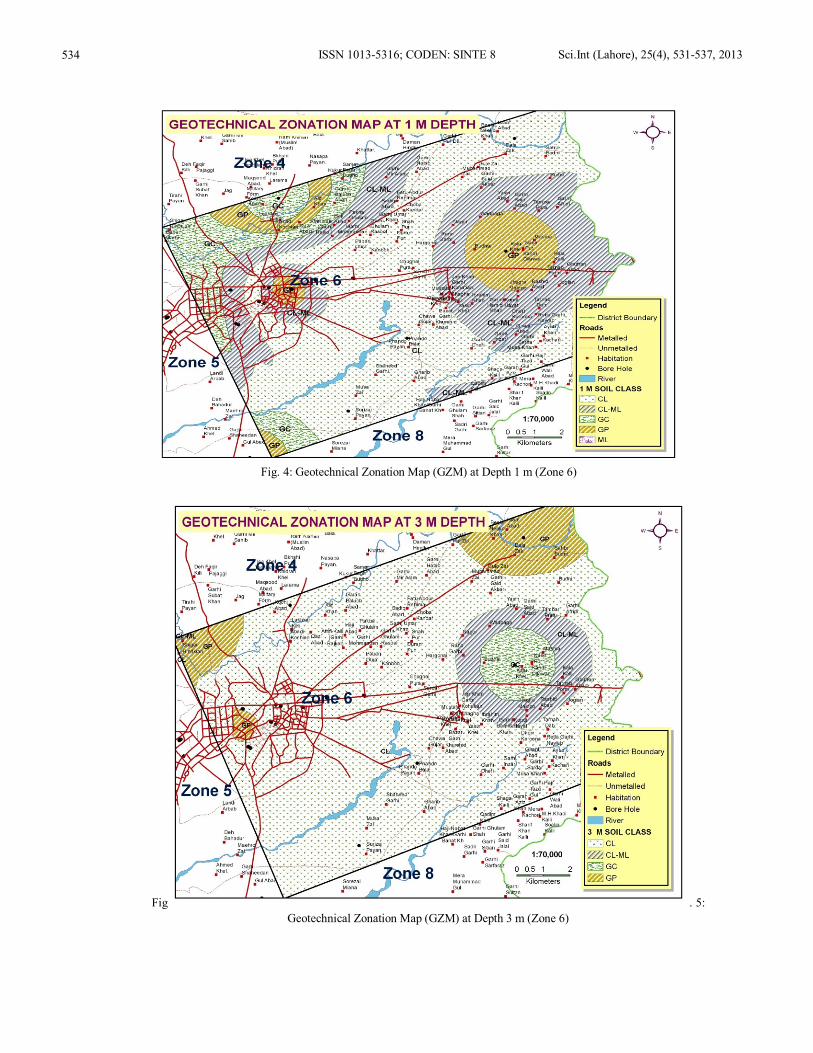
graded gravel (GC, GP) cover 37.1 % area. Consequently, at
depth 1 m in Zone 6, clay and silty clay or clayey silt (CL,
CL-ML) cover 80 % area, clayey gravel and poorly graded
gravel (GC, GP) cover 20 % area. While at depth 3 m clay
and silty clay or clayey silt (CL, CL-ML) cover 87 % area,
clayey gravel and poorly graded gravel (GC, GP)
considerably reduced from 20 % area - at depth 1 m in Zone
6 to 13 % area (Fig. 2-5).
5.2 Classification Characteristics
The results of the SPT show that the liquid limits ranges
from 18.4 % to 33.1 %, plastic limit from 14.9 % to 21.1 %,
plasticity index 0.8 % to 13.2 % and the moisture content
ranges from 0.5 % to 34.8 % in Zone 5. While in Zone 6 the
liquid limits ranges from 18.1 % to 32.2 %, plastic limit
from 15.1 % to 21.2 %, plasticity index 0.6 % to 14.1 % and
the moisture content ranges from 1.5 % to 52.5 %.
Generally, Coarse - grained soils (gravels etc) are not very
sensitive to moisture change, whereas fine - grained soils
(clays etc) are sensitive to moisture changes. Cohesionless
soils have plasticity index, theoretically, is zero.
5.3 Shear Strength Characteristics
Direct shear test is employed for determining the shear
strength parameters, cohesion or inter-particle attraction (c)
and the angle of internal friction (ϕ). The results revealed
that the cohesion (c) in Zone 5 ranges from 454.1 to 1209.47
PCF while in Zone 6 ranges from 445 to 1427 PCF. The
internal friction angle (ϕ) in Zone 5 varies from 11.3° to
40.8° while in Zone 6 its varies from 22° to 33.7°. Owing to
the increasing amounts of the fines-sized particles, such as
clay, the cohesion of soil increases [5]. Shear strength
characteristics of the fine grained soils are influenced greatly by moisture content variations.
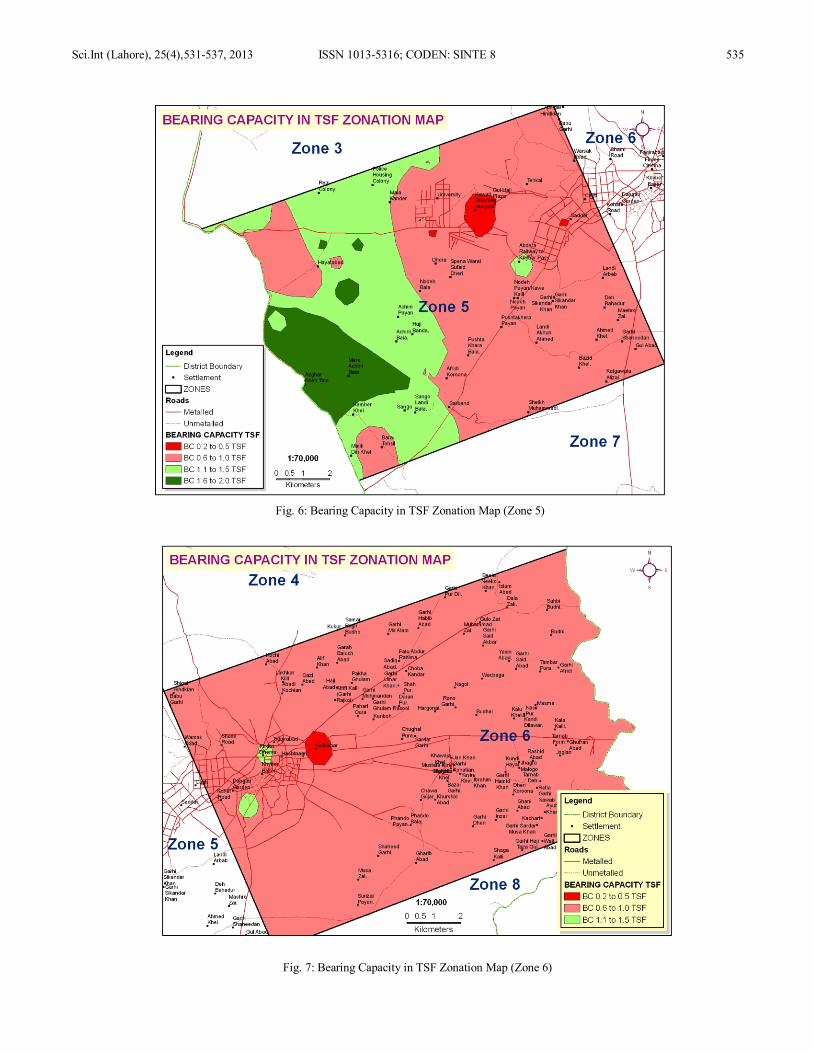
5.4 Bearing Capacity
The load – carrying capacity of the foundation soil and rock
Fig. 1: Land Cover Map of Peshawar District with
Study Area Zones.
Sci.Int (Lahore), 25(4),531-537, 2013 ISSN 1013-5316; CODEN: SINTE 8 533
without causing intolerable settlement of the structure is
called bearing capacity [6]. Tolerable settlement would not
affect the function or structural integrity of the structure and
is commonly set is about 1 inch. The highest value of the
safe bearing capacity was 2 TSF at depth 0.91 m (3 ft) and
width 3 ft in Hayatabad for an estimated settlement of 1 in recoded due to the poorly graded gravels and clayey gravels
(GP & GC) that reveals the increasing trend of angle of
internal friction resulting increase in bearing capacity of the
soil in Zone 5. In Zone 6 the minimum value of safe bearing
capacity at depth 0.91 m (3 ft) and width 3 ft for an
estimated settlement of 1 in was 0.2 TSF (Fig. 6-7).
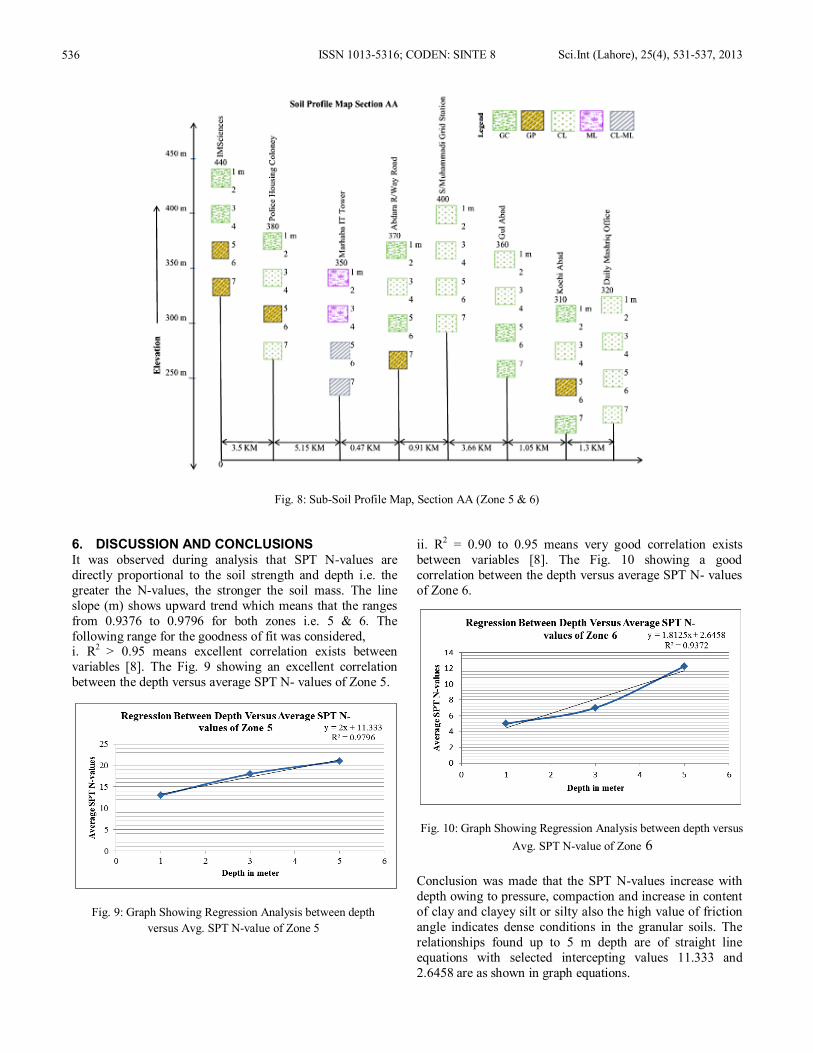
5.5 Sub-Soil Profile Soil profile is a vertical cross section of the actual soil strata
at a given site showing sequence and thickness of soil layers
below the natural surface level [7]. The sub-soil profile
section AA covers the area from Hayatabad to Gulbahar in
Peshawar. The sub-soil profile clearly indicates the presence of surface stratum of gravels and silts in Zone 5 while in
Zone 6 the coarse grained soils i.e. gravels are overlaying
over clay (Fig. 8). Ground water table was not encountered
to the exploration depth of 7 m in the sub-soil profile map.
Fig. 2: Geotechnical Zonation Map (GZM) at Depth 1 m (Zone 5)
Fig. 3: Geotechnical Zonation Map (GZM) at Depth 3 m (Zone 5)
ISSN 1013-5316; CODEN: SINTE 8 Sci.Int (Lahore), 25(4), 531-537, 2013 534
Fig . 5:
Geotechnical Zonation Map (GZM) at Depth 3 m (Zone 6)
Fig. 4: Geotechnical Zonation Map (GZM) at Depth 1 m (Zone 6)
Sci.Int (Lahore), 25(4),531-537, 2013 ISSN 1013-5316; CODEN: SINTE 8 535
Fig. 6: Bearing Capacity in TSF Zonation Map (Zone 5)
Fig. 7: Bearing Capacity in TSF Zonation Map (Zone 6)
ISSN 1013-5316; CODEN: SINTE 8 Sci.Int (Lahore), 25(4), 531-537, 2013 536
Fig. 8: Sub-Soil Profile Map, Section AA (Zone 5 & 6)
6. DISCUSSION AND CONCLUSIONS It was observed during analysis that SPT N-values are
directly proportional to the soil strength and depth i.e. the
greater the N-values, the stronger the soil mass. The line
slope (m) shows upward trend which means that the ranges
from 0.9376 to 0.9796 for both zones i.e. 5 & 6. The
following range for the goodness of fit was considered, i. R2 > 0.95 means excellent correlation exists between
variables [8]. The Fig. 9 showing an excellent correlation
between the depth versus average SPT N- values of Zone 5.
ii. R2 = 0.90 to 0.95 means very good correlation exists
between variables [8]. The Fig. 10 showing a good
correlation between the depth versus average SPT N- values
of Zone 6.
Conclusion was made that the SPT N-values increase with
depth owing to pressure, compaction and increase in content
of clay and clayey silt or silty also the high value of friction
angle indicates dense conditions in the granular soils. The
relationships found up to 5 m depth are of straight line
equations with selected intercepting values 11.333 and
2.6458 are as shown in graph equations.
Fig. 9: Graph Showing Regression Analysis between depth
versus Avg. SPT N-value of Zone 5
Fig. 10: Graph Showing Regression Analysis between depth versus
Avg. SPT N-value of Zone 6
Sci.Int (Lahore), 25(4),531-537, 2013 ISSN 1013-5316; CODEN: SINTE 8 537
This research collates the available one hundred and three
geotechnical sub-soil SPT reports of Peshawar urban
settlements. The standard penetration N-values is an index
which is directly proportional to the soil strength. The work
will assist as a ready reference guide for practicing
geotechnical Engineers and Researchers in Peshawar. This is valuable in the aspect that, it will reduce considerably the
initial costs of new proposed projects which is to initiate in
areas covered in this paper.
7. REFERENCES
[1] Suwanwiwattana, P., Chantawarangul, K.,
Mairaing, W., & Apaphant, P., “The development of geotechnical database of Bangkok subsoil using
GRASS-GIS,” 2001, November, pp. 5-9.
[2] Hayat, K., 2003, “Geotechnical zonation and their
relation to geology of Pakistan”, Ph.D. Thesis,
University of the Punjab, Pakistan.
[3] Aslam, M., Hussain, A., Ashraf, M. & Afridi, A. G. K., 2006, Geological Map of North West
Frontier Province, Geological Survey of Pakistan.
[4] Aguib, A., 2005, “GIS application for constructing
knowledge base and representing 3d geotechnical
data”, Proceedings of 11th International Colloquium on Structural and Geotechnical
Engineering, Ain Shams University, Egypt.
[5] Jumikis, A. R., Soil Mechanics, Neeraj, Galgotia,
New Delhi, p. 33.
[6] Chandra, K. U., Soil mechanics and Foundation
Engineering, PHI learning private limited, New
Delhi, P. 138.
[7] Jumikis, A. R., Soil Mechanics, Neeraj, Galgotia,
New Delhi, p. 32.
[8] Hoffmann, J. P., Beacom, K. & Cooper, A.,
“Linear Regression Analysis : Assumptions and
Applications.”