Embed Size (px)
Citation preview
Profiling South African middle-class households,
1998–2006
Report No. 03-03-01
Statistics South Africa
Pali Lehohla Statistician-General
Statistics South Africa
Profiling South African middle-class households,1998–2006 (Report No. 03-03-01)
i Profiling South African middle-class households, 1998–2006
Published by Statistics South Africa, Private Bag X44, Pretoria 0001
© Statistics South Africa, 2009Users may apply or process this data, provided Statistics South Africa (Stats SA) isacknowledged as the original source of the data; that it is specified that the application and/or analysis is th e result of the user's independent processing of the data; and that neither the basic data nor any reprocessed version or application thereof may be sold or offered for sale in any form whatsoever without prior permission from Stats SA.
Profiling South African middle-class households, 1998–2006, Statistics South Africa, Pretoria, 2009.
[Report no 03-03-01 (2009)]ISBN 978-0-621-39028-8
A complete set of Stats SA publications is available at Stats SA Library and the following libraries:National Library of South Africa, Pretoria DivisionNational Library of South Africa, Cape Town DivisionLibrary of Parliament, Cape TownBloemfontein Public LibraryNatal Society Library, PietermaritzburgJohannesburg Public LibraryEastern Cape Library Services, King William’s TownCentral Regional Library, PolokwaneCentral Reference Library, NelspruitCentral Reference Collection, KimberleyCentral Reference Library, Mmabatho
This report is available on the Stats SA website: www.statssa.gov.za
Copies are obtainable from: Printing and Distribution, Statistics South AfricaTel: (012) 310 8044 (Free publications)Tel: (012) 310 8619 / 310 8358Email: [email protected] / [email protected]: (012) 321 7381
Statistics South Africa
Profiling South African middle-class households,1998–2006 (Report No. 03-03-01)
ii
CONTENTS Executive Summary ................................ ................................ ................................ ................................ .......................... 11. Introduction................................ ................................ ................................ ................................ ........................... 22. Data Sources ................................ ................................ ................................ ................................ ........................ 33. Characteristics of a Middle-class Standard of Living ................................ ................................ ................... 3
3.1 Households with Various Components of a Middle-class Standard of Living ................................ ................... 3
4. Projections of Households with a Middle-class Standard of Living................................ ........................... 95. Education and Occupation of Young Adults (Aged 25-39) in Households with Middle-class
(SOL) ................................ ................................ ................................ ................................ ................................ .... 12
5.1 Educational Distribution of Young Adults................................ ................................ ................................ ........... 12
5.2 Occupation – Professional and Managerial Jobs................................ ................................ .............................. 14
5.2.1 The chance that Whites and Africans hold a professional or managerial job................................ .................. 145.2.2 Education and Occupation-Standardisation................................ ................................ ................................ ....... 175.2.3 Possible causes of differences in returns to education between Whites and Africans................................ ... 195.2.4 Examination of managerial and professional jobs separately................................ ................................ .......... 216. Concluding Remarks................................ ................................ ................................ ................................ ......... 26References................................ ................................ ................................ ................................ ................................ ........ 27Appendix 1: Decision not to use the data from the 1995-1997 October Household Surveys for most
purposes................................ ................................ ................................ ................................ ..................... 30
Appendix 2: Projection of the number of all households and of the number of households with a middle-classstandard of living................................ ................................ ................................ ................................ ........ 30
Appendix 3: Coding of education categories................................ ................................ ................................ ................ 31
LIST OF TABLES Table 1: Definition of a middle-class standard of living................................ ................................ .......................... 3
Table 2: Calculation of percentage with professional or managerial jobs: e.g. Whites 2004-2006........................ 17
Table 3: Difference between Africans and Whites in occupational category due to differences in returns to education ................................ ................................ ................................ ................................ ............. 24
Table A1: Percentage of households by population group with a middle-class standard of living........................... 31
Table A1: Percentage distribution of all households with a middle-class standard of living by population group..... 31
Statistics South Africa
Profiling South African middle-class households,1998–2006 (Report No. 03-03-01)
iii
LIST OF FIGURES
Figure 1: Percentage residing in formal housing................................ ................................ ................................ . 4
Figure 2: Households with a landline in dwelling or a cell phone................................ ................................ ......... 5
Figure 3: Households with electricity as the main lighting source................................ ................................ ........ 5
Figure 4: Households with electricity or gas as main cooking source................................ ................................ .. 6
Figure 5: Households with water tap in dwelling ................................ ................................ ................................ . 6
Figure 6: Households with flush toilet in dwelling................................ ................................ ................................ 7
Figure 7: Households with middle-class standard of living ................................ ................................ .................. 8
Figure 8: The distribution of households by population group within middle-class SOL 1998 and 2006 ............... 8
Figure 9: Households with a middle-class SOL with monthly expenditure greater than R2 500 and R5 000, 2006................................ ................................ ................................ ................................ .................... 9
Figure 10: Projected percentage of households with a middle-class SOL................................ ............................ 10
Figure 11: Projected number of households with a middle-class standard of living................................ .............. 11
Figure 12: The distribution of all households with a middle-class (SOL) across population groups...................... 11
Figure 13: Educational distribution of young adults in households with a middle-class SOL by population group, 1998-2000................................ ................................ ................................ .............................. 13
Figure 14: Educational distribution of young adults in households with a middle-class SOL by population group, 2001-2003................................ ................................ ................................ .............................. 13
Figure 15: Educational distribution of young adults in households with a middle-class SOL by population group, 2004-2006................................ ................................ ................................ .............................. 14
Figure 16: Whites and of Africans with professional or managerial jobs, 1998-2000, 2001-2003 and 2004-2006................................ ................................ ................................ ................................ .................. 15
Figure 17: Whites and of Africans with professional or managerial jobs by educational attainment (returns to education), 1998-2000................................ ................................ ................................ ....................... 16
Figure 18: Whites and of Africans with professional or managerial jobs by educational attainment 2001-2003 .... 17
Figure 19: Whites and of Africans with professional or managerial jobs by educational attainment 2004-2006 .... 17
Figure 20: Whites and Africans with professional or managerial jobs: actual, educational distributions and returns to education 1998-2000 to 2004-2006................................ ................................ .................... 18
Figure 21: White and African with managerial jobs: 1998-2000 to 2004-2006 ................................ ..................... 22
Figure 22: White and African with professional jobs, 1998-2000 to 2004-2006................................ .................... 22
Figure 23: White and African with managerial jobs by educational attainment 2004-2006 ................................ ... 23
Figure 24: Whites and Africans with professional jobs by educational attainment 2004-2006 .............................. 24
Statistics South Africa
Profiling South African middle-class households,1998–2006 (Report No. 03-03-01)
1
Executive Summary1
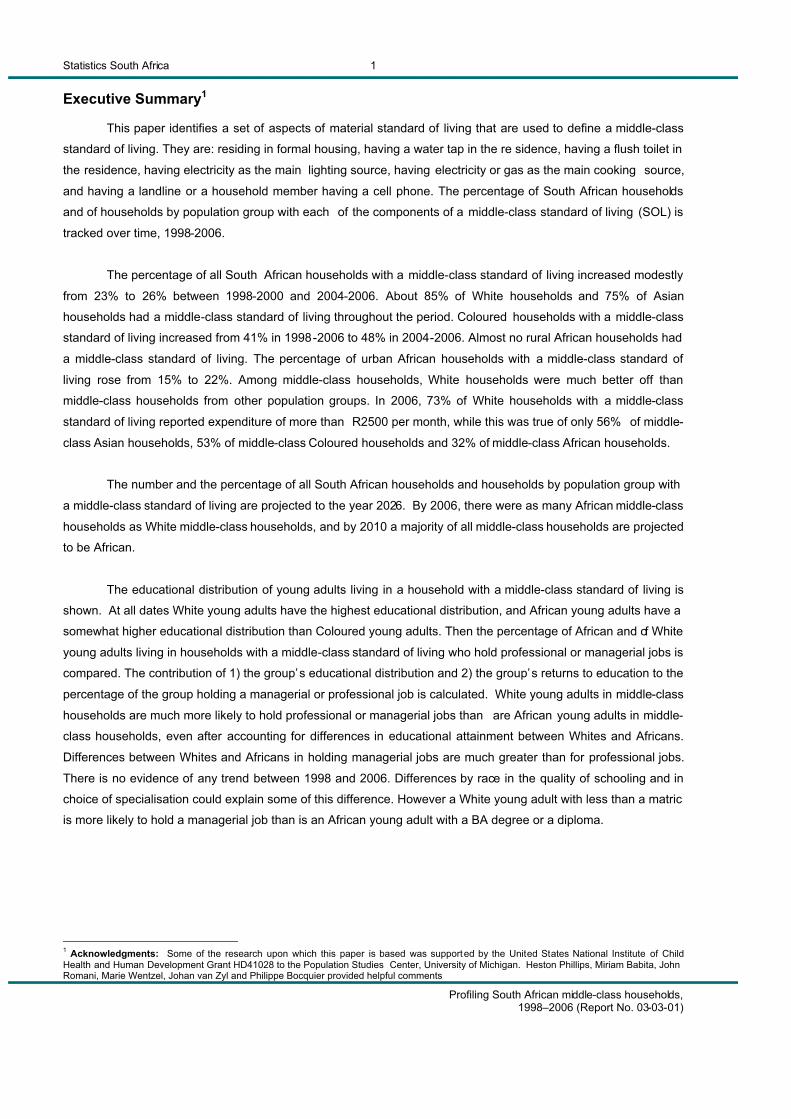
This paper identifies a set of aspects of material standard of living that are used to define a middle-class
standard of living. They are: residing in formal housing, having a water tap in the re sidence, having a flush toilet in
the residence, having electricity as the main lighting source, having electricity or gas as the main cooking source,
and having a landline or a household member having a cell phone. The percentage of South African households
and of households by population group with each of the components of a middle-class standard of living (SOL) is
tracked over time, 1998-2006.
The percentage of all South African households with a middle-class standard of living increased modestly
from 23% to 26% between 1998-2000 and 2004-2006. About 85% of White households and 75% of Asian
households had a middle-class standard of living throughout the period. Coloured households with a middle-class
standard of living increased from 41% in 1998-2006 to 48% in 2004-2006. Almost no rural African households had
a middle-class standard of living. The percentage of urban African households with a middle-class standard of
living rose from 15% to 22%. Among middle-class households, White households were much better off than
middle-class households from other population groups. In 2006, 73% of White households with a middle-class
standard of living reported expenditure of more than R2500 per month, while this was true of only 56% of middle-
class Asian households, 53% of middle-class Coloured households and 32% of middle-class African households.
The number and the percentage of all South African households and households by population group with
a middle-class standard of living are projected to the year 2026. By 2006, there were as many African middle-class
households as White middle-class households, and by 2010 a majority of all middle-class households are projected
to be African.
The educational distribution of young adults living in a household with a middle-class standard of living is
shown. At all dates White young adults have the highest educational distribution, and African young adults have a
somewhat higher educational distribution than Coloured young adults. Then the percentage of African and of White
young adults living in households with a middle-class standard of living who hold professional or managerial jobs is
compared. The contribution of 1) the group’s educational distribution and 2) the group’s returns to education to the
percentage of the group holding a managerial or professional job is calculated. White young adults in middle-class
households are much more likely to hold professional or managerial jobs than are African young adults in middle-
class households, even after accounting for differences in educational attainment between Whites and Africans.
Differences between Whites and Africans in holding managerial jobs are much greater than for professional jobs.
There is no evidence of any trend between 1998 and 2006. Differences by race in the quality of schooling and in
choice of specialisation could explain some of this difference. However a White young adult with less than a matric
is more likely to hold a managerial job than is an African young adult with a BA degree or a diploma.
1 Acknowledgments: Some of the research upon which this paper is based was supported by the United States National Institute of Child Health and Human Development Grant HD41028 to the Population Studies Center, University of Michigan. Heston Phillips, Miriam Babita, John Romani, Marie Wentzel, Johan van Zyl and Philippe Bocquier provided helpful comments
Statistics South Africa
Profiling South African middle-class households,1998–2006 (Report No. 03-03-01)
2
1. Introduction
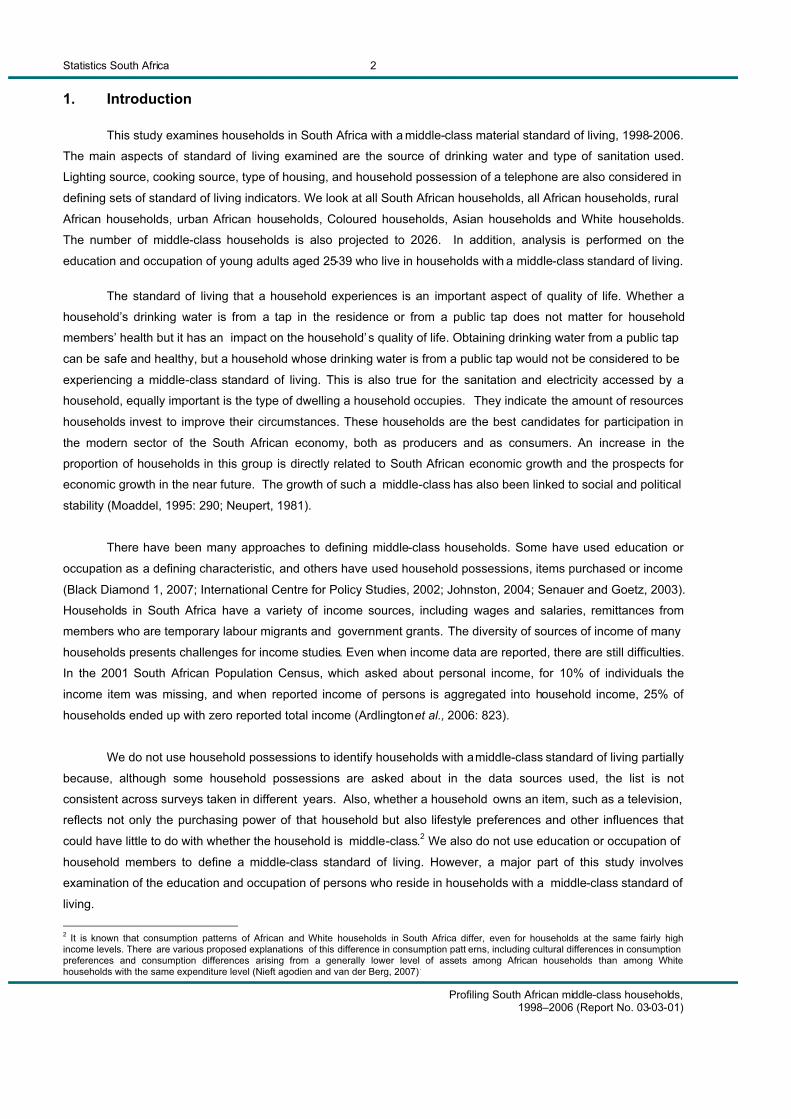
This study examines households in South Africa with a middle-class material standard of living, 1998-2006.
The main aspects of standard of living examined are the source of drinking water and type of sanitation used.
Lighting source, cooking source, type of housing, and household possession of a telephone are also considered in
defining sets of standard of living indicators. We look at all South African households, all African households, rural
African households, urban African households, Coloured households, Asian households and White households.
The number of middle-class households is also projected to 2026. In addition, analysis is performed on the
education and occupation of young adults aged 25-39 who live in households with a middle-class standard of living.
The standard of living that a household experiences is an important aspect of quality of life. Whether a
household’s drinking water is from a tap in the residence or from a public tap does not matter for household
members’ health but it has an impact on the household’s quality of life. Obtaining drinking water from a public tap
can be safe and healthy, but a household whose drinking water is from a public tap would not be considered to be
experiencing a middle-class standard of living. This is also true for the sanitation and electricity accessed by a
household, equally important is the type of dwelling a household occupies. They indicate the amount of resources
households invest to improve their circumstances. These households are the best candidates for participation in
the modern sector of the South African economy, both as producers and as consumers. An increase in the
proportion of households in this group is directly related to South African economic growth and the prospects for
economic growth in the near future. The growth of such a middle-class has also been linked to social and political
stability (Moaddel, 1995: 290; Neupert, 1981).
There have been many approaches to defining middle-class households. Some have used education or
occupation as a defining characteristic, and others have used household possessions, items purchased or income
(Black Diamond 1, 2007; International Centre for Policy Studies, 2002; Johnston, 2004; Senauer and Goetz, 2003).
Households in South Africa have a variety of income sources, including wages and salaries, remittances from
members who are temporary labour migrants and government grants. The diversity of sources of income of many
households presents challenges for income studies. Even when income data are reported, there are still difficulties.
In the 2001 South African Population Census, which asked about personal income, for 10% of individuals the
income item was missing, and when reported income of persons is aggregated into household income, 25% of
households ended up with zero reported total income (Ardlington et al., 2006: 823).
We do not use household possessions to identify households with a middle-class standard of living partially
because, although some household possessions are asked about in the data sources used, the list is not
consistent across surveys taken in different years. Also, whether a household owns an item, such as a television,
reflects not only the purchasing power of that household but also lifestyle preferences and other influences that
could have little to do with whether the household is middle-class.2 We also do not use education or occupation of
household members to define a middle-class standard of living. However, a major part of this study involves
examination of the education and occupation of persons who reside in households with a middle-class standard of
living.
2 It is known that consumption patterns of African and White households in South Africa differ, even for households at the same fairly high income levels. There are various proposed explanations of this difference in consumption patt erns, including cultural differences in consumption preferences and consumption differences arising from a generally lower level of assets among African households than among White households with the same expenditure level (Nieft agodien and van der Berg, 2007).
Statistics South Africa
Profiling South African middle-class households,1998–2006 (Report No. 03-03-01)
3
Although there is no general agreement about what the criteria should be for defining a household as
middle-class (Johnston, 2004), all of the definitions aim at identifying households with secure living conditions
without serious concerns about shelter, water and sanitation, and further identifying households that have the
potential to contribute to economic growth and participate in modern markets. Our definition of the middle-class,
using standard of living indicators, incorporates aspects of secure and desirable living circumstances.
2. Data Sources
Our analysis is based on the 1998-1999 October Household Surveys, the 2000-2001 Labour Force
Surveys and the 2002-2006 General Household Surveys. These are national representative surveys covering
18,000-30,000 households.
These surveys collected data that refer to persons within each household as well as characteristics of
entire households. The definition of whether a household has a middle-class standard of living is based on data
that refer to a household as a whole, such as the household’s main source of drinking water. However, we also
examine the characteristics of young adults (aged 25-39) residing in households with a middle-class standard of
living.
3. Characteristics of a Middle-class Standard of Living
Table 1 shows the characteristics that a household needs to have for it to be classified as having a middle-
class standard of living.3
Table 1: Definition of a middle-class standard of living Lives in formal housingWater tap in dwellingFlush toilet in dwellingElectricity is main light sourceElectricity or gas is main cooking sourceHas a landline phone or a household member has a cell phone
3.1 Households with Various Components of a Middle-class Standard of Living
Figures 1-6 show the percentage of all South African households and the percentage of households for
each of the main population groups that had the attributes associated with a middle-class standard of living listed in
Table 1. In order to have a middle-class standard of living, a household needed to have all of the listed
components simultaneously.
As we shall see later in the analysis, almost no rural African households had a middle-class standard of
living. Also, in 2006, over 90% of White, Asian, and Coloured households resided in urban areas, while only 57% of
African households resided in urban areas. Thus, results in this section are shown for urban African and rural
African households as well as for all African households.
3 For more discussion and analysis of the definition of middle-class standard of living used in this study see Anderson and Nhlapo (2009).
Statistics South Africa
Profiling South African middle-class households,1998–2006 (Report No. 03-03-01)
4
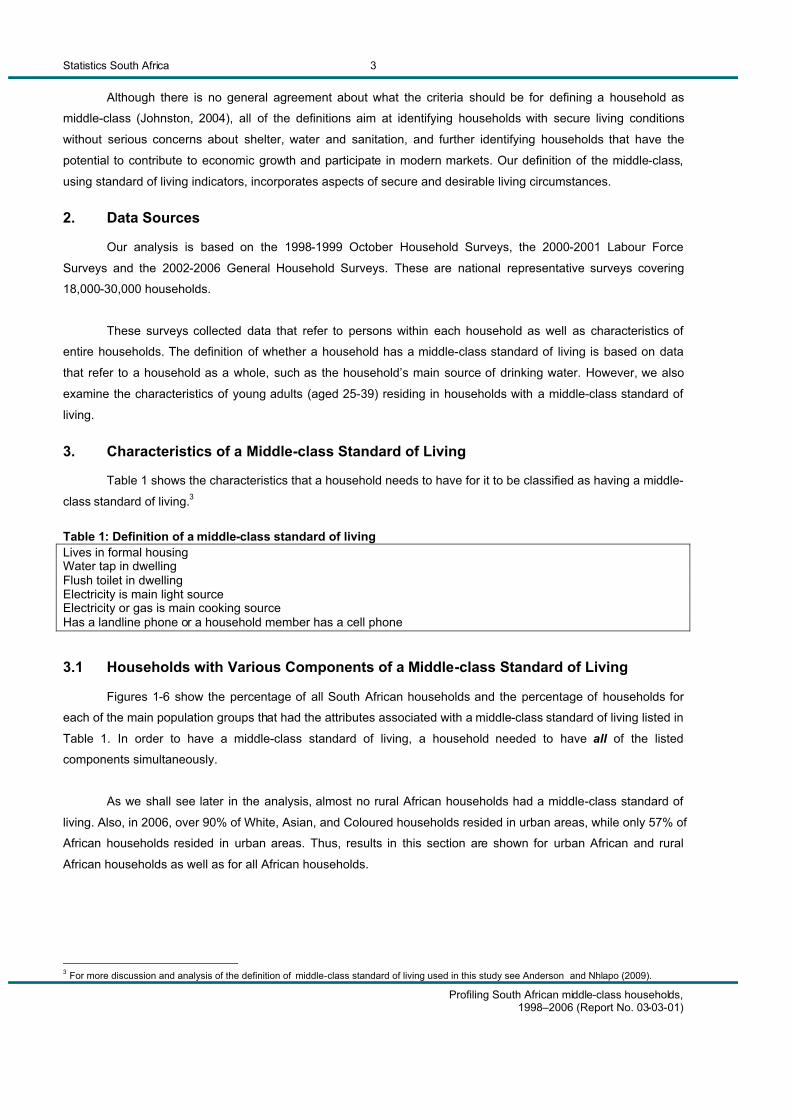
Figure 1 shows the percentage of households residing in formal housing over time. A household is
considered to reside in formal housing if it lives in any of the following types of dwelling: in a formal structure on a
separate stand, in a flat in a block of flats, in a townhouse or semi-detached house. In some surveys living in a unit
in a retirement village was listed as a separate category. When a retirement unit was listed as an option, it also was
considered to be formal housing. In every year White and Asian households have the highest percentage in formal
housing, followed by Coloured households, with a lower percent for African households.
Figure 1: Percentage residing in formal housing
There was little change over time for any group in the percentage residing in formal housing. Thus,
although residence in formal housing is a reasonable component of a middle-class standard of living, there were no
changes in this characteristic which would have pushed the percentage of households with a middle-class standard
of living up or down.
Statistics South Africa
Profiling South African middle-class households,1998–2006 (Report No. 03-03-01)
5
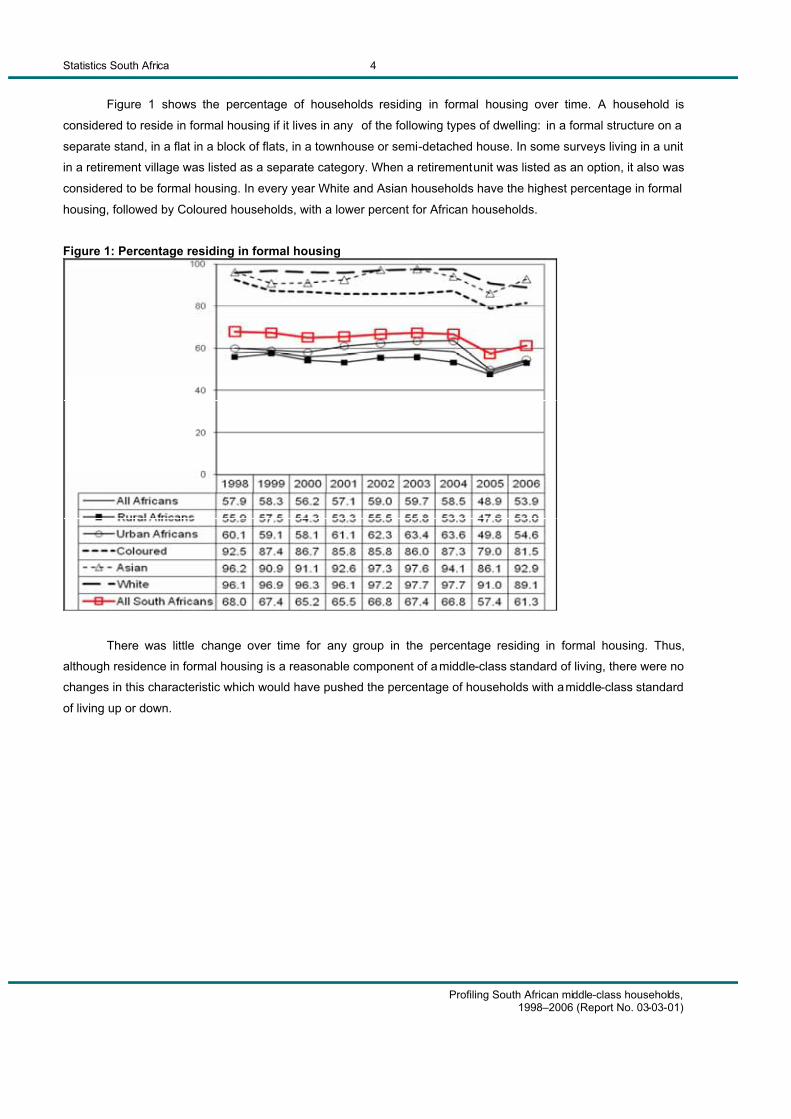
Figure 2: Households with a landline in dwelling or a cell phone
Figure 2 shows the percentage of households which had a landline phone or in which a household member
had a cellphone. For every group, except Asian households, there was a substantial increase over time. This
increase was especially large for Coloured households and even larger for African households.
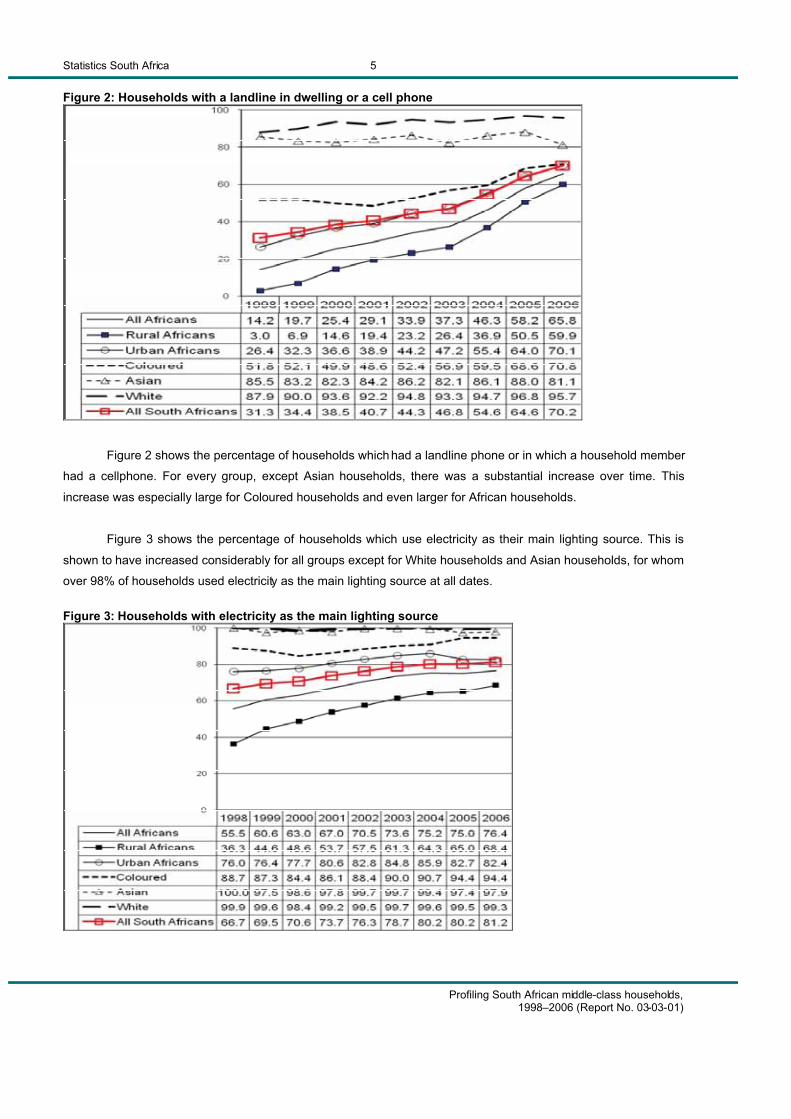
Figure 3 shows the percentage of households which use electricity as their main lighting source. This is
shown to have increased considerably for all groups except for White households and Asian households, for whom
over 98% of households used electricity as the main lighting source at all dates.
Figure 3: Households with electricity as the main lighting source
Statistics South Africa
Profiling South African middle-class households,1998–2006 (Report No. 03-03-01)
6
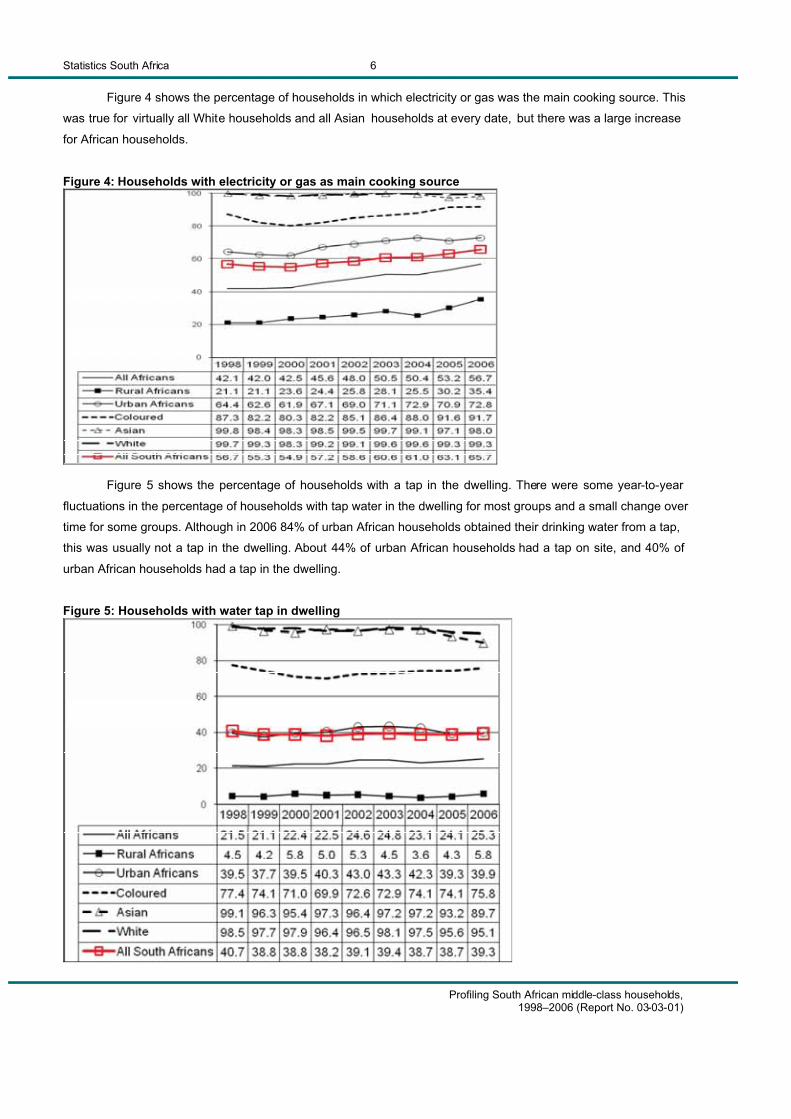
Figure 4 shows the percentage of households in which electricity or gas was the main cooking source. This
was true for virtually all White households and all Asian households at every date, but there was a large increase
for African households.
Figure 4: Households with electricity or gas as main cooking source
Figure 5 shows the percentage of households with a tap in the dwelling. There were some year-to-year
fluctuations in the percentage of households with tap water in the dwelling for most groups and a small change over
time for some groups. Although in 2006 84% of urban African households obtained their drinking water from a tap,
this was usually not a tap in the dwelling. About 44% of urban African households had a tap on site, and 40% of
urban African households had a tap in the dwelling.
Figure 5: Households with water tap in dwelling
Statistics South Africa
Profiling South African middle-class households,1998–2006 (Report No. 03-03-01)
7
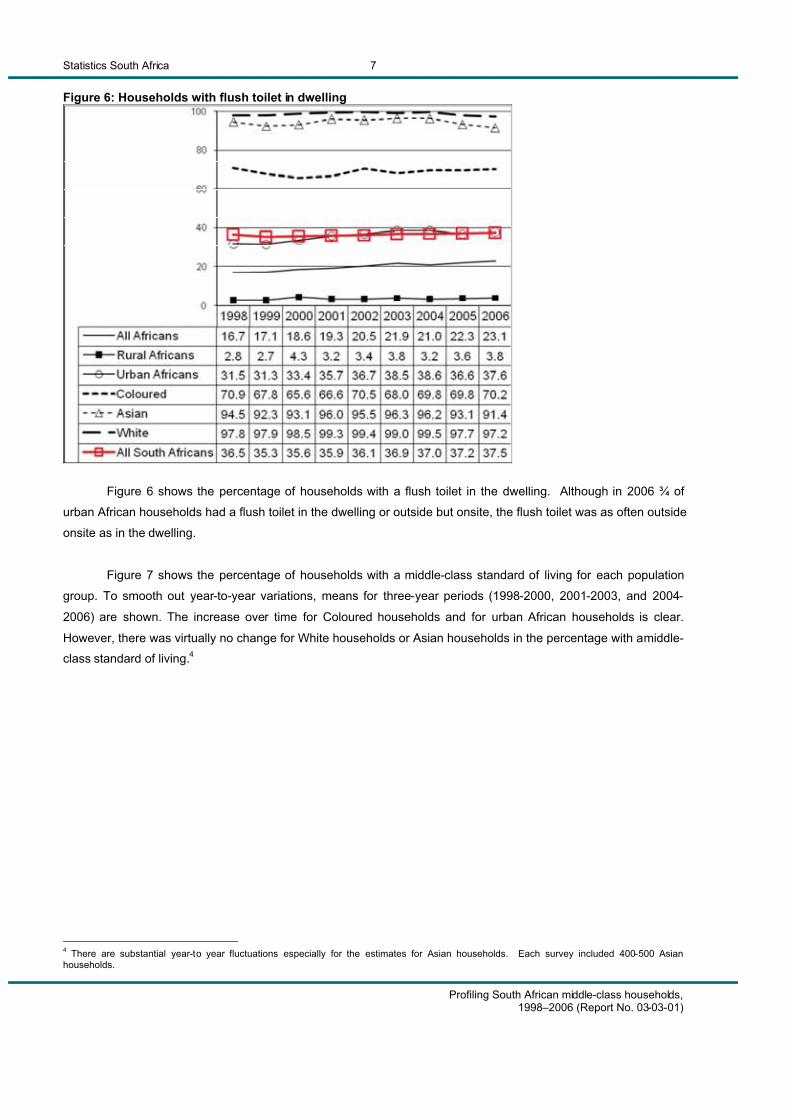
Figure 6: Households with flush toilet in dwelling
Figure 6 shows the percentage of households with a flush toilet in the dwelling. Although in 2006 ¾ of
urban African households had a flush toilet in the dwelling or outside but onsite, the flush toilet was as often outside
onsite as in the dwelling.
Figure 7 shows the percentage of households with a middle-class standard of living for each population
group. To smooth out year-to-year variations, means for three-year periods (1998-2000, 2001-2003, and 2004-
2006) are shown. The increase over time for Coloured households and for urban African households is clear.
However, there was virtually no change for White households or Asian households in the percentage with a middle-
class standard of living.4
4 There are substantial year-to year fluctuations especially for the estimates for Asian households. Each survey included 400-500 Asian households.
Statistics South Africa
Profiling South African middle-class households,1998–2006 (Report No. 03-03-01)
8
0
20
40
60
80
100
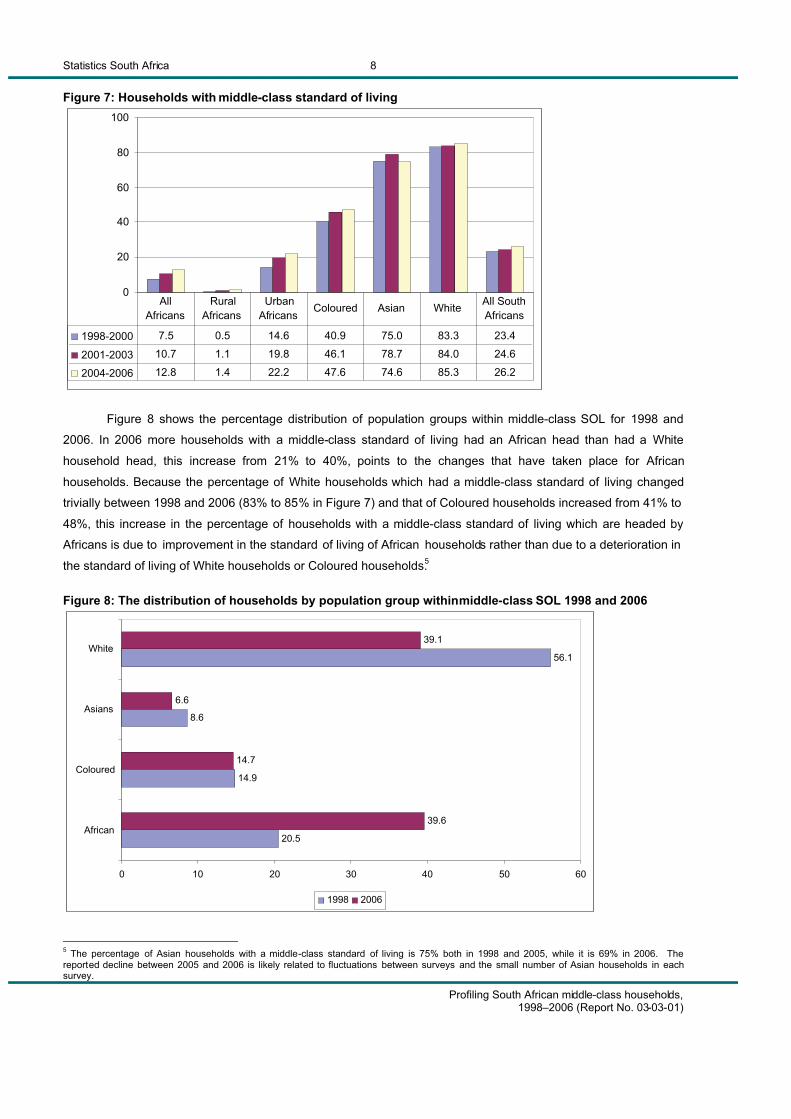
1998-2000 7.5 0.5 14.6 40.9 75.0 83.3 23.4
2001-2003 10.7 1.1 19.8 46.1 78.7 84.0 24.6
2004-2006 12.8 1.4 22.2 47.6 74.6 85.3 26.2
AllAfricans
RuralAfricans
UrbanAfricans
Coloured Asian White All South Africans
Figure 7: Households with middle-class standard of living
Figure 8 shows the percentage distribution of population groups within middle-class SOL for 1998 and
2006. In 2006 more households with a middle-class standard of living had an African head than had a White
household head, this increase from 21% to 40%, points to the changes that have taken place for African
households. Because the percentage of White households which had a middle-class standard of living changed
trivially between 1998 and 2006 (83% to 85% in Figure 7) and that of Coloured households increased from 41% to
48%, this increase in the percentage of households with a middle-class standard of living which are headed by
Africans is due to improvement in the standard of living of African households rather than due to a deterioration in
the standard of living of White households or Coloured households.5
Figure 8: The distribution of households by population group within middle-class SOL 1998 and 2006
20.5
14.9
8.6
56.1
39.6
14.7
6.6
39.1
0 10 20 30 40 50 60
African
Coloured
Asians
White
1998 2006
5 The percentage of Asian households with a middle-class standard of living is 75% both in 1998 and 2005, while it is 69% in 2006. The reported decline between 2005 and 2006 is likely related to fluctuations between surveys and the small number of Asian households in each survey.
Statistics South Africa
Profiling South African middle-class households,1998–2006 (Report No. 03-03-01)
9
Despite the increase in the percentage of u rban African households with a middle-class standard of living
(SOL) shown in Figures 7 and 8, not all middle-class households experience the same economic situation. Figure 9
shows the percentage of middle-class households for whom in 2006 the monthly household expenditures exceeded
R2 500 and the percentage whose monthly household expenditure exceeded R5 000 in 2006.6 This is not shown
for rural Africans, for whom less than 2% of households had a middle-class standard of living in 2006, virtually all
middle-class African households are in the urban areas.
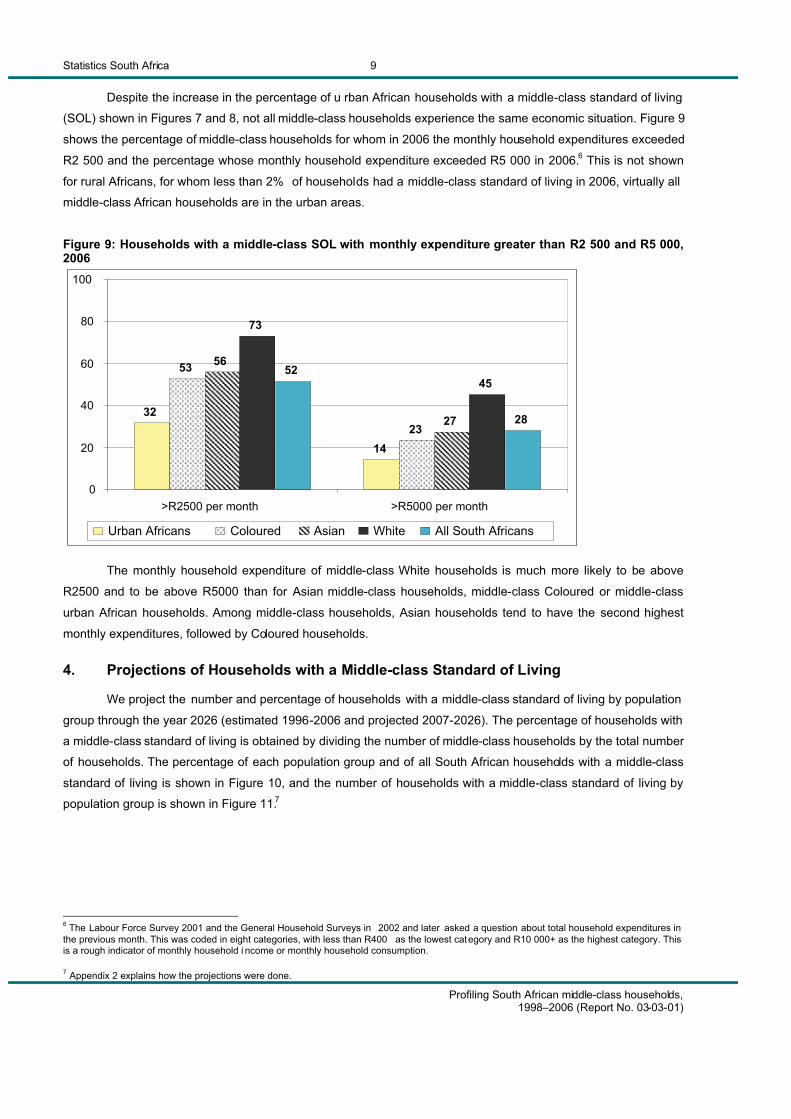
Figure 9: Households with a middle-class SOL with monthly expenditure greater than R2 500 and R5 000, 2006
32
14
53
23
56
27
73
4552
28
0
20
40
60
80
100
>R2500 per month >R5000 per month
Urban Africans Coloured Asian White All South Africans
The monthly household expenditure of middle-class White households is much more likely to be above
R2500 and to be above R5000 than for Asian middle-class households, middle-class Coloured or middle-class
urban African households. Among middle-class households, Asian households tend to have the second highest
monthly expenditures, followed by Coloured households.
4. Projections of Households with a Middle-class Standard of Living
We project the number and percentage of households with a middle-class standard of living by population
group through the year 2026 (estimated 1996-2006 and projected 2007-2026). The percentage of households with
a middle-class standard of living is obtained by dividing the number of middle-class households by the total number
of households. The percentage of each population group and of all South African households with a middle-class
standard of living is shown in Figure 10, and the number of households with a middle-class standard of living by
population group is shown in Figure 11.7
6 The Labour Force Survey 2001 and the General Household Surveys in 2002 and later asked a question about total household expenditures in the previous month. This was coded in eight categories, with less than R400 as the lowest category and R10 000+ as the highest category. This is a rough indicator of monthly household i ncome or monthly household consumption.
7 Appendix 2 explains how the projections were done.
Statistics South Africa
Profiling South African middle-class households,1998–2006 (Report No. 03-03-01)
10
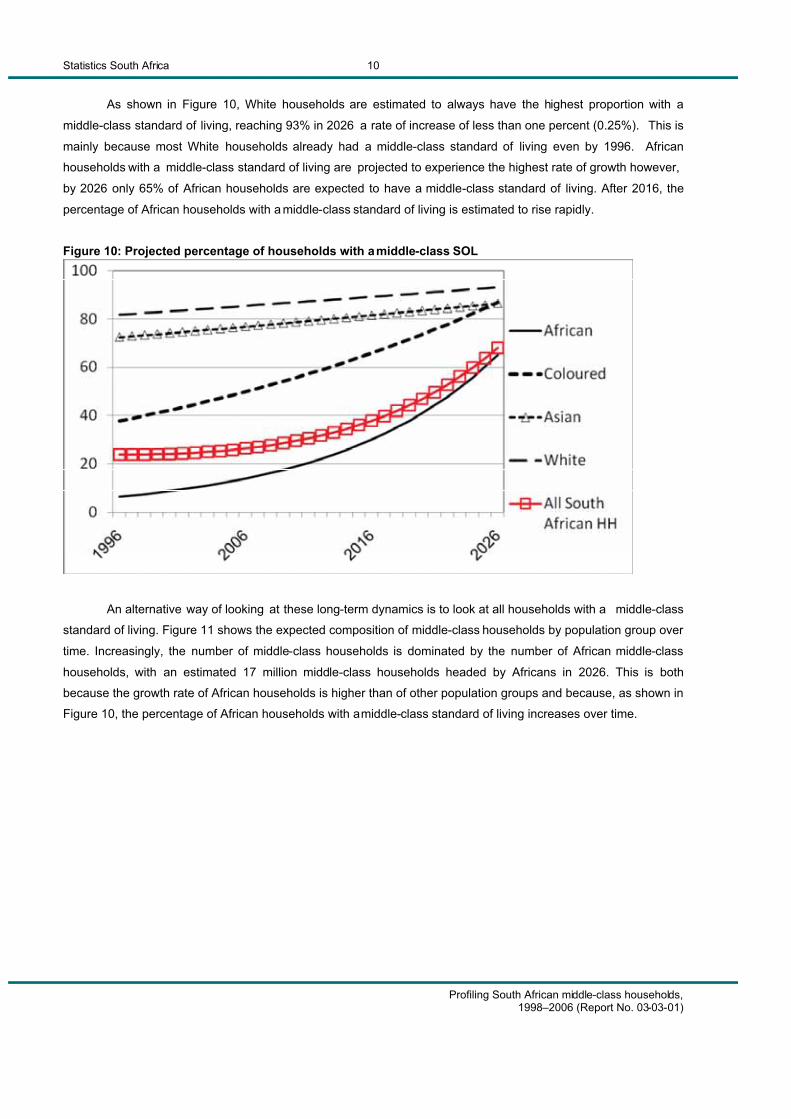
As shown in Figure 10, White households are estimated to always have the highest proportion with a
middle-class standard of living, reaching 93% in 2026 a rate of increase of less than one percent (0.25%). This is
mainly because most White households already had a middle-class standard of living even by 1996. African
households with a middle-class standard of living are projected to experience the highest rate of growth however,
by 2026 only 65% of African households are expected to have a middle-class standard of living. After 2016, the
percentage of African households with a middle-class standard of living is estimated to rise rapidly.
Figure 10: Projected percentage of households with a middle-class SOL
An alternative way of looking at these long-term dynamics is to look at all households with a middle-class
standard of living. Figure 11 shows the expected composition of middle-class households by population group over
time. Increasingly, the number of middle-class households is dominated by the number of African middle-class
households, with an estimated 17 million middle-class households headed by Africans in 2026. This is both
because the growth rate of African households is higher than of other population groups and because, as shown in
Figure 10, the percentage of African households with a middle-class standard of living increases over time.
Statistics South Africa
Profiling South African middle-class households,1998–2006 (Report No. 03-03-01)
11
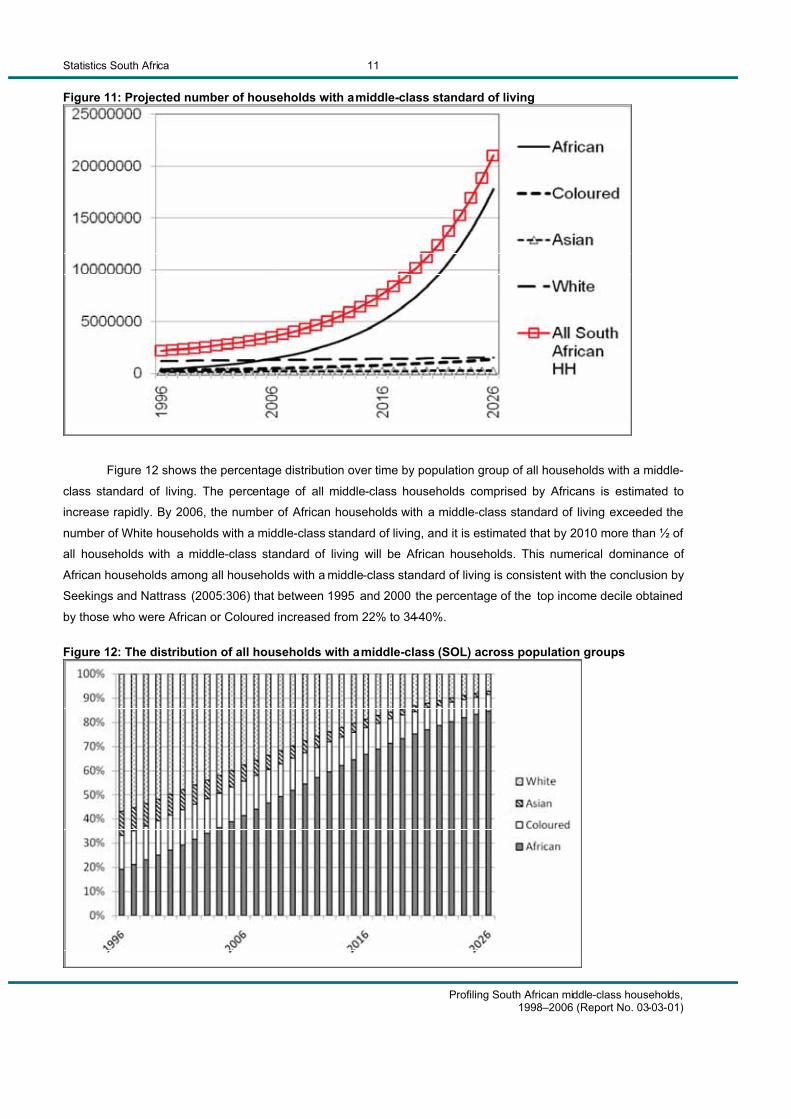
Figure 11: Projected number of households with a middle-class standard of living
Figure 12 shows the percentage distribution over time by population group of all households with a middle-
class standard of living. The percentage of all middle-class households comprised by Africans is estimated to
increase rapidly. By 2006, the number of African households with a middle-class standard of living exceeded the
number of White households with a middle-class standard of living, and it is estimated that by 2010 more than ½ of
all households with a middle-class standard of living will be African households. This numerical dominance of
African households among all households with a middle-class standard of living is consistent with the conclusion by
Seekings and Nattrass (2005:306) that between 1995 and 2000 the percentage of the top income decile obtained
by those who were African or Coloured increased from 22% to 34-40%.
Figure 12: The distribution of all households with a middle-class (SOL) across population groups
Statistics South Africa
Profiling South African middle-class households,1998–2006 (Report No. 03-03-01)
12 5. Education and Occupation of Young Adults (Aged 25-39) in Households with Middle-class (SOL)
We did not use educational or occupational characteristics of members of households to define whether
the household had a middle-class standard of living. However, in this section we examine the educational and
occupational characteristics of young adults (age 25-39) who live in households with a middle-class standard of
living. These young adults in middle-class households have more advantageous living arrangements; they likely
attended better quality schools than those from less advantaged background, which might increase their labour
market outcomes.
5.1 Educational Distribution of Young Adults
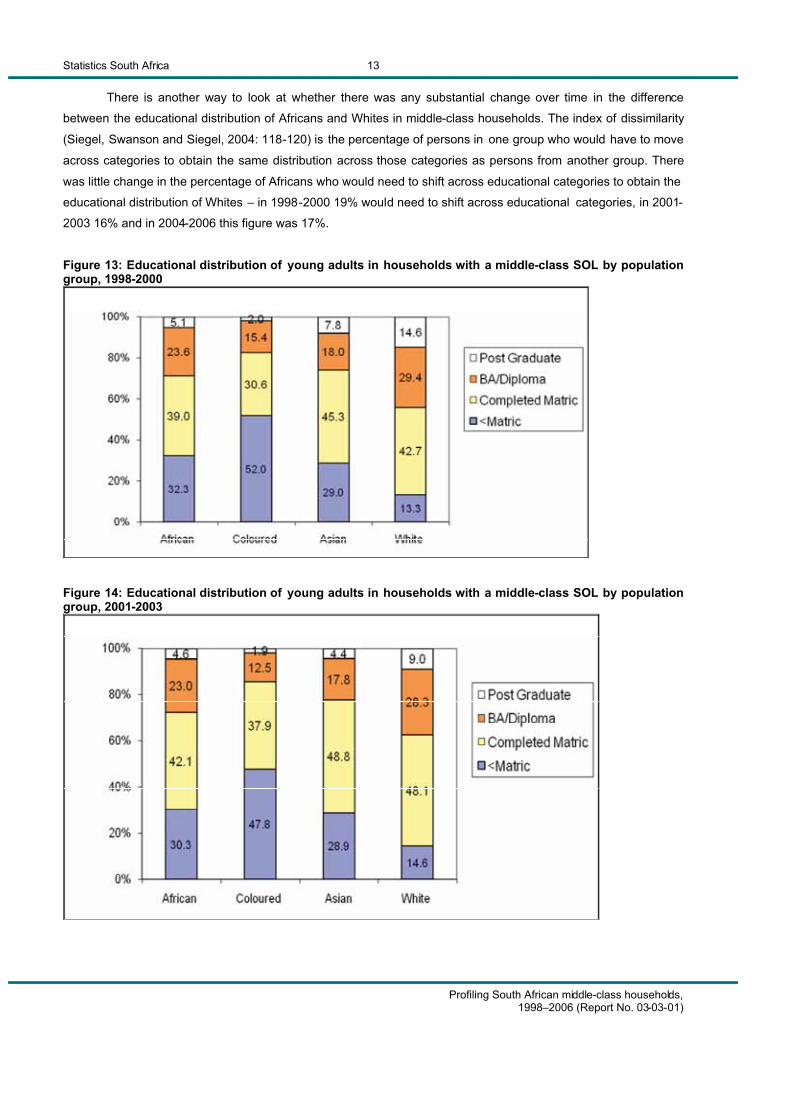
Figures 13-15 show the educational distribution of adults in middle-class households by population group in
1998-2000, 2001-2003 and 2004-2006.8 Whites and Asians have the highest educational attainment but Africans
have higher educational attainment than Coloureds. Since almost all African households with a middle-class
standard of living reside in urban places, and since urban residence for Africans has been fairly recent, African
households could have required more resources, including human capital, to attain a middle-class standard of living
than Coloured households.
There was fairly little change over time in the educational attainment of young adults in middle-class
households within each population group. We saw in Figure 10 that the percentage of households with a middle-
class standard of living increased over time for every population group, and it increased especially rapidly for
African households. Thus, in 1998-2000, African households with a middle-class standard of living were more
severely selected from all African households than was true somewhat later. As shown in Figure 7, from 1998-2000
to 2004-2006, the percentage of African households with a middle-class standard of living rose from 8% to 13%.
The high degree of selectivity is probably why we see little change in the educational distribution by
population group, even though overall educational attainment was increasing between the late 1990’s and the mid-
2000’s. For Africans in middle-class households, 29% had a BA/Diploma or higher in both 1998 -2000 and in 2004-
2006. In 1999, for all Africans aged 25-39, 7% had a BA/Diploma or higher, and by 2005, this had risen to 10%.
The selectivity of being in a middle-class household is clear for African young adults. For White young adults the
situation is different. For White young adults age 25-39 in a middle-class household, 44% had a BA/Diploma or
higher in 1998-2000 and 37% in 2004-2006. In 1999, for all Whites aged 25 -39, 33% had a BA/Diploma or higher,
and by 2005, this had risen to 36%, barely lower than the value for White young adults in middle-class households.
Of course, in 2004-2006, 85% of White households had a middle-class standard of living.
8 The coding of educational cat egories is shown in Appendix 3.
Statistics South Africa
Profiling South African middle-class households,1998–2006 (Report No. 03-03-01)
13
There is another way to look at whether there was any substantial change over time in the difference
between the educational distribution of Africans and Whites in middle-class households. The index of dissimilarity
(Siegel, Swanson and Siegel, 2004: 118-120) is the percentage of persons in one group who would have to move
across categories to obtain the same distribution across those categories as persons from another group. There
was little change in the percentage of Africans who would need to shift across educational categories to obtain the
educational distribution of Whites – in 1998-2000 19% would need to shift across educational categories, in 2001-
2003 16% and in 2004-2006 this figure was 17%.
Figure 13: Educational distribution of young adults in households with a middle-class SOL by population group, 1998-2000
Figure 14: Educational distribution of young adults in households with a middle-class SOL by population group, 2001-2003
Statistics South Africa
Profiling South African middle-class households,1998–2006 (Report No. 03-03-01)
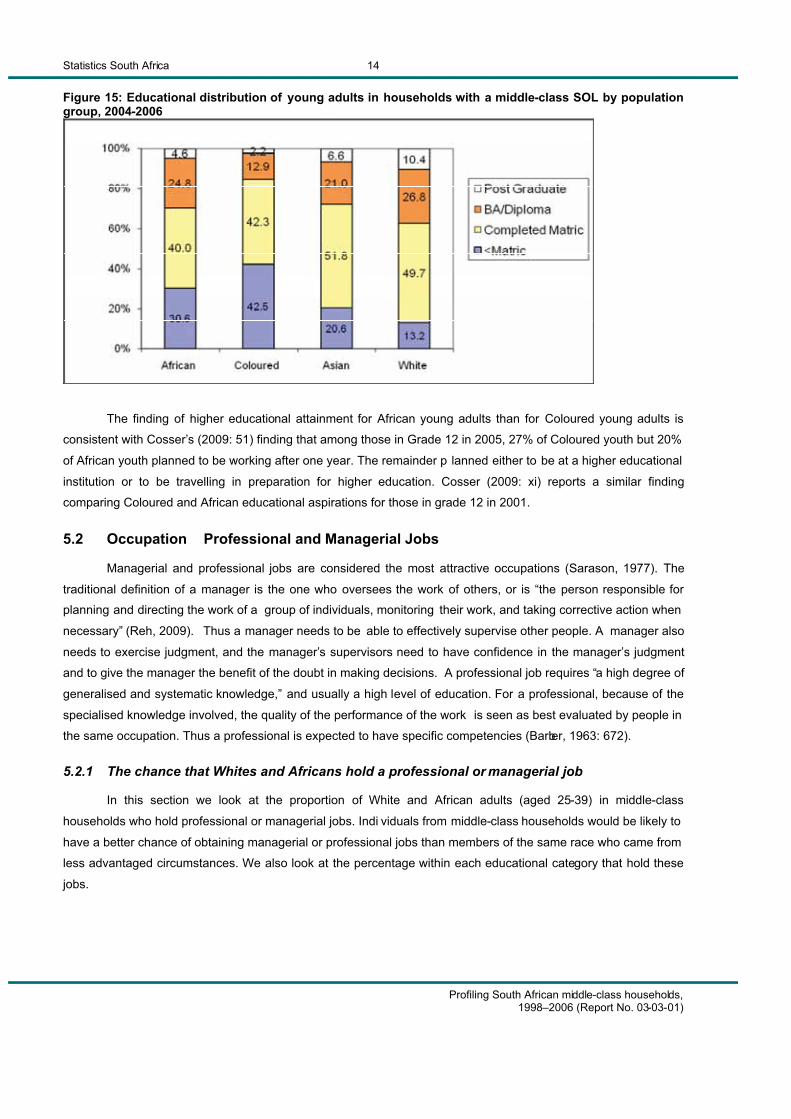
14 Figure 15: Educational distribution of young adults in households with a middle-class SOL by population group, 2004-2006
The finding of higher educational attainment for African young adults than for Coloured young adults is
consistent with Cosser’s (2009: 51) finding that among those in Grade 12 in 2005, 27% of Coloured youth but 20%
of African youth planned to be working after one year. The remainder p lanned either to be at a higher educational
institution or to be travelling in preparation for higher education. Cosser (2009: xi) reports a similar finding
comparing Coloured and African educational aspirations for those in grade 12 in 2001.
5.2 Occupation – Professional and Managerial Jobs
Managerial and professional jobs are considered the most attractive occupations (Sarason, 1977). The
traditional definition of a manager is the one who oversees the work of others, or is “the person responsible for
planning and directing the work of a group of individuals, monitoring their work, and taking corrective action when
necessary” (Reh, 2009). Thus a manager needs to be able to effectively supervise other people. A manager also
needs to exercise judgment, and the manager’s supervisors need to have confidence in the manager’s judgment
and to give the manager the benefit of the doubt in making decisions. A professional job requires “a high degree of
generalised and systematic knowledge,” and usually a high level of education. For a professional, because of the
specialised knowledge involved, the quality of the performance of the work is seen as best evaluated by people in
the same occupation. Thus a professional is expected to have specific competencies (Barber, 1963: 672).
5.2.1 The chance that Whites and Africans hold a professional or managerial job
In this section we look at the proportion of White and African adults (aged 25-39) in middle-class
households who hold professional or managerial jobs. Indi viduals from middle-class households would be likely to
have a better chance of obtaining managerial or professional jobs than members of the same race who came from
less advantaged circumstances. We also look at the percentage within each educational category that hold these
jobs.
Statistics South Africa
Profiling South African middle-class households,1998–2006 (Report No. 03-03-01)
15
In an effort to address past educational and labour market inequalities, various policies and programs were
developed to improve the employment situation of Africans, Coloureds and Asians, commonly classified as blacks
(c.f., Bowmaker-Falconer, et al. 1997). Often the issue of improving the employment of these groups and their
representation in high level jobs has been viewed as “managing diversity” (c.f., Horwitz, 1996), an approach that
has been criticised (Human, 1996). Looking at factors related to whether Africans and Whites who have a secure
material standard of living hold managerial and professional jobs and whether the situation has changed over time
is one way to see how far things have moved in the recent past, mainly because they are mostly at opposite
extremes of most indicators.
One would expect that the higher a person’s educational attainment, the greater that person’s chance of
obtaining a professional or managerial job. Thus, since as shown in Figures 13-15, White young adults in middle-
class households had a higher educational attainment distribution than Africans in middle-class households, a
higher percentage of White young adults than African young adults would be expected to have professional or
managerial jobs.
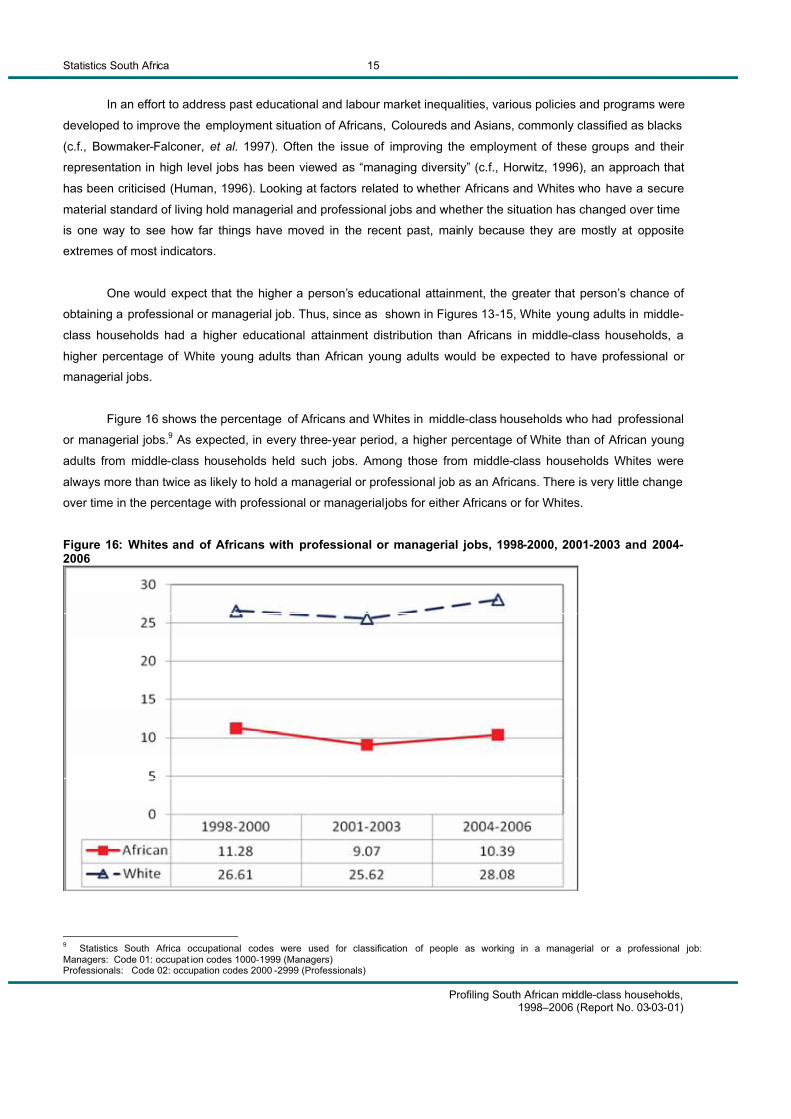
Figure 16 shows the percentage of Africans and Whites in middle-class households who had professional
or managerial jobs.9 As expected, in every three-year period, a higher percentage of White than of African young
adults from middle-class households held such jobs. Among those from middle-class households Whites were
always more than twice as likely to hold a managerial or professional job as an Africans. There is very little change
over time in the percentage with professional or managerial jobs for either Africans or for Whites.
Figure 16: Whites and of Africans with professional or managerial jobs, 1998-2000, 2001-2003 and 2004-2006
9 Statistics South Africa occupational codes were used for classification of people as working in a managerial or a professional job:Managers: Code 01: occupat ion codes 1000-1999 (Managers)Professionals: Code 02: occupation codes 2000 -2999 (Professionals)
Statistics South Africa
Profiling South African middle-class households,1998–2006 (Report No. 03-03-01)
16
Africans and Whites from middle-class households differ in educational attainment, which certainly af fects
the chance of obtaining these jobs. However it is also important to look at the chance that a member of a given
population group with a given educational attainment has a desirable job. This can be viewed as the returns to
education (or the returns to a particular educational attainment) for members of a particular population group.
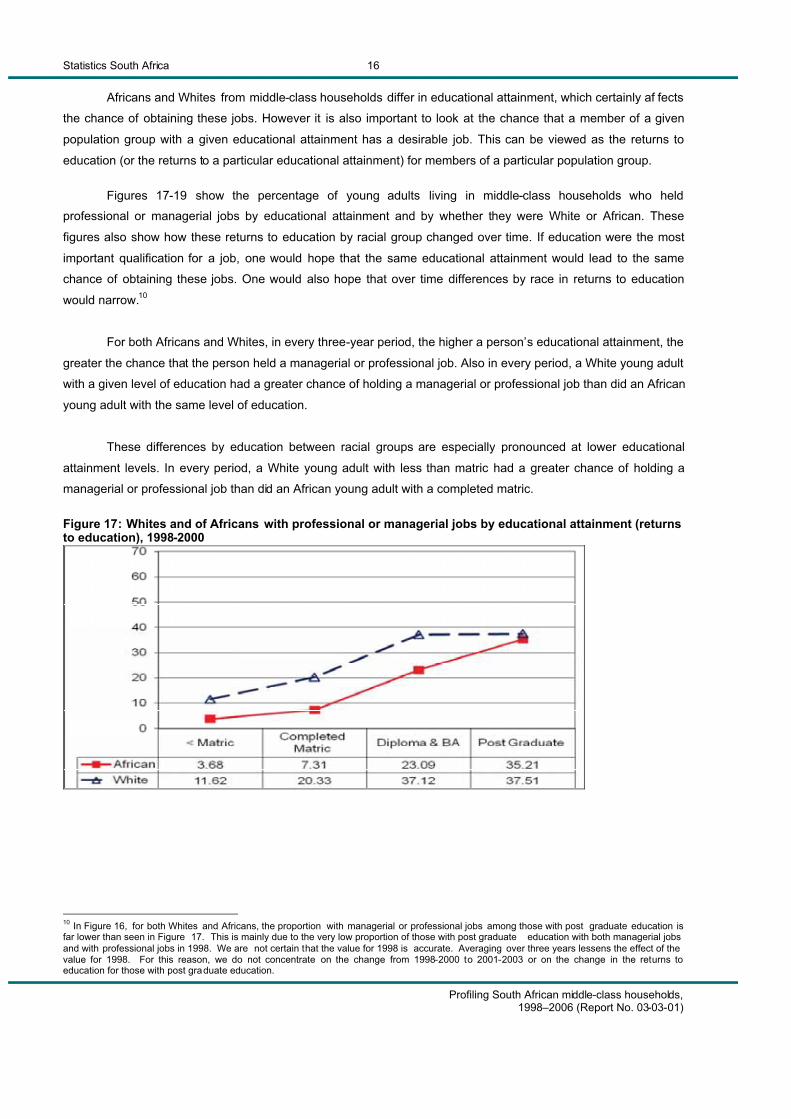
Figures 17-19 show the percentage of young adults living in middle-class households who held
professional or managerial jobs by educational attainment and by whether they were White or African. These
figures also show how these returns to education by racial group changed over time. If education were the most
important qualification for a job, one would hope that the same educational attainment would lead to the same
chance of obtaining these jobs. One would also hope that over time differences by race in returns to education
would narrow.10
For both Africans and Whites, in every three-year period, the higher a person’s educational attainment, the
greater the chance that the person held a managerial or professional job. Also in every period, a White young adult
with a given level of education had a greater chance of holding a managerial or professional job than did an African
young adult with the same level of education.
These differences by education between racial groups are especially pronounced at lower educational
attainment levels. In every period, a White young adult with less than matric had a greater chance of holding a
managerial or professional job than did an African young adult with a completed matric.
Figure 17: Whites and of Africans with professional or managerial jobs by educational attainment (returns to education), 1998-2000
10 In Figure 16, for both Whites and Africans, the proportion with managerial or professional jobs among those with post graduate education is far lower than seen in Figure 17. This is mainly due to the very low proportion of those with post graduate education with both managerial jobs and with professional jobs in 1998. We are not certain that the value for 1998 is accurate. Averaging over three years lessens the effect of the value for 1998. For this reason, we do not concentrate on the change from 1998-2000 to 2001-2003 or on the change in the returns to education for those with post graduate education.
Statistics South Africa
Profiling South African middle-class households,1998–2006 (Report No. 03-03-01)
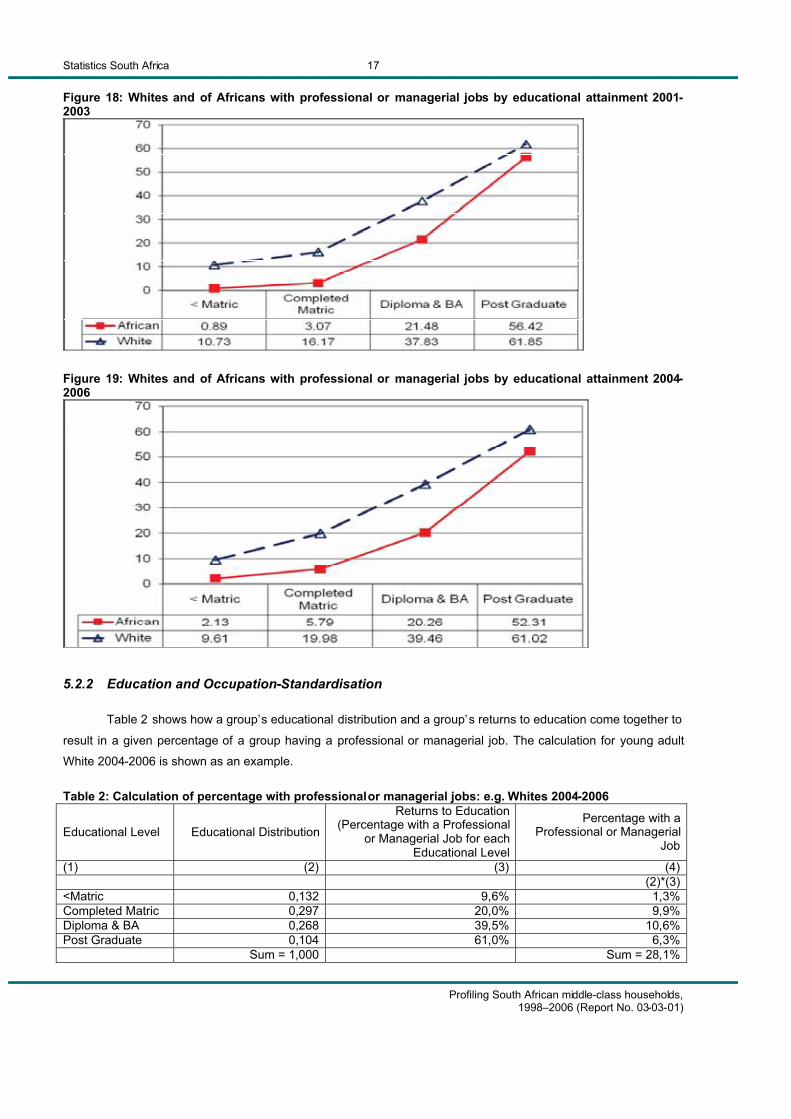
17 Figure 18: Whites and of Africans with professional or managerial jobs by educational attainment 2001-2003
Figure 19: Whites and of Africans with professional or managerial jobs by educational attainment 2004-2006
5.2.2 Education and Occupation-Standardisation
Table 2 shows how a group’s educational distribution and a group’s returns to education come together to
result in a given percentage of a group having a professional or managerial job. The calculation for young adult
White 2004-2006 is shown as an example.
Table 2: Calculation of percentage with professional or managerial jobs: e.g. Whites 2004-2006
Educational Level Educational Distribution
Returns to Education(Percentage with a Professional
or Managerial Job for each Educational Level
Percentage with a Professional or Managerial
Job
(1) (2) (3) (4)(2)*(3)
<Matric 0,132 9,6% 1,3%Completed Matric 0,297 20,0% 9,9%Diploma & BA 0,268 39,5% 10,6%Post Graduate 0,104 61,0% 6,3%
Sum = 1,000 Sum = 28,1%
Statistics South Africa
Profiling South African middle-class households,1998–2006 (Report No. 03-03-01)
18
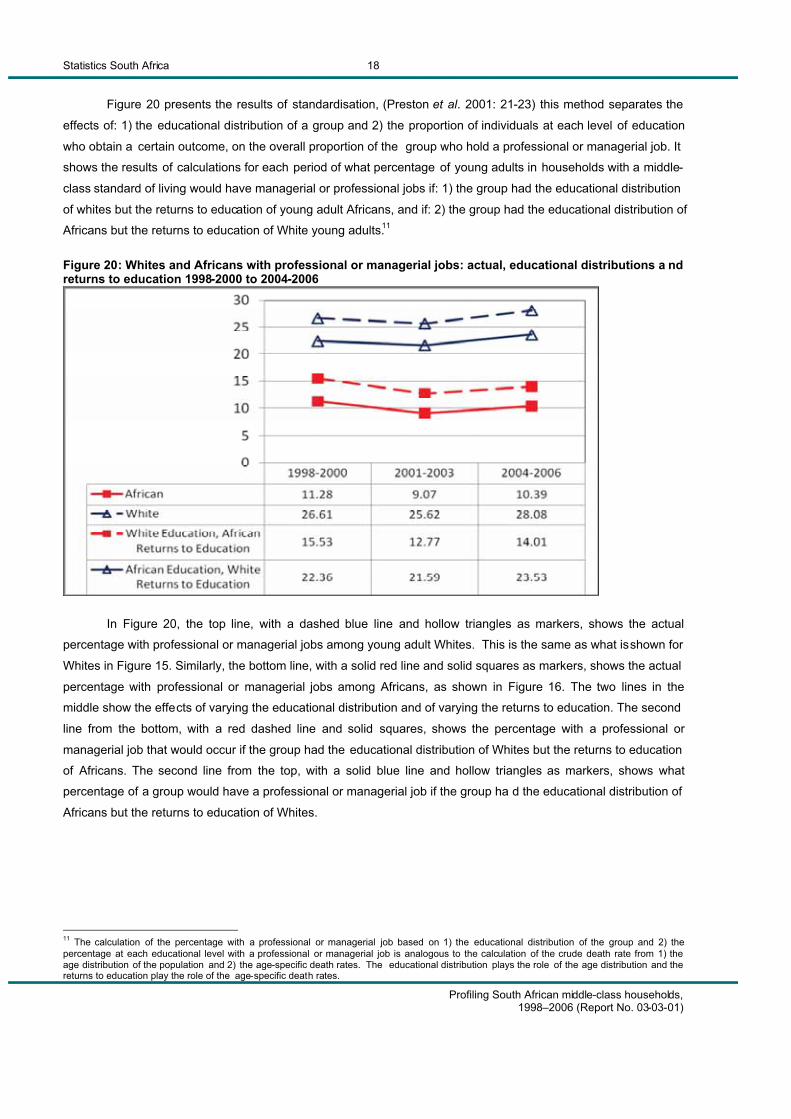
Figure 20 presents the results of standardisation, (Preston et al. 2001: 21-23) this method separates the
effects of: 1) the educational distribution of a group and 2) the proportion of individuals at each level of education
who obtain a certain outcome, on the overall proportion of the group who hold a professional or managerial job. It
shows the results of calculations for each period of what percentage of young adults in households with a middle-
class standard of living would have managerial or professional jobs if: 1) the group had the educational distribution
of whites but the returns to education of young adult Africans, and if: 2) the group had the educational distribution of
Africans but the returns to education of White young adults.11
Figure 20: Whites and Africans with professional or managerial jobs: actual, educational distributions a nd returns to education 1998-2000 to 2004-2006
In Figure 20, the top line, with a dashed blue line and hollow triangles as markers, shows the actual
percentage with professional or managerial jobs among young adult Whites. This is the same as what is shown for
Whites in Figure 15. Similarly, the bottom line, with a solid red line and solid squares as markers, shows the actual
percentage with professional or managerial jobs among Africans, as shown in Figure 16. The two lines in the
middle show the effects of varying the educational distribution and of varying the returns to education. The second
line from the bottom, with a red dashed line and solid squares, shows the percentage with a professional or
managerial job that would occur if the group had the educational distribution of Whites but the returns to education
of Africans. The second line from the top, with a solid blue line and hollow triangles as markers, shows what
percentage of a group would have a professional or managerial job if the group ha d the educational distribution of
Africans but the returns to education of Whites.
11 The calculation of the percentage with a professional or managerial job based on 1) the educational distribution of the group and 2) the percentage at each educational level with a professional or managerial job is analogous to the calculation of the crude death rate from 1) the age distribution of the population and 2) the age-specific death rates. The educational distribution plays the role of the age distribution and the returns to education play the role of the age-specific death rates.
Statistics South Africa
Profiling South African middle-class households,1998–2006 (Report No. 03-03-01)
19
If differences in educational attainment were the only reason why young Whites were more likely to have
professional or managerial jobs than young Africans, then the calculation using White educational attainment and
African returns to education should result in the same proportion with professional or managerial jobs as the
proportion of Whites with professional or managerial jobs. This is not the case.
It is clear that the greater chance that Whites has a professional or managerial job than an Africans with
the same educational attainment is the main reason for the higher percentage of Whites than Africans with a
professional or managerial job. That is, differences in returns to education between Whites and Africans explain
more of the difference between Whites and Africans in the percentage holding these jobs than do differences in
educational attainment between Whites and Africans.
In 1998-2000, if Africans had the White educational distribution but African returns to education, only 28%
of the gap between Africans and Whites would have been eliminated; in 1998-2000 if Africans had their own
educational distribution but White returns to education, 72% of the gap would have been eliminated. By 2004-2006,
if Africans had the White educational distribution but their own returns to education, 20% of the gap would have
been eliminated, but if Africans had their own educational distribution but White returns to education, 74% of the
gap would have been eliminated. Thus, there was virtually no change over time in the role of the educational
distribution and of returns to education in explaining the difference between the percentage of Africans and of
Whites with professional or managerial jobs.
5.2.3 Possible causes of differences in returns to education between Whites and Africans
What are the possible causes of the persistent difference between Whites and Africans in the returns to
education in holding a professional or managerial job? One possible cause is that even if a young White adult and
a young African adult have the same educational attainment, the quality of the education that the White obtained
usually was better than the education that the Africans obtained. A second possibility is that fields of specialisation
differ in the availability of managerial and professional jobs. If Africans tended to concentrate in fields with fewer
managerial and professional possibilities than Whites, this would contribute to a smaller percentage of Africans
than Whites holding professional or managerial jobs. A third possibility is that there could be qualifications for
these occupations that are not captured by educational attainment. A fourth possibility is that White jobseekers
could have more access than African jobseekers to social networks and connections that facilitate obtaining these
jobs. A fifth explanation is discrimination against African jobseekers – prospective employers of professionals or
managers could be more reluctant to hire and retain an African than a White applicant.
This analysis does not take differences between young White and African adults in quality of schooling or
in field of specialisation into account, nor does it investigate the other possible explanations. However, it is
worthwhile to point out these other possible influences on obtaining a managerial or professional job.
Differences in the quality of education obtained by Africans and Whites remain a persistent problem in
South Africa. Restricting our analysis to those living in households with a middle-class standard of living should
reduce differences between young adult Africans and Whites in quality of schooling, but it probably would not
eliminate the difference.
Statistics South Africa
Profiling South African middle-class households,1998–2006 (Report No. 03-03-01)
20
There is extensive literature that shows that generally the quality of education obtained by White South
Africans is higher than that obtained by African South Africans. Using data collected in 2000, van der Berg (2006)
found persistent large differences in educational quality among South African schools according to the population
group composition of the students attending the schools.
Chamberlain and van der Berg (2002) looked at the contribution of differences in quality of schooling
obtained by Africans and Whites to differences in earnings for 1995. Without taking educational quality into
account, they estimated that 42% of the earnings gap between Africans and Whites was due to racial
discrimination. After taking differences in educational quality into account, as indicated by the literacy and
numeracy scores on the 1993 Living Standards and Development Survey (SALDRU, 1994), the estimated
contribution of racial discrimination to the earnings gap was reduced to 24% (Chamberlain and van der Berg, 2002:
24).
Looking at factors related to unemployment in South Africa 1993-1994, Kingdon and Knight (2001) found
that 40% of the difference between the unemployment rate of Africans and Whites could be explained by
educational and other characteristics, such as age, gender, and province of residence that might reasonably be
related to the probability of unemployment. However, 40% of the difference between White and African
unemployment was not explained by the characteristics of the person included in the analysis. The authors
attributed this unexplained residual to the quality of education, discrimination, or other characteristics not included
in their analysis.
Bhorat (2004), looking at unemployment rates in 1995 and in 2002, noted that among those with tertiary
education, Africans were more than 4 times as likely to be unemployed as Whites in 1995 and more than 5 times
as likely to be unemployed as Whites in 2002. Also, in 1995, African managers had wages 42% of White
managers, and African professionals had wages 35% of those paid to White professionals.
Moleke (2005) analysed the results of a tracer study 1999-2000 of South Africans who graduated from
university between 1990 and 1998. She found that the waiting time between graduation and employment differed
by field of study, with those with degrees in engineering or medical sciences having little or no waiting and those in
education or law having a longer wait. Africans tended to be more concentrated than Whites in the fields with a
longer waiting time. However, within the same field of study, White graduates tended to find employment more
rapidly than did African graduates. Those who graduated from historically White universities also tended to have a
shorter waiting time to employment than did graduates of historically Black universities.
It is possible that there are social skills obtained while growing up that those with a more privileged
background obtain from their home setting that are useful in professional jobs, and perhaps more so, managerial
jobs. Restricting our consideration to households with a middle-class standard of living should narrow this
difference in socialisation, but it might not eliminate it. Cosser with Sehlola (2009) found that in South Africa for
those in Grade 12 in 2005, one year later 40% of those with jobs obtained those jobs through relatives or personal
contacts.
Statistics South Africa
Profiling South African middle-class households,1998–2006 (Report No. 03-03-01)
21
Fernandez (1975) found for the United States that among White managers, many thought there were social
skills apart from educational attainment that were important for the successful manager. In a study in the United
States of the rating of the promotion potential of professional and managerial employees by the manager
supervising the employee, Landau (1995) found that African-Americans were rated significantly lower on promotion
potential even when a variety of employee characteristics, including age, education, salary and organisational
tenure, were taken into account.
Also in the United States, Pager (2003: 958) using an audit study found that in applying for an entry-level
job, a White applicant with a criminal record was more likely to be offered a call-back for an actual job interview
than was an African-American applicant without a criminal record.
In order to hold a managerial or professional job, it is necessary not only to be hired into the job but to
continue to hold a managerial or professional job. In the United States, in a study of African-American and White
managerial/administrative and professional/technical workers, Wilson and McBrier (2005) found that African-
Americans in these jobs were more likely to be laid off than Whites and that individual characteristics that should
guard against lay-off, such as advanced education, were much less protective of jobs for African-Americans than
for Whites.
The social environment and support within the organisation can also be important. Igbaria and Wormley
(1992) found that in the United States, within a management information systems firm, African-American managers
and professionals “perceived less discretion and autonomy on their jobs than whites” (Igbara and Wormley: 1992:
521), received less career support from their supervisors than white employees, and reported that their job
expectations were met less often than reported by White employees. African-American managers and
professionals also reported a lower feeling of acceptance within the organisation than did White managers and
professionals.
5.2.4 Examination of managerial and professional jobs separately
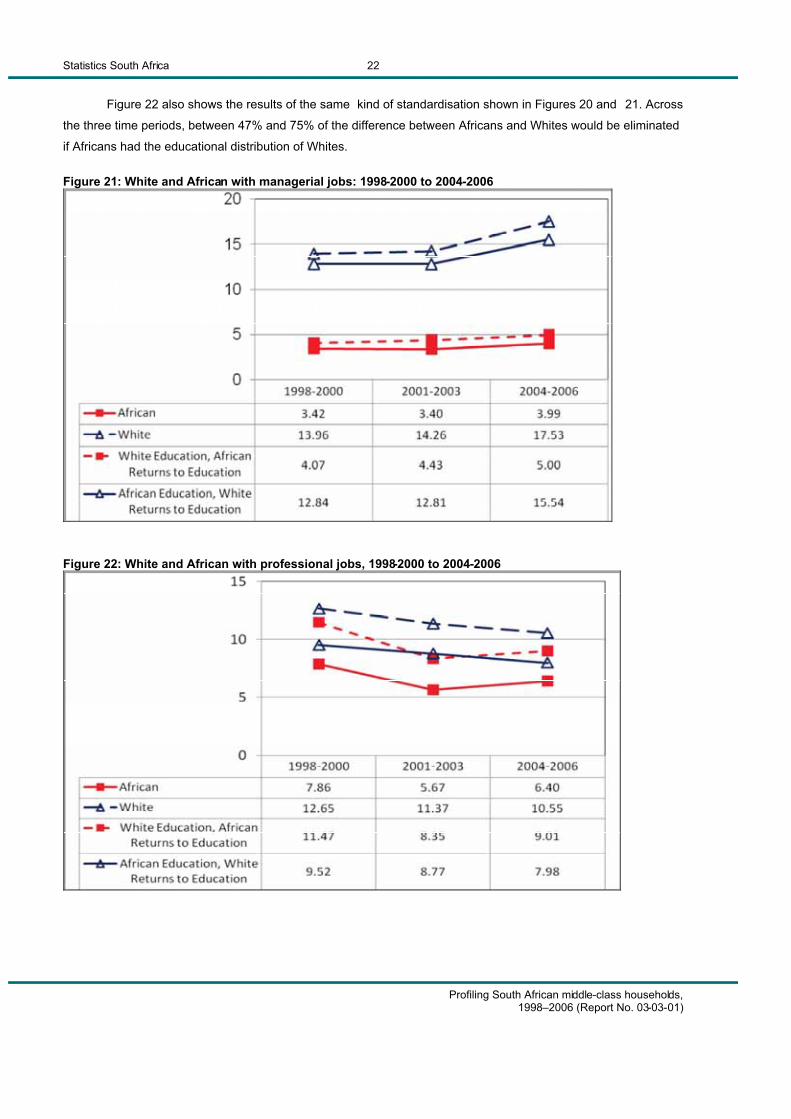
So far we have looked at managerial and professional jobs together. Next we look at these two
occupational categories separately. Figure 21 shows the percentage of young Whites and Africans adults in
middle-class households who held managerial jobs in each of the three time periods. The percentage of Whites
with managerial jobs was far higher than for Africans, and the gap widened over time. In every period Whites were
more than four times as likely as Africans to hold a managerial job.
Figure 21 shows the results of the same kind of standardisation shown in Figure 20. If Africans had the
same educational distribution as Whites in middle-class households but still had African returns to education, it
would have a trivial impact on the percentage of African young adults who held managerial jobs. Across the three
time periods, between 6% and 9% of the difference between Africans and Whites would be eliminated if Africans
had the educational distribution of Whites.
In Figure 22, we look at the situation for professional jobs. The percentage of White young adults with
professional jobs was higher than for Africans, but the gap was far less than for managerial jobs. Whites were 1.6 -
2.0 times more likely than Africans to hold a professional job.
Statistics South Africa
Profiling South African middle-class households,1998–2006 (Report No. 03-03-01)
22
Figure 22 also shows the results of the same kind of standardisation shown in Figures 20 and 21. Across
the three time periods, between 47% and 75% of the difference between Africans and Whites would be eliminated
if Africans had the educational distribution of Whites.
Figure 21: White and African with managerial jobs: 1998-2000 to 2004-2006
Figure 22: White and African with professional jobs, 1998-2000 to 2004-2006
Statistics South Africa
Profiling South African middle-class households,1998–2006 (Report No. 03-03-01)
23
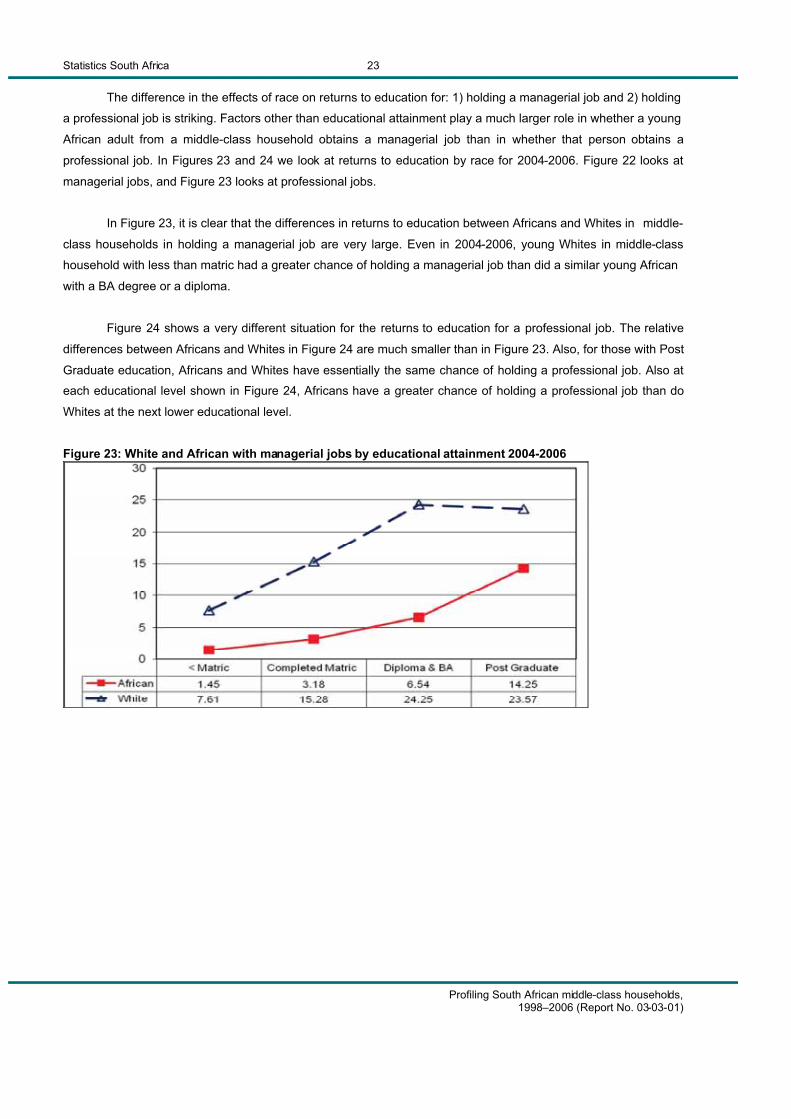
The difference in the effects of race on returns to education for: 1) holding a managerial job and 2) holding
a professional job is striking. Factors other than educational attainment play a much larger role in whether a young
African adult from a middle-class household obtains a managerial job than in whether that person obtains a
professional job. In Figures 23 and 24 we look at returns to education by race for 2004-2006. Figure 22 looks at
managerial jobs, and Figure 23 looks at professional jobs.
In Figure 23, it is clear that the differences in returns to education between Africans and Whites in middle-
class households in holding a managerial job are very large. Even in 2004-2006, young Whites in middle-class
household with less than matric had a greater chance of holding a managerial job than did a similar young African
with a BA degree or a diploma.
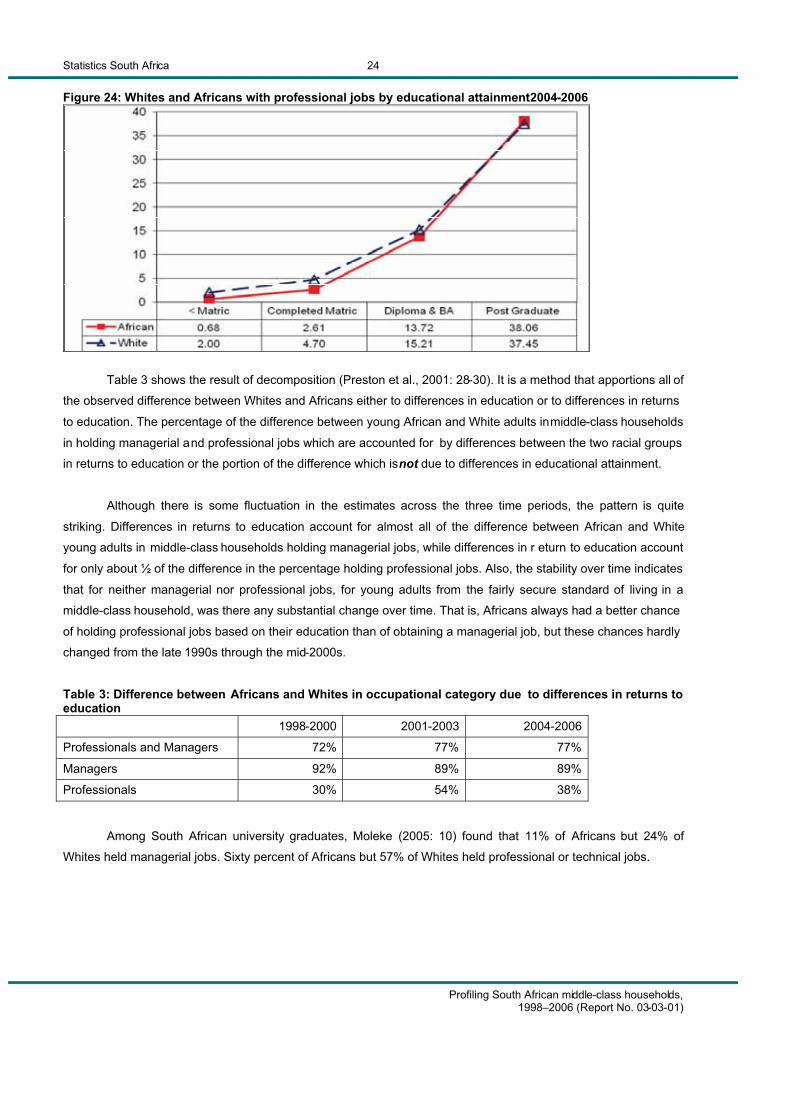
Figure 24 shows a very different situation for the returns to education for a professional job. The relative
differences between Africans and Whites in Figure 24 are much smaller than in Figure 23. Also, for those with Post
Graduate education, Africans and Whites have essentially the same chance of holding a professional job. Also at
each educational level shown in Figure 24, Africans have a greater chance of holding a professional job than do
Whites at the next lower educational level.
Figure 23: White and African with managerial jobs by educational attainment 2004-2006
Statistics South Africa
Profiling South African middle-class households,1998–2006 (Report No. 03-03-01)
24 Figure 24: Whites and Africans with professional jobs by educational attainment 2004-2006
Table 3 shows the result of decomposition (Preston et al., 2001: 28-30). It is a method that apportions all of
the observed difference between Whites and Africans either to differences in education or to differences in returns
to education. The percentage of the difference between young African and White adults in middle-class households
in holding managerial and professional jobs which are accounted for by differences between the two racial groups
in returns to education or the portion of the difference which is not due to differences in educational attainment.
Although there is some fluctuation in the estimates across the three time periods, the pattern is quite
striking. Differences in returns to education account for almost all of the difference between African and White
young adults in middle-class households holding managerial jobs, while differences in r eturn to education account
for only about ½ of the difference in the percentage holding professional jobs. Also, the stability over time indicates
that for neither managerial nor professional jobs, for young adults from the fairly secure standard of living in a
middle-class household, was there any substantial change over time. That is, Africans always had a better chance
of holding professional jobs based on their education than of obtaining a managerial job, but these chances hardly
changed from the late 1990s through the mid-2000s.
Table 3: Difference between Africans and Whites in occupational category due to differences in returns to education
1998-2000 2001-2003 2004-2006
Professionals and Managers 72% 77% 77%
Managers 92% 89% 89%
Professionals 30% 54% 38%
Among South African university graduates, Moleke (2005: 10) found that 11% of Africans but 24% of
Whites held managerial jobs. Sixty percent of Africans but 57% of Whites held professional or technical jobs.
Statistics South Africa
Profiling South African middle-class households,1998–2006 (Report No. 03-03-01)
25
Moleke (2005: 11) also found that among university graduates, the first job of Africans was much more
likely to be in the public sector (77%) than for Whites (39%). For current job, 82% of Africans and 29% of Whites
were in public sector jobs (Moleke, 2005: 26). Moleke (2005: 13) also found that among South African university
graduates employed in the private sector, 10% of Africans but 27% of Whites held managerial jobs. In the public
sector, 10% of both Africans and Whites held managerial jobs.
Between 1995 and 1999 the employment of Africans in professional jobs declined. Poswell (2002)
explains this as the result of an overall decline in public sector jobs in that period. It is likely that the differences in
returns to education by race are greater for jobs in the private sector than in the public sector, especially for
managerial jobs. In further work we plan to look at public sector and private sector employment of African and
White managers and professionals.
The difference in quality of schooling is likely less for those who live in households with a middle-class
standard of living than for all Whites and all Africans. It is difficult to imagine what differences in quality of schooling
could account for the result in Figure 21 in which Whites with less than matric have a greater chance of holding a
managerial job than do Africans with a college degree.
Sometimes people have long worked for an organisation and end up in a managerial position even though
they have lower educational attainment than younger employees. In South Africa, this especially could be true for
Whites who obtained managerial positions during the apartheid period. However, we have restricted our analysis to
adults age 25-39. The oldest persons included in our analyses would have been age 35 in 1994, thus, although
the phenomenon of retention in a managerial position from earlier could have some influence, its influence is less
than if we had included adults through age 59.
Some have suggested that for there to be more African managers in South Africa, that there need to be
personnel practices that better reflect African values (McFarlin, Coster and Mogale-Pretorius, 1999). However, it is
unclear how much of the problem stems from an organisational culture which is not Africanised enough and how
much might stem from an unwillingness to recognise the managerial capability and potential of African applicants
and employees.
Human (1996) reviewed studies from the late apartheid period of perceptions about Blacks on the part of
Whites in South Africa and found many things that would suggest that White decision-makers would have been
reluctant to put Blacks in managerial positions. Blacks were seen as inferior and as less intelligent than Whites
(Adam and Moodley, 1993: 105). Also, a study of mainly White business people found that Blacks were seen as not
objective enough to evaluate business situations (Human and Hofmeyr, 1987). One would hope that these
perceptions had changed, but further research would be necessary to determine whether such views still affect
whether Africans get and retain managerial positions in South Africa.
For the United States, Beatty (1973) and Cox and Nkomo (1986) found that social behaviour factors, such
as friendliness, were more important in performance evaluations of Black managers than of White managers.
Almost all of those doing the evaluations were White. Use of such subjective criteria can increase the role of racial
stereotypes to the disadvantage of African-American employees.
Statistics South Africa
Profiling South African middle-class households,1998–2006 (Report No. 03-03-01)
26 6. Concluding Remarks
The proportion of South African households with a middle-class material standard of living has increased
since 1998. This increase has been striking for urban Africans. Over time Africans are likely to comprise an ever-
increasing proportion of all middle-class households. However, African middle-class households have lower
expenditure than other middle-class households, and young adults from middle-class African households have a
lower chance than young adults from White middle-class households to obtain professional or managerial jobs.
This situation would improve only slightly if African young adults in middle-class households had the same
educational distribution as White young adults from middle-class households. Although South Africa has made
great progress, much remains to be done.
Statistics South Africa
Profiling South African middle-class households,1998–2006 (Report No. 03-03-01)
27
References
Adam, H, and Moodley, K. 1993. The Negotiated Revolution, Johannesburg: Jonathan Ball Publishers.
Anderson, Barbara A. and Nhlapo, Mosidi S. 2009 (forthcoming). Changes in standard of living among population groups in South Africa: 1998-2006. Pretoria: Statistics South Africa
Ardlington, Cally, Lam, David, Leibbrandt, Murray, and Welch, Matthew. 2006. “The sensitivity to key data imputations of recent estimates of income poverty and inequality in South Africa,” Economic Modelling, 23: 822-835.
Beatty, R. W. 1973. “Blacks as supervisors: A study of training, job performance, and employer’ expectations,” Academy of Management Journal, 16: 196-206.
Bhorat, Haroon. 2004. “Chapter 1: The development challenge in post-apartheid South African education,” in Linda Chisholm, Ed. Changing Class: Education and social change in post-apartheid South Africa, pp. 31-56. Cape Town: HSRC Press.
Black Diamond 1. 2007. website of the Unilever Institute of Strategic Marketing, University of Cape Town.Available at hhttp://www.unileverinstitute.co.za/black_diamond.asp Accessed on 7 June 2007.
Bowmaker-Falconer, Angus, Horwitz, Frank M., Jain, Harish, and Taggar, Simon. 1997. “Employment equality programmes in South Africa: Current trends,” Industrial Relations Journal, 29: 222-233.
Chamberlain, Doubell, and van der Berg, Servaas. 2002. “Earnings functions, labour market discrimination and quality of education in South Africa,” Stellenbosch Working Paper Series No. WP02/2002 Available at http://www.ekon.sun.ac.za/wpapers/2002. Accessed on 10 June 2009.
Cosser, Michael. 2009. Studying ambitions: Pathways from grade 12 and the factors that shape them. Pretoria: Human Sciences Research Council.
Cosser, M. with Sehlola, S. 2009 (forthcoming). Ambitions revised: Grade 12 learner destinations one year on.Cape Town: HSRC Press.
Cox, Taylor, and Nkomo, Stella M. 1986. “Differential performance appraisal criteria: A firld study of Black and White managers,” Group Organization Managenent, 11: 101-119.
Dias, Rosa, and Possel, Dorrit. 2007. “Unemployment, education and skills constraints in post-apartheid South Africa,” DPRU Working paper 07/120. Development Policy Research Unit: University of Cape Town. Available at http://www.commerce.uct.ac.za/Research_Units/DPRU/WorkingPapers/wpapers.asp Accessed June 11, 2009.
Fernandez, John P. 1975. Black managers in White corporations. New York: Wiley.
Horwitz, Frank M. 1996. “Human resource development and managing diversity in South Africa,” International Journal of Manpower, 17: 134-151.
Human, Linda. 1996. “Managing workforce diversity: a critique and example from South Africa,” International Journal of Manpower, 17: 46-64.
Human, L., and Hofmeyr, K. 1987. “Attitudes of South African managers to the advancement of blacks in business,” South African Journal of Labour Relations, 11: 5-19.
Igbaria, Magid, and Wormley, Wayne M. 1992. “Organizational experiences and career success of MIS professionals and managers: An examination of race differences,” MIS Quarterly, 16: 507-529.
International Centre for Policy Studies. 2002. The report on preliminary research “Ukraine’s middle-class,” October, Kyiv, Ukraine.Available at http://www.icps.com.ua/doc/middle_class_report_e.pdf Accessed 31 May 2007
Johnston, Alastair Iain. 2004. “Chinese middle-class attitudes toward international affairs: Nascent liberalization?” China Quarterly, 179: 603-628.
Statistics South Africa
Profiling South African middle-class households,1998–2006 (Report No. 03-03-01)
28
Kingdon, Greta, and Knight, John. 2001. “Race and the incidence of unemployment in South Africa.” Centre for the Study of African Economies Working Paper 156. CSAE, Oxford University.
Landau, Jacqueline. 1995. “The relationship of race and gender to managers’ rating of promotion potential,” Journal of Organizational Behavior, 16: 391-400.
McFarlin, Dean B., Coster, Edward A., and Mogale-Pretorius, Connie. 1999. “South African management development in the twenty-first century,” Journal of Management Development, 18: 63-78.
Moaddel, Mansoor. 1994. “Political conflict in the world economy: A cross-national analysis of modernization and world-system theories,” American Sociological Review, 59: 276-303.
Moleke, Percy. 2005. Finding Work: Employment experiences of South African graduates. Cape Town: HSRC Press. Available at http://www.hsrcpress.ac.za Accessed 12 June 2009.
Neupert, R.F. 1981. Fertility and middle-class in Latin America. Doctoral dissertation, Department of Sociology, Brown University.
Nieftagodien, Sihaam, and van der Berg, Servaas. 2007. “Consumption patterns and the black middle-class: The role of asets,” Stellenbosch Working Paper Series No. WP04/2006. Available athttp://www.ekon.sun.ac.za/wpapers/2007/wp022007 Accessed June 11, 2009.
Oosthuizen, Morner. 2006. “The post-apartheid labour market: 1995-2004,” DPRU Working paper 06/103.Development Policy Research Unit: University of Cape Town. Available at http://www.commerce.uct.ac.za/Research_Units/DPRU/WorkingPapers/wpapers.asp Accessed June 11, 2009.
Pager, Devah. 2003. “The mark of a criminal record,” American Journal of Sociology, 108: 937-975.
Preston, Samuel H., Heuveline, Patrick, and Guillot, Michel. 2001. Demography: Measuring and modelling population processes, Malden, MA: Blackwell.
Reh, F. John. 2009. Manager Available at http://management.about.com/od/policiesandprocedures/g/manager1.htm Accessed July 19, 2009.
SALDRU. 1994. South Africans rich and the poor: Baseline household statistics. School of Economics, University of Cape Town: Cape Town.
Sarason, S. 1977. Work, aging and social change. New York: The Free Press.
Seekings, Jeremy, and Nattrass, Nicoli. 2005. Class, race and inequality in South Africa. New Haven: Yale University Press.
Senauer, Benjamin, and Goetz, Linda. 2003. “The growing middle-class in developing countries and the market for high-value food products,” a paper presented at the Workshop for Global Markets for High-Value Food, Economic Research Service, Washington, DC, February 14. Available at http://www.farmfoundation.org/documents/Ben-Senauerpaper2--10--3-13-03_000.pdf Accessed 29 May 2007.
Shaw, D., and Human, L. 1989. “Assessment of managerial potential amongst black employees in selected South African companies,” South African Journal of Labour Relations, 13: 4-17.
Siegel, Jacob S., and Swanson, David, Eds. 2004. The methods and materials of demography (2nd edition). San Diego: Elsevier.
Smith, Ryan A. 2002. “Race, gender and authority in the workplace: Theory and research,” Annual Review of Sociology, 28: 509-542.
Southall, Roger. 2004. “The ANC and Black capitalism in South Africa,” Review of African Political Economy, 31: 313-328.
Templer, A., Beaty, D., and Hofmeyr, K. 1992. “The challenge of management development in South Africa: So little time and so much to do,” Journal of Management Development, 11: 32-41.
Statistics South Africa
Profiling South African middle-class households,1998–2006 (Report No. 03-03-01)
29
Van der Berg, Servaas. 2006. “How effective are poor schools? Poverty and educational outcomes in South Africa,” Stellenbosch Working Paper Series No. WP06/2006 Available at http://www.ekon.sun.ac.za/wpapers/2006Accessed 10 June 2009.
Wilson, George, and McBrier, Debra Branch. 2005. “Race and loss of privilege: African American/White differences in the determination of job lay-offs from upper-tier occupations,” Sociological Forum, 20: 301-321.
Woolard, Ingrid, and Woolard, Chris. 2006. Earnings inequality in South Africa 1995-2003, Employment, Growth and Development Initiative Occasional Paper 1, Cape Town: HSRC Press. Available at http://www.hsrcpress.ac.zaAccessed 12 June 2009.
Statistics South Africa
Profiling South African middle-class households,1998–2006 (Report No. 03-03-01)
30
Appendix 1: Decision not to use the data from the 1995-1997 October Household Surveys for most purposes
The 1995-1997 October Household Surveys had some deficiencies, compared with the surveys conducted
in 1998 and later. The African sample for the 1995 survey seems to have been drawn from disproportionately
economically well-off areas, leading to an estimated decline in the welfare of Africans between 1995 and 1996,
even when this is not plausible. For example, for 1995 it was reported that 32% of all African households had a
water tap in the dwelling – for each year 1996-2005, the reported percentage of African households with a tap in
the dwelling never exceeded 26%. Although we used recalculated weights based on the1996 South African Census
for the 1995 data, this does not take care of the problem in the 1995 sample for Africans.
The 1996 October Household Survey was conducted in the same year as the South African Census,
putting a strain on Statistics South Africa resources, with some effects on the quality of that survey (c.f . Anderson
and Phillips, 2006: 3).
In the 1997 October Household Survey, for Africans the sanitation reported for Africans is inexplicably
good, being substantially better than that reported for either 1996 or 1998. For example, it was reported that in
1997, 19% of rural African households had a flush toilet in the dwelling, while this was reported for 3% of rural
African households for both 1996 and 1998. The implausibly better sanitation situation in 1997 compared to 1996
and 1998 also is clear in Romani and Anderson (2002).
Appendix 2: Projection of the number of all households and of the number of households with a middle-class standard of living
The total number of households and the number of households with a middle-class standard of living for
each year 1996-2006 were estimated from the 1996-1998 October Household Surveys, the 2000 and 2001 Labour
Force Surveys and the 2002-2006 General Household Surveys. The household weights for each survey were used
to obtain the estimates. The year 1996 began the series due to the 1996 South African Census, which was thought
to have a firmer estimate of the South African population by population group than did population surveys.
The estimates were done separately for each population group. Considering the small number of
households for some groups, such as Asian households, there was a fair amount of year to year variability. In order
to minimize this variability, the estimated values for 1996 and for 2006 were accepted, but for every year 1997-
2005, the estimated value for the given year was replaced by the three year moving average. Thus the value for
1998 was the average of the directly estimated values for 1997, 1998 and 1999. This moving average minimised
the influence of the problem with reporting of flush toilets discussed in Appendix 1.
Then a curve was fitted for each group to the three-year averaged number of households and the three-
year averaged number of middle-class households. These projections are based on the assumption that
populations grow exponentially. Thus, an exponential equation of the form Y=B0* e B1*Year1 was fitted for each
population group. Year1 was the actual year of the observation minus 1900. This was done to make the coefficients
more manageable, but it had no effect on the fitted values.
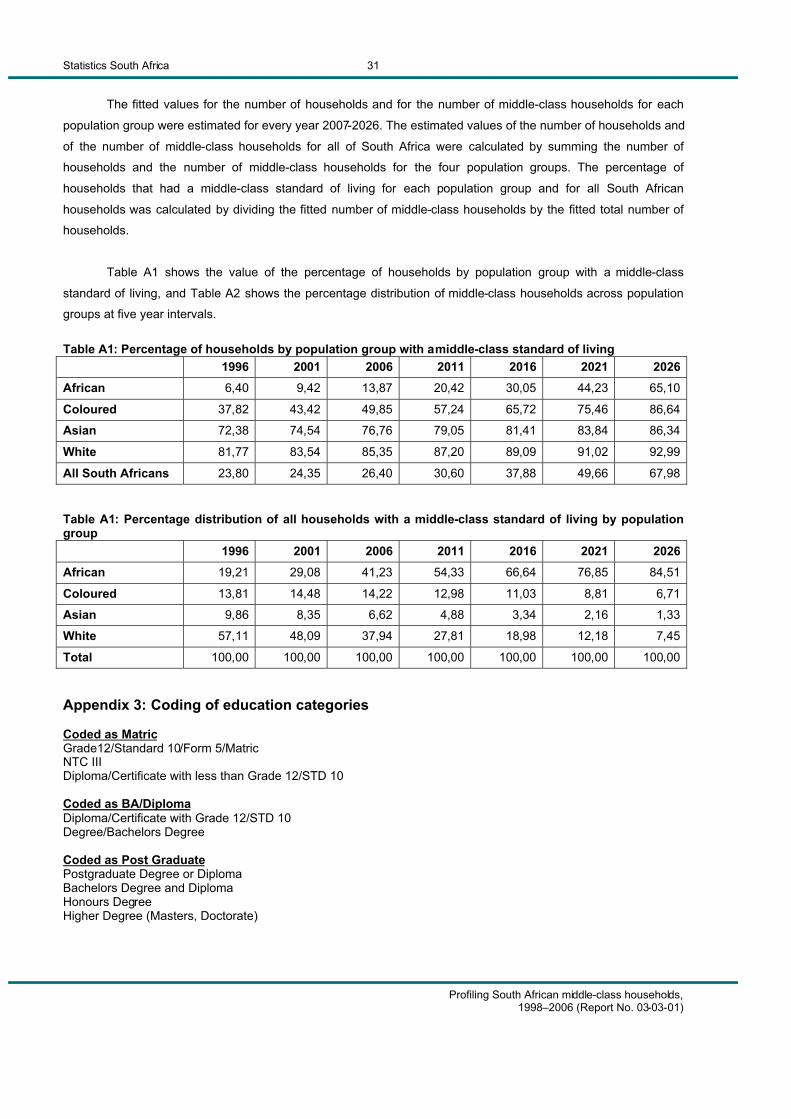
Statistics South Africa
Profiling South African middle-class households,1998–2006 (Report No. 03-03-01)
31
The fitted values for the number of households and for the number of middle-class households for each
population group were estimated for every year 2007-2026. The estimated values of the number of households and
of the number of middle-class households for all of South Africa were calculated by summing the number of
households and the number of middle-class households for the four population groups. The percentage of
households that had a middle-class standard of living for each population group and for all South African
households was calculated by dividing the fitted number of middle-class households by the fitted total number of
households.
Table A1 shows the value of the percentage of households by population group with a middle-class
standard of living, and Table A2 shows the percentage distribution of middle-class households across population
groups at five year intervals.
Table A1: Percentage of households by population group with a middle-class standard of living 1996 2001 2006 2011 2016 2021 2026
African 6,40 9,42 13,87 20,42 30,05 44,23 65,10
Coloured 37,82 43,42 49,85 57,24 65,72 75,46 86,64
Asian 72,38 74,54 76,76 79,05 81,41 83,84 86,34
White 81,77 83,54 85,35 87,20 89,09 91,02 92,99
All South Africans 23,80 24,35 26,40 30,60 37,88 49,66 67,98
Table A1: Percentage distribution of all households with a middle-class standard of living by population group
1996 2001 2006 2011 2016 2021 2026 African 19,21 29,08 41,23 54,33 66,64 76,85 84,51
Coloured 13,81 14,48 14,22 12,98 11,03 8,81 6,71
Asian 9,86 8,35 6,62 4,88 3,34 2,16 1,33
White 57,11 48,09 37,94 27,81 18,98 12,18 7,45
Total 100,00 100,00 100,00 100,00 100,00 100,00 100,00
Appendix 3: Coding of education categories Coded as Matric Grade12/Standard 10/Form 5/Matric NTC IIIDiploma/Certificate with less than Grade 12/STD 10
Coded as BA/Diploma Diploma/Certificate with Grade 12/STD 10Degree/Bachelors Degree
Coded as Post Graduate Postgraduate Degree or DiplomaBachelors Degree and DiplomaHonours DegreeHigher Degree (Masters, Doctorate)