Embed Size (px)
Citation preview
2019Vol.9 No.2:9
European Journal of Experimental Biology ISSN 2248-9215
1© Under License of Creative Commons Attribution 3.0 License | This article is available in: http://www.imedpub.com/european-journal-of-experimental-biology/
iMedPub Journalswww.imedpub.com
Research Article
Mohammad Hudzari Bin Haji Razali* and Muhammad Nawab Hazim Bin Mohd Azhan
University of Technology Mara, Melaka Branch, Jasin Campus, 77300, Malaysia
*Corresponding author: Mohammad Hudzari Bin Haji Razali
Faculty of Agrotechnology and Plantation, University of Technology Mara, Melaka Branch, Jasin Campus, Merlimau, Melaka Bandaraya Bersejarah, Malaysia.
Tel: +60192208486
Citation: Bin Haji Razali MH, Bin Mohd Azhan MNH (2019) Profiflfing fthe Nfiftrogen Efficiency Using Agricultural Engineering Technique of YARA ALS Tractor Sensor. Eur Exp Biol. Vol.9 No2:9.
IntroductionNitrogen is one of the macronutrients needed by all type of plants in order for them to grow into a healthy plant. Nitrogen is one of the important elements in plants because of its role in the chlorophyll production in the leaf. It is a basic need in the photosynthesis process. This nitrogen can be monitor and calculate by using certain equipment [1].
This study is about Nitrogen Sensor (N-Sensor). In this study, the Yara ALS N-Sensor by YARA International ASA is used. The Yara N-Sensor is a real-time variable rate nitrogen sensor that allows farmers to measure crop nitrogen requirement as the fertilizer spreader passes across the field and variably adjusts the fertilizer application rate accordingly.
The remote sensing for nitrogen is used to identify and monitor the availability of nitrogen in the leaf foliar and also in the soil. With this information acquired, the farmers can determine and can make better decision making when to apply the correct
amount of fertilizer. This is because if less nitrogen applied can affect in lower yield whereas when excess nitrogen applied can cause nitrogen toxicity to plants.
The YARA N-Sensor is mounted on an autopilot tractor. The system of the sensor is attached to the tractor. To operate this sensor, the tractor needs to move across the field in a patterned way to collect the data on each part of the selected field [2].
The data collected will be inserted in the sensor office which is the software that is suitable to analyze the data coming from the sensor. The software is made only for the YARA N-Sensor. The data collected will be presented in a map form. In the map, it will show which area has low, adequate or excess Nitrogen content in the soil.
According to the estimated nutrient removed by oil-palm (producing 25 tons per hectare Fresh Fruit Bunches (FFB) per year) are 192, 11, 209, 36 and 71 kg/ha per year of Nitrogen (N), Phosphorus (P), Potassium (K), Magnesium (Mg) and Calcium
Profiling the Nitrogen Efficiency Using Agricultural Engineering Technique of YARA
ALS Tractor Sensor
AbstractNitrogen is one of the macronutrients needed by all type of plants in order for them to grow into a healthy plant. Nitrogen is also one of the important elements in plants because of its role in the chlorophyll production in the leaf. Plants will grow healthy if they receive a sufficient amount of nitrogen needed. The study is conducted at Share Farm UiTM Jasin, Melaka. The YARA ALS N-Sensor has been used to determine the Nitrogen needed by the young oil palm. The result of visual analysis comes in a raster map form the sensor office website. There are 3 types of the map that which are N recommendation Map, N as-applied Map and Relative biomass map. The map is interpreted by the color on the map. For N recommendation map and N as-applied map, the darker the blue color which consists of 16.7% and 5.4% of total area respectively indicates that the area has less N in the leaf while the lighter blue color which consists of 6.0% and 6.7% of total area respectively indicates that the area has sufficient N in the leaf. As for the Relative biomass map, the darker green coloured area which consist 6.9% of the total area indicates that the area has sufficient N while for the lighter colored area which consists of 5.9% of the total area indicates that the area has less N. The area which indicates the less N needs to be applied with N based fertilizer whereas the area with sufficient N did not have to apply fertilizer but needs to be monitored.
Keywords: Elaeis guineensis; YARA ALS N-sensor; N kg/ha; Raster map; N recommendation map; N as-applied map; Relative biomass
Received: June 08, 2019; Accepted: June 19, 2019; Published: June 28, 2019
2019Vol.9 No.2:7
2 This article is available in: http://www.imedpub.com/european-journal-of-experimental-biology/
European Journal of Experimental Biology ISSN 2248-9215
(Ca), respectively. The Nitrogen data that has been gathered from the field will be compared with the estimated Nitrogen which is 192 kg/ha. From the comparison, farmers can know if the field has a sufficient amount of Nitrogen content or not [3].
Literature ReviewPrecision Agriculture (PA) is no longer a new term in global agriculture. Since the first substantial PA workshop was held in Minneapolis in 1992, it has become the subject of numerous conferences worldwide. The impetus for the current concept of Precision Agriculture in cropping systems emerged in the late 1980s with the matching of grid-based sampling of soil chemical properties with newly developed Variable-Rate Application (VRA) equipment for fertilizers. Using a compass and dead-reckoning principles, fertilizers were applied at rates designed to complement changes in soil fertility maps that had been created. Crop yield monitoring technologies were still in the research phase at this stage.
Precision Agriculture can be defined as integrated information-and production-based farming system that is designed to increase long term, site-specific and whole farm production efficiency, productivity and profitability while minimizing unintended impacts on wildlife and the environment [4]. The key to this definition is that it identifies PA as a “whole-farm” management strategy (not just for individual fields) that utilizes information technology and that the aim of management is to improve production and minimize environmental impact [5]. It also refers to the farming system which in modern agriculture may include the supply chain from the farm gate to the consumer. Since oil palm becomes a commercial crop, the plantation area has covered with many hectares. This will cause to the management faced problem such as difficulties in management and monitor due to larger area cover. Before the existence of new technology and precision agriculture being introduced, farmers using the manual or traditional technique to manage their plantation area that takes a long time and needed more workers. Means that, it is difficult to keep all the information and data related to plantation management.
According to Daliman [5], state that it is impossible to monitor for each palm in Malaysia estate manually and will take a lot of time due to cover the larger area without implementing proper management. To overcome these issues, the PA can be implemented because it introduces to the latest technology that can be applied in the plantation sectors such as Unmanned Aerial Vehicle (UAV) and remote sensing. Another example is by using the satellite positioning system such as GPS that has the ability to give the accurate location in the field and it is easier to collect the required data. This is supported by Dalman [5] where the new cloud such as data storage and processing, digital techniques of data capture can be applied along with Geographic Information System (GIS) application. This is because GIS is designed to keep all the data and information according to the related activities in oil palm. In addition, it can monitor the plantation area at the same time [6-10].
NitrogenNitrogen (N) was founded by Daniel Rutherford in 1772. It was observed to be inert to the point that Antoine Lavoisier named it "azote", signifying "without life". Nitrogen is the fourth most abundant element in cellular biomass, and it contains the greatest part of Earth’s atmosphere. Nitrogen is one of the macro elements other than Phosphorus and Potassium that is critically required by the plant for their development. Nitrogen additionally is a supplement that is frequently restricting the product yield. As said by Burgt, Nitrogen is a critical and as a rule yield constraining supplement. As far as plant development, physiology, and starch content, Nitrogen is the most vital supplement component [8]. It comprises a segment of chlorophyll, amino acids, proteins, alkaloids, and cellular material that is required for the plant development to be healthy and vigor.
Leaf Nitrogen content was a solid factor that gave influence to both optimum canopy light use efficiency and canopy photosynthesis rate [9]. Nitrogen plays a very important role in the sustainability of oil palm productivity, environmentally and economically [1].
Satisfactory nutrient supply particularly N is the most imperative in delivering high return from oil palm production. The N application has been accounted for to impact the palm tallness, chloroplast development, Leaf Area Index (LAI), weakness to pest and disease and therefore, fruit bunch and oil quality [7].
Oil palmOil palm (Elaeis guineensis) is a major crop that is planted in Malaysia. In Malaysia, oil palm begins presenting as an ornamental plant in the early 1870s and turned out to be one of the primary essential products after rubber tree and paddy [8]. The final product wanted by an oil palm estate is the production of fresh fruit bunches and a great deal of good quality [9,10]. Oil palm is the most quickly extending tropical perennial crop. The area of land under oil palm, right now adding up to around 19 Million ha, has been ascending at 660 000 ha per year over the 2005-2014 period (FAOSTAT, 2014), and this trend is most likely to continue until the year 2050 [4]. Palm oil production which is right now the most noteworthy agricultural export for the nation speaks to a vital product.
Oil palm is a particularly profitable tropical product with a potential yield capacity well more than 10 tons of oil for each hectare. In any case, current yields are well beneath this figure and are ordinarily around 4-6 tons for each hectare for the best commercial plantations and 3-4 tons for every hectare for smallholders. Therefore, Malaysia turned into the world's driving exporter of palm oil until 1997 when it was outperformed by Indonesia in 2007 (Table 1).
The Roundtable on Sustainable Palm Oil (RSPO) was set up in 2004 as a multi-partner association comprising of oil palm producers, processors, makers, brokers, retailers, financial specialists and concerned Non-government Organizations (NGO), with the target of advancing practical palm oil through partner commitment and credible worldwide benchmarks [11].
Oil palm and nitrogen: The success of oil palm cultivation is generally determined by soil conditions and water availability
2019Vol.9 No.2:7
3© Under License of Creative Commons Attribution 3.0 License
European Journal of Experimental Biology ISSN 2248-9215
which includes physical, biological, and chemical properties of soil. Palm oil trees need nitrogen, phosphorus, and potassium in large quantities. Nitrogen deficiency is usually associated with topsoil erosion. It will result in general and stiffening of the pinnae which lose their glossy luster, reduce the number of effective fruit bunches, as well as the bunch size. The availability of soil nutrients will affect oil palm productivity [12].
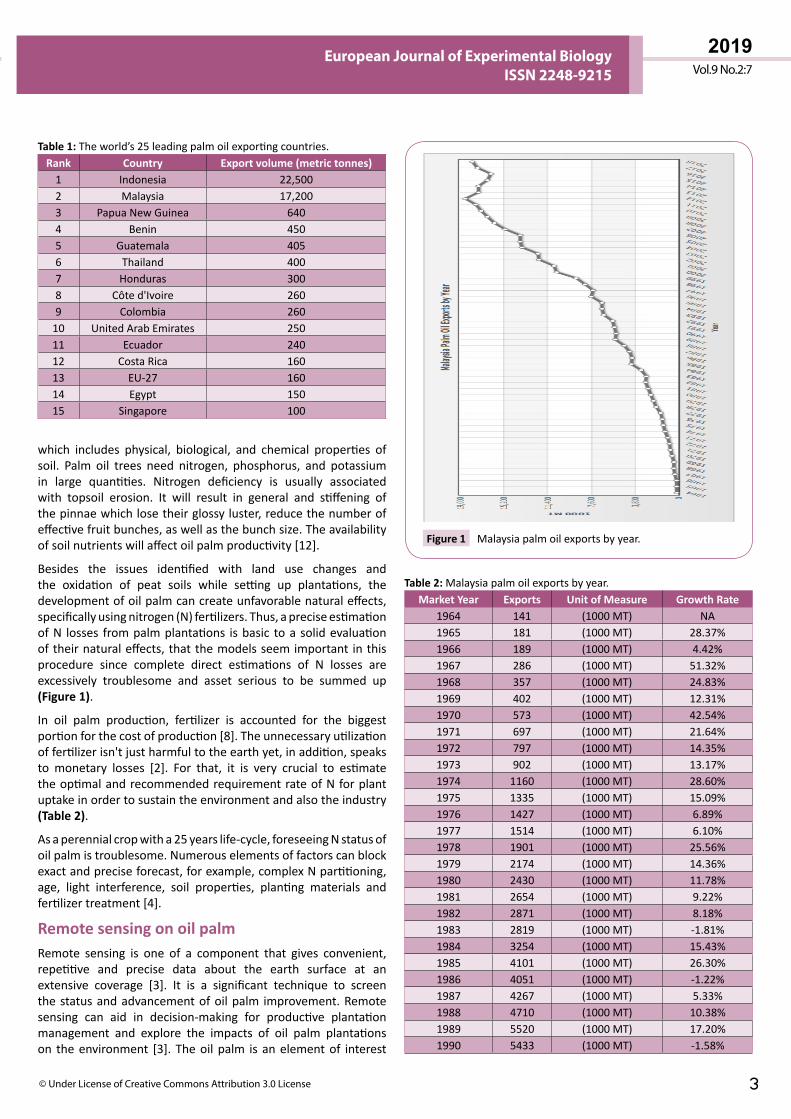
Besides the issues identified with land use changes and the oxidation of peat soils while setting up plantations, the development of oil palm can create unfavorable natural effects, specifically using nitrogen (N) fertilizers. Thus, a precise estimation of N losses from palm plantations is basic to a solid evaluation of their natural effects, that the models seem important in this procedure since complete direct estimations of N losses are excessively troublesome and asset serious to be summed up (Figure 1).
In oil palm production, fertilizer is accounted for the biggest portion for the cost of production [8]. The unnecessary utilization of fertilizer isn't just harmful to the earth yet, in addition, speaks to monetary losses [2]. For that, it is very crucial to estimate the optimal and recommended requirement rate of N for plant uptake in order to sustain the environment and also the industry (Table 2).
As a perennial crop with a 25 years life-cycle, foreseeing N status of oil palm is troublesome. Numerous elements of factors can block exact and precise forecast, for example, complex N partitioning, age, light interference, soil properties, planting materials and fertilizer treatment [4].
Remote sensing on oil palmRemote sensing is one of a component that gives convenient, repetitive and precise data about the earth surface at an extensive coverage [3]. It is a significant technique to screen the status and advancement of oil palm improvement. Remote sensing can aid in decision-making for productive plantation management and explore the impacts of oil palm plantations on the environment [3]. The oil palm is an element of interest
Table 1: The world’s 25 leading palm oil exporting countries.Rank Country Export volume (metric tonnes)
1 Indonesia 22,5002 Malaysia 17,2003 Papua New Guinea 6404 Benin 4505 Guatemala 4056 Thailand 4007 Honduras 3008 Côte d'Ivoire 2609 Colombia 260
10 United Arab Emirates 25011 Ecuador 24012 Costa Rica 16013 EU-27 16014 Egypt 15015 Singapore 100
Table 2: Malaysia palm oil exports by year.Market Year Exports Unit of Measure Growth Rate
1964 141 (1000 MT) NA1965 181 (1000 MT) 28.37%1966 189 (1000 MT) 4.42%1967 286 (1000 MT) 51.32%1968 357 (1000 MT) 24.83%1969 402 (1000 MT) 12.31%1970 573 (1000 MT) 42.54%1971 697 (1000 MT) 21.64%1972 797 (1000 MT) 14.35%1973 902 (1000 MT) 13.17%1974 1160 (1000 MT) 28.60%1975 1335 (1000 MT) 15.09%1976 1427 (1000 MT) 6.89%1977 1514 (1000 MT) 6.10%1978 1901 (1000 MT) 25.56%1979 2174 (1000 MT) 14.36%1980 2430 (1000 MT) 11.78%1981 2654 (1000 MT) 9.22%1982 2871 (1000 MT) 8.18%1983 2819 (1000 MT) -1.81%1984 3254 (1000 MT) 15.43%1985 4101 (1000 MT) 26.30%1986 4051 (1000 MT) -1.22%1987 4267 (1000 MT) 5.33%1988 4710 (1000 MT) 10.38%1989 5520 (1000 MT) 17.20%1990 5433 (1000 MT) -1.58%
Malaysia palm oil exports by year.Figure 1
2019Vol.9 No.2:7
4 This article is available in: http://www.imedpub.com/european-journal-of-experimental-biology/
European Journal of Experimental Biology ISSN 2248-9215
Hydro N-Sensor until April 2004 when Hydro Agri became Yara) is today widely used in Sweden as a device to provide information for spreading supplementary nitrogen-fertilizers according to within-field differences in demand.
The Yara N-Sensor is intended for continuously estimating the crop's nitrogen request, assessing the nitrogen prerequisite and controlling the measure of manure from the spreader. The N-Sensor is able to store data and also presented a map of the entire field that the farmers wanted to evaluate. As been said by, it is also possible to store data from the work done and to produce maps of the fertilizer application [14].
Research MethodologyLocation of study
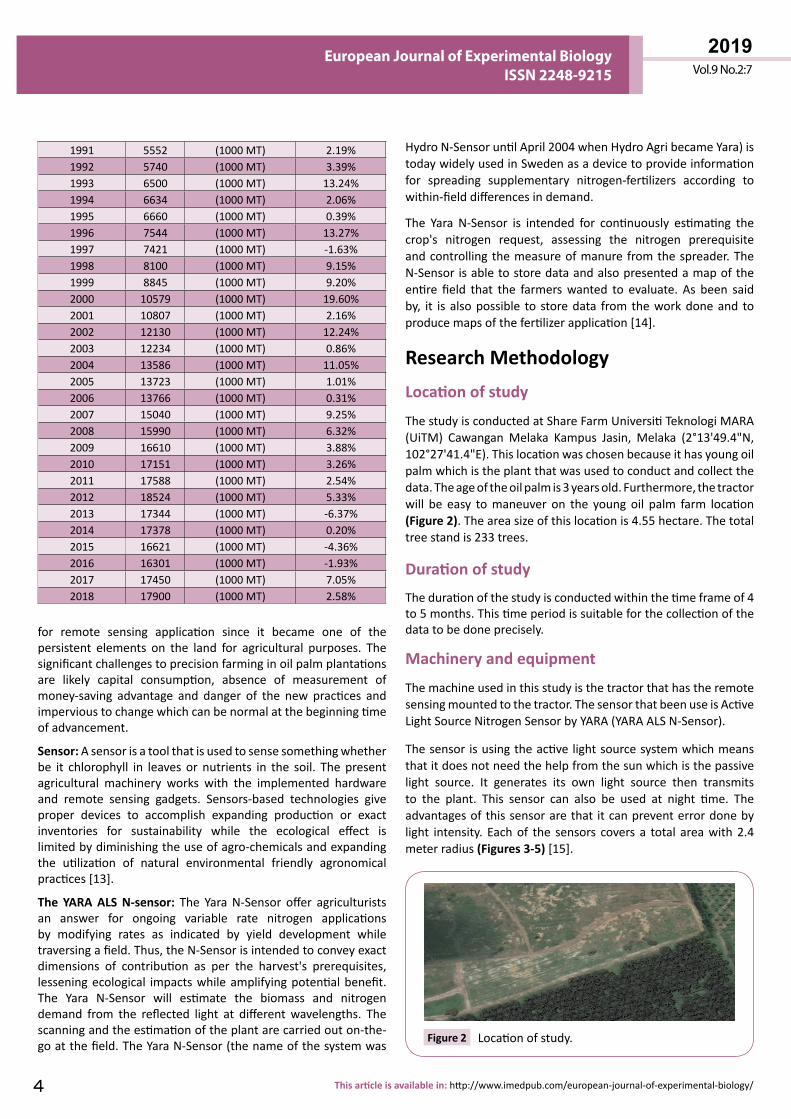
The study is conducted at Share Farm Universiti Teknologi MARA (UiTM) Cawangan Melaka Kampus Jasin, Melaka (2°13'49.4"N, 102°27'41.4"E). This location was chosen because it has young oil palm which is the plant that was used to conduct and collect the data. The age of the oil palm is 3 years old. Furthermore, the tractor will be easy to maneuver on the young oil palm farm location (Figure 2). The area size of this location is 4.55 hectare. The total tree stand is 233 trees.
Duration of studyThe duration of the study is conducted within the time frame of 4 to 5 months. This time period is suitable for the collection of the data to be done precisely.
Machinery and equipment
The machine used in this study is the tractor that has the remote sensing mounted to the tractor. The sensor that been use is Active Light Source Nitrogen Sensor by YARA (YARA ALS N-Sensor).
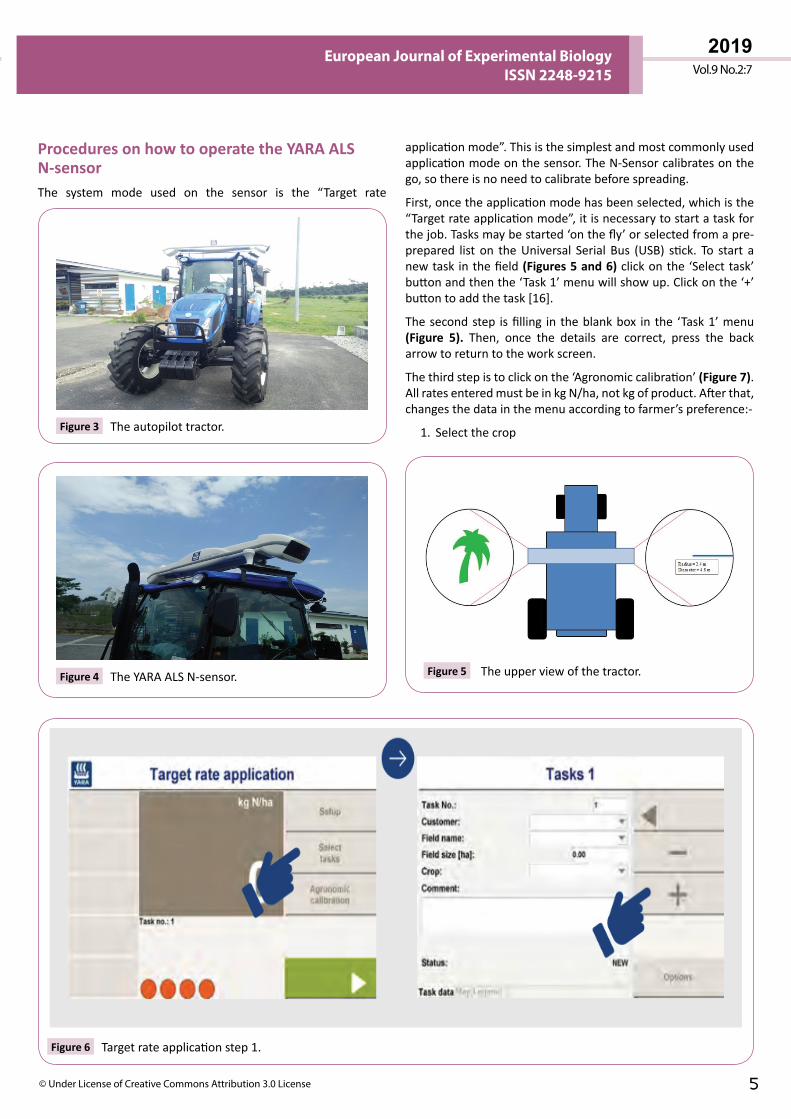
The sensor is using the active light source system which means that it does not need the help from the sun which is the passive light source. It generates its own light source then transmits to the plant. This sensor can also be used at night time. The advantages of this sensor are that it can prevent error done by light intensity. Each of the sensors covers a total area with 2.4 meter radius (Figures 3-5) [15].
for remote sensing application since it became one of the persistent elements on the land for agricultural purposes. The significant challenges to precision farming in oil palm plantations are likely capital consumption, absence of measurement of money-saving advantage and danger of the new practices and impervious to change which can be normal at the beginning time of advancement.
Sensor: A sensor is a tool that is used to sense something whether be it chlorophyll in leaves or nutrients in the soil. The present agricultural machinery works with the implemented hardware and remote sensing gadgets. Sensors-based technologies give proper devices to accomplish expanding production or exact inventories for sustainability while the ecological effect is limited by diminishing the use of agro-chemicals and expanding the utilization of natural environmental friendly agronomical practices [13].
The YARA ALS N-sensor: The Yara N-Sensor offer agriculturists an answer for ongoing variable rate nitrogen applications by modifying rates as indicated by yield development while traversing a field. Thus, the N-Sensor is intended to convey exact dimensions of contribution as per the harvest's prerequisites, lessening ecological impacts while amplifying potential benefit. The Yara N-Sensor will estimate the biomass and nitrogen demand from the reflected light at different wavelengths. The scanning and the estimation of the plant are carried out on-the-go at the field. The Yara N-Sensor (the name of the system was
1991 5552 (1000 MT) 2.19%1992 5740 (1000 MT) 3.39%1993 6500 (1000 MT) 13.24%1994 6634 (1000 MT) 2.06%1995 6660 (1000 MT) 0.39%1996 7544 (1000 MT) 13.27%1997 7421 (1000 MT) -1.63%1998 8100 (1000 MT) 9.15%1999 8845 (1000 MT) 9.20%2000 10579 (1000 MT) 19.60%2001 10807 (1000 MT) 2.16%2002 12130 (1000 MT) 12.24%2003 12234 (1000 MT) 0.86%2004 13586 (1000 MT) 11.05%2005 13723 (1000 MT) 1.01%2006 13766 (1000 MT) 0.31%2007 15040 (1000 MT) 9.25%2008 15990 (1000 MT) 6.32%2009 16610 (1000 MT) 3.88%2010 17151 (1000 MT) 3.26%2011 17588 (1000 MT) 2.54%2012 18524 (1000 MT) 5.33%2013 17344 (1000 MT) -6.37%2014 17378 (1000 MT) 0.20%2015 16621 (1000 MT) -4.36%2016 16301 (1000 MT) -1.93%2017 17450 (1000 MT) 7.05%2018 17900 (1000 MT) 2.58%
Location of study.Figure 2
2019Vol.9 No.2:7
5© Under License of Creative Commons Attribution 3.0 License
European Journal of Experimental Biology ISSN 2248-9215
application mode”. This is the simplest and most commonly used application mode on the sensor. The N-Sensor calibrates on the go, so there is no need to calibrate before spreading.
First, once the application mode has been selected, which is the “Target rate application mode”, it is necessary to start a task for the job. Tasks may be started ‘on the fly’ or selected from a pre-prepared list on the Universal Serial Bus (USB) stick. To start a new task in the field (Figures 5 and 6) click on the ‘Select task’ button and then the ‘Task 1’ menu will show up. Click on the ‘+’ button to add the task [16].
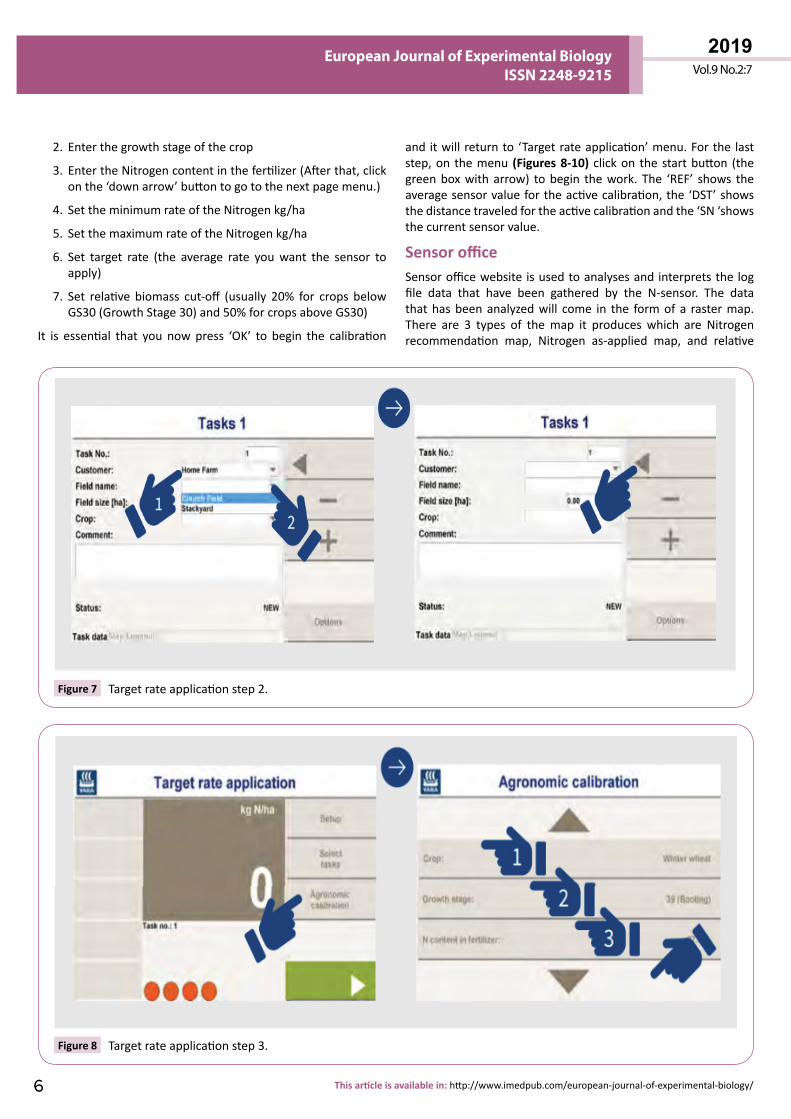
The second step is filling in the blank box in the ‘Task 1’ menu (Figure 5). Then, once the details are correct, press the back arrow to return to the work screen.
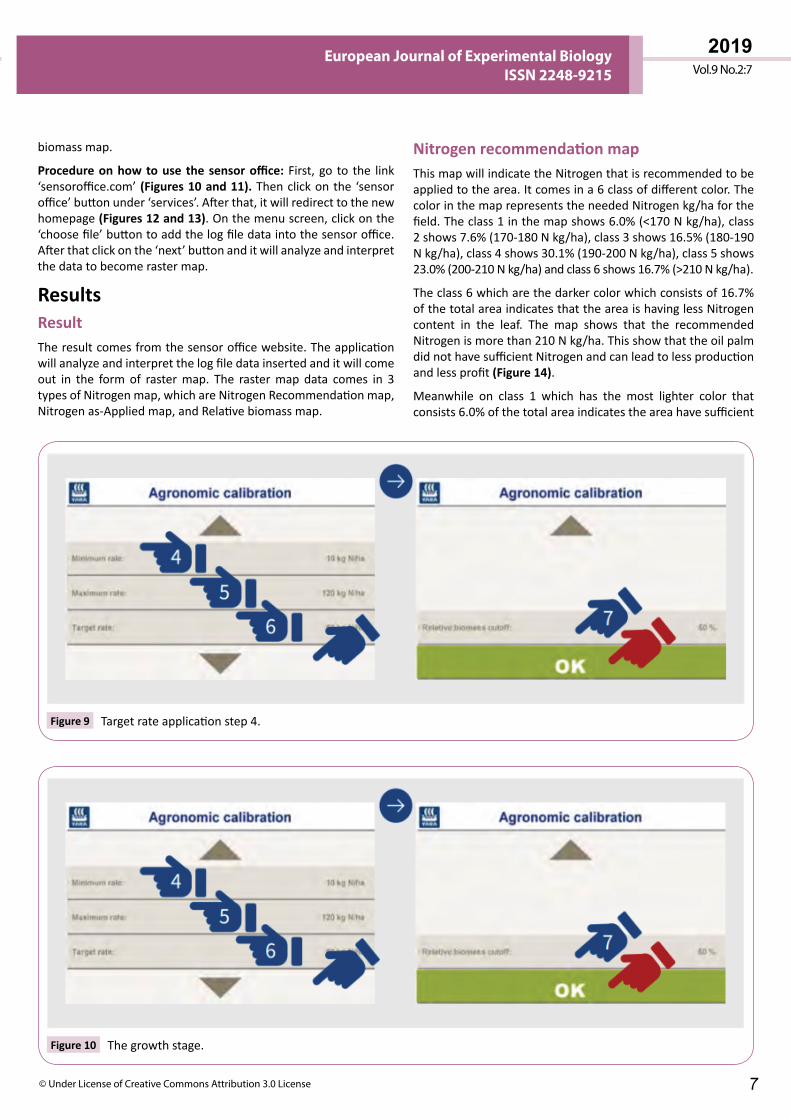
The third step is to click on the ‘Agronomic calibration’ (Figure 7). All rates entered must be in kg N/ha, not kg of product. After that, changes the data in the menu according to farmer’s preference:-
1. Select the cropThe autopilot tractor.Figure 3
The YARA ALS N-sensor.Figure 4 The upper view of the tractor.Figure 5
Target rate application step 1.Figure 6
Procedures on how to operate the YARA ALS N-sensorThe system mode used on the sensor is the “Target rate
2019Vol.9 No.2:7
6 This article is available in: http://www.imedpub.com/european-journal-of-experimental-biology/
European Journal of Experimental Biology ISSN 2248-9215
and it will return to ‘Target rate application’ menu. For the last step, on the menu (Figures 8-10) click on the start button (the green box with arrow) to begin the work. The ‘REF’ shows the average sensor value for the active calibration, the ‘DST’ shows the distance traveled for the active calibration and the ‘SN ‘shows the current sensor value.
Sensor officeSensor office website is used to analyses and interprets the log file data that have been gathered by the N-sensor. The data that has been analyzed will come in the form of a raster map. There are 3 types of the map it produces which are Nitrogen recommendation map, Nitrogen as-applied map, and relative
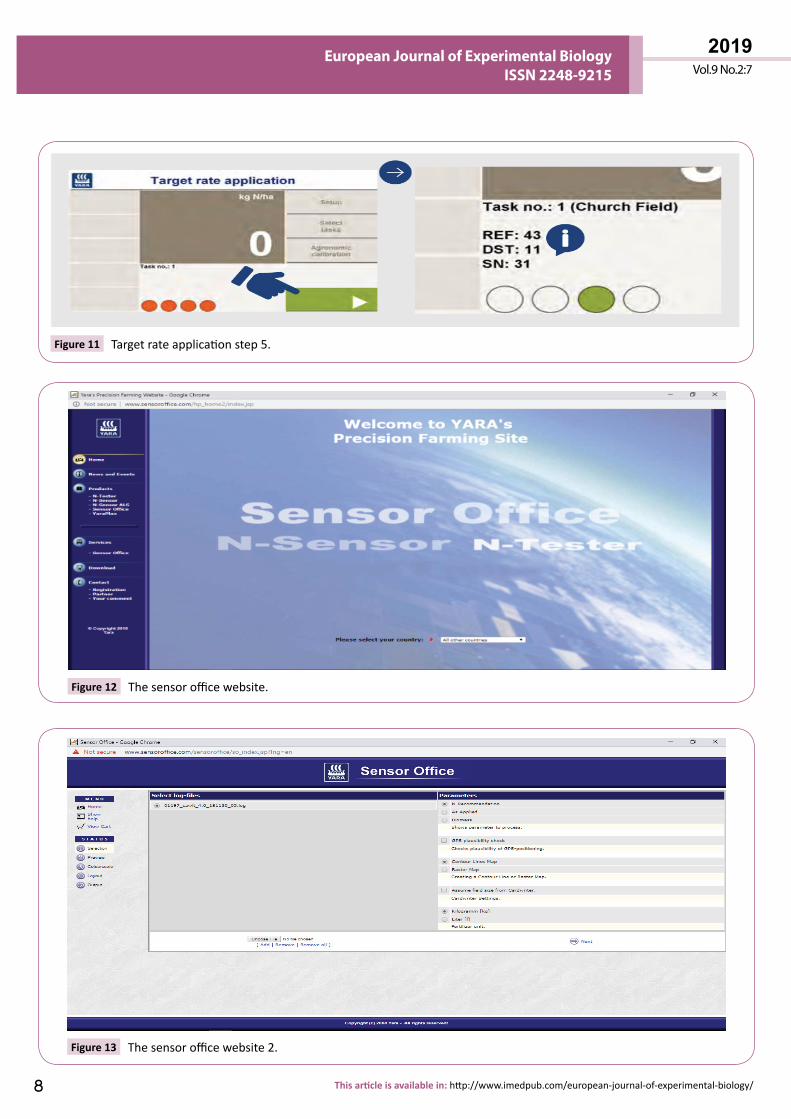
2. Enter the growth stage of the crop
3. Enter the Nitrogen content in the fertilizer (After that, click on the ‘down arrow’ button to go to the next page menu.)
4. Set the minimum rate of the Nitrogen kg/ha
5. Set the maximum rate of the Nitrogen kg/ha
6. Set target rate (the average rate you want the sensor to apply)
7. Set relative biomass cut-off (usually 20% for crops below GS30 (Growth Stage 30) and 50% for crops above GS30)
It is essential that you now press ‘OK’ to begin the calibration
Target rate application step 2.Figure 7
Target rate application step 3.Figure 8
2019Vol.9 No.2:7
7© Under License of Creative Commons Attribution 3.0 License
European Journal of Experimental Biology ISSN 2248-9215
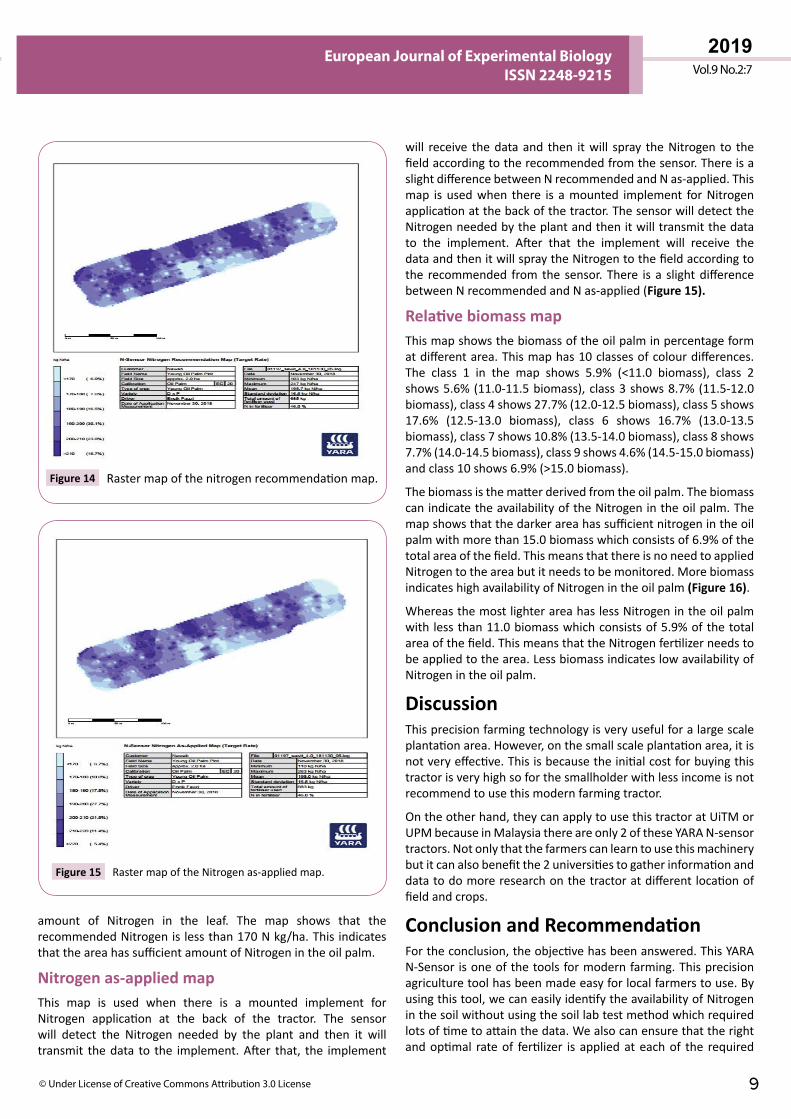
Nitrogen recommendation mapThis map will indicate the Nitrogen that is recommended to be applied to the area. It comes in a 6 class of different color. The color in the map represents the needed Nitrogen kg/ha for the field. The class 1 in the map shows 6.0% (<170 N kg/ha), class 2 shows 7.6% (170-180 N kg/ha), class 3 shows 16.5% (180-190 N kg/ha), class 4 shows 30.1% (190-200 N kg/ha), class 5 shows 23.0% (200-210 N kg/ha) and class 6 shows 16.7% (>210 N kg/ha).
The class 6 which are the darker color which consists of 16.7% of the total area indicates that the area is having less Nitrogen content in the leaf. The map shows that the recommended Nitrogen is more than 210 N kg/ha. This show that the oil palm did not have sufficient Nitrogen and can lead to less production and less profit (Figure 14).
Meanwhile on class 1 which has the most lighter color that consists 6.0% of the total area indicates the area have sufficient
Target rate application step 4.Figure 9
biomass map.
Procedure on how to use the sensor office: First, go to the link ‘sensoroffice.com’ (Figures 10 and 11). Then click on the ‘sensor office’ button under ‘services’. After that, it will redirect to the new homepage (Figures 12 and 13). On the menu screen, click on the ‘choose file’ button to add the log file data into the sensor office. After that click on the ‘next’ button and it will analyze and interpret the data to become raster map.
ResultsResultThe result comes from the sensor office website. The application will analyze and interpret the log file data inserted and it will come out in the form of raster map. The raster map data comes in 3 types of Nitrogen map, which are Nitrogen Recommendation map, Nitrogen as-Applied map, and Relative biomass map.
The growth stage.Figure 10
2019Vol.9 No.2:7
8 This article is available in: http://www.imedpub.com/european-journal-of-experimental-biology/
European Journal of Experimental Biology ISSN 2248-9215
Target rate application step 5.Figure 11
The sensor office website.Figure 12
The sensor office website 2.Figure 13
2019Vol.9 No.2:7
9© Under License of Creative Commons Attribution 3.0 License
European Journal of Experimental Biology ISSN 2248-9215
amount of Nitrogen in the leaf. The map shows that the recommended Nitrogen is less than 170 N kg/ha. This indicates that the area has sufficient amount of Nitrogen in the oil palm.
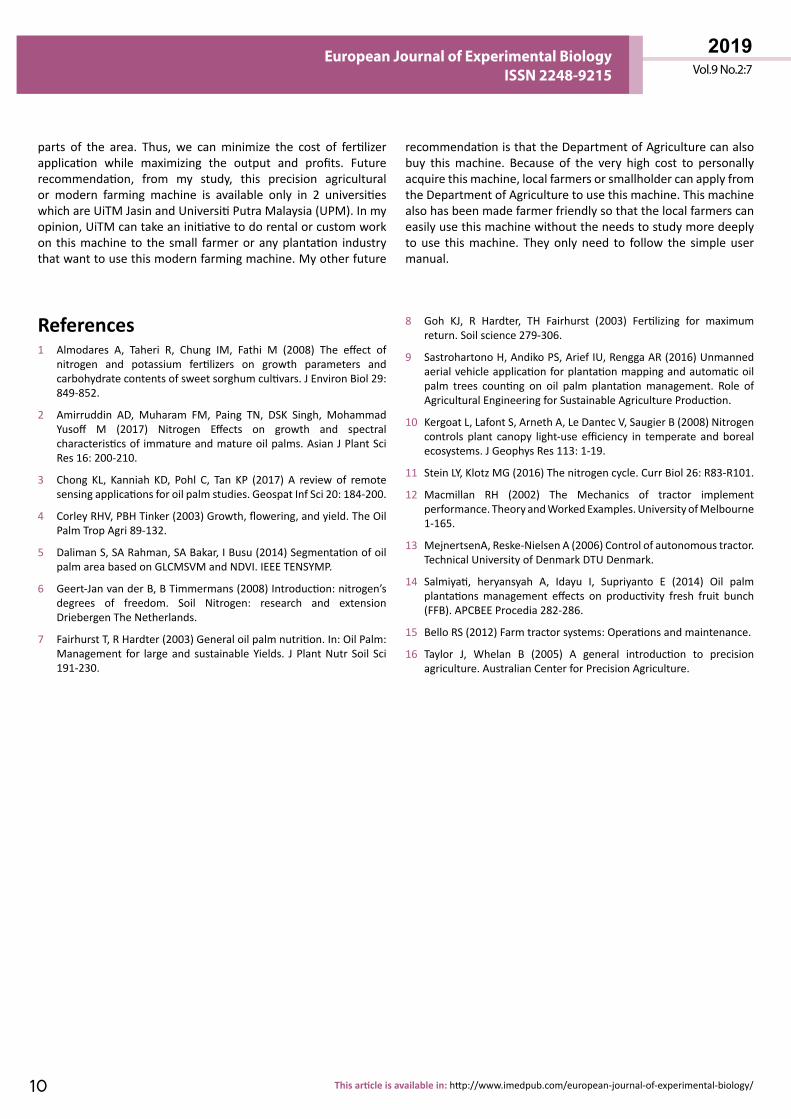
Nitrogen as-applied mapThis map is used when there is a mounted implement for Nitrogen application at the back of the tractor. The sensor will detect the Nitrogen needed by the plant and then it will transmit the data to the implement. After that, the implement
will receive the data and then it will spray the Nitrogen to the field according to the recommended from the sensor. There is a slight difference between N recommended and N as-applied. This map is used when there is a mounted implement for Nitrogen application at the back of the tractor. The sensor will detect the Nitrogen needed by the plant and then it will transmit the data to the implement. After that the implement will receive the data and then it will spray the Nitrogen to the field according to the recommended from the sensor. There is a slight difference between N recommended and N as-applied (Figure 15).
Relative biomass mapThis map shows the biomass of the oil palm in percentage form at different area. This map has 10 classes of colour differences. The class 1 in the map shows 5.9% (<11.0 biomass), class 2 shows 5.6% (11.0-11.5 biomass), class 3 shows 8.7% (11.5-12.0 biomass), class 4 shows 27.7% (12.0-12.5 biomass), class 5 shows 17.6% (12.5-13.0 biomass), class 6 shows 16.7% (13.0-13.5 biomass), class 7 shows 10.8% (13.5-14.0 biomass), class 8 shows 7.7% (14.0-14.5 biomass), class 9 shows 4.6% (14.5-15.0 biomass) and class 10 shows 6.9% (>15.0 biomass).
The biomass is the matter derived from the oil palm. The biomass can indicate the availability of the Nitrogen in the oil palm. The map shows that the darker area has sufficient nitrogen in the oil palm with more than 15.0 biomass which consists of 6.9% of the total area of the field. This means that there is no need to applied Nitrogen to the area but it needs to be monitored. More biomass indicates high availability of Nitrogen in the oil palm (Figure 16).
Whereas the most lighter area has less Nitrogen in the oil palm with less than 11.0 biomass which consists of 5.9% of the total area of the field. This means that the Nitrogen fertilizer needs to be applied to the area. Less biomass indicates low availability of Nitrogen in the oil palm.
DiscussionThis precision farming technology is very useful for a large scale plantation area. However, on the small scale plantation area, it is not very effective. This is because the initial cost for buying this tractor is very high so for the smallholder with less income is not recommend to use this modern farming tractor.
On the other hand, they can apply to use this tractor at UiTM or UPM because in Malaysia there are only 2 of these YARA N-sensor tractors. Not only that the farmers can learn to use this machinery but it can also benefit the 2 universities to gather information and data to do more research on the tractor at different location of field and crops.
Conclusion and RecommendationFor the conclusion, the objective has been answered. This YARA N-Sensor is one of the tools for modern farming. This precision agriculture tool has been made easy for local farmers to use. By using this tool, we can easily identify the availability of Nitrogen in the soil without using the soil lab test method which required lots of time to attain the data. We also can ensure that the right and optimal rate of fertilizer is applied at each of the required
Raster map of the nitrogen recommendation map.Figure 14
Raster map of the Nitrogen as-applied map.Figure 15
2019Vol.9 No.2:7
10 This article is available in: http://www.imedpub.com/european-journal-of-experimental-biology/
European Journal of Experimental Biology ISSN 2248-9215
parts of the area. Thus, we can minimize the cost of fertilizer application while maximizing the output and profits. Future recommendation, from my study, this precision agricultural or modern farming machine is available only in 2 universities which are UiTM Jasin and Universiti Putra Malaysia (UPM). In my opinion, UiTM can take an initiative to do rental or custom work on this machine to the small farmer or any plantation industry that want to use this modern farming machine. My other future
recommendation is that the Department of Agriculture can also buy this machine. Because of the very high cost to personally acquire this machine, local farmers or smallholder can apply from the Department of Agriculture to use this machine. This machine also has been made farmer friendly so that the local farmers can easily use this machine without the needs to study more deeply to use this machine. They only need to follow the simple user manual.
8 Goh KJ, R Hardter, TH Fairhurst (2003) Fertilizing for maximum return. Soil science 279-306.
9 Sastrohartono H, Andiko PS, Arief IU, Rengga AR (2016) Unmanned aerial vehicle application for plantation mapping and automatic oil palm trees counting on oil palm plantation management. Role of Agricultural Engineering for Sustainable Agriculture Production.
10 Kergoat L, Lafont S, Arneth A, Le Dantec V, Saugier B (2008) Nitrogen controls plant canopy light-use efficiency in temperate and boreal ecosystems. J Geophys Res 113: 1-19.
11 Stein LY, Klotz MG (2016) The nitrogen cycle. Curr Biol 26: R83-R101.
12 Macmillan RH (2002) The Mechanics of tractor implement performance. Theory and Worked Examples. University of Melbourne 1-165.
13 MejnertsenA, Reske-Nielsen A (2006) Control of autonomous tractor. Technical University of Denmark DTU Denmark.
14 Salmiyati, heryansyah A, Idayu I, Supriyanto E (2014) Oil palm plantations management effects on productivity fresh fruit bunch (FFB). APCBEE Procedia 282-286.
15 Bello RS (2012) Farm tractor systems: Operations and maintenance.
16 Taylor J, Whelan B (2005) A general introduction to precision agriculture. Australian Center for Precision Agriculture.
References1 Almodares A, Taheri R, Chung IM, Fathi M (2008) The effect of
nitrogen and potassium fertilizers on growth parameters and carbohydrate contents of sweet sorghum cultivars. J Environ Biol 29: 849-852.
2 Amirruddin AD, Muharam FM, Paing TN, DSK Singh, Mohammad Yusoff M (2017) Nitrogen Effects on growth and spectral characteristics of immature and mature oil palms. Asian J Plant Sci Res 16: 200-210.
3 Chong KL, Kanniah KD, Pohl C, Tan KP (2017) A review of remote sensing applications for oil palm studies. Geospat Inf Sci 20: 184-200.
4 Corley RHV, PBH Tinker (2003) Growth, flowering, and yield. The Oil Palm Trop Agri 89-132.
5 Daliman S, SA Rahman, SA Bakar, I Busu (2014) Segmentation of oil palm area based on GLCMSVM and NDVI. IEEE TENSYMP.
6 Geert-Jan van der B, B Timmermans (2008) Introduction: nitrogen’s degrees of freedom. Soil Nitrogen: research and extension Driebergen The Netherlands.
7 Fairhurst T, R Hardter (2003) General oil palm nutrition. In: Oil Palm: Management for large and sustainable Yields. J Plant Nutr Soil Sci 191-230.