Embed Size (px)
Citation preview

Scientific Papers (www.scientificpapers.org) Journal of Knowledge Management, Economics and Information Technology
1
Vol. IV, Issue 5 October 2014
Profit and Cost Efficiency Analysis in
Banking Sector: A Case of Stochastic
Frontier Approach for Vietnam
Author: Le Thi Thanh Ngan, Economics Faculty, Nha Trang
University, Nha Trang City, Vietnam,
By using stochastic frontier analysis (SFA) approach to measure the cost and
profit efficiency for data of 45 Vietnam commercial banks over the years from
2007 to 2012, this paper highlights risk and asset quality factors related to cost
and profit inefficiency of the banks. Besides, cost inefficiency seems to be
strongly related to bank concentration, mergers, and bank ownership. These
results suggested mergers and acquisition can gain potential cost inefficiency
and foster banks’ competition in the banking system. Based on test of variance
analysis, State owned commercial banks (SCOB) is more efficiency than other
domestic, commercial banks (JSCB) and foreign banks in terms of profit
efficiency, in contrast to cost efficiency, international banks are leading in
cost efficiency than other national banks.
Keywords: Cost efficiency, profit efficiency, stochastic frontier analysis,
market concentration, mergers and acquisitions, non-performing loans, risks
and asset quality.
Introduction
The trend of financial liberalization and banking reforms, restructuring via
merging and acquisitions activities strongly happened in developing
countries due to two main biggest financial crises in 1997 and 2008. Vietnam
has similar evolution as other regional countries, but it becomes the

Profit and Cost Efficiency Analysis in Banking Sector: A Case of Stochastic Frontier Approach for Vietnam
2
Vol. IV, Issue 5 October 2014
interesting case study when the country was noticed by its achievement
through overcoming successfully over these difficult times. Some evidences
show Vietnam’s economic growth was partial supported from the huge
expansion of bank credit. Specifically, in 2001, domestic credit was from 35
per cent of GDP which had rocketed to 120 per cent by 2010 and 2012 still
moving around 104.9 %. This point is a positive sign for Vietnam economy.
However, there are some arising problems to prove that Vietnam
commercial banks are operating in challenging environment. First, their
performance based on encouraging banking imprudent lending led to
unsustainable credit growth of 32–54 per cent per year before 2011. A deposit
credit rate slumps to 7 % which contributing to a drop in GDP growth to
5.03 per cent in 2012 due to lacking trusts among borrowers and investors [1].
In addition, Vietnamese banking sector also reflexes the notable weaknesses
during the progress of banking reform. Since Non-performing loans (NPL)
figures which measure for bad debts officially estimated at around 6–8 per
cent of bank assets, and many international reports discussed about the
transparencies of data. A the topic of how Vietnam can control Non-
performing loan issue and remain it not to be high in the future was
discussed by international conferences in East Asia region in recent years.
What is more, Overbanked is also a problem, at the end of 2010 to 2011,
Prime minister mandate the State bank of Vietnam (SBV) should try to have
15-17 banks by 2015. After Decision 254, the Bank enforces mergers of five
financial institutions. Until now, there is very little progress, just
consolidation of two banks or 4 banks into 2 other banks.
In Vietnam, total costs of the Vietnamese banking industry
increased on average by 32.2 per cent per year during 2000–2006. However,
Vu & Turnell, (2010) [2] found in their research, cost efficiency is around
87% of the total cost and insignificant difference among bank types. And
with profit efficiency, Vu & Nahm (2013)[3] suggested that Vietnam banks’
profit efficiency can be increased based on focusing on regulations from
government, reduction of NPLs and cost-to-asset ratios. They found state-
owned banks in Vietnam are more profit efficient than private banks on
average, and domestic banks are less efficient than foreign banks in the
period of 2000 – 2006. Besides, there is a few national research of banking
efficiency with appropriate methodologies in Vietnam. From these facts
above, whether the Vietnam banking system is healthy industry and efficient
to support Vietnam economy? How Vietnamese Banks’s profit and cost

Profit and Cost Efficiency Analysis in Banking Sector: A Case of Stochastic Frontier Approach for Vietnam
3
Vol. IV, Issue 5 October 2014
efficiency change after 2008 Global Financial Crisis? What the difference
between cost efficiency and profit efficiency in relation to risk and quality
asset and other potential correlates? And whether Foreign Banks’s cost and
profit structure are more efficient than domestic banks in Vietnam are our
research questions.
Literature Reviews and Theoretical framework
In the banking sector, cost efficiency and profit efficiency is two general
concepts which represent to bank performance and bank efficiency. Based
on that, series of researches was implemented at national level, majority
studies conducted in developed countries, less studied in developing ones
and at international level as cross section region as European or ASEAN.
Regards as cost efficiency literature, Berger and Humphrey (1997) [4]
pointed out the different the between results from the estimation of five
types of frontier models, namely nonparametric approach (DEA, FDH) and
parametric (SFA, TFA and DFA) for assessing cost efficiency from the results
of 130 surveys of financial institution analysis across 21 countries. In general,
the efficiency estimates from nonparametric methods are similar to
those from parametric frontiers, but its results often obtained slightly
lower mean efficiency as well as having greater dispersion than the
parametric models’ results. Besides, the different among efficiency rankings
depend on frontier approaches. Furthermore, they stated causes or
correlates of efficiency should need to be caution in efficiency measurement.
From their surveys, they suggested the importance of estimates of mean
efficiency can be reliable guidance for government policy and research in
national and business management level. It is necessary for evaluating the
effects of deregulation, market power or mergers and acquisitions on
industry efficiency to inform government policy. Another study works
notable from Berger & Mester (1997)[5] when these authors investigate
“inside black box” to explain the Banks’s efficiency with data from 6000 US
commercial banks during the period of 1990 to 1995. They suggested how
the choice of different design models affects efficiency measures based on
the use of three kinds of economics efficiency concepts of the cost structure,
standard profit as well as an alternative profit. The benefit and drawbacks of
each type discussed quite clear here. In this paper, they investigated the use
of the distribution free approach (DFA) and SFA, inclusion examining the

Profit and Cost Efficiency Analysis in Banking Sector: A Case of Stochastic Frontier Approach for Vietnam
4
Vol. IV, Issue 5 October 2014
differences between the specification of the Fourier-flexible functional
form and the trans log form. This study is the first research use a
comprehensive set of bank size, organizational ownership and corporate
governance, specific bank characteristics, market characteristics, the federal
regulator and geographic restrictions by state, called potential correlates of
efficiency. The results reported as new evidence when different
measurement method or functional form and other variables make very
little difference in terms of average banks efficiency or ranking of banks
efficiency. One of the important arguments is SFA provides results more
useful than other non-parametric techniques due to economic optimization.
Another point is the profit efficiency negatively correlated with cost
efficiency.
Hughes & Mester (2008) [6] presented the full set of theory,
evidence of banking efficiency estimation. This study gives a background
and discussion of two general empirical methods (nonstructure and
structure approach) in measuring bank performance. Some relations
between ownership and mergers with bank value that was presented here.
Altunbas at all (2000) [7] examine the effects of risk and quality factors on
Japanese commercial banks cost during the period of 1993 to 1996. They
utilized stochastic cost frontier to measure scale efficiency, X-efficiency and
technical development. They found that the financial capital has a huge
influence on optimal banks size. If the risk and quality factors were taken
account in bank cost estimation, the optimal banks size is smaller. If not, the
optimal banks size is overstated. And scale efficiency is more sensitive to
risk and asset quality than X-efficiency. They also pointed out the technical
change has reduced the production’s cost over times. Next, Isik, I., &
Hassan, M. K. (2002)[8] also applied stochastic frontier method to
investigate the effect of bank size, governance, ownership and corporate
control on Turkish bank’s cost and profit efficiency during the period of 1988
to 1196. The bank’s profit efficiency on average is estimated around 84%.
They found the linkage level of cost and profit efficiency is significant low,
the meaning is high profit efficiency does not need a high cost efficiency. In
their paper, they used some outputs related to short and long term loans
and balance sheet items, and other earning assets. However, the difference is
two step estimations. They used the inter-temporal comparison between the
costs, profit efficiency with ownership, bank size and governance, corporate
control. They concluded that the gap between the inefficiency banks and

Profit and Cost Efficiency Analysis in Banking Sector: A Case of Stochastic Frontier Approach for Vietnam
5
Vol. IV, Issue 5 October 2014
efficiency bank is wider, such as in cost structure, 4% and 84% in 1996
respectively and explained reason here is technology catch-up. One of their
findings is both cost and profit efficiency, when bank size increase will lead
a drop systematically and monotonically.
For Asian countries data, Manlagñit, (2011) [9] interested in
investigating a relationship between risk and banking efficiency of
Philippine commercial banks by using stochastic frontier approach from
1990 to 1999. They included risk and asset quality measures in the cost
estimation and use the one-step estimation follow Battese and Coelli
(1995)[10]. The author found the 1997 Asian financial crisis may adverse
effect on the cost inefficiency, banking reforms and regulatory enhanced the
Philippine banking sector’s strength. They proved Mergers and acquisitions
have negative significant relationship with cost inefficiency. In the same
research interest, Montgomery et all (2014) [11] examined the cost and profit
efficiency under banking sector consolidation effects by using two step
estimation with data from Japan during 1996 till 2009. Their results
indicated bank merger events have significantly lower cost efficiency
and little impact on profit efficiency and concluded that increasing market
power by merged banks tend to be more profit and cost efficient. Their
methodology separated the bank consolidation effect on cost and profit
efficiency into the efficiency measurement under bank operating risks
independently, ranking these scores and regressed these scores with bank
market power, M&A effects.
In Vietnam, many authors employed standard accounting ratios to
estimate banking efficiency. Lien. D (2013)[12] investigate the determinants
of profit efficiency between foreign banks and domestic banks in
relationship with bank’ specific factors, multinational bank indicators and
macro-economic factors by using Data from 2000 to 2012 taken from Fitch
Ratings source. She concluded the international banks performed better
than Vietnamese national bank because of their ownership’ advantages. Vu
& Turnell, (2010)[2] measure how Vietnamese bank’s cost efficiency varied
during 200-2006 by using Bayesian technique. They fail to incorporate
monotonicity and concavity conditions into cost function estimation so it
would lead to biased estimation and misleading bank rankings as well as
median cost efficiency does not affect the ranking on cost efficiency.
Officially, our paper aims to apply one step rather than two step estimation
to reduce the bias results in estimation process and also we try to capture

Profit and Cost Efficiency Analysis in Banking Sector: A Case of Stochastic Frontier Approach for Vietnam
6
Vol. IV, Issue 5 October 2014
determinants effects of risk and asset quality as additional variables on cost
efficiency and profit efficiency..
This paper uses the stochastic cost frontier analysis independently
proposed by Aigner, Lovell, and Schmidt (1977) [13] and Meeusen and van
der Broeck (1977) [14], which is a means to measure the relative performance
of banks by objectively providing numerical efficiency values and ranking
these accordingly. To be in detail, a commercial bank is considered
inefficient if its costs or profit are higher than those predicted for an
efficient commercial bank producing the same output under the same
existing conditions with the difference unexplainable by statistical noise.
Specifically, a stochastic cost function model implies that the bank’s
observed total cost and operating profit will deviate from the efficient
frontier. For panel data, the profit and cost function can be written as
ititititit wyYY ),,(ln)ln(
(1)
tiY , : log the outcome variables, (here is profit and cost) of the ith
bank (i=1,2…,N) at time tth
year (t=1,2,3…, T). N is the number of banks. ity:
Vector of banking output, wit : the vector of input price; : vector of
unknown coefficients for the associated output and input price variables in
efficiency estimation.
The composition error term or stochastic error term is ti , which
was followed [13] and Collie (1988) [15], where tititi uv ,,, for case of
profit function and tititi uv ,,, for case of cost function. Here, tiv ,
represents errors of approximation and other sources of statistical noise
assumed to be independent and identically distributed as N ),0(
2
v and
tiu , is a random variable which is assumed to be an independently but not
identically distributed non-negative random variable. The important point
here, tiu , is estimated as functional form of vector of appropriate
explanatory variables under this one-step approach, the formulation is
ititit zu (2)
Where itu follows a truncated-normal distribution with mean and
variances; zit : is a vector of explanatory variables, i.e., risk and quality

Profit and Cost Efficiency Analysis in Banking Sector: A Case of Stochastic Frontier Approach for Vietnam
7
Vol. IV, Issue 5 October 2014
variables and potential correlates that may influence the efficiency of the
banks; is a vector of parameters to be estimated; and it is defined by
the truncation of the normal distribution N ),0( 2 , such that the point of
truncation is -itz
. So, to assure that itu is non-negative, the condition is
itit z. Jondrow, J., Lovell, C., Materov, I., & Schmidt, P. (1982)[16]
suggested the maximum likelihood estimation allowed to generate estimates
of all parameters of the frontier function as well as estimates of the
unknown parameters σ, η and γ. After solving the maximum likelihood
problem, aggregate residuals ε can be derived by substituting the estimated
parameter vector β into the production function (1). Technical efficiency
estimation formulation
*2
1*exp
*
*1
*
**1
]|}[exp{ 2
,,,,
ti
it
it
tititi uETE
(3)
where : 22
222
,,
/.*
/*
vuvu
vuutiti
(.) Denotes the cumulative distribution function of standard normal
distribution.
Empirical Methodology and Data
Our main database in this research is Bankscope and we obtained the
balance sheet and income statement 45 banks from 2007 to 2012. Data
includes 5 state-owned commercial banks (SOCBs) and 4 joint – venture
commercial banks, 5 Foreign Banks (FBs) and 31 Joint Stock commercial
banks (JSCBs). The intermediation approach focuses on the bank’s
production of intermediation services and the total cost of production,
including both interest and operating expenses [9]. Profit ( ) is operating
profits and Total cost are two outcomes. Two outputs are Net Loan (y1) and
Total Securities (y2) are earning assets, obtained from database. Price of
physical capital (w1) is calculated by using total non-personnel expense over
Profit and Cost Efficiency Analysis in Banking Sector: A Case of Stochastic Frontier Approach for Vietnam
8
Vol. IV, Issue 5 October 2014
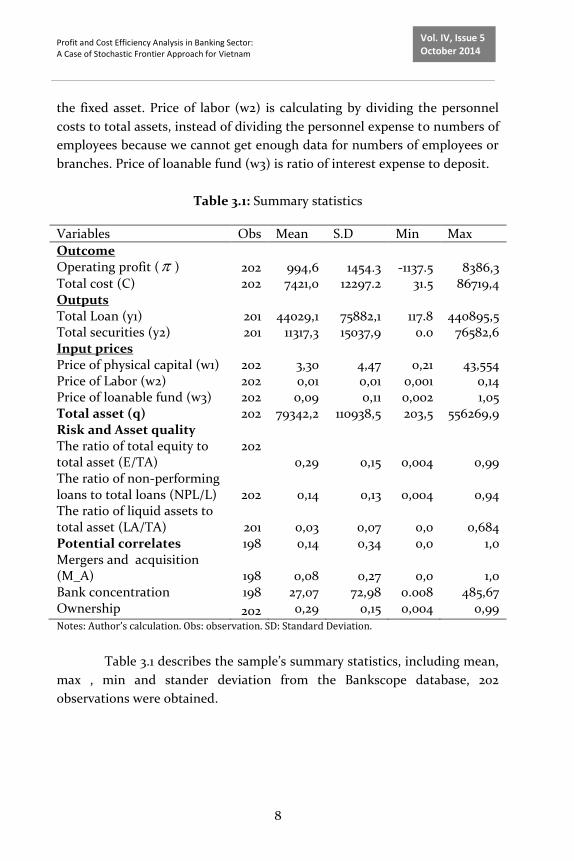
the fixed asset. Price of labor (w2) is calculating by dividing the personnel
costs to total assets, instead of dividing the personnel expense to numbers of
employees because we cannot get enough data for numbers of employees or
branches. Price of loanable fund (w3) is ratio of interest expense to deposit.
Table 3.1: Summary statistics
Variables Obs Mean S.D Min Max
Outcome Operating profit ( ) 202 994,6 1454.3 -1137.5 8386,3 Total cost (C) 202 7421,0 12297.2 31.5 86719,4 Outputs Total Loan (y1) 201 44029,1 75882,1 117.8 440895,5 Total securities (y2) 201 11317,3 15037,9 0.0 76582,6 Input prices Price of physical capital (w1) 202 3,30 4,47 0,21 43,554 Price of Labor (w2) 202 0,01 0,01 0,001 0,14 Price of loanable fund (w3) 202 0,09 0,11 0,002 1,05 Total asset (q) 202 79342,2 110938,5 203,5 556269,9 Risk and Asset quality The ratio of total equity to total asset (E/TA)
202 0,29 0,15 0,004 0,99
The ratio of non-performing loans to total loans (NPL/L) 202 0,14 0,13 0,004 0,94 The ratio of liquid assets to total asset (LA/TA) 201 0,03 0,07 0,0 0,684 Potential correlates 198 0,14 0,34 0,0 1,0 Mergers and acquisition (M_A) 198 0,08 0,27 0,0 1,0 Bank concentration 198 27,07 72,98 0.008 485,67 Ownership 202 0,29 0,15 0,004 0,99
Notes: Author’s calculation. Obs: observation. SD: Standard Deviation.
Table 3.1 describes the sample’s summary statistics, including mean,
max , min and stander deviation from the Bankscope database, 202
observations were obtained.

Profit and Cost Efficiency Analysis in Banking Sector: A Case of Stochastic Frontier Approach for Vietnam
9
Vol. IV, Issue 5 October 2014
Profit efficiency estimation1
itit
it
h
it
j
jh
hj
it
l
it
h
l
hl
h
it
k
it
j
k
jk
j
it
h
h
h
it
j
i
jo
it
uvT
w
w
q
y
w
w
q
w
q
y
q
y
w
w
q
y
qw
3
2
1
2
1
3
2
1
2
1
2
1
2
1
3
2
1
2
13
lnln
lnln2
1
lnln2
1
lnlnln
(4)
Where i, t : reprensent for bank i and time t, and : ordinary profit.
yk : represent the jth and kth output ; wh : input price at hth . And ui :
indicated inefficiency of bank i at time t.
Cost efficiency estimation
itit
it
h
it
j
jh
hj
it
l
it
h
l
hl
h
it
k
it
j
k
jk
j
it
h
h
h
it
j
i
jo
it
uvT
w
w
q
y
w
w
q
w
q
y
q
y
w
w
q
y
qw
C
3
2
1
2
1
3
2
1
2
1
2
1
2
1
3
2
1
2
13
lnln
lnln2
1
lnln2
1
lnlnln
(5)
1 Profit efficiency was estimated by the concept of alternative profit efficiency. In the banking efficiency literature it has become standard practice to use an alternative profit function, employing the same exogenous variables. The meaning of this concept is how close a bank comes to earning maximum profits given its output levels rather than its output prices. (Berger & Mester, 1997)[5]. A standard profit function would specify output prices, but output prices are not accurately measured for the banking sector

Profit and Cost Efficiency Analysis in Banking Sector: A Case of Stochastic Frontier Approach for Vietnam
10
Vol. IV, Issue 5 October 2014
Where C: total cost, other variables was explained above. There are
some way to avoid heteroskedastiscity and assure for homogeneity condition
by dividing output by total assets, as well as dividing cost and input prices
by input when choosing put variables into equation (4) and (5). Adding risks
and asset quality and examining the efficiency correlates, this study employs
the Battese and Coelli (1995) model. This model allows the simultaneous
estimation of the stochastic cost function and the identification of the
correlates of bank inefficiencies in one-step estimation. In detail, capturing
for risk and asset quality includes: The ratio of liquid asset to total asset
(LA/TA), Equity to total asset (E/TA), Non-performing loans ratio (NPL/TL).
Potential correlates of efficiency was examined by Ownership2, Bank
concentration3 and mergers and Acquisition (M&A)
4.
Results
Table 5.1: Test of hypothesis
Null hypothesis LR test Critical value Decision
PE CE 10% 5% 1% PE CE
Test of no inefficiency
0: oH
11.848
24.340
5.528 7.045
10.501 Reject
oH
Test of no risk, quality and potential correlates
621 .....: oH
91.68 43.86 9.998
11.911 16.074
Reject
oH
Test of no technical change over time:
5..2,1,0: 330 iH i
13.43
9.12
8.574
10.371
14.325
Reject
oH
Notes: Author’s calculation, LLF restricted and unrestricted were obtained from model and calculated by formulation of . Where LR means generalized likelihood-ratio, and are LogLikehood function from unrestricted and restricted model respectively. The comparison
2 Ownership is also important to bank efficiency because owners have influence over bank managers and the organizational form of a bank, as well as the bank’s main operational strategies (Manlagñit,, 2011) This is a dummy variable for ownership: 1= foreign banks, 0 = otherwise 3 Market concentration (HHI): a market concentration index calculated as the sum of total asset square of each bank’s total assets as a percent of the banking sector’s aggregate assets. The formulation for calculating market concentration as: where subscript i stands for bank i and t for time t [11] 4 This is Dummy variable for merger and acquisition; 1= acquiring and acquired banks, 0 = otherwise. If the banks implement M&A, means banks could increase its market power to result in better performance.

Profit and Cost Efficiency Analysis in Banking Sector: A Case of Stochastic Frontier Approach for Vietnam
11
Vol. IV, Issue 5 October 2014
between the LR test and critical value followed the Chi-square distribution of Kodde and Palm (1986) [17] to give the decision for rejecting or accepting null hypothesis. PE is Profit Efficiency, CE means cost Efficiency
Table 5.1 evaluated the hypothesis testing for appropriation of
representation of the profit and cost structure of the banks in our sample. In
the first null hypothesis, we aim to confirm there is no inefficiency effect in
our model or inefficiency effects are not stochastic. The results highlight
that in cost and profit efficiency estimation, the absence of inefficiency is
strongly rejected at 1% level. Thus, we also can conclude that inefficiency
components are incorporated with other variables in our estimation. Next,
the test of means there is no significant impact of risk and asset quality as
well as potential correlates on Vietnamese Banks’s profit and cost efficiency.
This hypothesis is strongly rejected in profit model at 1% significant level,
which implied the banks’ profit and cost inefficiency can be explained by
these variables in profit translog function model. The third hypothesis aims
to test of no technical change over time, the null hypothesis mentions there
is no existence of technological changes over time in Vietnamese banking
sector. The hypothesis is rejected in both profit and cost estimation case at
10% and 5% significant level respectively, which showing that in the banking
sector has technological change over period.
Through our results from some hypothesis, we can agree that using
translog stochastic frontier function for evaluating profit and cost
inefficiency of Vietnamese commercial banks is more appropriate than using
the ordinary least square.
Table 5.2: Estimated Mean of efficiency score5 of Vietnam commercial banks
over years
Mean by year Profit Efficiency Cost Efficiency
2007 68.89 16.84
2008 66.64 17.24
2009 65.97 16.63
2010 64.76 8.20
2011 63.07 19.98
5 were obtained from the of Frontier software [18] & [19]

Profit and Cost Efficiency Analysis in Banking Sector: A Case of Stochastic Frontier Approach for Vietnam
12
Vol. IV, Issue 5 October 2014
2012 61.64 11.76 Notes: number in parentheses is number of banks. Source: Author’s calculation
Table 5.2 provides the average percentage of efficiency of each year
illustrated represents for industry efficiency per year. It is pointed out the
downward trend of efficiency index in Vietnamese commercial bank’s profit
and cost structure from 2007 to 2012. One outstanding point is Vietnamese
banks’ profit efficiency is much higher than cost efficiency in 2007 and after
the Global Financial Crisis in 2008, the cost ratio decreased dramatically.
Table 5.3: Group mean comparison by ANOVA analysis
Group comparison Cost efficiency Profit Efficiency
FBs - JSCBs 8.340*** 0.772 FBs – JVCBs 5.877** 0.008 FBs- SOCBs 18.417*** 2.826 JSCBs – JVCBs 0.713 1.098 JSCBs – SOCBs 6.120** 2.888* JVCBs – SOCBs 2.356 3.954* Source: Author’s Calculation, *, **, *** represent statistically significant at the 10%, 5% and 1% level respectively. FBs, SOCBs, JSCBs and JVCBs means foreign banks, state owned commercial banks, joint stock commercial banks and joint venture commercial banks respectively.
From the table 5.3, there is strongly statistical significance for
clarifying a difference of cost efficiency between foreign banks and Vietnam
national banks, also between foreign banks and joint venture commercial
banks. Among domestic banks, we can confirm the difference between state
owned commercial banks and joint stock commercial banks is significant at
5%. Regards as profit efficiency, there is no evidence to support the
difference between foreign banks and others. But we found the weak
significant for distinguishing profit efficiency between state commercial
banks and another type in a national region.
Table 5.4: Correlates of profit and cost inefficiency in technical efficiency
estimation
Correlates of profit inefficiency
Correlates of cost inefficiency
Variables Coefficient S.E Coefficient S.E
Risk and asset quality E/TA
0.410 (0.886)
-1.500*** (0.708)

Profit and Cost Efficiency Analysis in Banking Sector: A Case of Stochastic Frontier Approach for Vietnam
13
Vol. IV, Issue 5 October 2014
NPL/L -0.233 (0.995) 0.291* (0.846) LA/TA 0.898* (0.676) 0.884* (0.597) Additional variables Mergers And Acquisition (M-A) -0.263
(0.287) -1.121**
(0.655)
Ownership 0.782*** (0.318) 1.033 (0.184) Market concentration -0.022** (0.001) -0.002*** (0.002) Sigma-squared 0.888*** (0.109) 0.412*** (0.088) Gamma 0.981*** (0.021) 0.978*** (0.007)
*, **, *** represent statistically significant at the 10%, 5% and 1% level respectively. Source: Author’s estimation. E/TA: the ratio of equity to total asset, NPL/L: the ratio of Non-performing loans to total loans, LA/TA: Liquid asset to total asset. Ownership: This is a dummy variable for ownership: 1= foreign banks, 0 = otherwise. Market concentration: a market concentration index calculated as the sum of total asset square of each bank’s total assets as a percent of the banking sector’s aggregate assets. Mergers and Acquisition: this is Dummy variable for merger and acquisition; 1= acquiring and acquired banks, 0 = otherwise. Number in parentheses is Standard Error.
The Sigma squared in both model again are all positive and strongly
significant. The estimated gamma is very close to unity, such as 0.981 for a
profit function and 0.978 for cost function show us the strong impact of
inefficiency score to bank’s profit and cost variance.
As can be seen, non-performing loans to gross loans ratio can
capture risk preference in Vietnam banking sector and has a statistical
significant positive effect on measured cost inefficiency this result consists
to previous findings. When 1% increase in the percentage of nonperforming
loans of total gross loans leads to increase 0.291 units in cost inefficiency. An
unhealthy bank with high costs would have more problem loans and lower
banks’ cost efficient operations. In case, cost and profit inefficiency
measurement, merger and acquisition has negative relationship, but is only
significant with cost inefficiency. This result again achieved our expectation
and followed merger literature. From our results, we can suggest that the
potential cost efficiency gains when Vietnamese banks do implement in
merger and acquisition. With new banking environment will lower the cost
inefficiency about 1.121 units. In addition, the addition variables as bank
concentration is negative and statistically significant for both cost
inefficiency and profit inefficiency, which means bank has higher market
shares specifies as banks’ market power thus leading to an increase in
Banks’s total asset and rise in market concentration will lower inefficiency
indexes. If the banking industry is almost monopolistic, the degree of
competition is low and banks can indulge in collusive behavior.
Consequently, a reinforcement of control on the part of the state would be

Profit and Cost Efficiency Analysis in Banking Sector: A Case of Stochastic Frontier Approach for Vietnam
14
Vol. IV, Issue 5 October 2014
recommended in order to prevent the abuse of market power by a small
number of banks [12]. According to this approach, a negative relationship
between market concentration and profit and cost inefficiency does not
necessarily reflect strong collusive behavior by several banks rather shows
that large banks come to reduce the profits and cost inefficiently.
Conclusions
Our results provide some evidences such as over years, Vietnamese
commercial Banks’s profit efficiency is around 61%-68% and theirs cost
efficiency is about from 8% to nearly 20% over the testing period. These
number is quite lower compared to some researches were carried on in the
past for Vietnam case. But these findings supported to banking literatures
and gave new evidence for testing banking in the year from 2007 to 2012.
One important thing is, there are both cost and profit efficiency which has a
downward trend over time that implied relatively inefficient banks tend to
remain relatively inefficient in coming years.
Consistent with previous studies, overall, some findings of this
paper rely on that the banking structure as results supports risk and asset
quality related to cost and profit inefficiency of the banks. Especially that
non-performing loans ratio affect the banks cost inefficiency and risk
management should consider for measuring the efficiency of the banks. The
cost inefficiency high correlates with a better risk evaluation, while cost
inefficiency is always inversely correlated with financial capital.
Furthermore, cost inefficiency seems to be strongly related to bank
concentration, mergers, and bank ownership. The results suggest mergers
and acquisition can increase potential cost inefficiency and foster banks’
competition in the banking system. Among commercial banks, the results
seem to indicate that universal commercial banks are more cost inefficient
than ordinary commercial banks.
From a policy perspective, our results support to strengthen bank
competition capacity by focusing on measuring cost or profit efficiency of
Vietnamese commercial banks by using frontier analysis. A recent change in
regulation allows more foreign ownership in Vietnam banks in special cases
(e.g., as part of restructurings of weak banks), subject to the prime minister's
approval. We believe this may be first step in allowing foreign banks to have
larger stakes in Vietnam banks and will help improve capitalization,

Profit and Cost Efficiency Analysis in Banking Sector: A Case of Stochastic Frontier Approach for Vietnam
15
Vol. IV, Issue 5 October 2014
management, and governance of local banks. So, it is necessary when
governments do accelerating and finishing restructures progress in the
banking system earlier as well as tightening cross-holding situation. The
profitability and cost measurement are affected by market concentration or
market share, because efficient banks can increase their market share and
earn high profits and gain cost efficiency even in a competitive and low-
concentration business. This idea implies the policy for regulation and
intervention from government are inappropriate since they might
discourage the proper functioning of the market mechanism has been
employed to explain the performance of the Vietnamese banking system.
Acknowledgment
I would like to express my special thanks to my advisor, Professor
MONTGOMERY, International Christian University. Your advice on both
research as well as on my career have been priceless. I would also like to
thank my committee members, Professor KAIZOJI, professor INABA from
International Christian University for serving as my committee members
even at hardship. I also want to thank you for your wonderful comments and
suggestions, may thanks to you.
References
[1]. Suiwah Leung. (2013) Bank restructuring in Vietnam. (n.d.).
Retrieved September 23, 2013, from
http://www.eastasiaforum.org/2013/04/07/bank-restructuring-in-
vietnam/
[2]. Vu, H. T., & Turnell, S. (2010). Cost Efficiency of the Banking Sector
in Vietnam: A Bayesian Stochastic Frontier Approach with Regularity
Constraints. Asian Economic Journal, 24(2), 115–139.
[3]. Vu, H., & Nahm, D. (0). The determinants of profit efficiency of banks
in Vietnam. Journal of the Asia Pacific Economy, 0(0), 1–17.
[4]. Berger, A., & Humphrey, D. (1997). Efficiency of financial
institutions: International survey and directions for future research.
European Journal of Operational Research, 98, 175–212.

Profit and Cost Efficiency Analysis in Banking Sector: A Case of Stochastic Frontier Approach for Vietnam
16
Vol. IV, Issue 5 October 2014
[5]. Berger, A., & Mester, L. (1997). Inside the black box: What explains
differences in the efficiencies of financial institutions? Journal of
Banking and Finance, 21, 895–947.
[6]. Hughes, J. P., & Mester, L. J. (2008). Efficiency in banking: theory,
practice, and evidence (Working Paper No. 08-1). Federal Reserve
Bank of Philadelphia. Retrieved from
http://ideas.repec.org/p/fip/fedpwp/08-1.html
[7]. Altunbas, Y., Liu, M., Molyneux, P., & Rama, S. (2000). Efficiency
and risk in Japanese banking. Journal of Banking and Finance, 24,
1605–1628
[8]. Isik, I., & Hassan, M. K. (2002). Cost and Profit Efficiency of the
Turkish Banking Industry: An Empirical Investigation. Financial
Review, 37(2), 257–279.
[9]. Manlagñit, M. C. V. (2011). Cost efficiency, determinants, and risk
preferences in banking: A case of stochastic frontier analysis in the
Philippines. Journal of Asian Economics, 22(1), 23–35.
[10].Battese, G. E., & Coelli, T. J. (1995). A model for technical inefficiency
effects in a stochastic frontier production function for panel data.
Empirical Economics, 20(2), 325–332.
[11]. Montgomery, H., Harimaya, K., & Takahashi, Y. (2014). Too big to
succeed? Banking sector consolidation and efficiency. Journal of
International Financial Markets, Institutions and Money, 32, 86–106.
[12]. Lien. D (2013). Foreign Banks in Vietnam: Determinants of
Profitability and Comparison with Domestic Banks, Proceedings of
World Business and Social Science Research Conference, 2013,
Novotel Bangkok on Siam Square, Bangkok, Thailand
[13]. Aigner, D., Lovell, C. A. K., & Schmidt, P. (1977). Formulation and
estimation of stochastic frontier production function models. Journal
of Econometrics, 6(1), 21–37.
[14]. Meeusen, W., & van Den Broeck, J. (1977). Efficiency Estimation
from Cobb-Douglas Production Functions with Composed Error.
International Economic Review, 18(2), 435.
[15]. Battese, G., & Coelli, T. (1988). Prediction of firm-level technical
efficiencies with generalized frontier production function and panel
data. Journal of Econometrics, 38, 387–399.

Profit and Cost Efficiency Analysis in Banking Sector: A Case of Stochastic Frontier Approach for Vietnam
17
Vol. IV, Issue 5 October 2014
[16]. Jondrow, J., Lovell, C., Materov, I., & Schmidt, P. (1982). On
the estimation of technical inefficiency on the stochastic frontier
production function model. Journal of Econometrics, 19, 233–238.
[17]. Kodde, D. A., & Palm, F. C. (1986). Wald Criteria for Jointly Testing
Equality and Inequality Restrictions. Econometrica, 54(5)
[18].Coelli, T., Rao, D., & Battese, G. (2005).An introduction to efficiency
and productivity analysis (2nd ed.). New York: Springer Science
Business Media
[19]. Coelli, T. (1996).A Guide to Frontier version 4.1: A computer
program for stochastic frontier production and cost function
estimation. Working Paper No. 7/96, Centre for Efficiency and
Productivity Analysis, University of New England, Australia.