Embed Size (px)
Citation preview
Profit Aware Load Balancing for Distributed CloudData Centers
Shuo Liu∗, Shaolei Ren†, Gang Quan∗, Ming Zhao†, and Shangping Ren‡∗Department of Electrical and Computer Engineering, Florida International University, Miami, FL, 33174†School of Computing and Information Sciences, Florida International University, Miami, FL, 33199
‡Department of Computer Science, Illinois Institute of Technology, Chicago, IL, 60616Emails: {sliu005, gang.quan}@fiu.edu, {sren, ming}@cs.fiu.edu, [email protected]
Abstract—The advent of cloud systems has spurred the emer-gence of an impressive assortment of Internet services. Recentpressures on enhancing the profitability by curtailing surgingdollar costs on energy have posed challenges to, as well as placeda new emphasis on, designing energy-efficient request dispatchingand resource management algorithms. What further adds to thedesign challenge is the highly diverse nature of Internet servicerequests in terms of Quality-of-Service (QoS) constraints andbusiness values. Nonetheless, most of the existing job schedulingand resource management solutions are for a single type ofrequest and are profit oblivious. They are unable to reap thebenefit of multi-service profit-aware algorithm designs.
In this paper, we consider a cloud service provider operatinggeographically distributed data centers in a multi-electricity-market environment, and propose an energy-efficient, profit- andcost-aware request dispatching and resource allocation algorithmto maximize a service provider’s net profit. We formulate the netprofit maximization issue as a constrained optimization problem,using a unified task model capturing multiple cloud layers (e.g.,SaaS, PaaS, IaaS.) The proposed approach maximizes a serviceprovider’s net profit by judiciously distributing service requeststo data centers, powering on/off an appropriate number ofservers, and allocating server resources to dispatched requests.We conduct extensive experiments to validate our proposedalgorithm. Results show that our proposed approach can improvea service provider’s net profit significantly.
I. INTRODUCTION
With the development of cloud computing, service providersare able to provide a variety of complex applications andservices to people’s daily lives, such as Google Docs andAppEngine, Amazon EC2 and S3, etc. These applications andservices are all supported by service provider’s data centersand delivered to a wide range of clients over the Internet.
The large number of service requests drastically increasesnot only the need for data centers, but also the scale of datacenters and their energy consumptions. The dollar cost spenton energy consumption takes a large portion of a serviceprovider’s operational cost annually. As an example, Googlehas more than 500K servers and it consumes more than $38Mworth of electricity each year. Similarly, Microsoft has morethan 200K servers and spends more than $36M on electricityannually [1]. Evidently, dollar costs on energy consumptionshave been a critical part in operational cost for serviceproviders. It is fair to say that an efficient computing resourcemanagement approach for distributed cloud data centers isessential to service providers.
A well-designed resource management scheme can effec-tively reduce the dollar cost on energy consumptions. Thisis particularly true for distributed cloud data centers wheretheir dollar costs on energy are sensitive to factors such asworkload distribution, data transferring, electricity prices, etc.The problem, however, is how to take all of these factors intoconsideration when designing and developing a resource man-agement scheme such that the QoS with respect to differentservice requests can be satisfied, as well as its cost on energyconsumptions can be minimized.
Fig. 1. Electricity prices at different locations in a day.
In this paper, we present a profit- and cost-aware resourcemanagement approach for distributed cloud data centers tooptimize a service provider’s net profit (defined as the profitminus the dollar cost on energy.) Service providers gainprofit by satisfying service requests to the level identifiedbased on a certain service level agreement (SLA). At thesame time, service providers need to pay the cost for energyconsumed by transferring and processing requests. For severalreasons, e.g. high availability, disaster tolerance, and uniformresponse times, etc., service providers usually spread their datacenters in a wide geographical region. The electricity pricesat different data center locations vary differently throughouta day. Therefore, opportunities present to reduce the dollarcost on electricity by selecting proper data centers for pro-cessing service requests. By taking advantages of the multi-electricity-market (as shown in Figure 1 [2]), our approachhas a high efficiency of energy and computing resource usageby judiciously dispatching service requests to different datacenters, powering on an appropriate number of servers at
different data centers, and adaptively allocating resources tothese service requests. Multiple types of services, with nopriority difference, are considered in our model. Even thoughthere are various layers in cloud computing, such as SaaS,PaaS, and IaaS, we do not focus on any special layer. Instead,we abstract the service requests of those layers with a uniformtask model. Compared with related work, our contributions inthis paper can be summarized as follows:• We propose a system model that incorporates the multi-
electricity-market, SLA, and net profit into a singleunified resource management framework. To our bestknowledge, this is the first work that deals with multi-electricity-markets, multiple types of requests, and multi-level SLAs, simultaneously.
• We model the profit gained by a service provider asa multi-level step-downward function, which is capableof simulating various scenarios (as explained in Sec-tion III-B1.) We formulate our problem of determininghow to dispatch service requests to different data centers,how many servers should be powered on in each datacenter, and how computing resources should be allocatedto service requests as a constrained optimization problem.We also derive a series of constraints to simplify theimplementation of our approach.
• The effectiveness of our proposed approach is validatedthrough simulations on both synthetic workload and realdata center traces with true electricity price history.
The remainder of the paper is organized as follows. Sec-tion II introduces the background of our problem and relatedwork. Our system architecture and task model are proposedin Section III. Section IV discusses our approach in detail.Experimental results are presented in Sections V, VI and VII.We conclude in Section VIII.
II. BACKGROUND AND RELATED WORK
Task scheduling and resource management are critical toensure the QoS (defined by SLA), and energy saving or energydollar cost reduction. There has been extensive research workconducted for optimizing a data center’s energy consumptionor cutting down the electricity bills for service providers.This work can be largely divided into two groups. One isSLA-based resource management for a single data center andthe other is for distributed data centers in a multi-electricity-market environment.
A. Single data center
Many types of SLA-based resource management researchwere conducted to lower energy consumptions or cut downthe operational costs spent on energy consumptions. In [3],Chase et al. presented an architecture for resource managementin a hosting center operating system. They adaptively pro-visioned server resources according to the offered workload.The efficiency of server clusters was improved by dynamicallyresizing the active server set in accordance with SLAs torespond to power supply disruptions or thermal events. Wanget al. in [4] solved a problem of managing power consumption
in multi-tier web clusters equipped with heterogeneous servers.Their method employs dynamic voltage scaling (DVS). Byadjusting the number of powered-on servers and their workingfrequencies, they effectively reduced the energy consumptionin their web clusters. Different from our work, these two stud-ies are focused on a single data center rather than distributeddata centers. In addition, they only consider a single type ofservice request.
Liu et al. in [5][6] studied a method for multi-tier archi-tecture that decides the workload distribution and computingcapacity allocation to optimize the SLA-based profit a datacenter may achieve. However, this work does not account forthe energy consumed by data centers. Later, in [7], energyconsumption was considered and an energy consumption con-trol method was proposed to satisfy certain SLAs and energyconstraints. Contrary to the work in [5][6][7], our approach isfor distributed cloud data centers in a multi-electricity-marketenvironment.
Lin et al. [8] analytically formulated their optimal offlinesolution and developed the corresponding online algorithmto bound the number of powered-on servers with respectto certain delay constraints, in order to reduce the energyconsumption for power-proportional data centers. Their ap-proach focuses on a single service type, and implies thatonce the number of powered-on servers is fixed, the optimaldispatching rule will evenly distribute workloads across theservers. However, this is not suitable for multiple types ofrequests.
Recently, Sarood et al. [9] proposed models that takecooling energy consumptions into consideration. By reason-ably balancing workloads and employing dynamic voltageand frequency scaling (DVFS), they successfully loweredthe overall energy consumed by their cooling system whilesatisfying temperature constraints. Cooling factors are out ofthe scope of our work. However, our model can be extended byadding a parameter describing a data center’s power utilizationefficiency (PUE) to account for the energy consumed bycooling systems as well as other peripheral equipments.
B. Distributed data centers
Le et al. have studied the advantages of using green energy(e.g. energy generated by winds or solar energy). These studieshelp to replace the usage of “brown” energy (produced viacarbon-intensive means) with “green energy” during a datacenter’s operation in order to cut down the cost spent on energyconsumptions. For instance, a study of a framework for multi-data-center services was introduced in [10][11]. However,no SLA-based profit was considered in these studies. Onlyresponse time constraints were considered to reflect the QoSrequirements.
Since most cloud systems geographically distribute theirdata centers, requests dispatching and resource managementdesign for multiple data centers attracts more and moreattention. The research in [2][12] extended the work in [4]to a distributed data center architecture in a multi-electricity-market environment. Rao et al. modeled their problem as a
constrained mixed-integer linear programming, and proposedan efficient approach to approximate the problem with a linearprogramming formulation. These studies only considered asingle service type. Our new proposed algorithm works formultiple types of service requests. Moreover, our model ac-counts for transferring costs as well.
In real-time services, QoS is reflected by a service’s time-liness. After Jensen first proposed the time utility function(TUF) [13], there were many studies conducted based onTUFs to study the timeliness of real-time tasks in variousfields [14][15][16]. Most of them are task-level schedulingalgorithms. Scheduling activities are performed according toeach single task’s behavior. In [17], Liu et al. proposeda task allocation and scheduling algorithm for distributeddata centers in a multi-electricity-market environment. Theyimplemented two TUFs to describe each task’s potential profitand penalty, respectively. The scheduling algorithm accountsfor the dollar costs of data transferring and processing. Nev-ertheless, the work in [17] has a high timing complexityfor online implementation in network-based system becauseof the huge amount of service requests. Our new proposedapproach is a significant improvement of [17] by using thequeuing theory to build a constrained optimization formulain order to flexibly dispatch requests and allocate computingresources for maximizing net profits in distributed cloud datacenters. The system models, approaches and techniques are allfundamentally different from [17]. Instead of focusing on eachsingle service request [17], our new approach focuses on eachtype of requests. Requests of the same service type follow thesame scheduling policy.
III. SYSTEM MODELS AND PROBLEM FORMULATION
In this section, we introduce our system model, basedon which we develop our time-slotted profit-aware requestdispatching and resource management approach for distributedcloud data centers in a multi-electricity-market environment.Our approach periodically runs at the beginning of each timeslot T based on the average arrival rates during a slot sincejob interarrival times are much shorter compared to a slot [8].Requests arrival pattern forecast is not studied in our work.Existing prediction methods (e.g. the Kalman Filter [18],) orstudies (e.g. [19][20]) that have been conducted can be em-ployed if necessary. The length of T is a pre-defined constantthat is decided by several factors, e.g. adjusting frequenciesof electricity prices (electricity prices stochastically vary overtime due to the deregulation of electricity market [21].) Weconsider that the electricity prices in a time-slot T are constant.Constant prices during a time period are widely implementedin prior work [8][21].
A. System architecture
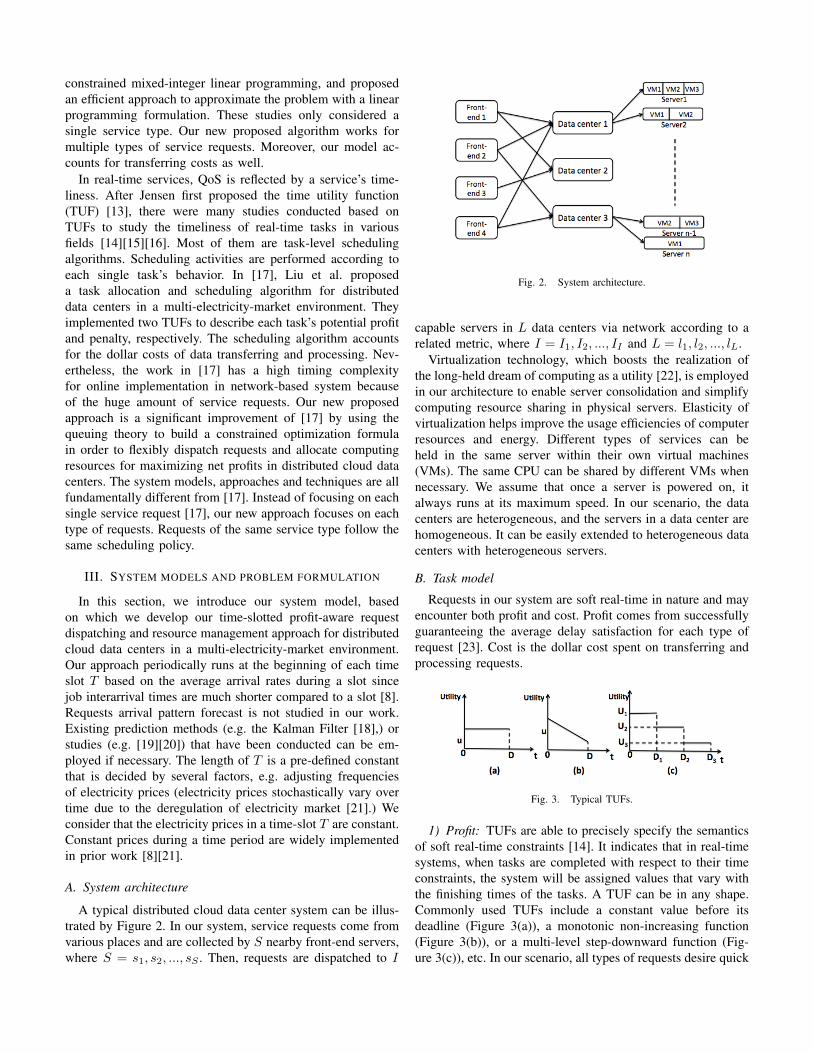
A typical distributed cloud data center system can be illus-trated by Figure 2. In our system, service requests come fromvarious places and are collected by S nearby front-end servers,where S = s1, s2, ..., sS . Then, requests are dispatched to I
Fig. 2. System architecture.
capable servers in L data centers via network according to arelated metric, where I = I1, I2, ..., II and L = l1, l2, ..., lL.
Virtualization technology, which boosts the realization ofthe long-held dream of computing as a utility [22], is employedin our architecture to enable server consolidation and simplifycomputing resource sharing in physical servers. Elasticity ofvirtualization helps improve the usage efficiencies of computerresources and energy. Different types of services can beheld in the same server within their own virtual machines(VMs). The same CPU can be shared by different VMs whennecessary. We assume that once a server is powered on, italways runs at its maximum speed. In our scenario, the datacenters are heterogeneous, and the servers in a data center arehomogeneous. It can be easily extended to heterogeneous datacenters with heterogeneous servers.
B. Task model
Requests in our system are soft real-time in nature and mayencounter both profit and cost. Profit comes from successfullyguaranteeing the average delay satisfaction for each type ofrequest [23]. Cost is the dollar cost spent on transferring andprocessing requests.
Fig. 3. Typical TUFs.
1) Profit: TUFs are able to precisely specify the semanticsof soft real-time constraints [14]. It indicates that in real-timesystems, when tasks are completed with respect to their timeconstraints, the system will be assigned values that vary withthe finishing times of the tasks. A TUF can be in any shape.Commonly used TUFs include a constant value before itsdeadline (Figure 3(a)), a monotonic non-increasing function(Figure 3(b)), or a multi-level step-downward function (Fig-ure 3(c)), etc. In our scenario, all types of requests desire quick
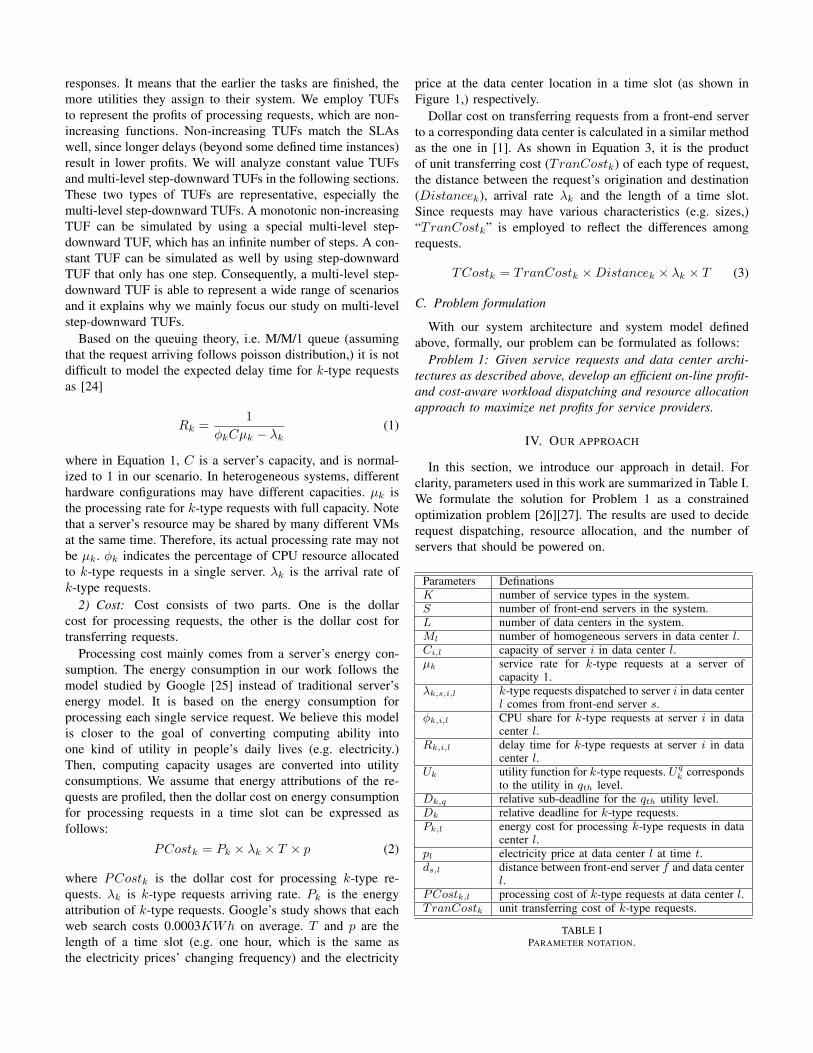
responses. It means that the earlier the tasks are finished, themore utilities they assign to their system. We employ TUFsto represent the profits of processing requests, which are non-increasing functions. Non-increasing TUFs match the SLAswell, since longer delays (beyond some defined time instances)result in lower profits. We will analyze constant value TUFsand multi-level step-downward TUFs in the following sections.These two types of TUFs are representative, especially themulti-level step-downward TUFs. A monotonic non-increasingTUF can be simulated by using a special multi-level step-downward TUF, which has an infinite number of steps. A con-stant TUF can be simulated as well by using step-downwardTUF that only has one step. Consequently, a multi-level step-downward TUF is able to represent a wide range of scenariosand it explains why we mainly focus our study on multi-levelstep-downward TUFs.
Based on the queuing theory, i.e. M/M/1 queue (assumingthat the request arriving follows poisson distribution,) it is notdifficult to model the expected delay time for k-type requestsas [24]
Rk =1
φkCµk − λk(1)
where in Equation 1, C is a server’s capacity, and is normal-ized to 1 in our scenario. In heterogeneous systems, differenthardware configurations may have different capacities. µk isthe processing rate for k-type requests with full capacity. Notethat a server’s resource may be shared by many different VMsat the same time. Therefore, its actual processing rate may notbe µk. φk indicates the percentage of CPU resource allocatedto k-type requests in a single server. λk is the arrival rate ofk-type requests.
2) Cost: Cost consists of two parts. One is the dollarcost for processing requests, the other is the dollar cost fortransferring requests.
Processing cost mainly comes from a server’s energy con-sumption. The energy consumption in our work follows themodel studied by Google [25] instead of traditional server’senergy model. It is based on the energy consumption forprocessing each single service request. We believe this modelis closer to the goal of converting computing ability intoone kind of utility in people’s daily lives (e.g. electricity.)Then, computing capacity usages are converted into utilityconsumptions. We assume that energy attributions of the re-quests are profiled, then the dollar cost on energy consumptionfor processing requests in a time slot can be expressed asfollows:
PCostk = Pk × λk × T × p (2)
where PCostk is the dollar cost for processing k-type re-quests. λk is k-type requests arriving rate. Pk is the energyattribution of k-type requests. Google’s study shows that eachweb search costs 0.0003KWh on average. T and p are thelength of a time slot (e.g. one hour, which is the same asthe electricity prices’ changing frequency) and the electricity
price at the data center location in a time slot (as shown inFigure 1,) respectively.
Dollar cost on transferring requests from a front-end serverto a corresponding data center is calculated in a similar methodas the one in [1]. As shown in Equation 3, it is the productof unit transferring cost (TranCostk) of each type of request,the distance between the request’s origination and destination(Distancek), arrival rate λk and the length of a time slot.Since requests may have various characteristics (e.g. sizes,)“TranCostk” is employed to reflect the differences amongrequests.
TCostk = TranCostk ×Distancek × λk × T (3)
C. Problem formulation
With our system architecture and system model definedabove, formally, our problem can be formulated as follows:
Problem 1: Given service requests and data center archi-tectures as described above, develop an efficient on-line profit-and cost-aware workload dispatching and resource allocationapproach to maximize net profits for service providers.
IV. OUR APPROACH
In this section, we introduce our approach in detail. Forclarity, parameters used in this work are summarized in Table I.We formulate the solution for Problem 1 as a constrainedoptimization problem [26][27]. The results are used to deciderequest dispatching, resource allocation, and the number ofservers that should be powered on.
Parameters DefinationsK number of service types in the system.S number of front-end servers in the system.L number of data centers in the system.Ml number of homogeneous servers in data center l.Ci,l capacity of server i in data center l.µk service rate for k-type requests at a server of
capacity 1.λk,s,i,l k-type requests dispatched to server i in data center
l comes from front-end server s.φk,i,l CPU share for k-type requests at server i in data
center l.Rk,i,l delay time for k-type requests at server i in data
center l.Uk utility function for k-type requests. Uq
k correspondsto the utility in qth level.
Dk,q relative sub-deadline for the qth utility level.Dk relative deadline for k-type requests.Pk,l energy cost for processing k-type requests in data
center l.pl electricity price at data center l at time t.ds,l distance between front-end server f and data center
l.PCostk,l processing cost of k-type requests at data center l.TranCostk unit transferring cost of k-type requests.
TABLE IPARAMETER NOTATION.
The objective function of Problem 1 can be mathematicallyformulated as follows:
max
S∑s=1
L∑l=1
M∑i=1
K∑k=1
{Uk(Rk,i,l)λk,s,i,l − Costk,s,i,lλk,s,i,l}T
(4)
After we substitute the factors in Equation 4 with Equation 1,2 and 3, it becomes to Equation 5:
max
S∑s=1
L∑l=1
M∑i=1
K∑k=1
{Uk(Rk,i,l)λk,s,i,l − Pk,lλk,s,i,lpl
−TranCostkds,lλk,s,i,l}T(5)
with following constraints:
1φk,i,lCi,lµk,l − λk,s,i,l
≤ Dk, ∀k, i, s, l (6)
S∑s=1
L∑l=1
M∑i=1
λk,s,i,l ≤S∑
s=1
λk,s, ∀k (7)
K∑k=1
φk,i,l ≤ 1, ∀i, s, l (8)
Constraint 6 shows the QoS requirement. The average delayfor each type of request cannot exceed its deadline. Con-straint 7 assures that the number of assigned requests doesnot exceed the number of total service requests coming fromthe Internet. Constraint 8 bounds the CPU share by varioustypes of services in a single server.
In our constrained optimization formulae, φk,i,l and λk,s,i,l
are the two variables that need to be solved, representing whereto assign and how much workload should be assigned fromeach front-end server. In addition, as we know how requestsare dispatched, we can determine how many servers should bepowered on. Clearly, when there is no workload on a server,the server should be powered off.
In our model, we assume that server switching costs anddurations are negligible compared to the total energy consump-tion and time of processing and transferring requests during atime slot (e.g. one hour.)
The complexity of our objective function depends heavilyon the format of the utility function used to reflect a request’spotential profit. Since multi-level step-downward TUFs arerepresentative and cover a large scenario diversity, in whatfollows, we discuss three typical multi-level step-downwardutility functions, and corresponding solutions for each ofthem. As stair TUFs need “if-else” descriptions, which areunfortunately not well supported by some popular non-linear mathematic programming (or some constraint logicprogramming) solvers, e.g. Prolog, we hence transform the“if-else” into a set of constraints.
1) One-level step-downward TUF: The first type of TUFhas a constant utility before deadline and can be expressed asfollows:
Uk = TUF (Rk) =
{Uk,1 0 < Rk ≤ Dk
0 Rk > Dk
(9)
where, Uk is the utility of k-type requests. Uk,1 is a constantvalue. Before delay time Rk exceeds deadline Dk, Uk equalsto Uk,1.
With one-level step-downward TUF, the objectivefunction (Equation 5) is simply a linear function. Eventhough there is a nonlinear component in Equation 6,it can be linearized through simple transformations, i.e.φk,i,lCi,lµk,l − λk,s,i,l ≥ 1
Dk. The whole problem can be
solved by using traditional linear programming solvers [28].
2) Two-level step-downward TUF: This type of TUF canbe expressed as follows:
Uk = TUF (Rk) =
Uk,1 0 < Rk ≤ Dk,1
Uk,2 Dk,1 < Rk ≤ Dk
0 Rk > Dk
(10)
where Uk is the utility of k-type requests. Rk is the delaytime of k-type requests. Dk,q is the relative sub-deadline foreach utility level Uk,q , and q is the index of each level (i.e. theq-th sub-deadline of k-type requests to achieve the q-th utilitylevel.) We assume that Dk is the final deadline for k-typeservice requests. Executing a request becomes meaninglessonce the delay time exceeds Dk.
Note that when the TUF employs a two-level step-downward function, the objective function is no longer alinear one. Furthermore, with Equation 10, it is challenging toformulate the objective in one formula. To solve this problem,we transform Equation 10 to a set of extra constraints asfollows:
Uk ∈ {Uk,1, Uk,2}, (Uk,1 > Uk,2) (11)
(Rk −Dk,1) + ](Uk − Uk,1) <= 0 (12)
(Dk,1 + δ −Rk) + ](Uk,2 − Uk) <= 0 (13)
where, ] is a large constant. δ is a constant time value whichis small enough. Dk,1 + δ indicates the time instance thatimmediately follows time Dk,1.
To see the reason that Equation 10 can be equivalentlytransformed to a set of constraints listed in Equations 11, 12and 13, consider the following two cases:• When 0 < Rk ≤ Dk,1
Under this condition, we readily have Rk − Dk,1 ≤ 0.From Equation 11, Uk can be either Uk,1 or Uk,2.Therefore, to satisfy Equation 13, we must have
Uk = Uk,1. In the meantime, Equation 13 can be easilysatisfied as long as ] is large enough. To this end,Uk = Uk,1 is the only solution when 0 < Rk ≤ Dk,1.
• When Rk > Dk,1
Under this condition, we readily have Dk,1 +δ−Rk ≤ 0.Since Uk can be either Uk,1 or Uk,2, to satisfyEquation 12, we must have Uk = Uk,2. In the meantime,Equation 12 can be easily satisfied as long as ] is largeenough. To this end, Uk = Uk,2 is the only solutionwhen Rk > Dk,1.
While we can transform Equation 10 to a set of constraintslisted in Equations 11 – 13, the problem is not over. Note thatEquation 11 is still a constraint that is not formulated properly.To formulate the constraint in Equation (11), we can definean integer variable x with
0 ≤ x ≤ 1 (14)
such that
U = xUk,1 + (1− x)Uk,2 (15)
With the extra constraints listed in Equations 11 - 13, it isdesirable to use traditional integer linear programming solverto solve the problem. Unfortunately, this is not feasible. FromEquation 1, it is not difficult to see that both Constraints 12and 13 are non-linear formulae. To solve this problem, weneed to employ the constraint logic programming solvers ornonlinear mathematic programming solvers such as ILOGCPLEX [29] and AIMMS [30] to find the near optimalsolutions. With the help of the series of constraints, peoplemay avoid the difficulty of implementing “if, else” statementin some solvers. Similar series can be derived for multi-levelstep-downward TUFs.
3) Three or more level step-downward TUF: This type ofTUF can be formulated as follows:
Uk = TUF (Rk) =
Uk,1 0 < Rk ≤ Dk,1
Uk,2 Dk,1 < Rk ≤ Dk,2
Uk,3 Dk,2 < Rk ≤ Dk,3
...0 Rk > Dk
(16)
Similarly, Equation 16 can be transformed into a series ofnew constraints as listed below:
Uk ∈ {Uk,1, Uk,2, Uk,3, ..., Uk,n}
(Rk −Dk,1) + ](Uk − Uk,1) <= 0(Dk,1 + δ −Rk) + ](Uk,2 − Uk)(Uk − Uk,3) <= 0
(Rk −Dk,2) + ](Uk,2 − Uk)(Uk − Uk,1) <= 0(Dk,2 + δ −Rk) + ](Uk,3 − Uk)(Uk − Uk,4) <= 0
(Rk −Dk,3) + ](Uk,3 − Uk)(Uk − Uk,2) <= 0...
(Dk,n−1 + δ −Rk) + ](Uk,n − Uk) <= 0(17)
where, Uk,1 . . .Uk,n, Dk,1 . . .Dk,n, ], and δ are the sameas those in a two-level step-downward function, and Uk,1 >Uk,2 > · · · > Uk,n. Take n = 3 as an example, we have:
Uk ∈ {Uk,1, Uk,2, Uk,3}, (Uk,1 > Uk,2 > Uk,3) (18)
(Rk −Dk,1) + ](Uk − Uk,1) <= 0 (19)
(Dk,1 + δ −Rk) + ](Uk,2 − Uk)(Uk − Uk,3) <= 0 (20)
(Rk −Dk,2) + ](Uk,2 − Uk)(Uk − Uk,1) <= 0 (21)
(Dk,2 + δ −Rk) + ](Uk,3 − Uk) <= 0 (22)
Equations 19 and 22 are very similar to Equations 12 and13. The newly added constraints are Equations 20 and 21.Note that, similar to the analysis above, it is not difficult tosee that as long as ] is large enough, we must have Uk = Uk,1
when Rk ≤ Dk,1, and Uk = Uk,3, when Rk > Dk,2 to satisfyConstraints 19 – 22.
Now, consider the situation when Dk,1 < Rk ≤ Dk,2
(note that Uk,1 > Uk,2 > Uk,3.) Under this condition,similarly, Equations 20 and 21 can be easily satisfied withany Uk ∈ {Uk,1, Uk,2, Uk,3}. From Equation 19, we canconclude that, to satisfy Equation 21, we must have
(Uk − Uk,1) < 0that is, we have either
Uk = Uk,2 or Uk = Uk,3 (23)
Meanwhile, to satisfy Equation 22, we must have
(Uk,3 − Uk) < 0that is, we have either
Uk = Uk,1 or Uk = Uk,2 (24)
Therefore, to satisfy Equations 19 - 22, we must have Uk =Uk,2 when Dk,1 < Rk ≤ Dk,2.
We have shown that Equation 16 can be transformedequivalently into Equation 17. The problem becomes how to
formulate Uk (Equation 18) using a general form. Similarly,we can introduce an integer variable x, with
1 ≤ x ≤ n (25)
where, n is the number of step levels. Then Uk can beformulated as follows:
Uk =
∑i≤ni=1 [Πj≤n
j=0,j!=i(j − x)]Uk,i
(−1)xx!(n− x)!(26)
As a result, Uk is successfully transformed into a series ofconstraints as described in Equations 17, 25, and 26. Sameas above, together with our objective function, this constraintseries can be solved by using constraint logic programmingsolvers or nonlinear programming solvers.
V. STUDY OF BASIC CHARACTERISTICS
In this section, we study the basic characteristics of ournew proposed approach using experiments with syntheticworkloads and electricity prices. Experiments with real requesttraces and electricity prices will be shown in later sections.
A. Experiment setup
Two approaches were implemented and compared. One iscalled the “Optimized” approach, which is our new proposedone. The other one, called “Balanced,” is a static approachthat evenly dispatches workloads and allocates resources forevery front-end server. During dispatching in the balancedapproach, every front-end server first seeks the data centerwhich has the lowest electricity price. Workloads are assignedto the servers in that data center first until its utilization isfull. Then, workloads are forwarded to the rest data centersin accordance with the order of electricity prices, i.e. startingfrom the lowest data center to the highest one. Transferringcost is not considered in this basic study.
In this experiment, we set four front-end servers to collectand dispatch three types of service requests. There are threeheterogeneous data centers with their own local electricityprices. Each data center has six homogeneous servers. Forsimplicity, the TUFs used here are those with constant values.Two groups of request arrival rates were set for simulatingboth light and heavy workloads (shown in Table II). Othertest parameters for each server are summarized in Table III.
B. Experimental results
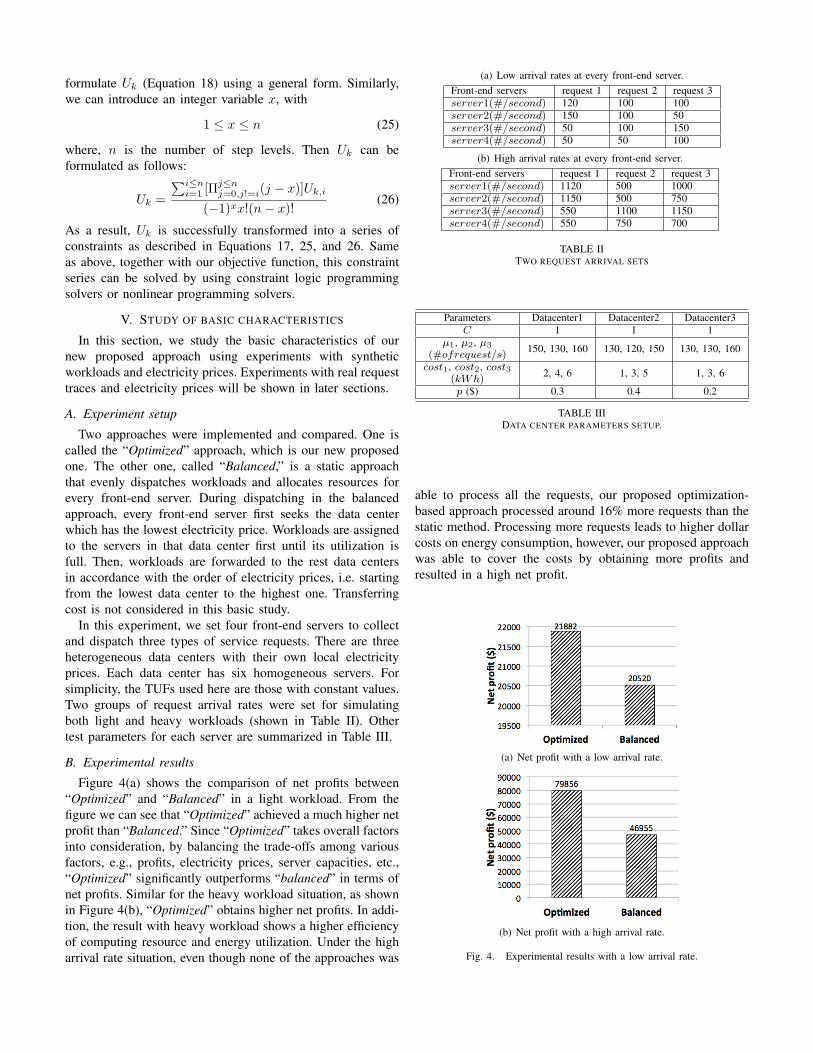
Figure 4(a) shows the comparison of net profits between“Optimized” and “Balanced” in a light workload. From thefigure we can see that “Optimized” achieved a much higher netprofit than “Balanced.” Since “Optimized” takes overall factorsinto consideration, by balancing the trade-offs among variousfactors, e.g., profits, electricity prices, server capacities, etc.,“Optimized” significantly outperforms “balanced” in terms ofnet profits. Similar for the heavy workload situation, as shownin Figure 4(b), “Optimized” obtains higher net profits. In addi-tion, the result with heavy workload shows a higher efficiencyof computing resource and energy utilization. Under the higharrival rate situation, even though none of the approaches was
(a) Low arrival rates at every front-end server.Front-end servers request 1 request 2 request 3server1(#/second) 120 100 100server2(#/second) 150 100 50server3(#/second) 50 100 150server4(#/second) 50 50 100
(b) High arrival rates at every front-end server.Front-end servers request 1 request 2 request 3server1(#/second) 1120 500 1000server2(#/second) 1150 500 750server3(#/second) 550 1100 1150server4(#/second) 550 750 700
TABLE IITWO REQUEST ARRIVAL SETS
Parameters Datacenter1 Datacenter2 Datacenter3C 1 1 1
µ1, µ2, µ3
(#ofrequest/s)150, 130, 160 130, 120, 150 130, 130, 160
cost1, cost2, cost3(kWh)
2, 4, 6 1, 3, 5 1, 3, 6
p ($) 0.3 0.4 0.2
TABLE IIIDATA CENTER PARAMETERS SETUP.
able to process all the requests, our proposed optimization-based approach processed around 16% more requests than thestatic method. Processing more requests leads to higher dollarcosts on energy consumption, however, our proposed approachwas able to cover the costs by obtaining more profits andresulted in a high net profit.
(a) Net profit with a low arrival rate.
(b) Net profit with a high arrival rate.
Fig. 4. Experimental results with a low arrival rate.
VI. STUDY WITH REAL TRACES USING ONE-LEVELSTEP-DOWNWARD TUFS
A. Experiment setup
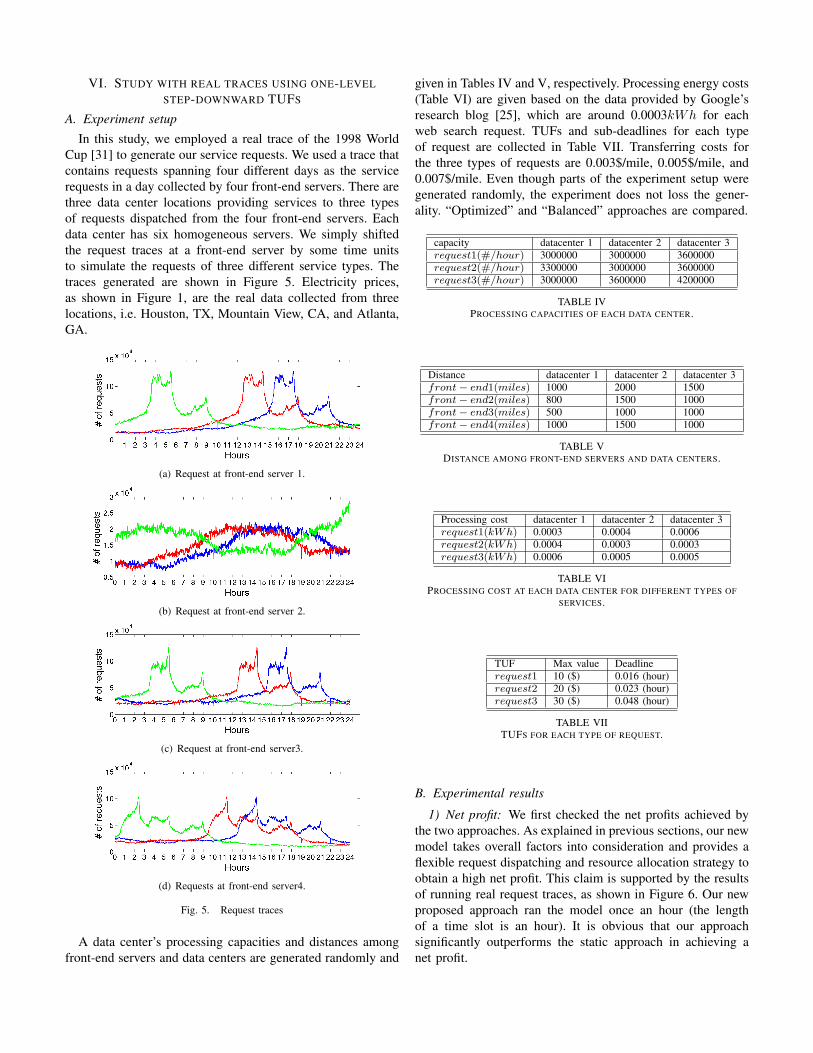
In this study, we employed a real trace of the 1998 WorldCup [31] to generate our service requests. We used a trace thatcontains requests spanning four different days as the servicerequests in a day collected by four front-end servers. There arethree data center locations providing services to three typesof requests dispatched from the four front-end servers. Eachdata center has six homogeneous servers. We simply shiftedthe request traces at a front-end server by some time unitsto simulate the requests of three different service types. Thetraces generated are shown in Figure 5. Electricity prices,as shown in Figure 1, are the real data collected from threelocations, i.e. Houston, TX, Mountain View, CA, and Atlanta,GA.
(a) Request at front-end server 1.
(b) Request at front-end server 2.
(c) Request at front-end server3.
(d) Requests at front-end server4.
Fig. 5. Request traces
A data center’s processing capacities and distances amongfront-end servers and data centers are generated randomly and
given in Tables IV and V, respectively. Processing energy costs(Table VI) are given based on the data provided by Google’sresearch blog [25], which are around 0.0003kWh for eachweb search request. TUFs and sub-deadlines for each typeof request are collected in Table VII. Transferring costs forthe three types of requests are 0.003$/mile, 0.005$/mile, and0.007$/mile. Even though parts of the experiment setup weregenerated randomly, the experiment does not loss the gener-ality. “Optimized” and “Balanced” approaches are compared.
capacity datacenter 1 datacenter 2 datacenter 3request1(#/hour) 3000000 3000000 3600000request2(#/hour) 3300000 3000000 3600000request3(#/hour) 3000000 3600000 4200000
TABLE IVPROCESSING CAPACITIES OF EACH DATA CENTER.
Distance datacenter 1 datacenter 2 datacenter 3front− end1(miles) 1000 2000 1500front− end2(miles) 800 1500 1000front− end3(miles) 500 1000 1000front− end4(miles) 1000 1500 1000
TABLE VDISTANCE AMONG FRONT-END SERVERS AND DATA CENTERS.
Processing cost datacenter 1 datacenter 2 datacenter 3request1(kWh) 0.0003 0.0004 0.0006request2(kWh) 0.0004 0.0003 0.0003request3(kWh) 0.0006 0.0005 0.0005
TABLE VIPROCESSING COST AT EACH DATA CENTER FOR DIFFERENT TYPES OF
SERVICES.
TUF Max value Deadlinerequest1 10 ($) 0.016 (hour)request2 20 ($) 0.023 (hour)request3 30 ($) 0.048 (hour)
TABLE VIITUFS FOR EACH TYPE OF REQUEST.
B. Experimental results
1) Net profit: We first checked the net profits achieved bythe two approaches. As explained in previous sections, our newmodel takes overall factors into consideration and provides aflexible request dispatching and resource allocation strategy toobtain a high net profit. This claim is supported by the resultsof running real request traces, as shown in Figure 6. Our newproposed approach ran the model once an hour (the lengthof a time slot is an hour). It is obvious that our approachsignificantly outperforms the static approach in achieving anet profit.
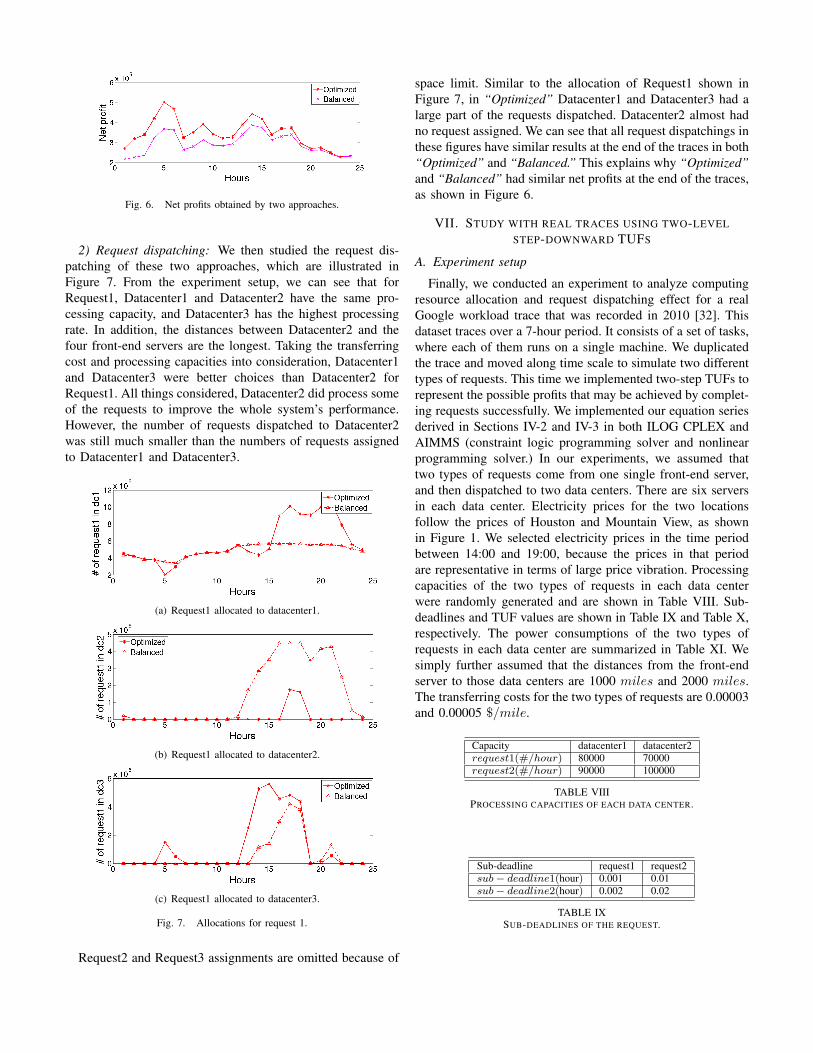
Fig. 6. Net profits obtained by two approaches.
2) Request dispatching: We then studied the request dis-patching of these two approaches, which are illustrated inFigure 7. From the experiment setup, we can see that forRequest1, Datacenter1 and Datacenter2 have the same pro-cessing capacity, and Datacenter3 has the highest processingrate. In addition, the distances between Datacenter2 and thefour front-end servers are the longest. Taking the transferringcost and processing capacities into consideration, Datacenter1and Datacenter3 were better choices than Datacenter2 forRequest1. All things considered, Datacenter2 did process someof the requests to improve the whole system’s performance.However, the number of requests dispatched to Datacenter2was still much smaller than the numbers of requests assignedto Datacenter1 and Datacenter3.
(a) Request1 allocated to datacenter1.
(b) Request1 allocated to datacenter2.
(c) Request1 allocated to datacenter3.
Fig. 7. Allocations for request 1.
Request2 and Request3 assignments are omitted because of
space limit. Similar to the allocation of Request1 shown inFigure 7, in “Optimized” Datacenter1 and Datacenter3 had alarge part of the requests dispatched. Datacenter2 almost hadno request assigned. We can see that all request dispatchings inthese figures have similar results at the end of the traces in both“Optimized” and “Balanced.” This explains why “Optimized”and “Balanced” had similar net profits at the end of the traces,as shown in Figure 6.
VII. STUDY WITH REAL TRACES USING TWO-LEVELSTEP-DOWNWARD TUFS
A. Experiment setup
Finally, we conducted an experiment to analyze computingresource allocation and request dispatching effect for a realGoogle workload trace that was recorded in 2010 [32]. Thisdataset traces over a 7-hour period. It consists of a set of tasks,where each of them runs on a single machine. We duplicatedthe trace and moved along time scale to simulate two differenttypes of requests. This time we implemented two-step TUFs torepresent the possible profits that may be achieved by complet-ing requests successfully. We implemented our equation seriesderived in Sections IV-2 and IV-3 in both ILOG CPLEX andAIMMS (constraint logic programming solver and nonlinearprogramming solver.) In our experiments, we assumed thattwo types of requests come from one single front-end server,and then dispatched to two data centers. There are six serversin each data center. Electricity prices for the two locationsfollow the prices of Houston and Mountain View, as shownin Figure 1. We selected electricity prices in the time periodbetween 14:00 and 19:00, because the prices in that periodare representative in terms of large price vibration. Processingcapacities of the two types of requests in each data centerwere randomly generated and are shown in Table VIII. Sub-deadlines and TUF values are shown in Table IX and Table X,respectively. The power consumptions of the two types ofrequests in each data center are summarized in Table XI. Wesimply further assumed that the distances from the front-endserver to those data centers are 1000 miles and 2000 miles.The transferring costs for the two types of requests are 0.00003and 0.00005 $/mile.
Capacity datacenter1 datacenter2request1(#/hour) 80000 70000request2(#/hour) 90000 100000
TABLE VIIIPROCESSING CAPACITIES OF EACH DATA CENTER.
Sub-deadline request1 request2sub− deadline1(hour) 0.001 0.01sub− deadline2(hour) 0.002 0.02
TABLE IXSUB-DEADLINES OF THE REQUEST.
TUF values level1 level2 level3request1($) 20 10 0request2($) 30 10 0
TABLE XTUF VALUES AT DIFFERENT STEPS OF THE REQUESTS.
Power datacenter1 datacenter2request1(kWh) 0.0002 0.0003request2(kWh) 0.0001 0.0003
TABLE XIPOWER CONSUMPTION OF THE REQUESTS IN EACH DATA CENTER.
B. Experimental results
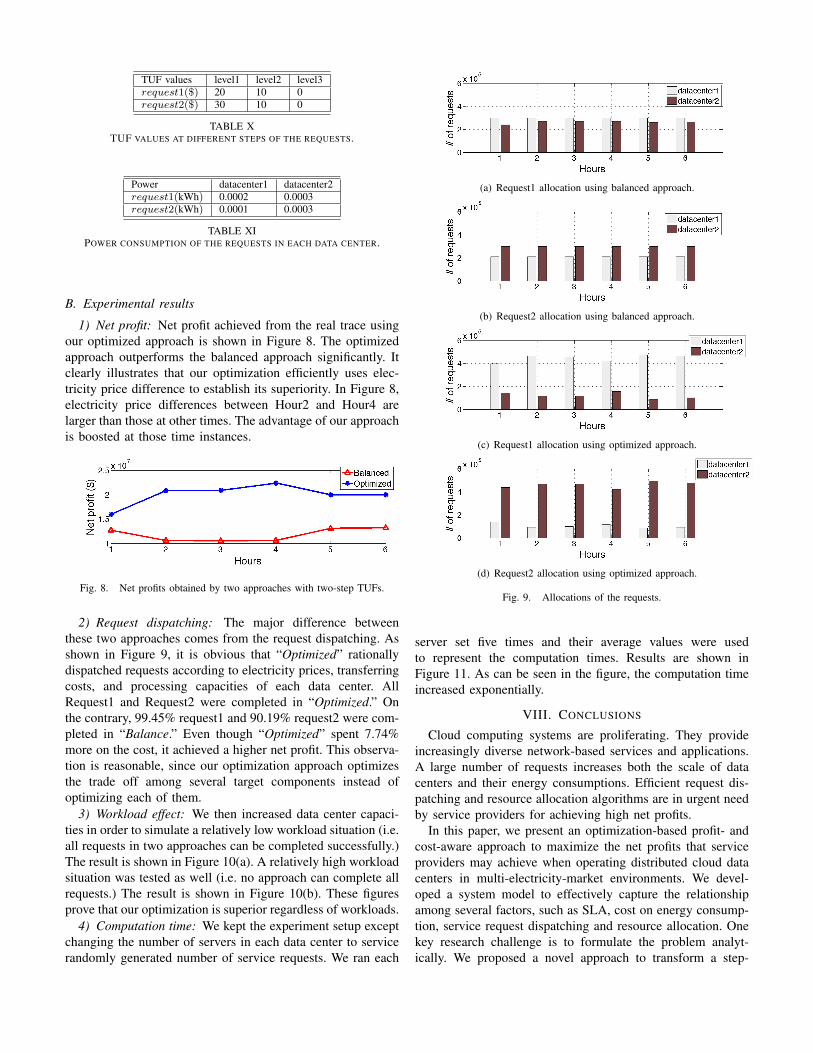
1) Net profit: Net profit achieved from the real trace usingour optimized approach is shown in Figure 8. The optimizedapproach outperforms the balanced approach significantly. Itclearly illustrates that our optimization efficiently uses elec-tricity price difference to establish its superiority. In Figure 8,electricity price differences between Hour2 and Hour4 arelarger than those at other times. The advantage of our approachis boosted at those time instances.
Fig. 8. Net profits obtained by two approaches with two-step TUFs.
2) Request dispatching: The major difference betweenthese two approaches comes from the request dispatching. Asshown in Figure 9, it is obvious that “Optimized” rationallydispatched requests according to electricity prices, transferringcosts, and processing capacities of each data center. AllRequest1 and Request2 were completed in “Optimized.” Onthe contrary, 99.45% request1 and 90.19% request2 were com-pleted in “Balance.” Even though “Optimized” spent 7.74%more on the cost, it achieved a higher net profit. This observa-tion is reasonable, since our optimization approach optimizesthe trade off among several target components instead ofoptimizing each of them.
3) Workload effect: We then increased data center capaci-ties in order to simulate a relatively low workload situation (i.e.all requests in two approaches can be completed successfully.)The result is shown in Figure 10(a). A relatively high workloadsituation was tested as well (i.e. no approach can complete allrequests.) The result is shown in Figure 10(b). These figuresprove that our optimization is superior regardless of workloads.
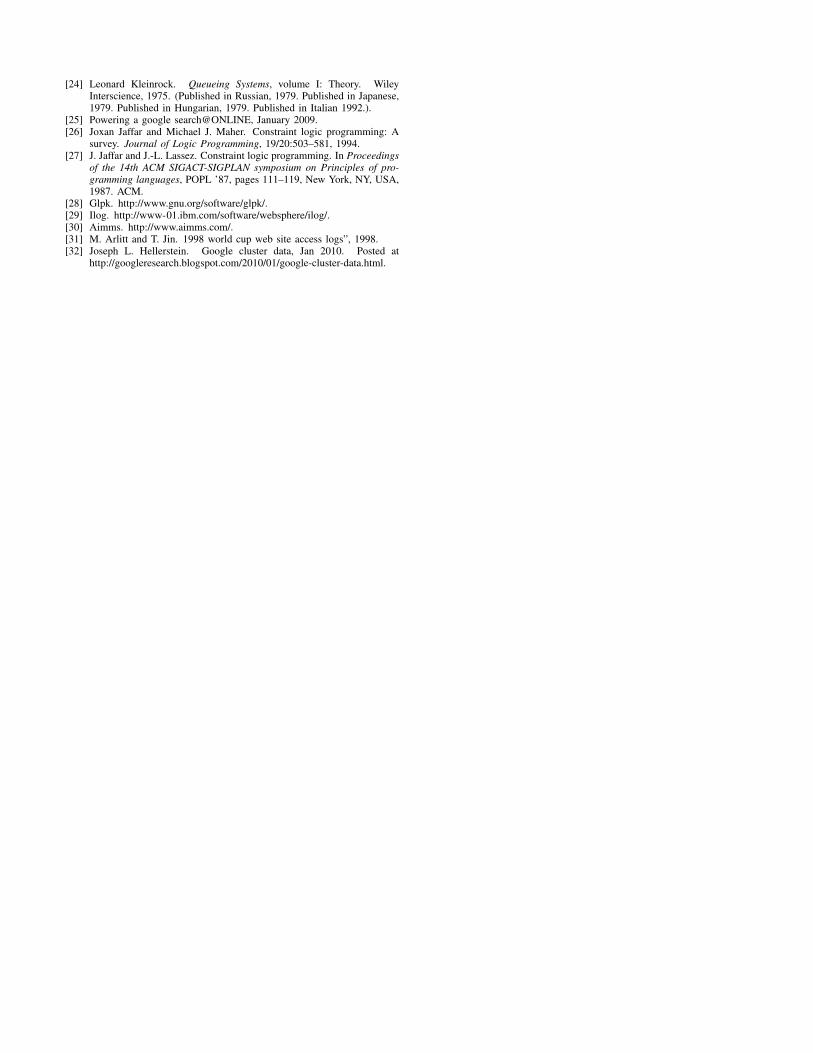
4) Computation time: We kept the experiment setup exceptchanging the number of servers in each data center to servicerandomly generated number of service requests. We ran each
(a) Request1 allocation using balanced approach.
(b) Request2 allocation using balanced approach.
(c) Request1 allocation using optimized approach.
(d) Request2 allocation using optimized approach.
Fig. 9. Allocations of the requests.
server set five times and their average values were usedto represent the computation times. Results are shown inFigure 11. As can be seen in the figure, the computation timeincreased exponentially.
VIII. CONCLUSIONS
Cloud computing systems are proliferating. They provideincreasingly diverse network-based services and applications.A large number of requests increases both the scale of datacenters and their energy consumptions. Efficient request dis-patching and resource allocation algorithms are in urgent needby service providers for achieving high net profits.
In this paper, we present an optimization-based profit- andcost-aware approach to maximize the net profits that serviceproviders may achieve when operating distributed cloud datacenters in multi-electricity-market environments. We devel-oped a system model to effectively capture the relationshipamong several factors, such as SLA, cost on energy consump-tion, service request dispatching and resource allocation. Onekey research challenge is to formulate the problem analyt-ically. We proposed a novel approach to transform a step-
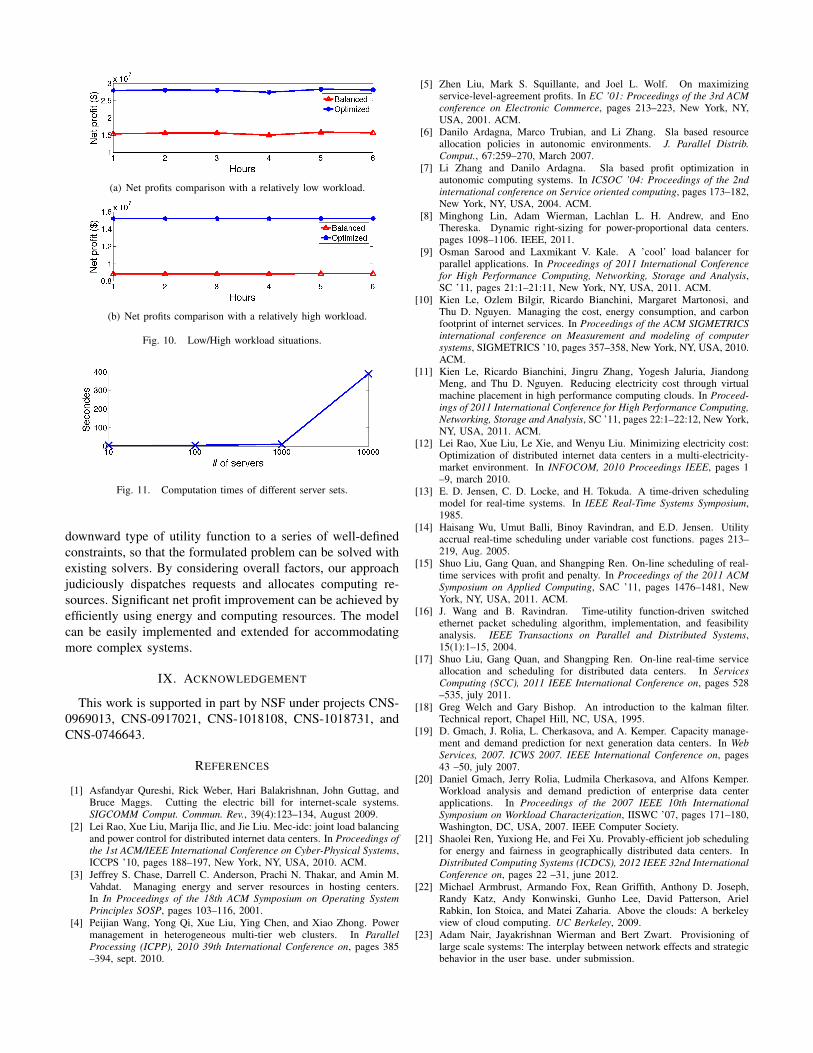
(a) Net profits comparison with a relatively low workload.
(b) Net profits comparison with a relatively high workload.
Fig. 10. Low/High workload situations.
Fig. 11. Computation times of different server sets.
downward type of utility function to a series of well-definedconstraints, so that the formulated problem can be solved withexisting solvers. By considering overall factors, our approachjudiciously dispatches requests and allocates computing re-sources. Significant net profit improvement can be achieved byefficiently using energy and computing resources. The modelcan be easily implemented and extended for accommodatingmore complex systems.
IX. ACKNOWLEDGEMENT
This work is supported in part by NSF under projects CNS-0969013, CNS-0917021, CNS-1018108, CNS-1018731, andCNS-0746643.
REFERENCES
[1] Asfandyar Qureshi, Rick Weber, Hari Balakrishnan, John Guttag, andBruce Maggs. Cutting the electric bill for internet-scale systems.SIGCOMM Comput. Commun. Rev., 39(4):123–134, August 2009.
[2] Lei Rao, Xue Liu, Marija Ilic, and Jie Liu. Mec-idc: joint load balancingand power control for distributed internet data centers. In Proceedings ofthe 1st ACM/IEEE International Conference on Cyber-Physical Systems,ICCPS ’10, pages 188–197, New York, NY, USA, 2010. ACM.
[3] Jeffrey S. Chase, Darrell C. Anderson, Prachi N. Thakar, and Amin M.Vahdat. Managing energy and server resources in hosting centers.In In Proceedings of the 18th ACM Symposium on Operating SystemPrinciples SOSP, pages 103–116, 2001.
[4] Peijian Wang, Yong Qi, Xue Liu, Ying Chen, and Xiao Zhong. Powermanagement in heterogeneous multi-tier web clusters. In ParallelProcessing (ICPP), 2010 39th International Conference on, pages 385–394, sept. 2010.
[5] Zhen Liu, Mark S. Squillante, and Joel L. Wolf. On maximizingservice-level-agreement profits. In EC ’01: Proceedings of the 3rd ACMconference on Electronic Commerce, pages 213–223, New York, NY,USA, 2001. ACM.
[6] Danilo Ardagna, Marco Trubian, and Li Zhang. Sla based resourceallocation policies in autonomic environments. J. Parallel Distrib.Comput., 67:259–270, March 2007.
[7] Li Zhang and Danilo Ardagna. Sla based profit optimization inautonomic computing systems. In ICSOC ’04: Proceedings of the 2ndinternational conference on Service oriented computing, pages 173–182,New York, NY, USA, 2004. ACM.
[8] Minghong Lin, Adam Wierman, Lachlan L. H. Andrew, and EnoThereska. Dynamic right-sizing for power-proportional data centers.pages 1098–1106. IEEE, 2011.
[9] Osman Sarood and Laxmikant V. Kale. A ’cool’ load balancer forparallel applications. In Proceedings of 2011 International Conferencefor High Performance Computing, Networking, Storage and Analysis,SC ’11, pages 21:1–21:11, New York, NY, USA, 2011. ACM.
[10] Kien Le, Ozlem Bilgir, Ricardo Bianchini, Margaret Martonosi, andThu D. Nguyen. Managing the cost, energy consumption, and carbonfootprint of internet services. In Proceedings of the ACM SIGMETRICSinternational conference on Measurement and modeling of computersystems, SIGMETRICS ’10, pages 357–358, New York, NY, USA, 2010.ACM.
[11] Kien Le, Ricardo Bianchini, Jingru Zhang, Yogesh Jaluria, JiandongMeng, and Thu D. Nguyen. Reducing electricity cost through virtualmachine placement in high performance computing clouds. In Proceed-ings of 2011 International Conference for High Performance Computing,Networking, Storage and Analysis, SC ’11, pages 22:1–22:12, New York,NY, USA, 2011. ACM.
[12] Lei Rao, Xue Liu, Le Xie, and Wenyu Liu. Minimizing electricity cost:Optimization of distributed internet data centers in a multi-electricity-market environment. In INFOCOM, 2010 Proceedings IEEE, pages 1–9, march 2010.
[13] E. D. Jensen, C. D. Locke, and H. Tokuda. A time-driven schedulingmodel for real-time systems. In IEEE Real-Time Systems Symposium,1985.
[14] Haisang Wu, Umut Balli, Binoy Ravindran, and E.D. Jensen. Utilityaccrual real-time scheduling under variable cost functions. pages 213–219, Aug. 2005.
[15] Shuo Liu, Gang Quan, and Shangping Ren. On-line scheduling of real-time services with profit and penalty. In Proceedings of the 2011 ACMSymposium on Applied Computing, SAC ’11, pages 1476–1481, NewYork, NY, USA, 2011. ACM.
[16] J. Wang and B. Ravindran. Time-utility function-driven switchedethernet packet scheduling algorithm, implementation, and feasibilityanalysis. IEEE Transactions on Parallel and Distributed Systems,15(1):1–15, 2004.
[17] Shuo Liu, Gang Quan, and Shangping Ren. On-line real-time serviceallocation and scheduling for distributed data centers. In ServicesComputing (SCC), 2011 IEEE International Conference on, pages 528–535, july 2011.
[18] Greg Welch and Gary Bishop. An introduction to the kalman filter.Technical report, Chapel Hill, NC, USA, 1995.
[19] D. Gmach, J. Rolia, L. Cherkasova, and A. Kemper. Capacity manage-ment and demand prediction for next generation data centers. In WebServices, 2007. ICWS 2007. IEEE International Conference on, pages43 –50, july 2007.
[20] Daniel Gmach, Jerry Rolia, Ludmila Cherkasova, and Alfons Kemper.Workload analysis and demand prediction of enterprise data centerapplications. In Proceedings of the 2007 IEEE 10th InternationalSymposium on Workload Characterization, IISWC ’07, pages 171–180,Washington, DC, USA, 2007. IEEE Computer Society.
[21] Shaolei Ren, Yuxiong He, and Fei Xu. Provably-efficient job schedulingfor energy and fairness in geographically distributed data centers. InDistributed Computing Systems (ICDCS), 2012 IEEE 32nd InternationalConference on, pages 22 –31, june 2012.
[22] Michael Armbrust, Armando Fox, Rean Griffith, Anthony D. Joseph,Randy Katz, Andy Konwinski, Gunho Lee, David Patterson, ArielRabkin, Ion Stoica, and Matei Zaharia. Above the clouds: A berkeleyview of cloud computing. UC Berkeley, 2009.
[23] Adam Nair, Jayakrishnan Wierman and Bert Zwart. Provisioning oflarge scale systems: The interplay between network effects and strategicbehavior in the user base. under submission.
[24] Leonard Kleinrock. Queueing Systems, volume I: Theory. WileyInterscience, 1975. (Published in Russian, 1979. Published in Japanese,1979. Published in Hungarian, 1979. Published in Italian 1992.).
[25] Powering a google search@ONLINE, January 2009.[26] Joxan Jaffar and Michael J. Maher. Constraint logic programming: A
survey. Journal of Logic Programming, 19/20:503–581, 1994.[27] J. Jaffar and J.-L. Lassez. Constraint logic programming. In Proceedings
of the 14th ACM SIGACT-SIGPLAN symposium on Principles of pro-gramming languages, POPL ’87, pages 111–119, New York, NY, USA,1987. ACM.
[28] Glpk. http://www.gnu.org/software/glpk/.[29] Ilog. http://www-01.ibm.com/software/websphere/ilog/.[30] Aimms. http://www.aimms.com/.[31] M. Arlitt and T. Jin. 1998 world cup web site access logs”, 1998.[32] Joseph L. Hellerstein. Google cluster data, Jan 2010. Posted at
http://googleresearch.blogspot.com/2010/01/google-cluster-data.html.


![Open Archive TOULOUSE Archive Ouverte ( OATAO ) · Many papers have studied thermal-aware scheduling in data-centers with ... [30] studied thermal-aware load balancing with fan management](https://img.pdfslide.net/doc/110x75/603ea546b704da0962121441/open-archive-toulouse-archive-ouverte-oatao-many-papers-have-studied-thermal-aware.jpg)