Embed Size (px)
Citation preview
Profit maximization by firms
ECO61Udayan Roy
Fall 2008
Revenues and costs
• A firm’s costs (C) were discussed in the previous chapter
• A firm’s revenue is R = P Q– Where P is the price charged by the firm for the
commodity it sells and Q is the quantity of the firm’s output that people buy
– We discussed the link between price and quantity consumed – the demand curve – earlier
• Now it is time to bring revenues and costs together to study a firm’s behavior
Profit-MaximizingPrices and Quantities
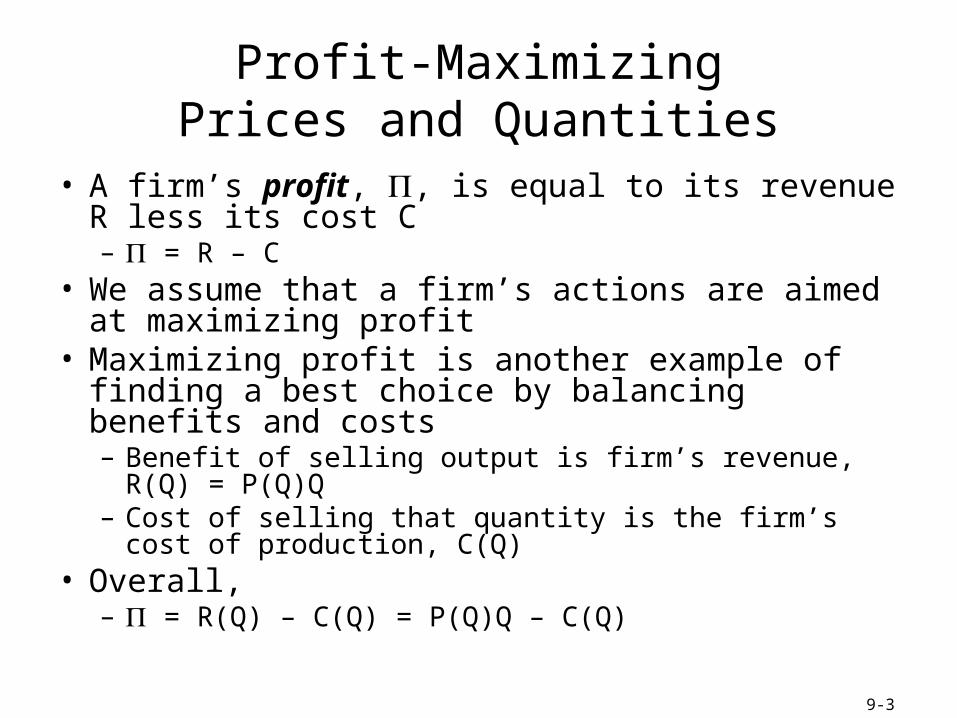
• A firm’s profit, , is equal to its revenue R less its cost C– = R – C
• We assume that a firm’s actions are aimed at maximizing profit
• Maximizing profit is another example of finding a best choice by balancing benefits and costs– Benefit of selling output is firm’s revenue, R(Q) = P(Q)Q– Cost of selling that quantity is the firm’s cost of
production, C(Q)• Overall,
– = R(Q) – C(Q) = P(Q)Q – C(Q)
9-3
Profit-Maximization: An Example
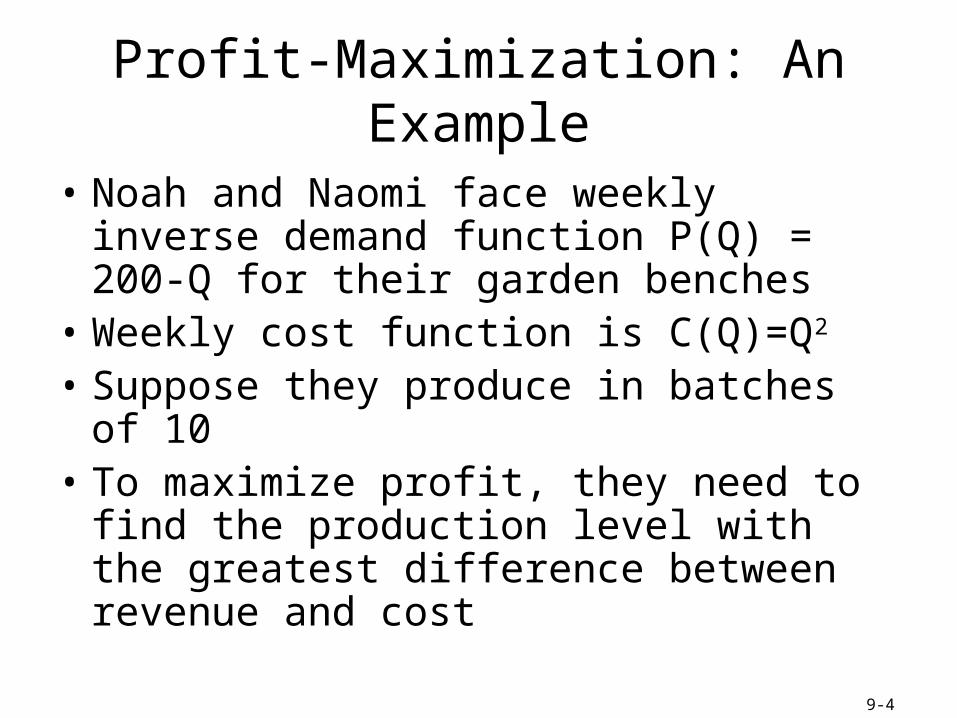
• Noah and Naomi face weekly inverse demand function P(Q) = 200-Q for their garden benches
• Weekly cost function is C(Q)=Q2
• Suppose they produce in batches of 10• To maximize profit, they need to find the
production level with the greatest difference between revenue and cost
9-4
Profit-Maximization: An Example
)]50[50(2
])50250[50(2
])10050[50(2
)1005050(2)100(2
2200200
)200(
22
222
222
2222
222
2
Q
QQQQ
QQQQQ
QQQ
CQPCR
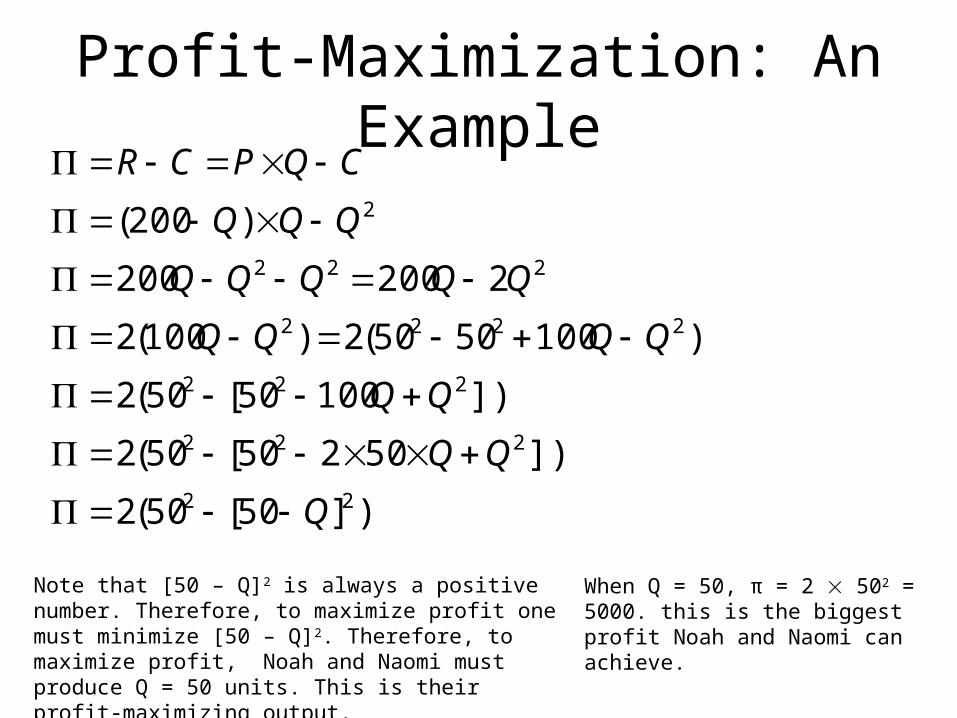
Note that [50 – Q]2 is always a positive number. Therefore, to maximize profit one must minimize [50 – Q]2. Therefore, to maximize profit, Noah and Naomi must produce Q = 50 units. This is their profit-maximizing output.
When Q = 50, π = 2 502 = 5000. this is the biggest profit Noah and Naomi can achieve.
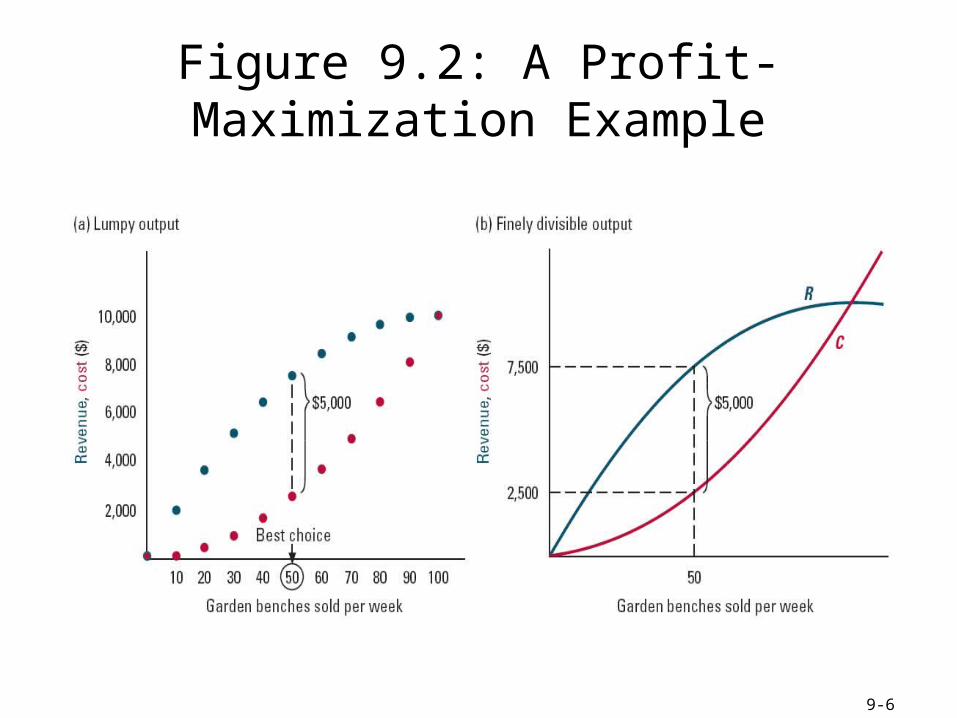
Figure 9.2: A Profit-Maximization Example
9-6
Choice requires balance at the margin
• In general marginal benefit must equal marginal cost at a decision-maker’s best choice whenever a small increase or decrease in her action is possible
Example
Marginal Revenue• Here the firm’s marginal benefit is its marginal
revenue: the extra revenue produced by the Q marginal units sold, measured on a per unit basis
9-9
Marginal Revenue and Price• An increase in sales quantity (Q) changes revenue
in two ways:– Firm sells Q additional units of output, each at a price
of P(Q). This is the output expansion effect: PQ– Firm also has to lower price as dictated by the demand
curve; reduces revenue earned from the original Q units of output. This is the price reduction effect: QP
9-10
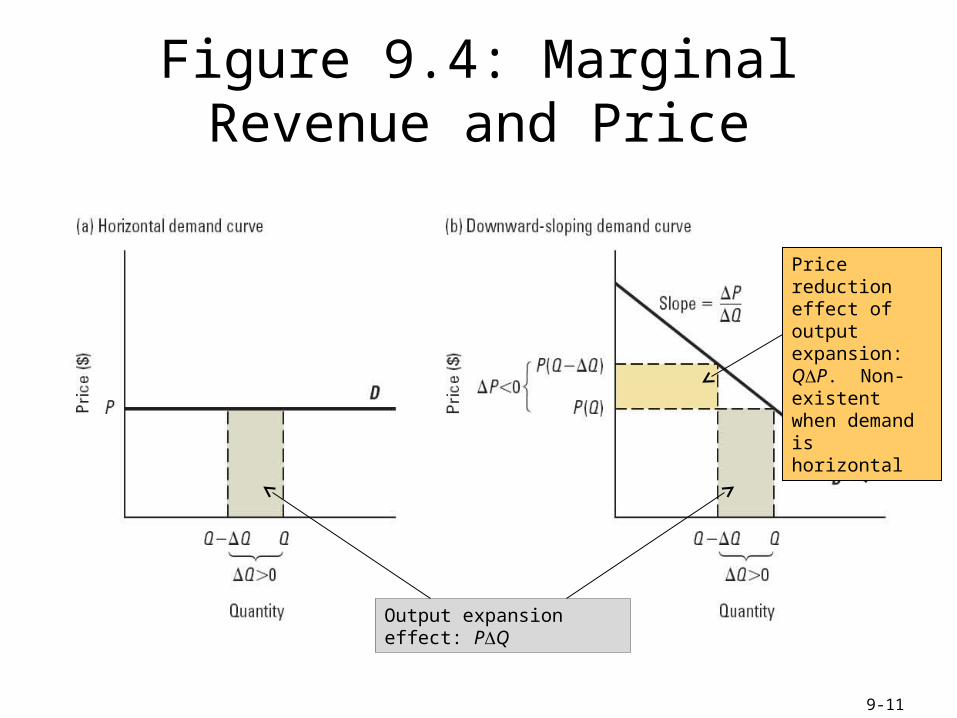
Figure 9.4: Marginal Revenue and Price
9-11
Output expansion effect: PQ
Price reduction effect of output expansion: QP. Non-existent when demand is horizontal
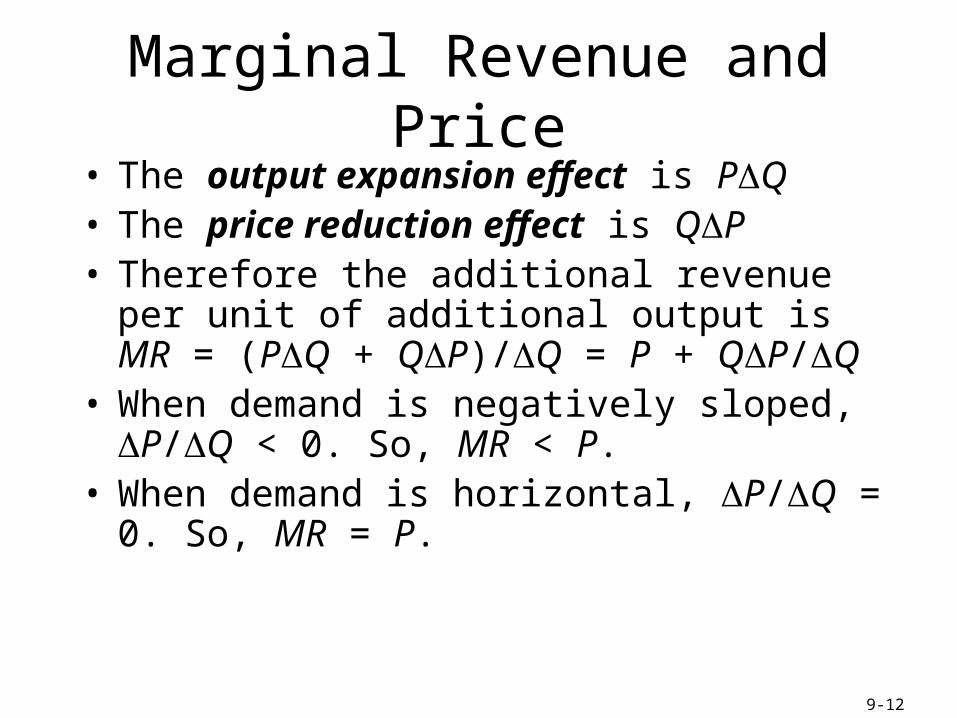
Marginal Revenue and Price• The output expansion effect is PQ• The price reduction effect is QP• Therefore the additional revenue per unit of
additional output is MR = (PQ + QP)/Q = P + QP/Q
• When demand is negatively sloped, P/Q < 0. So, MR < P.
• When demand is horizontal, P/Q = 0. So, MR = P.
9-12
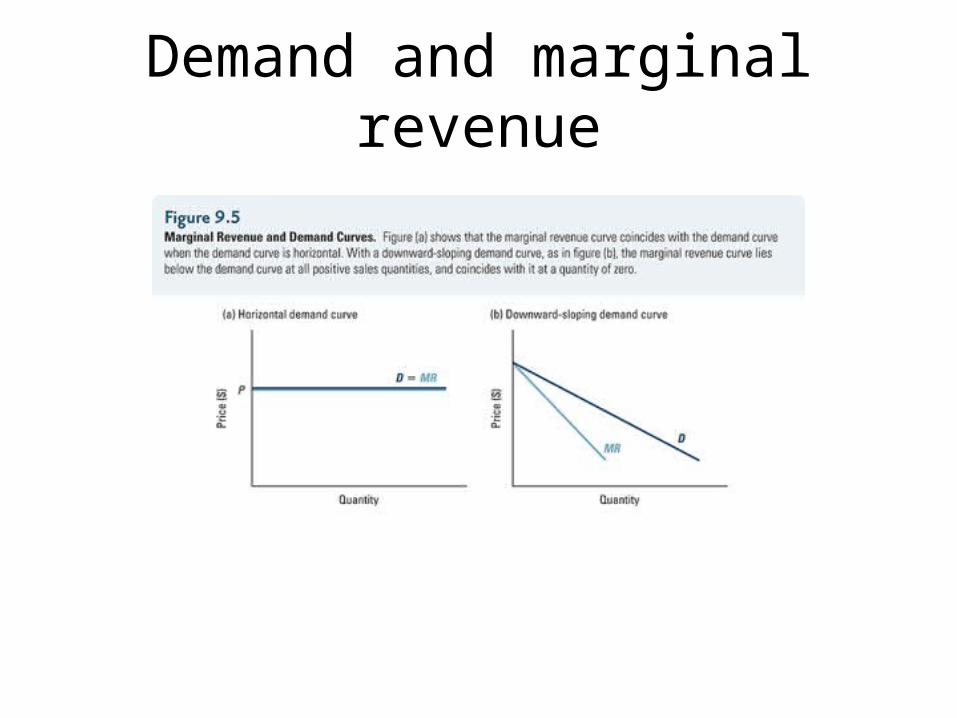
Demand and marginal revenue
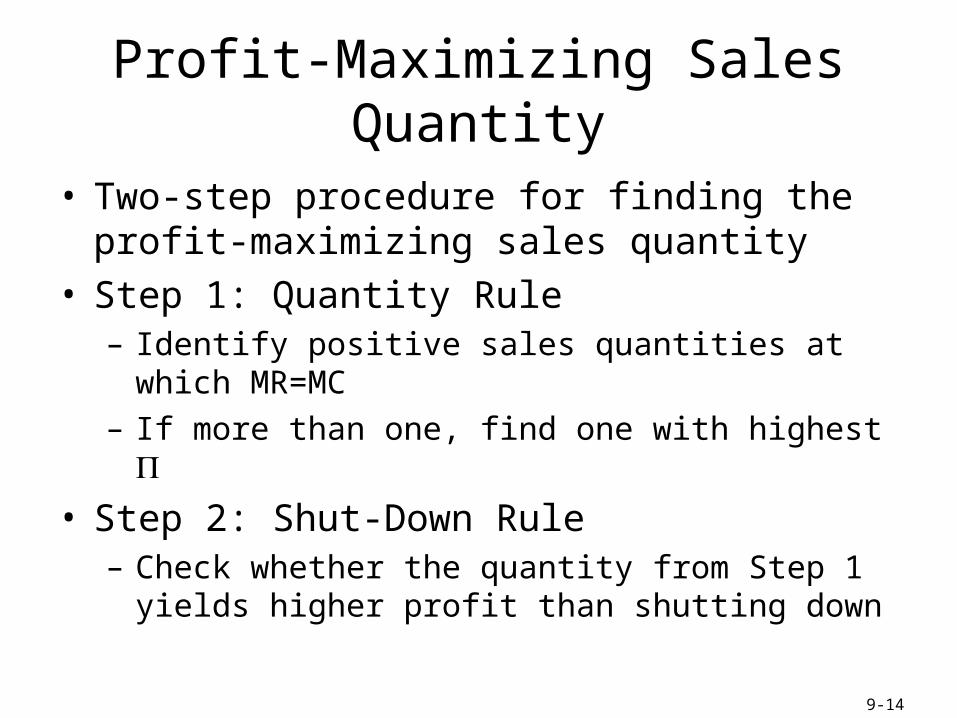
Profit-Maximizing Sales Quantity
• Two-step procedure for finding the profit-maximizing sales quantity
• Step 1: Quantity Rule– Identify positive sales quantities at which MR=MC– If more than one, find one with highest
• Step 2: Shut-Down Rule– Check whether the quantity from Step 1 yields higher
profit than shutting down
9-14
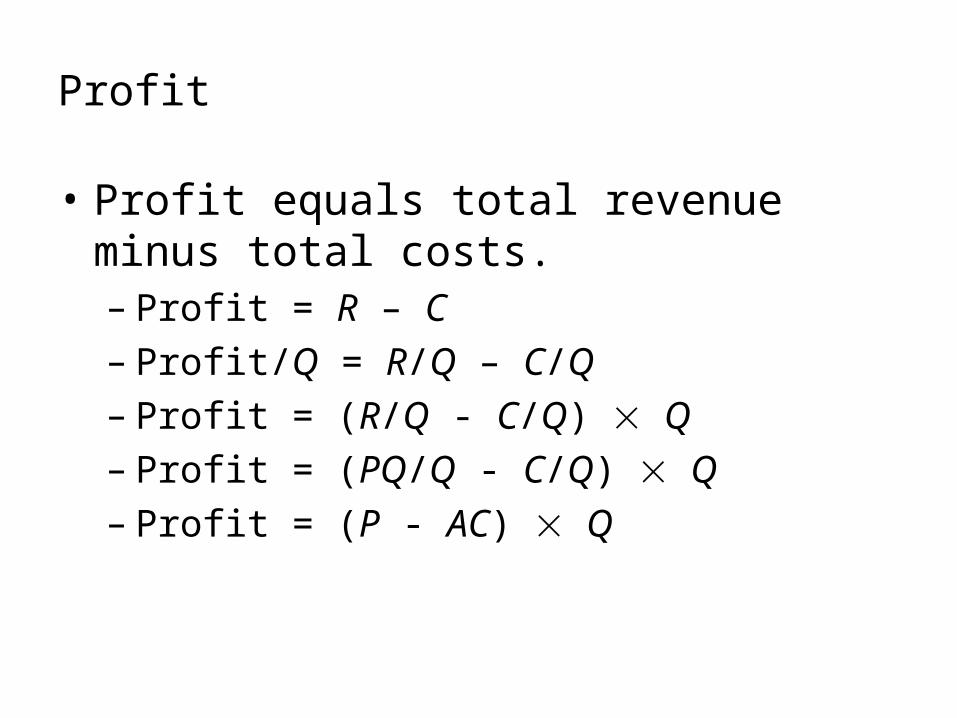
Profit
• Profit equals total revenue minus total costs.– Profit = R – C– Profit/Q = R/Q – C/Q– Profit = (R/Q - C/Q) Q– Profit = (PQ/Q - C/Q) Q– Profit = (P - AC) Q
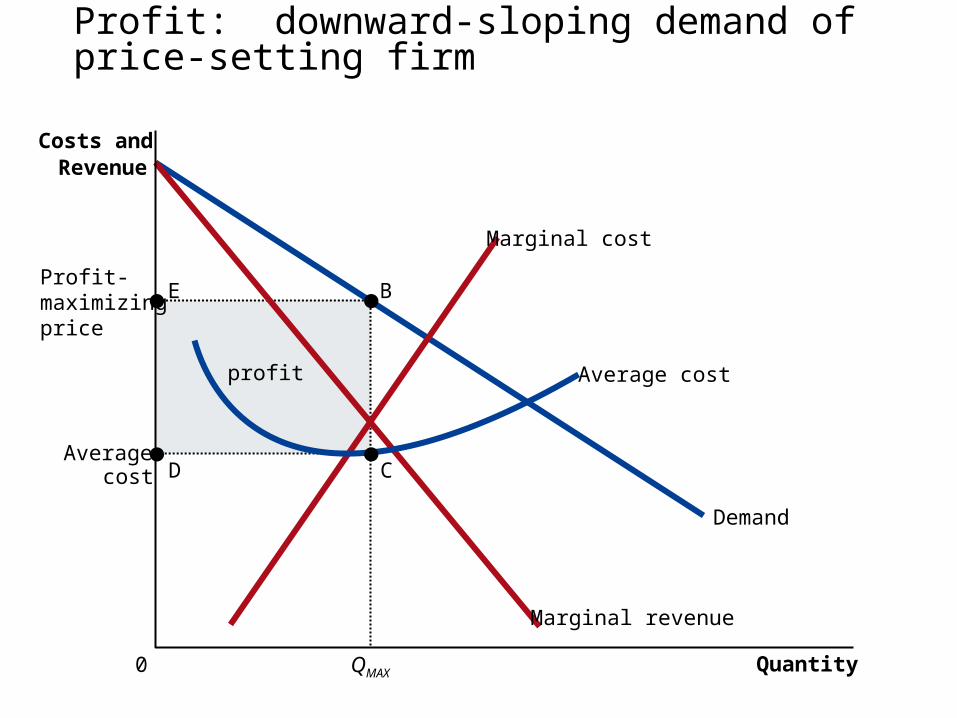
Profit: downward-sloping demand of price-setting firm
profit
Averagecost
Quantity
Profit-maximizing price
QMAX0
Costs andRevenue
Demand
Marginal cost
Marginal revenue
Average cost
B
C
E
D
Profit: downward-sloping demand of price-setting firm
• Recall that profit = (P - AC) Q• Therefore, the firm will stay in business as
long as price (P) is greater than average cost (AC).
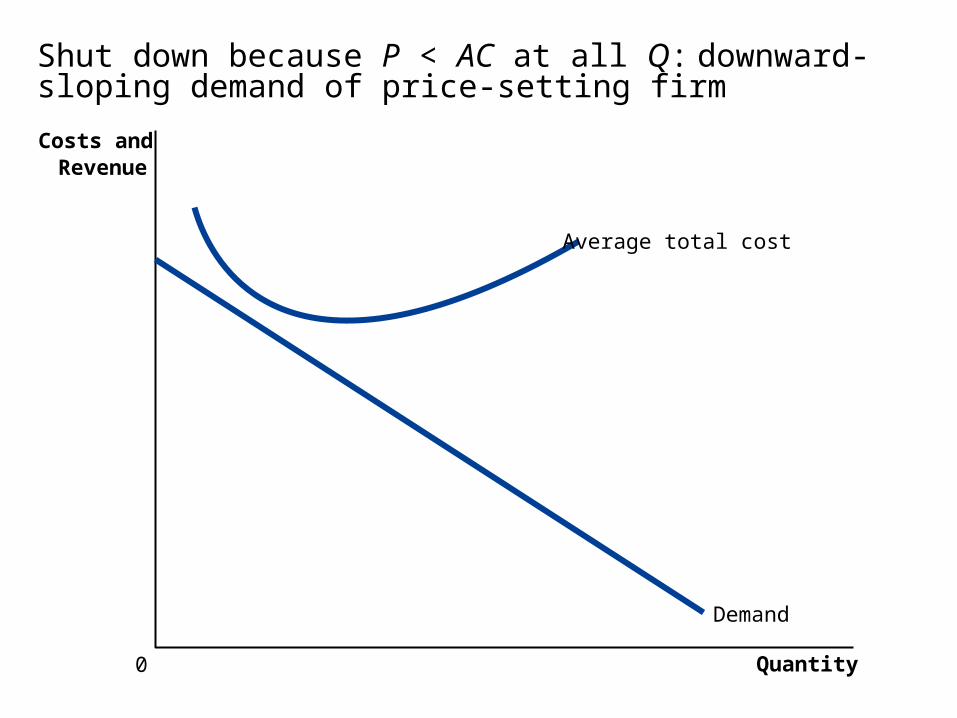
Shut down because P < AC at all Q: downward-sloping demand of price-setting firm
Quantity0
Costs andRevenue
Demand
Average total cost
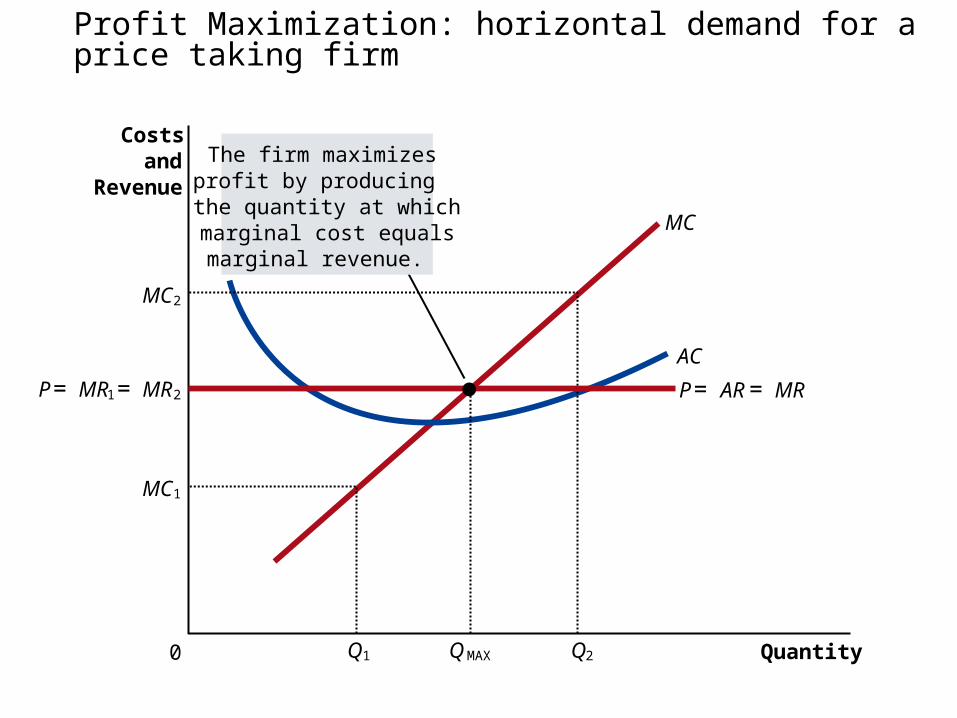
Profit Maximization: horizontal demand for a price taking firm
Quantity0
Costsand
Revenue
MC
AC
MC1
Q1
MC2
Q2
The firm maximizesprofit by producing the quantity at whichmarginal cost equalsmarginal revenue.
QMAX
P = MR1 = MR2 P = AR = MR
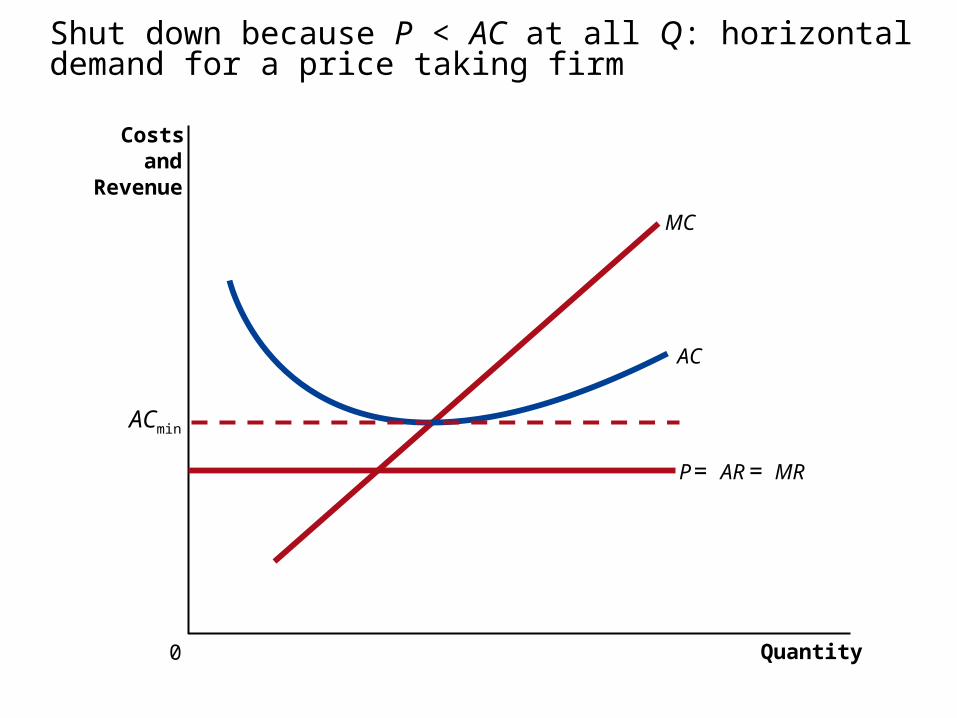
Shut down because P < AC at all Q: horizontal demand for a price taking firm
Quantity0
Costsand
Revenue
MC
AC
P = AR = MR
ACmin
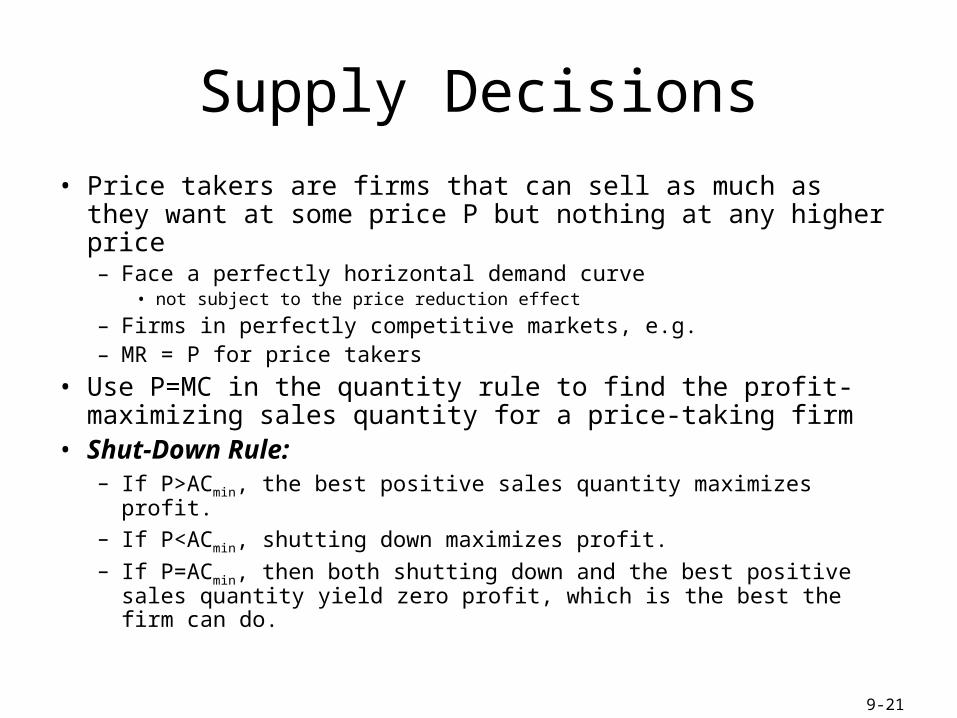
Supply Decisions• Price takers are firms that can sell as much as they want at
some price P but nothing at any higher price– Face a perfectly horizontal demand curve
• not subject to the price reduction effect
– Firms in perfectly competitive markets, e.g.– MR = P for price takers
• Use P=MC in the quantity rule to find the profit-maximizing sales quantity for a price-taking firm
• Shut-Down Rule:– If P>ACmin, the best positive sales quantity maximizes profit.– If P<ACmin, shutting down maximizes profit.– If P=ACmin, then both shutting down and the best positive sales
quantity yield zero profit, which is the best the firm can do.
9-21
Price determination
• We have seen how the price is determined in the case of price setting firms that have downward sloping demand curves
• But how is the price that price taking firms use to guide their production determined?– For now think of it as determined by trial and error.
Pick a random price. See what quantity is demanded by buyers and what quantity is supplied by producers. Keep trying different prices whenever the two quantities are unequal
– The market equilibrium price is the price at which the quantities supplied and demanded are equal