Embed Size (px)
Citation preview
[Saftiana et. al., Vol.6 (Iss.3): March, 2018] ISSN- 2350-0530(O), ISSN- 2394-3629(P)
(Received: Mar 02, 2018 - Accepted: Mar 29, 2018) DOI: 10.5281/zenodo.1216779
Http://www.granthaalayah.com ©International Journal of Research - GRANTHAALAYAH [256]
Management
PROFITABILITY, ADVERTISING INTENSITY AND CONCENTRATION
RATIO IN INDONESIAN CIGARETTE INDUSTRY (2000 -2013)
Yulia Saftiana *1
, Benadette Robiani *2
, Syamsurijal A.K. *3
, Suhel *4
*1, *2, *3, *4
Faculty of Economics, Sriwijaya University, Indonesia
Abstract
This study aimed to invest the relationship of structure, behavior and performance on cigarette
industry in Indonesia. The variable used in this research is concentration ratio that used CR4 to
measure industry structure, advertising intensity of four companies that included in CR4 to
measure promotion behavior, Price Cost Margin (PCM) and profitability of four companies
(ROS) included in CR4 to measure industry performance. Descriptive analysis between Price
Cost Margin (PCM) and concentration of cigarette industry shows the direction of inconsistent
relationship but for 23 years the direction of change is more positive than negative sign.
Otherwise, the relationship between Return on Sales (ROS) with industrial concentration shows
more negative sign than positive sign.
Keywords: Advertising Intensity; Concentration Ratio; Price Cost Margin and Return on Sales.
Cite This Article: Yulia Saftiana, Benadette Robiani, Syamsurijal A.K., and Suhel. (2018).
“PROFITABILITY, ADVERTISING INTENSITY AND CONCENTRATION RATIO IN
INDONESIAN CIGARETTE INDUSTRY (2000 -2013).” International Journal of Research -
Granthaalayah, 6(3), 256-268. https://doi.org/10.5281/zenodo.1216779.
1. Introduction
The definition of cigarettes in article 1, paragraph 1 of Government Regulation (PP) No. 81 of
2002 is the output of processed tobacco wrapped including cigars or other forms produced from
Nicotiona tabacum plants, Nicotiana rustica and other species or synthetics containing nicotine
and tar with or without additional ingredients. More 90% of cigarettes consumption in Indonesia
is kretek type, cigarette with raw material that inserts cloves into tobacco mixture. Another 10%
is consumption in white cigarettes, tobacco, klobot, and cigars. (http://duniaindustri.com).
The growth of the cigarette industry in Indonesia is marked by the birth of a large cigarette
company that controls the market in this industry, such as PT. Gudang Garam, Tbk based in
Kediri, PT. Djarum based in Kudus, PT.HM Sampoerna, Tbk based in Surabaya, PT. Bentoel
based in Malang and PT. Nojorono based in Kudus.
[Saftiana et. al., Vol.6 (Iss.3): March, 2018] ISSN- 2350-0530(O), ISSN- 2394-3629(P)
(Received: Mar 02, 2018 - Accepted: Mar 29, 2018) DOI: 10.5281/zenodo.1216779
Http://www.granthaalayah.com ©International Journal of Research - GRANTHAALAYAH [257]
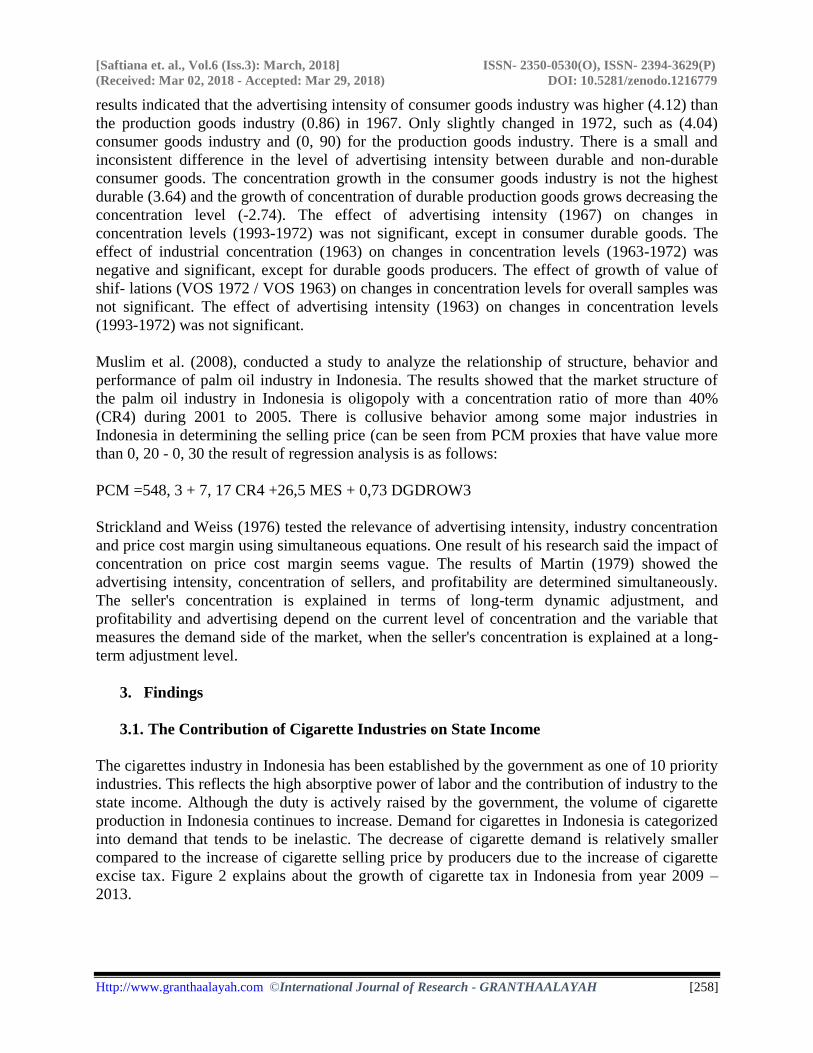
Indonesia is one of the countries with the largest number of smokers in the world after Japan and
Thailand. The number of cigarettes consumed in Indonesia in 2013 was recorded at 341.9 billion
cigarettes. The cigarette industry is one of the major contributors of the State's income, either
developing or developed countries.
Source: Association of Indonesian Cigarette Producers (GAPRI), 2015
Figure 1: Number of Cigarette Industry in Indonesia
Seen from figure 1 the cigarette companies listing on the Indonesia Stock Exchange are H.M
Sampoerna Tbk, Gudang garam Tbk, Bentoel Internasional Ivestama, Tbk and Wismilak Inti
Makmur Tbk, cigarette factories in Indonesia experienced significant depreciation, data from the
Association of Indonesian Cigarette Producers (GAPRI) explained the cigarette factory in 2009
which amounted to 3,225 units. That number decreased to 2600 units in 2010. In 2011 there was
a decline of cigarette factory to 2540 units. Significant decrease of cigarette factory in 2012 to
1000 units. The decline continues to occur until the year 2013 left 800 units of cigarette factories
in Indonesia.
The shrinking number of national cigarette industry becomes a serious problem, because in
general the decrease in the number of industries will affect the decrease of production and excise
income obtained by the government. Although the number of industries declined drastically,
production performance and contribution of excise contributed by national cigarette continue to
experience positive growth. The bankruptcy of small and medium scale cigarette industry
because of its products can not compete with large medium-sized industries. In contrast, large-
scale industry is increasingly expanding the company mainly done by the four largest companies.
From the total 1,664 business units in the cigarette industry in Indonesia, it turns out that six
cigarette companies that control the largest market share. The six cigarette companies are PT
HM Sampoerna Tbk (HMSP) with a market share of 31.1% in 2012, followed by PT Gudang
Garam Tbk (GGRM) with 20.7% share, PT Djarum with 20.2% share, PT Bentoel International
Investama Tbk (RMBA) with 8.0% share, PT Nojorono with a share of 5.8%, and PT Wismilak
Inti Makmur Tbk (WIIM) holds 1% share, based on data duniaindustri.com
(http://duniaindustri.com).
2. Research Elaboration
There are several studies that test the direct relationship between structure and performance.
Peter's research (1981) tested the contribution of the advertising intensity on concentration
changes over the period 1963-1967, and 1967-1972. Using multiple analysis techniques. The
0
1000
2000
3000
4000
2009 2010 2011 2012 2013
3225
2600 2450
1000 800 Series1
[Saftiana et. al., Vol.6 (Iss.3): March, 2018] ISSN- 2350-0530(O), ISSN- 2394-3629(P)
(Received: Mar 02, 2018 - Accepted: Mar 29, 2018) DOI: 10.5281/zenodo.1216779
Http://www.granthaalayah.com ©International Journal of Research - GRANTHAALAYAH [258]
results indicated that the advertising intensity of consumer goods industry was higher (4.12) than
the production goods industry (0.86) in 1967. Only slightly changed in 1972, such as (4.04)
consumer goods industry and (0, 90) for the production goods industry. There is a small and
inconsistent difference in the level of advertising intensity between durable and non-durable
consumer goods. The concentration growth in the consumer goods industry is not the highest
durable (3.64) and the growth of concentration of durable production goods grows decreasing the
concentration level (-2.74). The effect of advertising intensity (1967) on changes in
concentration levels (1993-1972) was not significant, except in consumer durable goods. The
effect of industrial concentration (1963) on changes in concentration levels (1963-1972) was
negative and significant, except for durable goods producers. The effect of growth of value of
shif- lations (VOS 1972 / VOS 1963) on changes in concentration levels for overall samples was
not significant. The effect of advertising intensity (1963) on changes in concentration levels
(1993-1972) was not significant.
Muslim et al. (2008), conducted a study to analyze the relationship of structure, behavior and
performance of palm oil industry in Indonesia. The results showed that the market structure of
the palm oil industry in Indonesia is oligopoly with a concentration ratio of more than 40%
(CR4) during 2001 to 2005. There is collusive behavior among some major industries in
Indonesia in determining the selling price (can be seen from PCM proxies that have value more
than 0, 20 - 0, 30 the result of regression analysis is as follows:
PCM =548, 3 + 7, 17 CR4 +26,5 MES + 0,73 DGDROW3
Strickland and Weiss (1976) tested the relevance of advertising intensity, industry concentration
and price cost margin using simultaneous equations. One result of his research said the impact of
concentration on price cost margin seems vague. The results of Martin (1979) showed the
advertising intensity, concentration of sellers, and profitability are determined simultaneously.
The seller's concentration is explained in terms of long-term dynamic adjustment, and
profitability and advertising depend on the current level of concentration and the variable that
measures the demand side of the market, when the seller's concentration is explained at a long-
term adjustment level.
3. Findings
3.1. The Contribution of Cigarette Industries on State Income
The cigarettes industry in Indonesia has been established by the government as one of 10 priority
industries. This reflects the high absorptive power of labor and the contribution of industry to the
state income. Although the duty is actively raised by the government, the volume of cigarette
production in Indonesia continues to increase. Demand for cigarettes in Indonesia is categorized
into demand that tends to be inelastic. The decrease of cigarette demand is relatively smaller
compared to the increase of cigarette selling price by producers due to the increase of cigarette
excise tax. Figure 2 explains about the growth of cigarette tax in Indonesia from year 2009 –
2013.
[Saftiana et. al., Vol.6 (Iss.3): March, 2018] ISSN- 2350-0530(O), ISSN- 2394-3629(P)
(Received: Mar 02, 2018 - Accepted: Mar 29, 2018) DOI: 10.5281/zenodo.1216779
Http://www.granthaalayah.com ©International Journal of Research - GRANTHAALAYAH [259]
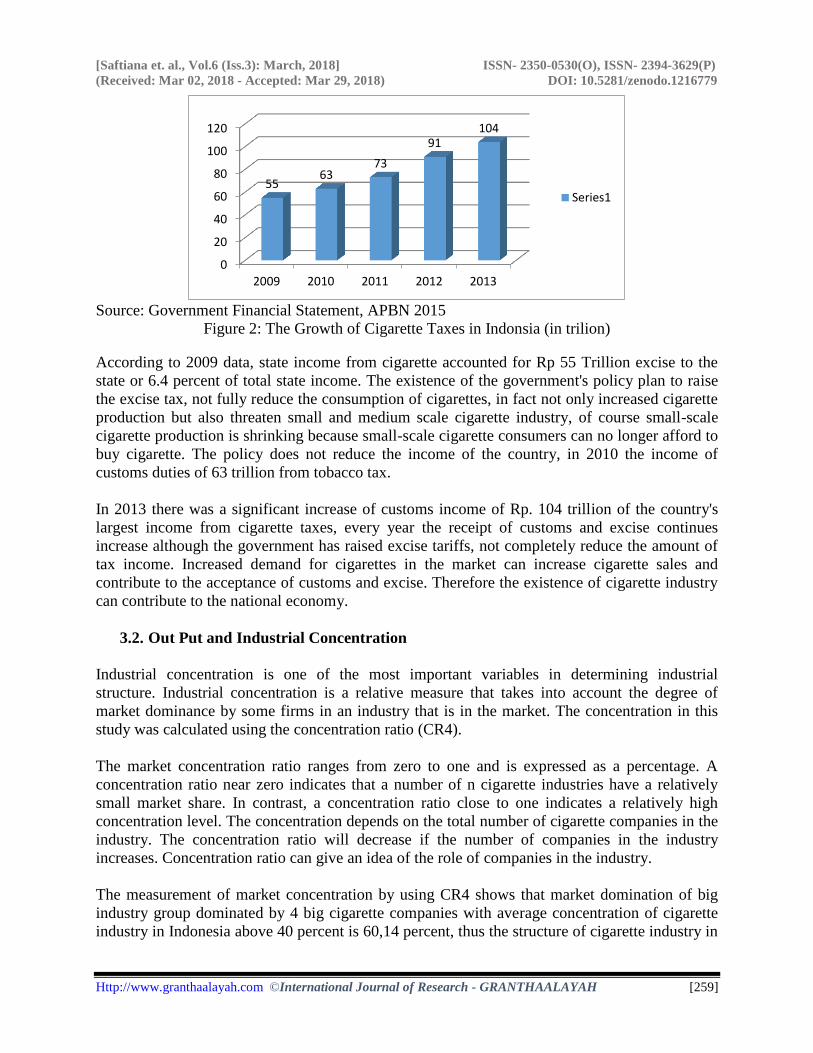
Source: Government Financial Statement, APBN 2015
Figure 2: The Growth of Cigarette Taxes in Indonsia (in trilion)
According to 2009 data, state income from cigarette accounted for Rp 55 Trillion excise to the
state or 6.4 percent of total state income. The existence of the government's policy plan to raise
the excise tax, not fully reduce the consumption of cigarettes, in fact not only increased cigarette
production but also threaten small and medium scale cigarette industry, of course small-scale
cigarette production is shrinking because small-scale cigarette consumers can no longer afford to
buy cigarette. The policy does not reduce the income of the country, in 2010 the income of
customs duties of 63 trillion from tobacco tax.
In 2013 there was a significant increase of customs income of Rp. 104 trillion of the country's
largest income from cigarette taxes, every year the receipt of customs and excise continues
increase although the government has raised excise tariffs, not completely reduce the amount of
tax income. Increased demand for cigarettes in the market can increase cigarette sales and
contribute to the acceptance of customs and excise. Therefore the existence of cigarette industry
can contribute to the national economy.
3.2. Out Put and Industrial Concentration
Industrial concentration is one of the most important variables in determining industrial
structure. Industrial concentration is a relative measure that takes into account the degree of
market dominance by some firms in an industry that is in the market. The concentration in this
study was calculated using the concentration ratio (CR4).
The market concentration ratio ranges from zero to one and is expressed as a percentage. A
concentration ratio near zero indicates that a number of n cigarette industries have a relatively
small market share. In contrast, a concentration ratio close to one indicates a relatively high
concentration level. The concentration depends on the total number of cigarette companies in the
industry. The concentration ratio will decrease if the number of companies in the industry
increases. Concentration ratio can give an idea of the role of companies in the industry.
The measurement of market concentration by using CR4 shows that market domination of big
industry group dominated by 4 big cigarette companies with average concentration of cigarette
industry in Indonesia above 40 percent is 60,14 percent, thus the structure of cigarette industry in
0
20
40
60
80
100
120
2009 2010 2011 2012 2013
55 63
73
91 104
Series1
[Saftiana et. al., Vol.6 (Iss.3): March, 2018] ISSN- 2350-0530(O), ISSN- 2394-3629(P)
(Received: Mar 02, 2018 - Accepted: Mar 29, 2018) DOI: 10.5281/zenodo.1216779
Http://www.granthaalayah.com ©International Journal of Research - GRANTHAALAYAH [260]
Indonesia can classified as oligopoly structure. This means that the four largest companies
control about 60, 14 percent of the total supply of a good in the market.
The output growth of the 4 largest companies and the concentration of the cigarette industries
from 1990 to 2013 are presented in Table 1.
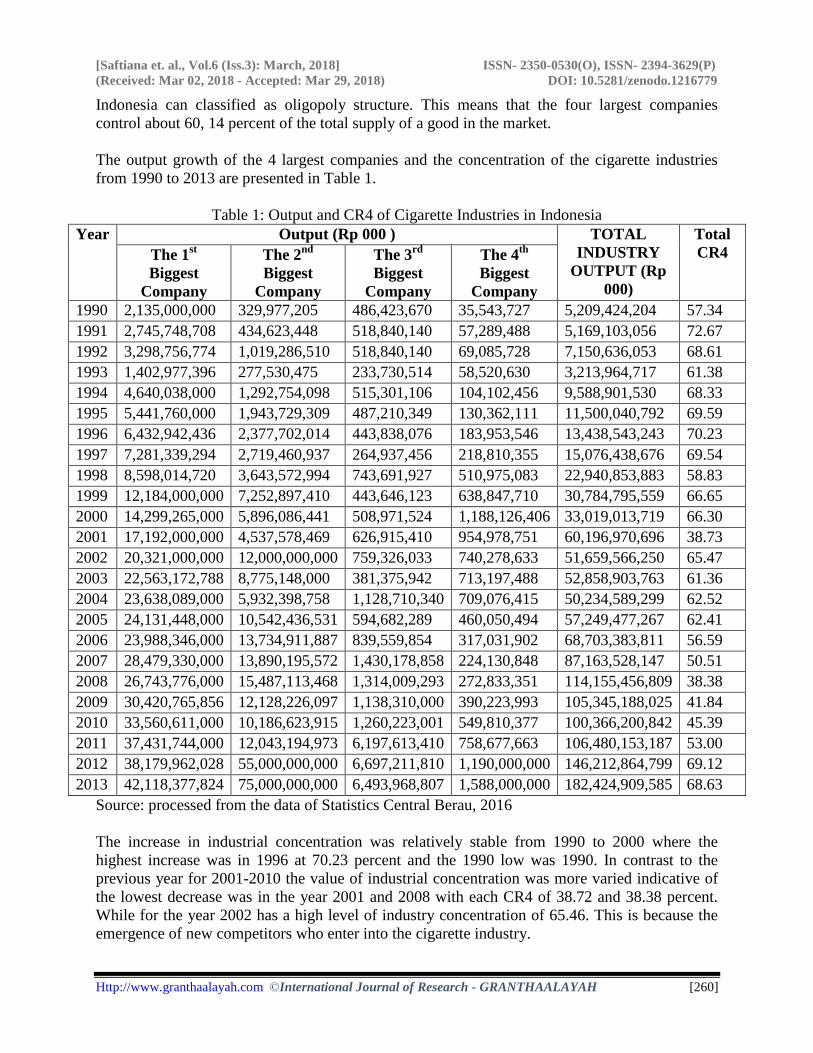
Table 1: Output and CR4 of Cigarette Industries in Indonesia
Year Output (Rp 000 ) TOTAL
INDUSTRY
OUTPUT (Rp
000)
Total
CR4 The 1st
Biggest
Company
The 2nd
Biggest
Company
The 3rd
Biggest
Company
The 4th
Biggest
Company
1990 2,135,000,000 329,977,205 486,423,670 35,543,727 5,209,424,204 57.34
1991 2,745,748,708 434,623,448 518,840,140 57,289,488 5,169,103,056 72.67
1992 3,298,756,774 1,019,286,510 518,840,140 69,085,728 7,150,636,053 68.61
1993 1,402,977,396 277,530,475 233,730,514 58,520,630 3,213,964,717 61.38
1994 4,640,038,000 1,292,754,098 515,301,106 104,102,456 9,588,901,530 68.33
1995 5,441,760,000 1,943,729,309 487,210,349 130,362,111 11,500,040,792 69.59
1996 6,432,942,436 2,377,702,014 443,838,076 183,953,546 13,438,543,243 70.23
1997 7,281,339,294 2,719,460,937 264,937,456 218,810,355 15,076,438,676 69.54
1998 8,598,014,720 3,643,572,994 743,691,927 510,975,083 22,940,853,883 58.83
1999 12,184,000,000 7,252,897,410 443,646,123 638,847,710 30,784,795,559 66.65
2000 14,299,265,000 5,896,086,441 508,971,524 1,188,126,406 33,019,013,719 66.30
2001 17,192,000,000 4,537,578,469 626,915,410 954,978,751 60,196,970,696 38.73
2002 20,321,000,000 12,000,000,000 759,326,033 740,278,633 51,659,566,250 65.47
2003 22,563,172,788 8,775,148,000 381,375,942 713,197,488 52,858,903,763 61.36
2004 23,638,089,000 5,932,398,758 1,128,710,340 709,076,415 50,234,589,299 62.52
2005 24,131,448,000 10,542,436,531 594,682,289 460,050,494 57,249,477,267 62.41
2006 23,988,346,000 13,734,911,887 839,559,854 317,031,902 68,703,383,811 56.59
2007 28,479,330,000 13,890,195,572 1,430,178,858 224,130,848 87,163,528,147 50.51
2008 26,743,776,000 15,487,113,468 1,314,009,293 272,833,351 114,155,456,809 38.38
2009 30,420,765,856 12,128,226,097 1,138,310,000 390,223,993 105,345,188,025 41.84
2010 33,560,611,000 10,186,623,915 1,260,223,001 549,810,377 100,366,200,842 45.39
2011 37,431,744,000 12,043,194,973 6,197,613,410 758,677,663 106,480,153,187 53.00
2012 38,179,962,028 55,000,000,000 6,697,211,810 1,190,000,000 146,212,864,799 69.12
2013 42,118,377,824 75,000,000,000 6,493,968,807 1,588,000,000 182,424,909,585 68.63
Source: processed from the data of Statistics Central Berau, 2016
The increase in industrial concentration was relatively stable from 1990 to 2000 where the
highest increase was in 1996 at 70.23 percent and the 1990 low was 1990. In contrast to the
previous year for 2001-2010 the value of industrial concentration was more varied indicative of
the lowest decrease was in the year 2001 and 2008 with each CR4 of 38.72 and 38.38 percent.
While for the year 2002 has a high level of industry concentration of 65.46. This is because the
emergence of new competitors who enter into the cigarette industry.
[Saftiana et. al., Vol.6 (Iss.3): March, 2018] ISSN- 2350-0530(O), ISSN- 2394-3629(P)
(Received: Mar 02, 2018 - Accepted: Mar 29, 2018) DOI: 10.5281/zenodo.1216779
Http://www.granthaalayah.com ©International Journal of Research - GRANTHAALAYAH [261]
The industrial concentration from 2011-2013 has increased significantly which is 52.99 percent
(2011) increased by 68.63 percent (2013). Where the company (2) has the highest market share
of 41.11 percent while the company (4) has the lowest market share among the other 4
companies by 0.87 percent.
A high concentration ratio will indicate that the market is dominated by a small number of
companies, which means the shape of the oligopoly structure. In oligopoly structures, large
producers can influence prices by controlling production output. The lower concentration, the
closer market is at perfectly competitive condition. The results of observations made in
accordance with the report of the Association of Indonesian Cigarette Manufacturers (GAPPRI)
showed the dominance of 6 cigarette companies PT Gudang Garam, Tbk., PT HM. Sampoerna,
PT Bentoel, PT Djarum Kudus, PT Nojorono and Wismilak Inti Makmur Tbk from 800
companies throughout Indonesia.
Large-scale companies have the opportunity to gain higher efficiency, especially in production
costs. Thus the total growth of fixed assets can illustrate the growth of factory size. Table 1
generally shows the observations on the average total fixed assets of 4 companies with the
largest market goose (CR4) in Indonesia's tobacco industry. The average number of company
fixed assets increased during 1990 to 2013. Several years decreased, ie in 1997, 2006, 2007, and
2010. From the trend in Table 1 shows that the fixed asset investment needs of the cigarette
industries increase every year.
3.3. Advertising Intensity
Hitting your business for different types of products will lead to different advertising behavior.
There are different sales efforts between search goods and experience goods. Search goods are
the characteristics of the product before purchasing or not purchased, the customer must first
learn the product. While the experience goods are goods purchased by the customer only when it
has been using the product. Advertising in newspapers and magazines can be made to explain in
detail the search goods. Experiential goods should be tested first by the customer before deciding
to buy it. Advertising is needed to influence customer demand for experience goods because
customers believe the advertised goods will be better for them to buy. (Martin, 1994).
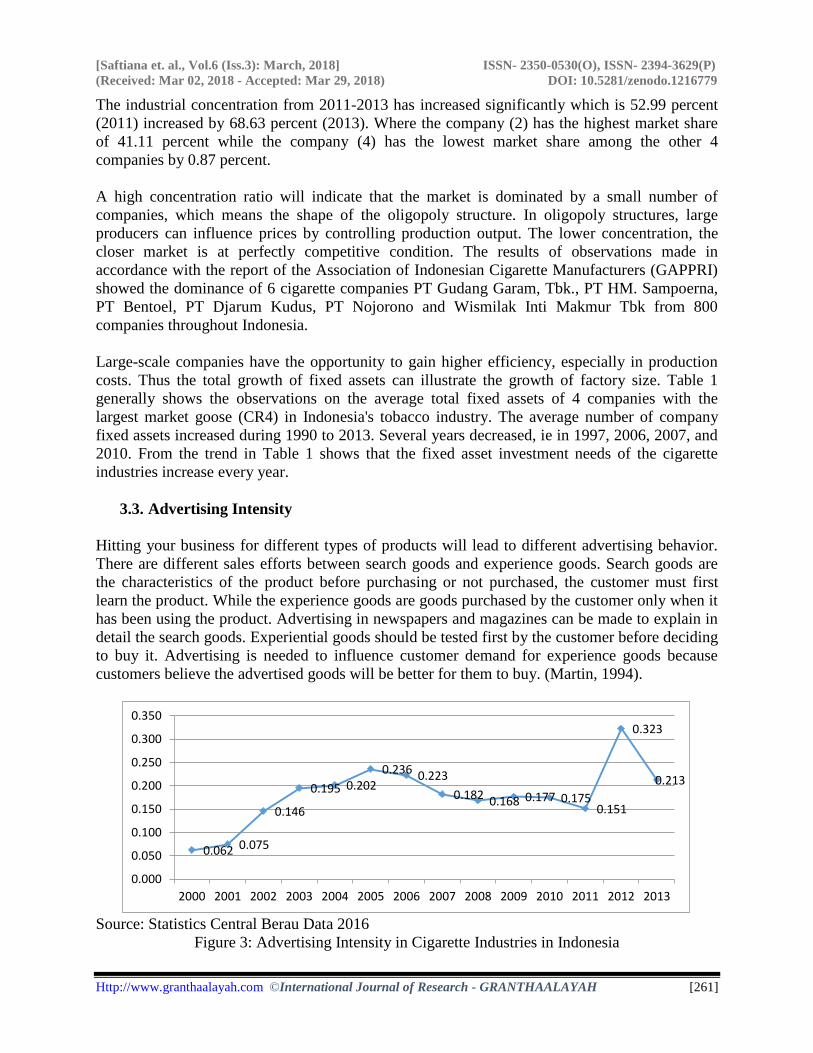
Source: Statistics Central Berau Data 2016
Figure 3: Advertising Intensity in Cigarette Industries in Indonesia
0.062 0.075
0.146
0.195 0.202 0.236 0.223
0.182 0.168 0.177 0.175 0.151
0.323
0.213
0.000
0.050
0.100
0.150
0.200
0.250
0.300
0.350
2000 2001 2002 2003 2004 2005 2006 2007 2008 2009 2010 2011 2012 2013
[Saftiana et. al., Vol.6 (Iss.3): March, 2018] ISSN- 2350-0530(O), ISSN- 2394-3629(P)
(Received: Mar 02, 2018 - Accepted: Mar 29, 2018) DOI: 10.5281/zenodo.1216779
Http://www.granthaalayah.com ©International Journal of Research - GRANTHAALAYAH [262]
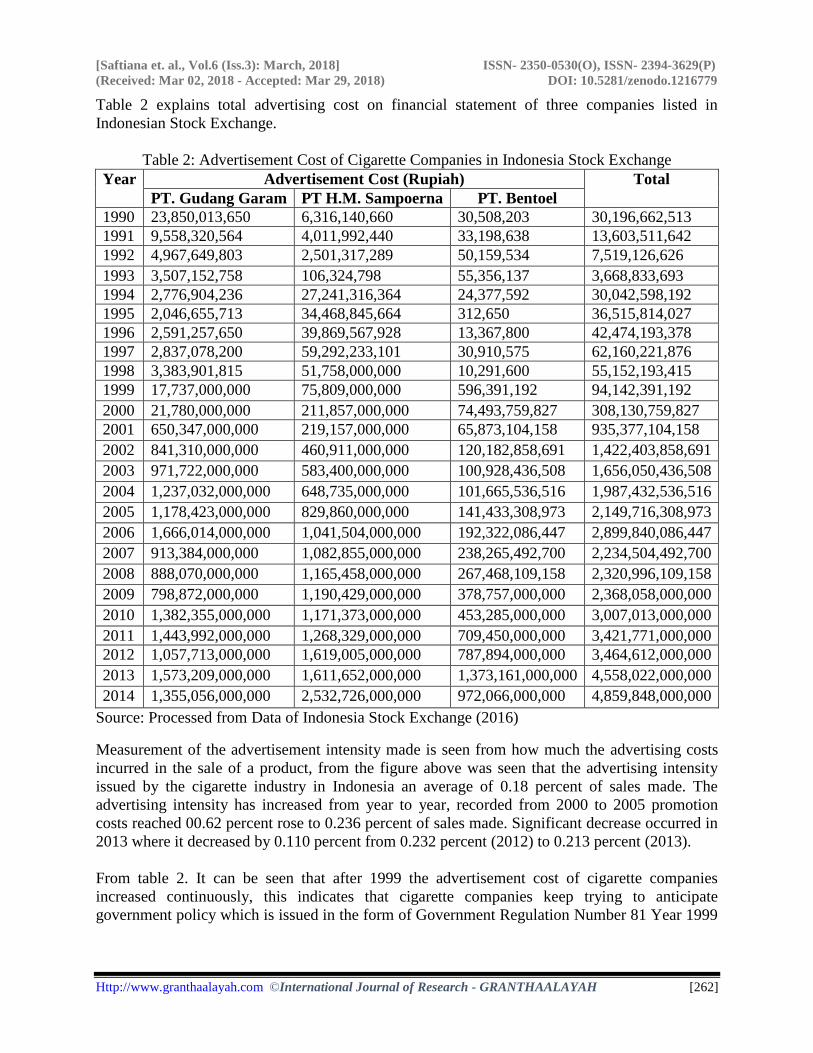
Table 2 explains total advertising cost on financial statement of three companies listed in
Indonesian Stock Exchange.
Table 2: Advertisement Cost of Cigarette Companies in Indonesia Stock Exchange
Year Advertisement Cost (Rupiah) Total
PT. Gudang Garam PT H.M. Sampoerna PT. Bentoel
1990 23,850,013,650 6,316,140,660 30,508,203 30,196,662,513
1991 9,558,320,564 4,011,992,440 33,198,638 13,603,511,642
1992 4,967,649,803 2,501,317,289 50,159,534 7,519,126,626
1993 3,507,152,758 106,324,798 55,356,137 3,668,833,693
1994 2,776,904,236 27,241,316,364 24,377,592 30,042,598,192
1995 2,046,655,713 34,468,845,664 312,650 36,515,814,027
1996 2,591,257,650 39,869,567,928 13,367,800 42,474,193,378
1997 2,837,078,200 59,292,233,101 30,910,575 62,160,221,876
1998 3,383,901,815 51,758,000,000 10,291,600 55,152,193,415
1999 17,737,000,000 75,809,000,000 596,391,192 94,142,391,192
2000 21,780,000,000 211,857,000,000 74,493,759,827 308,130,759,827
2001 650,347,000,000 219,157,000,000 65,873,104,158 935,377,104,158
2002 841,310,000,000 460,911,000,000 120,182,858,691 1,422,403,858,691
2003 971,722,000,000 583,400,000,000 100,928,436,508 1,656,050,436,508
2004 1,237,032,000,000 648,735,000,000 101,665,536,516 1,987,432,536,516
2005 1,178,423,000,000 829,860,000,000 141,433,308,973 2,149,716,308,973
2006 1,666,014,000,000 1,041,504,000,000 192,322,086,447 2,899,840,086,447
2007 913,384,000,000 1,082,855,000,000 238,265,492,700 2,234,504,492,700
2008 888,070,000,000 1,165,458,000,000 267,468,109,158 2,320,996,109,158
2009 798,872,000,000 1,190,429,000,000 378,757,000,000 2,368,058,000,000
2010 1,382,355,000,000 1,171,373,000,000 453,285,000,000 3,007,013,000,000
2011 1,443,992,000,000 1,268,329,000,000 709,450,000,000 3,421,771,000,000
2012 1,057,713,000,000 1,619,005,000,000 787,894,000,000 3,464,612,000,000
2013 1,573,209,000,000 1,611,652,000,000 1,373,161,000,000 4,558,022,000,000
2014 1,355,056,000,000 2,532,726,000,000 972,066,000,000 4,859,848,000,000
Source: Processed from Data of Indonesia Stock Exchange (2016)
Measurement of the advertisement intensity made is seen from how much the advertising costs
incurred in the sale of a product, from the figure above was seen that the advertising intensity
issued by the cigarette industry in Indonesia an average of 0.18 percent of sales made. The
advertising intensity has increased from year to year, recorded from 2000 to 2005 promotion
costs reached 00.62 percent rose to 0.236 percent of sales made. Significant decrease occurred in
2013 where it decreased by 0.110 percent from 0.232 percent (2012) to 0.213 percent (2013).
From table 2. It can be seen that after 1999 the advertisement cost of cigarette companies
increased continuously, this indicates that cigarette companies keep trying to anticipate
government policy which is issued in the form of Government Regulation Number 81 Year 1999
[Saftiana et. al., Vol.6 (Iss.3): March, 2018] ISSN- 2350-0530(O), ISSN- 2394-3629(P)
(Received: Mar 02, 2018 - Accepted: Mar 29, 2018) DOI: 10.5281/zenodo.1216779
Http://www.granthaalayah.com ©International Journal of Research - GRANTHAALAYAH [263]
about security of cigarette danger for health and reinforced by Law Number 31 of 2002 on
Broadcasting.
3.4. Cigarette Industries Profit
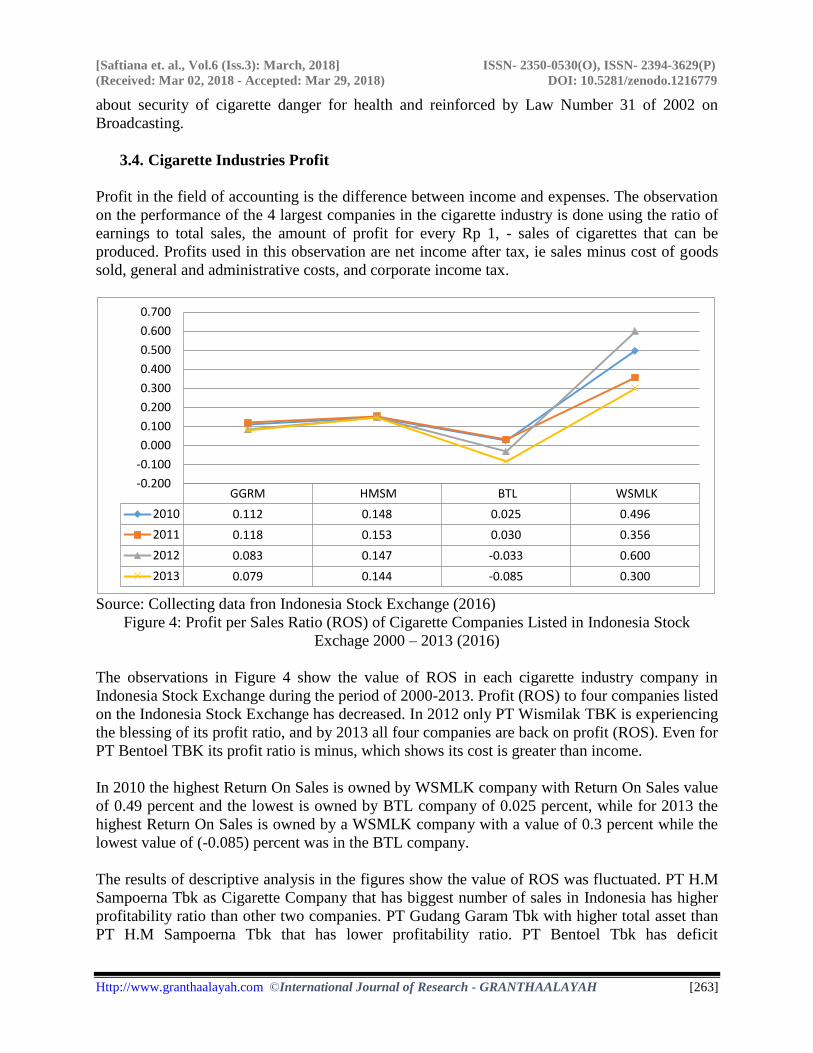
Profit in the field of accounting is the difference between income and expenses. The observation
on the performance of the 4 largest companies in the cigarette industry is done using the ratio of
earnings to total sales, the amount of profit for every Rp 1, - sales of cigarettes that can be
produced. Profits used in this observation are net income after tax, ie sales minus cost of goods
sold, general and administrative costs, and corporate income tax.
Source: Collecting data fron Indonesia Stock Exchange (2016)
Figure 4: Profit per Sales Ratio (ROS) of Cigarette Companies Listed in Indonesia Stock
Exchage 2000 – 2013 (2016)
The observations in Figure 4 show the value of ROS in each cigarette industry company in
Indonesia Stock Exchange during the period of 2000-2013. Profit (ROS) to four companies listed
on the Indonesia Stock Exchange has decreased. In 2012 only PT Wismilak TBK is experiencing
the blessing of its profit ratio, and by 2013 all four companies are back on profit (ROS). Even for
PT Bentoel TBK its profit ratio is minus, which shows its cost is greater than income.
In 2010 the highest Return On Sales is owned by WSMLK company with Return On Sales value
of 0.49 percent and the lowest is owned by BTL company of 0.025 percent, while for 2013 the
highest Return On Sales is owned by a WSMLK company with a value of 0.3 percent while the
lowest value of (-0.085) percent was in the BTL company.
The results of descriptive analysis in the figures show the value of ROS was fluctuated. PT H.M
Sampoerna Tbk as Cigarette Company that has biggest number of sales in Indonesia has higher
profitability ratio than other two companies. PT Gudang Garam Tbk with higher total asset than
PT H.M Sampoerna Tbk that has lower profitability ratio. PT Bentoel Tbk has deficit
GGRM HMSM BTL WSMLK
2010 0.112 0.148 0.025 0.496
2011 0.118 0.153 0.030 0.356
2012 0.083 0.147 -0.033 0.600
2013 0.079 0.144 -0.085 0.300
-0.200
-0.100
0.000
0.100
0.200
0.300
0.400
0.500
0.600
0.700
[Saftiana et. al., Vol.6 (Iss.3): March, 2018] ISSN- 2350-0530(O), ISSN- 2394-3629(P)
(Received: Mar 02, 2018 - Accepted: Mar 29, 2018) DOI: 10.5281/zenodo.1216779
Http://www.granthaalayah.com ©International Journal of Research - GRANTHAALAYAH [264]
profitability ratio. Profit is calculated by sales minus cost of good sold and administration and tax
expense. If profitability ratio PT Bentoel Tbk is deficit, but company still exist because the four
cigarette companies has biggest market share, which means the reason of deficit is because the
amount of fixed asset company. The components of fixed asset are salary expense, depreciation
of fixed asset expense and interest expense. Otherwise sales can cover variable cost, therefore
company can still exist.
3.5. The Effect of Advertising Intensity on Concentration Ratio
Companies in one type of industry selling a truly uniform standard product will never happen. In
the consumer goods industry, for example a standard product is mineral water. In fact there are
various brands of mineral water that have different standards with different prices. In the
cigarette industry, there are three kinds of standard cigarette products, namely clove cigarettes,
white cigarette and cigar. The fact is each type of cigarette has a specific difference for each
brand.
One of the advertising goals is to create a "brand perception" to strengthen consumer loyalty to
the brand. Cigarette products have consumers who are very loyal to a brand. Habitual and
cultural factors of society also greatly affect the strong level of consumer loyalty. So the purpose
of cigarette industry promotion behavior in the form of advertising to maintain and increase
market share is positive.
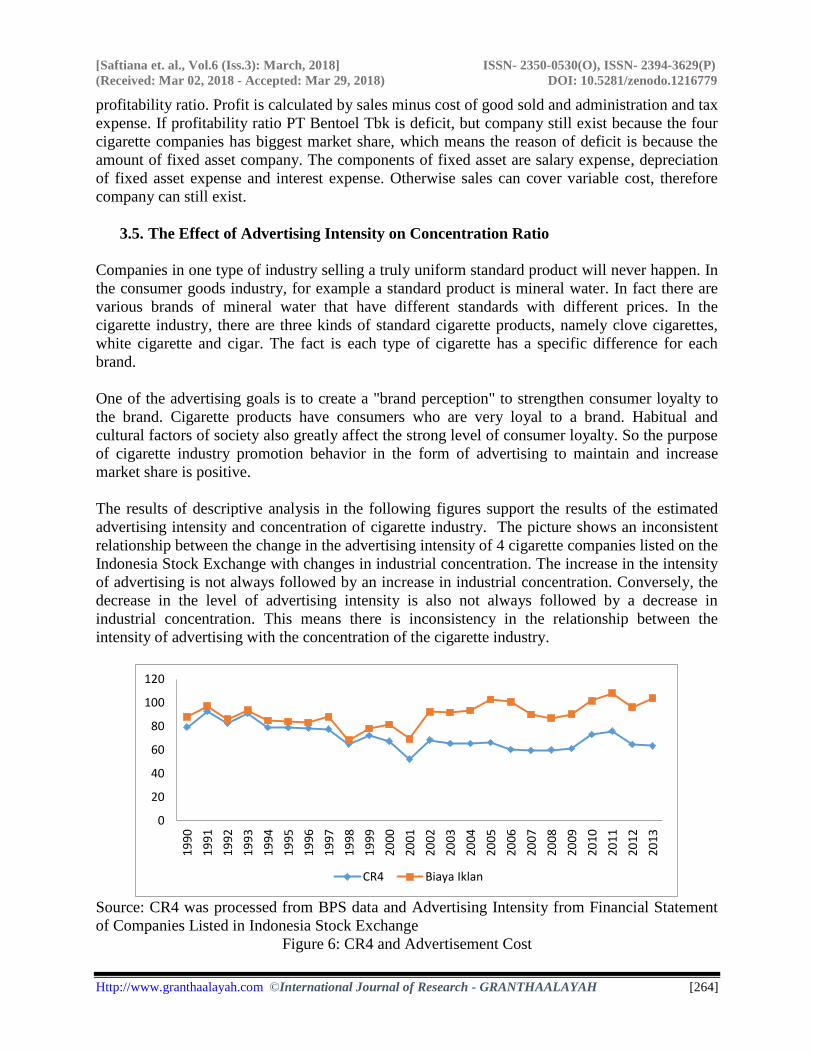
The results of descriptive analysis in the following figures support the results of the estimated
advertising intensity and concentration of cigarette industry. The picture shows an inconsistent
relationship between the change in the advertising intensity of 4 cigarette companies listed on the
Indonesia Stock Exchange with changes in industrial concentration. The increase in the intensity
of advertising is not always followed by an increase in industrial concentration. Conversely, the
decrease in the level of advertising intensity is also not always followed by a decrease in
industrial concentration. This means there is inconsistency in the relationship between the
intensity of advertising with the concentration of the cigarette industry.
Source: CR4 was processed from BPS data and Advertising Intensity from Financial Statement
of Companies Listed in Indonesia Stock Exchange
Figure 6: CR4 and Advertisement Cost
0
20
40
60
80
100
120
19
90
19
91
19
92
19
93
19
94
19
95
19
96
19
97
19
98
19
99
20
00
20
01
20
02
20
03
20
04
20
05
20
06
20
07
20
08
20
09
20
10
20
11
20
12
20
13
CR4 Biaya Iklan
[Saftiana et. al., Vol.6 (Iss.3): March, 2018] ISSN- 2350-0530(O), ISSN- 2394-3629(P)
(Received: Mar 02, 2018 - Accepted: Mar 29, 2018) DOI: 10.5281/zenodo.1216779
Http://www.granthaalayah.com ©International Journal of Research - GRANTHAALAYAH [265]
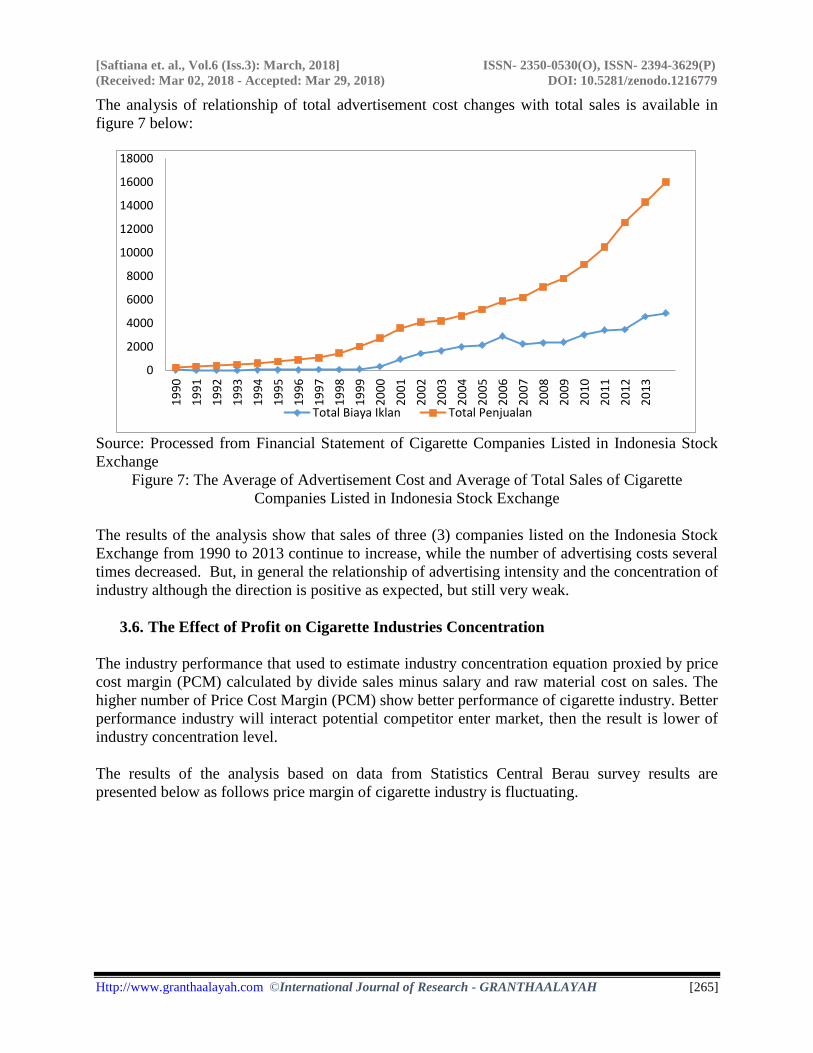
The analysis of relationship of total advertisement cost changes with total sales is available in
figure 7 below:
Source: Processed from Financial Statement of Cigarette Companies Listed in Indonesia Stock
Exchange
Figure 7: The Average of Advertisement Cost and Average of Total Sales of Cigarette
Companies Listed in Indonesia Stock Exchange
The results of the analysis show that sales of three (3) companies listed on the Indonesia Stock
Exchange from 1990 to 2013 continue to increase, while the number of advertising costs several
times decreased. But, in general the relationship of advertising intensity and the concentration of
industry although the direction is positive as expected, but still very weak.
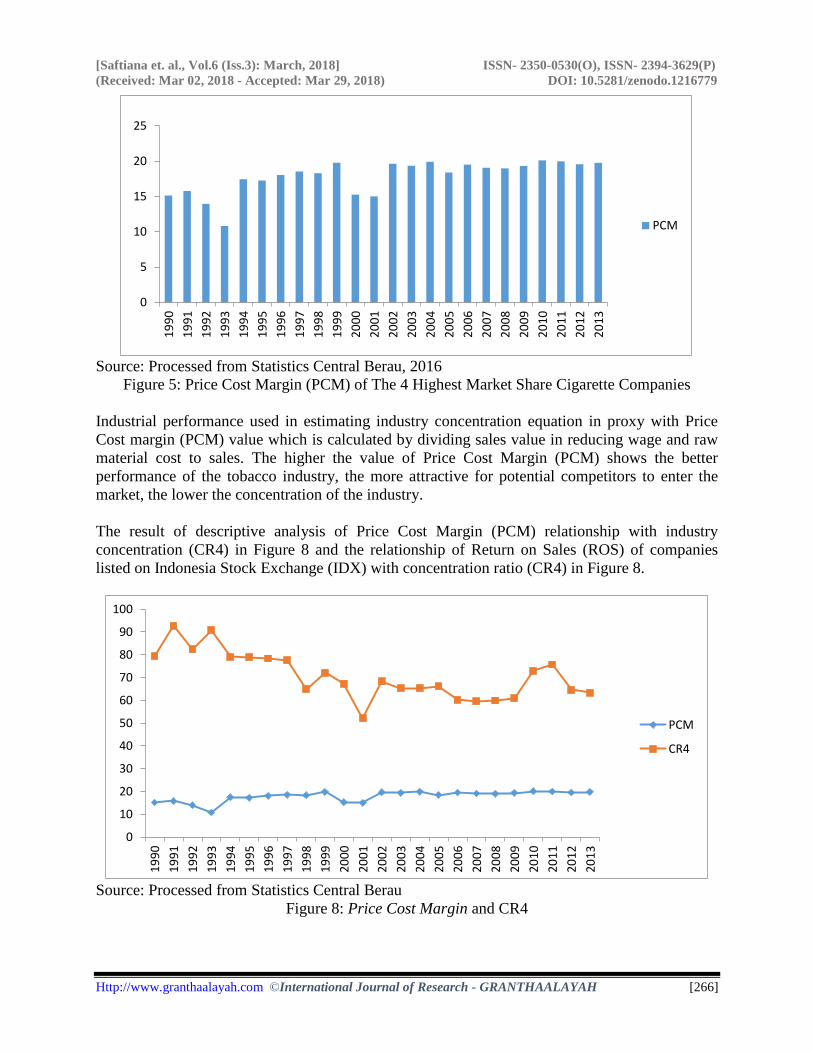
3.6. The Effect of Profit on Cigarette Industries Concentration
The industry performance that used to estimate industry concentration equation proxied by price
cost margin (PCM) calculated by divide sales minus salary and raw material cost on sales. The
higher number of Price Cost Margin (PCM) show better performance of cigarette industry. Better
performance industry will interact potential competitor enter market, then the result is lower of
industry concentration level.
The results of the analysis based on data from Statistics Central Berau survey results are
presented below as follows price margin of cigarette industry is fluctuating.
0
2000
4000
6000
8000
10000
12000
14000
16000
18000
19
90
19
91
19
92
19
93
19
94
19
95
19
96
19
97
19
98
19
99
20
00
20
01
20
02
20
03
20
04
20
05
20
06
20
07
20
08
20
09
20
10
20
11
20
12
20
13
Total Biaya Iklan Total Penjualan
[Saftiana et. al., Vol.6 (Iss.3): March, 2018] ISSN- 2350-0530(O), ISSN- 2394-3629(P)
(Received: Mar 02, 2018 - Accepted: Mar 29, 2018) DOI: 10.5281/zenodo.1216779
Http://www.granthaalayah.com ©International Journal of Research - GRANTHAALAYAH [266]
Source: Processed from Statistics Central Berau, 2016
Figure 5: Price Cost Margin (PCM) of The 4 Highest Market Share Cigarette Companies
Industrial performance used in estimating industry concentration equation in proxy with Price
Cost margin (PCM) value which is calculated by dividing sales value in reducing wage and raw
material cost to sales. The higher the value of Price Cost Margin (PCM) shows the better
performance of the tobacco industry, the more attractive for potential competitors to enter the
market, the lower the concentration of the industry.
The result of descriptive analysis of Price Cost Margin (PCM) relationship with industry
concentration (CR4) in Figure 8 and the relationship of Return on Sales (ROS) of companies
listed on Indonesia Stock Exchange (IDX) with concentration ratio (CR4) in Figure 8.
Source: Processed from Statistics Central Berau
Figure 8: Price Cost Margin and CR4
0
5
10
15
20
25
19
90
19
91
19
92
19
93
19
94
19
95
19
96
19
97
19
98
19
99
20
00
20
01
20
02
20
03
20
04
20
05
20
06
20
07
20
08
20
09
20
10
20
11
20
12
20
13
PCM
0
10
20
30
40
50
60
70
80
90
100
19
90
19
91
19
92
19
93
19
94
19
95
19
96
19
97
19
98
19
99
20
00
20
01
20
02
20
03
20
04
20
05
20
06
20
07
20
08
20
09
20
10
20
11
20
12
20
13
PCM
CR4
[Saftiana et. al., Vol.6 (Iss.3): March, 2018] ISSN- 2350-0530(O), ISSN- 2394-3629(P)
(Received: Mar 02, 2018 - Accepted: Mar 29, 2018) DOI: 10.5281/zenodo.1216779
Http://www.granthaalayah.com ©International Journal of Research - GRANTHAALAYAH [267]
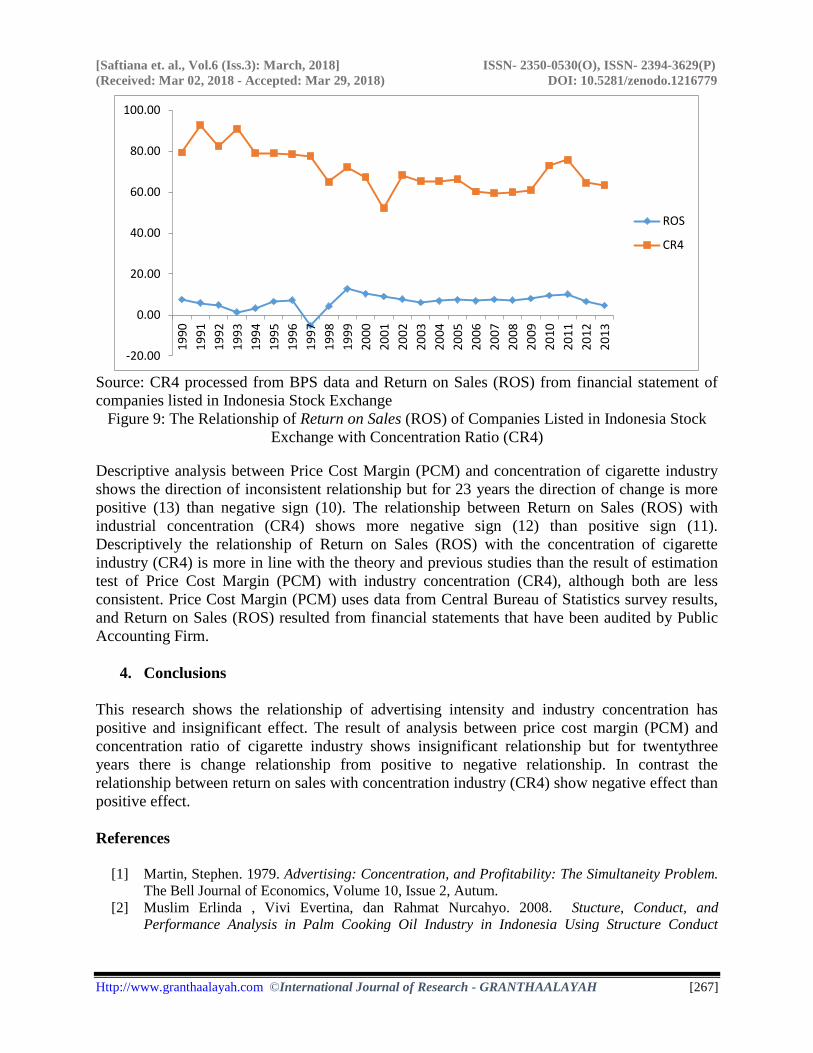
Source: CR4 processed from BPS data and Return on Sales (ROS) from financial statement of
companies listed in Indonesia Stock Exchange
Figure 9: The Relationship of Return on Sales (ROS) of Companies Listed in Indonesia Stock
Exchange with Concentration Ratio (CR4) Descriptive analysis between Price Cost Margin (PCM) and concentration of cigarette industry
shows the direction of inconsistent relationship but for 23 years the direction of change is more
positive (13) than negative sign (10). The relationship between Return on Sales (ROS) with
industrial concentration (CR4) shows more negative sign (12) than positive sign (11).
Descriptively the relationship of Return on Sales (ROS) with the concentration of cigarette
industry (CR4) is more in line with the theory and previous studies than the result of estimation
test of Price Cost Margin (PCM) with industry concentration (CR4), although both are less
consistent. Price Cost Margin (PCM) uses data from Central Bureau of Statistics survey results,
and Return on Sales (ROS) resulted from financial statements that have been audited by Public
Accounting Firm.
4. Conclusions
This research shows the relationship of advertising intensity and industry concentration has
positive and insignificant effect. The result of analysis between price cost margin (PCM) and
concentration ratio of cigarette industry shows insignificant relationship but for twentythree
years there is change relationship from positive to negative relationship. In contrast the
relationship between return on sales with concentration industry (CR4) show negative effect than
positive effect.
References
[1] Martin, Stephen. 1979. Advertising: Concentration, and Profitability: The Simultaneity Problem.
The Bell Journal of Economics, Volume 10, Issue 2, Autum.
[2] Muslim Erlinda , Vivi Evertina, dan Rahmat Nurcahyo. 2008. Stucture, Conduct, and
Performance Analysis in Palm Cooking Oil Industry in Indonesia Using Structure Conduct
-20.00
0.00
20.00
40.00
60.00
80.00
100.00
19
90
19
91
19
92
19
93
19
94
19
95
19
96
19
97
19
98
19
99
20
00
20
01
20
02
20
03
20
04
20
05
20
06
20
07
20
08
20
09
20
10
20
11
20
12
20
13
ROS
CR4
[Saftiana et. al., Vol.6 (Iss.3): March, 2018] ISSN- 2350-0530(O), ISSN- 2394-3629(P)
(Received: Mar 02, 2018 - Accepted: Mar 29, 2018) DOI: 10.5281/zenodo.1216779
Http://www.granthaalayah.com ©International Journal of Research - GRANTHAALAYAH [268]
Performance Paradigm (SCP), Preceeding International Seminar on Industrial Engineering and
Management, 2008
[3] Peter, Asch. 1979, The Role of Advertising in Changing Concnetration, Shourther Economic
Journal (pre 1981); Juli 1979.
[4] Stricklend, Allyn.D dan Weiss, Leonard W. 1976. Advertising, Concentration, and Price-Cost-
Margin, The Journal of Political Economy, Vol 84, No 5, (Okt, 1976) pp 1109-1122.
*Corresponding author.
E-mail address: ysaftiana@ yahoo.com