Embed Size (px)
Citation preview

IOSR Journal of Business and Management (IOSR-JBM)
e-ISSN: 2278-487X, p-ISSN: 2319-7668. Volume 20, Issue 7. Ver. VI (July. 2018), PP 64-75
www.iosrjournals.org
DOI: 10.9790/487X-2007066475 www.iosrjournals.org 64 | Page
Profitability Evaluation Of Capital Investment With Net Present
Value (Npv) And Internal Rate Of Return (Irr) Method In Pt
GGG Karawang, West Java
Arief Priyono1 ,Budi Santosa
2
1,2Department of Industry Management,Sepuluh Nopember Institute of Technology, Surabaya, Indonesia
Corresponding Author: Arief Priyono1
Abstract-In 2018, PT GGG plans to develop a new factory in Karawang area, West Java. Management will
require the new plant will also be supported with a factory of packaging. Currently PT GGG is faced with three
options in fulfilling the development plan of the packaging factory is whether to move an existing machine from
the factory in Surabaya or still buy new machines from Switzerland or France in accordance with the needs of
the company. The most feasible investment option chosen by PT GGG to increase its packaging production
capacity by 30% at a new plant in Karawang West Java is the second alternative of purchasing a new machine
from Switzerland. The alternative is chosen because it can produce the greatest NPV value when compared with
other alternative that is Rp 1.341.290.049.333. Profitability of this investment proposal is also very high that is
equal to 245.25% so that allows the company although it should come out big investment in front but will have
the return of capital in the first year. After the sensitivity analysis is done for pessimistic and optimistic
condition, alternative proposal 2 can also be said still feasible to be implemented because it has positive NPV.
This means that this investment proposal has a very small risk of loss if it will be run because of high
profitability and not easily affected by changes in economic conditions.
Keywords: NPV, IRR, Capital Investment, Investment in Java, Packaging Plant.
----------------------------------------------------------------------------------------------------------------------------- ----------
Date of Submission: 13-07-2018 Date of acceptance: 27-07-2018
----------------------------------------------------------------------------------------------------------------------------- ----------
I. Introduction PT GGG is an Indonesian national tobacco company that produces several famous brands such as
Gudang Garam International. Gudan Garam Surya, Gudang Garam Merah, Surya Pro, and others. In 2012 PT
GGG has made a new investment to add cigarette packaging production machine in Surabaya factory. The
investment is planned to increase production capacity by 40% from the previous year. To achieve these
objectives PT GGG has purchased new machines from Switzerland as much as 9 units, following by recruiting
several new experts associated with the operation of the machine that is 5 managers and 10 employees level
supervisors.In 2018, it was found that the utilization rate of 9 units of machines purchased in 2012 was only
56%, while the target of production capacity increase which was originally set at 40% has been achieved. It can
be concluded that in 2012 the company bought too many new machines so there are some machines that idle
capacity today. Along with that in 2018 this PT GGG also decided to create a new factory in Karawang, West
Java. The financial directorate of PT GGG wants that the new plant will also be supported by a packaging
division located adjacent to the goal to accelerate the production flow. Management wants that the production
capacity of the new plant will be 30% of that in Surabaya today.
PT GGG is currently faced with three options to meet the company's goal is to move the old machine
already installed in Surabaya considering the utility is still low or buy a new machine output in 2018 which is
separate from existing machines in Surabaya. The purchase option of the new machine will also consist of two
choices whether to buy a machine from Switzerland or France. Each of these investment options has its own
cost calculation borne by the company. The task of management is to determine the best investment option that
can bring maximum profit for the company in the future.

Profitability evaluation of capital investment with present value (NPV) and internal rate
DOI: 10.9790/487X-2007066475 www.iosrjournals.org 65 | Page
Table 1.Table for machine output at Surabaya Plant year 2017
From the above calculation if the average machine output per year of ± 680,000,000 pcs then theproduction
target of 1,856,412,520 estimates can be achieved simply by using 3 machines only.
Figure 1.Diagram for 3 Investment alternatives
The author is interested to conduct research related to the case study experienced by PT GGG at this
time. The author will provide an evaluation based on the NPV and IRR assessment methods of the choices
considered most feasible by the company.
II. Theory and Methods 2.1 Net Present Value (NPV)
Net Present Value (NPV) is a method to evaluate the feasibility of a project most frequently used in
some companies. This method calculates the present value of money from the expected net cash in future
compared to the amount of investment to be made (Anthes, 2003). The difference between the value inculcated
in the initial investment compared to the present value of the cash inflows is estimated to be obtained from the
investment is what is called the net present value.

Profitability evaluation of capital investment with present value (NPV) and internal rate
DOI: 10.9790/487X-2007066475 www.iosrjournals.org 66 | Page
Equation 1.Formula forNPV
Remark:
Cash Flow : annual net cash flows generated by the project
Initial Cash : present value of the initial investment cost
i : discount rate
t : time period
2.2 Internal Rate of Return (IRR)
The Internal Rate of Return (IRR) is a method that calculates the interest rate (discount rate) which
makes the present value of all estimated cash inflows equal to the present value of the expected cash outflow
(Hazen, 2009, pg. 1030-1034). IRR is the interest rate that makes the calculated NPV value to be equal to zero.
Equation 2.Formula for IRR
Remark:
NPV : NPV value
Cn : annual net cash flows generated by the project
1o : present value of the initial investment cost
r : internal rate of return
2.3 Sensitivity Analysis
Sensitivity analysis is a risk analysis technique where NPV projects are calculated based on
assumptions if the worst and best conditions are to occur. This analysis is conducted to anticipate the state of the
company in the future due to instability of input variables associated with the calculation of feasibility analysis
of an investment. Sensitivity analysis uses three scenarios where the condition is pessimistic, normal, and
optimistic. Pessimistic condition where sales quantity decrease 5% every year, normal condition where
conservative sales quantity is assumed every year there is no increase, and optimistic condition where sales
quantity increase 5% every year.
III. Result And Discussion 3.1 Required Data
To be able to do this research smoothly then researchers need some data as follows for the purposes of analysis:
3.1.1 Details of new machine purchase costs, along with installation costs and technicians.
3.1.2 Estimated maximum production capacity that can be produced by each machine both old and new.
3.1.3 The amount of labor required and the size of the salary range to run a machine both old and new.
3.1.4 Electricity needs of every machine both old and new.
3.1.5 Estimated cost of capital required by the firm, assumed same for all investment alternatives.
3.1.6 Machine maintenance costs every year both old and new.
3.1.7 The cost of removal per machine from Surabaya to Karawang if alternative 1 is executed.
3.1.8 Estimated economic value (age of depreciation) of each machine both old and new.
3.2 Costing Assumptions
As the basis for calculating the projection of cash flows over the next eight years, from 2019 to 2026,
the following assumptions will be calculated:
3.2.1 Inflation rate
Inflation is used as the basis for calculating the increase in expenses annually. During the investment
appraisal period it is assumed that the inflation rate will always remain unchanged. Determination of the
inflation rate used in this study refers to the average rate of inflation during the last 5 years of 2013-2017 period
as contained in the following table:

Profitability evaluation of capital investment with present value (NPV) and internal rate
DOI: 10.9790/487X-2007066475 www.iosrjournals.org 67 | Page
Table 2.Inflation rate
3.2.2 Rate of Interest
The interest rate is used as the basis of discounted rate in the calculation of NPV and IRR. Both
methods take into account the concept of time value of money so that the projected cash flow to be received in
the future should be calculated with the value of money now using a discounted rate as a divisor. The
investment that will be conducted by PT GGG uses its own internal financing capital not through credit in the
bank so that the comparison data used is the deposit interest rate with the assumption that if the investment fund
is not used for business containing business risk then deposited in the bank can obtain minimum profit the
equivalent of safe deposit interest. The deposit rate data used in this study refers to the maximum interest rate
guaranteed by the Deposit Insurance Agency (LPS) on average during the last 5 years of 2013-2017 period as
contained in the following table;
Table 3.Interest rate
3.2.3 Sales Projection
It is assumed that the machine procurement plan at Karawang branch can be run at this time then with
the lead time of installation of the machine about 4 months then the initial estimate of year 2019 all machine can
already produce normally. In determining the projected quantity of product sales based on the production output
target 30% of the current production capacity in Surabaya is 1,856,412,520 pcs. There are 3 scenarios that will
be executed in the current calculation that is at a pessimistic condition where the sales quantity decreased 5%
every year, during normal conditions where the quantity of sales is assumed to be conservative every year there
is no increase, and when conditions are optimistic conditions where the quantity sales have increased 5%
annually. Below is the table of calculation result of sales quantity projection during project period with 3
condition scenarios:
Table 4.3 Scenarios of sales (pcs)

Profitability evaluation of capital investment with present value (NPV) and internal rate
DOI: 10.9790/487X-2007066475 www.iosrjournals.org 68 | Page
Determination of the selling price per unit of production is set by the management of Rp 300 per pcs
and will increase every year by 10% adjusted according to the inflation rate and the estimated increase in
production costs.
Table 5.Estimated price per pcs by period
The projected sales turnover is used as the basis for calculating income in profit or loss before being
reduced by operating expenses.
Table 6.Estimated of sales by period
3.2.4 Cost of Goods Sold (COGS)
Cost of goods sold represents expenses incurred by the company for the purchase of raw materials and
production support. The amount of COGS depends on the quantity of goods produced because of its variable
cost. This means that the greater the quantity of goods produced will be the greater the burden of COGS. In
determining the COGS, the company's management controls very tight costs where there is a policy that the
COGS per unit of output should not exceed 60% of the selling price, this is to maintain the company's
profitability ratio where other operating expenses are estimated at 20% of the selling price so the company is
still can reap net income in the range of 20% of the sale price before taxes and depreciation of fixed assets.
3.2.5 Machine Requirement and Production Capacity
To meet the production target of 30% of Surabaya's current capacity of 1,856,412,520 units, the
following calculations are required:
3.2.5.1 Alternative 1
Due to the old machine that has been used for 6 years then the production capacity is equal to the
current in Surabaya which is 216.000 /hour.
3.2.5.1 Alternative 2
Due to the new machine purchased from Switzerland the production capacity can be 10% larger than
the machine in Surabaya so the output will be 237,600 / hour.
3.2.5.1 Alternative 3
Due to a new machine purchased from France but at a cheaper cost than a Swiss machine the
production capacity of 0.833 times from the Swiss machine is 197.921 / hour.
Profitability evaluation of capital investment with present value (NPV) and internal rate
DOI: 10.9790/487X-2007066475 www.iosrjournals.org 69 | Page
Additional for alternative 1 where the plan will be there will be 3 machines that moved from Surabaya
to Karawang then the company will be charged removal fee of Rp 6 billion / machine. The removal costs are
quite large as they include the dismantling of installed construction machinery, cabling, container hauling costs,
redevelopment in new places, and the cost of bringing in foreign technicians as experts for reconfiguring
machine systems. For alternative 2 if you want to buy a new machine from Switzerland then the cost of each
machine is Rp 50 Billion, while alternative 3 if you want to buy a new machine from France then the price of
each machine is Rp 30 Billion. Alternatives 2 and 3 have no longer charged the transfer fee because the machine
to be installed is a new machine.
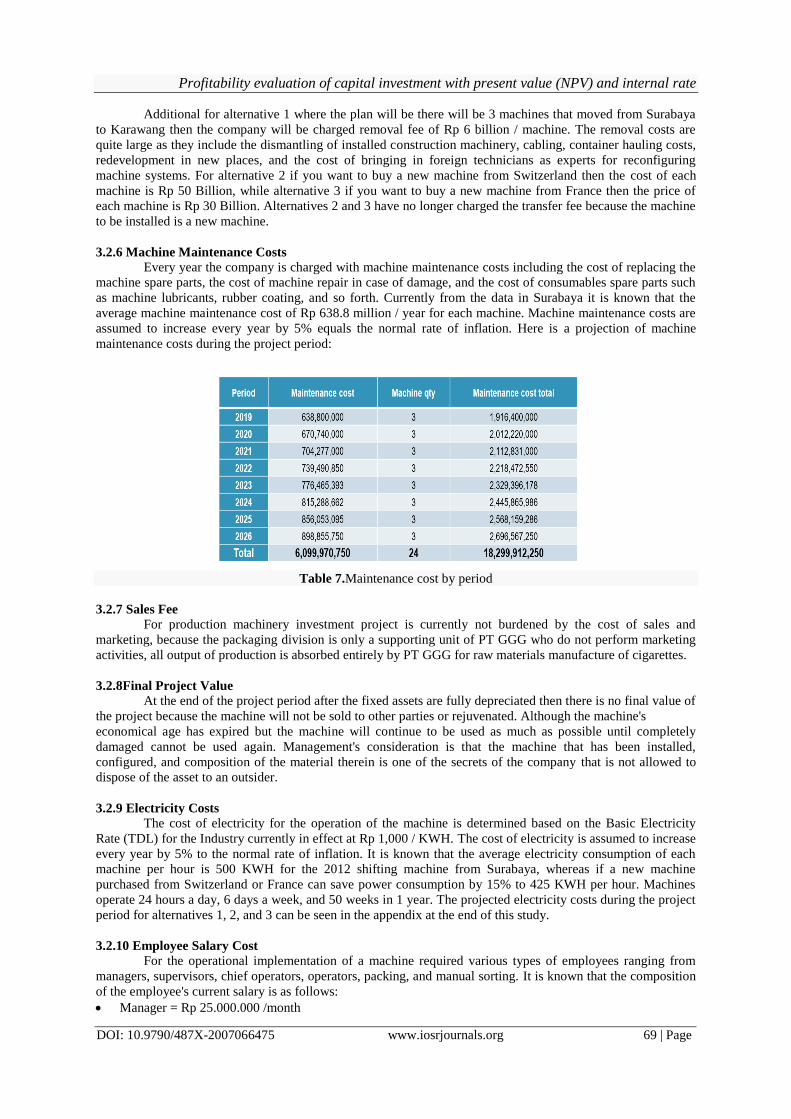
3.2.6 Machine Maintenance Costs
Every year the company is charged with machine maintenance costs including the cost of replacing the
machine spare parts, the cost of machine repair in case of damage, and the cost of consumables spare parts such
as machine lubricants, rubber coating, and so forth. Currently from the data in Surabaya it is known that the
average machine maintenance cost of Rp 638.8 million / year for each machine. Machine maintenance costs are
assumed to increase every year by 5% equals the normal rate of inflation. Here is a projection of machine
maintenance costs during the project period:
Table 7.Maintenance cost by period
3.2.7 Sales Fee
For production machinery investment project is currently not burdened by the cost of sales and
marketing, because the packaging division is only a supporting unit of PT GGG who do not perform marketing
activities, all output of production is absorbed entirely by PT GGG for raw materials manufacture of cigarettes.
3.2.8Final Project Value
At the end of the project period after the fixed assets are fully depreciated then there is no final value of
the project because the machine will not be sold to other parties or rejuvenated. Although the machine's
economical age has expired but the machine will continue to be used as much as possible until completely
damaged cannot be used again. Management's consideration is that the machine that has been installed,
configured, and composition of the material therein is one of the secrets of the company that is not allowed to
dispose of the asset to an outsider.
3.2.9 Electricity Costs
The cost of electricity for the operation of the machine is determined based on the Basic Electricity
Rate (TDL) for the Industry currently in effect at Rp 1,000 / KWH. The cost of electricity is assumed to increase
every year by 5% to the normal rate of inflation. It is known that the average electricity consumption of each
machine per hour is 500 KWH for the 2012 shifting machine from Surabaya, whereas if a new machine
purchased from Switzerland or France can save power consumption by 15% to 425 KWH per hour. Machines
operate 24 hours a day, 6 days a week, and 50 weeks in 1 year. The projected electricity costs during the project
period for alternatives 1, 2, and 3 can be seen in the appendix at the end of this study.
3.2.10 Employee Salary Cost
For the operational implementation of a machine required various types of employees ranging from
managers, supervisors, chief operators, operators, packing, and manual sorting. It is known that the composition
of the employee's current salary is as follows:
Manager = Rp 25.000.000 /month

Profitability evaluation of capital investment with present value (NPV) and internal rate
DOI: 10.9790/487X-2007066475 www.iosrjournals.org 70 | Page
Supervisor = Rp 12.000.000 / month
Head Operator = Rp 8.000.000 / month
Operator = Rp 5.000.000 / month
Packing & Sort = Rp 4,000,000 / month
Employee salary costs are assumed to increase every year by 10% to the national average of MSE
increase annually. The Company provides benefits to employees in the form of an additional 1x basic salary
during the holiday (THR) and 2x basic salary at the end of the year (bonus), so the calculation of salary per
employee in a year multiplied by 15.
Each alternative selected machine has different employee requirements especially for the number of
operators and packing sorting personnel. The machine operates nonstop 24 hours a day so the working hours are
divided into 4 shifts. Known employee needs for each machine type as follows:
3.2.10.1Alternative 1
Using a machine in 2012, it takes 1 manager to handle the overall operation of the machine, it takes 1
supervisor to handle 3 machines each shift so that a total of 4 supervisors, it takes 1 head operator for each
machine each shift so that a total of 12 operator heads, it takes 4 the operator for each machine each shift so that
a total of 48 operators, and required each of each machine 6 people packing power and 2 people sorting power
for each machine and each shift so that a total of 96 packing and sorting power.
3.2.10.2 Alternative 2
Buying a new machine from Switzerland, it takes 1 manager to handle the entire machine operation, it
takes 1 supervisor to handle 3 machines per shift so that a total of 4 supervisors takes 1 head operator for each
machine each shift so a total of 12 operator heads is required 3 operators for each machine each shift so that a
total of 36 operators is more labor-efficient than using the machine in 2012, and it takes each each machine 6
person power packing alone without power sorting for each machine and each shift so that a total of 72
personnel packing and sorting , no manual manually needed anymore because it has done automation sorting
through the machine.
3.2.10.3 Alternative 3
Purchased a new machine from France, it takes 1 manager to handle the whole machine operation, it
takes 1 supervisor to handle 3 machines per shift so that a total of 4 supervisors takes 1 head operator for each
machine each shift so that a total of 12 operator heads is required 3 operators for each machine each shift so that
a total of 36 operators is more labor-efficient than using the machine in 2012, and it takes each machine every 8
people packing power alone without power sorting for each machine and each shift so that a total of 96 packing
and sorting power , no manual manually needed anymore because it has done automation sorting through the
machine.
3.3 Investment Feasibility Assessment
Assessment of investment feasibility using NPV and IRR criteria. Assessment is done on all possible
alternatives for the procurement of production machinery in Karawang branch. Investment can be said to be
eligible to meet the criteria if the value of NPV> 0 or positive and IRR value> 6% greater when compared with
the current deposit rate. Here are the investment feasibility assessments for each alternative:
3.3.1 Alternative 1 (Moving machine from Surabaya)
Alternative 1 here is just a transfer of machines from Surabaya factory to Karawang. This transfer is
intended to utilize idle capacity from the excess number of machines in Surabaya. Because the nature is still in
the same division of packaging, this alternative is only the transfer of machinery between the parts there is no
cashflow activity in and out which affects the cash flow of the project apart from the cost of moving the
machine. From the calculation of the projected income statement and cash flow projection in the attachment
section, we can calculate the NPV and IRR values as follows:
Profitability evaluation of capital investment with present value (NPV) and internal rate
DOI: 10.9790/487X-2007066475 www.iosrjournals.org 71 | Page
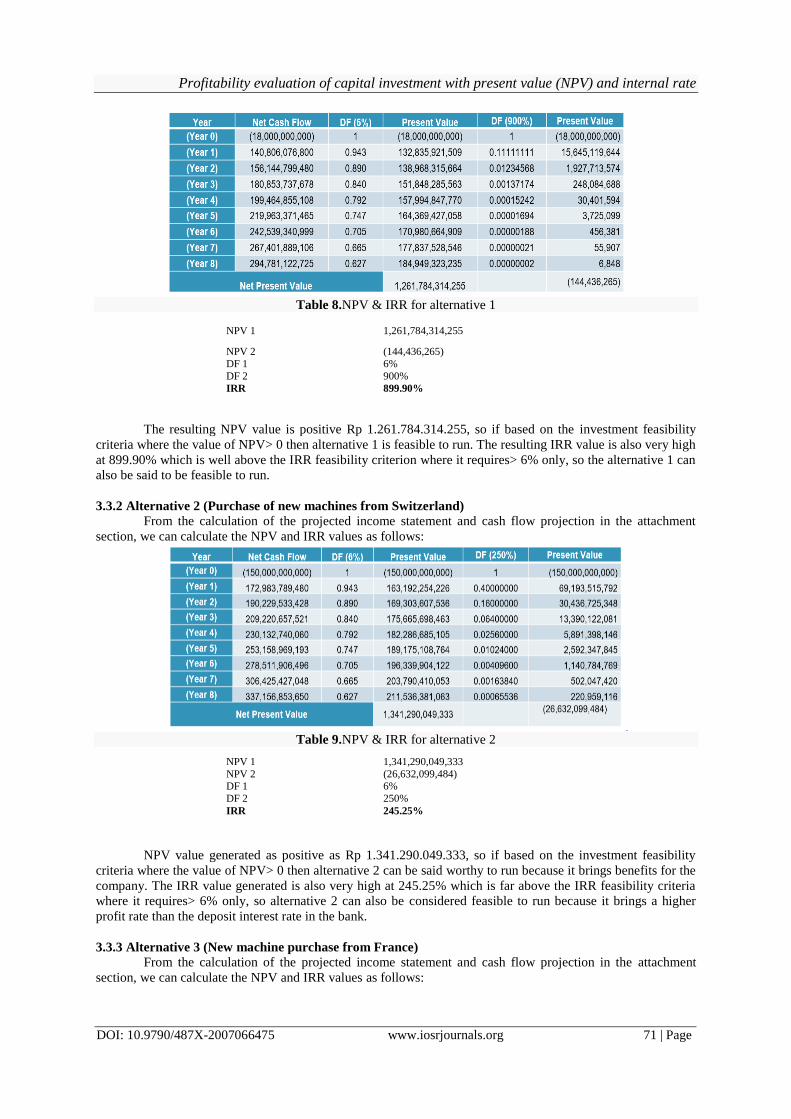
Table 8.NPV & IRR for alternative 1
NPV 1 1,261,784,314,255
NPV 2 (144,436,265)
DF 1 6%
DF 2 900%
IRR 899.90%
The resulting NPV value is positive Rp 1.261.784.314.255, so if based on the investment feasibility
criteria where the value of NPV> 0 then alternative 1 is feasible to run. The resulting IRR value is also very high
at 899.90% which is well above the IRR feasibility criterion where it requires> 6% only, so the alternative 1 can
also be said to be feasible to run.
3.3.2 Alternative 2 (Purchase of new machines from Switzerland)
From the calculation of the projected income statement and cash flow projection in the attachment
section, we can calculate the NPV and IRR values as follows:
Table 9.NPV & IRR for alternative 2
NPV 1 1,341,290,049,333
NPV 2 (26,632,099,484) DF 1 6%
DF 2 250%
IRR 245.25%
NPV value generated as positive as Rp 1.341.290.049.333, so if based on the investment feasibility
criteria where the value of NPV> 0 then alternative 2 can be said worthy to run because it brings benefits for the
company. The IRR value generated is also very high at 245.25% which is far above the IRR feasibility criteria
where it requires> 6% only, so alternative 2 can also be considered feasible to run because it brings a higher
profit rate than the deposit interest rate in the bank.
3.3.3 Alternative 3 (New machine purchase from France)
From the calculation of the projected income statement and cash flow projection in the attachment
section, we can calculate the NPV and IRR values as follows:

Profitability evaluation of capital investment with present value (NPV) and internal rate
DOI: 10.9790/487X-2007066475 www.iosrjournals.org 72 | Page
Table 10.NPV & IRR for alternative 3
NPV 1 1,116,156,222,658
NPV 2 (16,621,736,299) DF 1 6%
DF 2 300%
IRR 295,69%
NPV value generated as positive as Rp 1.116.156.222.658, so if based on the investment feasibility
criteria where the value of NPV> 0 then alternative 3 can be said worthy to run because it brings benefits for the
company. The resulting IRR value is also very high at 295.69% which is far above the IRR feasibility criteria
which requires> 6% only, so alternative 3 can also be said to be feasible to run because it brings a higher profit
rate than deposit interest in the bank.
3.4 Selection of Investment
From the investment feasibility assessment for several alternatives that have been done before it can be
taken a summary of the results as follows
Table 11.NPV & IRR for 3 alternatives
Based on the above table if each alternative has a positive IRR value then the selection of investments
made is taken from the alternative that has the highest NPV value, with the consideration that the alternative
with the highest NPV most can provide maximum benefits for the company. In this case means alternative 2 is a
purchase of a new machine from Switzerland that is most feasible by the company. If the three alternative
options are independent projects which allow it to be run simultaneously as long as it is still in the investment
grade category then the priority sequence implemented is alternative 2, alternative 1, and alternative 3.
If from the calculation of the financial aspect chosen alternative 2 then from the operational aspect can
also be obtained a strong reason for the selection of alternative 2. Through the purchase of new machines from
Switzerland then the company gets the advantage of larger machine capacity, more power efficient, and more
efficient labor. Though the company spent a considerable initial investment expense but the excess that can be
earned over the long term will bring huge profits to the company. Although the alternative 1 is cheaper cost at
the beginning but the machine still uses the old technology where manual power is still manual, this will
potentially cause high industrial problems because if still using human power then sorting results will not be
able to match consistency when compared to automated sorting machine alternative 2, so that from technical
reason of machine and financial calculation above then PT GGG is suggested to choose alternative 2 in
fulfillment of production capacity requirement of factory in Karawang.

Profitability evaluation of capital investment with present value (NPV) and internal rate
DOI: 10.9790/487X-2007066475 www.iosrjournals.org 73 | Page
3.5 Sensitivity Analysis
Sensitivity analysis is a risk analysis technique where NPV projects are calculated based on
assumptions if the worst and best conditions are to occur. This analysis is conducted to anticipate the state of the
company in the future due to instability of input variables associated with the calculation of feasibility analysis
of an investment. Sensitivity analysis uses three scenarios where the condition is pessimistic, normal, and
optimistic. Pessimistic condition where sales quantity decrease 5% every year, the normal condition where the
quantity of sales is assumed conservatively every year there is no increase, and optimistic condition where the
sales quantity increase 5% every year. Calculation of sensitivity analysis using alternative 2 in accordance with
the selected and will be implemented by the company.
3.5.1 Pessimistic Condition (Sales decrease 5% every year)
From recalculation to projected income statement and cash flow projection in the attachment section
we can calculate the value of NPV and IRR for pessimistic conditions as follows:
Table 12.Pessimistic Condition
NPV 1 1,076,807,495,803 NPV 2 (31,527,684,292)
DF 1 6%
DF 2 250%
IRR 243.06%
Although the condition of sales is assumed to decrease by 5% annually the value of NPV generated is
still positive at Rp 1,076,807,495,803, so if based on the investment feasibility criteria where the value of NPV>
0 then in the pessimistic condition this investment proposal can be said is still feasible to run for profit for the
company. The resulting IRR value is also very high at 243.06% which is far above the IRR feasibility criterion
where it requires> 6% only, so in pessimistic conditions this investment alternative also still can be said to be
feasible to run because it bring a higher profit rate than the deposit interest deposits in the bank.
3.5.2 Optimistic Condition (Sales increase 5% every year)
From recalculation to projected income statement and cash flow projection in the attachment section,
we can calculate the NPV and IRR values for optimistic conditions as follows:

Profitability evaluation of capital investment with present value (NPV) and internal rate
DOI: 10.9790/487X-2007066475 www.iosrjournals.org 74 | Page
NPV 1
Table 13.Optimist Condition
1,666,066,176,039
NPV 2 (21,363,174,688)
DF 1 6% DF 2 250%
IRR 246,91%
Sales condition is assumed to increase 5% every year and the value of NPV generated is still positive
Rp 1.666.066.176.039, so if based on the investment feasibility criteria where the value of NPV> 0 then in
optimistic condition this investment proposal can be said still feasible to run because profit for the company.
The value of IRR generated is also very high that is 246,91% which is far above the criteria of IRR feasibility
where it requires> 6% only, so in optimistic condition this investment alternatives also still can be said is
feasible to run because bring profit rate greater than deposit interest deposits in the bank.
IV. Conclusion After the calculation of investment feasibility criteria on several alternative options available then it can
be concluded the results of this study as follows:
The most feasible investment option chosen by PT GGG to increase the packaging production capacity by
30% at the new plant in Karawang West Java is the second alternative is the purchase of a new machine
from Switzerland. The alternative is chosen because it can produce the greatest NPV value when compared
to other alternatives. Although at the beginning the company had to pay a large enough cost for machine
investment of Rp 150 billion, but the company benefited from a larger machine production capacity of 10%
than the old machine, saving the amount of labor costs due to fewer operator needs, and more efficient
power consumption 15%. Profitability of this investment proposal is also very high that is equal to 245.25%
so that allows the company although it should come out big investment in front but already will return
capital in the first year.
After the sensitivity analysis is done for pessimistic and optimistic condition, alternative proposal 2 can also
be said still feasible to be implemented because it has positive NPV. This means that this investment
proposal has a very small risk of loss if it will be run because of high profitability and not easily affected by
changes in economic conditions
References [1]. Anthes, Gary M., 2003, Net Present Value, Journal of Financial Management.
[2]. Catherine A Maritan, Capital investment as investing in organizational capabilities, Academy of Management Journal; Jun 2001; 44, 3; ABI/INFORM Global.
[3]. Chan S. Park and Hemantha S.B. Herath, Exploiting Uncertainty – Investment Opprotunities as Real Options : A New Way of Thingking in Engineering Economics The Engineering Economics, Vol. 45, No. 1, 2000.
[4]. Edward J Farragher; Robert T Kleiman; Anandi P Sahu, Current Capital Investment Practices The Engineering Economics, Vol. 44,
No. 2. [5]. Hazen, Gordon., 2009, An Extension of the Internal Rate of Return to Stochastic Cash Flows. Journal of Management Science. Vol.
55.
[6]. Jones, Charles P., 2004, Investment Analysis and Management 9th edition. New York : John Wiley & Sons.

Profitability evaluation of capital investment with present value (NPV) and internal rate
DOI: 10.9790/487X-2007066475 www.iosrjournals.org 75 | Page
[7]. Johnathan Mun, Real Option Analysis : Tools and Techniques for Valuing Strategic Investments and Decisions John Wiley & Sons,
Inc, New York, 2002
[8]. Juhasz, Lajos., 2011, Net Present Value Versus Internal Rate of Return, Economics & Sociology, Vol. 4, No. 1. [9]. Keown, Arthur J. et al., 2005, Financial Management : Principles and Applications 10th edition. New Jersey : Pearson Prentice
Hall.
[10]. Libby, R., Libby, P.A., dan Short, D.G., 2004, Financial Accounting, 4th Edition, McGraw-Hill. [11]. Selvam, P., dan Punitavati, N., 2012, A Fundamental Study on Long-Term Investment Decision, International Journal of
Management Research and Review, Vol. 2, Issue. 1.
IOSR Journal of Business and Management (IOSR-JBM) is UGC approved Journal with Sl. No. 4481,
Journal no. 46879.
Arief Priyono1 , “Profitability Evaluation Of Capital Investment With Net Present Value (Npv) And
Internal Rate Of Return (Irr) Method In Pt Ggg ." IOSR Journal of Business and Management (IOSR-
JBM) 20.7 (2018): 68-75.


![Vol20-4 ความชุกของโรคโลหิตจาง [นิพนธ์ต้นฉบับ]](https://img.pdfslide.net/doc/110x75/55720cba497959fc0b8c4a30/vol20-4-.jpg)