Embed Size (px)
Citation preview
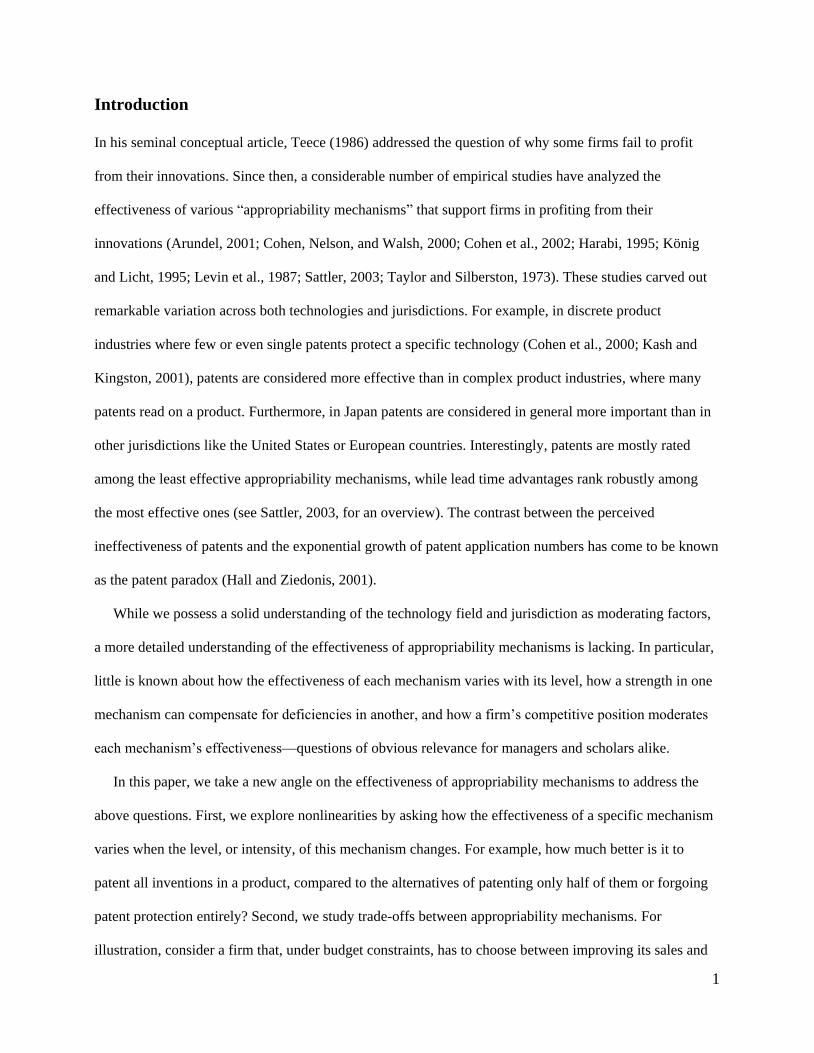
A Closer Look at Profiting From Innovation—
Appropriability Mechanisms’ Nonlinearities, Trade-Offs,
and Goal Contingencies
August, 2011
Timo Fischer1, Joachim Henkel
1,2
1Schöller Chair in Technology and Innovation Management, Technische Universität München
Arcisstr. 21, D-80333 Munich, Germany. +49-89-289-25760; fischer | henkel @wi.tum.de
2Center for Economic Policy Research (CEPR), London
Abstract
How firms manage to profit from innovation is a central question in the literature on innovation
management. Extant empirical studies have analyzed the effectiveness of mechanisms that support firms
in profiting from innovation on the macro-level, focusing on how it varies with industry and geography.
However, there has been little analysis of these appropriability mechanisms on a more detailed level. We
address this gap in three ways: (1) by exploring nonlinearities in a mechanism’s effectiveness as a
function of its level; (2) by studying trade-offs between appropriability mechanisms, and (3) by studying
their effectiveness contingent on the firm’s competitive position. To this end we conducted a choice-based
conjoint analysis with 319 participants managing various appropriability mechanisms. Our findings help
to solve puzzles resulting from macro-level studies and have implications for firms trying to maximize
value appropriation from innovation.
Keywords: profiting from innovation; patents; nonlinearities; choice-based conjoint analysis
1
Introduction
In his seminal conceptual article, Teece (1986) addressed the question of why some firms fail to profit
from their innovations. Since then, a considerable number of empirical studies have analyzed the
effectiveness of various “appropriability mechanisms” that support firms in profiting from their
innovations (Arundel, 2001; Cohen, Nelson, and Walsh, 2000; Cohen et al., 2002; Harabi, 1995; König
and Licht, 1995; Levin et al., 1987; Sattler, 2003; Taylor and Silberston, 1973). These studies carved out
remarkable variation across both technologies and jurisdictions. For example, in discrete product
industries where few or even single patents protect a specific technology (Cohen et al., 2000; Kash and
Kingston, 2001), patents are considered more effective than in complex product industries, where many
patents read on a product. Furthermore, in Japan patents are considered in general more important than in
other jurisdictions like the United States or European countries. Interestingly, patents are mostly rated
among the least effective appropriability mechanisms, while lead time advantages rank robustly among
the most effective ones (see Sattler, 2003, for an overview). The contrast between the perceived
ineffectiveness of patents and the exponential growth of patent application numbers has come to be known
as the patent paradox (Hall and Ziedonis, 2001).
While we possess a solid understanding of the technology field and jurisdiction as moderating factors,
a more detailed understanding of the effectiveness of appropriability mechanisms is lacking. In particular,
little is known about how the effectiveness of each mechanism varies with its level, how a strength in one
mechanism can compensate for deficiencies in another, and how a firm’s competitive position moderates
each mechanism’s effectiveness—questions of obvious relevance for managers and scholars alike.
In this paper, we take a new angle on the effectiveness of appropriability mechanisms to address the
above questions. First, we explore nonlinearities by asking how the effectiveness of a specific mechanism
varies when the level, or intensity, of this mechanism changes. For example, how much better is it to
patent all inventions in a product, compared to the alternatives of patenting only half of them or forgoing
patent protection entirely? Second, we study trade-offs between appropriability mechanisms. For
illustration, consider a firm that, under budget constraints, has to choose between improving its sales and

2
service efforts and taking out more patents. Third, we analyze the effectiveness of each mechanism
contingent on the competitive outcome a firm can expect to reach. For example, the effectiveness of
appropriability mechanisms could be different if a firm struggles to survive compared to a situation where
it outperforms its competitors.
To answer these questions, we conduct discrete choice experiments with 319 employees of a leading
firm in the communications equipment industry. Participants manage all relevant mechanisms that support
the firm in appropriating profits from innovation, covering research and development (R&D), intellectual
property (IP), and marketing functions. In each of 10 choice sets, participants saw three different
hypothetical companies with strengths and weaknesses in five selected appropriability mechanisms, but
with technically identical products. From each choice set, participants had to choose the company they
expected to profit most from its innovation (the focal product) and the company they expected to profit
least. The resulting choice data provide rich information on participants’ perceptions of the various
appropriability mechanisms.
Some of our main results are as follows. Lead time advantages increase dramatically from being
among the last followers to being among early followers, but increase only by a meager additional 21
percent to being first to market. In stark contrast, product-related patent protection is considered almost
irrelevant if only half of all product-related inventions are patented, and only matters when nearly all
product-related inventions are patented. An interesting example of a trade-off between appropriability
mechanisms is that it is worth settling for being an early follower rather than the first mover, if doing so
allows improving the quality of sales and service from “good” to “excellent.” As to goal contingencies,
the difference in effectiveness between the top and the middle level of several mechanisms is considerably
bigger when the goal is to be best than when it is to avoid being last.
The paper is organized as follows. In the next section, we review the literature on the most relevant
appropriability mechanisms. We then explain our empirical approach and subsequently describe the
estimation method. We next present our findings and, finally, discuss their contribution to the literature.
3
Profiting from Innovation
Teece’s (1986) seminal paper on how to profit from innovation laid foundations for subsequent research in
innovation and strategic management. He identified the timing of market entry, the efficacy of protecting
the technology against imitation and a firm’s access to complementary assets as interdependent main
determinants of a firm’s ability to capture value from innovation. Scholars building on this framework
elaborate that a firm may not only profit from a tight appropriability regime where excluding others from
the innovation is effective but also from a weak appropriability regime where others make use of the
innovation (Pisano, 2006). A firm may even deliberately weaken the appropriability regime for some of its
innovations, thus endogenizing it to its innovation strategy (Henkel, 2006).
Building upon these determinants of profiting from innovation, the literature on innovation
management studies several mechanisms that support firms in appropriating value—so-called
appropriability mechanisms (Cohen et al., 2000; Levin et al., 1987). Appropriability mechanisms that are
most relevant for our empirical setting, the communication equipment industry, are: exclusion rights; lead
time advantages; favorable complementary asset positions; and, contributions to open standards.
Legal property rights offer an owner the possibility to exclude others from using its property by
enforcing the right in court. Patents and utility models are exclusion rights that protect technical
inventions, while other legal exclusion rights such as copyright, brands, and trademarks protect
nontechnical IP (with the exception of copyright covering software as well). While firms commonly use a
mix of these IP rights, for innovative technical firms, as those in our setting, patents are the most
prominent exclusion right and the core of companies’ IP management. The traditional function of patents
is to prevent imitation of the focal invention or, if the patented technology is not used by the patentee, to
block competitors from developing substitutes. Besides of this traditional function, patents are exploited in
various other ways, often labeled as “strategic” usages (see Blind et al., 2006, for a recent overview).
Firms use them to signal technological competence and to measure R&D output; even more important,
they often patent to amass large patent portfolios to deter legal attacks and use their patents as bargaining
chips in cross-licensing agreements (Cohen et al., 2000; Hall and Ziedonis, 2001). These different ways to
4
exploit give patents a value independent of the underlying invention and its use in products (Artz et al.,
2010). Thus, in our analysis, we make the important distinction between product-related patents—those
protecting inventions made for the product—and the firm’s overall patent portfolio used for cross-
licensing or deterrence. This distinction helps to disentangle the role that different functions of patents
play in supporting firms in their quest to profit from innovation.
Recent insights made in innovation management practice and research shake the old doctrine (Arrow,
1962; Liebeskind, 1996) that exclusion of others for a certain time is a precondition to appropriate value.
Firms may also profit by freely revealing innovations, or related information, without direct
compensation, and benefit indirectly from the fact that others adopt the innovation. Such indirect benefits
may be due to informal R&D collaboration, reputation building, standard setting, and increased demand
for complements (e.g., Allen, 1983; de Fraja, 1993; Harhoff, Henkel, and von Hippel, 2003; Henkel, 2006;
Sahay and Riley, 2003; von Hippel, 1988; von Hippel and von Krogh, 2006), or may arise because the
innovator reassures its customers that it will not exploit them monopolistically down the road
(Economides, 1996; Farrell and Gallini, 1988; Shepard, 1987). Diffusion of inventions may also create
royalty income and thus allow firms to profit from innovation with direct compensation. Relevant
instances of openness are, for example, openness with respect to software source code (Grand et al., 2004;
Henkel, 2006; von Hippel and von Krogh, 2003; West and Gallagher, 2006), technical inventions (Allen,
1983; Fauchart, 2003; Nuvolari, 2004; Rysman and Simcoe, 2008), or information in general (Dahl and
Pedersen, 2004; Schrader, 1991; von Hippel, 1988). In our empirical setting, contributions of technical
inventions to open standard setting organizations1 are most important (cf. Bekkers, Duysters, and
Verspagen, 2002; Leiponen, 2008). Open standard setting organizations such as the Internet Engineering
Task Force (IETF) provide a platform where members establish a consensus on interoperability by
standardizing technologies (e.g., Rysman and Simcoe, 2008). By contributing inventions to these open
1 The precise meaning of “open” in this context is highly contested. We understand the term “open standards” in a
sense that membership in voluntary standard setting organizations is possible for everyone interested,
specifications of the resulting standards are publicly available, and standard-relevant IP of members has to be
licensed to fair, reasonable, and nondiscriminating terms (cf. Leiponen, 2008)
5
standardization processes the contributors can reap the aforementioned benefits of practicing open
innovation. These include gaining time advantages in product implementation, increasing efficiency in
new product development by obtaining external development support, enhancing licensing income, and
signaling standard adherence to customers.
In order to successfully appropriate value from an invention, a company typically needs various
complementary assets. Complementary assets comprise sales channels, customer services, brands,
manufacturing facilities, and additional know-how (Teece, 1986). In the context of our study, brand
recognition matters less, since the market is a business-to-business market in which all relevant players
enjoy a high reputation. Access to manufacturing facilities also is not critical, since the focal products
consist of software complemented by commodity hardware. Thus, in our study, we only include the
quality of marketing, sales, and service activities.
A company enjoys lead time advantages over competitors if it is faster in bringing an innovation to the
market. Other strands of literature refer to such a lead as a first mover advantage, pioneering advantage, or
time-to-market advantage (Lieberman and Montgomery, 1988). Being first on the market enhances the
firm’s bargaining power due to lower intensity of competition. Furthermore, firms can achieve a customer
lock-in when first hitting the market by creating and afterwards profiting from customers’ switching costs
(Golder and Tellis, 1993). Firms also may achieve an innovation lock-in by setting an industry standard
that other firms have to adhere to (Carpenter and Nakamoto, 1989). Moreover, lead time advantages may
be exploited to build other competitive advantages in complementary assets (Dechenaux et al., 2008) or
learning curve advantages (Fehrshtman, Mahajan, and Muller, 1990) that again enhance value
appropriation.
To summarize, the appropriability mechanisms that we focus on are product-related patents, overall
patent portfolio size, contribution of inventions to open standards, lead time advantages, and marketing,
sales, and service quality.
6
Empirical Setting
Extant studies on profiting from innovation asked respondents directly for their assessment regarding
various appropriability mechanisms, using Likert-scale survey questions.2 This approach makes it
convenient for respondents to answer and is particularly suited for large-scale surveys due to ease of
analyzing answers. However, it has the drawback that respondents’ answers on Likert-scales can be biased
due to individual response styles (e.g. Stening and Everett, 1984). Furthermore, trade-offs between
mechanisms as well as goal contingencies are very difficult to evaluate, and nonlinearities in
appropriability mechanisms’ benefit contributions are impossible to show. To fill this gap, we conducted a
choice based conjoint analysis (Green and Srinivasan, 1990). In such a conjoint experiment, participants
repeatedly see multiple alternatives described by several attributes at different levels, and each time
choose the one they prefer most. The preference for each attribute level is revealed indirectly by
estimating the attributes’ impact on the probability that a specific alternative is preferred over others.
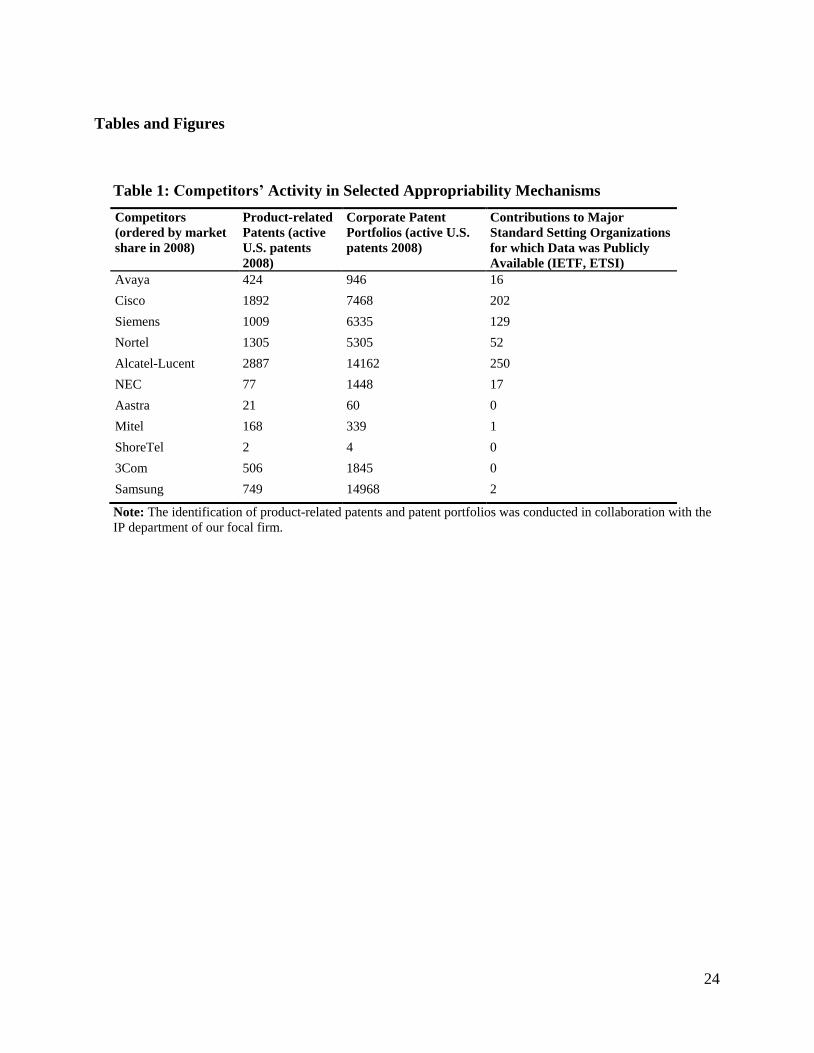
The sample for our empirical study consists of all employees managing various appropriability
mechanisms in one specific firm in the enterprise communications industry. The enterprise
communications industry is a subsegment of the communications equipment industry (see Table 2 for an
industry overview) and particularly apt for our study. In this industry, all four types of appropriability
mechanisms (patents, openness, lead time advantages, and complementary assets) play a major role.
Furthermore, the patent paradox that our study helps to explain is especially pronounced in the
communications equipment industry (Cohen et al., 2000, Table 1 and Table A1).
We identified all employees of the focal company who worked in marketing, sales, services, R&D, IP
management, and standardization. We include only permanent employees and exclude secretaries,
students, and trainees, who would not possess the necessary experience to handle our experiments. Of
2 The Yale study (Levin et al., 1987)—on which most of the subsequent studies built—asked “How effective is each
of the following means of capturing and protecting the competitive advantages of new or improved products
(production processes)?” Respondents answered on seven-point Likert-scales ranging from “not at all effective” to
“very effective” for each appropriability mechanism. The Carnegie Mellon study (Cohen et al., 2000) asked for the
share of a firm’s innovations for which each appropriability mechanism was effective, the possible answers
ranging on a five-point Likert-scale from 0% to 100%.
7
1,475 employees that met our criteria, 319 completed at least one experiment yielding a response rate of
21.6%. A nonresponse analysis reveals that we slightly oversample R&D personnel and undersample
marketing, sales, and service employees. Asked about their levels of experience in the relevant fields,
relatively large shares of survey participants described themselves as experienced with service (58%) and
with R&D (48%), while smaller shares considered themselves experienced with sales (31%), marketing
(29%), standardization (25%), and IP management (21%). Our survey participants have, on average, 19
years of industry experience: 19.4% work in upper management, 30.7% in middle management, and
49.8% in lower management positions. Most work in Germany (180), 45 in the United States, 29 in the
United Kingdom, and five in Greece. The remaining participants either work in countries with three or
less participants or did not provide information on their location.
------------------------------------------
Insert Table 1, Figure 1 about here
------------------------------------------
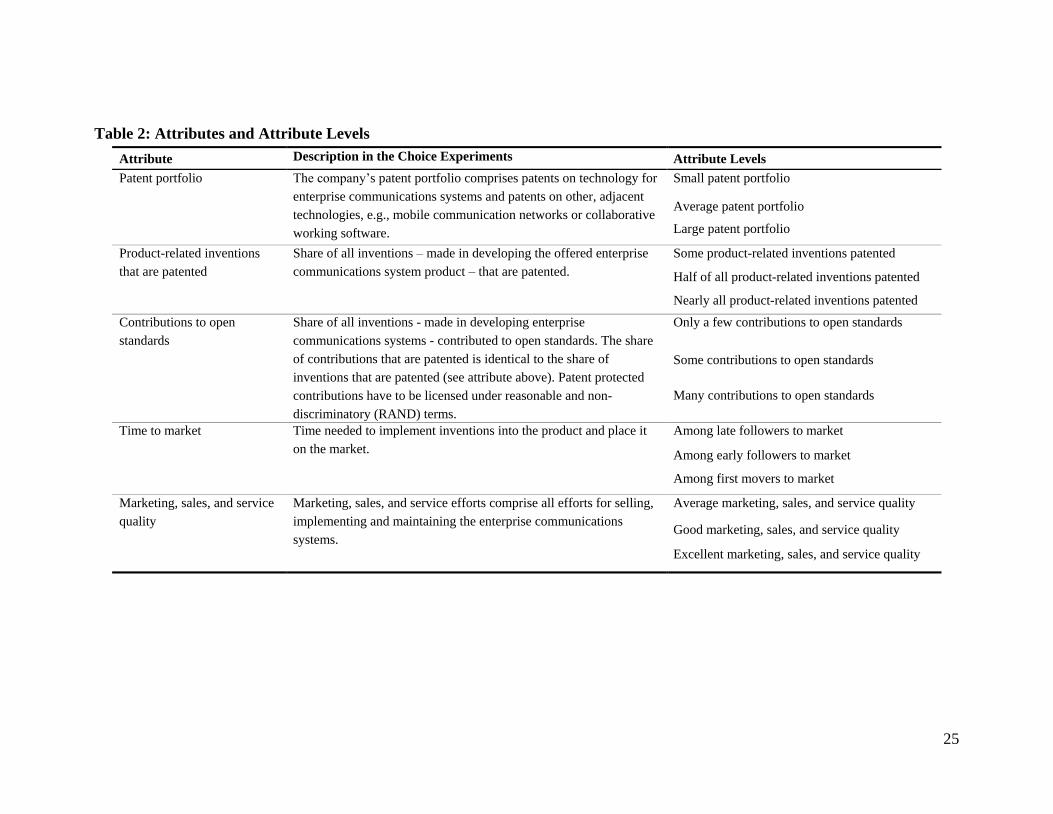
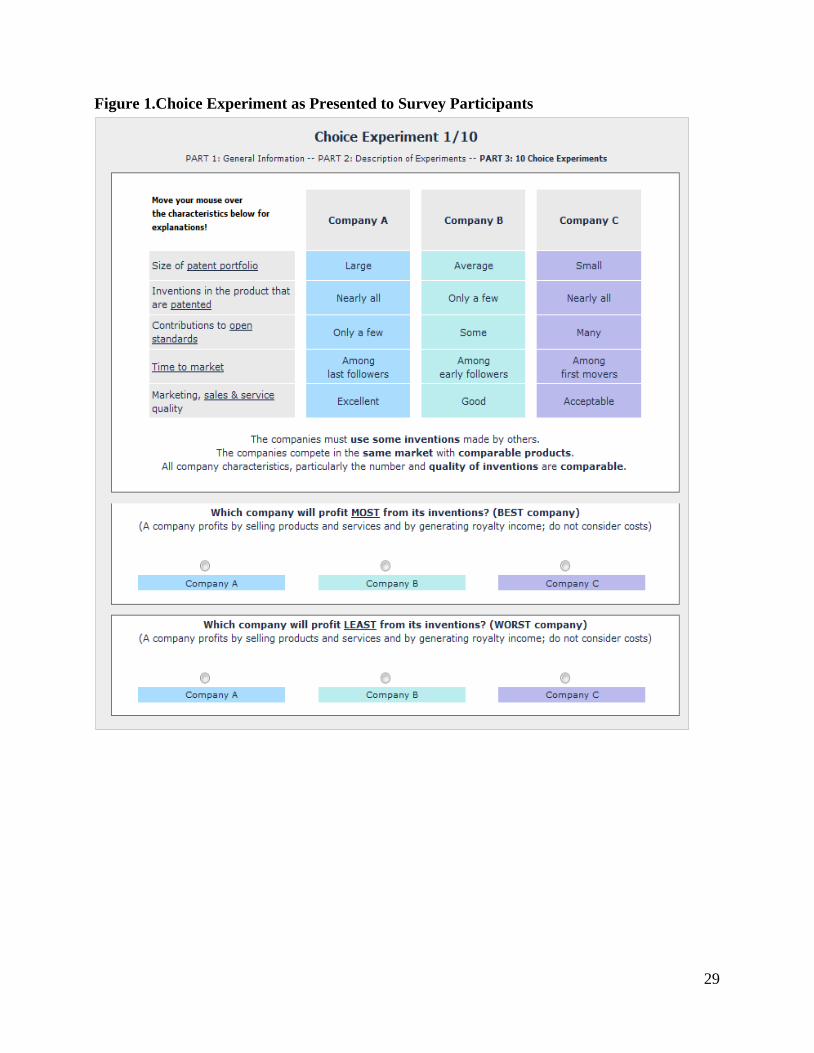
An important issue in choice experiments is making them as realistic as possible while keeping them
manageable by respondents. To make sure that we only included relevant appropriability mechanisms at
realistic levels, we conducted 20 in-depth interviews with employees in different functions, such as
marketing, sales, services, R&D, standardization, product management, and IP management. They
confirmed that the firm’s overall patent portfolio, the share of product-related inventions that are patented,
lead time advantages, the contributions to open standards, and marketing, sales, and services efforts are all
relevant and that we did not miss other more important appropriability mechanisms for this industry. We
used these five appropriability mechanisms, each at three levels, to construct our choice experiments. Each
alternative in a choice set represents one hypothetical firm with different endowments and capabilities in
each of the five appropriability mechanisms (see Figure 1). We chose to let the survey participants see 10
choice sets, each containing three hypothetical firms. In addition to our interviews, we conducted four
experiment pretests, one each with an R&D manager, an IP manager, a marketing manager, and a
8
standardization manager. These pretests confirmed that the number of choice tasks was burdensome but
manageable and that the attribute levels and experimental descriptions were realistic and understandable.
In our experiment with five mechanisms at three levels each, 35=243 possible combinations (the full-
fractional design) exist. To restrict the number of choice situations, we relied on an efficient fractional-
factorial design generated by computerized search (Yu, Goos, and Vanderbroek, 2009).3 We used five
versions of the resulting design randomly assigned to survey participants where the order of choice sets
and the order of appropriability mechanisms were randomly varied to avoid biases. We coded each
attribute into two dummy variables indicating the deviation from the reference level. To ensure convenient
interpretation of coefficient estimates we used the attribute level with the (presumably) lowest benefit as
reference for each attribute. These values are: small patent portfolio; only a few product-related inventions
patented; only a few product-related inventions contributed to open standards; among last followers to
market; and acceptable marketing, sales, and service quality. Table 1 shows all attributes and their levels
as well as their description in the choice experiments.
--------------------------------
Insert Table 2 about here
--------------------------------
Estimation Strategy
Discrete choice data was traditionally fitted using McFadden’s (1974) conditional logit model. However,
employing a conditional logit estimator on repeated discrete choice data is questionable in light of its
independence of irrelevant alternatives assumption (IIA). This property implies that the error terms of
each respondent’s choice of alternatives have to be independently and identically distributed (Layton,
2000). This assumption will typically be violated with repeated choice data due to preference
heterogeneity: a person who puts greater value than the average respondent on a specific alternative in his
or her first choice will also put greater value on a similar alternative in subsequent choices (Hausman and
3 The design was generated using the software package NGene 1.0 by ChoiceMetrics, Ltd.
9
Wise, 1978), leading to a correlation among the error terms. Mixed logit models (also called random
coefficient models) are an extension of conditional logit that do not require the undesirable IIA
assumption (Brownstone and Train, 1999; McFadden and Train, 2000; Revelt and Train, 1998). By
estimating individual coefficient vectors, they accommodate heterogeneity in preferences. The drawback
of mixed logit models is that the log-likelihood function to be maximized does not have a closed form
solution. Revelt and Train (1998) proposed a procedure for simulating the likelihood function value,
which Hole (2007) implemented in the STATA mixlogit command that we use.
Besides letting our survey participants identify the best firm in a choice setting, we also asked for the
second-best so we would be able to evaluate goal-contingencies. We, thus, obtained a complete ranking
over the three hypothetical companies. Such rank ordered choice data is fitted with a conditional logit after
exploding the data of k ranks in one choice set into k-1 independent choices (Beggs, Cardell, and
Hausman, 1981; Chapman and Staelin, 1982).
This leaves us with three models to fit our data. To test for nonlinearities and trade-offs, we exploit the
full ranking data in a rank ordered mixed logit (Model 1a) and a rank ordered logit (Model 1b) as a
robustness check. To analyze goal contingencies, we separately make use of the choices that identify the
best (Models 2a, 2b) and the worst company (Models 3a, 3b). In both cases, we employ a mixed logit
specification (a) and a conditional logit specification (b) as a robustness check.
As we estimate nonlinear models, we cannot base our interpretation on the obtained coefficient
estimates (Hoetker, 2007; Huang and Shields, 2000; Norton, Wang, and Ai, 2004). Only marginal effects
give an impression of the attribute levels’ impact on the probability that a hypothetical company is chosen
as best. Due to our dummy coding of attribute levels, we calculate the marginal effect as the difference in
predicted probability that hypothetical company A is chosen as best out of three, when the dummy is
being switched from “off” to “on” (e.g., Long and Freese, 2006). In nonlinear models, marginal effect
sizes depend not only on the coefficient estimate of the variable of interest but also on the values of all
other variables in the model. Thus, we calculate the marginal effect for all possible combinations of
attributes’ levels of the hypothetical company A and all combinations of attribute levels that the two
10
competing firms in a choice set can possess. As we evaluate the effect of one attribute in hypothetical
company A, 34=81 attribute combinations remain for this company, while there are 35 x 35 = 59,049
combinations to evaluate for the two companies competing with the first one. Averaging the resulting
4,782,969 marginal effects of all combinations of attribute levels gives the average marginal effect (AME)
that we report. Confidence intervals for each AME are calculated using the simulation approach recently
proposed by King, Tomz, and Wittenberg (2000) and Zelner (2009). Following them, we calculate AMEs
not only based on the estimated coefficients but additionally for 100 simulated coefficient vectors drawn
from the distributions of the estimated coefficient.4
Results
We now employ our data to analyze, in turn, the relative importance of the appropriability mechanisms
considered; the benefit contributions of the various levels of each mechanism, in particular nonlinearities
and trade-offs between them; and goal contingencies in the sense of differences in these benefit
contributions between firms with good and firms with poor appropriability performance.
Relative Importance of Attributes
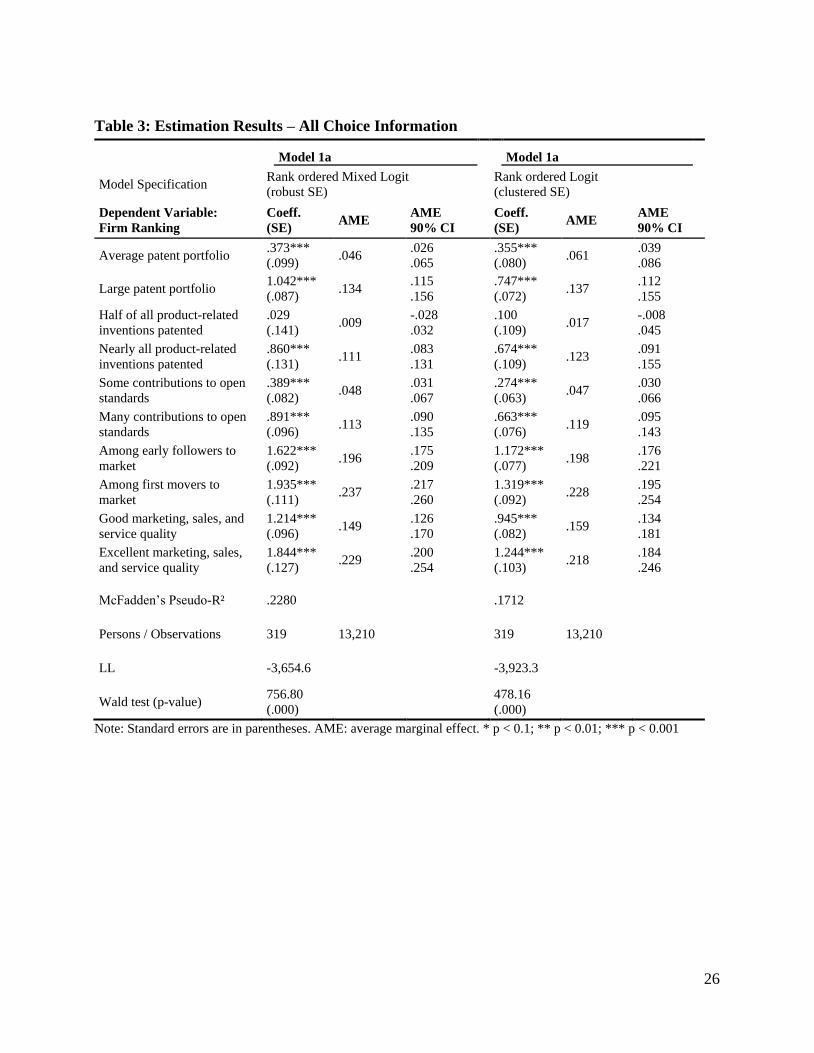
Table 3 contains two models that exploit the full rank order information: the first (Model 1a) in a rank
ordered mixed logit specification; and the second (Model 1b) in the more traditional rank ordered logit
specification, which we use as a robustness check. There are, indeed, some deviations between the two
models, indicating that using the more sophisticated specification is advisable. Yet, overall, the outcomes
are comparable, confirming robustness of our results.
----------------------------------
4 Relying on the central limit theorem, the distribution of the coefficients is assumed to be normal as described by
the coefficients’ estimated mean and its standard error (King et al., 2000). Because this algorithm is
computationally very demanding, we chose only 100 simulated coefficient draws from the normal distribution of
the original estimated coefficients. We only calculate 10% and 5% confidence intervals for the AMEs since with
only 100 observations 1% confidence intervals would be strongly influenced by outliers. STATA code that
implements the proposed algorithm can be obtained from the authors.
11
Insert Table 2 about here
----------------------------------
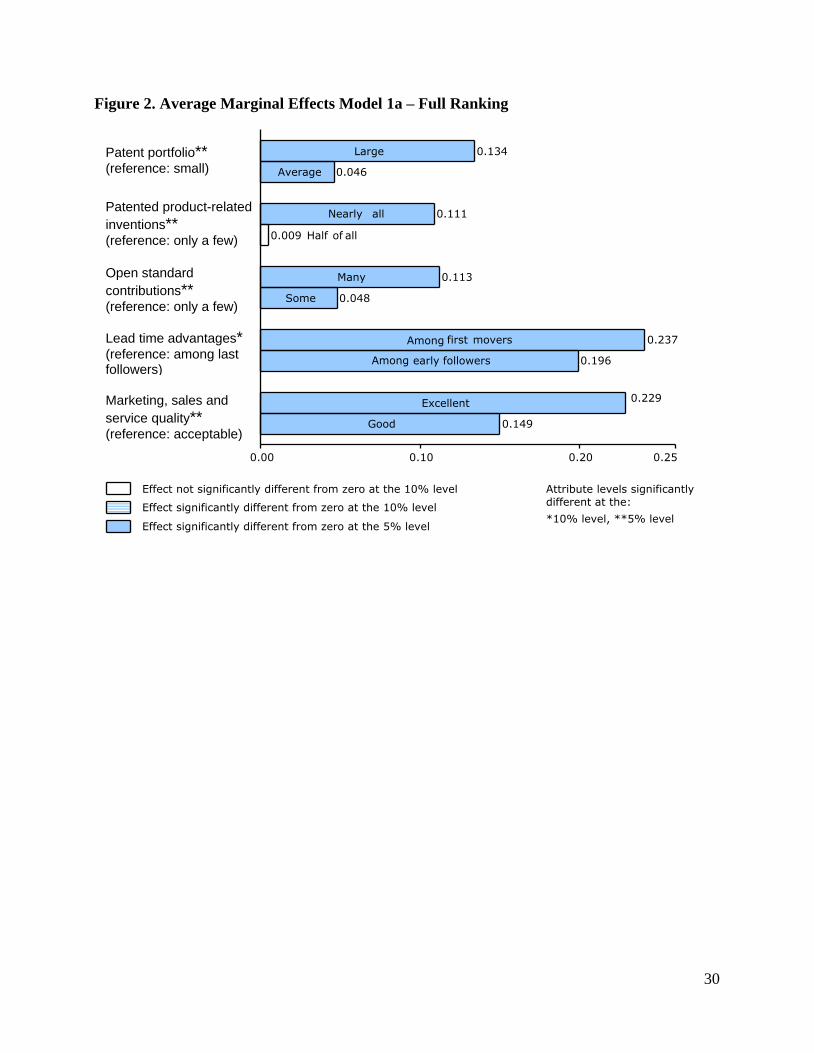
We define the importance of an attribute as the difference between the highest marginal effect of the
attribute’s level and its lowest marginal effect, normalized in such a way that the sum of all five
importance values equals 100% (cf. Franke et al., 2008). As for each attribute, the least preferred level
serves as the point of reference, the non-normalized importance value of this attribute is the AME of the
most preferred level. All importance values are then normalized by dividing them by the sum of the AMEs
of the respective most preferred attribute levels. Take the patent portfolio as an example. The AME of the
patent portfolio shown in Table 3, Model 1a, is 0.046 for an average patent portfolio and 0.134 for a large
patent portfolio. The most preferred level for patent portfolio is, thus, large with an AME of 0.134.
Dividing 0.134 by the sum of the AMEs of the respective most preferred level (large patent portfolio,
nearly all product-related inventions patent protected, nearly all product-related inventions contributed to
open standards, among first movers to market and excellent marketing, sales, and service quality) yields
an importance of the appropriability mechanism patent portfolio of 16.2%.
Overall, the importance ranking we obtain is in line with previous studies (see the Profiting from
Innovation section). Lead time advantages turn out to be the most important appropriability mechanisms
with an importance value of 29.2%. Ranked second, marketing, sales, and service quality follow closely
with an importance of 27.8%. Third is patent portfolio size with 16.2%, fourth is open standard
contributions (13.6%), and last, product-related patents (13.2%). Yet, despite the parallel to earlier studies,
the strong dominance of lead time advantages and marketing, sales, and service quality is striking. Both
are perceived as nearly twice as important as the other three appropriability mechanisms.
Comparing the importance levels of the patent portfolio and of product-related patents yields a second
interesting insight: the size of the overall patent portfolio is perceived as more important than the patents
covering the focal product. While the importance of large patent portfolios for purposes of deterrence or as
bargaining chips in cross-licensing is well known (Hall and Ziedonis, 2001), the finding that a firm’s
12
overall portfolio actually matters more for appropriating value from a specific product innovation than the
number of product-related innovations is highly remarkable.
Finally, it is noteworthy that the importance of contributions of product-related inventions to open
standards is higher than that of product-related patent protection. An interviewee explained the importance
of contributions to open standards: “An enterprise that contributes [inventions] to standard setting
organizations reduces its business risk. It means far more risk for us to start an own, proprietary
development [not contributing it to open standards] because nobody knows if the market will accept it or
not.” Furthermore, interviewees pointed out that it is vital to actively take part in the standard
development by contributing own technology to control the standardization processes and to gather early
implementation know-how.
--------------------------------
Insert Figure 2 about here
--------------------------------
Nonlinearities and Trade-offs
We now assess nonlinearities and trade-offs for each attribute listed in Table 3, Model 1. Figure 2
illustrates the AMEs, suggesting that the benefit contribution of the appropriability mechanisms patent
portfolio, open standard contributions, and marketing, sales, and service efforts is a roughly linear
function of the respective levels. In contrast, product-related patent protection and lead time advantages
show pronounced nonlinearities. Interestingly, having half of all inventions patent protected is considered
no more effective than having only a few patented (the reference level); the AME is 0.005, close to zero
and insignificant. Having nearly all inventions in the product patented, however, has a significant benefit
contribution of 0.109. This suggests that only a full patent covering of product-related inventions (which
comprise inventions that are substitutes to those embodied in the product) is helpful, while partial
coverage is largely ineffective. Another interviewee explained that “one of the possible technological
solutions will be realized [in our products], and with the others you have by that same time plastered the

13
[technological] environment. A competitor will face difficulties when trying to find a loophole.” This
statement suggests that excessive patenting is used to make inventing around patents harder and thus to
increase the effectiveness of patent protection. Another interviewee mentioned that “it is important to keep
in mind that you do not know how technology will develop in the future. You cannot predict the future.
That’s why you have to patent more broadly.” Summarizing the key message from our qualitative
research, firms have to patent all potential technological solutions to a problem in order to make inventing
around patents more difficult for their competitors and to account for technological uncertainty.
Regarding lead time advantages, we find that being among early followers has a benefit contribution of
0.199, while being among first movers has only a moderately higher benefit contribution of 0.241. One
interviewee explained that “it is not sufficient to have the new technology, you also have to create
awareness, the customer demand, in fact the market [for the new technology].” Thus, being first on the
market does not automatically translate into benefits but requires additional investments into
advertisement and related sales activities. If a firm is an early follower to market, it can to some extend
free ride on the investments first movers made. Trade-offs between appropriability mechanisms can also
be evaluated in Figure 2. An interesting example for a trade-off between appropriability mechanisms that
management could exploit is that it is worth settling for being an early follower rather than the first mover
if doing so allows improving the quality of sales and service from “good” to “excellent.”
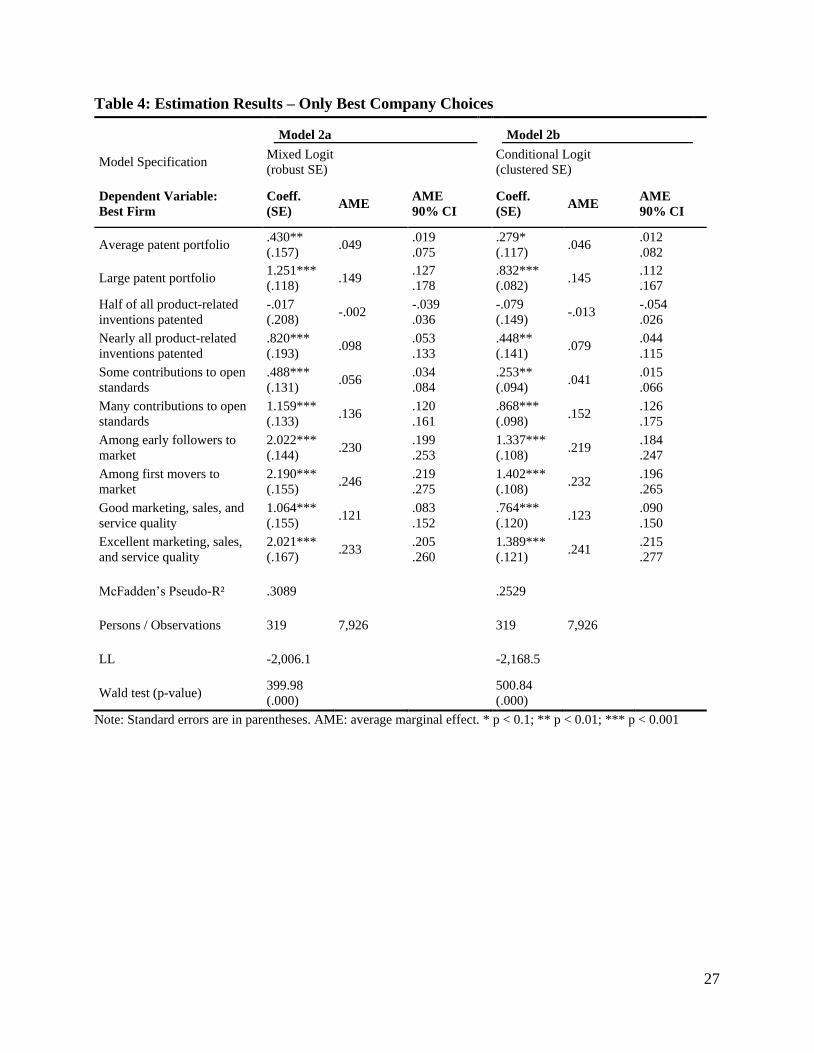
Goal Contingencies: Good vs. Poor Appropriability Performance
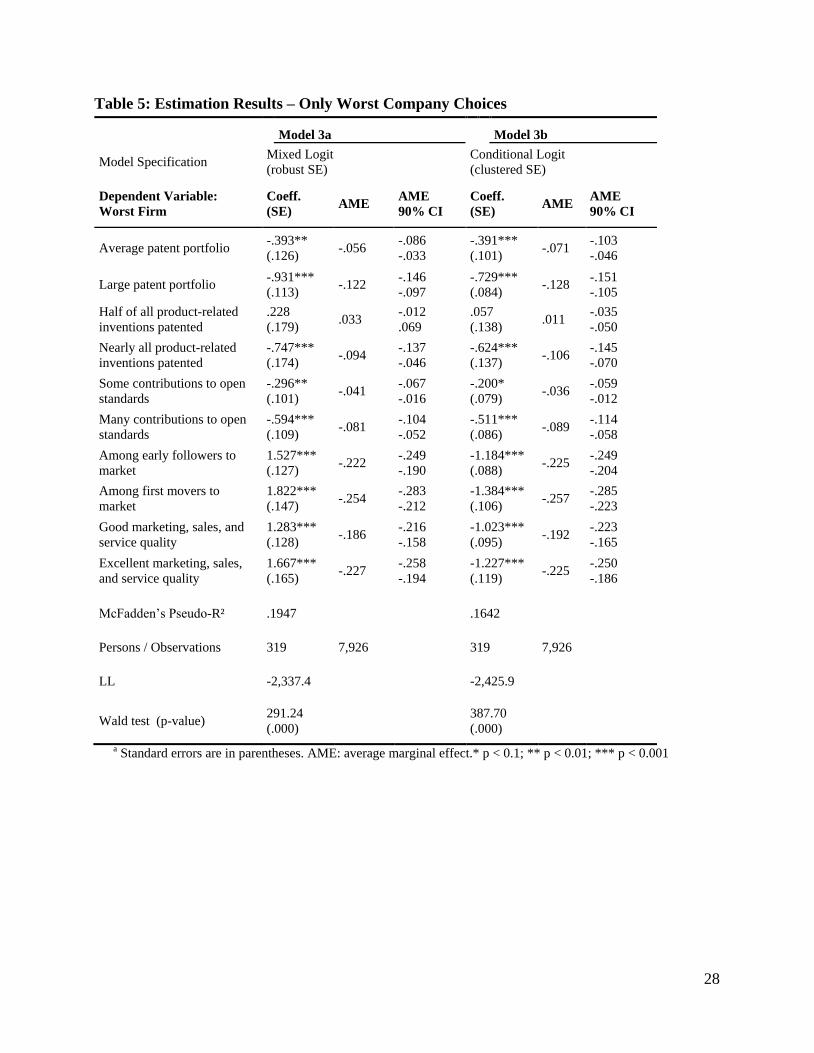
We now disentangle the complete rank order data in two choices and discuss diverging results of the
models that fit the choices of best performing firms (Table 4) and those that fit the choices of worst
performing firms (Table 5). Conditional logit regressions (Models 2b, 3b) show some deviations but
overall confirm robustness of our main models. In the following, we thus refer to Models 2a and 3a.
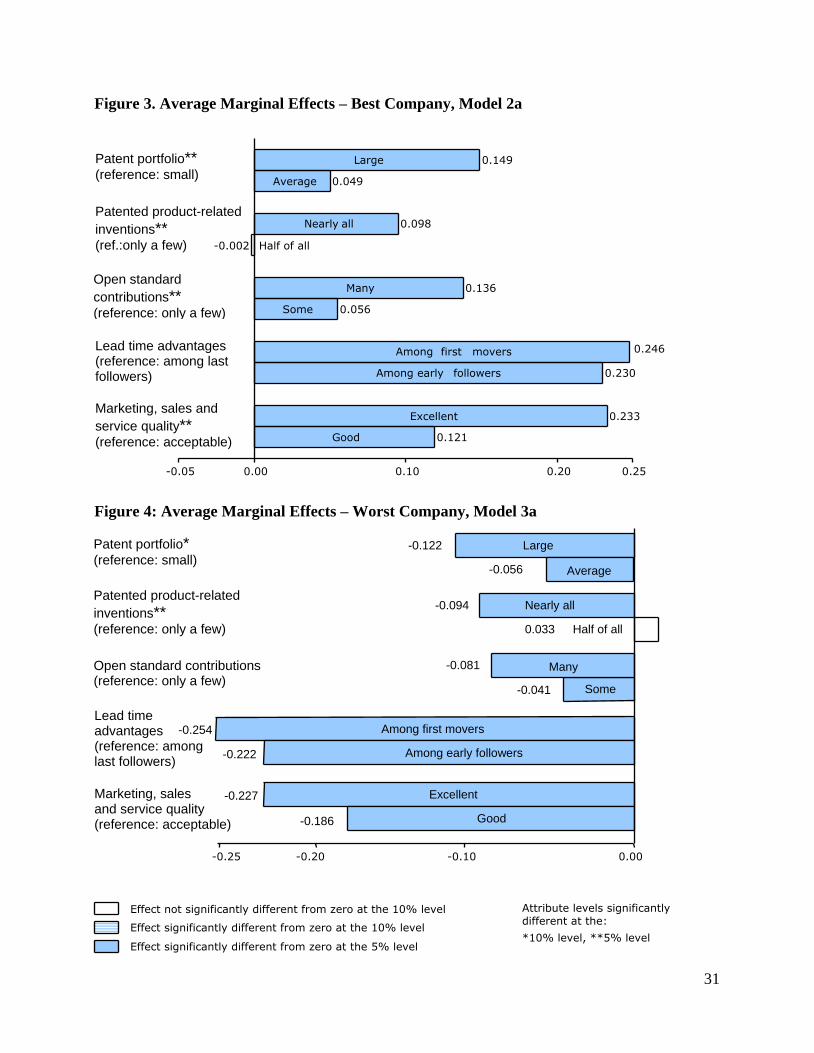
Comparing Models 2a and 3a (Figures 3 and 4) to each other and to the specification employing the
full rank order data (Model 1a, Figure 2) shows that the importance rankings of the appropriability
14
mechanisms are mostly identical.5 Looking at absolute values of the AMEs, we see a pronounced
difference for “many contributions to open standards,” with values of 0.136 in Model 2a and only 0.081in
Model 3a. Apparently, contributions to open standards are much more effective for good than for bad
performers. In addition, marked differences between Models 2a and 3a exist with respect to how AMEs
vary between levels. While for “being best” the benefit contribution of a large patent portfolio is 3.04
times as large as that of an average portfolio (Model 2a), this ratio equals 2.18 for “not being worst”
(Model 3a). Similarly, the ratio between the AMEs of “many” and “some” open standard contributions is
2.43 in Model 2a compared with 1.97 in Model 3a. Most pronounced is the difference between Model 2a
and 3a with respect to the AME ratios of “excellent” and “good” marketing, sales, and service quality,
with 1.93 compared with 1.22. We thus find that the relation between the level and the effectiveness of
these appropriability mechanisms is more strongly convex for top than for poor performers.
----------------------------------------------------------
Insert Tables 4, 5, and Figures 3, 4 about here
----------------------------------------------------------
These findings indicate that for poorly performing firms it is relatively more important to achieve
average levels in all appropriability mechanisms than to excel in some at the expense of others. In
contrast, high performers may benefit from being top in one and last in some other mechanism rather than
being average in both. For illustration, a well-performing firm would obtain an aggregate AME of 0.136
from a small patent portfolio and many contributions to open standards, and a value of only 0.105 from
average values in both mechanisms. For this firm, focus pays. In contrast, a struggling firm would obtain
aggregate AMEs of 0.081 and 0.097, respectively, and would thus be better off developing both
mechanisms to an average level.
5 The only exception is that product-related patents come out slightly more important than contributions to open
standards in Model 3a. However, given their standard errors (see Table 5), these values are not significantly
different from each other.
15
Discussion
Summarizing our results, we find—in line with previous research—that lead time advantages and
marketing, sales, and service efforts are perceived as the most important appropriability mechanisms.
Interestingly, the overall patent portfolio and contributions to open standards are perceived as even more
important than product-related patent protection. We also find empirical evidence that the benefit
contribution of some appropriability mechanisms is a strongly nonlinear function of its levels. A
remarkable finding is that product-related patent protection is found effective only at its highest level,
while switching from nearly no to half of all product-related inventions patented does not lead to a
significant increase in benefit contribution. Furthermore, we find that switching from being among early
followers to market to being first on the market also does not lead to an increase in benefit contribution.
Thus, it seems to be worth settling for being an early follower rather than the first mover, if doing so
allows improving the quality of sales and service from good to excellent or if doing so generates the
necessary resources to patent nearly all product-related inventions. Evaluating only best and worst
company choices, we find that contributing many inventions to open standards is perceived as less
effective in preventing companies to be a ranked as worst than for supporting companies to be ranked as
best. Furthermore, it turns out that average levels of “patent portfolio,” “open standard contributions,” and
“marketing, sales, and service quality” are relatively more attractive for bad than for good performers.
Our results contribute to several strands of literature. First, our findings help to explain the patent
paradox, that is, the apparent contradiction between the steady increase in the number of patent
applications and the perceived ineffectiveness of patents in most industries (Cohen et al., 2000; Hall and
Ziedonis, 2001; Parchomovsky and Wagner, 2005). Hall and Ziedonis (2001) propose an explanation of
this paradox by observing that firms amass patent portfolios for the purpose of deterrence and cross-
licensing, beyond using patents in order to prevent imitation. This argument is supported by our finding
that the patent portfolio size is perceived as more important for profiting from innovation than the number
of product-related patents. Furthermore, our finding that product-related patents are considered effective
only when used extensively suggests an additional explanation of the patent paradox. Our qualitative
16
research points to the common argument that a major obstacle to effective patent protection is the ease of
inventing around the patent (e.g., Cohen et al., 2000). That means firms are patenting extensively to keep
competing firms from inventing around a patent protected invention by patenting alternative technical
solutions. Furthermore, our qualitative research puts forth yet another argument for firm’s extensive
patenting. Firms patent various different technological implementations of one invention because it is not
clear which technological solution will prevail. In technologies that allow for many solutions to one
problem—such as in the communications equipment industry we focus on—it seems to be important to
acquire multiple options for future patent protection.
Second, we contribute to the literature on market entry timing. Lead time advantages over competitors
have robustly been ranked among the most effective appropriability mechanisms (cf. Sattler 2003),
consistent with many empirical studies that show the important effect of lead time advantages on long-
lived market share advantages (see Golder and Tellis, 1993, for an overview). Our study also finds lead
time advantages to be very effective; however, our finding that being among the first followers is nearly
equally effective than being a first mover requires carefully interpreting the results of previous studies.
Pushing the product to market to gain lead time advantages may not always be the best choice. First
movers have to spend considerable resources on communicating customer benefits of new products and on
identifying and eliminating customer problems with new technologies. First followers can, to some extent,
free ride on these investments and leapfrog first movers with better marketing, sales, and service
capabilities or superior technology (Lieberman and Montomery, 1988; Shankar, Carpenter, and
Krishnamurthi, 1998, 1999). Chandy et al. (2006) further find evidence that an overly strong focus on
speed in product development processes actually impedes the firm’s ability to convert promising ideas
into innovations that enter the market. Our findings thus suggest that it is crucial not to fall behind the
early followers. In contrast, whether to opt for a first mover or an early follower strategy, a question that
sparked a huge discussion (e.g., Lieberman and Montgomery, 1988, 1998), should only have second
priority in optimizing value appropriation in industries similar to the one we study.
17
Third, we contribute to the literature on open diffusion of inventions. Many scholars have
emphasized the advantages of diffusing inventions and facilitating others’ use instead of excluding others
from them (Chesbrough, 2003; Foray, 2004; Harhoff et al., 2003; Henkel, 2006). In the context of open
standards—the instance of open diffusion of inventions that is most relevant in our setting— firms profit
by making their former proprietary technology a standard, thus gaining time advantages in product
implementation, increasing efficiency in new product development by obtaining external development
support, enhancing their licensing income, and signaling standard adherence to their customers. Yet, while
these benefits are evident, firms need to weigh them against the loss of product differentiation that
contributing to open standard entails. In order to make sure that, despite its sharing technology with
competitors, its own products still succeed on the market, a firm thus needs to excel in other,
complementary dimensions. These may be the sale of complementary products or services (e.g., Sengupta,
1998), a high quality of product-related marketing, sales, and services, or other related inventions that are
kept exclusive (Henkel, 2006). Thus, to reap benefits of open diffusion of inventions, a practicing
company must be in a good position overall to capture value from its R&D. Our findings support this
view. Many contributions to open standards are considered as effective in supporting value appropriation
for successful firms (analysis of best company choices), while they show a significantly weaker effect for
firms with poorer appropriability performance (analysis of worst company choices).
Our empirical approach has a number of limitations. First of all, in order to motivate a large number
of managers from all relevant functions to participate in our time-consuming experiments, we had to
concentrate on one firm. Thus, the effect sizes we measure are likely to be to some extent firm-specific.
However, we are confident that external validity of our study for the overall industry is given, for four
reasons: we asked respondents not about their own firm, but about hypothetical firms in their industry; our
focal firm is international, with respondents working in 13 different countries and five different
continents; the industry we study is in a concentration process, so that employees often change firms;6 and
6 We had access to the résumés of 100 of our participants. Of these 100, 58% had worked at least for one other
company in the industry. On average, each of them worked for 1.6 other companies.
18
the relevant firms in the industry exhibit rather similar patenting and standardization activities.7 Also, our
focus on one industry constitutes a limitation. However, in order to keep the experimental setting realistic,
tailoring it to one industry was necessary. For example, the relevant manifestation of “openness” in other
industries may be the extent of bilateral licensing or of contributions to public open source software
projects rather than contributions to open standards. Thus, focusing on one industry seems a sensible
approach, but it does, of course, call for conducting similar studies in other industries. Data from the
Carnegie Mellon study (Cohen et al., 2000) reveal that the communications equipment industry we study
is, in terms of appropriability mechanisms, very similar to semiconductors, computers, and machine tools.
More fundamentally, our main point was to demonstrate that nonlinearities and goal contingencies in
appropriability mechanisms’ effectiveness exist that have to be taken into account when optimizing value
appropriation. We expect this qualitative result to hold quite generally.
Our empirical evidence of nonlinearities in the benefit contribution of appropriability mechanisms
complemented with the quantification of trade-offs between appropriability mechanisms points to
important levers for optimizing value appropriation. Managers need to take a holistic view on value
appropriation, taking all specific properties of the relevant appropriability mechanisms into account. As
different functions manage different appropriability mechanisms, the coordination necessary to strike the
right balance between them might not be trivial. Firms should. Thus. organize for value appropriation in a
way that allows them to actively exploit trade-offs between appropriability mechanisms.
7 Table 2 shows that the activity of the top four, major players in the communications equipment industry regarding
observable appropriability mechanisms is comparable.
19
References
Allen, R.C. 1983. Collective Invention. Journal of Economic Behavior & Organization 4(1): 1–24.
Arrow, K. 1962. Economic Welfare and the Allocation of Resources for Invention. In: The Rate and
Discretion of Inventive Activity: Economic and Social Factors, ed. R. Nelson. Princeton, NJ: Princeton
University Press, 609–26.
Artz, K.W., Norman, P.M., Hatfield, D.E., and Cardinal, L.B. 2010. A Longitudinal Study of the Impact
of R&D, Patents, and Product Innovation on Firm Performance. Journal of Product Innovation
Management. 27(5): 725–40.
Arundel, A. 2001. The Relative Effectiveness of Patents and Secrecy for Appropriation. Research Policy
30(4): 611–24.
Beggs, S., Cardell, S., and Hausman, J. 1981. Assessing the Potential Demand for Electric Cars. Journal
of Econometrics 17(1): 1–19.
Bekkers, R., Duysters, G., and Verspagen, B. 2002. Intellectual Property Rights, Strategic Technology
Agreements and Market Structure: The Case of GSM. Research Policy 31: 1141–161.
Blind, K., Edler, J., Frietsch, R., and Schmoch, U. 2006. Motives to Patent: Empirical Evidence from
Germany. Research Policy 35(5): 655-72.
Brownstone, D. and Train, K. 1999. Forecasting New Product Penetration with Flexible Substitution
Patterns. Journal of Econometrics 89(1-2): 109-29.
Carpenter, G.S. and Nakamoto, K. 1989. Consumer Preference Formation and Pioneering Advantage.
Journal of Marketing Research 26: 285–98.
Chandy, R., Hopstaken, B., Narasimhan, O. and Prabhu, J. 2006. From Invention to Innovation:
Conversion Ability in Product Development. Journal of Marketing Research 43: 494–508.
Chapman, R.G. and Staelin, R. 1982. Exploiting Rank Ordered Choice Set Data within the Stochastic
Utility Model. Journal of Marketing Research 19(3): 288–301.
Chesbrough, H.W. 2003. Open Innovation. The New Imperative for Creating and Profiting from
Technology. Boston, MA: Harvard Business School Press.
Cohen, W.M., Goto, A., Nagata, A., Nelson, R.R., and Walsh, J.P. 2002. R&D Spillovers, Patents and the
Incentives to Innovate in Japan and the U.S. Research Policy 31(8-9): 1349–67.
20
Cohen, W.M., Nelson, R.R., and Walsh, J.P. 2000. Protecting their Intellectual Assets: Appropriability
Conditions and Why U.S. Manufacturing Firms Patent (or not). NBER Working Paper no. w7552.
Cambridge, MA: National Bureau of Economics Research.
Dahl, M. and Pedersen, C. 2004. Knowledge Flows through Informal Contacts in Industrial Clusters:
Myth or Reality? Research Policy 33(10): 1673–86
Dechenaux, E., Goldfarb, B., Shane, S., and Thursby, M. 2008. Appropriability and Commercialization:
Evidence from MIT Inventions. Management Science 54(5): 893–906.
de Fraja, G. 1993. Strategic Spillovers in Patent Races. International Journal of Industrial Organization
11(1): 139–46.
Economides, N. 1996. Network Externalities, Complementarities, and Invitations to Enter. European
Journal of Political Economy 12(2): 211–33.
Farrell, J. and Gallini, N.T. 1988. Second-Sourcing as a Commitment: Monopoly Incentives to Attract
Competition. Quarterly Journal of Economics 103(4): 673–94.
Fauchart, E. 2003. On Knowledge Sharing Patterns among Rival Firms: The Case of Knowledge on
Safety. DRUID Summer Conference 2003. Retrieved August 9, 2011, from
http://www.druid.dk/uploads/tx_picturedb/ds2003-789.pdf
Fehrshtman, C., Mahajan, V., and Muller, E. 1990. Market Share Pioneering Advantage: A Theoretical
Approach. Management Science 36(8): 900–18.
Foray, D. 2004. Economics of Knowledge. Cambridge, MA: MIT Press.
Franke, N., Gruber, M., Harhoff, D., and Henkel, J. 2008. Venture Capitalists’ Evaluations of Start-up
Teams: Trade-offs, Knock-out Criteria, and the Impact of VC Experience. Entrepreneurship Theory &
Practice 32(3): 459–83.
Golder, P.N. and Tellis, G.J. 1993. Pioneer Advantage: Marketing Logic or Marketing Legend? Journal of
Marketing Research 30: 158–70.
Grand, S., von Krogh, G., Leonard, D., and Swap, W. 2004. Resource Allocation Beyond Firm
Boundaries: A Multi-Level Model for Open Source Innovation. Long Range Planning 37(6): 591–610.
Green, P.E. and Srinivasan, V. 1990. Conjoint Analysis in Marketing: New Developments with
Implications for Research and Practice. Journal of Marketing 54(4): 3–19.
Hall, B.H. and Ziedonis, R. 2001. The Patent Paradox Revisited: An Empirical Study of Patenting in the
US Semiconductor Industry, 1979-95. RAND Journal of Economics 32(1): 101–28.
21
Harabi, N. 1995. Appropriability of Technical Innovations: An Empirical Analysis. Research Policy
24(6): 981–92.
Harhoff, D., Henkel, J., and von Hippel, E. 2003. Profiting from Voluntary Information Spillovers: How
Users Benefit by Freely Revealing their Innovations. Research Policy 32(10): 1753–69.
Hausman, J.A. and Wise, D.A. 1978. A Conditional Probit Model for Qualitative Choice: Discrete
Decisions Recognizing Interdependence and Heterogeneous Preferences. Econometrica 46(2): 403–26.
Henkel, J. 2006. Selective Revealing in Open Innovation Processes: The Case of Embedded Linux.
Research Policy 35(7): 953–69.
Hoetker, G. 2007. The Use of Logit and Probit Models in Strategic Management Research: Critical Issues.
Strategic Management Journal 28(4): 331–43.
Hole, A.R. 2007. Fitting Mixed Logit Models by Using Maximum Simulated Likelihood. STATA
Journal 7(3): 388–401.
Huang, C. and Shields, T.G. 2000. Interpretation of Interaction Effects in Logit and Probit analyses.
American Politics Quarterly 28(1): 80–95.
Kash, D. and Kingston, W. 2001. Patents in a World of Complex Technologies. Science and Public Policy
28(1): 11–22.
King, G., Tomz, M., and Wittenberg, J. 2000. Making the Most of Statistical Analyses: Improving
Interpretation and Presentation. American Journal of Political Science 44(2): 347-61.
König, H. and Licht, G. 1995. Patents, R&D and Innovation: Evidence from the Mannheim Innovation
Panel. Ifo-Studien 41: 521–45.
Layton, D.F. 2000. Random Coefficient Models for Stated Preference Surveys. Journal of Environmental
Economics and Management 40(1): 21–26.
Leiponen, A.E. 2008. Competing through Cooperation: The Organization of Standard Setting in Wireless
Telecommunications. Management Science 54(11): 1904–19.
Levin, R.C., Klevorick, A.K., Nelson, R.R., Winter, S.G., Gilbert, R., and Griliches, Z. 1987.
Appropriating the Returns from Industrial Research and Development. Brookings Papers on Economic
Activity 1987(3): 783–831.
Lieberman, M.B. and Montgomery, D.B. 1988. First-Mover Advantages. Strategic Management Journal
9: 41–58.
22
Lieberman, M.B. and Montgomery, D.B. 1998. First-Mover (Dis)Advantages: Retrospective and Link
with the Resource-Based View. Strategic Management Journal 19(12): 1111–25.
Liebeskind, J.P. 1996. Knowledge, Strategy, and the Knowledge of the Firm. Strategic Management
Journal 17(winter special issue): 93–107.
Long, J.S. and Freese, J. 2006. Regression Models for Categorical Dependent Variables using STATA.
College Station, TX: STATACorp.
McFadden, D. 1974. Conditional Logit Analysis of Qualitative Choice Behavior. In: Frontiers in
Econometrics, ed. P. Zarembka. New York: Academic Press: 105–42.
McFadden, D. and Train, K. 2000. Mixed MNL Models for Discrete Response. Journal of Applied
Econometrics 15(5): 447–70.
Norton, E. C., Wang, H., Ai, C.R. 2004. Computing interaction effects in logit and probit models. Stata
Journal 4(2): 154–167.
Nuvolari, A. 2004. Collective Invention during the British Industrial Revolution: The Case of the Cornish
Pumping Engine. Cambridge Journal of Economics 28(3): 347–63
Parchomovsky, G. and Wagner, R.P. 2005. Patent Portfolios. University of Pennsylvania Law Review
154(1).
Pisano, G. 2006. Profiting from Innovation and the Intellectual Property Revolution. Research Policy 35:
1122–30.
Revelt, D. and Train, K. 1998. Mixed Logit with Repeated Choices: Households Choice of Mixed Logit
with Repeated Choices: Households Choice of Appliance Efficiency Level. Review of Economics and
Statistics 53(4): 647–57.
Rysman, M. and Simcoe, T. 2008. Patents and the Performance of Voluntary Standard-Setting
Organizations. Management Science 54(11): 1920–34.
Sahay, A. and Riley, D. 2003. The Role of Resource Access, Market Considerations, and the Nature of
Innovation in Pursuit of Standards in the New Product Development Process. Journal of Product
Innovation Management 20(5): 338–55.
Sattler, H. 2003. Appropriability of Product Innovations: an Empirical Analysis for Germany.
International Journal of Technology Transfer 25(5-6): 502–16.
Schrader, S. 1991. Informal Technology Transfer between Firms: Cooperation through Information
Trading. Research Policy 20(2): 153–70
23
Sengupta, S. 1998. Some Approaches to Complementary Product Strategy. Journal of Product and
Innovation Management 15(4): 352–67.
Shankar, V., Carpenter, G.S., and Krishnamurthi, L. 1998. Late Mover Advantage: How Innovative Late
Entrants Outsell Pioneers. Journal of Marketing Research 35: 54–70.
Shankar, V., Carpenter, G.S., and Krishnamurthi, L. 1999. The Advantage of Entry in the Growth Stage of
the Product Life Cycle: An Empirical Analysis. Journal of Marketing Research 36: 269–276.
Shepard, A. 1987. Licensing to Enhance Demand for New Technologies. RAND Journal of Economics
18(3): 360–68.
Stening, B.W. and Everett, J.E. 1984. Response Styles in a Cross-cultural Managerial Study. Journal of
Social Psychology 122: 151–56.
Taylor, C.T. and Silberston, Z.A. 1973. The Economic Impact of the Patent System: A Study of the British
Patent System. Cambridge, MA: Cambridge University Press.
Teece, D.J. 1986. Profiting from Technological Innovation: Implications for Integration, Collaboration,
Licensing and Public Policy. Research Policy 15(6): 285–304.
von Hippel, E. 1988. The Sources of Innovation. New York: Oxford University Press.
von Hippel, E. and von Krogh, G. 2003. Open Source Software and the ‘Private-Collective’ Innovation
Model: Issues for Organization Science. Organization Science 14(2): 208–23.
von Hippel, E. and von Krogh, G. 2006. Free Revealing and the Private-Collective Model for Innovation
Incentives. R&D Management 36(3): 295–306.
West, J. and Gallagher, S. 2006. Challenges of Open Innovation: The Paradox of Firm Investment in
Open-Source Software. R&D Management 36(3): 319–31
Yu, J., Goos, P., and Vandebroek, M. 2009. Efficient Conjoint Choice Designs in the Presence of
Respondent Heterogeneity. Marketing Science 28(1): 122–35.
Zelner, B.A. 2009. Using Simulation to Interpret Results from Logit, Probit, and Other Nonlinear Models.
Strategic Management Journal 30(12): 1335–48.
24
Tables and Figures
Table 1: Competitors’ Activity in Selected Appropriability Mechanisms
Competitors
(ordered by market
share in 2008)
Product-related
Patents (active
U.S. patents
2008)
Corporate Patent
Portfolios (active U.S.
patents 2008)
Contributions to Major
Standard Setting Organizations
for which Data was Publicly
Available (IETF, ETSI)
Avaya 424 946 16
Cisco 1892 7468 202
Siemens 1009 6335 129
Nortel 1305 5305 52
Alcatel-Lucent 2887 14162 250
NEC 77 1448 17
Aastra 21 60 0
Mitel 168 339 1
ShoreTel 2 4 0
3Com 506 1845 0
Samsung 749 14968 2
Note: The identification of product-related patents and patent portfolios was conducted in collaboration with the
IP department of our focal firm.
25
Table 2: Attributes and Attribute Levels
Attribute Description in the Choice Experiments Attribute Levels
Patent portfolio The company’s patent portfolio comprises patents on technology for
enterprise communications systems and patents on other, adjacent
technologies, e.g., mobile communication networks or collaborative
working software.
Small patent portfolio
Average patent portfolio
Large patent portfolio
Product-related inventions
that are patented
Share of all inventions – made in developing the offered enterprise
communications system product – that are patented.
Some product-related inventions patented
Half of all product-related inventions patented
Nearly all product-related inventions patented
Contributions to open
standards
Share of all inventions - made in developing enterprise
communications systems - contributed to open standards. The share
of contributions that are patented is identical to the share of
inventions that are patented (see attribute above). Patent protected
contributions have to be licensed under reasonable and non-
discriminatory (RAND) terms.
Only a few contributions to open standards
Some contributions to open standards
Many contributions to open standards
Time to market Time needed to implement inventions into the product and place it
on the market.
Among late followers to market
Among early followers to market
Among first movers to market
Marketing, sales, and service
quality
Marketing, sales, and service efforts comprise all efforts for selling,
implementing and maintaining the enterprise communications
systems.
Average marketing, sales, and service quality
Good marketing, sales, and service quality
Excellent marketing, sales, and service quality
26
Table 3: Estimation Results – All Choice Information
Model 1a Model 1a
Model Specification Rank ordered Mixed Logit
(robust SE)
Rank ordered Logit
(clustered SE)
Dependent Variable:
Firm Ranking
Coeff.
(SE) AME
AME
90% CI
Coeff.
(SE) AME
AME
90% CI
Average patent portfolio .373***
(.099) .046
.026
.065
.355***
(.080) .061
.039
.086
Large patent portfolio 1.042***
(.087) .134
.115
.156
.747***
(.072) .137
.112
.155
Half of all product-related
inventions patented
.029
(.141) .009
-.028
.032
.100
(.109) .017
-.008
.045
Nearly all product-related
inventions patented
.860***
(.131) .111
.083
.131
.674***
(.109) .123
.091
.155
Some contributions to open
standards
.389***
(.082) .048
.031
.067
.274***
(.063) .047
.030
.066
Many contributions to open
standards
.891***
(.096) .113
.090
.135
.663***
(.076) .119
.095
.143
Among early followers to
market
1.622***
(.092) .196
.175
.209
1.172***
(.077) .198
.176
.221
Among first movers to
market
1.935***
(.111) .237
.217
.260
1.319***
(.092) .228
.195
.254
Good marketing, sales, and
service quality
1.214***
(.096) .149
.126
.170
.945***
(.082) .159
.134
.181
Excellent marketing, sales,
and service quality
1.844***
(.127) .229
.200
.254
1.244***
(.103) .218
.184
.246
McFadden’s Pseudo-R² .2280 .1712
Persons / Observations 319 13,210 319 13,210
LL -3,654.6 -3,923.3
Wald test (p-value) 756.80
(.000)
478.16
(.000)
Note: Standard errors are in parentheses. AME: average marginal effect. * p < 0.1; ** p < 0.01; *** p < 0.001
27
Table 4: Estimation Results – Only Best Company Choices
Model 2a Model 2b
Model Specification Mixed Logit
(robust SE)
Conditional Logit
(clustered SE)
Dependent Variable:
Best Firm
Coeff.
(SE) AME
AME
90% CI
Coeff.
(SE) AME
AME
90% CI
Average patent portfolio .430**
(.157) .049
.019
.075
.279*
(.117) .046
.012
.082
Large patent portfolio 1.251***
(.118) .149
.127
.178
.832***
(.082) .145
.112
.167
Half of all product-related
inventions patented
-.017
(.208) -.002
-.039
.036
-.079
(.149) -.013
-.054
.026
Nearly all product-related
inventions patented
.820***
(.193) .098
.053
.133
.448**
(.141) .079
.044
.115
Some contributions to open
standards
.488***
(.131) .056
.034
.084
.253**
(.094) .041
.015
.066
Many contributions to open
standards
1.159***
(.133) .136
.120
.161
.868***
(.098) .152
.126
.175
Among early followers to
market
2.022***
(.144) .230
.199
.253
1.337***
(.108) .219
.184
.247
Among first movers to
market
2.190***
(.155) .246
.219
.275
1.402***
(.108) .232
.196
.265
Good marketing, sales, and
service quality
1.064***
(.155) .121
.083
.152
.764***
(.120) .123
.090
.150
Excellent marketing, sales,
and service quality
2.021***
(.167) .233
.205
.260
1.389***
(.121) .241
.215
.277
McFadden’s Pseudo-R² .3089 .2529
Persons / Observations 319 7,926 319 7,926
LL -2,006.1 -2,168.5
Wald test (p-value) 399.98
(.000)
500.84
(.000)
Note: Standard errors are in parentheses. AME: average marginal effect. * p < 0.1; ** p < 0.01; *** p < 0.001
28
Table 5: Estimation Results – Only Worst Company Choices
Model 3a Model 3b
Model Specification Mixed Logit
(robust SE)
Conditional Logit
(clustered SE)
Dependent Variable:
Worst Firm
Coeff.
(SE) AME
AME
90% CI
Coeff.
(SE) AME
AME
90% CI
Average patent portfolio -.393**
(.126) -.056
-.086
-.033
-.391***
(.101) -.071
-.103
-.046
Large patent portfolio -.931***
(.113) -.122
-.146
-.097
-.729***
(.084) -.128
-.151
-.105
Half of all product-related
inventions patented
.228
(.179) .033
-.012
.069
.057
(.138) .011
-.035
-.050
Nearly all product-related
inventions patented
-.747***
(.174) -.094
-.137
-.046
-.624***
(.137) -.106
-.145
-.070
Some contributions to open
standards
-.296**
(.101) -.041
-.067
-.016
-.200*
(.079) -.036
-.059
-.012
Many contributions to open
standards
-.594***
(.109) -.081
-.104
-.052
-.511***
(.086) -.089
-.114
-.058
Among early followers to
market
1.527***
(.127) -.222
-.249
-.190
-1.184***
(.088) -.225
-.249
-.204
Among first movers to
market
1.822***
(.147) -.254
-.283
-.212
-1.384***
(.106) -.257
-.285
-.223
Good marketing, sales, and
service quality
1.283***
(.128) -.186
-.216
-.158
-1.023***
(.095) -.192
-.223
-.165
Excellent marketing, sales,
and service quality
1.667***
(.165) -.227
-.258
-.194
-1.227***
(.119) -.225
-.250
-.186
McFadden’s Pseudo-R² .1947 .1642
Persons / Observations 319 7,926 319 7,926
LL -2,337.4 -2,425.9
Wald test (p-value) 291.24
(.000)
387.70
(.000)
a Standard errors are in parentheses. AME: average marginal effect.* p < 0.1; ** p < 0.01; *** p < 0.001
29
Figure 1.Choice Experiment as Presented to Survey Participants
30
Figure 2. Average Marginal Effects Model 1a – Full Ranking
Patent portfolio**
(reference: small)
Patented product-related
inventions**
(reference: only a few)
Open standard
contributions**
(reference: only a few)
Lead time advantages*
(reference: among last followers)
Marketing, sales and
service quality**
(reference: acceptable)
0.00 0.10 0.20 0.25 Good
Excellent 0.149
early followers
first movers 0.196
0.237
Some Many 0.048
0.113
Nearly all 0.009
0.111
Average Large
0.046 0.134
Half of all
Effect not significantly different from zero at the 10% level
0.229
Attribute levels significantly
different at the:
*10% level, **5% level
Among Among
Effect significantly different from zero at the 5% level
Effect significantly different from zero at the 10% level
31
Figure 3. Average Marginal Effects – Best Company, Model 2a
Figure 4: Average Marginal Effects – Worst Company, Model 3a
Patent portfolio*
(reference: small)
Patented product-related
inventions**
(reference: only a few)
Open standard contributions (reference: only a few)
Lead time advantages (reference: among last followers)
Marketing, sales and service quality (reference: acceptable)
-0.20 -0.10
-0.094
-0.056
0.033 Half of all
Nearly all
-0.081
-0.041
-0.254
-0.222
-0.227
-0.186
-0.122
Many
Some
Among early followers
Among first movers
Excellent
Good
0.00 -0.25
Large
Average
Attribute levels significantly
different at the:
*10% level, **5% level
Effect not significantly different from zero at the 10% level Effect significantly different from zero at the 5% level
Effect significantly different from zero at the 10% level
-0.002
Patent portfolio**
(reference: small)
Patented product-related
inventions**
(ref.:only a few)
Open standard
contributions**
(reference: only a few)
Lead time advantages (reference: among last followers)
Marketing, sales and
service quality**
(reference: acceptable)
-0.05 0.00 0.10 0.20 0.25
Excellent Good
0.233 0.121
Among first movers Among early followers 0.230
Many Some
0.136 0.056
Nearly all 0.098
Large Average
0.149 0.049
Half of all
0.246