Embed Size (px)
Citation preview

Progility plc
ANNUAL REPORT 2016
Company No. 03525870
Page 2 Company No. 03525870 Progility Annual Report and Accounts for the year to 30 June 2016
CONTENTS PAGES
Our Performance
Chairman’s statement 3
Strategic Report 4
Governance
Board of directors 11
Directors’ report 12
Remuneration report 15
Corporate governance 17
Independent auditor’s report 20
Financial statements
Consolidated statement of comprehensive income 22
Consolidated statement of financial position 23
Company statement of financial position 24
Consolidated cash flow statement 25
Company cash flow statement 26
Consolidated statement of changes in equity 27
Company statement of changes in equity 28
Notes to the financial statements 29
Shareholder Information
Notice of Annual General Meeting 68
Company No. 03525870 Progility Annual Report and Accounts for the year to 30 June 2016 Page 3
Progility plc (“Progility”) is the holding company of a systems integration and project management services group which has been created
to provide a range of project management services including innovative and market leading technology solutions.
Chairman’s Statement
I am pleased to present Progility’s results for the twelve months to 30 June 2016. Early in the period we reconsidered the basis upon
which we reported our results as we evolved into a more stable set of businesses. Although our focus remains to apply our expertise as a
broadly based project management services group we are now very focused on achieving efficient and effective operations within three
distinct areas – Professional Services, (comprising our training and recruitment businesses), Healthcare (comprising Starkstrom) and
Communications (comprising our technology businesses in India and Australia). Wherever possible we will seek to exploit opportunities
to combine activities across these segments and across geographies, but during the period under review the focus has been on improving
the cost effectiveness and overall efficiency of the separate segments and to instil a much more rigorous approach to all aspects of our
business.
During the year we have therefore incurred some additional cost in implementing change, both in reducing Corporate headcount and also
in closing certain activities which were not and are no longer expected to generate an acceptable return.
Financial Performance
Overall revenue was £61.6 million from continuing operations, which represented growth of 3%, from continuing operations, over the
prior year. Within this we saw a reduction in sales in both Professional Services and Healthcare but strong revenue growth in
Communications operations, primarily as a result of consolidating a full year of results from India. An operating loss of £0.1 million from
continuing operations, before highlighted items, was clearly disappointing but in arriving at this we have absorbed a significant level of
cost in implementing changes to our operational cost base and in headcount reduction.
The overall reported post tax loss for the year was £2.7 million which is after interest charges of £3.0 million, a write down of goodwill in
Australia of £0.6 million and a credit of £2.0 million arising from the release of provisions on our Indian acquisition.
Our strategic report on page 4 contains more detailed commentary on our three business areas.
Management and the Board
During the year we have seen a number of changes to the Board. At the end of July 2015, Donald Stewart left the company, some three
years after joining Progility, to pursue his own professional practice and become more involved as a non-executive with a range of
companies. Hugh Cawley, our CFO, left the Company at the end of March 2016 after a year with the Group. We have strengthened the
finance function within our operating segments and have not therefore considered it necessary to have a CFO on the Board at this time.
We continue to keep this situation under review. We are grateful to both Donald and Hugh for their efforts on behalf of the Group.
Outside the Board we have made additions to senior management, in particular in Australia where Campbell Johnson joined in September
2015, and is already making great strides in changing the performance of our Australian activities. He is also providing his expertise
elsewhere in the Group, particularly at Starkstrom, to drive efficiencies in the business.
Prospects
The focus will remain, in the year ahead, on embedding greater efficiency into our operating units. We have made the changes to enable
this to happen and expect our future performance to improve. We will ensure that future growth is both sustainable and profitable. We
believe that there are significant opportunities for our businesses to develop and expect a more positive outcome this year.
Wayne Bos
Executive Chairman
7 October 2016
Page 4 Company No. 03525870 Progility Annual Report and Accounts for the year to 30 June 2016
Strategic Report
Progility plc - Overview
The Progility Group now comprises three business segments Professional Services, (comprising the training and recruitment businesses),
Healthcare (comprising Starkstrom) and Communications (comprising our technology businesses in India and Australia). This move from a
historically geographic segment approach reflects our more stable set of businesses. Using this spread of skills and the geographic reach
of our businesses it is still the intention, where opportunities arise, to create solutions for both using the skills and resources of our three
segments to deliver project management solutions. However, the focus in the period under review has been to implement the necessary
changes to our cost base and to our operational practices to achieve more acceptable returns in the future.
The group will continue to be run as a portfolio, making additions and disposals when the opportunity to generate above average returns
arises. The current period saw no acquisitions or disposals.
Principal activity and business review
The principal activities of the Group during the period, as outlined above, are Professional Services, Healthcare and Communications.
Corporate Management and segmental reporting
The Group’s global headquarters remain in central London to suit the diverse needs of the various businesses within the Group.
Our executive management team comprises highly capable managers within sales, finance and operations. The team has evolved to
become an effective operation, able to deliver across their respective geographical client base. Their combined experience covers both
large and medium sized entities and includes: systems integration, consulting, business development, sales, classroom and e-learning,
digital transformation, financial control and operating in a public company environment. Our executive team are experienced in mergers
and acquisitions, business integration and business improvement.
Our business is managed through three business segments to maximize our ability to communicate and to deliver our full range of
products and expertise to our key clients’ decision makers across the diverse territories and time zones in which we operate. These three
segments reflect the management responsibility and accounting arrangements used to manage and report upon the performance of the
business.
Key performance indicators (KPI’s) for each business are revenue, gross profit margin and earnings before interest, taxation, depreciation
and amortisation (EBITDA).
The Group’s chief operating decision maker remains the Executive Chairman who reviews and considers these reports at the formal board
meetings.
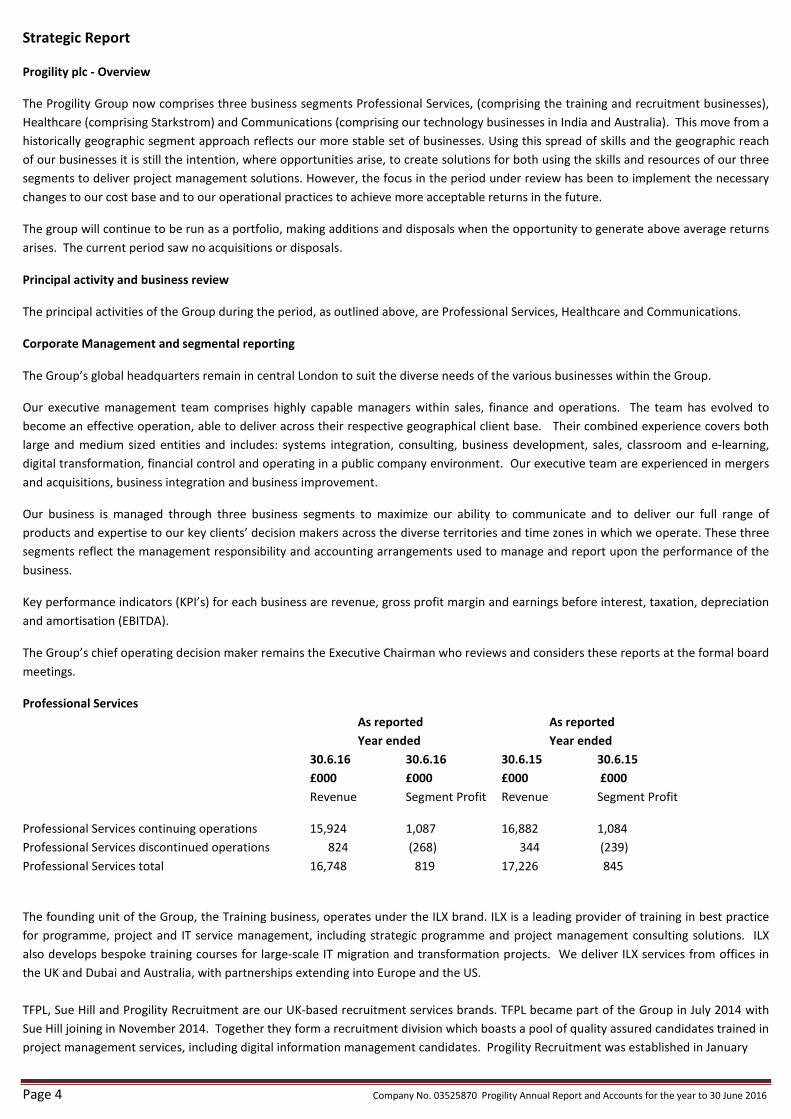
Professional Services
As reported As reported
Year ended Year ended
30.6.16 30.6.16 30.6.15 30.6.15
£000 £000 £000 £000
Revenue Segment Profit Revenue Segment Profit
Professional Services continuing operations 15,924 1,087 16,882 1,084
Professional Services discontinued operations 824 (268) 344 (239)
Professional Services total 16,748 819 17,226 845
The founding unit of the Group, the Training business, operates under the ILX brand. ILX is a leading provider of training in best practice
for programme, project and IT service management, including strategic programme and project management consulting solutions. ILX
also develops bespoke training courses for large-scale IT migration and transformation projects. We deliver ILX services from offices in
the UK and Dubai and Australia, with partnerships extending into Europe and the US.
TFPL, Sue Hill and Progility Recruitment are our UK-based recruitment services brands. TFPL became part of the Group in July 2014 with
Sue Hill joining in November 2014. Together they form a recruitment division which boasts a pool of quality assured candidates trained in
project management services, including digital information management candidates. Progility Recruitment was established in January
Company No. 03525870 Progility Annual Report and Accounts for the year to 30 June 2016 Page 5
Strategic Report (continued)
Professional Services (continued)
2014 to offer specific project management recruitment services. Obrar is a consulting-led project management services company, with
over 30 years' experience of delivering technology and people solutions in the UK and internationally. Obrar focuses on multimedia-
driven contact centres, corporate technology infrastructure and associated operational change management. Woodspeen Training works
with individuals and companies across a range of occupational areas, led by an experienced team of advisors and trainers, operating from
seven locations across the UK, enhancing young people’s skills and helping them into work.
Overall revenue of this segment fell by just under 3%, though we were able to maintain profit margins in line with the previous year, such
that the decline in segment profit was also 3%. However, taking into account the closure of the southern operations of Woodspeen,
which is treated as a discontinued activity, underlying operating margins have materially improved.
During the year the ILX training business achieved revenue almost in line with the prior year with slightly improved operating margins.
This year has been a transitory one for the business with its new Managing Director, who was appointed just before this period,
transforming the management team and implementing steps to improve operational efficiency and marketing effectiveness.
The recruitment business, which specialises in both temporary and permanent resources in information management, has had a
challenging year with differing performance across the various industry categories of our clients.
Woodspeen, for which this is the first full year under our ownership, has contributed strongly to revenue, but also made only a modest
contribution to profit, as a result of the cost of reorganising the business to deliver our learning courses efficiently and effectively. This
involved ceasing providing training in the south of the UK, disclosed as discontinued operations above, and in note 11 to the accounts.
We see significant opportunities to grow this business which addresses an important area for both government and the wider community
in getting people equipped to work.
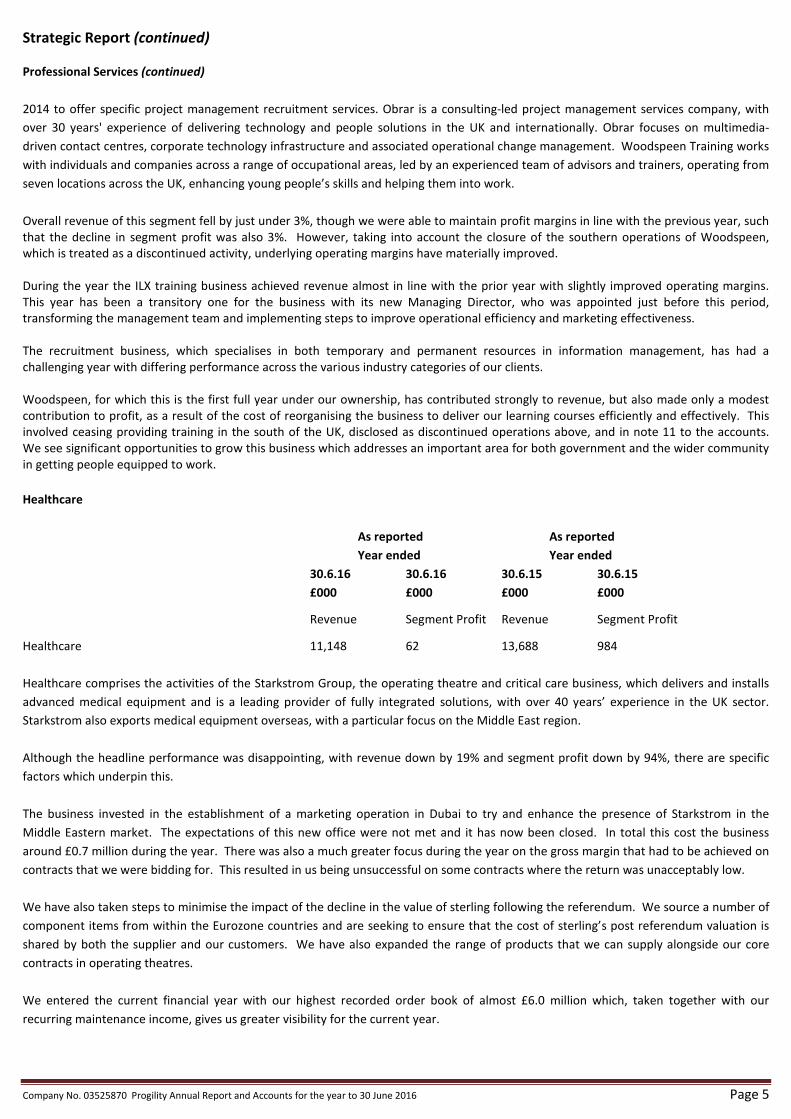
Healthcare
As reported As reported
Year ended Year ended
30.6.16 30.6.16 30.6.15 30.6.15
£000 £000 £000 £000
Revenue Segment Profit Revenue Segment Profit
Healthcare 11,148 62 13,688 984
Healthcare comprises the activities of the Starkstrom Group, the operating theatre and critical care business, which delivers and installs
advanced medical equipment and is a leading provider of fully integrated solutions, with over 40 years’ experience in the UK sector.
Starkstrom also exports medical equipment overseas, with a particular focus on the Middle East region.
Although the headline performance was disappointing, with revenue down by 19% and segment profit down by 94%, there are specific
factors which underpin this.
The business invested in the establishment of a marketing operation in Dubai to try and enhance the presence of Starkstrom in the
Middle Eastern market. The expectations of this new office were not met and it has now been closed. In total this cost the business
around £0.7 million during the year. There was also a much greater focus during the year on the gross margin that had to be achieved on
contracts that we were bidding for. This resulted in us being unsuccessful on some contracts where the return was unacceptably low.
We have also taken steps to minimise the impact of the decline in the value of sterling following the referendum. We source a number of
component items from within the Eurozone countries and are seeking to ensure that the cost of sterling’s post referendum valuation is
shared by both the supplier and our customers. We have also expanded the range of products that we can supply alongside our core
contracts in operating theatres.
We entered the current financial year with our highest recorded order book of almost £6.0 million which, taken together with our
recurring maintenance income, gives us greater visibility for the current year.
Page 6 Company No. 03525870 Progility Annual Report and Accounts for the year to 30 June 2016
Strategic Report (continued)
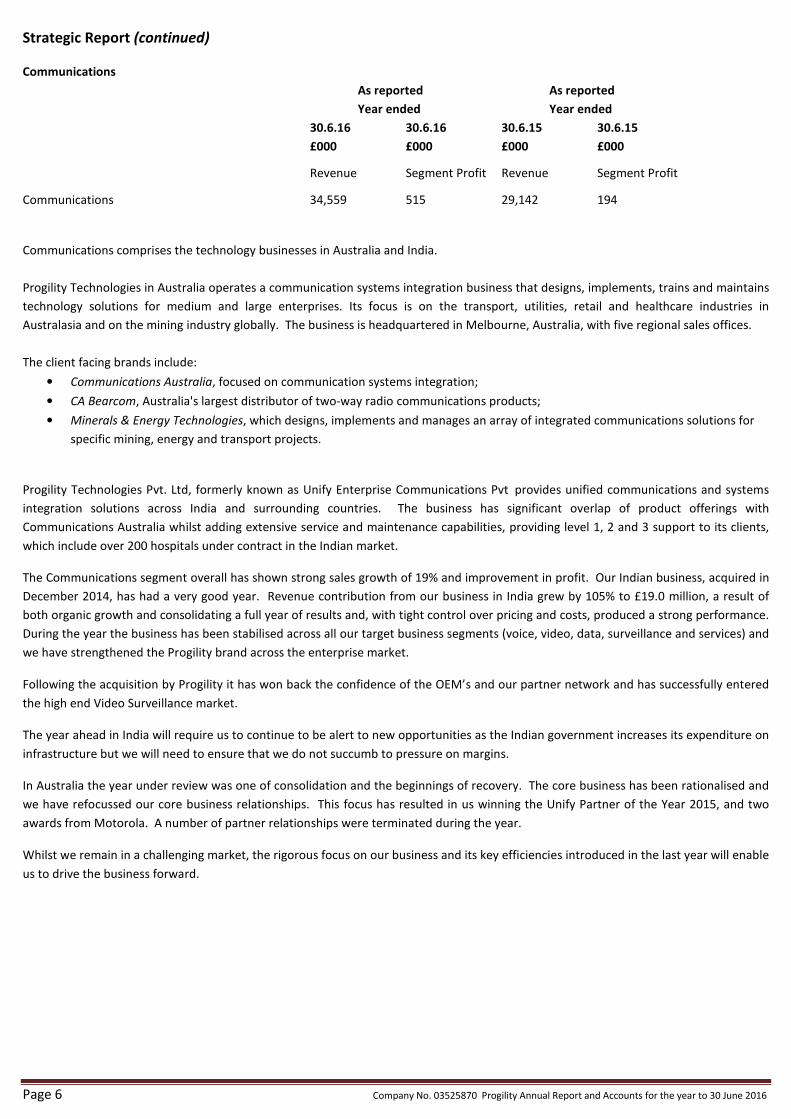
Communications
As reported As reported
Year ended Year ended
30.6.16 30.6.16 30.6.15 30.6.15
£000 £000 £000 £000
Revenue Segment Profit Revenue Segment Profit
Communications 34,559 515 29,142 194
Communications comprises the technology businesses in Australia and India.
Progility Technologies in Australia operates a communication systems integration business that designs, implements, trains and maintains
technology solutions for medium and large enterprises. Its focus is on the transport, utilities, retail and healthcare industries in
Australasia and on the mining industry globally. The business is headquartered in Melbourne, Australia, with five regional sales offices.
The client facing brands include:
• Communications Australia, focused on communication systems integration;
• CA Bearcom, Australia's largest distributor of two-way radio communications products;
• Minerals & Energy Technologies, which designs, implements and manages an array of integrated communications solutions for
specific mining, energy and transport projects.
Progility Technologies Pvt. Ltd, formerly known as Unify Enterprise Communications Pvt provides unified communications and systems
integration solutions across India and surrounding countries. The business has significant overlap of product offerings with
Communications Australia whilst adding extensive service and maintenance capabilities, providing level 1, 2 and 3 support to its clients,
which include over 200 hospitals under contract in the Indian market.
The Communications segment overall has shown strong sales growth of 19% and improvement in profit. Our Indian business, acquired in
December 2014, has had a very good year. Revenue contribution from our business in India grew by 105% to £19.0 million, a result of
both organic growth and consolidating a full year of results and, with tight control over pricing and costs, produced a strong performance.
During the year the business has been stabilised across all our target business segments (voice, video, data, surveillance and services) and
we have strengthened the Progility brand across the enterprise market.
Following the acquisition by Progility it has won back the confidence of the OEM’s and our partner network and has successfully entered
the high end Video Surveillance market.
The year ahead in India will require us to continue to be alert to new opportunities as the Indian government increases its expenditure on
infrastructure but we will need to ensure that we do not succumb to pressure on margins.
In Australia the year under review was one of consolidation and the beginnings of recovery. The core business has been rationalised and
we have refocussed our core business relationships. This focus has resulted in us winning the Unify Partner of the Year 2015, and two
awards from Motorola. A number of partner relationships were terminated during the year.
Whilst we remain in a challenging market, the rigorous focus on our business and its key efficiencies introduced in the last year will enable
us to drive the business forward.
Company No. 03525870 Progility Annual Report and Accounts for the year to 30 June 2016 Page 7
Strategic Report (continued)
Developing our businesses’ talent
In order to develop the inherent capability of the businesses, we have created a structure which promotes talent, and allows rapid
communication within our business. We look constantly for opportunities to strengthen the capability further, thus ensuring we have
sufficient capacity to develop the business, and over the past year have enjoyed some success in securing appropriately qualified senior
talent. The regional structure which we operate is a platform for our experienced executives to take the business forward. We shall
continue to provide a rewarding and stimulating environment to make Progility a truly competitive force in the market place. Obtaining
the best talent to strengthen capability will remain a challenge, particularly as the wider economy improves and intensifies competition
for good people.
By strengthening our project management services capabilities and with a widened product technology portfolio, the Group will continue
to:
• Expand our consultancy and technology solutions services actively in the UK and Europe, the Middle East, Africa, and Australasia
applying our core skills to underpin this activity;
• Promote our skills in industries where we already provide products and services, particularly to the healthcare and communications
sectors;
• Exploit our market leading position in the provision of project management training to build complementary offerings; and
• Provide recruitment services that complement our project management activities and help foster deeper relationships with our
clients in other functions.
The Board believes that there is a significant opportunity to create value through building on its customer contacts, intellectual property
and the further development of those assets. We believe that we have the capability to provide a wider range of project related services
to our clients and that we can cross-sell opportunities in different areas to clients who have hitherto engaged with the Group in only a
limited way. Additionally, as we have stated before, we will continue our search for new opportunities to develop the business and add
companies which complement our skills and broaden our sector reach to our portfolio of brands, skills and geographies.
Performance Management
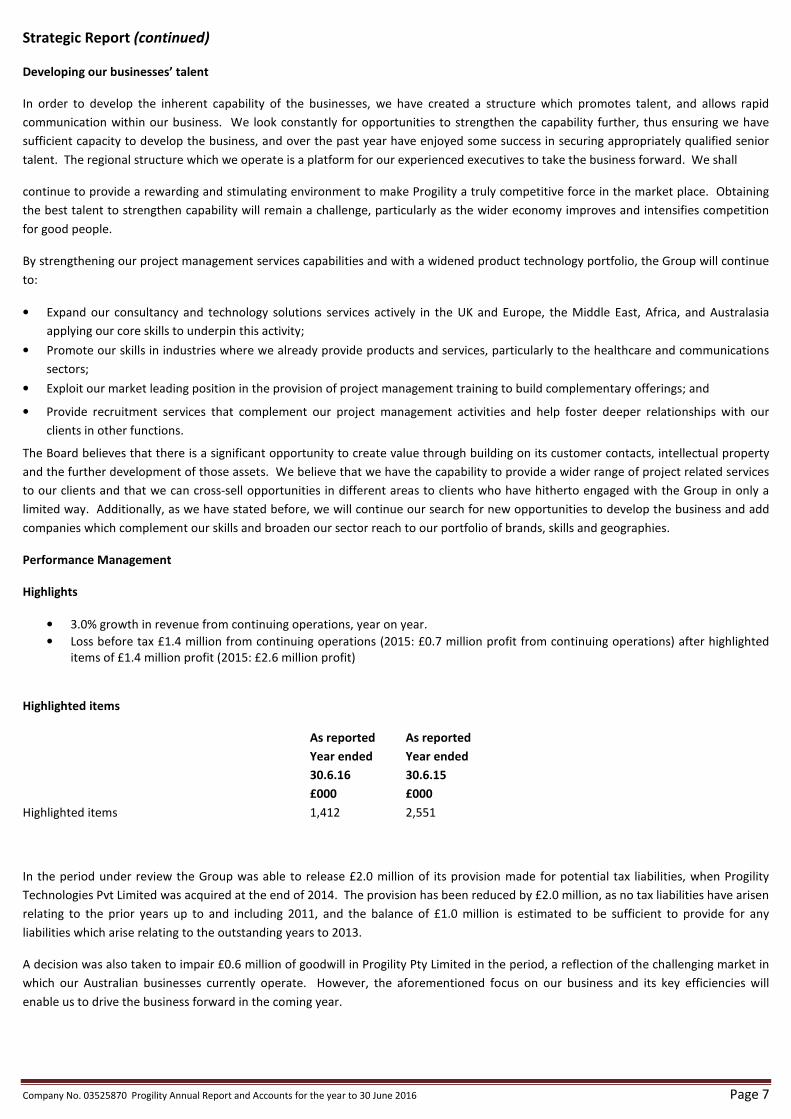
Highlights
• 3.0% growth in revenue from continuing operations, year on year.
• Loss before tax £1.4 million from continuing operations (2015: £0.7 million profit from continuing operations) after highlighted
items of £1.4 million profit (2015: £2.6 million profit)
Highlighted items
As reported As reported
Year ended Year ended
30.6.16 30.6.15
£000 £000
Highlighted items 1,412 2,551
In the period under review the Group was able to release £2.0 million of its provision made for potential tax liabilities, when Progility
Technologies Pvt Limited was acquired at the end of 2014. The provision has been reduced by £2.0 million, as no tax liabilities have arisen
relating to the prior years up to and including 2011, and the balance of £1.0 million is estimated to be sufficient to provide for any
liabilities which arise relating to the outstanding years to 2013.
A decision was also taken to impair £0.6 million of goodwill in Progility Pty Limited in the period, a reflection of the challenging market in
which our Australian businesses currently operate. However, the aforementioned focus on our business and its key efficiencies will
enable us to drive the business forward in the coming year.
Page 8 Company No. 03525870 Progility Annual Report and Accounts for the year to 30 June 2016
Strategic Report (continued)
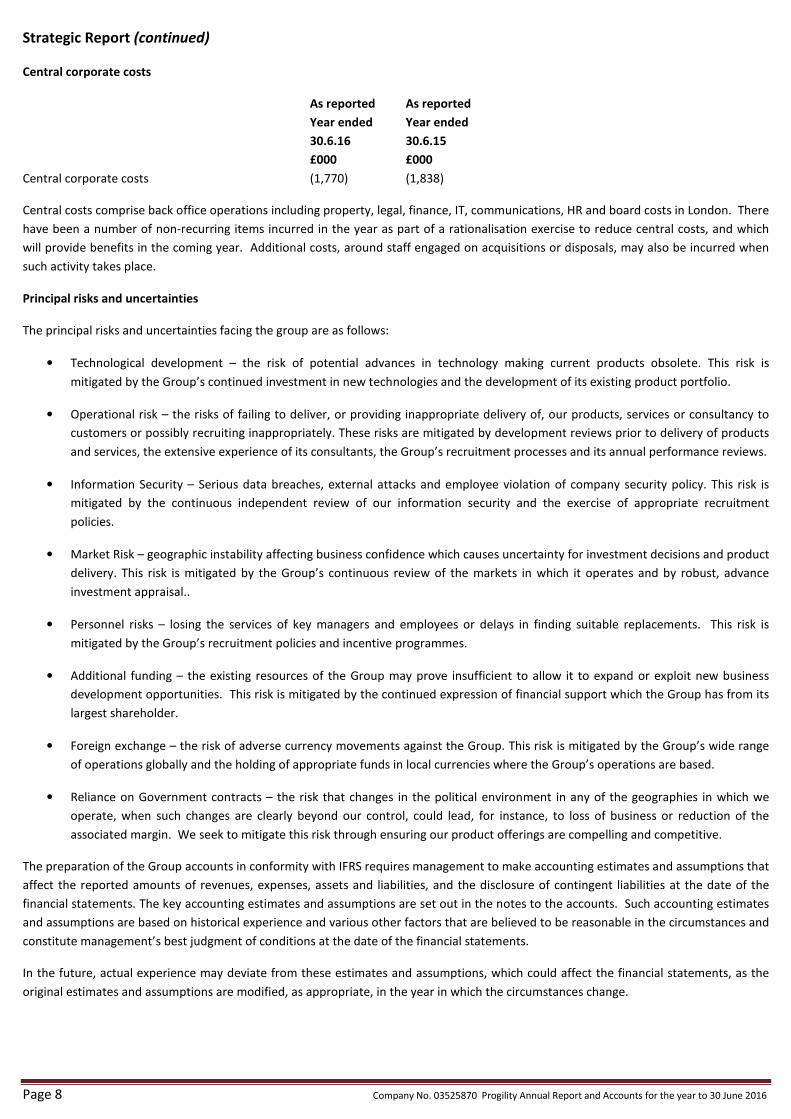
Central corporate costs
As reported As reported
Year ended Year ended
30.6.16 30.6.15
£000 £000
Central corporate costs (1,770) (1,838)
Central costs comprise back office operations including property, legal, finance, IT, communications, HR and board costs in London. There
have been a number of non-recurring items incurred in the year as part of a rationalisation exercise to reduce central costs, and which
will provide benefits in the coming year. Additional costs, around staff engaged on acquisitions or disposals, may also be incurred when
such activity takes place.
Principal risks and uncertainties
The principal risks and uncertainties facing the group are as follows:
• Technological development – the risk of potential advances in technology making current products obsolete. This risk is
mitigated by the Group’s continued investment in new technologies and the development of its existing product portfolio.
• Operational risk – the risks of failing to deliver, or providing inappropriate delivery of, our products, services or consultancy to
customers or possibly recruiting inappropriately. These risks are mitigated by development reviews prior to delivery of products
and services, the extensive experience of its consultants, the Group’s recruitment processes and its annual performance reviews.
• Information Security – Serious data breaches, external attacks and employee violation of company security policy. This risk is
mitigated by the continuous independent review of our information security and the exercise of appropriate recruitment
policies.
• Market Risk – geographic instability affecting business confidence which causes uncertainty for investment decisions and product
delivery. This risk is mitigated by the Group’s continuous review of the markets in which it operates and by robust, advance
investment appraisal..
• Personnel risks – losing the services of key managers and employees or delays in finding suitable replacements. This risk is
mitigated by the Group’s recruitment policies and incentive programmes.
• Additional funding – the existing resources of the Group may prove insufficient to allow it to expand or exploit new business
development opportunities. This risk is mitigated by the continued expression of financial support which the Group has from its
largest shareholder.
• Foreign exchange – the risk of adverse currency movements against the Group. This risk is mitigated by the Group’s wide range
of operations globally and the holding of appropriate funds in local currencies where the Group’s operations are based.
• Reliance on Government contracts – the risk that changes in the political environment in any of the geographies in which we
operate, when such changes are clearly beyond our control, could lead, for instance, to loss of business or reduction of the
associated margin. We seek to mitigate this risk through ensuring our product offerings are compelling and competitive.
The preparation of the Group accounts in conformity with IFRS requires management to make accounting estimates and assumptions that
affect the reported amounts of revenues, expenses, assets and liabilities, and the disclosure of contingent liabilities at the date of the
financial statements. The key accounting estimates and assumptions are set out in the notes to the accounts. Such accounting estimates
and assumptions are based on historical experience and various other factors that are believed to be reasonable in the circumstances and
constitute management’s best judgment of conditions at the date of the financial statements.
In the future, actual experience may deviate from these estimates and assumptions, which could affect the financial statements, as the
original estimates and assumptions are modified, as appropriate, in the year in which the circumstances change.
Company No. 03525870 Progility Annual Report and Accounts for the year to 30 June 2016 Page 9
Strategic Report (continued)
Financial Review
Operating performance
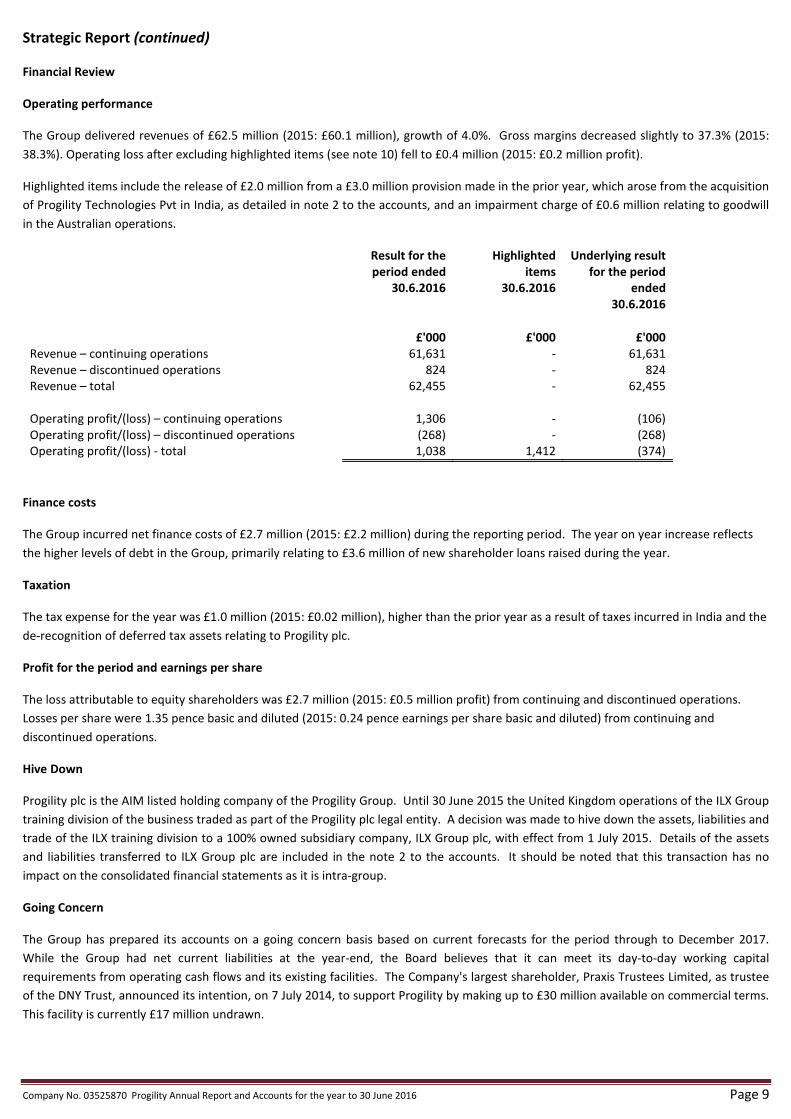
The Group delivered revenues of £62.5 million (2015: £60.1 million), growth of 4.0%. Gross margins decreased slightly to 37.3% (2015:
38.3%). Operating loss after excluding highlighted items (see note 10) fell to £0.4 million (2015: £0.2 million profit).
Highlighted items include the release of £2.0 million from a £3.0 million provision made in the prior year, which arose from the acquisition
of Progility Technologies Pvt in India, as detailed in note 2 to the accounts, and an impairment charge of £0.6 million relating to goodwill
in the Australian operations.
Result for the
period ended
30.6.2016
Highlighted
items
30.6.2016
Underlying result
for the period
ended
30.6.2016
£'000 £'000 £'000
Revenue – continuing operations 61,631 - 61,631
Revenue – discontinued operations 824 - 824
Revenue – total 62,455 - 62,455
Operating profit/(loss) – continuing operations 1,306 - (106)
Operating profit/(loss) – discontinued operations (268) - (268)
Operating profit/(loss) - total 1,038 1,412 (374)
Finance costs
The Group incurred net finance costs of £2.7 million (2015: £2.2 million) during the reporting period. The year on year increase reflects
the higher levels of debt in the Group, primarily relating to £3.6 million of new shareholder loans raised during the year.
Taxation
The tax expense for the year was £1.0 million (2015: £0.02 million), higher than the prior year as a result of taxes incurred in India and the
de-recognition of deferred tax assets relating to Progility plc.
Profit for the period and earnings per share
The loss attributable to equity shareholders was £2.7 million (2015: £0.5 million profit) from continuing and discontinued operations.
Losses per share were 1.35 pence basic and diluted (2015: 0.24 pence earnings per share basic and diluted) from continuing and
discontinued operations.
Hive Down
Progility plc is the AIM listed holding company of the Progility Group. Until 30 June 2015 the United Kingdom operations of the ILX Group
training division of the business traded as part of the Progility plc legal entity. A decision was made to hive down the assets, liabilities and
trade of the ILX training division to a 100% owned subsidiary company, ILX Group plc, with effect from 1 July 2015. Details of the assets
and liabilities transferred to ILX Group plc are included in the note 2 to the accounts. It should be noted that this transaction has no
impact on the consolidated financial statements as it is intra-group.
Going Concern
The Group has prepared its accounts on a going concern basis based on current forecasts for the period through to December 2017.
While the Group had net current liabilities at the year-end, the Board believes that it can meet its day-to-day working capital
requirements from operating cash flows and its existing facilities. The Company's largest shareholder, Praxis Trustees Limited, as trustee
of the DNY Trust, announced its intention, on 7 July 2014, to support Progility by making up to £30 million available on commercial terms.
This facility is currently £17 million undrawn.
Page 10 Company No. 03525870 Progility Annual Report and Accounts for the year to 30 June 2016
Strategic Report (continued)
Financial Review (continued)
Cash flow, net debt and facilities
Cash flow
Cash generated from operating activities was £1.8 million (2015: £1.3 million). The Group generates operating cash flow from its product
sales, maintenance contracts and from advance payments from customers.
The Group paid £0.6 million in income tax during the period of reporting (2015: £0.4 million paid).
The Group continues to invest in its staff development, its product range and also incurred capital expenditure in the period relating to
updates of intellectual property assets, product development and its internal systems and equipment to improve operating efficiency.
Net debt and facilities
At the balance sheet date the Group’s debt comprised loans and overdrafts due within one year of £1.2 million (2015: £3.3 million) and
£18.5 million (2015: £14.8 million) falling due in over one year. Of these amounts a total of £18.8 million represents shareholder loans
made up of £0.4 million of convertible loan notes and £18.4 million of other notes.
Net debt at the year end, defined as all bank and third party debt, less cash at bank, excluding shareholder loans was an asset of £2.8m
million (2015: asset of £0.6 million). This comprised: £3.6 million in cash balances, less £0.8 million in invoice discounting facilities.
Dividend
As noted above, it is the Board’s objective to invest to grow the Group’s business. That ambition, together with a lack of distributable
reserves militates against the payment of a dividend for the period ended 30 June 2016. As the Board intends that income generated by
the Group will generally be re-invested to implement the Group’s growth strategy this is likely to remain the position for the foreseeable
future.
Post balance sheet events
There have been no post balance sheet events which would affect the overview of the Group provided by these statements.
On behalf of the Board
Wayne Bos
Executive Chairman
7 October 2016
Company No. 03525870 Progility Annual Report and Accounts for the year to 30 June 2016 Page 11
Governance
Board of Directors
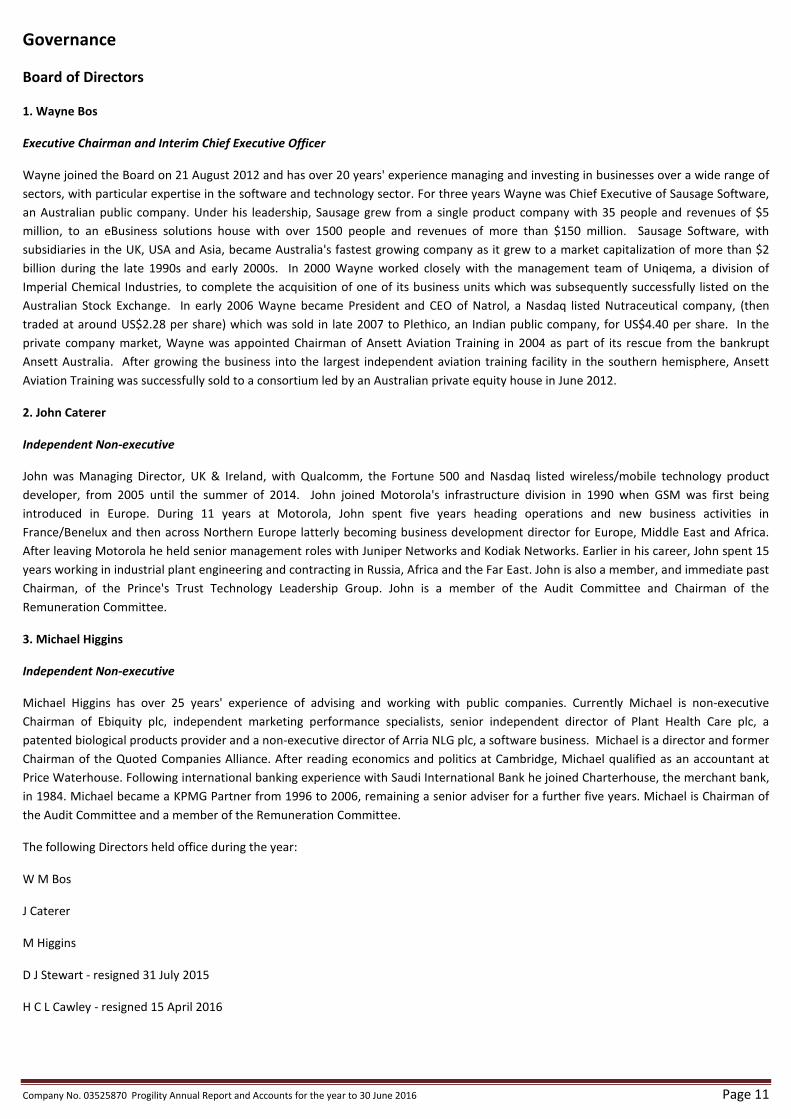
1. Wayne Bos
Executive Chairman and Interim Chief Executive Officer
Wayne joined the Board on 21 August 2012 and has over 20 years' experience managing and investing in businesses over a wide range of
sectors, with particular expertise in the software and technology sector. For three years Wayne was Chief Executive of Sausage Software,
an Australian public company. Under his leadership, Sausage grew from a single product company with 35 people and revenues of $5
million, to an eBusiness solutions house with over 1500 people and revenues of more than $150 million. Sausage Software, with
subsidiaries in the UK, USA and Asia, became Australia's fastest growing company as it grew to a market capitalization of more than $2
billion during the late 1990s and early 2000s. In 2000 Wayne worked closely with the management team of Uniqema, a division of
Imperial Chemical Industries, to complete the acquisition of one of its business units which was subsequently successfully listed on the
Australian Stock Exchange. In early 2006 Wayne became President and CEO of Natrol, a Nasdaq listed Nutraceutical company, (then
traded at around US$2.28 per share) which was sold in late 2007 to Plethico, an Indian public company, for US$4.40 per share. In the
private company market, Wayne was appointed Chairman of Ansett Aviation Training in 2004 as part of its rescue from the bankrupt
Ansett Australia. After growing the business into the largest independent aviation training facility in the southern hemisphere, Ansett
Aviation Training was successfully sold to a consortium led by an Australian private equity house in June 2012.
2. John Caterer
Independent Non-executive
John was Managing Director, UK & Ireland, with Qualcomm, the Fortune 500 and Nasdaq listed wireless/mobile technology product
developer, from 2005 until the summer of 2014. John joined Motorola's infrastructure division in 1990 when GSM was first being
introduced in Europe. During 11 years at Motorola, John spent five years heading operations and new business activities in
France/Benelux and then across Northern Europe latterly becoming business development director for Europe, Middle East and Africa.
After leaving Motorola he held senior management roles with Juniper Networks and Kodiak Networks. Earlier in his career, John spent 15
years working in industrial plant engineering and contracting in Russia, Africa and the Far East. John is also a member, and immediate past
Chairman, of the Prince's Trust Technology Leadership Group. John is a member of the Audit Committee and Chairman of the
Remuneration Committee.
3. Michael Higgins
Independent Non-executive
Michael Higgins has over 25 years' experience of advising and working with public companies. Currently Michael is non-executive
Chairman of Ebiquity plc, independent marketing performance specialists, senior independent director of Plant Health Care plc, a
patented biological products provider and a non-executive director of Arria NLG plc, a software business. Michael is a director and former
Chairman of the Quoted Companies Alliance. After reading economics and politics at Cambridge, Michael qualified as an accountant at
Price Waterhouse. Following international banking experience with Saudi International Bank he joined Charterhouse, the merchant bank,
in 1984. Michael became a KPMG Partner from 1996 to 2006, remaining a senior adviser for a further five years. Michael is Chairman of
the Audit Committee and a member of the Remuneration Committee.
The following Directors held office during the year:
W M Bos
J Caterer
M Higgins
D J Stewart - resigned 31 July 2015
H C L Cawley - resigned 15 April 2016

Page 12 Company No. 03525870 Progility Annual Report and Accounts for the year to 30 June 2016
Directors’ Report for the year ended 30 June 2016
The Directors present their report and the financial statements for the year ended 30 June 2016.
Principal activities and business review
A review of the principal activities and of trading and future developments is presented in the Chairman’s Statement on page 3 and the
Strategic Report on pages 4 to 10.
Results and dividends
The results of the Group for the year are set out on page 21. As the group continues to invest in its growth, the existing negative reserves
mean that no dividend can be declared.
Principal shareholders
At the date of this report the Company has been notified of the following shareholdings in excess of 3% of the Company’s issued share
capital:
Ordinary Shares of 10
pence each Percentage
Praxis Trustees Limited* 129,294,195 64.75
Mmilt Pty Limited 32,845,465 16.45
Cameron Investment Trust 6,516,130 3.26
*As trustee of the DNY Trust, a family trust of which Wayne Bos is a discretionary beneficiary, Praxis Trustees Limited holds 129,294,195
ordinary shares and, through DNY Investments Limited, a company which is an asset of the DNY Trust, has the right to subscribe for up to
a further 8,000,000 ordinary shares by exercising the conversion rights attached to a convertible loan notes and warrants issued by the
Company on 17 December 2012.
Going concern
The Group’s business activities, together with the factors likely to affect its future development, performance and position are set out in
the Business Review within the Strategic Report on pages 4 to 10. The financial position of the Group, its cash flows, liquidity position and
borrowing facilities are described in the Financial Review on pages 9 to 10. In addition, the notes to the financial statements include the
Group’s objectives, policies and processes for managing its capital; its financial risk management objectives; details of its financial
instruments and hedging activities; and its exposures to credit risk and liquidity risk.
Details of the Group’s funding facilities, which include invoice financing and shareholder loans, are set out in the notes to the accounts.
The Group’s forecasts and projections, taking account of reasonably foreseeable changes in trading performance, show that the Group
should be able to operate within the level of its current facilities. Through discussions with its loan note holders and principal bankers
and lenders, the Directors, after making enquiries, have concluded that they have a reasonable expectation that the Company and the
Group will have adequate resources to continue in operational existence for the foreseeable future. Accordingly, they continue to adopt
the going concern basis in preparing the annual report and financial statements. Further information on going concern is included in the
Notes to the Financial Statements on page 29.
The financial statements do not include the adjustments that would result if the Group or Company were unable to continue as a going
concern.
Employment policies
It is the policy of the Group to consider all applicants for employment on the basis of qualification for the specific job without regard to
race, colour, religion, age, sex, sexual orientation, disability or national origin. This policy extends to all aspects of employment including
recruitment, training, compensation, career development and promotion.
Company No. 03525870 Progility Annual Report and Accounts for the year to 30 June 2016 Page 13
Directors’ Report for the year ended 30 June 2016 (continued)
Corporate social responsibility
The Group is developing a corporate responsibility programme that focuses on adding value to the communities and countries in which
we operate, looking after our environment, ensuring quality and excellence for our customers and investing in our people.
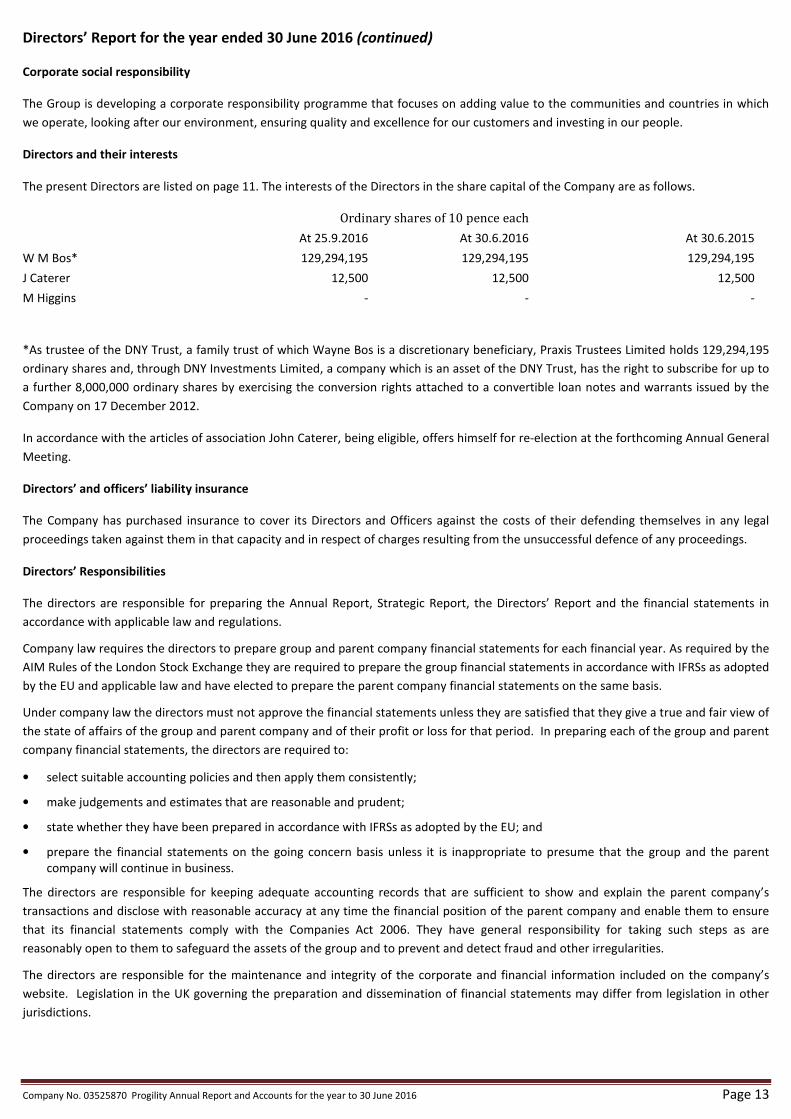
Directors and their interests
The present Directors are listed on page 11. The interests of the Directors in the share capital of the Company are as follows.
Ordinary shares of 10 pence each
At 25.9.2016 At 30.6.2016 At 30.6.2015
W M Bos* 129,294,195 129,294,195 129,294,195
J Caterer 12,500 12,500 12,500
M Higgins - - -
*As trustee of the DNY Trust, a family trust of which Wayne Bos is a discretionary beneficiary, Praxis Trustees Limited holds 129,294,195
ordinary shares and, through DNY Investments Limited, a company which is an asset of the DNY Trust, has the right to subscribe for up to
a further 8,000,000 ordinary shares by exercising the conversion rights attached to a convertible loan notes and warrants issued by the
Company on 17 December 2012.
In accordance with the articles of association John Caterer, being eligible, offers himself for re-election at the forthcoming Annual General
Meeting.
Directors’ and officers’ liability insurance
The Company has purchased insurance to cover its Directors and Officers against the costs of their defending themselves in any legal
proceedings taken against them in that capacity and in respect of charges resulting from the unsuccessful defence of any proceedings.
Directors’ Responsibilities
The directors are responsible for preparing the Annual Report, Strategic Report, the Directors’ Report and the financial statements in
accordance with applicable law and regulations.
Company law requires the directors to prepare group and parent company financial statements for each financial year. As required by the
AIM Rules of the London Stock Exchange they are required to prepare the group financial statements in accordance with IFRSs as adopted
by the EU and applicable law and have elected to prepare the parent company financial statements on the same basis.
Under company law the directors must not approve the financial statements unless they are satisfied that they give a true and fair view of
the state of affairs of the group and parent company and of their profit or loss for that period. In preparing each of the group and parent
company financial statements, the directors are required to:
• select suitable accounting policies and then apply them consistently;
• make judgements and estimates that are reasonable and prudent;
• state whether they have been prepared in accordance with IFRSs as adopted by the EU; and
• prepare the financial statements on the going concern basis unless it is inappropriate to presume that the group and the parent
company will continue in business.
The directors are responsible for keeping adequate accounting records that are sufficient to show and explain the parent company’s
transactions and disclose with reasonable accuracy at any time the financial position of the parent company and enable them to ensure
that its financial statements comply with the Companies Act 2006. They have general responsibility for taking such steps as are
reasonably open to them to safeguard the assets of the group and to prevent and detect fraud and other irregularities.
The directors are responsible for the maintenance and integrity of the corporate and financial information included on the company’s
website. Legislation in the UK governing the preparation and dissemination of financial statements may differ from legislation in other
jurisdictions.
Page 14 Company No. 03525870 Progility Annual Report and Accounts for the year to 30 June 2016
Directors’ Report for the year ended 30 June 2016 (continued)
Disclosure of information to auditor
The Directors confirm that:
• so far as each Director is aware, there is no relevant audit information of which the Company’s auditor is unaware; and
• the Directors have taken all the steps that they ought to have taken as Directors in order to make themselves aware of any relevant
audit information and to establish that the Company’s auditor is aware of that information
Auditor
KPMG LLP have been appointed as auditor of the Company. In accordance with S489 of the Companies Act 2006 a resolution proposing
that KPMG LLP be reappointed as auditor to the Company will be put to the Annual General Meeting.
Annual general meeting
The resolutions to be proposed at the Annual General Meeting will be communicated in due course.
This report was approved by the board on 7 October 2016.
On behalf of the board
Wayne Bos
Executive Chairman
Company No. 03525870 Progility Annual Report and Accounts for the year to 30 June 2016 Page 15
Remuneration Report for the period ended 30 June 2016
Remuneration policy
The objective of the Group’s remuneration policy is to attract, motivate and retain high quality individuals who will contribute
significantly to shareholder value. The remuneration committee decides on the remuneration of the Directors and other senior
executives, which comprises a basic salary, plus any or all of a car allowance, healthcare, bonus scheme, share options, and medium term
incentive plan. The Board as a whole decides the remuneration of the non-executives.
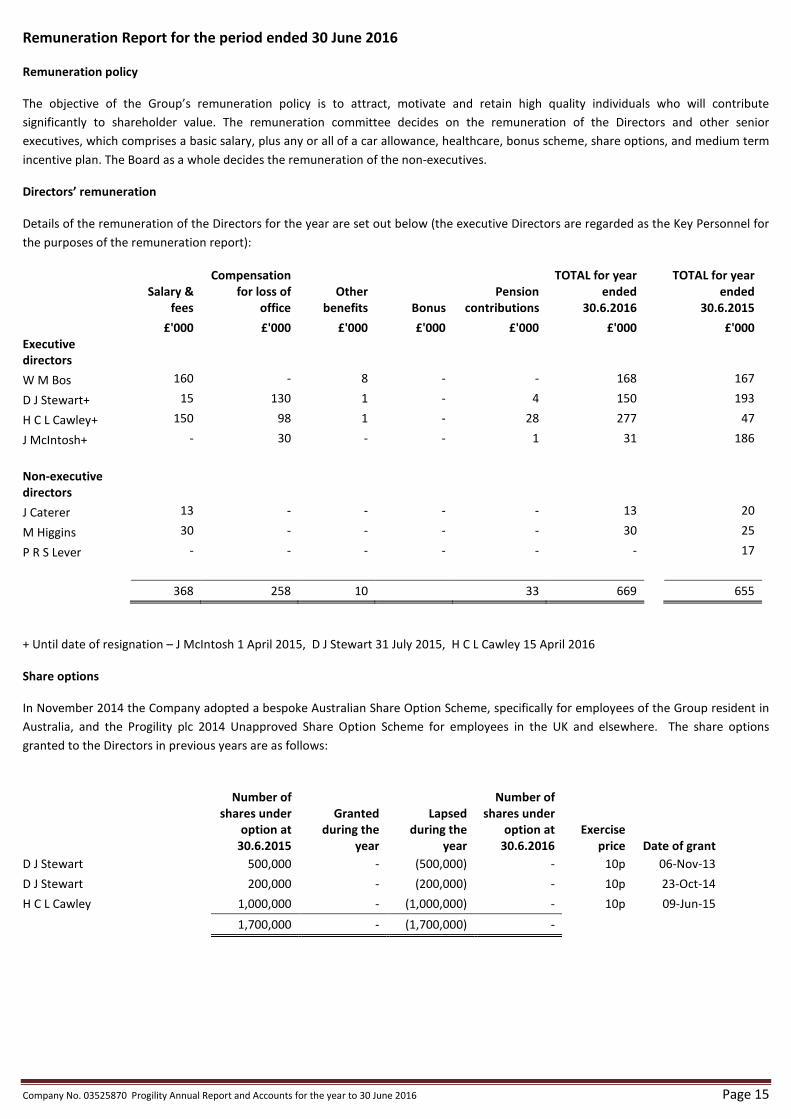
Directors’ remuneration
Details of the remuneration of the Directors for the year are set out below (the executive Directors are regarded as the Key Personnel for
the purposes of the remuneration report):
Salary &
fees
Compensation
for loss of
office
Other
benefits Bonus
Pension
contributions
TOTAL for year
ended
30.6.2016
TOTAL for year
ended
30.6.2015
£'000 £'000 £'000 £'000 £'000 £'000 £'000
Executive
directors
W M Bos 160 - 8 - - 168 167
D J Stewart+ 15 130 1 - 4 150
193
H C L Cawley+ 150 98 1 - 28 277 47
J McIntosh+ - 30 - - 1 31 186
Non-executive
directors
J Caterer 13 - - - - 13 20
M Higgins 30 - - - - 30 25
P R S Lever - - - - - - 17
368 258 10
33 669 655
+ Until date of resignation – J McIntosh 1 April 2015, D J Stewart 31 July 2015, H C L Cawley 15 April 2016
Share options
In November 2014 the Company adopted a bespoke Australian Share Option Scheme, specifically for employees of the Group resident in
Australia, and the Progility plc 2014 Unapproved Share Option Scheme for employees in the UK and elsewhere. The share options
granted to the Directors in previous years are as follows:
Number of
shares under
option at
30.6.2015
Granted
during the
year
Lapsed
during the
year
Number of
shares under
option at
30.6.2016
Exercise
price Date of grant
D J Stewart 500,000 - (500,000) - 10p 06-Nov-13
D J Stewart 200,000 - (200,000) - 10p 23-Oct-14
H C L Cawley 1,000,000 - (1,000,000) - 10p 09-Jun-15
1,700,000 - (1,700,000) -
Page 16 Company No. 03525870 Progility Annual Report and Accounts for the year to 30 June 2016
Remuneration Report for the period ended 30 June 2016 (continued)
Bonus scheme for executive Directors
The Company is considering creating a bonus scheme for the executive Directors and management, based on meeting market
expectations and operating profit margin targets. No bonuses were paid for the period under review.
Shareholder approval
In accordance with best practice in corporate governance, the Company will put a resolution to shareholders to approve the
remuneration report at the forthcoming Annual General Meeting.
This report was approved by the board on 7 October 2016.
On behalf of the board
J Caterer
Director

Company No. 03525870 Progility Annual Report and Accounts for the year to 30 June 2016 Page 17
Corporate Governance
Statement of compliance
As a Company quoted on the Alternative Investment Market (AIM) of the London Stock Exchange, the Company is not required to comply
with the UK Corporate Governance Code. However, the Directors have adopted the Quoted Companies Alliance Corporate Governance
Code for Small and Mid-Size Quoted Companies (the QCA Code). The QCA Code adopts key elements of the UK Corporate Governance
Code, current policy initiatives and other relevant guidance and applies these to the needs and particular circumstances of small and mid-
size quoted companies on a public market. The QCA Code meets the different needs of developing and growing companies.
The Directors are committed to ensuring appropriate standards of Corporate Governance are maintained by the Group and this
statement sets out how the Board has applied the QCA Code in its management of the business during the year ended 30 June 2016.
The Board recognises its collective responsibility for the long term success of the Group. It assesses business opportunities and seeks to
ensure that appropriate controls are in place to assess and manage risk. During a normal year there are up to ten scheduled Board
meetings with other meetings being arranged at shorter notice as necessary. During the period, there were eight scheduled meetings.
Meetings of the Board were attended by all Directors who were appointed at the time of the meeting. The Board agenda is set by the
Chairman in consultation with the other Directors and the Company Secretary.
The Board has a formal schedule of matters reserved to it for decision which is reviewed on an annual basis. Under the provisions of the
Company’s Articles of Association all Directors are required to offer themselves for re-election at least once every three years. In addition,
under the Articles, any Director appointed during the year will stand for election at the next following annual general meeting, ensuring
that each Board member faces re-election at regular intervals. The Directors are entitled to take independent professional advice at the
expense of the Company and have access to the advice and services of the Group’s General Counsel and Company Secretary.
The Board
The Board is ultimately responsible and accountable for the Group’s operations. During the period the Board consisted of:
Executive Directors
Wayne Bos, Executive Chairman
Non-executive Directors
John Caterer
Michael Higgins
All of the Directors have access to the advice and services of legal counsel. The Board meets regularly and agrees and monitors the
progress of a variety of Group activities. These include strategy, business plan and budgets, acquisitions, major capital expenditure and
consideration of significant financial and operational matters. The Board also monitors the exposure to key business risks and considers
legislative, environmental, employment, quality and health and safety issues. There is a written statement of matters reserved for
consideration by the Board.
During the year to 30 June 2016 the Board has been fortunate to benefit fully from the expertise of two independent non-executive
directors who broaden the experience available to the Company and who aid strong governance within the management of the Group.
The Chairman, who is responsible for running the Board, continues to assume the role of acting Chief Executive. The Board continues to
believe that this is appropriate, given the circumstances in which this situation arose, the current structure of the business, and Board’s
need to strengthen the drivers of the core business and successfully integrate the additional businesses that have been acquired. The
Chairman has continued to display a clear vision and focus for the Company’s strategy and has drawn together the disparate
characteristics, skills, qualities and experience of the other members of the Board and senior management. Highly visible in his role, he
continues to foster a positive corporate governance culture, which has permeated through the Company. In his role as acting Chief
Executive he has been instrumental in facilitating the executive management team in running the Group’s expanded business and
implementing the Group’s growth strategy.
The Board considers its current structure is appropriate for the scale of the business and enables the Group to be managed effectively. It
is keeping the need to appoint a CFO to the Board under review.
Page 18 Company No. 03525870 Progility Annual Report and Accounts for the year to 30 June 2016
Corporate Governance (continued)
The Group does not have an internal audit department, although the need for one is reviewed from time to time within the Audit
Committee framework. Non-executive Directors are subject to reappointment by the shareholders at the Annual General Meeting at
intervals of no more than three years.
Committees
The Board was supported throughout the year by an audit committee and a remuneration committee with formally delegated
responsibilities ensuring that appropriate governance procedures are followed. The audit committee comprises Michael Higgins
(chairman) and John Caterer and the remuneration committee comprises John Caterer (chairman), Michael Higgins. John Caterer also
chairs the Company risk committee. The risk committee was formed to review controls over risk, which are in place to mitigate the
Group’s exposure to, and the management of risk.
The Board has not established a nomination committee as it regards the approval and appointment of Directors (whether executive or
non-executive) as a matter for consideration by the whole board.
Audit committee
The audit committee meets at least twice a year, and typically the auditors, Chairman and CFO are also invited to attend for part of these
meetings. The committee is responsible for ensuring that the financial performance of the Group is properly monitored and reported. It
also reviews the effectiveness of the Group’s systems of internal control on a continuing basis. No significant weaknesses have been
identified. However, the committee recognises that, as the Group continues to grow, particularly internationally, internal controls will
have to be continually reviewed and updated. The audit committee is also responsible for appointing the auditors, ensuring the auditors’
independence is not compromised, and reviewing the reports on the Group from the auditors in relation to the accounts and internal
control systems.
Remuneration committee
The remuneration committee is responsible for reviewing the performance of the Executive Director and other senior executives, and for
determining the scale and structure of their remuneration packages and the basis of their service contracts, bearing in mind the interests
of shareholders. The committee also monitors performance and approves the payment of performance related bonuses and the granting
of share options.
Internal control
The QCA Code provides that the Board is responsible for putting in place and communicating a sound system to manage risk and
implement internal control.
Although no system of internal control can provide absolute assurance against material misstatement or loss, the Group’s system is
designed to provide the Directors with reasonable assurance that problems are identified on a timely basis and dealt with appropriately.
The key procedures that have been established and which are designed to provide effective internal control are as follows:
• A formal management structure with a schedule of matters specifically reserved for the Board’s approval. The Executive
Directors and other members of senior management meet regularly to control and monitor the Group’s activities.
• A strategic planning and budget setting process with both annual and longer-term forecasts reviewed and approved by the
Board.
• A comprehensive monthly financial reporting system which compares results with budgets, together with a written report
detailing current trading conditions, variations from budget and periodically updated forecasts.
• A report to the audit committee from the auditors stating any material findings arising from the audit. This report is also
considered by the Board and action taken where appropriate.
• A framework for capital expenditure and controls including authorisation procedures and rules relating to the delegation of
authority.
• Risk management policies to manage issues relating to health and safety, disaster recover`y, legal compliance, insurance and
security.
Company No. 03525870 Progility Annual Report and Accounts for the year to 30 June 2016 Page 19
Corporate Governance (continued)
Relations with shareholders
The Group places a high level of importance on communicating with its shareholders and welcomes and encourages such dialogue within
the constraints of the AIM Rules and other regulations applicable to publicly quoted companies.
Information is made available on the Company’s website in accordance with the requirements of Rule 26 of the AIM Rules for Companies.
The Company has adopted electronic communication to the fullest extent permissible and shareholders are notified when new statutory
information is available on the website. Hard copies of reports are only sent where shareholders have specifically requested their receipt.
Annual General Meeting
The date of the Company’s AGM will be communicated in due course.
Supplier payment policy
The Company and Group policy is to settle terms of payment with suppliers when agreeing the terms of each transaction, to ensure that
suppliers are made aware of the terms of payment and to abide by the terms of the payment.
Share capital
Details of the Company’s share capital and changes to the share capital are shown in note 23 to the Consolidated Financial Statements.
Website publication
The Directors are responsible for ensuring the annual report and the financial statements are made available on a website. Financial
statements are published on the Company's website (www.progility.com) in accordance with legislation and the AIM Rules. The
maintenance and integrity of the Company's website is the responsibility of the Directors. The Directors' responsibility also extends to the
integrity of the financial statements contained therein.
Charitable and political donations
Group donations to charities worldwide during the period under review were £nil (2015: £nil). No donations were made to any political
party.
This report was approved by the board on 7 October 2016.
On behalf of the board
Wayne Bos
Executive Chairman

Page 20 Company No. 03525870 Progility Annual Report and Accounts for the year to 30 June 2016
INDEPENDENT AUDITOR’S REPORT TO THE MEMBERS OF PROGILITY PLC
We have audited the financial statements of Progility plc for the year ended 30 June 2016 set out on pages 22 to 67. The financial
reporting framework that has been applied in their preparation is applicable law and International Financial Reporting Standards (IFRSs)
as adopted by the EU and, as regards the parent company financial statements, as applied in accordance with the provisions of the
Companies Act 2006.
This report is made solely to the company’s members, as a body, in accordance with Chapter 3 of Part 16 of the Companies Act 2006. Our
audit work has been undertaken so that we might state to the company’s members those matters we are required to state to them in an
auditor’s report and for no other purpose. To the fullest extent permitted by law, we do not accept or assume responsibility to anyone
other than the company and the company’s members, as a body, for our audit work, for this report, or for the opinions we have formed.
Respective responsibilities of directors and auditor
As explained more fully in the Directors’ Responsibilities Statement set out on page 13, the directors are responsible for the preparation
of the financial statements and for being satisfied that they give a true and fair view. Our responsibility is to audit, and express an opinion
on, the financial statements in accordance with applicable law and International Standards on Auditing (UK and Ireland). Those standards
require us to comply with the Auditing Practices Board’s Ethical Standards for Auditors.
Scope of the audit of the financial statements
A description of the scope of an audit of financial statements is provided on the Financial Reporting Council’s website at
www.frc.org.uk/auditscopeukprivate.
Opinion on financial statements
In our opinion:
• the financial statements give a true and fair view of the state of the group’s and of the parent company’s affairs as at 30 June 2016
and of the group’s loss for the year then ended;
• the group financial statements have been properly prepared in accordance with IFRSs as adopted by the EU;
• the parent company financial statements have been properly prepared in accordance with IFRSs as adopted by the EU and as applied
in accordance with the provisions of the Companies Act 2006; and
• the financial statements have been prepared in accordance with the requirements of the Companies Act 2006.
Opinion on other matter[s] prescribed by the Companies Act 2006
In our opinion the information given in the Strategic Report and the Directors’ Report for the financial year for which the financial
statements are prepared is consistent with the financial statements.
Company No. 03525870 Progility Annual Report and Accounts for the year to 30 June 2016 Page 21
INDEPENDENT AUDITOR’S REPORT TO THE MEMBERS OF PROGILITY PLC (continued)
Matters on which we are required to report by exception
We have nothing to report in respect of the following matters where the Companies Act 2006 requires us to report to you if, in our
opinion:
• adequate accounting records have not been kept by the parent company, or returns adequate for our audit have not been received
from branches not visited by us; or
• the parent company financial statements are not in agreement with the accounting records and returns; or
• certain disclosures of directors’ remuneration specified by law are not made; or
• we have not received all the information and explanations we require for our audit.
Mark Prince (Senior Statutory Auditor)
for and on behalf of KPMG LLP, Statutory Auditor
Chartered Accountants
15 Canada Square
Canary Wharf
London
E14 5GL
7 October 2016
Page 22 Company No. 03525870 Progility Annual Report and Accounts for the year to 30 June 2016
Financial Statements
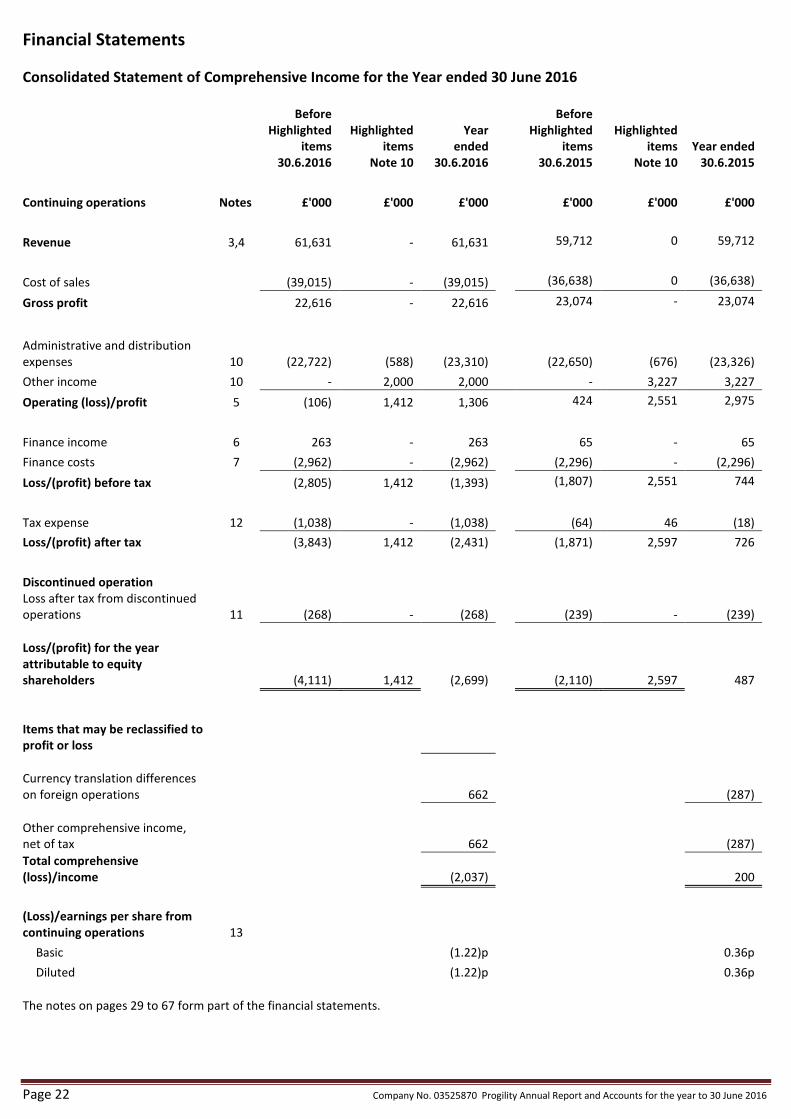
Consolidated Statement of Comprehensive Income for the Year ended 30 June 2016
Before
Highlighted
items
30.6.2016
Highlighted
items
Note 10
Year
ended
30.6.2016
Before
Highlighted
items
30.6.2015
Highlighted
items
Note 10
Year ended
30.6.2015
Continuing operations Notes £'000 £'000 £'000 £'000 £'000 £'000
Revenue 3,4 61,631 - 61,631 59,712 0 59,712
Cost of sales (39,015) - (39,015) (36,638) 0 (36,638)
Gross profit 22,616 - 22,616 23,074 - 23,074
Administrative and distribution
expenses 10 (22,722) (588) (23,310) (22,650) (676) (23,326)
Other income 10 - 2,000 2,000 - 3,227 3,227
Operating (loss)/profit 5 (106) 1,412 1,306 424 2,551 2,975
Finance income 6 263 - 263 65 - 65
Finance costs 7 (2,962) - (2,962) (2,296) - (2,296)
Loss/(profit) before tax (2,805) 1,412 (1,393) (1,807) 2,551 744
Tax expense 12 (1,038) - (1,038) (64) 46 (18)
Loss/(profit) after tax (3,843) 1,412 (2,431) (1,871) 2,597 726
Discontinued operation
Loss after tax from discontinued
operations 11 (268) - (268) (239) - (239)
Loss/(profit) for the year
attributable to equity
shareholders (4,111) 1,412 (2,699) (2,110) 2,597 487
Items that may be reclassified to
profit or loss
Currency translation differences
on foreign operations 662 (287)
Other comprehensive income,
net of tax 662 (287)
Total comprehensive
(loss)/income (2,037) 200
(Loss)/earnings per share from
continuing operations 13
Basic (1.22)p 0.36p
Diluted (1.22)p 0.36p
The notes on pages 29 to 67 form part of the financial statements.
Company No. 03525870 Progility Annual Report and Accounts for the year to 30 June 2016 Page 23
Financial Statements (continued)
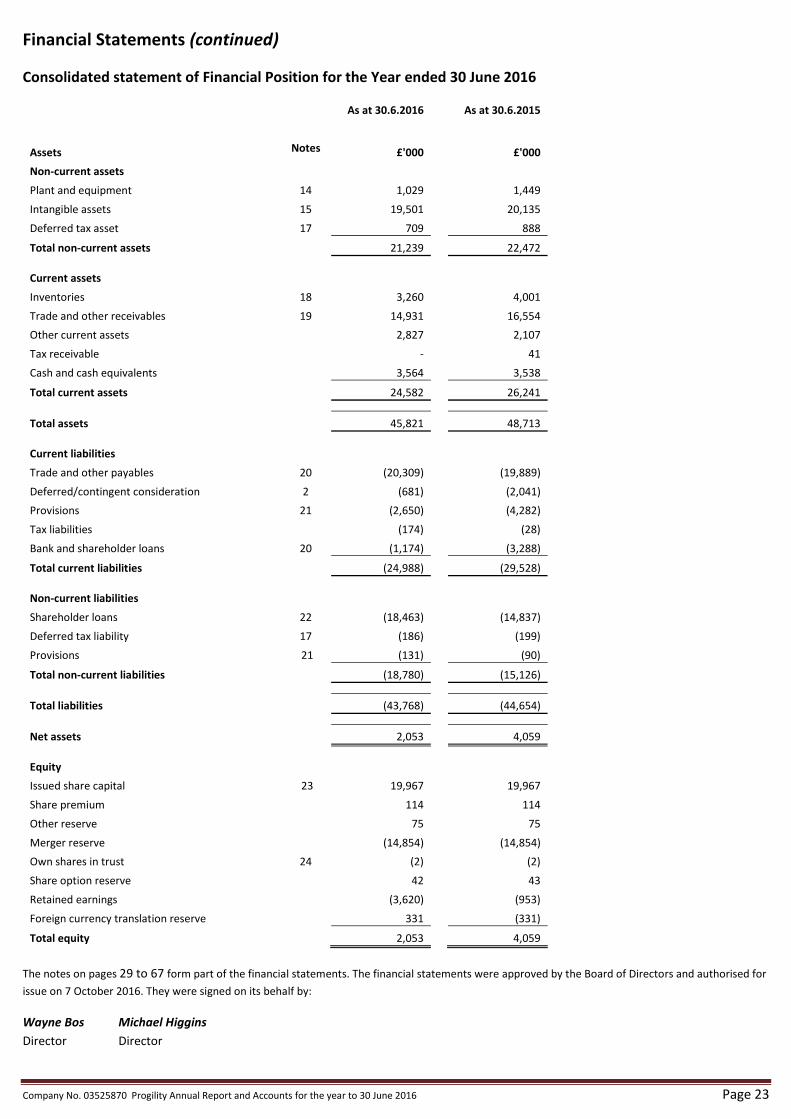
Consolidated statement of Financial Position for the Year ended 30 June 2016
As at 30.6.2016 As at 30.6.2015
Assets Notes £'000 £'000
Non-current assets
Plant and equipment 14 1,029 1,449
Intangible assets 15 19,501 20,135
Deferred tax asset 17 709 888
Total non-current assets 21,239 22,472
Current assets
Inventories 18 3,260 4,001
Trade and other receivables 19 14,931 16,554
Other current assets 2,827 2,107
Tax receivable - 41
Cash and cash equivalents 3,564 3,538
Total current assets 24,582 26,241
Total assets 45,821 48,713
Current liabilities
Trade and other payables 20 (20,309) (19,889)
Deferred/contingent consideration 2 (681) (2,041)
Provisions 21 (2,650) (4,282)
Tax liabilities (174) (28)
Bank and shareholder loans 20 (1,174) (3,288)
Total current liabilities (24,988) (29,528)
Non-current liabilities
Shareholder loans 22 (18,463) (14,837)
Deferred tax liability 17 (186) (199)
Provisions 21 (131) (90)
Total non-current liabilities (18,780) (15,126)
Total liabilities (43,768) (44,654)
Net assets 2,053 4,059
Equity
Issued share capital 23 19,967 19,967
Share premium 114 114
Other reserve 75 75
Merger reserve (14,854) (14,854)
Own shares in trust 24 (2) (2)
Share option reserve 42 43
Retained earnings (3,620) (953)
Foreign currency translation reserve 331 (331)
Total equity 2,053 4,059
The notes on pages 29 to 67 form part of the financial statements. The financial statements were approved by the Board of Directors and authorised for
issue on 7 October 2016. They were signed on its behalf by:
Wayne Bos Michael Higgins
Director Director
Page 24 Company No. 03525870 Progility Annual Report and Accounts for the year to 30 June 2016
Financial Statements (continued)
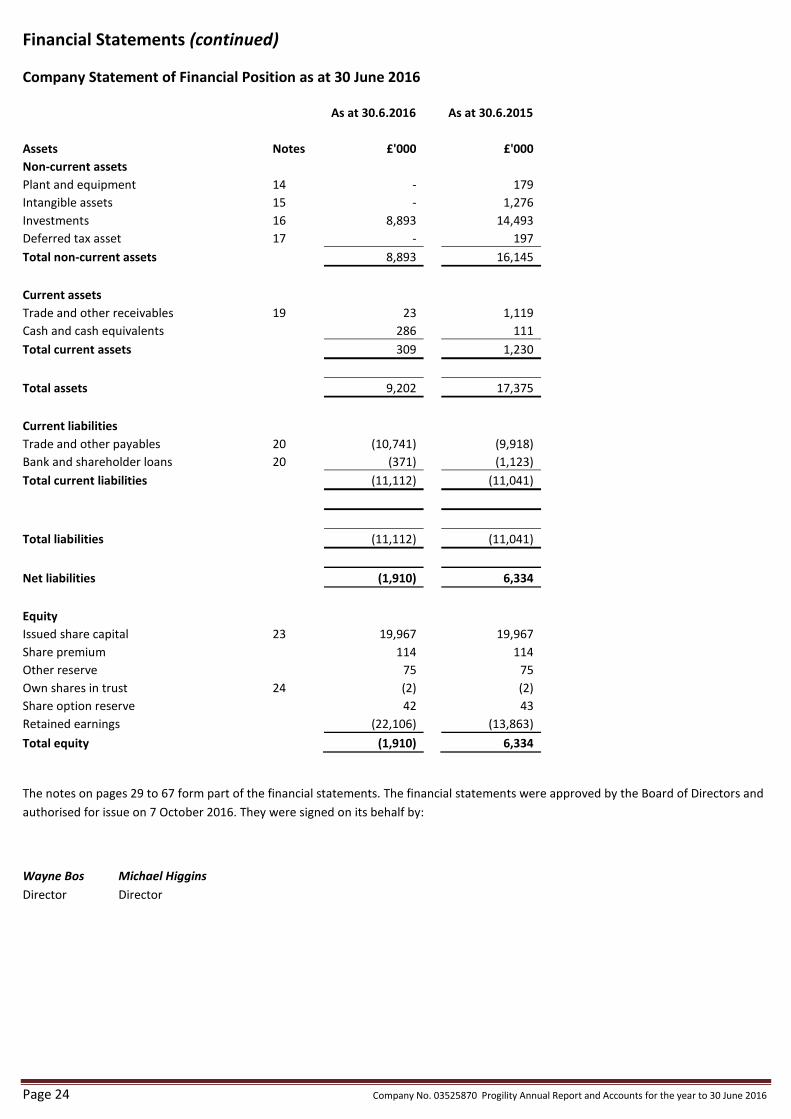
Company Statement of Financial Position as at 30 June 2016
As at 30.6.2016 As at 30.6.2015
Assets Notes £'000 £'000
Non-current assets
Plant and equipment 14 - 179
Intangible assets 15 - 1,276
Investments 16 8,893 14,493
Deferred tax asset 17 - 197
Total non-current assets 8,893 16,145
Current assets
Trade and other receivables 19 23 1,119
Cash and cash equivalents 286 111
Total current assets 309 1,230
Total assets 9,202 17,375
Current liabilities
Trade and other payables 20 (10,741) (9,918)
Bank and shareholder loans 20 (371) (1,123)
Total current liabilities (11,112) (11,041)
Total liabilities (11,112) (11,041)
Net liabilities (1,910) 6,334
Equity
Issued share capital 23 19,967 19,967
Share premium 114 114
Other reserve 75 75
Own shares in trust 24 (2) (2)
Share option reserve 42 43
Retained earnings (22,106) (13,863)
Total equity (1,910) 6,334
The notes on pages 29 to 67 form part of the financial statements. The financial statements were approved by the Board of Directors and
authorised for issue on 7 October 2016. They were signed on its behalf by:
Wayne Bos Michael Higgins
Director Director
Company No. 03525870 Progility Annual Report and Accounts for the year to 30 June 2016 Page 25
Financial Statements (continued)
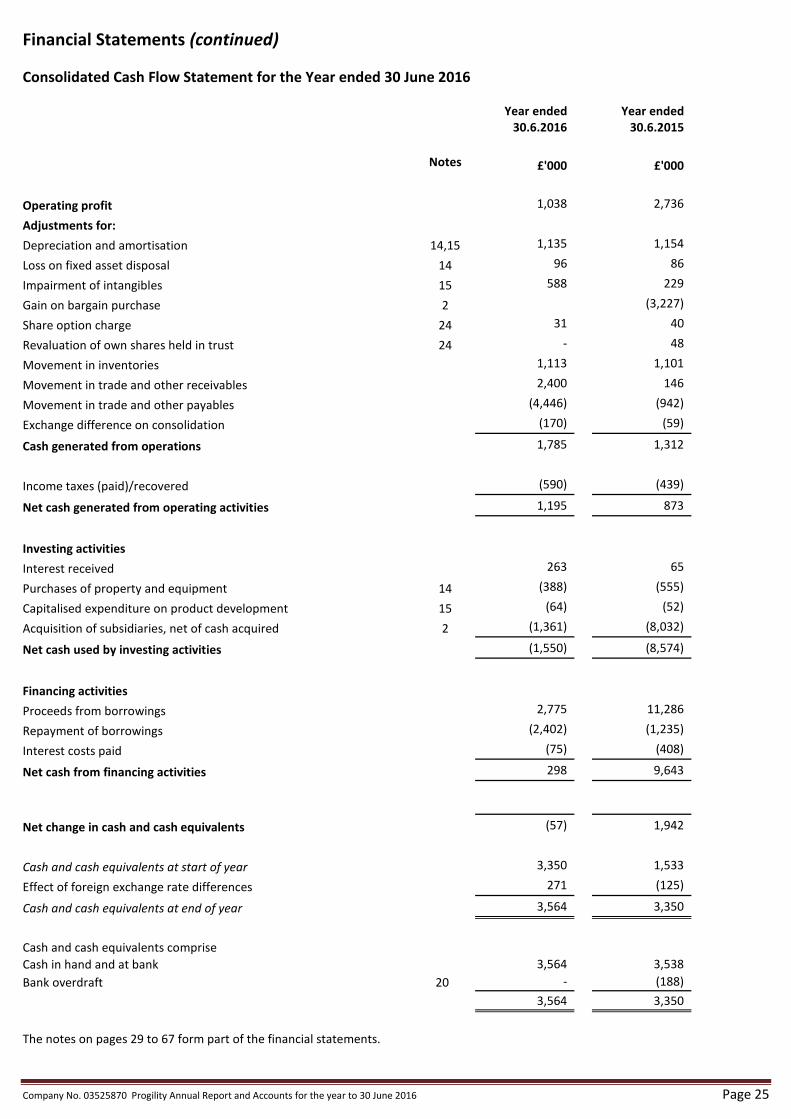
Consolidated Cash Flow Statement for the Year ended 30 June 2016
Year ended
30.6.2016
Year ended
30.6.2015
Notes £'000 £'000
Operating profit 1,038
2,736
Adjustments for:
Depreciation and amortisation 14,15 1,135
1,154
Loss on fixed asset disposal 14 96
86
Impairment of intangibles 15 588
229
Gain on bargain purchase 2
(3,227)
Share option charge 24 31
40
Revaluation of own shares held in trust 24 - 48
Movement in inventories 1,113
1,101
Movement in trade and other receivables 2,400
146
Movement in trade and other payables (4,446)
(942)
Exchange difference on consolidation (170)
(59)
Cash generated from operations 1,785
1,312
Income taxes (paid)/recovered (590) (439)
Net cash generated from operating activities 1,195 873
Investing activities
Interest received 263
65
Purchases of property and equipment 14 (388)
(555)
Capitalised expenditure on product development 15 (64)
(52)
Acquisition of subsidiaries, net of cash acquired 2 (1,361)
(8,032)
Net cash used by investing activities (1,550) (8,574)
Financing activities
Proceeds from borrowings 2,775
11,286
Repayment of borrowings (2,402)
(1,235)
Interest costs paid (75)
(408)
Net cash from financing activities 298 9,643
Net change in cash and cash equivalents (57)
1,942
Cash and cash equivalents at start of year 3,350
1,533
Effect of foreign exchange rate differences 271
(125)
Cash and cash equivalents at end of year 3,564
3,350
Cash and cash equivalents comprise
Cash in hand and at bank 3,564
3,538
Bank overdraft 20 -
(188)
3,564
3,350
The notes on pages 29 to 67 form part of the financial statements.
Page 26 Company No. 03525870 Progility Annual Report and Accounts for the year to 30 June 2016
Financial Statements (continued)
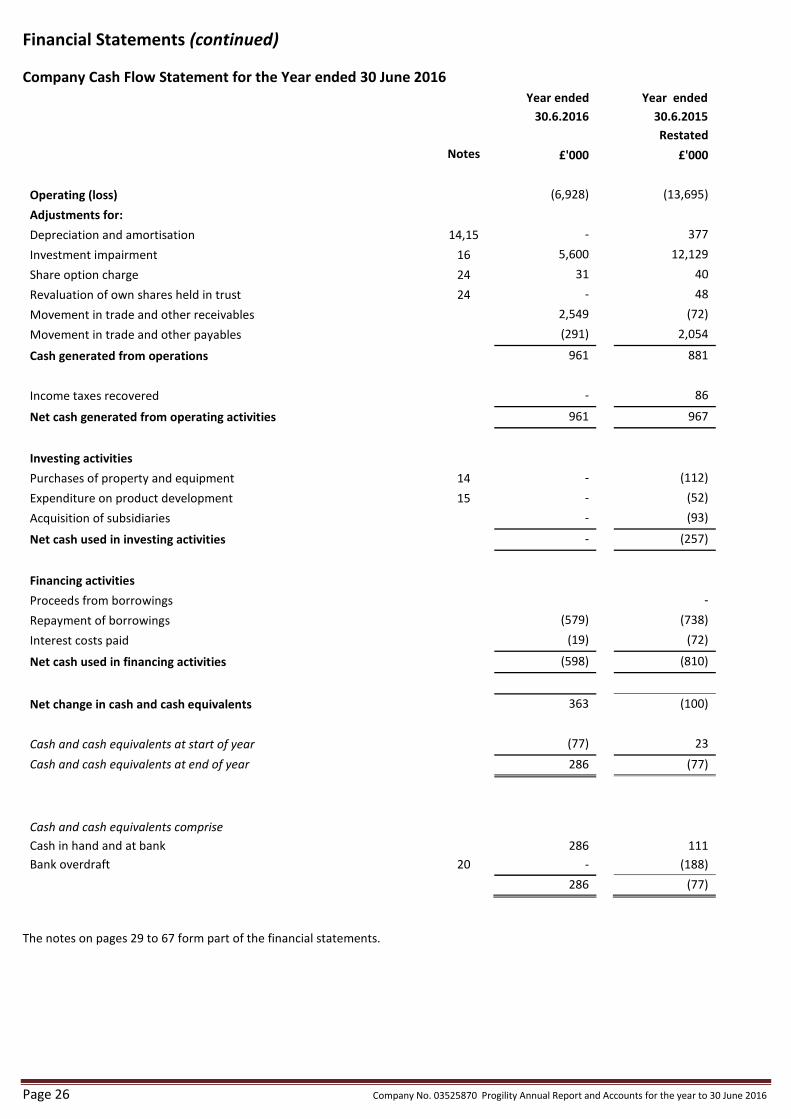
Company Cash Flow Statement for the Year ended 30 June 2016
Year ended
30.6.2016
Year ended
30.6.2015
Restated
Notes £'000 £'000
Operating (loss) (6,928)
(13,695)
Adjustments for:
Depreciation and amortisation 14,15 -
377
Investment impairment 16 5,600
12,129
Share option charge 24 31
40
Revaluation of own shares held in trust 24 - 48
Movement in trade and other receivables 2,549
(72)
Movement in trade and other payables (291)
2,054
Cash generated from operations 961
881
Income taxes recovered - 86
Net cash generated from operating activities 961 967
Investing activities
Purchases of property and equipment 14 -
(112)
Expenditure on product development 15 -
(52)
Acquisition of subsidiaries -
(93)
Net cash used in investing activities -
(257)
Financing activities
Proceeds from borrowings
-
Repayment of borrowings (579)
(738)
Interest costs paid (19)
(72)
Net cash used in financing activities (598)
(810)
Net change in cash and cash equivalents 363
(100)
Cash and cash equivalents at start of year (77)
23
Cash and cash equivalents at end of year 286 (77)
Cash and cash equivalents comprise
Cash in hand and at bank 286 111
Bank overdraft 20 - (188)
286 (77)
The notes on pages 29 to 67 form part of the financial statements.

Company No. 03525870 Progility Annual Report and Accounts for the year to 30 June 2016 Page 27
Financial Statements (continued)
Statement of Changes in Equity for the year ended 30 June 2016
Called up
share
capital
Share
premium
account
Other
reserve
Merger
reserve
Own
shares in
trust
Share
option
reserve
Foreign
currency
translation
reserve
Retained
earnings Total
Group £'000 £'000 £'000 £'000 £'000 £'000 £'000 £'000 £'000
Balance at 30.6.2014 19,967 114 75 (14,854) (50) 16 (44) (1,453) 3,771
Options granted - - - - - 40 - - 40
Revaluation of own
shares - - - - 48 - - - 48
Options lapsed and
waived - - - - - (13) - 13 -
Transactions with
owners - - - - 48 27 - 13 88
Profit for the year - - - - - - - 487 487
Other comprehensive
income:
Foreign currency
translation adjustment - - - - - - (287) - (287)
Total comprehensive
income for the year - - - - - - (287) 487 200
Balance at 30.6.2015 19,967 114 75 (14,854) (2) 43 (331) (953) 4,059
Balance at 30.6.2015 19,967 114 75 (14,854) (2) 43 (331) (953) 4,059
Options granted - - - - - 31 - - 31
Revaluation of own
shares - - - - - - - - -
Options lapsed and
waived - - - - - (32) - 32 -
Transactions with
owners - - - - - (1) - 32 31
Loss for the year - - - - - - - (2,699) (2,699)
Other comprehensive
income:
Foreign currency
translation adjustment - - - - - - 662 - 662
Total comprehensive
income for the year - - - - - - 662 (2,699) (2,037)
Balance at 30.6.2016 19,967 114 75 (14,854) (2) 42 331 (3,620) 2,053
The notes on pages 29 to 67 form part of the financial statements.

Page 28 Company No. 03525870 Progility Annual Report and Accounts for the year to 30 June 2016
Financial Statements (continued)
Statement of Changes in Equity for the year ended 30 June 2016
Called up
share capital
Share
premium
account
Other
reserve
Own
shares
in trust
Share
option
reserve
Retained
earnings Total
Company £'000 £'000 £'000 £'000 £'000 £'000 £'000
Balance at 30.6.2014 19,967 114 75 (50) 16 9 20,131
Options granted - - - - 40 - 40
Revaluation of own
shares - - - 48 - - 48
Options lapsed and
waived - - - - (13) 13 -
Transactions with
owners - - - 48 27 13 88
Loss for the year - - - - - (13,885) (13,885)
Total comprehensive
income for the year - - - - - (13,885) (13,885)
Balance at 30.6.2015 19,967 114 75 (2) 43 (13,863) 6,334
Balance at 30.6.2015 19,967 114 75 (2) 43 (13,863) 6,334
Options granted - - - - 31 - 31
Revaluation of own
shares - - - - - - -
Options lapsed and
waived - - - - (32) 32 -
Transactions with
owners - - - - (1) 32 31
Loss for the year - - - - - (8,275) (8,275)
Total comprehensive
income for the year - - - - - (8,275) (8,275)
Balance at 30.6.2016 19,967 114 75 (2) 42 (22,106) (1,910)
The notes on pages 29 to 67 form part of the financial statements.
Company No. 03525870 Progility Annual Report and Accounts for the year to 30 June 2016 Page 29
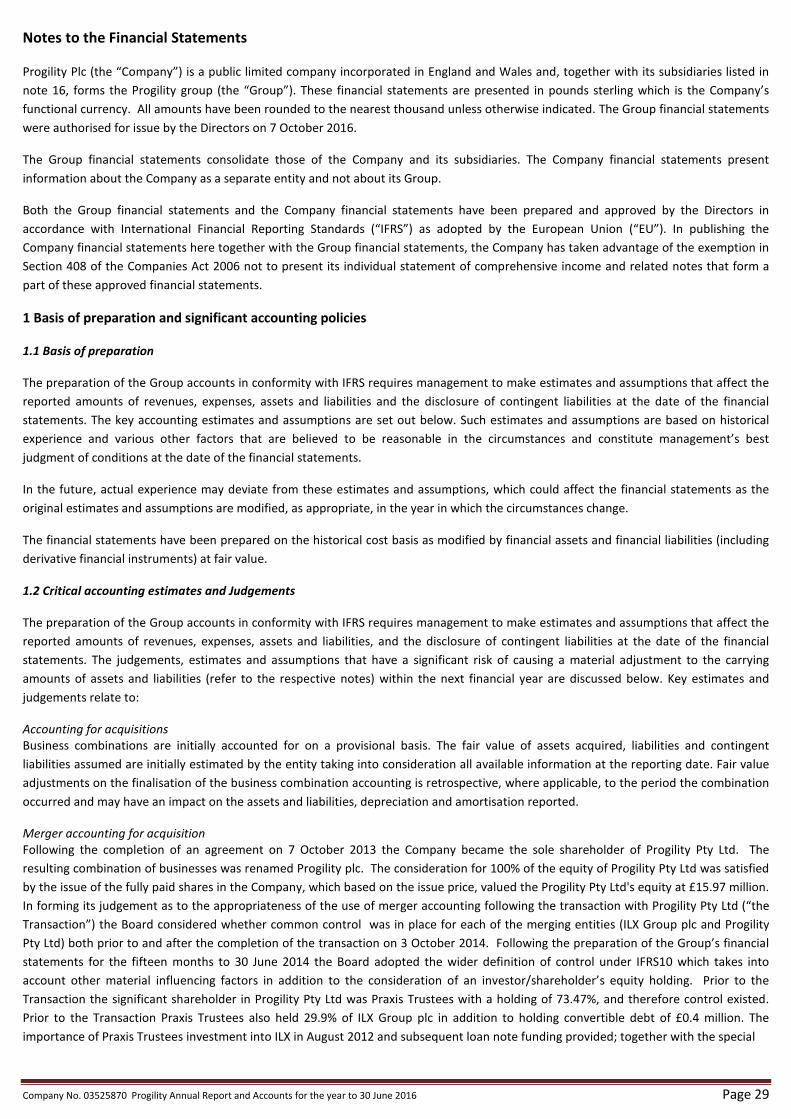
Notes to the Financial Statements
Progility Plc (the “Company”) is a public limited company incorporated in England and Wales and, together with its subsidiaries listed in
note 16, forms the Progility group (the “Group”). These financial statements are presented in pounds sterling which is the Company’s
functional currency. All amounts have been rounded to the nearest thousand unless otherwise indicated. The Group financial statements
were authorised for issue by the Directors on 7 October 2016.
The Group financial statements consolidate those of the Company and its subsidiaries. The Company financial statements present
information about the Company as a separate entity and not about its Group.
Both the Group financial statements and the Company financial statements have been prepared and approved by the Directors in
accordance with International Financial Reporting Standards (“IFRS”) as adopted by the European Union (“EU”). In publishing the
Company financial statements here together with the Group financial statements, the Company has taken advantage of the exemption in
Section 408 of the Companies Act 2006 not to present its individual statement of comprehensive income and related notes that form a
part of these approved financial statements.
1 Basis of preparation and significant accounting policies
1.1 Basis of preparation
The preparation of the Group accounts in conformity with IFRS requires management to make estimates and assumptions that affect the
reported amounts of revenues, expenses, assets and liabilities and the disclosure of contingent liabilities at the date of the financial
statements. The key accounting estimates and assumptions are set out below. Such estimates and assumptions are based on historical
experience and various other factors that are believed to be reasonable in the circumstances and constitute management’s best
judgment of conditions at the date of the financial statements.
In the future, actual experience may deviate from these estimates and assumptions, which could affect the financial statements as the
original estimates and assumptions are modified, as appropriate, in the year in which the circumstances change.
The financial statements have been prepared on the historical cost basis as modified by financial assets and financial liabilities (including
derivative financial instruments) at fair value.
1.2 Critical accounting estimates and Judgements
The preparation of the Group accounts in conformity with IFRS requires management to make estimates and assumptions that affect the
reported amounts of revenues, expenses, assets and liabilities, and the disclosure of contingent liabilities at the date of the financial
statements. The judgements, estimates and assumptions that have a significant risk of causing a material adjustment to the carrying
amounts of assets and liabilities (refer to the respective notes) within the next financial year are discussed below. Key estimates and
judgements relate to:
Accounting for acquisitions
Business combinations are initially accounted for on a provisional basis. The fair value of assets acquired, liabilities and contingent
liabilities assumed are initially estimated by the entity taking into consideration all available information at the reporting date. Fair value
adjustments on the finalisation of the business combination accounting is retrospective, where applicable, to the period the combination
occurred and may have an impact on the assets and liabilities, depreciation and amortisation reported.
Merger accounting for acquisition
Following the completion of an agreement on 7 October 2013 the Company became the sole shareholder of Progility Pty Ltd. The
resulting combination of businesses was renamed Progility plc. The consideration for 100% of the equity of Progility Pty Ltd was satisfied
by the issue of the fully paid shares in the Company, which based on the issue price, valued the Progility Pty Ltd's equity at £15.97 million.
In forming its judgement as to the appropriateness of the use of merger accounting following the transaction with Progility Pty Ltd (“the
Transaction”) the Board considered whether common control was in place for each of the merging entities (ILX Group plc and Progility
Pty Ltd) both prior to and after the completion of the transaction on 3 October 2014. Following the preparation of the Group’s financial
statements for the fifteen months to 30 June 2014 the Board adopted the wider definition of control under IFRS10 which takes into
account other material influencing factors in addition to the consideration of an investor/shareholder’s equity holding. Prior to the
Transaction the significant shareholder in Progility Pty Ltd was Praxis Trustees with a holding of 73.47%, and therefore control existed.
Prior to the Transaction Praxis Trustees also held 29.9% of ILX Group plc in addition to holding convertible debt of £0.4 million. The
importance of Praxis Trustees investment into ILX in August 2012 and subsequent loan note funding provided; together with the special
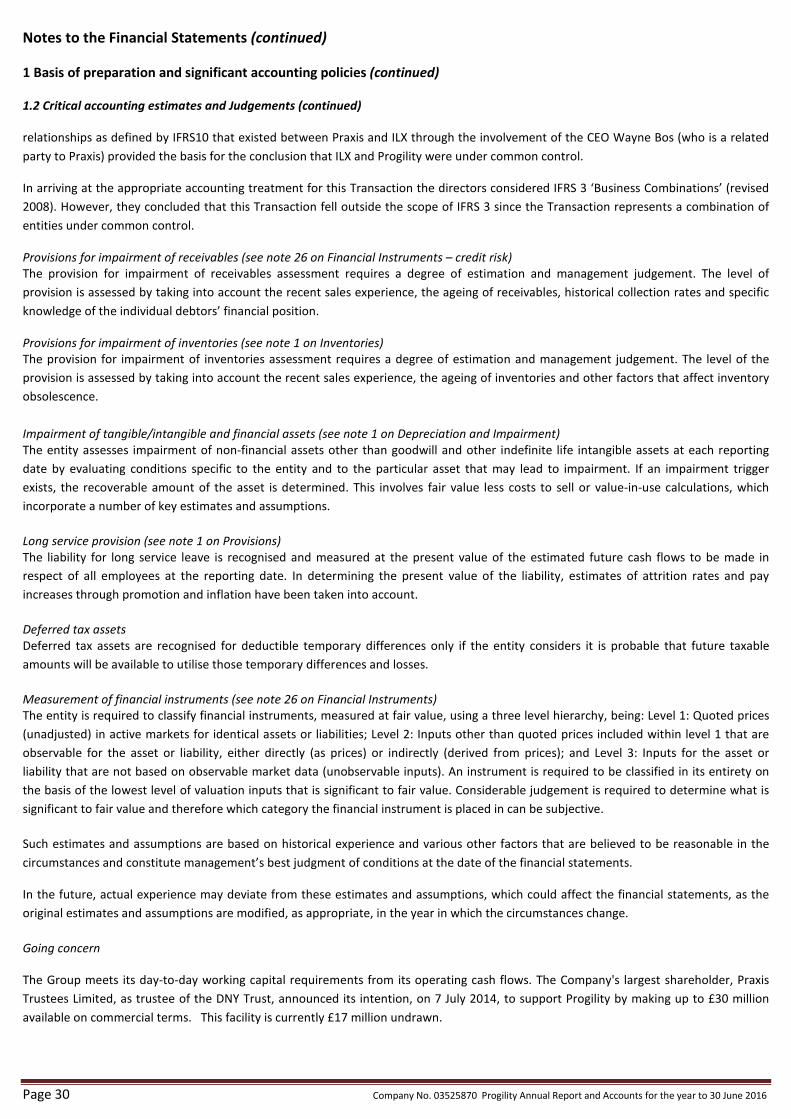
Page 30 Company No. 03525870 Progility Annual Report and Accounts for the year to 30 June 2016
Notes to the Financial Statements (continued)
1 Basis of preparation and significant accounting policies (continued)
1.2 Critical accounting estimates and Judgements (continued)
relationships as defined by IFRS10 that existed between Praxis and ILX through the involvement of the CEO Wayne Bos (who is a related
party to Praxis) provided the basis for the conclusion that ILX and Progility were under common control.
In arriving at the appropriate accounting treatment for this Transaction the directors considered IFRS 3 ‘Business Combinations’ (revised
2008). However, they concluded that this Transaction fell outside the scope of IFRS 3 since the Transaction represents a combination of
entities under common control.
Provisions for impairment of receivables (see note 26 on Financial Instruments – credit risk)
The provision for impairment of receivables assessment requires a degree of estimation and management judgement. The level of
provision is assessed by taking into account the recent sales experience, the ageing of receivables, historical collection rates and specific
knowledge of the individual debtors’ financial position.
Provisions for impairment of inventories (see note 1 on Inventories)
The provision for impairment of inventories assessment requires a degree of estimation and management judgement. The level of the
provision is assessed by taking into account the recent sales experience, the ageing of inventories and other factors that affect inventory
obsolescence.
Impairment of tangible/intangible and financial assets (see note 1 on Depreciation and Impairment)
The entity assesses impairment of non-financial assets other than goodwill and other indefinite life intangible assets at each reporting
date by evaluating conditions specific to the entity and to the particular asset that may lead to impairment. If an impairment trigger
exists, the recoverable amount of the asset is determined. This involves fair value less costs to sell or value-in-use calculations, which
incorporate a number of key estimates and assumptions.
Long service provision (see note 1 on Provisions)
The liability for long service leave is recognised and measured at the present value of the estimated future cash flows to be made in
respect of all employees at the reporting date. In determining the present value of the liability, estimates of attrition rates and pay
increases through promotion and inflation have been taken into account.
Deferred tax assets
Deferred tax assets are recognised for deductible temporary differences only if the entity considers it is probable that future taxable
amounts will be available to utilise those temporary differences and losses.
Measurement of financial instruments (see note 26 on Financial Instruments)
The entity is required to classify financial instruments, measured at fair value, using a three level hierarchy, being: Level 1: Quoted prices
(unadjusted) in active markets for identical assets or liabilities; Level 2: Inputs other than quoted prices included within level 1 that are
observable for the asset or liability, either directly (as prices) or indirectly (derived from prices); and Level 3: Inputs for the asset or
liability that are not based on observable market data (unobservable inputs). An instrument is required to be classified in its entirety on
the basis of the lowest level of valuation inputs that is significant to fair value. Considerable judgement is required to determine what is
significant to fair value and therefore which category the financial instrument is placed in can be subjective.
Such estimates and assumptions are based on historical experience and various other factors that are believed to be reasonable in the
circumstances and constitute management’s best judgment of conditions at the date of the financial statements.
In the future, actual experience may deviate from these estimates and assumptions, which could affect the financial statements, as the
original estimates and assumptions are modified, as appropriate, in the year in which the circumstances change.
Going concern
The Group meets its day-to-day working capital requirements from its operating cash flows. The Company's largest shareholder, Praxis
Trustees Limited, as trustee of the DNY Trust, announced its intention, on 7 July 2014, to support Progility by making up to £30 million
available on commercial terms. This facility is currently £17 million undrawn.

Company No. 03525870 Progility Annual Report and Accounts for the year to 30 June 2016 Page 31
Notes to the Financial Statements (continued)
1 Basis of preparation and significant accounting policies (continued)
1.2 Critical accounting estimates and Judgements (continued)
The Directors, after making enquiries of its loan note holders, its principal bankers and other lenders, have a reasonable expectation that
the Company and the Group will have adequate resources to continue in operational existence for the foreseeable future. Accordingly,
they continue to adopt the going concern basis in preparing the annual report and financial statements.
It is the Board's view that, based on cash flow projections, the Group considers the existing financing facilities to be adequate to meet
operating requirements through December 2016.
1.3 Basis of consolidation
The consolidated financial statements include the financial statements of Progility Plc and its subsidiaries. There are no associates or joint
ventures to be considered.
Intra-group balances, and any unrealised gains and losses or income and expenses arising from intra-group transactions, are eliminated in
preparing the consolidated financial statements. The Group uses the acquisition method of accounting to account for the acquisition of
subsidiaries. The acquisition of Progility Pty Limited was accounted for as a merger in 2013.
1.4 Revenue
Sales of Goods
Revenue is recognised when the significant risks and rewards of ownership have been transferred to the customer, recovery of the
consideration is probable, the associated costs and possible return of goods can be estimated reliably, there is no continuing
management involvement with the goods and the amount of revenue can be measured reliably. Revenue is measured net of returns,
trade discounts and rebates.
Software licences
Revenue for licenses to use generic software products is recognised over the period of the license term, provided that delivery has
occurred. Previously financial statements were prepared recognising revenue from software at the commencement of the licence period.
Revenue from software that is sold together with a workshop or exam voucher is split into separate components based on the fair value
of the individual deliverables. The software will be recognised based on the licence granted. The workshop or course deliverable will be
recognised upon delivery of the service. The allocation of the fair value is based on stand-alone selling prices with the exception of the
exam vouchers which are determined after taking into account the expected redemptions that have been reliably estimated based on
significant historical experience. This amount is deferred until the exam has been taken or the voucher has expired.
Recognition of exam vouchers
Provision is made for unredeemed exam vouchers based on actual take up rates. Actual experience may deviate from the assumptions
used, which could impact the financial statements in the year in which circumstances change.
Projects
Revenue from fixed price consultancy, training, customisation and software development projects or events is recognised in accordance
with the delivery for each project or event. Revenue from such projects chargeable on a time and materials basis is recognised when the
work is performed by reference to the percentage stage of completion.
Services
Revenue is generated for after-sales service, maintenance and consulting and telecommunication solutions. Consideration received for
those services is initially deferred and included in other liabilities and recognised as revenue in the period when the service is performed.
In recognising after sales service and maintenance revenues the Group considers the nature of the services and the customer’s use of
related products based on historical experience.
Revenue from rental and support services is recognised evenly over the period for which the service is to be provided.

Page 32 Company No. 03525870 Progility Annual Report and Accounts for the year to 30 June 2016
Notes to the Financial Statements (continued)
1 Basis of preparation and significant accounting policies (continued)
1.4 Revenue (continued)
Contracts
Revenue on fixed price contracts is recognised when the outcome of the contract can be estimated reliably and the stage of completion
of the contract can be measured reliably.
Contract revenue and expenses are recognised in accordance with the stage of completion of the contract. Under the stage of completion
method, contracts costs, revenue and the resulting profit are recognised in the period in which the work is performed. Contract costs
incurred that relate to future activities are deferred and recognised as inventory. Stage of completion is based on costs incurred as a
percentage of total budgeted costs.
When the outcome of a contract cannot be estimated reliably, revenue is recognised to the extent of costs incurred that are probable of
recovery.
Revenue relating to retention payments is recognised at the fair value of the amount receivable.
When a contract includes a service element then the contract is split into a servicing component that is recognised separately as services
revenue. Where contracts have a fixed fee split, revenue is recognised in line with the contract. In cases where contracts do not clearly
separate revenue streams a fair value estimate is performed to allocate an appropriate portion of the revenue to the service element.
1.5 Basis of consolidation
Subsidiaries
Subsidiaries are entities controlled by the Group. The Group controls an entity when it is exposed to, or has rights to, variable returns
from its involvement with the entity and has the ability to affect those returns through its power over the entity.. In assessing control, the
Group takes into consideration potential voting rights that are currently exercisable. The acquisition date is the date on which control is
transferred to the acquirer. The financial statements of subsidiaries are included in the consolidated financial statements from the date
that control commences until the date that control ceases. Losses applicable to the non-controlling interests in a subsidiary are allocated
to the non-controlling interests even if doing so causes the non-controlling interests to have a deficit balance.
Transactions eliminated on consolidation
Intra-group balances and transactions, and any unrealised income and expenses arising from intra-group transactions, are eliminated.
Unrealised losses are eliminated in the same way as unrealised gains, but only to the extent that there is no evidence of impairment.
Separate parent company financial statements
In the parent company financial statements, all investments in subsidiaries are carried at cost less impairment.
1.6 Foreign currency
Transactions in foreign currencies are translated to the respective functional currencies of Group entities at the foreign exchange rate
ruling at the date of the transaction. Monetary assets and liabilities denominated in foreign currencies at the balance sheet date are
retranslated to the functional currency at the foreign exchange rate ruling at that date. Foreign exchange differences arising on
translation are recognised in profit or loss. Non-monetary assets and liabilities that are measured in terms of historical cost in a foreign
currency are translated using the exchange rate at the date of the transaction. Non-monetary assets and liabilities denominated in foreign
currencies that are stated at fair value are retranslated to the functional currency at foreign exchange rates ruling at the dates the fair
value was determined.
The assets and liabilities of foreign operations, including goodwill and fair value adjustments arising on consolidation, are translated to
the Group’s presentational currency, Sterling, at foreign exchange rates ruling at the balance sheet date. The revenues and expenses of
foreign operations are translated at an average rate for the year where this rate approximates to the foreign exchange rates ruling at the
dates of the transactions. Exchange differences arising from this translation of foreign operations are reported as an item of other
comprehensive income and accumulated in the translation reserve or non-controlling interest, as the case may be.

Company No. 03525870 Progility Annual Report and Accounts for the year to 30 June 2016 Page 33
Notes to the Financial Statements (continued)
1 Basis of preparation and significant accounting policies (continued)
1.7 Classification of financial instruments issued by the Group
Following the adoption of IAS 32, financial instruments issued by the Group are treated as equity only to the extent that they meet the
following two conditions:
(a) they include no contractual obligations upon the company (or group as the case may be) to deliver cash or other financial
assets or to exchange financial assets or financial liabilities with another party under conditions that are potentially unfavourable to the
company (or group); and
(b) where the instrument will or may be settled in the company’s own equity instruments, it is either a non-derivative that
includes no obligation to deliver a variable number of the company’s own equity instruments or is a derivative that will be settled by the
company’s exchanging a fixed amount of cash or other financial assets for a fixed number of its own equity instruments.
To the extent that this definition is not met, the proceeds of issue are classified as a financial liability. Where the instrument so classified
takes the legal form of the company’s own shares, the amounts presented in these financial statements for called up share capital and
share premium account exclude amounts in relation to those shares.
1.8 Convertible loans
Convertible loan notes are regarded as compound instruments, consisting of a liability instrument and an equity instrument. At the date
of issue the fair value of the liability component is estimated using the prevailing market interest rate for similar non-convertible debt.
The difference between the proceeds of issue of the convertible loan note and the fair value assigned to the liability component,
representing the embedded option to convert the liability into equity of the Group, is included in equity within the ‘other’ reserve. The
interest expense of the liability component is calculated by applying the effective interest rate to the liability component of the
instrument. The difference between this amount and the interest paid is added to the carrying amount of the convertible loan note.
1.9 Non-derivative financial instruments
Non-derivative financial instruments comprise investments in equity and debt securities, trade and other receivables, cash and cash
equivalents, loans and borrowings, and trade and other payables.
Trade and other receivables
Trade and other receivables are recognised initially at fair value. Subsequent to initial recognition they are measured at amortised cost
using the effective interest method, less any impairment losses.
Trade and other payables
Trade and other payables are recognised initially at fair value. Subsequent to initial recognition they are measured at amortised cost using
the effective interest method.
Investments in debt and equity securities
Investments in subsidiaries in standalone accounts are stated at amortised cost less impairment.
Cash and cash equivalents
Cash and cash equivalents comprise cash on hand, bank balances, demand deposits and other short term, highly liquid investments with
original maturities of three months or less.
Interest-bearing borrowings
Interest-bearing borrowings are recognised initially at fair value less attributable transaction costs. Subsequent to initial recognition,
interest-bearing borrowings are stated at amortised cost using the effective interest method, less any impairment losses.
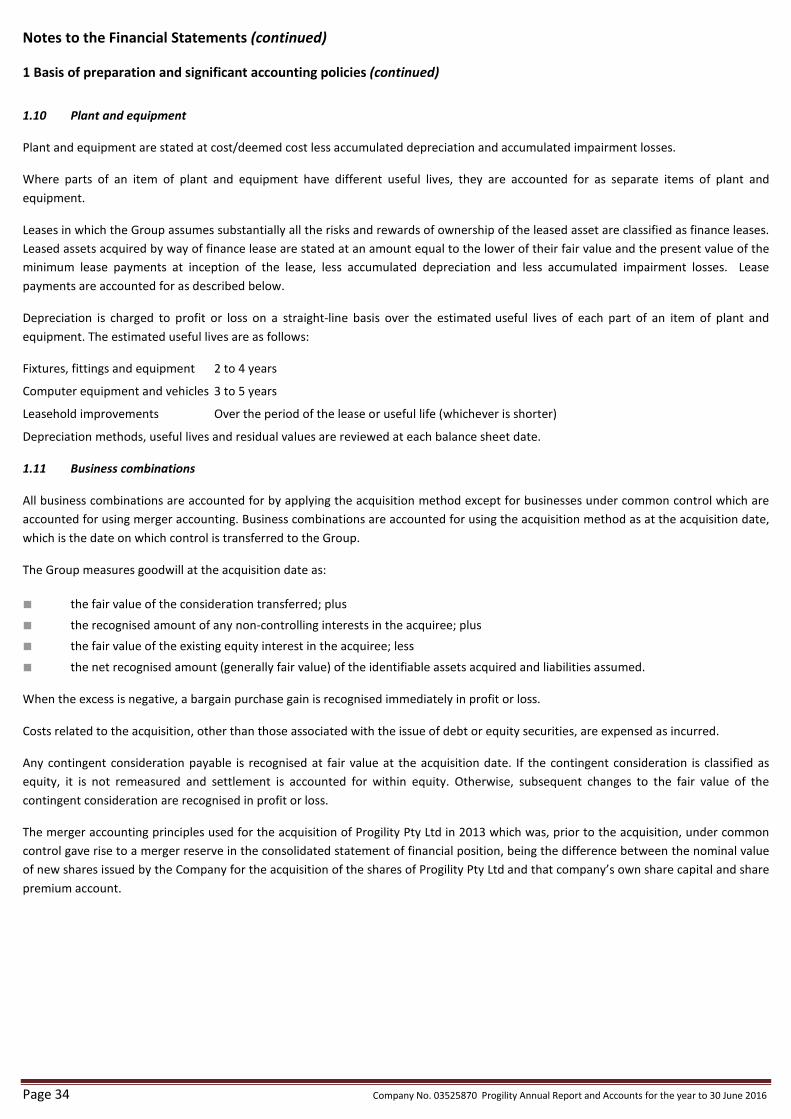
Page 34 Company No. 03525870 Progility Annual Report and Accounts for the year to 30 June 2016
Notes to the Financial Statements (continued)
1 Basis of preparation and significant accounting policies (continued)
1.10 Plant and equipment
Plant and equipment are stated at cost/deemed cost less accumulated depreciation and accumulated impairment losses.
Where parts of an item of plant and equipment have different useful lives, they are accounted for as separate items of plant and
equipment.
Leases in which the Group assumes substantially all the risks and rewards of ownership of the leased asset are classified as finance leases.
Leased assets acquired by way of finance lease are stated at an amount equal to the lower of their fair value and the present value of the
minimum lease payments at inception of the lease, less accumulated depreciation and less accumulated impairment losses. Lease
payments are accounted for as described below.
Depreciation is charged to profit or loss on a straight-line basis over the estimated useful lives of each part of an item of plant and
equipment. The estimated useful lives are as follows:
Fixtures, fittings and equipment 2 to 4 years
Computer equipment and vehicles 3 to 5 years
Leasehold improvements Over the period of the lease or useful life (whichever is shorter)
Depreciation methods, useful lives and residual values are reviewed at each balance sheet date.
1.11 Business combinations
All business combinations are accounted for by applying the acquisition method except for businesses under common control which are
accounted for using merger accounting. Business combinations are accounted for using the acquisition method as at the acquisition date,
which is the date on which control is transferred to the Group.
The Group measures goodwill at the acquisition date as:
■ the fair value of the consideration transferred; plus
■ the recognised amount of any non-controlling interests in the acquiree; plus
■ the fair value of the existing equity interest in the acquiree; less
■ the net recognised amount (generally fair value) of the identifiable assets acquired and liabilities assumed.
When the excess is negative, a bargain purchase gain is recognised immediately in profit or loss.
Costs related to the acquisition, other than those associated with the issue of debt or equity securities, are expensed as incurred.
Any contingent consideration payable is recognised at fair value at the acquisition date. If the contingent consideration is classified as
equity, it is not remeasured and settlement is accounted for within equity. Otherwise, subsequent changes to the fair value of the
contingent consideration are recognised in profit or loss.
The merger accounting principles used for the acquisition of Progility Pty Ltd in 2013 which was, prior to the acquisition, under common
control gave rise to a merger reserve in the consolidated statement of financial position, being the difference between the nominal value
of new shares issued by the Company for the acquisition of the shares of Progility Pty Ltd and that company’s own share capital and share
premium account.
Company No. 03525870 Progility Annual Report and Accounts for the year to 30 June 2016 Page 35
Notes to the Financial Statements (continued)
1 Basis of preparation and significant accounting policies (continued)
1.12 Intangible assets and goodwill
Goodwill
Goodwill is stated at cost less any accumulated impairment losses. Goodwill is allocated to cash-generating units and is not amortised but
is tested annually for impairment.
Research and development
Expenditure on research activities is recognised in profit or loss as an expense as incurred.
Expenditure on development activities is capitalised if the product or process is technically and commercially feasible and the Group
intends, has the technical ability and has sufficient resources to complete development, future economic benefits are probable and if the
Group can measure reliably the expenditure attributable to the intangible asset during its development. Development activities involve a
plan or design for the production of new or substantially improved products or processes. The expenditure capitalised includes the cost of
materials, direct labour and an appropriate proportion of overheads and capitalised borrowing costs. Other development expenditure is
recognised in profit or loss as an expense as incurred. Capitalised development expenditure is stated at cost less accumulated
amortisation and less accumulated impairment losses.
Other intangible assets
Expenditure on internally generated goodwill and brands is recognised in profit or loss as an expense as incurred. Other intangible assets
that are acquired by the Group are stated at cost less accumulated amortisation and less accumulated impairment losses.
Amortisation
Amortisation is charged to profit or loss on a straight-line basis over the estimated useful lives of intangible assets unless such lives are
indefinite. Intangible assets with an indefinite useful life and goodwill are systematically tested for impairment at each balance sheet
date. Other intangible assets are amortised from the date they are available for use. The estimated useful lives are as follows:
Brand indefinite life
Capitalised development costs 10 years
Acquired customer relationships amortised over the period to which the contract with the customer relates.
1.13 Inventories
Inventories are stated at the lower of cost and net realisable value. Cost is based on the weighted average principle and includes
expenditure incurred in acquiring the inventories, production or conversion costs and other costs in bringing them to their existing
location and condition. In the case of manufactured inventories and work in progress, cost includes an appropriate share of overheads
based on normal operating capacity.
1.14 Impairment excluding inventories and deferred tax assets
Financial assets (including receivables)
A financial asset not carried at fair value through profit or loss is assessed at each reporting date to determine whether there is objective
evidence that it is impaired. A financial asset is impaired if objective evidence indicates that a loss event has occurred after the initial
recognition of the asset, and that the loss event had a negative effect on the estimated future cash flows of that asset that can be
estimated reliably.
An impairment loss in respect of a financial asset measured at amortised cost is calculated as the difference between its carrying amount
and the present value of the estimated future cash flows discounted at the asset’s original effective interest rate. Interest on the
impaired asset continues to be recognised through the unwinding of the discount. When a subsequent event causes the amount of
impairment loss to decrease, the decrease in impairment loss is reversed through profit or loss.
Non-financial assets
The carrying amounts of the Group’s non-financial assets, other than inventories and deferred tax assets, are reviewed at each reporting
date to determine whether there is any indication of impairment. If any such indication exists, then the asset’s recoverable amount is
estimated. For goodwill, and intangible assets that have indefinite useful lives or that are not yet available for use, the recoverable
amount is estimated each year at the same time.

Page 36 Company No. 03525870 Progility Annual Report and Accounts for the year to 30 June 2016
Notes to the Financial Statements (continued)
1 Basis of preparation and significant accounting policies (continued)
1.14 Impairment excluding inventories and deferred tax assets (continued)
The recoverable amount of an asset or cash-generating unit is the greater of its value in use and its fair value less costs to sell. In assessing
value in use, the estimated future cash flows are discounted to their present value using a pre-tax discount rate that reflects current
market assessments of the time value of money and the risks specific to the asset. For the purpose of impairment testing, assets that
cannot be tested individually are grouped together into the smallest group of assets that generates cash inflows from continuing use that
are largely independent of the cash inflows of other assets or groups of assets (the “cash-generating unit”). The goodwill acquired in a
business combination, for the purpose of impairment testing, is allocated to cash-generating units, or (“CGU”). Subject to an operating
segment ceiling test, for the purposes of goodwill impairment testing, CGUs to which goodwill has been allocated are aggregated so that
the level at which impairment is tested reflects the lowest level at which goodwill is monitored for internal reporting purposes. Goodwill
acquired in a business combination is allocated to groups of CGUs that are expected to benefit from the synergies of the combination.
An impairment loss is recognised if the carrying amount of an asset or its CGU exceeds its estimated recoverable amount. Impairment
losses are recognised in profit or loss. Impairment losses recognised in respect of CGUs are allocated first to reduce the carrying amount
of any goodwill allocated to the units, and then to reduce the carrying amounts of the other assets in the unit (group of units) on a pro
rata basis.
An impairment loss in respect of goodwill is not reversed. In respect of other assets, impairment losses recognised in prior periods are
assessed at each reporting date for any indications that the loss has decreased or no longer exists. An impairment loss is reversed if there
has been a change in the estimates used to determine the recoverable amount. An impairment loss is reversed only to the extent that the
asset’s carrying amount does not exceed the carrying amount that would have been determined, net of depreciation or amortisation, if
no impairment loss had been recognised.
1.15 Employee benefits
Defined contribution plans
A defined contribution plan is a post-employment benefit plan under which the company pays fixed contributions into a separate entity
and will have no legal or constructive obligation to pay further amounts. Obligations for contributions to defined contribution pension
plans are recognised as an expense in profit or loss in the periods during which services are rendered by employees.
Short-term benefits
Short-term employee benefit obligations are measured on an undiscounted basis and are expensed as the related service is provided. A
liability is recognised for the amount expected to be paid under short-term cash bonus or profit-sharing plans if the Group has a present
legal or constructive obligation to pay this amount as a result of past service provided by the employee and the obligation can be
estimated reliably.
Share-based payment transactions
Share-based payment arrangements in which the Group receives goods or services as consideration for its own equity instruments are
accounted for as equity-settled share-based payment transactions, regardless of how the equity instruments are obtained by the Group.
The grant date fair value of share-based payment awards granted to employees is recognised as an employee expense, with a corresponding
increase in equity, over the period that the employees become unconditionally entitled to the awards. The fair value of the options granted
is measured using an option valuation model, taking into account the terms and conditions upon which the options were granted. The
amount recognised as an expense is adjusted to reflect the actual number of awards for which the related service and non-market vesting
conditions are expected to be met, such that the amount ultimately recognised as an expense is based on the number of awards that do
meet the related service and non-market performance conditions at the vesting date. For share-based payment awards with non-vesting
conditions, the grant date fair value of the share-based payment is measured to reflect such conditions and there is no true-up for
differences between expected and actual outcomes.
Share-based payment transactions in which the Group receives goods or services by incurring a liability to transfer cash or other assets
that is based on the price of the Group’s equity instruments are accounted for as cash-settled share-based payments. The fair value of
the amount payable to employees is recognised as an expense, with a corresponding increase in liabilities, over the period in which the
employees become unconditionally entitled to payment. The liability is remeasured at each balance sheet date and at settlement date.
Any changes in the fair value of the liability are recognised as personnel expense in profit or loss.
Company No. 03525870 Progility Annual Report and Accounts for the year to 30 June 2016 Page 37
Notes to the Financial Statements (continued)
1 Basis of preparation and significant accounting policies (continued)
1.16 Provisions
A provision is recognised in the balance sheet when the Group has a present legal or constructive obligation as a result of a past event,
that can be reliably measured and it is probable that an outflow of economic benefits will be required to settle the obligation. Provisions
are determined by discounting the expected future cash flows at a pre-tax rate that reflects risks specific to the liability..
1.17 Expenses
Operating lease payments
Payments made under operating leases are recognised in profit or loss on a straight-line basis over the term of the lease. Lease incentives
received are recognised in profit or loss as an integral part of the total lease expense.
Financing income and expenses
Financing expenses comprise interest payable, finance charges on shares classified as liabilities and finance leases recognised in profit or
loss using the effective interest method, unwinding of the discount on provisions, and net foreign exchange losses that are recognised in
profit or loss (see foreign currency accounting policy). Financing income comprise interest receivable on funds invested, dividend income,
and net foreign exchange gains.
Interest income and interest payable is recognised in profit or loss as it accrues, using the effective interest method. Dividend income is
recognised in the income statement on the date the entity’s right to receive payments is established. Foreign currency gains and losses
are reported on a net basis.
1.18 Taxation
Tax on the profit or loss for the year comprises current and deferred tax. Tax is recognised in profit or loss except to the extent that it
relates to items recognised directly in equity, in which case it is recognised in equity.
Current tax is the expected tax payable or receivable on the taxable income or loss for the year, using tax rates enacted or substantively
enacted at the balance sheet date, and any adjustment to tax payable in respect of previous years.
Deferred tax is provided on temporary differences between the carrying amounts of assets and liabilities for financial reporting purposes and
the amounts used for taxation purposes. The following temporary differences are not provided for: the initial recognition of goodwill; the
initial recognition of assets or liabilities that affect neither accounting nor taxable profit other than in a business combination, and differences
relating to investments in subsidiaries to the extent that they will probably not reverse in the foreseeable future. The amount of deferred tax
provided is based on the expected manner of realisation or settlement of the carrying amount of assets and liabilities, using tax rates enacted
or substantively enacted at the balance sheet date.
A deferred tax asset is recognised only to the extent that it is probable that future taxable profits will be available against which the
temporary difference can be utilised
1.19 Highlighted items
Highlighted items represent material items of income and expenses relating primarily to restructuring of the group, costs associated with
the merger with Progility and impairments of intangible assets.
1.19 Adopted IFRS not yet applied
The following Adopted IFRSs have been issued but have not been applied by the Group in these financial statements. Their adoption is
not expected to have a material effect on the financial statements unless otherwise indicated:
■ IFRS 9 Financial Instruments (effective date to be confirmed).
■ IFRS 15 Revenue from Contract with Customers (effective date to be confirmed).
■ Accounting for Acquisitions of Interests in Joint Operations – Amendments to IFRS 11 (1 January 2016).
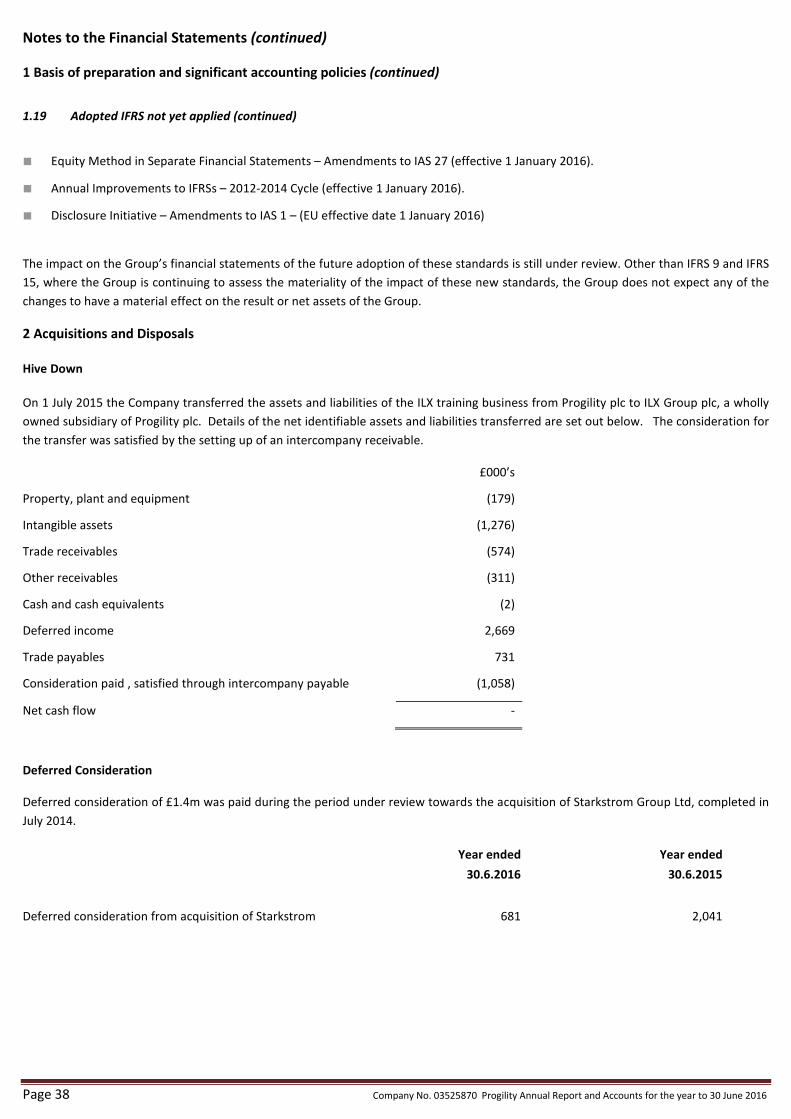
Page 38 Company No. 03525870 Progility Annual Report and Accounts for the year to 30 June 2016
Notes to the Financial Statements (continued)
1 Basis of preparation and significant accounting policies (continued)
1.19 Adopted IFRS not yet applied (continued)
■ Equity Method in Separate Financial Statements – Amendments to IAS 27 (effective 1 January 2016).
■ Annual Improvements to IFRSs – 2012-2014 Cycle (effective 1 January 2016).
■ Disclosure Initiative – Amendments to IAS 1 – (EU effective date 1 January 2016)
The impact on the Group’s financial statements of the future adoption of these standards is still under review. Other than IFRS 9 and IFRS
15, where the Group is continuing to assess the materiality of the impact of these new standards, the Group does not expect any of the
changes to have a material effect on the result or net assets of the Group.
2 Acquisitions and Disposals
Hive Down
On 1 July 2015 the Company transferred the assets and liabilities of the ILX training business from Progility plc to ILX Group plc, a wholly
owned subsidiary of Progility plc. Details of the net identifiable assets and liabilities transferred are set out below. The consideration for
the transfer was satisfied by the setting up of an intercompany receivable.
£000’s
Property, plant and equipment (179)
Intangible assets (1,276)
Trade receivables (574)
Other receivables (311)
Cash and cash equivalents (2)
Deferred income 2,669
Trade payables 731
Consideration paid , satisfied through intercompany payable (1,058)
Net cash flow -
Deferred Consideration
Deferred consideration of £1.4m was paid during the period under review towards the acquisition of Starkstrom Group Ltd, completed in
July 2014.
Year ended Year ended
30.6.2016 30.6.2015
Deferred consideration from acquisition of Starkstrom 681 2,041

Company No. 03525870 Progility Annual Report and Accounts for the year to 30 June 2016 Page 39
Notes to the Financial Statements (continued)
2 Acquisitions and Disposals (continued)
Acquisitions in prior year
During the previous reporting period, to 30 June 2015, acquisitions were completed as detailed below.
Starkstrom Group Ltd
On 14 July 2014 the company acquired 100% of the ordinary share capital of Starkstrom Group Ltd. Starkstrom operates a UK based
project management services company specialising in manufacturing and supplying medical infrastructure equipment for operating
theatres and intensive care units. The entire share capital was acquired for an aggregate consideration, payable in cash and loan notes, of
£10.68 million from its owner managers. This acquisition will provide a strong hub around which to focus the Group’s work in the
healthcare sector as a provider of project management services and solutions to hospitals.
The consideration paid was £7.96m in cash on completion and the issue of £2.72m of zero coupon loan notes repayable in four half-yearly
tranches over the two years following Completion. The loan notes will be convertible into new ordinary Progility shares, at the prevailing
market price, in the event of non-payment.
The fair values of the identifiable assets and liabilities of the new subsidiary at the date of acquisition were calculated below as follows:
Fair value of consideration £'000
Cash paid 8,636
Fair value of deferred consideration 2,041
Total 10,677
Book value Fair value
Recognised amounts of identifiable net assets £'000 £'000
Intangible assets 2,102 928
Tangible assets 536 536
Inventories 1,040 1,040
Trade and other receivables 3,209 3,209
Cash at bank and in hand 537 537
Trade and other payables (3,237) (3,237)
Tax liabilities (287) (287)
Deferred Tax - (185)
Identifiable Net Assets 3,900 2,541
Goodwill on acquisition 8,136
Consideration paid in cash 8,636
Cash and cash equivalents acquired (537)
Net cash paid relating to the acquisition 8,099
The nature of the Starkstrom business is that sales are made to a wide variety of customers who behave as operating units in a large
enterprise or government department. It is not the relationship with existing customers that helps Starkstrom to win new business, rather
it is its reputation within that market sector. Consequently, the goodwill inherent in the business on acquisition lay in its brands rather
than its customer relationships. The group also has the opportunity to exploit Starkstrom’s brands in overseas markets. The Group has
attributed a fair value of £928,000 to brands, which was determined by discounting the future cash flows to be generated from specific
Starkstrom product lines. An assessment of other assets at the time of acquisition was also made, no other fair value adjustment was
deemed necessary.
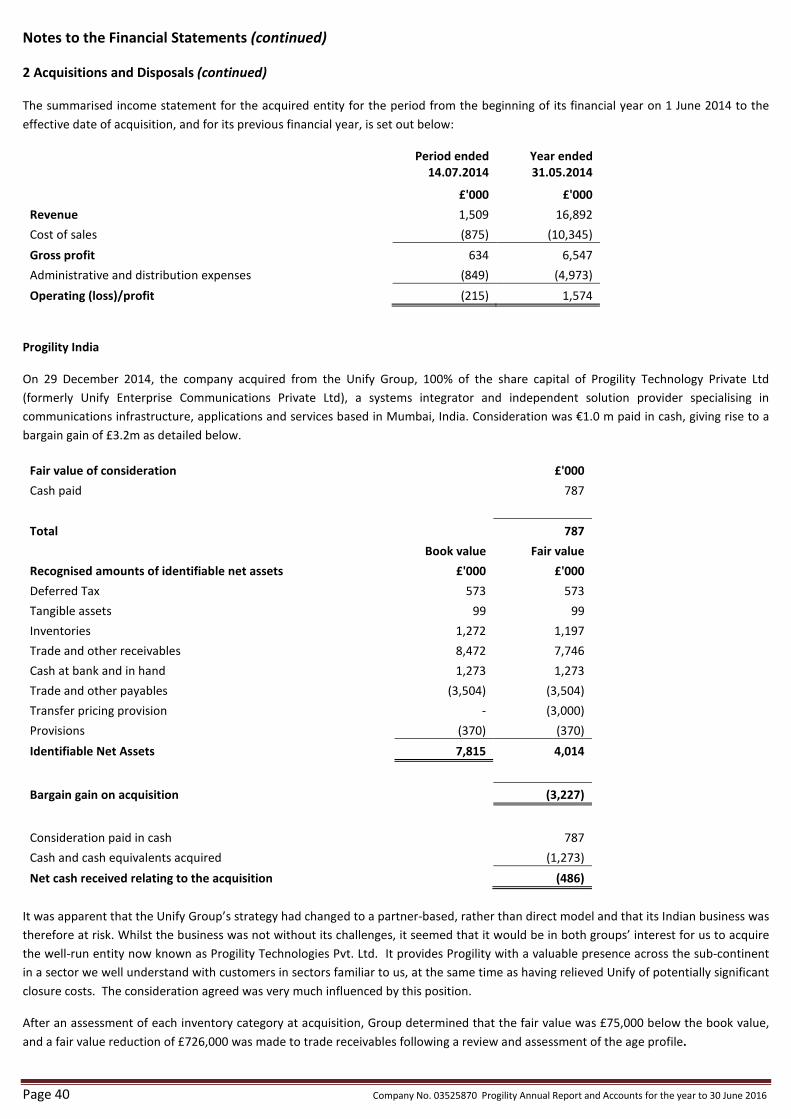
Page 40 Company No. 03525870 Progility Annual Report and Accounts for the year to 30 June 2016
Notes to the Financial Statements (continued)
2 Acquisitions and Disposals (continued)
The summarised income statement for the acquired entity for the period from the beginning of its financial year on 1 June 2014 to the
effective date of acquisition, and for its previous financial year, is set out below:
Period ended
14.07.2014
Year ended
31.05.2014
£'000 £'000
Revenue 1,509 16,892
Cost of sales (875) (10,345)
Gross profit 634 6,547
Administrative and distribution expenses (849) (4,973)
Operating (loss)/profit (215) 1,574
Progility India
On 29 December 2014, the company acquired from the Unify Group, 100% of the share capital of Progility Technology Private Ltd
(formerly Unify Enterprise Communications Private Ltd), a systems integrator and independent solution provider specialising in
communications infrastructure, applications and services based in Mumbai, India. Consideration was €1.0 m paid in cash, giving rise to a
bargain gain of £3.2m as detailed below.
Fair value of consideration £'000
Cash paid 787
Total 787
Book value Fair value
Recognised amounts of identifiable net assets £'000 £'000
Deferred Tax 573 573
Tangible assets 99 99
Inventories 1,272 1,197
Trade and other receivables 8,472 7,746
Cash at bank and in hand 1,273 1,273
Trade and other payables (3,504) (3,504)
Transfer pricing provision - (3,000)
Provisions (370) (370)
Identifiable Net Assets 7,815 4,014
Bargain gain on acquisition (3,227)
Consideration paid in cash 787
Cash and cash equivalents acquired (1,273)
Net cash received relating to the acquisition (486)
It was apparent that the Unify Group’s strategy had changed to a partner-based, rather than direct model and that its Indian business was
therefore at risk. Whilst the business was not without its challenges, it seemed that it would be in both groups’ interest for us to acquire
the well-run entity now known as Progility Technologies Pvt. Ltd. It provides Progility with a valuable presence across the sub-continent
in a sector we well understand with customers in sectors familiar to us, at the same time as having relieved Unify of potentially significant
closure costs. The consideration agreed was very much influenced by this position.
After an assessment of each inventory category at acquisition, Group determined that the fair value was £75,000 below the book value,
and a fair value reduction of £726,000 was made to trade receivables following a review and assessment of the age profile.

Company No. 03525870 Progility Annual Report and Accounts for the year to 30 June 2016 Page 41
Notes to the Financial Statements (continued)
2 Acquisitions and Disposals (continued)
In addition, we have established a provision against possible liabilities associated with acquired, pre-existing transfer pricing discussions.
The summarised income statement for the acquired entity for the period from the beginning of its financial year on 1 October 2014 to the
effective date of acquisition, and for its previous financial year, is set out below:
Period ended
29.12.2014
Year ended
30.09.2014
£'000 £'000
Revenue 4,798 19,740
Cost of sales (3,338) (13,436)
Gross profit 1,460 6,304
Administrative and distribution expenses (1,189) (5,146)
Operating profit 271 1,158
Woodspeen Training
On 5 January 2015, the company acquired 100% of the share capital of Woodspeen Training Ltd, a UK provider of training and skills
development for a cash consideration of £0.4m.
Fair value of consideration £'000
Cash paid 400
Total 400
Book value Fair value
Recognised amounts of identifiable net assets £'000 £'000
Tangible assets 185 185
Trade and other receivables 418 418
Cash at bank and in hand 11 11
Trade and other payables (721) (721)
Identifiable Net Assets (107) (107)
Goodwill on acquisition 507
Consideration paid in cash 400
Cash and cash equivalents acquired (11)
Net cash paid relating to the acquisition 389
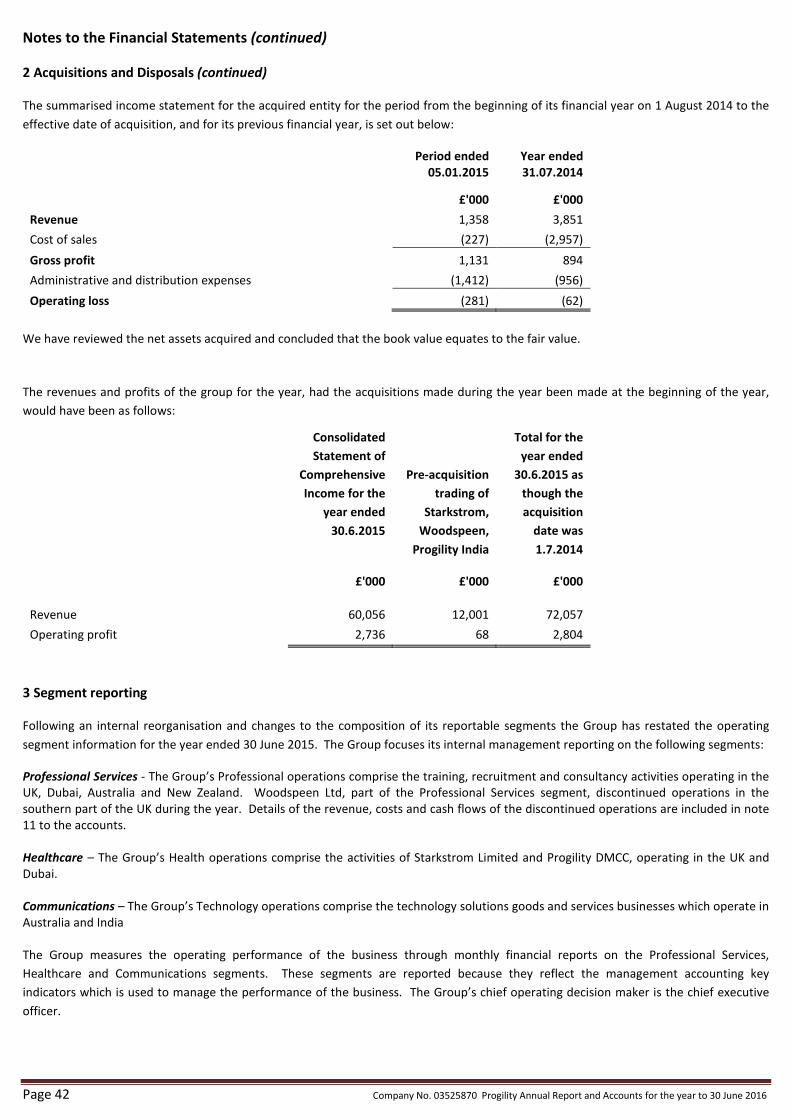
Page 42 Company No. 03525870 Progility Annual Report and Accounts for the year to 30 June 2016
Notes to the Financial Statements (continued)
2 Acquisitions and Disposals (continued)
The summarised income statement for the acquired entity for the period from the beginning of its financial year on 1 August 2014 to the
effective date of acquisition, and for its previous financial year, is set out below:
Period ended
05.01.2015
Year ended
31.07.2014
£'000 £'000
Revenue 1,358 3,851
Cost of sales (227) (2,957)
Gross profit 1,131 894
Administrative and distribution expenses (1,412) (956)
Operating loss (281) (62)
We have reviewed the net assets acquired and concluded that the book value equates to the fair value.
The revenues and profits of the group for the year, had the acquisitions made during the year been made at the beginning of the year,
would have been as follows:
Consolidated
Statement of
Comprehensive
Income for the
year ended
30.6.2015
Pre-acquisition
trading of
Starkstrom,
Woodspeen,
Progility India
Total for the
year ended
30.6.2015 as
though the
acquisition
date was
1.7.2014
£'000 £'000 £'000
Revenue 60,056 12,001 72,057
Operating profit 2,736 68 2,804
3 Segment reporting
Following an internal reorganisation and changes to the composition of its reportable segments the Group has restated the operating
segment information for the year ended 30 June 2015. The Group focuses its internal management reporting on the following segments:
Professional Services - The Group’s Professional operations comprise the training, recruitment and consultancy activities operating in the
UK, Dubai, Australia and New Zealand. Woodspeen Ltd, part of the Professional Services segment, discontinued operations in the
southern part of the UK during the year. Details of the revenue, costs and cash flows of the discontinued operations are included in note
11 to the accounts.
Healthcare – The Group’s Health operations comprise the activities of Starkstrom Limited and Progility DMCC, operating in the UK and
Dubai.
Communications – The Group’s Technology operations comprise the technology solutions goods and services businesses which operate in
Australia and India
The Group measures the operating performance of the business through monthly financial reports on the Professional Services,
Healthcare and Communications segments. These segments are reported because they reflect the management accounting key
indicators which is used to manage the performance of the business. The Group’s chief operating decision maker is the chief executive
officer.
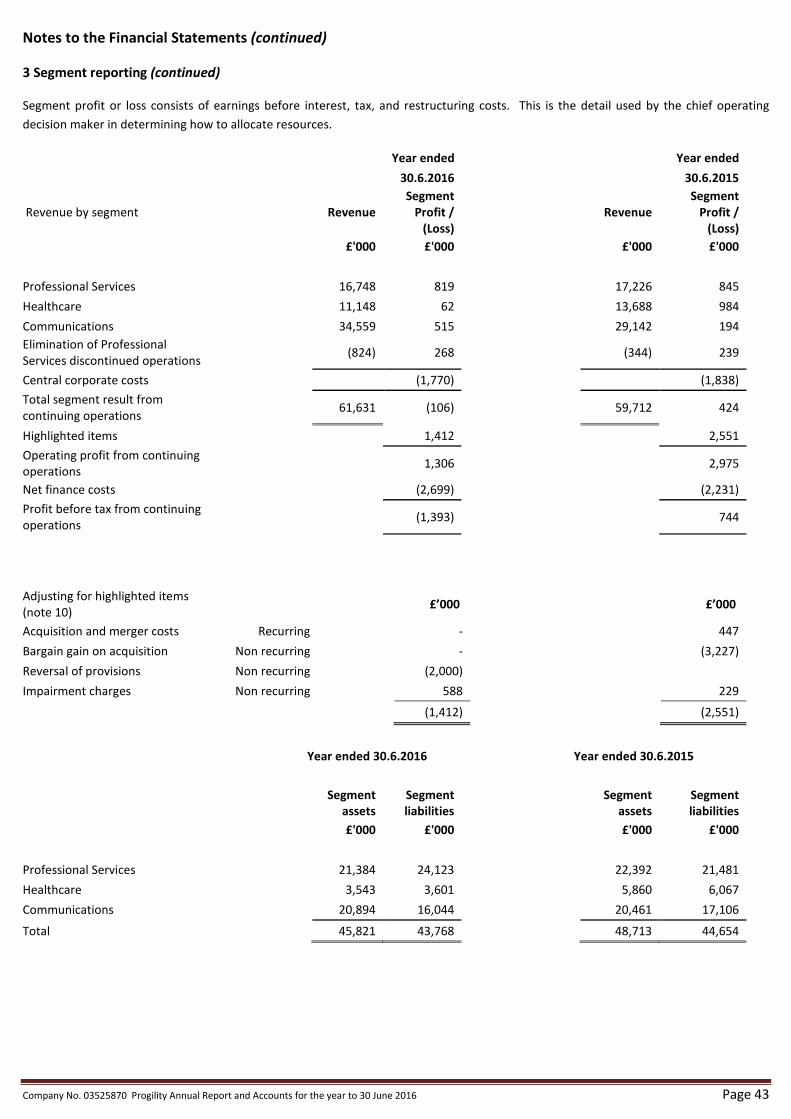
Company No. 03525870 Progility Annual Report and Accounts for the year to 30 June 2016 Page 43
Notes to the Financial Statements (continued)
3 Segment reporting (continued)
Segment profit or loss consists of earnings before interest, tax, and restructuring costs. This is the detail used by the chief operating
decision maker in determining how to allocate resources.
Year ended Year ended
30.6.2016 30.6.2015
Revenue by segment Revenue
Segment
Profit /
(Loss)
Revenue
Segment
Profit /
(Loss)
£'000 £'000 £'000 £'000
Professional Services 16,748 819 17,226 845
Healthcare 11,148 62 13,688 984
Communications 34,559 515 29,142 194
Elimination of Professional
Services discontinued operations (824) 268 (344) 239
Central corporate costs (1,770) (1,838)
Total segment result from
continuing operations 61,631 (106) 59,712 424
Highlighted items 1,412 2,551
Operating profit from continuing
operations 1,306 2,975
Net finance costs (2,699) (2,231)
Profit before tax from continuing
operations (1,393) 744
Adjusting for highlighted items
(note 10) £’000 £’000
Acquisition and merger costs Recurring - 447
Bargain gain on acquisition Non recurring -
(3,227)
Reversal of provisions Non recurring (2,000)
Impairment charges Non recurring 588 229
(1,412) (2,551)
Year ended 30.6.2016 Year ended 30.6.2015
Segment
assets
Segment
liabilities
Segment
assets
Segment
liabilities
£'000 £'000 £'000 £'000
Professional Services 21,384 24,123 22,392 21,481
Healthcare 3,543 3,601 5,860 6,067
Communications 20,894 16,044 20,461 17,106
Total 45,821 43,768 48,713 44,654

Page 44 Company No. 03525870 Progility Annual Report and Accounts for the year to 30 June 2016
Notes to the Financial Statements (continued)
3 Segment reporting (continued)
Revenues for the year and prior year split by geographical area were as follows:
Year ended
30.6.2016
Year ended
30.6.2015
£'000 % £'000 %
UK, Ireland & Europe 25,659 41.6% 28,366 47.5%
Australasia 17,316 28.1% 21,847 36.6%
Middle East and Africa 454 0.7% 607 1.0%
Asia 19,026 30.9% 9,236 15.5%
UK discontinued operations (824) (1.3%) (344) (0.6%)
61,631 100.0% 59,712 100.0%
Note: No individual customer represents more than 10% of the revenue.
4 Revenue
Revenue comprises:
Year ended
30.6.2016
£’000
Continuing
Year ended
30.6.2016
£’000
Discontinued
Year ended
30.6.2016
£’000
Total
Year ended
30.6.2015
£’000
Continuing
Year ended
30.6.2015
£’000
Discontinued
Year ended
30.6.2015
£’000
Total
Rendered Services 23,946 824 24,770 29,491 344 29,835
Goods Sold 37,685 - 37,685 30,221 - 30,221
61,631 824 62,455 59,712 344 60,056
5 Operating profit
Operating profit is stated after charging:
Year ended
30.6.2016
Year ended
30.6.2015
£'000 £'000
Raw materials and consumables 24,141 21,754
Depreciation 776 626
Amortisation 359 528
Impairment 588 229
Loss on disposal 96 86
Bargain gain on acquisition - (3,227)
Release of provision/provision for tax liabilities in India (2,000) 3,000
Exchange losses / (gains) (93) (524)
Operating lease rentals - land and buildings 1,064 1,132
Operating lease rentals – other 758 9
Research and development 110 64
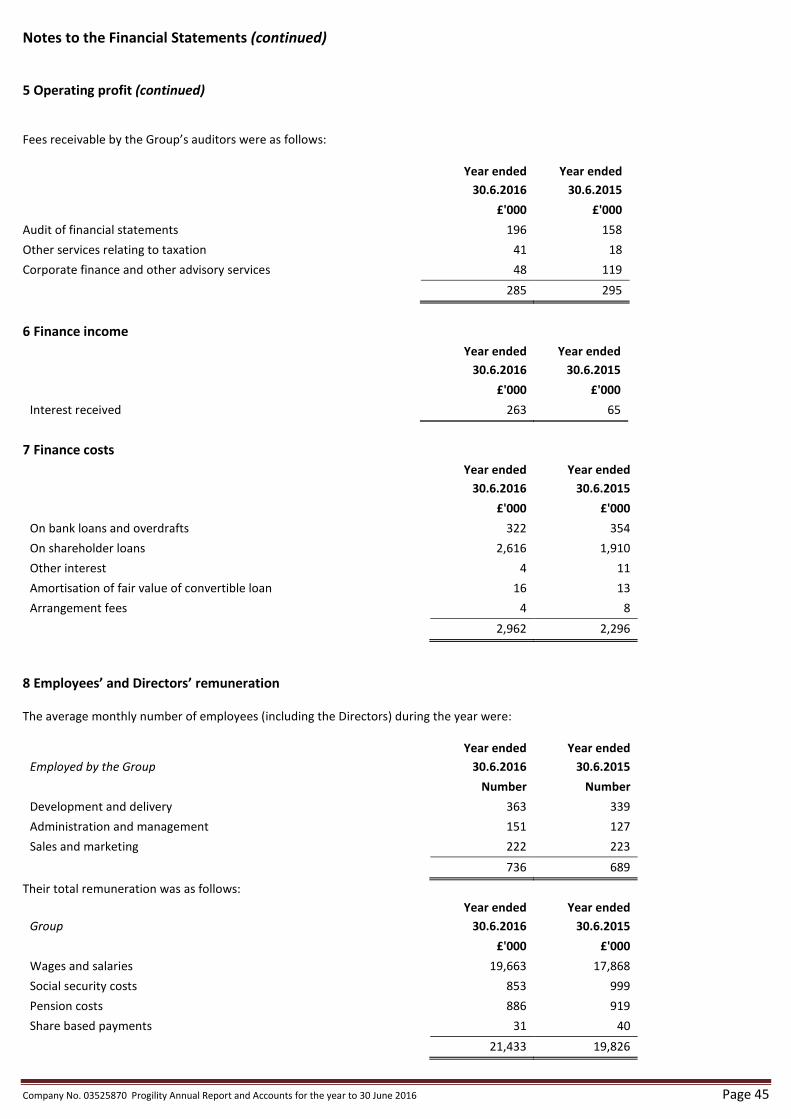
Company No. 03525870 Progility Annual Report and Accounts for the year to 30 June 2016 Page 45
Notes to the Financial Statements (continued)
5 Operating profit (continued)
Fees receivable by the Group’s auditors were as follows:
Year ended
30.6.2016
Year ended
30.6.2015
£'000 £'000
Audit of financial statements 196 158
Other services relating to taxation 41 18
Corporate finance and other advisory services 48 119
285 295
6 Finance income
Year ended
30.6.2016
Year ended
30.6.2015
£'000 £'000
Interest received 263 65
7 Finance costs
Year ended
30.6.2016
Year ended
30.6.2015
£'000 £'000
On bank loans and overdrafts 322 354
On shareholder loans 2,616 1,910
Other interest 4 11
Amortisation of fair value of convertible loan 16 13
Arrangement fees 4 8
2,962 2,296
8 Employees’ and Directors’ remuneration
The average monthly number of employees (including the Directors) during the year were:
Employed by the Group
Year ended
30.6.2016
Year ended
30.6.2015
Number Number
Development and delivery 363 339
Administration and management 151 127
Sales and marketing 222 223
736 689
Their total remuneration was as follows:
Group
Year ended
30.6.2016
Year ended
30.6.2015
£'000 £'000
Wages and salaries 19,663 17,868
Social security costs 853 999
Pension costs 886 919
Share based payments 31 40
21,433 19,826

Page 46 Company No. 03525870 Progility Annual Report and Accounts for the year to 30 June 2016
Notes to the Financial Statements (continued)
8 Employees’ and Directors’ remuneration (continued)
The employees’ and Directors’ remuneration is reflected in the financial statements as follows:
Group Year ended
30.6.2016
Year ended
30.6.2015
£'000 £'000
Cost of sales 7,344 6,877
Administrative expenses 14,062 12,927
Product development capital expenditure - 22
21,406 19,826
Directors' Remuneration
Company
Year ended
30.6.2016
Year ended
30.6.2015
£'000 £'000
Remuneration and other emoluments 378 553
Severance pay 258 80
Pension contributions 33 22
669 655
£'000 £'000
Highest paid Director 277 193
One director was (in 2015, two directors were) accruing benefits under the group pension scheme. A detailed analysis of Directors’
remuneration is provided on page 14.
Key management personnel emoluments
Year ended
30.6.2016
Year ended
30.6.2015
£'000 £'000
Short term employment benefits 1,085 891
Other compensation including pension contributions 151 22
Post-employment benefits 9 -
1,245 913
9 Pension costs
The Company operates a defined contribution pension scheme in respect of the Directors and employees. The scheme and its assets are
held by independent managers. The pension charge represents contributions due from the Company which amounted to £886,000 (2015:
£919,000) plus contributions payable directly to Directors’ and employees’ personal pension schemes which amounted to £33,000 (2015:
£22,000).
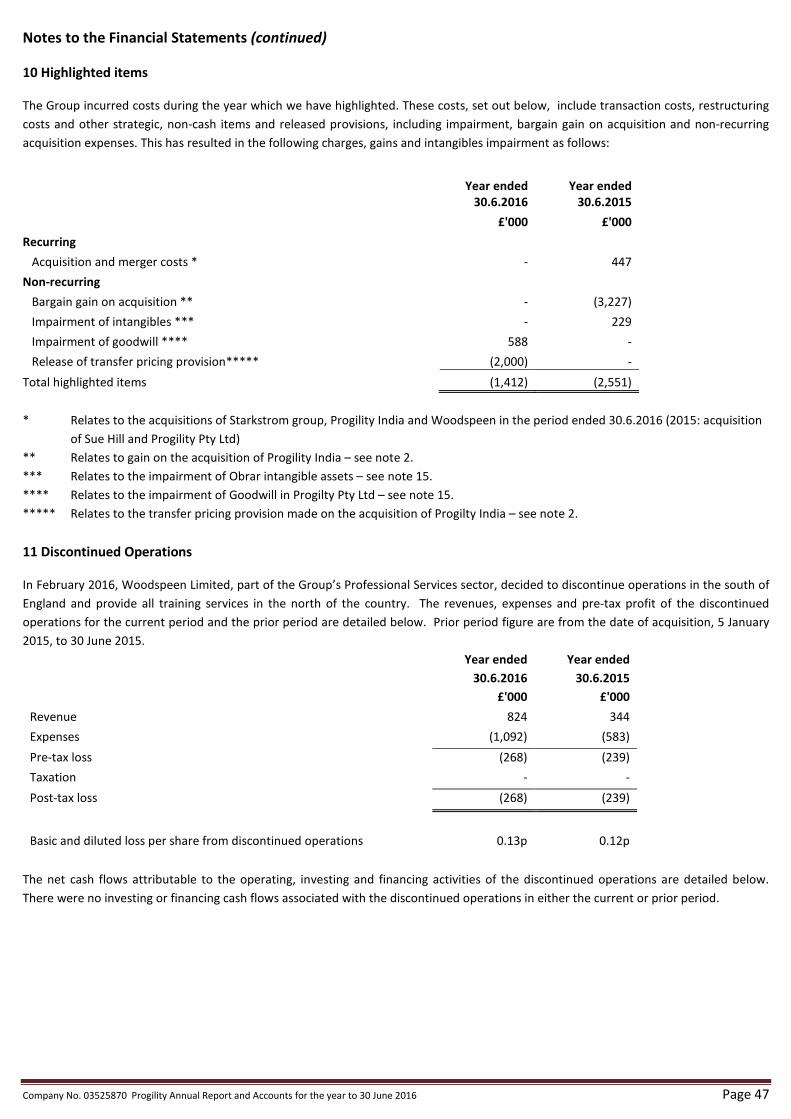
Company No. 03525870 Progility Annual Report and Accounts for the year to 30 June 2016 Page 47
Notes to the Financial Statements (continued)
10 Highlighted items
The Group incurred costs during the year which we have highlighted. These costs, set out below, include transaction costs, restructuring
costs and other strategic, non-cash items and released provisions, including impairment, bargain gain on acquisition and non-recurring
acquisition expenses. This has resulted in the following charges, gains and intangibles impairment as follows:
Year ended
30.6.2016
Year ended
30.6.2015
£'000 £'000
Recurring
Acquisition and merger costs * - 447
Non-recurring
Bargain gain on acquisition ** - (3,227)
Impairment of intangibles *** - 229
Impairment of goodwill **** 588 -
Release of transfer pricing provision***** (2,000) -
Total highlighted items (1,412) (2,551)
* Relates to the acquisitions of Starkstrom group, Progility India and Woodspeen in the period ended 30.6.2016 (2015: acquisition
of Sue Hill and Progility Pty Ltd)
** Relates to gain on the acquisition of Progility India – see note 2.
*** Relates to the impairment of Obrar intangible assets – see note 15.
**** Relates to the impairment of Goodwill in Progilty Pty Ltd – see note 15.
***** Relates to the transfer pricing provision made on the acquisition of Progilty India – see note 2.
11 Discontinued Operations
In February 2016, Woodspeen Limited, part of the Group’s Professional Services sector, decided to discontinue operations in the south of
England and provide all training services in the north of the country. The revenues, expenses and pre-tax profit of the discontinued
operations for the current period and the prior period are detailed below. Prior period figure are from the date of acquisition, 5 January
2015, to 30 June 2015.
Year ended
30.6.2016
Year ended
30.6.2015
£'000 £'000
Revenue 824 344
Expenses (1,092) (583)
Pre-tax loss (268) (239)
Taxation - -
Post-tax loss (268) (239)
Basic and diluted loss per share from discontinued operations 0.13p 0.12p
The net cash flows attributable to the operating, investing and financing activities of the discontinued operations are detailed below.
There were no investing or financing cash flows associated with the discontinued operations in either the current or prior period.
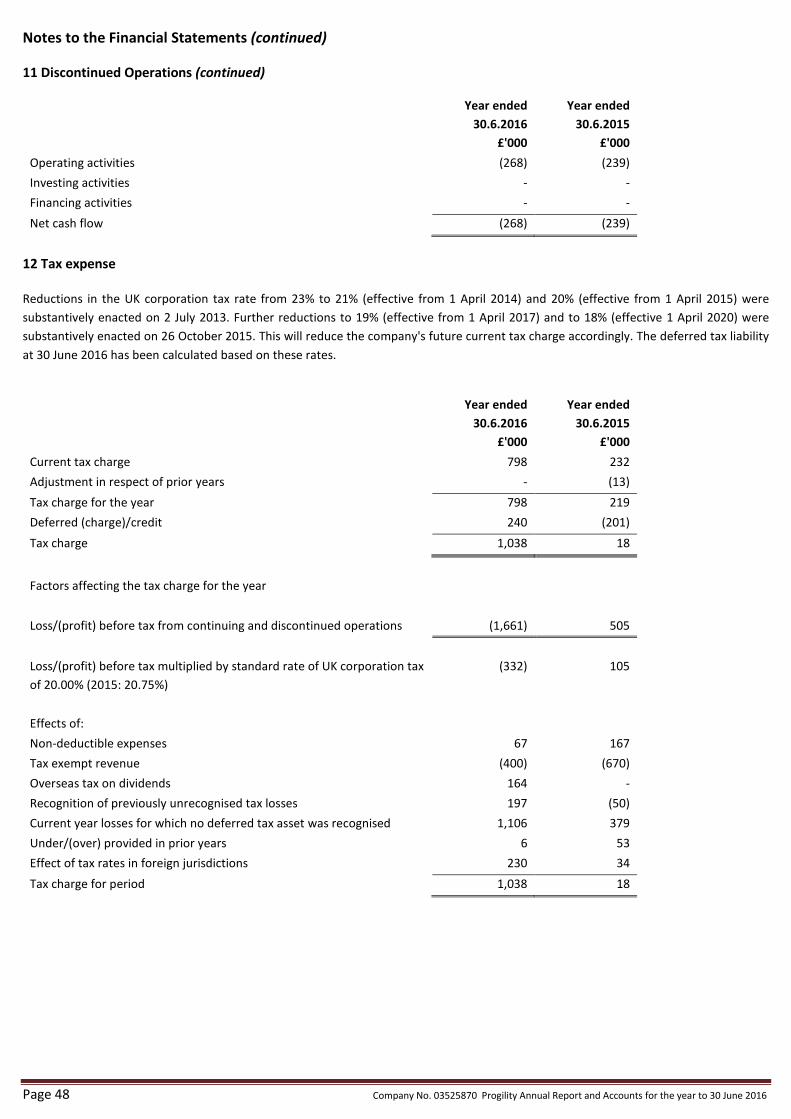
Page 48 Company No. 03525870 Progility Annual Report and Accounts for the year to 30 June 2016
Notes to the Financial Statements (continued)
11 Discontinued Operations (continued)
Year ended
30.6.2016
Year ended
30.6.2015
£'000 £'000
Operating activities (268) (239)
Investing activities - -
Financing activities - -
Net cash flow (268) (239)
12 Tax expense
Reductions in the UK corporation tax rate from 23% to 21% (effective from 1 April 2014) and 20% (effective from 1 April 2015) were
substantively enacted on 2 July 2013. Further reductions to 19% (effective from 1 April 2017) and to 18% (effective 1 April 2020) were
substantively enacted on 26 October 2015. This will reduce the company's future current tax charge accordingly. The deferred tax liability
at 30 June 2016 has been calculated based on these rates.
Year ended
30.6.2016
Year ended
30.6.2015
£'000 £'000
Current tax charge 798 232
Adjustment in respect of prior years - (13)
Tax charge for the year 798 219
Deferred (charge)/credit 240 (201)
Tax charge 1,038 18
Factors affecting the tax charge for the year
Loss/(profit) before tax from continuing and discontinued operations (1,661) 505
Loss/(profit) before tax multiplied by standard rate of UK corporation tax
of 20.00% (2015: 20.75%)
(332) 105
Effects of:
Non-deductible expenses 67 167
Tax exempt revenue (400) (670)
Overseas tax on dividends 164 -
Recognition of previously unrecognised tax losses 197 (50)
Current year losses for which no deferred tax asset was recognised 1,106 379
Under/(over) provided in prior years 6 53
Effect of tax rates in foreign jurisdictions 230 34
Tax charge for period 1,038 18
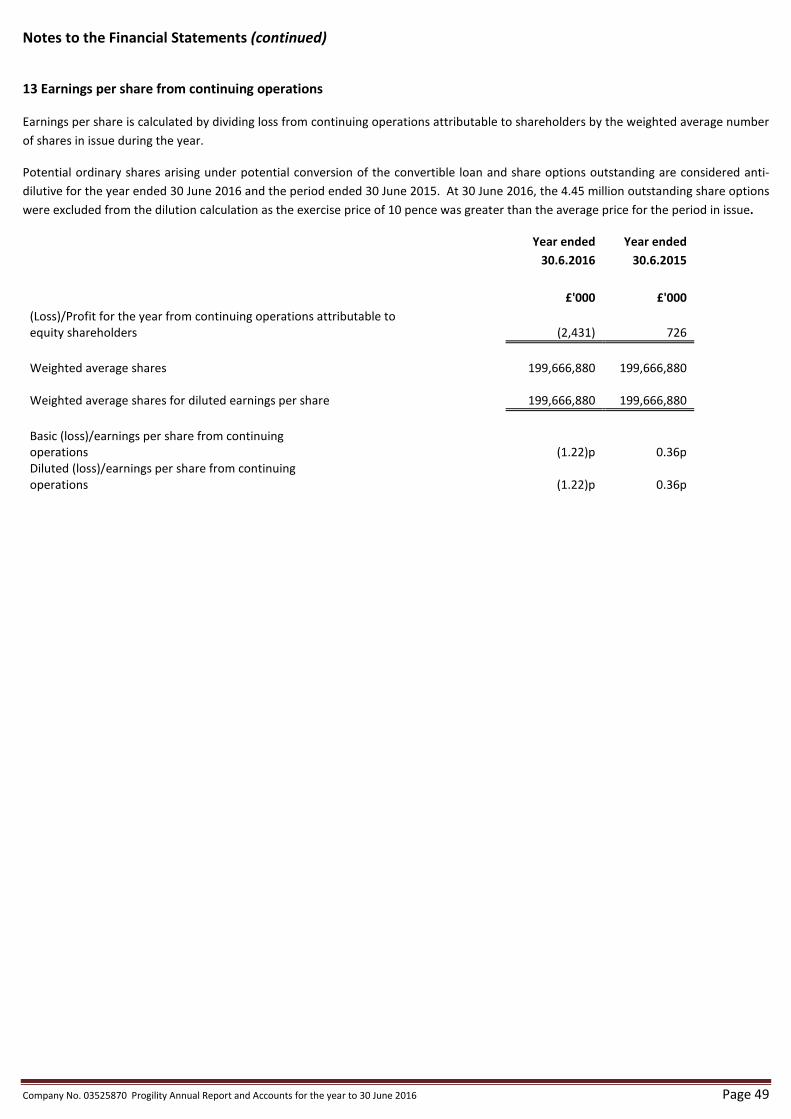
Company No. 03525870 Progility Annual Report and Accounts for the year to 30 June 2016 Page 49
Notes to the Financial Statements (continued)
13 Earnings per share from continuing operations
Earnings per share is calculated by dividing loss from continuing operations attributable to shareholders by the weighted average number
of shares in issue during the year.
Potential ordinary shares arising under potential conversion of the convertible loan and share options outstanding are considered anti-
dilutive for the year ended 30 June 2016 and the period ended 30 June 2015. At 30 June 2016, the 4.45 million outstanding share options
were excluded from the dilution calculation as the exercise price of 10 pence was greater than the average price for the period in issue.
Year ended
30.6.2016
Year ended
30.6.2015
£'000 £'000
(Loss)/Profit for the year from continuing operations attributable to
equity shareholders (2,431) 726
Weighted average shares 199,666,880 199,666,880
Weighted average shares for diluted earnings per share 199,666,880 199,666,880
Basic (loss)/earnings per share from continuing
operations (1.22)p 0.36p
Diluted (loss)/earnings per share from continuing
operations (1.22)p 0.36p

Page 50 Company No. 03525870 Progility Annual Report and Accounts for the year to 30 June 2016
Notes to the Financial Statements (continued)
14 Plant and equipment
Group
Fixtures,
fittings and
equipment
Computer
equipment and
software Motor Vehicles
Leasehold
improvements Total
Cost £'000 £'000 £'000 £'000 £'000
At 30.6.2014 801 774 154 46 1,775
Additions 205 313 37 - 555
Acquired with subsidiary 602 62 156 - 820
Disposals (69) (3) (58) - (130)
Foreign exchange (103) (72) (15) (6) (196)
At 30.6.2015 1,436 1,074 274 40 2,824
Reclassifications (183) 29 154 -
Additions 79 258 51 - 388
Disposals (50) (27) (72) - (149)
Foreign exchange 131 145 13 5 294
At 30.6.2016 1,413 1,479 266 199 3,357
Depreciation
At 30.6.2014 331 474 88 21 914
Charge for the year 320 209 88 9 626
Disposals (1) (2) (41) - (44)
Foreign exchange (52) (55) (10) (4) (121)
At 30.6.2015 598 626 125 26 1,375
Reclassification (113) 17 - 96 -
Charge for the year 385 296 65 30 776
Disposals (34) (9) (10) - (53)
Foreign exchange 114 100 12 4 230
At 30.6.2016 950 1,030 192 156 2,328
Net Book Value
At 30.6.2016 463 449 74 43 1,029
At 30.6.2015 838 448 149 14 1,449
At 30.6.2014 470 300 66 25 861
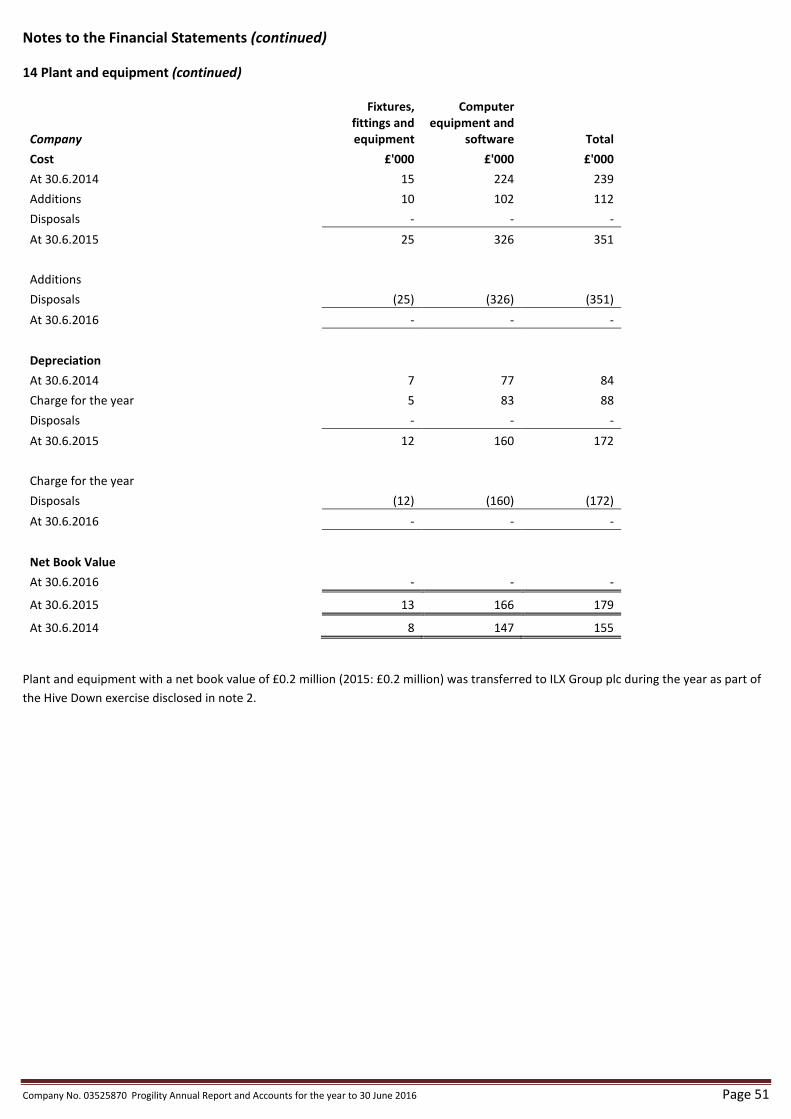
Company No. 03525870 Progility Annual Report and Accounts for the year to 30 June 2016 Page 51
Notes to the Financial Statements (continued)
14 Plant and equipment (continued)
Company
Fixtures,
fittings and
equipment
Computer
equipment and
software Total
Cost £'000 £'000 £'000
At 30.6.2014 15 224 239
Additions 10 102 112
Disposals - - -
At 30.6.2015 25 326 351
Additions
Disposals (25) (326) (351)
At 30.6.2016 - - -
Depreciation
At 30.6.2014 7 77 84
Charge for the year 5 83 88
Disposals - - -
At 30.6.2015 12 160 172
Charge for the year
Disposals (12) (160) (172)
At 30.6.2016 - - -
Net Book Value
At 30.6.2016 - - -
At 30.6.2015 13 166 179
At 30.6.2014 8 147 155
Plant and equipment with a net book value of £0.2 million (2015: £0.2 million) was transferred to ILX Group plc during the year as part of
the Hive Down exercise disclosed in note 2.

Page 52 Company No. 03525870 Progility Annual Report and Accounts for the year to 30 June 2016
Notes to the Financial Statements (continued)
15 Intangible assets
Group Goodwill Brand
Acquired
customer
relationships
Capitalised
development
costs Total
Cost £'000 £'000 £'000 £'000 £'000
At 30.6.2014 12,056 1,133 518 4,531 18,238
Additions 8,643 928 - 52 9,623
Foreign exchange (90) (127) - (35) (252)
At 30.6.2015 20,609 1,934 518 4,548 27,609
Additions - - - 64 64
Disposals (1,602) (1,602)
Foreign exchange 226 21 - 35 282
At 30.6.2016 20,835 1,955 518 3,045 26,353
Impairment and Amortisation
At 30.6.2014 3,840 - 76 2,819 6,735
Impairment charge for the year - - 229 - 229
Amortisation charge for the year 7 - 145 376 528
Foreign exchange - - 1 (19) (18)
At 30.6.2015 3,847 - 451 3,176 7,474
Disposals (1,602) (1,602)
Impairment charge for the year 588 - - - 588
Amortisation charge for the year - - 67 292 359
Foreign exchange - - - 33 33
At 30.6.2016 4,435 - 518 1,899 6,852
Net Book Value
At 30.6.2016 16,400 1,955 - 1,146 19,501
At 30.6.2015 16,762 1,934 67 1,372 20,135
At 30.6.2014 8,216 1,133 442 1,712 11,503
Impairment testing for cash generating units (CGU) containing goodwill
For the purpose of impairment testing, goodwill is allocated to the Group’s operating divisions. The aggregate carrying amounts of
goodwill allocated to each cash generating unit are as follows:
Year ended 30.6.2016 Year ended 30.6.2015
CGU £'000 £'000
ILX Training 7,097 7,097
Woodspeen Training 507 507
Technology 497 859
Recruitment 163 163
Medical 8,136 8,136
16,400 16,762
The recoverable amount of each CGU was based on its value in use and was determined by discounting the future cash flows to be
generated from the continuing use of the CGU.
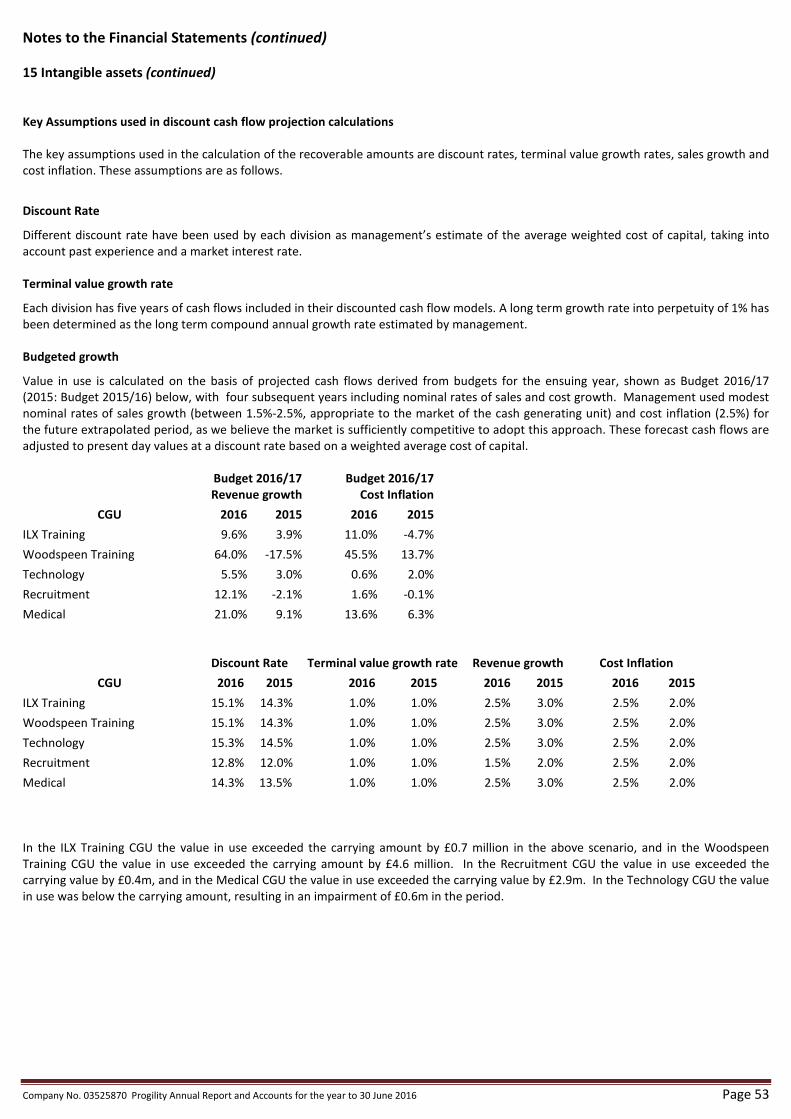
Company No. 03525870 Progility Annual Report and Accounts for the year to 30 June 2016 Page 53
Notes to the Financial Statements (continued)
15 Intangible assets (continued)
Key Assumptions used in discount cash flow projection calculations
The key assumptions used in the calculation of the recoverable amounts are discount rates, terminal value growth rates, sales growth and
cost inflation. These assumptions are as follows.
Discount Rate
Different discount rate have been used by each division as management’s estimate of the average weighted cost of capital, taking into
account past experience and a market interest rate.
Terminal value growth rate
Each division has five years of cash flows included in their discounted cash flow models. A long term growth rate into perpetuity of 1% has
been determined as the long term compound annual growth rate estimated by management.
Budgeted growth
Value in use is calculated on the basis of projected cash flows derived from budgets for the ensuing year, shown as Budget 2016/17
(2015: Budget 2015/16) below, with four subsequent years including nominal rates of sales and cost growth. Management used modest
nominal rates of sales growth (between 1.5%-2.5%, appropriate to the market of the cash generating unit) and cost inflation (2.5%) for
the future extrapolated period, as we believe the market is sufficiently competitive to adopt this approach. These forecast cash flows are
adjusted to present day values at a discount rate based on a weighted average cost of capital.
Budget 2016/17
Revenue growth
Budget 2016/17
Cost Inflation
CGU 2016 2015 2016 2015
ILX Training 9.6% 3.9% 11.0% -4.7%
Woodspeen Training 64.0% -17.5% 45.5% 13.7%
Technology 5.5% 3.0% 0.6% 2.0%
Recruitment 12.1% -2.1% 1.6% -0.1%
Medical 21.0% 9.1% 13.6% 6.3%
Discount Rate Terminal value growth rate Revenue growth Cost Inflation
CGU 2016 2015 2016 2015 2016 2015 2016 2015
ILX Training 15.1% 14.3% 1.0% 1.0% 2.5% 3.0% 2.5% 2.0%
Woodspeen Training 15.1% 14.3% 1.0% 1.0% 2.5% 3.0% 2.5% 2.0%
Technology 15.3% 14.5% 1.0% 1.0% 2.5% 3.0% 2.5% 2.0%
Recruitment 12.8% 12.0% 1.0% 1.0% 1.5% 2.0% 2.5% 2.0%
Medical 14.3% 13.5% 1.0% 1.0% 2.5% 3.0% 2.5% 2.0%
In the ILX Training CGU the value in use exceeded the carrying amount by £0.7 million in the above scenario, and in the Woodspeen
Training CGU the value in use exceeded the carrying amount by £4.6 million. In the Recruitment CGU the value in use exceeded the
carrying value by £0.4m, and in the Medical CGU the value in use exceeded the carrying value by £2.9m. In the Technology CGU the value
in use was below the carrying amount, resulting in an impairment of £0.6m in the period.
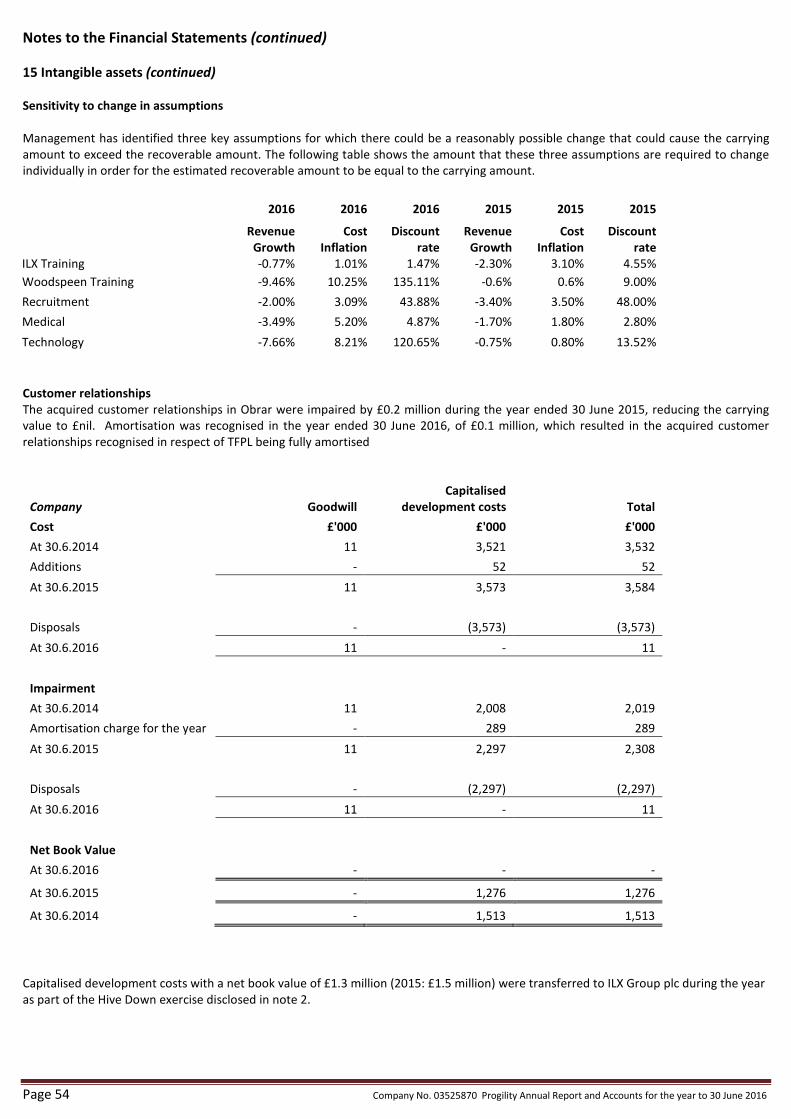
Page 54 Company No. 03525870 Progility Annual Report and Accounts for the year to 30 June 2016
Notes to the Financial Statements (continued)
15 Intangible assets (continued)
Sensitivity to change in assumptions
Management has identified three key assumptions for which there could be a reasonably possible change that could cause the carrying
amount to exceed the recoverable amount. The following table shows the amount that these three assumptions are required to change
individually in order for the estimated recoverable amount to be equal to the carrying amount.
2016 2016 2016 2015 2015 2015
Revenue
Growth
Cost
Inflation
Discount
rate
Revenue
Growth
Cost
Inflation
Discount
rate
ILX Training -0.77% 1.01% 1.47% -2.30% 3.10% 4.55%
Woodspeen Training -9.46% 10.25% 135.11% -0.6% 0.6% 9.00%
Recruitment -2.00% 3.09% 43.88% -3.40% 3.50% 48.00%
Medical -3.49% 5.20% 4.87% -1.70% 1.80% 2.80%
Technology -7.66% 8.21% 120.65% -0.75% 0.80% 13.52%
Customer relationships
The acquired customer relationships in Obrar were impaired by £0.2 million during the year ended 30 June 2015, reducing the carrying
value to £nil. Amortisation was recognised in the year ended 30 June 2016, of £0.1 million, which resulted in the acquired customer
relationships recognised in respect of TFPL being fully amortised
Company Goodwill
Capitalised
development costs Total
Cost £'000 £'000 £'000
At 30.6.2014 11 3,521 3,532
Additions - 52 52
At 30.6.2015 11 3,573 3,584
Disposals - (3,573) (3,573)
At 30.6.2016 11 - 11
Impairment
At 30.6.2014 11 2,008 2,019
Amortisation charge for the year - 289 289
At 30.6.2015 11 2,297 2,308
Disposals - (2,297) (2,297)
At 30.6.2016 11 - 11
Net Book Value
At 30.6.2016 - - -
At 30.6.2015 - 1,276 1,276
At 30.6.2014 - 1,513 1,513
Capitalised development costs with a net book value of £1.3 million (2015: £1.5 million) were transferred to ILX Group plc during the year
as part of the Hive Down exercise disclosed in note 2.
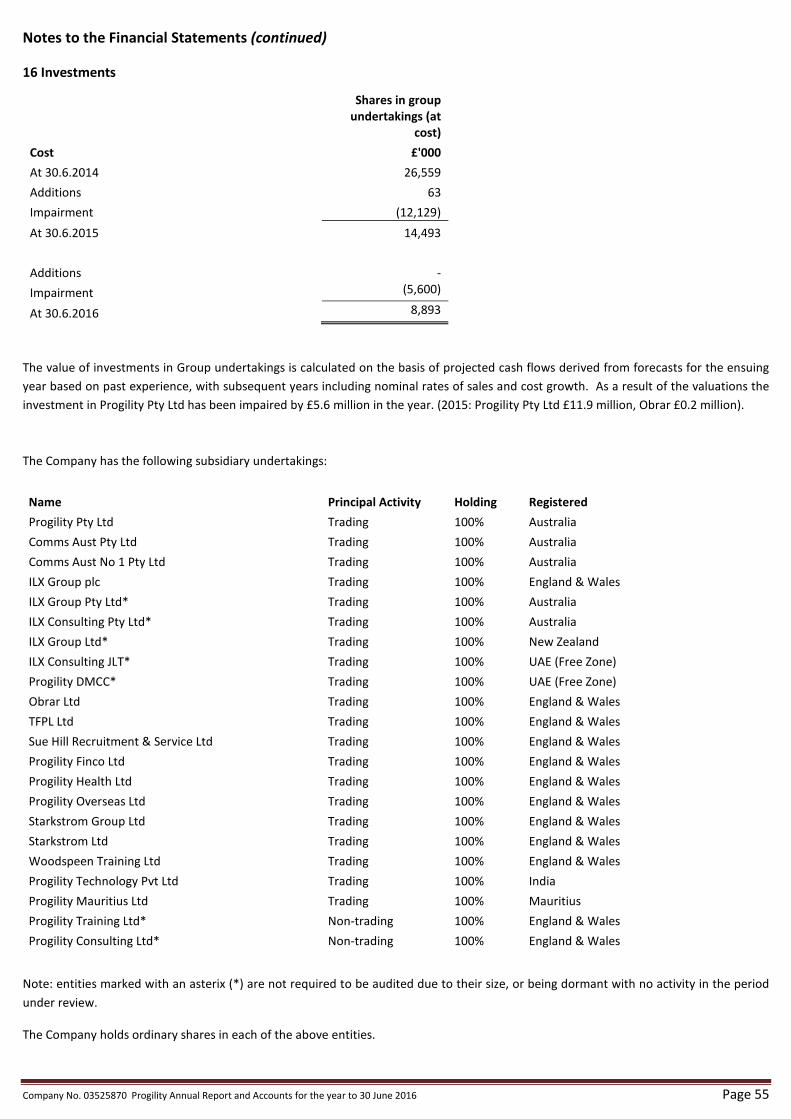
Company No. 03525870 Progility Annual Report and Accounts for the year to 30 June 2016 Page 55
Notes to the Financial Statements (continued)
16 Investments
Shares in group
undertakings (at
cost)
Cost £'000
At 30.6.2014 26,559
Additions 63
Impairment (12,129)
At 30.6.2015 14,493
Additions -
Impairment (5,600)
At 30.6.2016 8,893
The value of investments in Group undertakings is calculated on the basis of projected cash flows derived from forecasts for the ensuing
year based on past experience, with subsequent years including nominal rates of sales and cost growth. As a result of the valuations the
investment in Progility Pty Ltd has been impaired by £5.6 million in the year. (2015: Progility Pty Ltd £11.9 million, Obrar £0.2 million).
The Company has the following subsidiary undertakings:
Name Principal Activity Holding Registered
Progility Pty Ltd Trading 100% Australia
Comms Aust Pty Ltd Trading 100% Australia
Comms Aust No 1 Pty Ltd Trading 100% Australia
ILX Group plc Trading 100% England & Wales
ILX Group Pty Ltd* Trading 100% Australia
ILX Consulting Pty Ltd* Trading 100% Australia
ILX Group Ltd* Trading 100% New Zealand
ILX Consulting JLT* Trading 100% UAE (Free Zone)
Progility DMCC* Trading 100% UAE (Free Zone)
Obrar Ltd Trading 100% England & Wales
TFPL Ltd Trading 100% England & Wales
Sue Hill Recruitment & Service Ltd Trading 100% England & Wales
Progility Finco Ltd Trading 100% England & Wales
Progility Health Ltd Trading 100% England & Wales
Progility Overseas Ltd Trading 100% England & Wales
Starkstrom Group Ltd Trading 100% England & Wales
Starkstrom Ltd Trading 100% England & Wales
Woodspeen Training Ltd Trading 100% England & Wales
Progility Technology Pvt Ltd Trading 100% India
Progility Mauritius Ltd Trading 100% Mauritius
Progility Training Ltd* Non-trading 100% England & Wales
Progility Consulting Ltd* Non-trading 100% England & Wales
Note: entities marked with an asterix (*) are not required to be audited due to their size, or being dormant with no activity in the period
under review.
The Company holds ordinary shares in each of the above entities.

Page 56 Company No. 03525870 Progility Annual Report and Accounts for the year to 30 June 2016
Notes to the Financial Statements (continued)
17 Deferred Taxation
The following are the major deferred tax assets recognised by the Group.
Group Assets Liabilities
2016 2015 2016 2015
£'000 £'000 £'000 £'000
Intangible assets - - 186 199
Provisions 622 614 - -
Tax value of loss carry-forwards 87 274 - -
Tax assets/liabilities 709 888 186 199
Group (continued)
Movement in deferred tax
As at
30.6.2015
Recognised in
income
Exchange
difference
Acquired in
business
combination
As at
30.6.2016
Intangible assets (199) 13 - - (186)
Provisions 614 (51) 59 0 622
Tax value of loss carry-forwards 274 (202) 15 0 87
689 (240) 74 - 523
As at
30.6.2014
Recognised in
income
Exchange
difference
Acquired in
business
combination
As at
30.6.2015
Intangible assets (91) 77 - (185) (199)
Provisions 3 59 (21) 573 614
Tax value of loss carry-forwards 274 65 (65) 0 274
186 201 (86) 388 689
Deferred tax assets at 30 June 2016 of £1.5 million (2015: £1.7 million) have not been recognised in respect of tax losses, because it is not
probable that future taxable profit will be available against which the Group can use the benefits.
Company Assets Liabilities
2016 2015 2016 2015
£'000 £'000 £'000 £'000
Provisions - (5) - -
Tax value of loss carry-forwards - 202 - -
Tax assets/liabilities - 197 - -
As a result of the Hive Down of the Professional Services UK business to ILXGroup plc, on 1 July 2015, the tax value of loss carry forwards
has been derecognised in the Company as it no longer carries on a trade against which the tax value of loss carry forwards can be
recovered.
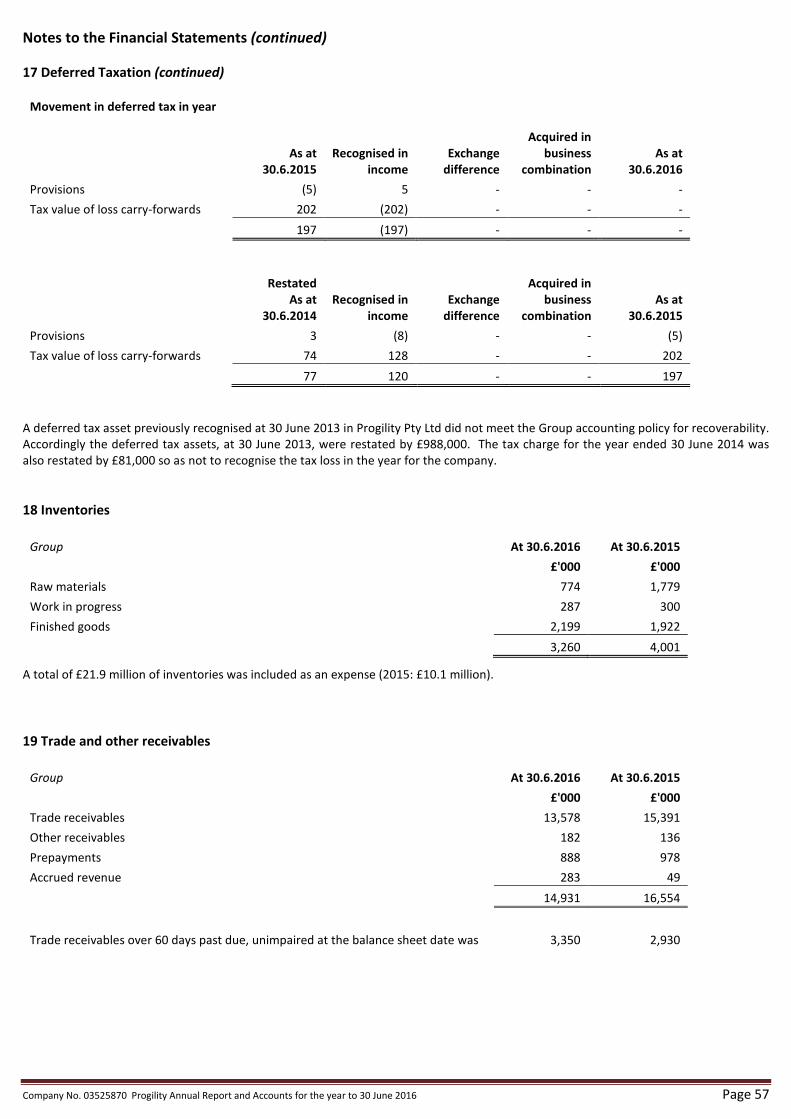
Company No. 03525870 Progility Annual Report and Accounts for the year to 30 June 2016 Page 57
Notes to the Financial Statements (continued)
17 Deferred Taxation (continued)
Movement in deferred tax in year
As at
30.6.2015
Recognised in
income
Exchange
difference
Acquired in
business
combination
As at
30.6.2016
Provisions (5) 5 - - -
Tax value of loss carry-forwards 202 (202) - - -
197 (197) - - -
Restated
As at
30.6.2014
Recognised in
income
Exchange
difference
Acquired in
business
combination
As at
30.6.2015
Provisions 3 (8) - - (5)
Tax value of loss carry-forwards 74 128 - - 202
77 120 - - 197
A deferred tax asset previously recognised at 30 June 2013 in Progility Pty Ltd did not meet the Group accounting policy for recoverability.
Accordingly the deferred tax assets, at 30 June 2013, were restated by £988,000. The tax charge for the year ended 30 June 2014 was
also restated by £81,000 so as not to recognise the tax loss in the year for the company.
18 Inventories
Group At 30.6.2016 At 30.6.2015
£'000 £'000
Raw materials 774 1,779
Work in progress 287 300
Finished goods 2,199 1,922
3,260 4,001
A total of £21.9 million of inventories was included as an expense (2015: £10.1 million).
19 Trade and other receivables
Group At 30.6.2016 At 30.6.2015
£'000 £'000
Trade receivables 13,578 15,391
Other receivables 182 136
Prepayments 888 978
Accrued revenue 283 49
14,931 16,554
Trade receivables over 60 days past due, unimpaired at the balance sheet date was 3,350 2,930
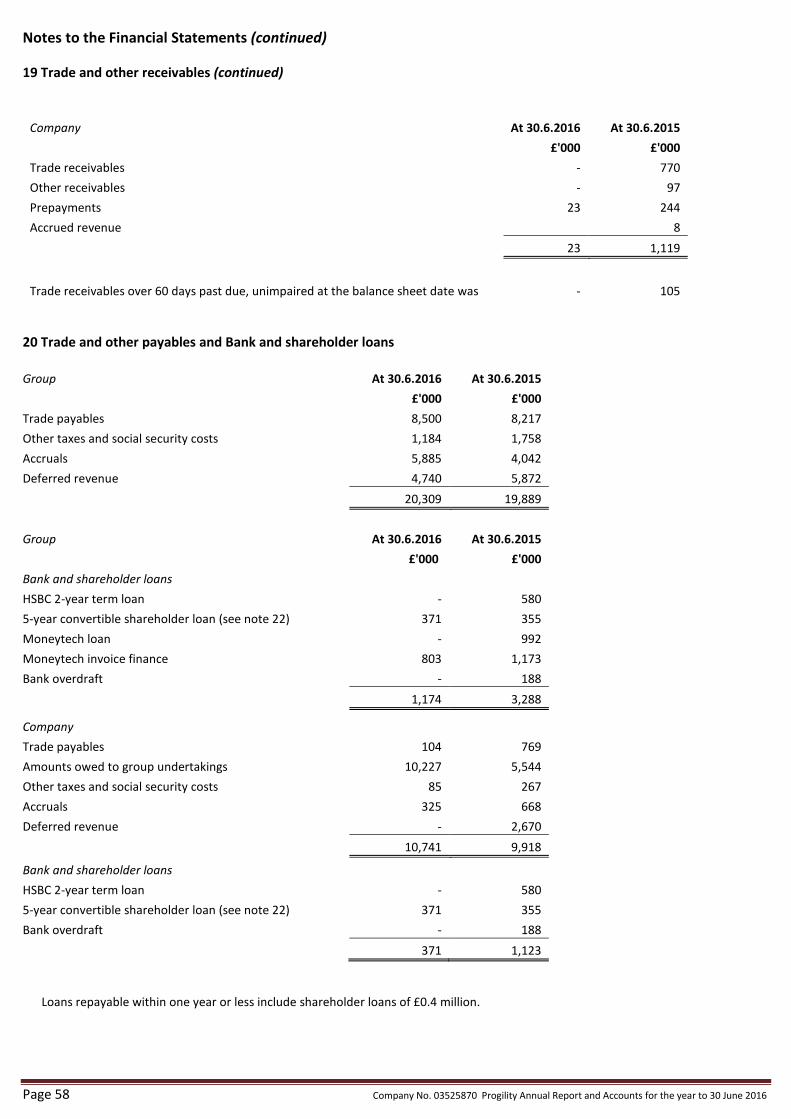
Page 58 Company No. 03525870 Progility Annual Report and Accounts for the year to 30 June 2016
Notes to the Financial Statements (continued)
19 Trade and other receivables (continued)
Company At 30.6.2016 At 30.6.2015
£'000 £'000
Trade receivables - 770
Other receivables - 97
Prepayments 23 244
Accrued revenue 8
23 1,119
Trade receivables over 60 days past due, unimpaired at the balance sheet date was - 105
20 Trade and other payables and Bank and shareholder loans
Group At 30.6.2016 At 30.6.2015
£'000 £'000
Trade payables 8,500 8,217
Other taxes and social security costs 1,184 1,758
Accruals 5,885 4,042
Deferred revenue 4,740 5,872
20,309 19,889
Group At 30.6.2016 At 30.6.2015
£'000 £'000
Bank and shareholder loans
HSBC 2-year term loan - 580
5-year convertible shareholder loan (see note 22) 371 355
Moneytech loan - 992
Moneytech invoice finance 803 1,173
Bank overdraft - 188
1,174 3,288
Company
Trade payables 104 769
Amounts owed to group undertakings 10,227 5,544
Other taxes and social security costs 85 267
Accruals 325 668
Deferred revenue - 2,670
10,741 9,918
Bank and shareholder loans
HSBC 2-year term loan - 580
5-year convertible shareholder loan (see note 22) 371 355
Bank overdraft - 188
371 1,123
Loans repayable within one year or less include shareholder loans of £0.4 million.
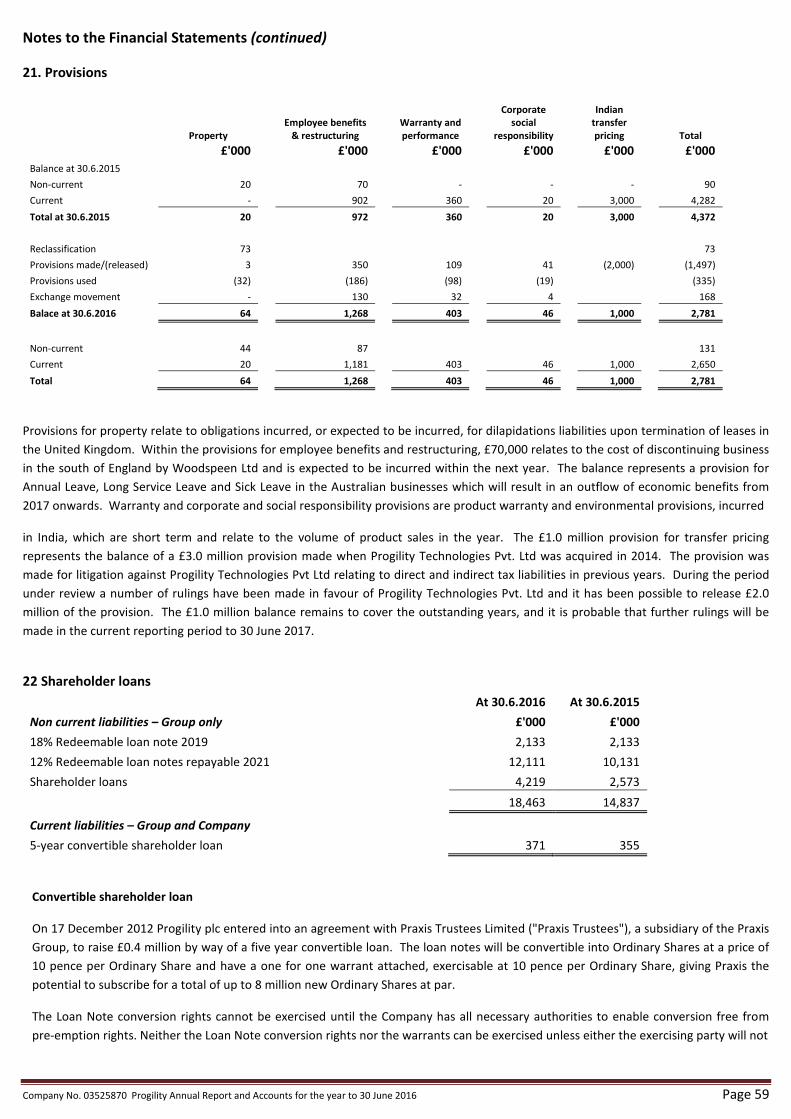
Company No. 03525870 Progility Annual Report and Accounts for the year to 30 June 2016 Page 59
Notes to the Financial Statements (continued)
21. Provisions
Property
Employee benefits
& restructuring
Warranty and
performance
Corporate
social
responsibility
Indian
transfer
pricing Total
£'000 £'000 £'000 £'000 £'000 £'000
Balance at 30.6.2015
Non-current 20 70 - - - 90
Current - 902 360 20 3,000 4,282
Total at 30.6.2015 20 972 360 20 3,000 4,372
Reclassification 73 73
Provisions made/(released) 3 350 109 41 (2,000) (1,497)
Provisions used (32) (186) (98) (19) (335)
Exchange movement - 130 32 4 168
Balace at 30.6.2016 64 1,268 403 46 1,000 2,781
Non-current 44 87 131
Current 20 1,181 403 46 1,000 2,650
Total 64 1,268 403 46 1,000 2,781
Provisions for property relate to obligations incurred, or expected to be incurred, for dilapidations liabilities upon termination of leases in
the United Kingdom. Within the provisions for employee benefits and restructuring, £70,000 relates to the cost of discontinuing business
in the south of England by Woodspeen Ltd and is expected to be incurred within the next year. The balance represents a provision for
Annual Leave, Long Service Leave and Sick Leave in the Australian businesses which will result in an outflow of economic benefits from
2017 onwards. Warranty and corporate and social responsibility provisions are product warranty and environmental provisions, incurred
in India, which are short term and relate to the volume of product sales in the year. The £1.0 million provision for transfer pricing
represents the balance of a £3.0 million provision made when Progility Technologies Pvt. Ltd was acquired in 2014. The provision was
made for litigation against Progility Technologies Pvt Ltd relating to direct and indirect tax liabilities in previous years. During the period
under review a number of rulings have been made in favour of Progility Technologies Pvt. Ltd and it has been possible to release £2.0
million of the provision. The £1.0 million balance remains to cover the outstanding years, and it is probable that further rulings will be
made in the current reporting period to 30 June 2017.
22 Shareholder loans
At 30.6.2016 At 30.6.2015
Non current liabilities – Group only £'000 £'000
18% Redeemable loan note 2019 2,133 2,133
12% Redeemable loan notes repayable 2021 12,111 10,131
Shareholder loans 4,219 2,573
18,463 14,837
Current liabilities – Group and Company
5-year convertible shareholder loan 371 355
Convertible shareholder loan
On 17 December 2012 Progility plc entered into an agreement with Praxis Trustees Limited ("Praxis Trustees"), a subsidiary of the Praxis
Group, to raise £0.4 million by way of a five year convertible loan. The loan notes will be convertible into Ordinary Shares at a price of
10 pence per Ordinary Share and have a one for one warrant attached, exercisable at 10 pence per Ordinary Share, giving Praxis the
potential to subscribe for a total of up to 8 million new Ordinary Shares at par.
The Loan Note conversion rights cannot be exercised until the Company has all necessary authorities to enable conversion free from
pre-emption rights. Neither the Loan Note conversion rights nor the warrants can be exercised unless either the exercising party will not

Page 60 Company No. 03525870 Progility Annual Report and Accounts for the year to 30 June 2016
Notes to the Financial Statements (continued)
22 Shareholder loans (continued)
incur a City Code mandatory offer obligation or it obtains a dispensation from such obligation. Subject to these conditions being
fulfilled, the loan notes can be converted by Praxis Trustees giving the Company 14 days notice.
18% Redeemable loan note 2019
During the period under review the repayment date for the £2.1 million (2015 £2.1 million) redeemable loan note was extended from 2
April 2016 to 1 April 2019.
12% Redeemable loan notes
The £12.1 million (2015: £10.1 million) of loan notes are issued, by Progility Finco Ltd, under a £50.0 million facility and become
repayable in July 2021 or before.
23 Share capital and reserves
As at 30.6.2016 As at 30.6.2015
£'000 £'000
Allotted, called up and fully paid equity:
Ordinary shares of 10p each 19,967 19,967
Issued and fully paid ordinary shares of 10 pence each
Number of
ordinary shares £'000
At 30.6.2015 and 30.6.2016 199,666,880 19,967
Share premium account
This reserve records the consideration premium for shares issued at a value that exceeds their nominal value, less any costs incurred
by the Company relating directly to the issue of these shares.
Other reserve
This reserve records the difference between the proceeds of issue of the convertible loan note and the fair value assigned to the
liability component, representing the embedded option to convert the liability into equity of the Group, as outlined in note 22.
Merger reserve
This reserve records the difference between the nominal value of the shares issued and fair value of other consideration given and the
nominal value of the share capital and other reserves received in a business combination under common control.
Own shares in trust
This reserve records the purchase cost of shares by Investec Trust held in the Group’s medium term incentive plan trust. Further
details are contained in note 24.
Share option reserve
This reserve records the cumulative charges to profit with respect to unexercised share options.
Foreign currency translation reserve
The translation reserve comprise all foreign currency differences arising from the translation of the financial statements of foreign
operations.
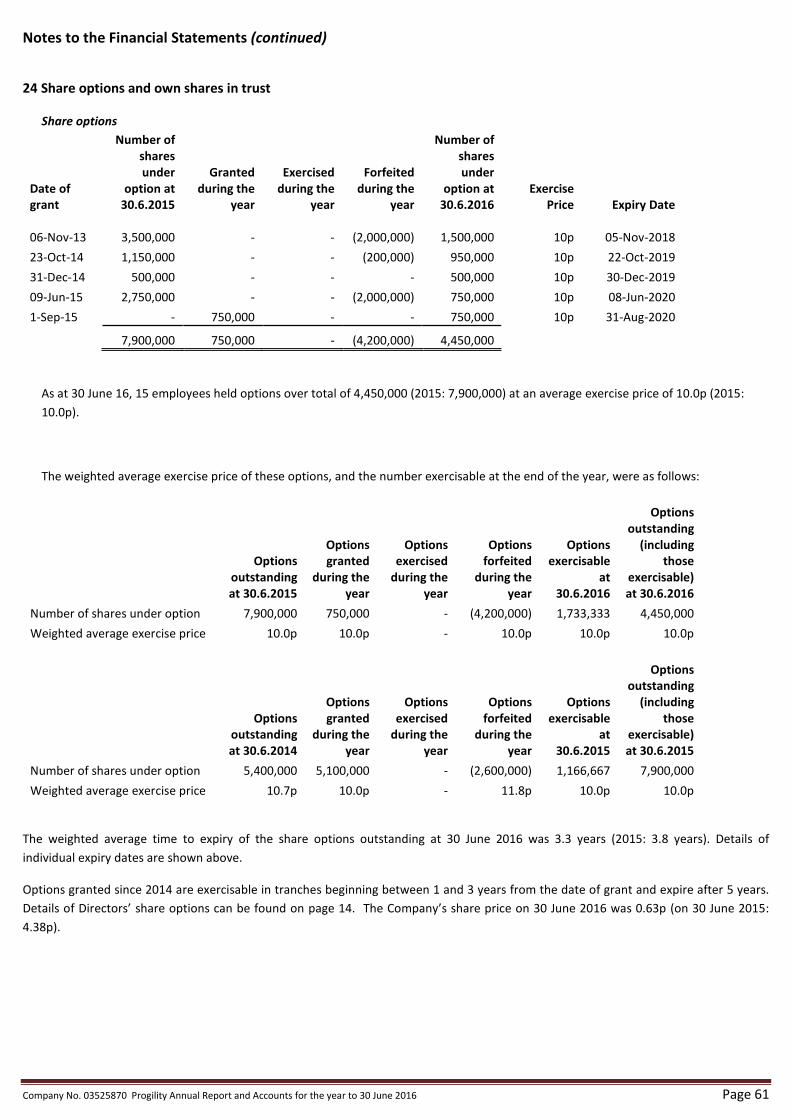
Company No. 03525870 Progility Annual Report and Accounts for the year to 30 June 2016 Page 61
Notes to the Financial Statements (continued)
24 Share options and own shares in trust
Share options
Date of
grant
Number of
shares
under
option at
30.6.2015
Granted
during the
year
Exercised
during the
year
Forfeited
during the
year
Number of
shares
under
option at
30.6.2016
Exercise
Price Expiry Date
06-Nov-13 3,500,000 - - (2,000,000) 1,500,000 10p 05-Nov-2018
23-Oct-14 1,150,000 - - (200,000) 950,000 10p 22-Oct-2019
31-Dec-14 500,000 - - - 500,000 10p 30-Dec-2019
09-Jun-15 2,750,000 - - (2,000,000) 750,000 10p 08-Jun-2020
1-Sep-15 - 750,000 - - 750,000 10p 31-Aug-2020
7,900,000 750,000 - (4,200,000) 4,450,000
As at 30 June 16, 15 employees held options over total of 4,450,000 (2015: 7,900,000) at an average exercise price of 10.0p (2015:
10.0p).
The weighted average exercise price of these options, and the number exercisable at the end of the year, were as follows:
Options
outstanding
at 30.6.2015
Options
granted
during the
year
Options
exercised
during the
year
Options
forfeited
during the
year
Options
exercisable
at
30.6.2016
Options
outstanding
(including
those
exercisable)
at 30.6.2016
Number of shares under option 7,900,000 750,000 - (4,200,000) 1,733,333 4,450,000
Weighted average exercise price 10.0p 10.0p - 10.0p 10.0p 10.0p
Options
outstanding
at 30.6.2014
Options
granted
during the
year
Options
exercised
during the
year
Options
forfeited
during the
year
Options
exercisable
at
30.6.2015
Options
outstanding
(including
those
exercisable)
at 30.6.2015
Number of shares under option 5,400,000 5,100,000 - (2,600,000) 1,166,667 7,900,000
Weighted average exercise price 10.7p 10.0p - 11.8p 10.0p 10.0p
The weighted average time to expiry of the share options outstanding at 30 June 2016 was 3.3 years (2015: 3.8 years). Details of
individual expiry dates are shown above.
Options granted since 2014 are exercisable in tranches beginning between 1 and 3 years from the date of grant and expire after 5 years.
Details of Directors’ share options can be found on page 14. The Company’s share price on 30 June 2016 was 0.63p (on 30 June 2015:
4.38p).
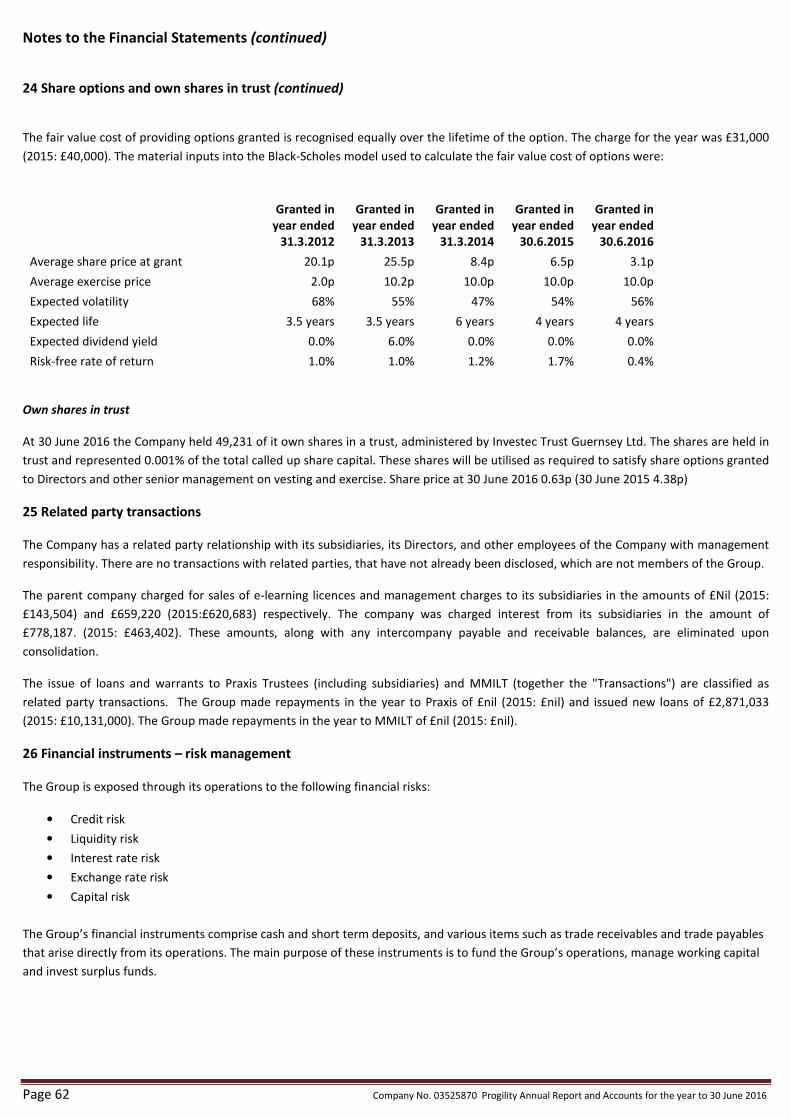
Page 62 Company No. 03525870 Progility Annual Report and Accounts for the year to 30 June 2016
Notes to the Financial Statements (continued)
24 Share options and own shares in trust (continued)
The fair value cost of providing options granted is recognised equally over the lifetime of the option. The charge for the year was £31,000
(2015: £40,000). The material inputs into the Black-Scholes model used to calculate the fair value cost of options were:
Granted in
year ended
31.3.2012
Granted in
year ended
31.3.2013
Granted in
year ended
31.3.2014
Granted in
year ended
30.6.2015
Granted in
year ended
30.6.2016
Average share price at grant 20.1p 25.5p 8.4p 6.5p 3.1p
Average exercise price 2.0p 10.2p 10.0p 10.0p 10.0p
Expected volatility 68% 55% 47% 54% 56%
Expected life 3.5 years 3.5 years 6 years 4 years 4 years
Expected dividend yield 0.0% 6.0% 0.0% 0.0% 0.0%
Risk-free rate of return 1.0% 1.0% 1.2% 1.7% 0.4%
Own shares in trust
At 30 June 2016 the Company held 49,231 of it own shares in a trust, administered by Investec Trust Guernsey Ltd. The shares are held in
trust and represented 0.001% of the total called up share capital. These shares will be utilised as required to satisfy share options granted
to Directors and other senior management on vesting and exercise. Share price at 30 June 2016 0.63p (30 June 2015 4.38p)
25 Related party transactions
The Company has a related party relationship with its subsidiaries, its Directors, and other employees of the Company with management
responsibility. There are no transactions with related parties, that have not already been disclosed, which are not members of the Group.
The parent company charged for sales of e-learning licences and management charges to its subsidiaries in the amounts of £Nil (2015:
£143,504) and £659,220 (2015:£620,683) respectively. The company was charged interest from its subsidiaries in the amount of
£778,187. (2015: £463,402). These amounts, along with any intercompany payable and receivable balances, are eliminated upon
consolidation.
The issue of loans and warrants to Praxis Trustees (including subsidiaries) and MMILT (together the "Transactions") are classified as
related party transactions. The Group made repayments in the year to Praxis of £nil (2015: £nil) and issued new loans of £2,871,033
(2015: £10,131,000). The Group made repayments in the year to MMILT of £nil (2015: £nil).
26 Financial instruments – risk management
The Group is exposed through its operations to the following financial risks:
• Credit risk
• Liquidity risk
• Interest rate risk
• Exchange rate risk
• Capital risk
The Group’s financial instruments comprise cash and short term deposits, and various items such as trade receivables and trade payables
that arise directly from its operations. The main purpose of these instruments is to fund the Group’s operations, manage working capital
and invest surplus funds.
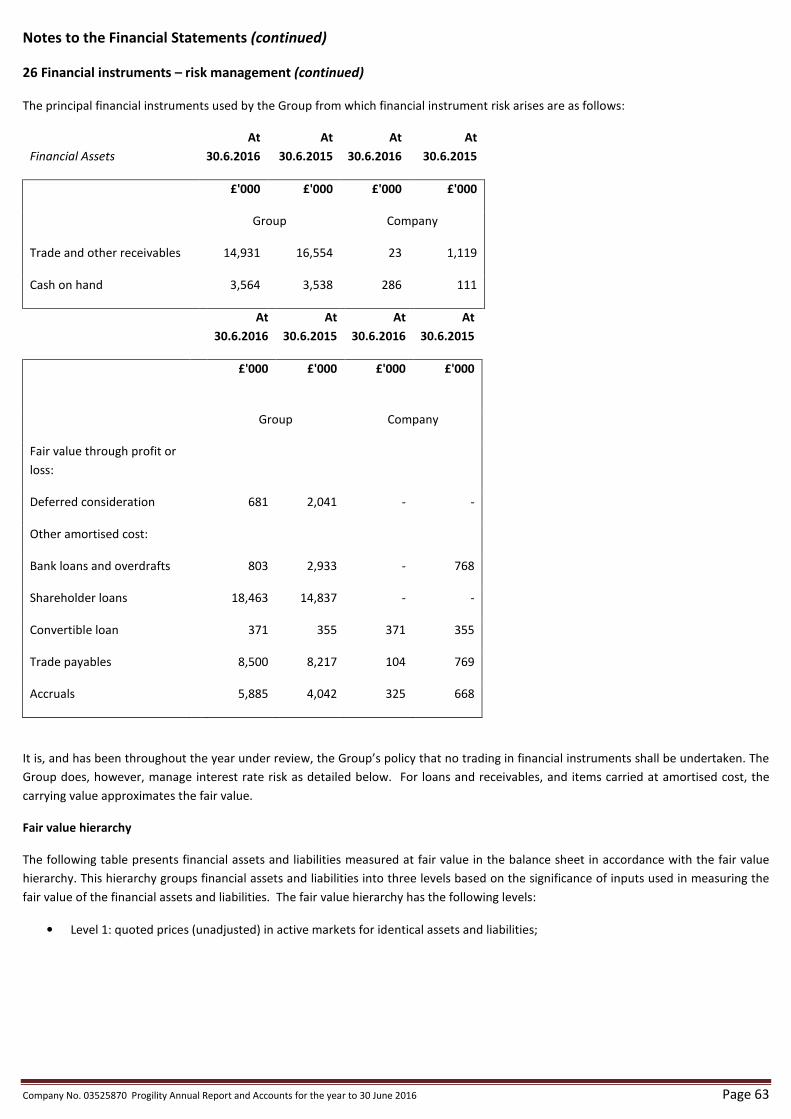
Company No. 03525870 Progility Annual Report and Accounts for the year to 30 June 2016 Page 63
Notes to the Financial Statements (continued)
26 Financial instruments – risk management (continued)
The principal financial instruments used by the Group from which financial instrument risk arises are as follows:
Financial Assets
At
30.6.2016
At
30.6.2015
At
30.6.2016
At
30.6.2015
£'000 £'000 £'000 £'000
Group Company
Trade and other receivables 14,931 16,554 23 1,119
Cash on hand 3,564 3,538 286 111
At
30.6.2016
At
30.6.2015
At
30.6.2016
At
30.6.2015
£'000
£'000
£'000
£'000
Group Company
Fair value through profit or
loss:
Deferred consideration 681 2,041 - -
Other amortised cost:
Bank loans and overdrafts 803 2,933 - 768
Shareholder loans 18,463 14,837 - -
Convertible loan 371 355 371 355
Trade payables 8,500 8,217 104 769
Accruals 5,885 4,042 325 668
It is, and has been throughout the year under review, the Group’s policy that no trading in financial instruments shall be undertaken. The
Group does, however, manage interest rate risk as detailed below. For loans and receivables, and items carried at amortised cost, the
carrying value approximates the fair value.
Fair value hierarchy
The following table presents financial assets and liabilities measured at fair value in the balance sheet in accordance with the fair value
hierarchy. This hierarchy groups financial assets and liabilities into three levels based on the significance of inputs used in measuring the
fair value of the financial assets and liabilities. The fair value hierarchy has the following levels:
• Level 1: quoted prices (unadjusted) in active markets for identical assets and liabilities;
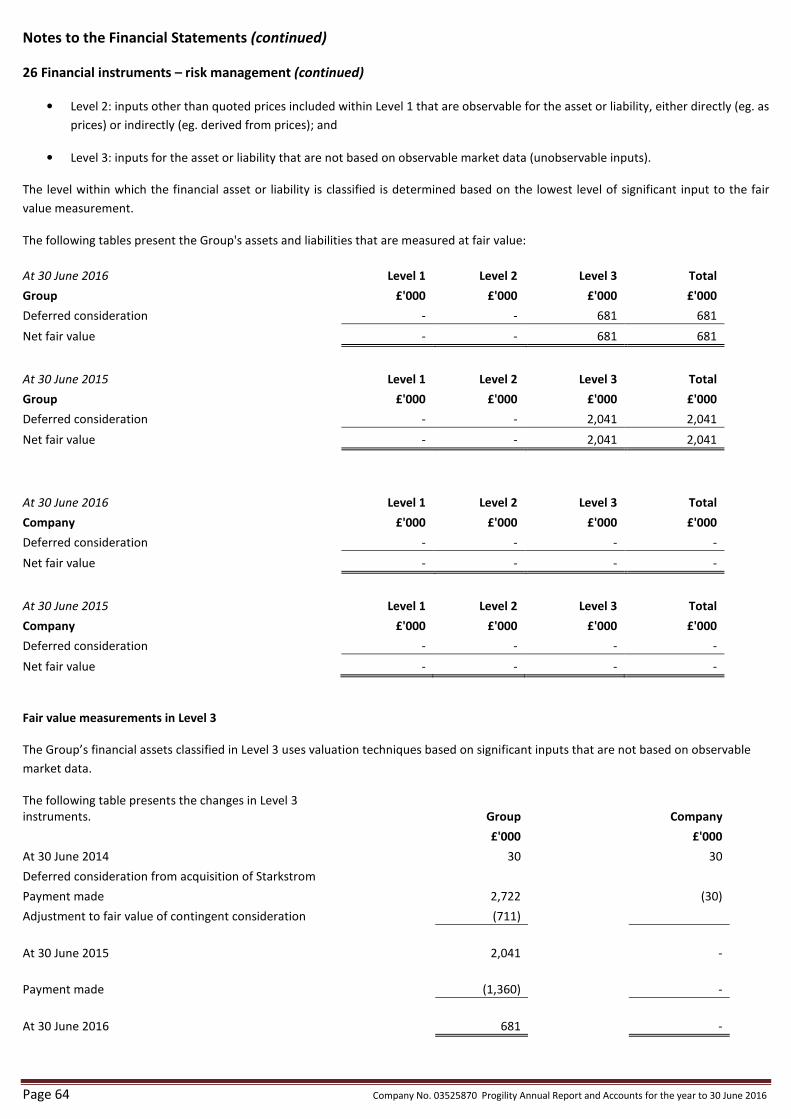
Page 64 Company No. 03525870 Progility Annual Report and Accounts for the year to 30 June 2016
Notes to the Financial Statements (continued)
26 Financial instruments – risk management (continued)
• Level 2: inputs other than quoted prices included within Level 1 that are observable for the asset or liability, either directly (eg. as
prices) or indirectly (eg. derived from prices); and
• Level 3: inputs for the asset or liability that are not based on observable market data (unobservable inputs).
The level within which the financial asset or liability is classified is determined based on the lowest level of significant input to the fair
value measurement.
The following tables present the Group's assets and liabilities that are measured at fair value:
At 30 June 2016 Level 1 Level 2 Level 3 Total
Group £'000 £'000 £'000 £'000
Deferred consideration - - 681 681
Net fair value - - 681 681
At 30 June 2015 Level 1 Level 2 Level 3 Total
Group £'000 £'000 £'000 £'000
Deferred consideration - - 2,041 2,041
Net fair value - - 2,041 2,041
At 30 June 2016 Level 1 Level 2 Level 3 Total
Company £'000 £'000 £'000 £'000
Deferred consideration - - - -
Net fair value - - - -
At 30 June 2015 Level 1 Level 2 Level 3 Total
Company £'000 £'000 £'000 £'000
Deferred consideration - - - -
Net fair value - - - -
Fair value measurements in Level 3
The Group’s financial assets classified in Level 3 uses valuation techniques based on significant inputs that are not based on observable
market data.
The following table presents the changes in Level 3
instruments. Group Company
£'000 £'000
At 30 June 2014 30 30
Deferred consideration from acquisition of Starkstrom
Payment made 2,722 (30)
Adjustment to fair value of contingent consideration (711)
At 30 June 2015 2,041 -
Payment made (1,360) -
At 30 June 2016 681 -
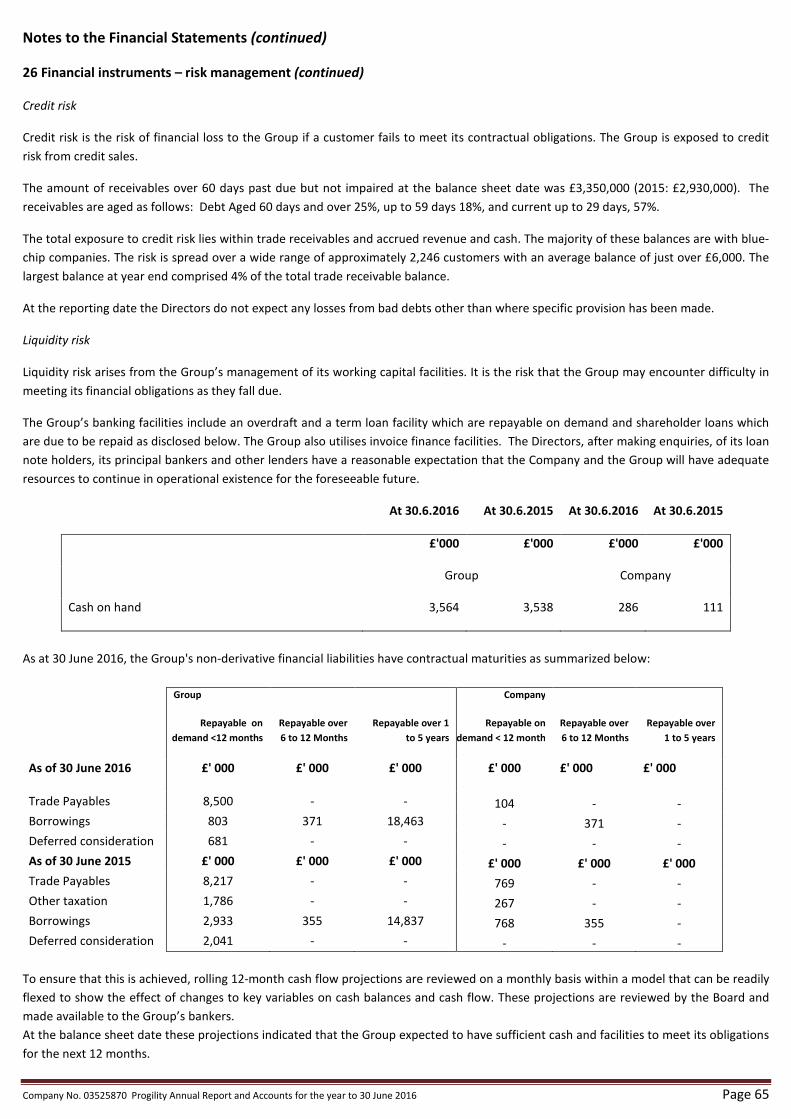
Company No. 03525870 Progility Annual Report and Accounts for the year to 30 June 2016 Page 65
Notes to the Financial Statements (continued)
26 Financial instruments – risk management (continued)
Credit risk
Credit risk is the risk of financial loss to the Group if a customer fails to meet its contractual obligations. The Group is exposed to credit
risk from credit sales.
The amount of receivables over 60 days past due but not impaired at the balance sheet date was £3,350,000 (2015: £2,930,000). The
receivables are aged as follows: Debt Aged 60 days and over 25%, up to 59 days 18%, and current up to 29 days, 57%.
The total exposure to credit risk lies within trade receivables and accrued revenue and cash. The majority of these balances are with blue-
chip companies. The risk is spread over a wide range of approximately 2,246 customers with an average balance of just over £6,000. The
largest balance at year end comprised 4% of the total trade receivable balance.
At the reporting date the Directors do not expect any losses from bad debts other than where specific provision has been made.
Liquidity risk
Liquidity risk arises from the Group’s management of its working capital facilities. It is the risk that the Group may encounter difficulty in
meeting its financial obligations as they fall due.
The Group’s banking facilities include an overdraft and a term loan facility which are repayable on demand and shareholder loans which
are due to be repaid as disclosed below. The Group also utilises invoice finance facilities. The Directors, after making enquiries, of its loan
note holders, its principal bankers and other lenders have a reasonable expectation that the Company and the Group will have adequate
resources to continue in operational existence for the foreseeable future.
At 30.6.2016 At 30.6.2015 At 30.6.2016 At 30.6.2015
£'000 £'000 £'000 £'000
Group Company
Cash on hand 3,564 3,538 286 111
As at 30 June 2016, the Group's non-derivative financial liabilities have contractual maturities as summarized below:
Group
Repayable on
demand <12 months
Repayable over
6 to 12 Months
Repayable over 1
to 5 years
Company
Repayable on
demand < 12 month
Repayable over
6 to 12 Months
Repayable over
1 to 5 years
As of 30 June 2016 £' 000 £' 000 £' 000 £' 000 £' 000 £' 000
Trade Payables 8,500 - - 104 - -
Borrowings 803 371 18,463 - 371 -
Deferred consideration 681 - - - - -
As of 30 June 2015 £' 000 £' 000 £' 000 £' 000 £' 000 £' 000
Trade Payables 8,217 - - 769 - -
Other taxation 1,786 - - 267 - -
Borrowings 2,933 355 14,837 768 355 -
Deferred consideration 2,041 - - - - -
To ensure that this is achieved, rolling 12-month cash flow projections are reviewed on a monthly basis within a model that can be readily
flexed to show the effect of changes to key variables on cash balances and cash flow. These projections are reviewed by the Board and
made available to the Group’s bankers.
At the balance sheet date these projections indicated that the Group expected to have sufficient cash and facilities to meet its obligations
for the next 12 months.
Page 66 Company No. 03525870 Progility Annual Report and Accounts for the year to 30 June 2016
Notes to the Financial Statements (continued)
26 Financial instruments – risk management (continued)
Interest rate risk
Interest risk arises from potential changes to interest rates. It is the risk that the Group’s financial position may be adversely affected by
future changes to interest rates.
It is the Group’s policy to reduce its exposure to movements in interest rates in instances where a significant change in rates could have a
material adverse impact on the Group’s position. This risk is minimised by regular review of the facilities available to the Group.
During the period under review all bank borrowings and other secured facilities, which carry an interest rate margin over Base Rate, were
repaid. As such the Group has no current exposure to changes in the Bank of England base rate, and a one percentage point movement in
the Bank of England Base Rate would have approximately £nil (2015: £34,000) impact on the monthly interest rate charge.
Exchange rate risk
All assets and liabilities are presented in Sterling. Transactions in Euros, American Dollars, Australian Dollars, Indian Rupee, New Zealand
Dollars, Omani Riyals, Emirati Dirhams and South African Rand are translated at the exchange rate ruling at the date of the transaction.
The Group did not carry out a significant level of transactions in any other currency during the year, however, this may increase in the
future in line with the Group’s strategy. A five percentage point adverse movement in the Australian dollar exchange rate could
potentially be reflected as a £798,000 (2015: £1,058,000) reduction on the annual sales recorded in pound sterling in the Group’s
accounts, an increase of £72,000 (2015: £34,000) in profit after tax and an increase of £76,000 (2015: increase of £77,000) in total
comprehensive income. Similarly, a five percentage point adverse movement in the Indian rupee exchange rate could potentially be
reflected as a £906,000 (2015: £462,000) reduction on the annual sales recorded in pound sterling in the Group’s accounts, a reduction of
£38,000 in profit after tax (2015: £22,000) and a reduction of £118,000 (2015: £37,000) in total comprehensive income.
Any gain or loss resulting from the final realisation of these transactions in sterling is taken to the statement of comprehensive income as
an exchange gain or loss. Monetary assets and liabilities remaining in foreign currencies are re-translated at the rates of exchange ruling
at the balance sheet date, with any gain or loss taken to the statement of profit or loss as an exchange gain or loss.
No hedging of this risk is undertaken as the non-sterling assets and liabilities are relatively liquid and the Group considers that its
exposure is adequately managed, for the time being, through matching of currency income and expenditure.
Capital risk
The Group’s capital management objectives are:
• To ensure the Group’s ability to continue as a going concern;
• To fund projects from raising capital from equity placements rather than long term borrowings;
• To increase the value of the assets of the business; and to provide an adequate return to shareholders in the future when new assets
are taken on board.
These objectives will be achieved by maintaining and adding value to existing projects and ultimately taking them through to delivery and
cash flow.
The Group monitors capital on the basis of the carrying amount of share capital and other reserves as presented on the face of the
financial position. Capital for the reporting periods under review is defined as total equity summarised in the consolidated statement of
changes in equity and was £2,053,000 at the end of the year (2015: £4,059,000).
The Group obtains the amount of capital in proportion to its overall financing structure. The Group manages the capital structure and
makes adjustments to it in the light of changes in economic conditions and the risk characteristics of the underlying assets. In order to
maintain or adjust the capital structure the Group may adjust the amount of dividends paid in the future or issue new shares.

Company No. 03525870 Progility Annual Report and Accounts for the year to 30 June 2016 Page 67
Notes to the Financial Statements (continued)
27 Ultimate parent undertaking and controlling interest
Praxis Trustees Limited, as trustee of the DNY Trust, which holds the majority of shares of the company, is considered to be the ultimate
controlling party of the company.
28 Operating leases
At 30 June 2016 the Group had minimum commitments under non-cancellable operating leases as set out below:
Land and
buildings
30.6.2016
Land and
buildings
30.6.2015
Group £'000 £'000
Due within one year 956 1,186
Due in second to fifth year 1,946 1,528
Due over five years 34 -
Total minimum lease payments 2,936 2,714
Land and
buildings
30.6.2016
Land and
buildings
30.6.2015
Company £'000 £'000
Due within one year 75 225
Due in second to fifth year - 100
Total minimum lease payments 75 325
The Group leases office spaces under operating leases. The lease terms typically range from one year to ten years. There are no leases
with more than five years to run from the balance sheet date.
The amounts shown above assume all leases are broken at the earliest opportunity and include any penalty payments that would result
from exercising the early break clauses.
Other
30.6.2016
Other
30.6.2015
Group £'000 £'000
Due within one year 210 269
Due in second to fifth year 188 358
Total minimum lease payments 398 627
29 Capital commitments
There were no material capital commitments at the end of the year (2015: £Nil).
30 Subsequent event review
There have been no significant events subsequent to the balance sheet date.