Embed Size (px)
Citation preview

January 16, 2018 Circulation. 2018;137:286–297. DOI: 10.1161/CIRCULATIONAHA.117.031560286
Key Words: heart failure ◼ meta-analysis ◼ prognosis ◼ troponin T ◼ ventricular dysfunction, left
SYSTEMATIC REVIEW
BACKGROUND: Most patients with chronic heart failure have detectable troponin concentrations when evaluated by high-sensitivity assays. The prognostic relevance of this finding has not been clearly established so far. We aimed to assess high-sensitivity troponin assay for risk stratification in chronic heart failure through a meta-analysis approach.
METHODS: Medline, EMBASE, Cochrane Library, and Scopus were searched in April 2017 by 2 independent authors. The terms were “troponin” AND “heart failure” OR “cardiac failure” OR “cardiac dysfunction” OR “cardiac insufficiency” OR “left ventricular dysfunction.” Inclusion criteria were English language, clinical stability, use of a high-sensitivity troponin assay, follow-up studies, and availability of individual patient data after request to authors. Data retrieved from articles and provided by authors were used in agreement with the PRISMA statement. The end points were all-cause death, cardiovascular death, and hospitalization for cardiovascular cause.
RESULTS: Ten studies were included, reporting data on 11 cohorts and 9289 patients (age 66±12 years, 77% men, 60% ischemic heart failure, 85% with left ventricular ejection fraction <40%). High-sensitivity troponin T data were available for all patients, whereas only 209 patients also had high-sensitivity troponin I assayed. When added to a prognostic model including established risk markers (sex, age, ischemic versus nonischemic etiology, left ventricular ejection fraction, estimated glomerular filtration rate, and N-terminal fraction of pro-B-type natriuretic peptide), high-sensitivity troponin T remained independently associated with all-cause mortality (hazard ratio, 1.48; 95% confidence interval, 1.41–1.55), cardiovascular mortality (hazard ratio, 1.40; 95% confidence interval, 1.33–1.48), and cardiovascular hospitalization (hazard ratio, 1.42; 95% confidence interval, 1.36–1.49), over a median 2.4-year follow-up (all P<0.001). High-sensitivity troponin T significantly improved risk prediction when added to a prognostic model including the variables above. It also displayed an independent prognostic value for all outcomes in almost all population subgroups. The area under the curve–derived 18 ng/L cutoff yielded independent prognostic value for the 3 end points in both men and women, patients with either ischemic or nonischemic etiology, and across categories of renal dysfunction.
CONCLUSIONS: In chronic heart failure, high-sensitivity troponin T is a strong and independent predictor of all-cause and cardiovascular mortality, and of hospitalization for cardiovascular causes, as well. This biomarker then represents an additional tool for prognostic stratification.
Prognostic Value of High-Sensitivity Troponin T in Chronic Heart FailureAn Individual Patient Data Meta-Analysis
The full author list is available on page 295.
Correspondence to: Michele Emdin, MD, PhD, FESC, Scuola Superiore Sant’Anna and Fondazione Toscana Gabriele Monasterio, Via G. Moruzzi 1 - 56124 Pisa, Italy. E-mail [email protected] or [email protected]
Sources of Funding, see page 295
© 2018 American Heart Association, Inc.
Alberto Aimo, MDet al
by guest on January 18, 2018http://circ.ahajournals.org/
Dow
nloaded from
by guest on January 18, 2018http://circ.ahajournals.org/
Dow
nloaded from
by guest on January 18, 2018http://circ.ahajournals.org/
Dow
nloaded from
by guest on January 18, 2018http://circ.ahajournals.org/
Dow
nloaded from
by guest on January 18, 2018http://circ.ahajournals.org/
Dow
nloaded from
by guest on January 18, 2018http://circ.ahajournals.org/
Dow
nloaded from
by guest on January 18, 2018http://circ.ahajournals.org/
Dow
nloaded from
by guest on January 18, 2018http://circ.ahajournals.org/
Dow
nloaded from
by guest on January 18, 2018http://circ.ahajournals.org/
Dow
nloaded from
by guest on January 18, 2018http://circ.ahajournals.org/
Dow
nloaded from
by guest on January 18, 2018http://circ.ahajournals.org/
Dow
nloaded from
by guest on January 18, 2018http://circ.ahajournals.org/
Dow
nloaded from
by guest on January 18, 2018http://circ.ahajournals.org/
Dow
nloaded from
by guest on January 18, 2018http://circ.ahajournals.org/
Dow
nloaded from

High-Sensitivity Troponin T and Prognosis
Circulation. 2018;137:286–297. DOI: 10.1161/CIRCULATIONAHA.117.031560 January 16, 2018 287
STATE OF THE ART
Cardiac isoforms of troponin T (TnT) and troponin I (TnI) are components of the cardiomyocyte contrac-tile apparatus. These proteins are released into the
bloodstream on necrotic cell death, and possibly mem-brane leakage.1 In heart failure (HF), troponin release is promoted by several postulated mechanisms, including myocardial ischemia attributable to coronary artery dis-ease or microcirculatory dysfunction, damage elicited by neurohormonal overactivation, inflammatory or infiltra-tive processes, myocardial apoptosis or autophagy, and in-creased protein turnover, among others.2 In patients with stable chronic HF, circulating troponin may be detectable in 10% to 60% of patients with traditional assays, and in nearly 100% of patients, when using the high-sensitivity (hs) assays, with a substantial proportion above the 99th percentile of hs-Tn for healthy populations.2
Several studies have reported that higher plasma con-centrations of troponin, measured with either traditional or hs assays, are associated with worse prognosis in chronic HF. Based on these findings, the 2013 American College of
Cardiology Foundation/American Heart Association Guide-lines recommended troponin assay as an additive tool for risk stratification.3 In contrast, the 2016 European Society of Cardiology Guidelines have not even mentioned tro-ponins among risk predictors.4 A possible explanation for these diverging opinions is the current absence of compre-hensive analyses on troponins and prognosis in chronic HF, with the exception of a 2012 systematic review consider-ing only cumulative, unadjusted data, and including stud-ies on both traditional and hs assays,5 whereas the latter are replacing traditional assays in current clinical practice.6
Meta-analyses based on individual patient data (IPD) are regarded as the gold standard for meta-analyses and are becoming increasingly common, because they have several advantages over meta-analyses of summary sta-tistics.7 For example, they allow researchers to define exposures and outcomes consistently across studies, adjusting for the same confounders.7 To establish the prognostic value of hs-Tn in chronic HF, we therefore es-tablished a multinational collaboration aiming to collect and evaluate data from published studies on this topic.
METHODSData Sources, Search Strategy, and Eligibility CriteriaThe meta-analysis was conducted in agreement with the Preferred Reporting Items for Systematic reviews and
Clinical Perspective
What Is New?• In this individual patient data meta-analysis on
high-sensitivity troponins and prognosis in chronic heart failure, data were retrieved from 10 studies, corresponding to 11 cohorts and 9289 patients, all with available high-sensitivity troponin T (hs-TnT) data.
• hs-TnT emerged as a strong independent predictor of outcome in chronic heart failure.
• Over a median 2.4-year follow-up, hs-TnT was independent predictor of all-cause and cardiovas-cular death, and cardiovascular hospitalization.
• The prognostic significance of hs-cardiac TnT was retained across almost all population subgroups.
• A 18 ng/L hs-TnT concentration independently pre-dicted all 3 end points in both the ischemic and nonischemic subgroups, and across categories of renal dysfunction.
What Are the Clinical Implications?• These results provide conceptual support to the
widespread use of hs-cardiac TnT for prognostic stratification in chronic heart failure.
• The information from hs-cardiac TnT seems incre-mental to other risk predictors, including natriuretic peptides.
• The striking consistency of results irrespective of patient and disease characteristics has important consequences, implying no need to vary mea-surement of hs-TnT and interpretation of results depending on patients subgroup (eg, ischemic versus nonischemic etiology, or normal versus impaired renal function).
Figure 1. Study selection. cTnI indicates cardiac troponin I; cTnT, cardiac troponin T; HF, heart failure; hs, high sensitivity; and Tn, troponin.
by guest on January 18, 2018http://circ.ahajournals.org/
Dow
nloaded from

Aimo et al
January 16, 2018 Circulation. 2018;137:286–297. DOI: 10.1161/CIRCULATIONAHA.117.031560288
Meta-Analyses statement.8 In April 2017, 2 authors (A.A., G.V.) independently searched 4 databases (Medline, EMBASE, Cochrane Library, and Scopus). The search terms, deliberately generic, were “troponin” AND “heart failure” OR “cardiac failure” OR “cardiac dysfunction” OR “cardiac insufficiency” OR “left ventricular dysfunction.”
Inclusion criteria were as follows: 1. English language2. Patients aged ≥18 years and diagnosed with HF3. Reported enrollment of outpatients or patients under-
going elective admission4. Reported use of a hs assay for TnT and TnI5. Information on patient prognosis6. Authors’ availability to provide IPD.Two authors (A.A., G.V.) independently evaluated the
studies to be included in the meta-analysis. Disagreement about study inclusion was resolved by discussion with a third author (M.E.).
The following data were extracted from each study: first author’s last name, publication year, country where the study was conducted, study period, number of patients enrolled, left ventricular ejection fraction (LVEF) criteria, follow-up dura-tion, outcomes evaluated, and all demographic and clinical baseline data provided. The data were extracted by a reviewer (A.A.), and checked for accuracy by a second reviewer (G.V.).
The authors of each study were then contacted and asked to provide IPD for as many as possible of the following variables: age, sex, ethnic group (black versus others), body mass index, hypertension, atrial fibrillation, diabetes mellitus,
chronic obstructive pulmonary disease, plasma hemoglobin, HF etiology (ischemic versus nonischemic), LVEF, hs-TnT and hs-TnI, natriuretic peptides (NPs: either B-type NP [BNP] or the N-terminal fraction of its precursor [NT-proBNP]), serum creatinine, hs C-reactive protein, follow-up duration, and out-come measures (all-cause death, cardiovascular death, and hospitalization for cardiovascular cause). As specified below, hs-TnI values were available for a small minority of patients. Therefore, only hs-TnT was considered in analysis.
This analysis was not sponsored, and there were no sources of funding.
Statistical AnalysisStatistical analysis was performed using the IBM SPSS Statistics (version 22, 2013) and the R statistical software9 (version 3.4.0; metafor, pROC, predictABEL, ResourceSelection, riskRegression, cmprsk, and readxl packages).
Normal distribution was assessed through the Kolmogorov-Smirnov test; variables with normal distribution were pre-sented as mean±SD, and those with nonnormal distribution as median and interquartile interval. Mean differences among groups were evaluated through the unpaired Student t test or the Mann-Whitney U test, when appropriate. P values of <0.05 were considered significant.
Prognostic Value of hs-TnTOver the entire patient population, the prognostic value of hs-TnT for 3 end points (all-cause death, cardiovascular death,
Table 1. Characteristics of Study Populations Table 1. Continued
Author, YearPatients,
n
Sex, Men, n
(%) Age, yBMI,
kg/m2
Ischemic HF, n (%)
Hypertension, n (%)
Diabetes Mellitus,
n (%) LVEF,% NT-proBNP, ng/LeGFR, mL·min–1·1.73 m–2 hs-CRP, mg/L hs-TnT, ng/L hs-TnI, ng/L
ACEi/ARB, % BB, % MRA, %
Follow-Up, months
All-Cause Death, n
(%)Cardiovascular Death, n (%)
Cardiovascular Hospitalization,
n (%)
Alonso et al, 201615 803 576 (72) 66±11 N/A 419 (52) 499 (62) 570 (35) 33±13 1187 (476–2676) 51 (34–69) 3.6 (1.3–8.3) 22.3 (10.7–39.2) N/A 731 (91) 723 (90) 466 (58) 68 (33–102) 449 (56) 241 (30) 193 (24)
Eggers et al, 201116 111 68 (62) 53±13 N/A 22 (20) 29 (26) 18 (16) 39±18 1198 (618–2475) 63 (49–78) N/A 6.7 (3.5–17.8) 14.0 (7.8–32.7) 93 (84) 93 (84) 71 (64) 58 (19–107) 27 (25) N/A N/A
Egstrup et al, 201217 416 295 (71) 71±11 27±5 258 (62) N/A 79 (19) 31±9 1008 (419–2385) 64 (51–79) N/A 18 (10–32) N/A 275 (66) 183 (44) N/A 55 (24–93) 211 (51) N/A N/A
Gaggin et al, 201418 150 127 (84) 65±14 29±6 76 (50) 78 (52) 63 (42) 27±9 1897 (980–3718) 50 (37–65) 4.2 (1.2–10.1) 17.9 (7.3–37.3) 10.9 (6.1–23.4) 122 (81) 143 (95) 62 (41) 12 (12–13) 14 (9) 10 (7) N/A
Gravning et al, 201319 1245 959 (77) 72±7 N/A 1245 (100) 868 (60) N/A 32±7 1319 (507–2867) 55 (45–65) 3.6 (1.6–7.6) 13.9 (6.6–25.6) N/A 1133 (91) 959 (77) 461 (37) 31 (27–36) 366 (29) 299 (24) 522 (42)
Masson et al, 2012(Val-HeFT)20
4053 3253 (80) 63±11 27±4 2345 (58) 1698 (42) 1049 (26) 27±7 902 (378–1990) 58 (48–67) 3.3 (1.4–7.6) 12.5 (5.9–22.4) N/A 3773 (93) 1463 (36) 215 (5) 24 (18–29) 780 (19) 671 (17) 655 (16)
Masson et al,2012(GISSI-HF)20
1231 991 (81) 67±11 27±4 627 (51) 677 (55) 322 (26) 33±10 846 (376–1869) 63 (49–77) 2.3 (1.1–5.5) 17.0 (10.3–27.8) N/A 1219 (99) 836 (68) 532 (43) 48 (37–56) 330 (27) 243 (20) 692 (56)
Nakamura et al, 201421 444 282 (64) 67±14 N/A 66 (15) 367 (83) 206 (46) 46±15 N/A 69 (48–92) N/A 28 (15–61) N/A 355 (80) 355 (80) N/A 54 (30–67) 172 (39) 97 (22) N/A
Sanders-van Wijk et al, 201522
561 340 (61) 77±8 26±5 297 (53) 417 (74) 204 (36) 35±13 3822 (1907–6947) 52 (37–66) 7.6 (2.8–18.1) 32.4 (18.6–59.8) N/A 533 (95) 432 (77) 213 (38) 26 (14–38) 217 (39) 164 (29) 281 (50)
Schroten et al, 201323 101 94 (93) 64±10 28±4 73 (72) 35 (35) 14 (14) 35±8 376 (202–808) 75 (65–85) N/A 4.4 (3.0–12.4) N/A 101 (100) 97 (97) 29 (29) 65 (51–74) 22 (22) N/A 13 (13)
Tentzeris et al, 201124 174 134 (77) 64±12 N/A 67 (38) 130 (75) 61 (35) 34±11 1655(671–3515) 71 (54–93) N/A 18.4 (9.1–26.6) N/A N/A N/A N/A 25 (7–47) 32 (18) N/A 19 (11)
Individual patient data were available for all variables listed, with the exception of therapy, for which cumulative data were considered. ACEi indicates angiotensin-converting enzyme inhibitors; ARB, angiotensin receptor blockers; BB, β-blockers; BMI, body mass index; eGFR, estimated glomerular filtration rate; GISSI-HF, Gruppo Italiano per lo Studio della Sopravvivenza nell’Insufficienza Cardiaca–Heart Failure; hs-CRP, high-sensitivity C-reactive protein; hs-TnI/T, high-sensitivity troponin I/T; LVEF, left ventricular ejection fraction; MRA, mineralocorticoid receptor antagonists; N/A, not available; NT-proBNP, N-terminal fraction of pro-B-type natriuretic peptide; and Val-HeFT, Valsartan Heart Failure Trial.
(Continued )
by guest on January 18, 2018http://circ.ahajournals.org/
Dow
nloaded from

High-Sensitivity Troponin T and Prognosis
Circulation. 2018;137:286–297. DOI: 10.1161/CIRCULATIONAHA.117.031560 January 16, 2018 289
STATE OF THE ART
and cardiovascular hospitalization) was calculated through a Cox proportional hazards model. Adjusted hazard ratio (HR) values with corresponding 95% confidence intervals (CIs) were computed for standardized log2(hs-TnT), representing the risk per doubling of hs-TnT. The prognostic model used for adjustment included variables commonly available in the outpatient setting, with potential influence on circulating lev-els and with prognostic relevance (ie, patient sex and age, ischemic versus nonischemic etiology, LVEF, estimated glo-merular filtration rate [eGFR], log2-transformed NT-proBNP). The Fine-Gray model was used to account for mutually exclu-sive end points; noncardiovascular death was considered as a competing risk for cardiovascular death, and all-cause death as a competing risk for cardiovascular hospitalization.10
As another method for computing global HR, adjusted HR values were calculated for each study by using standardized log2(hs-TnT), representing the risk per doubling of hs-TnT. HR values were then ln-transformed, and the summary of effect size was computed by using the random-effects model and the generic inverse variance method.
Heterogeneity Analysis, Search for Bias in Included Studies and Across StudiesHeterogeneity across studies was evaluated through unad-justed analysis and random-effects models. The following
measures were calculated: I2 (total heterogeneity/total vari-ability), H2 (total variability/sampling variability), and H (square root of H2).11 Because of the small study number, the Cochran Q test was not used.11 Meta-regression analysis was per-formed to search for population characteristics unevenly distributed among studies, thus possibly contributing to dif-ferent estimates of hs-TnT predictive value.
The risk of bias in included studies was evaluated accord-ing to the criteria established by the Cochrane collaboration.12 Funnel plot analysis integrated by the trim-and-fill method was planned to search for publication bias.
Additional Analyses
Predictors of hs-TnT LevelsMultivariate linear regression analysis was performed to search for predictors of hs-TnT (log2-transformed). Pearson product moment correlation coefficient (r) was calculated as a measure of linear association between the variable and log2(hs-TnT). R-squared, expressing explained variation/total variation, was also computed.
Additive Value of hs-TnT in Risk StratificationThe prognostic performance of 2 models was then evalu-ated. Model 1 included the variables above (patient sex and age, ischemic versus nonischemic etiology, LVEF, eGFR, log2-transformed NT-proBNP), whereas model 2 also included
Table 1. Characteristics of Study Populations Table 1. Continued
Author, YearPatients,
n
Sex, Men, n
(%) Age, yBMI,
kg/m2
Ischemic HF, n (%)
Hypertension, n (%)
Diabetes Mellitus,
n (%) LVEF,% NT-proBNP, ng/LeGFR, mL·min–1·1.73 m–2 hs-CRP, mg/L hs-TnT, ng/L hs-TnI, ng/L
ACEi/ARB, % BB, % MRA, %
Follow-Up, months
All-Cause Death, n
(%)Cardiovascular Death, n (%)
Cardiovascular Hospitalization,
n (%)
Alonso et al, 201615 803 576 (72) 66±11 N/A 419 (52) 499 (62) 570 (35) 33±13 1187 (476–2676) 51 (34–69) 3.6 (1.3–8.3) 22.3 (10.7–39.2) N/A 731 (91) 723 (90) 466 (58) 68 (33–102) 449 (56) 241 (30) 193 (24)
Eggers et al, 201116 111 68 (62) 53±13 N/A 22 (20) 29 (26) 18 (16) 39±18 1198 (618–2475) 63 (49–78) N/A 6.7 (3.5–17.8) 14.0 (7.8–32.7) 93 (84) 93 (84) 71 (64) 58 (19–107) 27 (25) N/A N/A
Egstrup et al, 201217 416 295 (71) 71±11 27±5 258 (62) N/A 79 (19) 31±9 1008 (419–2385) 64 (51–79) N/A 18 (10–32) N/A 275 (66) 183 (44) N/A 55 (24–93) 211 (51) N/A N/A
Gaggin et al, 201418 150 127 (84) 65±14 29±6 76 (50) 78 (52) 63 (42) 27±9 1897 (980–3718) 50 (37–65) 4.2 (1.2–10.1) 17.9 (7.3–37.3) 10.9 (6.1–23.4) 122 (81) 143 (95) 62 (41) 12 (12–13) 14 (9) 10 (7) N/A
Gravning et al, 201319 1245 959 (77) 72±7 N/A 1245 (100) 868 (60) N/A 32±7 1319 (507–2867) 55 (45–65) 3.6 (1.6–7.6) 13.9 (6.6–25.6) N/A 1133 (91) 959 (77) 461 (37) 31 (27–36) 366 (29) 299 (24) 522 (42)
Masson et al, 2012(Val-HeFT)20
4053 3253 (80) 63±11 27±4 2345 (58) 1698 (42) 1049 (26) 27±7 902 (378–1990) 58 (48–67) 3.3 (1.4–7.6) 12.5 (5.9–22.4) N/A 3773 (93) 1463 (36) 215 (5) 24 (18–29) 780 (19) 671 (17) 655 (16)
Masson et al,2012(GISSI-HF)20
1231 991 (81) 67±11 27±4 627 (51) 677 (55) 322 (26) 33±10 846 (376–1869) 63 (49–77) 2.3 (1.1–5.5) 17.0 (10.3–27.8) N/A 1219 (99) 836 (68) 532 (43) 48 (37–56) 330 (27) 243 (20) 692 (56)
Nakamura et al, 201421 444 282 (64) 67±14 N/A 66 (15) 367 (83) 206 (46) 46±15 N/A 69 (48–92) N/A 28 (15–61) N/A 355 (80) 355 (80) N/A 54 (30–67) 172 (39) 97 (22) N/A
Sanders-van Wijk et al, 201522
561 340 (61) 77±8 26±5 297 (53) 417 (74) 204 (36) 35±13 3822 (1907–6947) 52 (37–66) 7.6 (2.8–18.1) 32.4 (18.6–59.8) N/A 533 (95) 432 (77) 213 (38) 26 (14–38) 217 (39) 164 (29) 281 (50)
Schroten et al, 201323 101 94 (93) 64±10 28±4 73 (72) 35 (35) 14 (14) 35±8 376 (202–808) 75 (65–85) N/A 4.4 (3.0–12.4) N/A 101 (100) 97 (97) 29 (29) 65 (51–74) 22 (22) N/A 13 (13)
Tentzeris et al, 201124 174 134 (77) 64±12 N/A 67 (38) 130 (75) 61 (35) 34±11 1655(671–3515) 71 (54–93) N/A 18.4 (9.1–26.6) N/A N/A N/A N/A 25 (7–47) 32 (18) N/A 19 (11)
Individual patient data were available for all variables listed, with the exception of therapy, for which cumulative data were considered. ACEi indicates angiotensin-converting enzyme inhibitors; ARB, angiotensin receptor blockers; BB, β-blockers; BMI, body mass index; eGFR, estimated glomerular filtration rate; GISSI-HF, Gruppo Italiano per lo Studio della Sopravvivenza nell’Insufficienza Cardiaca–Heart Failure; hs-CRP, high-sensitivity C-reactive protein; hs-TnI/T, high-sensitivity troponin I/T; LVEF, left ventricular ejection fraction; MRA, mineralocorticoid receptor antagonists; N/A, not available; NT-proBNP, N-terminal fraction of pro-B-type natriuretic peptide; and Val-HeFT, Valsartan Heart Failure Trial.
by guest on January 18, 2018http://circ.ahajournals.org/
Dow
nloaded from
Aimo et al
January 16, 2018 Circulation. 2018;137:286–297. DOI: 10.1161/CIRCULATIONAHA.117.031560290
log2-transformed hs-Tn. The discriminating power of hs-TnT with regard to the end points was assessed by the DeLong test for 2 correlated receiver operating characteristic curves. The D’Agostino-Nam version of the Hosmer-Lemeshow cali-bration test was used to calculate χ2 value as a measure of calibration. The net reclassification improvement (with risk categories set at <10%, 10%–30%, and >30%) and the inte-grated discrimination improvement were calculated to assess reclassification.13,14
Subgroup Analyses and Search for hs-TnT CutoffsOptimal hs-TnT cutoffs were searched via receiver operat-ing characteristics curve and Youden J statistic. The analysis was performed in the whole population and in population subsets identified by sex, HF etiology, and eGFR categories; the 3 end points were assessed. Cubic spline interpolation was performed to represent the changes in risk of all-cause death according to hs-Tn values; 5 knots were considered. The hs-TnT value for which HR=1 was chosen as the value corresponding to the inflection point of the curve, ie, the concentration above which the slope of the curve becomes steeper.
Following the previous analyses, a hs-TnT cutoff was selected. It was evaluated at Kaplan-Meier analysis with log-rank test (Mantel-Cox), and its independent prognostic role was evaluated in the entire population and in the subsets identified by sex, HF etiology, and eGFR categories.
RESULTSPatient PopulationFifteen articles met the inclusion and exclusion crite-ria.15–29 Among them, one20 was a post hoc analysis of 2 trials (Val-HeFT [Valsartan Heart Failure Trial]30 and GISSI-HF [Effects of n-3 PUFA and Rosuvastatin on Mor-tality-Morbidity of Patients With Symptomatic CHF]31); 11 patient cohorts were then evaluated. The authors of 10 articles15–24 sent individual patient data; 5 studies were excluded because the authors could not be con-tacted,25–28 or were unable to provide IPD28,29 (Figure 1). The total patient number from excluded studies was 1312.25–29 Overall, the present analysis evaluated 9289 patients, all with hs-TnT measured (median, 16 ng/L; interquartile interval, 8–29 ng/L). The assay used in all studies was the only hs-TnT assay available (Roche Di-agnostics; lower detection limit of 3 ng/L, 99th percen-tile value in apparently healthy individuals of 14 ng/L).32 However, hs-TnI had been assayed (together with hs-TnT) only in 209 patients (2%) from 2 studies (Table 1), using different assays.16,18 Therefore, we focused on the prognostic performance of hs-TnT.
Patients were aged 66±12 years, with a male prev-alence (n=7122, 77%). The majority had HF with re-duced ejection fraction (LVEF <40%: n=7902, 85%; LVEF 40–49%: n=718, 8%; LVEF ≥50%: n=479, 5%). Median hs-TnT levels were 15 ng/L (8–28) in the <40% LVEF subgroup versus 18 ng/L (9–38) in pa-
tients with 40% to 49% LVEF, and 22 ng/L (12–43) in those with ≥50% LVEF (P<0.001). All patients had available data on HF etiology; ischemic HF was more common (5543 patients, 60%). All studies but one21 reported data on NT-proBNP (n=8845, 95%; median value, 1067 ng/L; interquartile interval, 433–2470 ng/L). Median GFR, estimated using the chronic kid-ney disease epidemiology collaboration equation,34 was 58 mL·min–1·1.73 m–2 (interquartile interval, 46–70). Among patients with therapy data available from published studies (n=9004, 97%), 91% were on an-giotensin-converting enzyme inhibitors or angioten-sin receptor blockers, 58% were on β-blockers, and 24% were on mineralocorticoid receptor antagonists. Median follow-up duration was 2.4 years (interquar-tile interval, 1.6–3.3). Data on all-cause death were available for all cohorts (2620 deaths, 28%), whereas data on cardiovascular death were available for 6 co-horts15,18–22 (8487 patients, 1725 events, 20%), and data on cardiovascular hospitalization were available for 6 other cohorts15,19,20,22–24 (8168 patients, 2375 events, 29%) (Table 1).
Independent Prognostic Value of hs-TnTThe prognostic performance of hs-TnT as predictor of all-cause death, cardiovascular death, and cardiovascu-lar hospitalization was evaluated after adjustment for sex, age, ischemic versus nonischemic HF etiology, LVEF, eGFR, and log2-transformed NT-proBNP. Of the entire study population, 8341 patients (90%) had information on all-cause death and all variables needed for adjust-ment; the corresponding numbers for cardiovascular death and cardiovascular hospitalization were 7685 (83%) and 7803 (84%), respectively. HR values were 1.48 (1.41–1.55) for all-cause death, 1.40 (1.33–1.48) for cardiovascular death, and 1.42 (1.36–1.49) for car-diovascular hospitalization (all P values <0.001).
When repeating the analysis considering study HR values and combining them, very similar results were found after anti ln transformation: HR, 1.43 (95% CI, 1.35–1.52) for all-cause death, HR, 1.39 (95% CI, 1.32–1.48) for cardiovascular death (Figure I in the on-line-only Data Supplemental), and HR, 1.36 (95% CI, 1.30–1.43) for cardiovascular hospitalization (all P val-ues <0.001).
Among patients with available data for adjusted analysis (n=201), hs-TnI also was independently asso-ciated with all-cause death (HR, 2.88; 95% CI, 1.38–6.01; P=0.005).
Heterogeneity Analysis: Search for BiasHR values were 2.54 (95% CI, 1.65–5.36) for all-cause death, 2.45 (95% CI, 1.45–5.41) for cardiovascular death, and 2.47 (95% CI, 1.52–5.27) for cardiovascular hospital-
by guest on January 18, 2018http://circ.ahajournals.org/
Dow
nloaded from

High-Sensitivity Troponin T and Prognosis
Circulation. 2018;137:286–297. DOI: 10.1161/CIRCULATIONAHA.117.031560 January 16, 2018 291
STATE OF THE ART
ization. I2 values were 84.45 (95% CI, 63.38–96.52) for all-cause death, 83.39 (95% CI, 52.67–96.59) for cardio-vascular death, and 84.60 (95% CI, 62.11–95.97) for car-diovascular hospitalization. These values denoted signifi-cant heterogeneity among studies.11 At meta-regression analysis, all population characteristics listed in Table 1 emerged as significant sources of heterogeneity among studies (all P values <0.001). After careful revision of the
included studies, no evidence of bias within studies was detected.12 Funnel plot analysis (ie, the search for publica-tion bias) was not performed because of the low study number and high degree of heterogeneity.35
Predictors of hs-TnT LevelsWhen entered into a linear regression model, several population characteristics predicted higher log2(hs-TnT) levels. In decreasing order of strength of association, the predictive variables were: higher log2(NT-proBNP) (Pearson r=0.533), older age (r=0.439), lower eGFR (r=–0.303), diabetes mellitus (r=0.210), hypertension (r=0.201), log2(hs–C-reactive protein) (r=0.141), ischemic etiology (r=0.075), male sex (r=0.072), and lower body mass index (r=–0.039). Despite all P values <0.001, many of these variables were very weak predictors of hs-TnT levels, as demonstrated by r values close to 0. The combi-nation of all the variables above yielded a 0.44 R-squared value, ie, it explained only 44% of total hs-TnT variation.
Additive Value of hs-TnT in Risk StratificationWhen added to a prognostic model including the vari-ables above (age, sex, HF etiology, LVEF, eGFR, and NT-proBNP), hs-TnT significantly improved risk predic-tion (Table 2). For example, area under the curve val-ues for all-cause death increased from 0.715 to 0.744 (P<0.001; Table 2 and Figure 2).
hs-TnT and Prognosis: Subgroup AnalysesThe availability of IPD allowed us to identify several population subgroups to evaluate the prognostic role of hs-TnT after adjustment for the prespecified model (in-cluding age, sex, HF etiology, LVEF, eGFR, and NT-proB-NP). Concentrations of hs-TnT independently predicted all-cause death (Figure 3), and cardiovascular death and cardiovascular hospitalization in all subgroups, as well, with the exception of cardiovascular hospitalization in patients with eGFR <30 mL·min–1·1.73 m–2 (Figures II and III in the online-only Data Supplement).
Search for hs-TnT CutoffsThe optimal hs-TnT cutoff for all-cause death, cardio-vascular death, and cardiovascular hospitalization was evaluated in the whole population and in several pa-tient subgroups (ie, men versus women, ischemic ver-sus nonischemic HF, and across eGFR categories). In the entire population, the optimal cutoff value for all-cause death was 18 ng/L. When considering other patient subgroups, the optimal cutoff remained at 18 ng/L in both ischemic and nonischemic subgroups, whereas it
Table 2. Performance Metrics of Risk Prediction Models
Index
Model 1:Sex, Age, HF
Etiology, LVEF, eGFR, NT-proBNP
Model 2:Sex, Age, HF Etiology, LVEF, eGFR, NT-proBNP,
hs-cTnT
All-cause death
DiscriminationAUC
0.715 (95% CI, 0.703–0.728)
0.744 (95% CI, 0.732–0.756)
Reference P<0.001
Calibration HL χ2 10.82, P=0.212 χ2 12.03, P=0.150
ReclassificationIDI Reference
0.031 (95% CI, 0.027–0.035),
P<0.001
NRI Reference
0.336 (95% CI, 0.289–0.383),
P<0.001
Cardiovascular death
DiscriminationAUC
0.711 (95% CI, 0.695–0.724)
0.735 (95% CI, 0.721–0.749)
Reference P<0.001
Calibration HL χ2 4.91, P=0.767 χ2 10.25, P=0.248
ReclassificationIDI Reference
0.022 (95% CI, 0.018–0.026),
P<0.001
NRI Reference
0.288 (95% CI, 0.233–0.343),
P<0.001
Cardiovascular hospitalization
DiscriminationAUC
0.664 (95% CI, 0.651–0.677)
0.697 (95% CI, 0.685–0.710)
Reference P<0.001
Calibration HL χ2 7.54, P=0.480 χ2 16.59, P=0.634
ReclassificationIDI Reference
0.028 (95% CI, 0.024–0.032), P<0.001
NRI Reference
0.336 (95% CI, 0.287–0.384), P<0.001
The whole study population is considered. As specified in the text, 8341 patients (90%) had information on all-cause death and all variables needed for adjustment; the corresponding numbers for cardiovascular death and cardiovascular hospitalization were 7685 (83%) and 7803 (84%), respectively.
Both high-sensitivity cardiac troponin T (hs-cTnT) and N-terminal fraction of pro-B-type natriuretic peptide (NT-proBNP) were log2 transformed. Discrimination and reclassification analyses evaluated the additive value of hs-cTnT for risk stratification. Continuous NRI is considered. Models with good calibration have P values >0.05 at the HL test.
AUC indicates area under the curve; CI, confidence interval; eGFR, estimated glomerular filtration rate; HF, heart failure; HL, Hosmer-Lemeshow; hs-cTnT, high-sensitivity cardiac Troponin T; IDI, integrated discrimination improvement; LVEF, left ventricular ejection fraction; NRI, net reclassification improvement; and NT-proBNP, N-terminal fraction of pro-B-type natriuretic peptide.
by guest on January 18, 2018http://circ.ahajournals.org/
Dow
nloaded from

Aimo et al
January 16, 2018 Circulation. 2018;137:286–297. DOI: 10.1161/CIRCULATIONAHA.117.031560292
was slightly higher among men and lower among women. The optimal cutoff values also increased pro-gressively with worse renal function (Table I in the on-line-only Data Supplement).
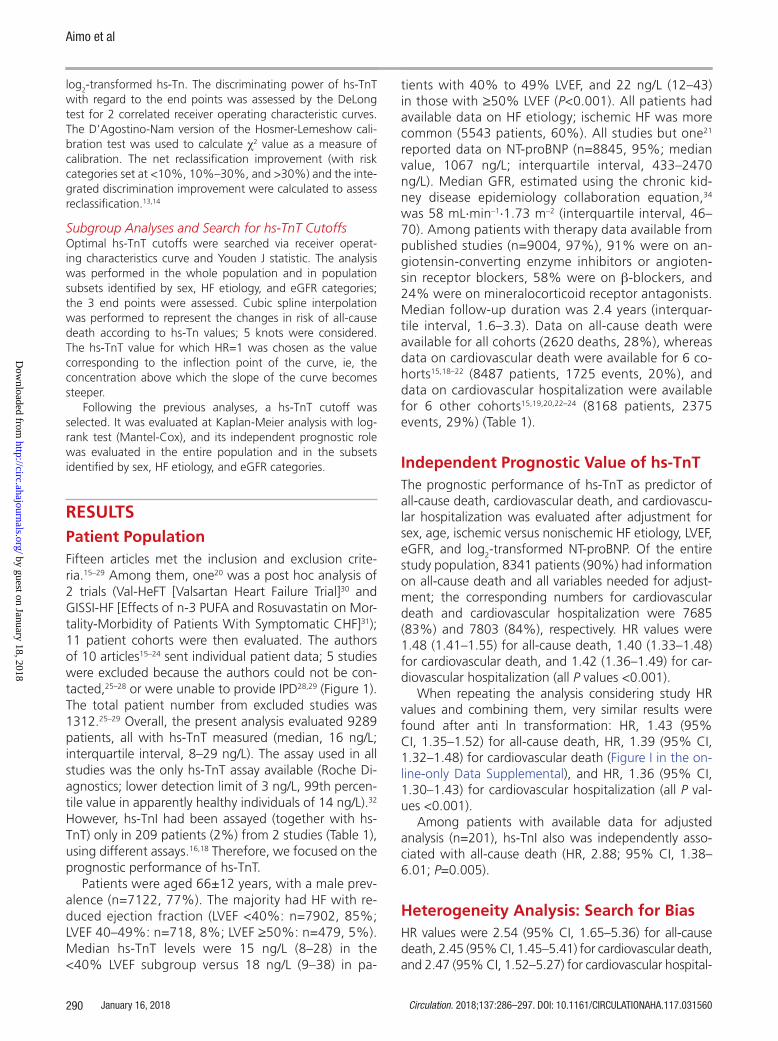
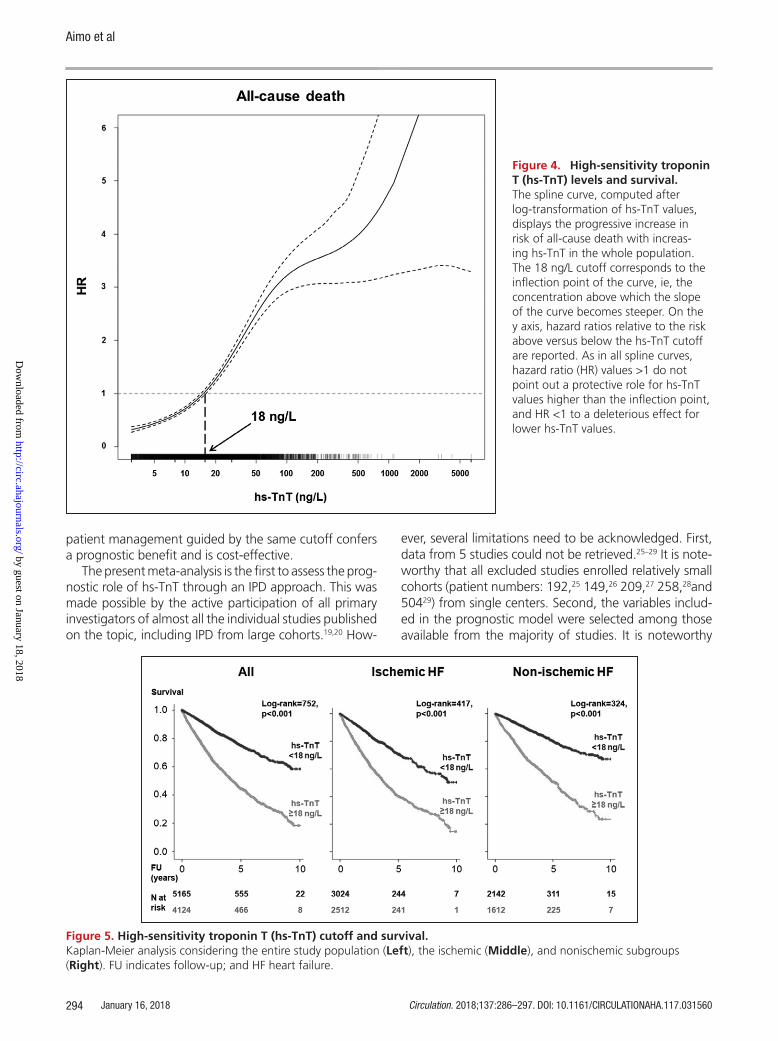
The 18 ng/L value was also identified at spline curve analysis as the hs-TnT concentration above which there was a sharp increase in risk of all-cause death (Figure 4). Kaplan-Meier analysis demonstrated that patients with hs-TnT >18 ng/L had significantly shorter time to all-cause death (Figure 5). This cutoff retained independent prognostic value for all 3 end points in the whole popu-lation, and in most patient subgroups, as well (Table 3).
DISCUSSIONIn a population of 9289 patients from 10 studies and 11 cohorts, hs-TnT emerged as a strong independent predictor of outcome in chronic HF. Over a 29-month median follow-up, hs-TnT predicted all-cause and car-diovascular death, and cardiovascular hospitalization, as well, independent of age, sex, systolic function, renal function, and NT-proBNP. In detail, median HR values were 1.48 for all-cause death, 1.40 for cardiovascular death, and 1.42 for cardiovascular hospitalization (all P values <0.001); very similar results were obtained when combining HR values from single studies in Forest plots. The independent prognostic significance of hs-TnT was retained in all population subgroups. A hs-TnT concen-tration of 18 ng/L was identified as the optimal cutoff
level for the prediction of all-cause death through either receiver operating characteristic or spline analysis. The same threshold resulted as an independent predictor of all 3 end points in men and women, in both ischemic and nonischemic subgroups, and, with a single excep-tion, across all categories of renal dysfunction.
In patients with HF, measurement of circulating bio-markers has emerged as a powerful tool for understand-ing the mechanism of disease and for patient selection for clinical trials. On a clinical level, biomarker assessment can assist the clinician in diagnosis and risk stratification. The use of BNP and NT-proBNP for such applications is now widespread.3,4 Our results demonstrate a prognostic role of hs-TnT levels, which is additive to other estab-lished risk markers commonly evaluated in the outpa-tient setting, including NT-proBNP. These results provide a confirmation of the findings previously reported on the Val-HeFT cohort by Latini et al.36 In our analysis, each doubling of hs-TnT increased the risk of all-cause death by 48%, cardiovascular death by 40%, and cardiovascu-lar hospitalization by 42%, regardless of the other vari-ables. It is also worth considering that, in comparison with other emerging assays with prognostic relevance in chronic HF, such as sST2,37 the hs-TnT assay has the great advantage of automation and wide availability.6,38
The information from measuring hs-TnT seems incre-mental to other clinical and biohumoral characteristics, as confirmed also by the lack of strong predictors of hs-TnT concentrations. For example, hs-TnT and BNP
Figure 2. High-sensitivity troponin T (hs-TnT) and refinement in prog-nostic stratification. The inclusion of hs-TnT (log2-trans-formed) significantly (P<0.001) im-proved discrimination when added to a prognostic model including age, sex, left ventricular ejection fraction (LVEF), estimated glomerular filtration rate (eGFR), and N-terminal fraction of pro-B-type natriuretic peptide (NT-proBNP, log2-transformed). AUC indicates area under the curve.
by guest on January 18, 2018http://circ.ahajournals.org/
Dow
nloaded from

High-Sensitivity Troponin T and Prognosis
Circulation. 2018;137:286–297. DOI: 10.1161/CIRCULATIONAHA.117.031560 January 16, 2018 293
STATE OF THE ART
concentrations likely reflect complementary biological information, namely the severity of ongoing myocar-dial damage and hemodynamic overload, respectively, which are related to yet different from pathophysiologi-cal phenomena.2
The striking consistency of results irrespective of pa-tient and disease characteristics has important conse-quences, implying no need to vary the measurement of hs-TnT and interpretation of results depending on pa-tients subgroups. The finding that prognostic relevance of hs-TnT is independent from HF etiology confirms that ischemic heart disease is not a necessary prerequisite for hs-Tn release in HF, and suggests that the severity of ongoing myocardial damage is predictive of progno-sis by itself, regardless of the underlying pathogenesis. In addition, the independent prognostic significance of hs-TnT across categories of eGFR is noteworthy, given the potential for abnormal renal function to influence the concentration of this marker.39 In other words, hs-TnT tended to increase in parallel with declining renal
function, reflecting impaired clearance; nonetheless, higher hs-TnT levels remained predictive of worse prog-nosis within each eGFR range.
With regard to the proposed cutoff for all-cause death, a 18 ng/L value is quite close to the upper ref-erence limit among healthy subjects (ie, 14 ng/L), and optimal cutoffs for other end points were even lower (16 ng/L for cardiovascular death, and 15 ng/L for cardiovas-cular hospitalization). These findings point to the prog-nostic relevance of even low-grade, sustained myocardial damage, reflecting active processes, which on the long term may culminate in adverse ventricular remodeling and life-threatening arrhythmias.40 The same conclusion applies to the general population, as recently reviewed.41 For simplicity, a single cutoff (18 ng/L) should probably be considered in clinical practice for risk stratification, especially because the same cutoff holds independent prognostic significance in subgroups identified by pa-tient sex, HF etiology, and categories of renal function. It is clear that dedicated studies should establish whether
Figure 3. High-sensitivity troponin T (hs-TnT) for the prediction of all-cause death: subgroup analysis. The prognostic value of Hs-TnT (log2-transformed) is considered in several patient subgroups, after adjustment for age, sex, heart failure (HF) etiology, left ventricular ejection fraction (LVEF), estimated glomerular filtration rate (eGFR), and log2-transformed N-termi-nal fraction of pro-B-type natriuretic peptide (NT-proBNP). As a cut point for age (expressed in years), mean value is considered, whereas median values are reported for NT-proBNP (ng/L), and C-reactive protein (CRP; mg/L). eGFR is expressed as mL·min–1·1.73 m–2. All P values are <0.001, except for eGFR ≥90 mL/min/1.73 m2. CI indicates confidence interval; HR, hazard ratio; and hs-cTNT, high-sensitivity cardiac troponin T.
by guest on January 18, 2018http://circ.ahajournals.org/
Dow
nloaded from
Aimo et al
January 16, 2018 Circulation. 2018;137:286–297. DOI: 10.1161/CIRCULATIONAHA.117.031560294
patient management guided by the same cutoff confers a prognostic benefit and is cost-effective.
The present meta-analysis is the first to assess the prog-nostic role of hs-TnT through an IPD approach. This was made possible by the active participation of all primary investigators of almost all the individual studies published on the topic, including IPD from large cohorts.19,20 How-
ever, several limitations need to be acknowledged. First, data from 5 studies could not be retrieved.25–29 It is note-worthy that all excluded studies enrolled relatively small cohorts (patient numbers: 192,25 149,26 209,27 258,28and 50429) from single centers. Second, the variables includ-ed in the prognostic model were selected among those available from the majority of studies. It is noteworthy
Figure 4. High-sensitivity troponin T (hs-TnT) levels and survival. The spline curve, computed after log-transformation of hs-TnT values, displays the progressive increase in risk of all-cause death with increas-ing hs-TnT in the whole population. The 18 ng/L cutoff corresponds to the inflection point of the curve, ie, the concentration above which the slope of the curve becomes steeper. On the y axis, hazard ratios relative to the risk above versus below the hs-TnT cutoff are reported. As in all spline curves, hazard ratio (HR) values >1 do not point out a protective role for hs-TnT values higher than the inflection point, and HR <1 to a deleterious effect for lower hs-TnT values.
Figure 5. High-sensitivity troponin T (hs-TnT) cutoff and survival. Kaplan-Meier analysis considering the entire study population (Left), the ischemic (Middle), and nonischemic subgroups (Right). FU indicates follow-up; and HF heart failure.
by guest on January 18, 2018http://circ.ahajournals.org/
Dow
nloaded from

High-Sensitivity Troponin T and Prognosis
Circulation. 2018;137:286–297. DOI: 10.1161/CIRCULATIONAHA.117.031560 January 16, 2018 295
STATE OF THE ART
that these variables are commonly available in the out-patient setting, and all are recognized markers of risk. Third, a high degree of heterogeneity was found among studies, possibly affecting our conclusions; nonetheless, the results from all the largest cohorts were consistent and seemed to provide robust evidence of an indepen-dent prognostic value of hs-TnT. Fourth, we focused on the prognostic relevance of point hs-TnT measurement, without considering the impact of serial testing, which may20 or may not18 add substantially to risk prediction. Fifth, a malcalibration or low-end shift issue affected the Roche hs-TnT lots used clinically in 2010 to 2012 world-wide, possibly affecting the reliability of the measured TnT concentrations.42 Unfortunately, it was not possible to establish which patients had been evaluated using the 2010-to-2012 lots. Nevertheless, assay malcalibration was certainly not an issue for original studies published before 2010. This was the case for the Val-HeFT (2001),30 GISSI-HF (2008),31 CORONA (Controlled Rosuvastatin Multinational Trial in Heart Failure) (2007),43 and TIME-CHF (Trial of Intensified vs Standard Medical Therapy in Elderly Patients With Congestive Heart Failure) (2009),44 accounting for a total patient number of 7090 (76%). Furthermore, a dedicated analysis of the 2010-to-2012 lots found that deviations nearly exclusively affected hs-TnT levels below the 99th percentile (14 ng/L), with a very limited clinical impact (only 8.5% of patients triaged for myocardial infarction were at risk for misdiagnosis).42 We can then estimate that the 2010-to-2012 low-end shift had limited impact (if any) on our results. Finally, dedicated studies should establish whether a hs-TnT–guided approach to therapy decision making and follow-up results in improved patient prognosis.
In conclusion, in our IPD meta-analysis, hs-TnT lev-els emerged as independent predictor of all-cause and cardiovascular mortality, and hospitalization for cardio-vascular causes, as well, over a long follow-up period. The prognostic value of hs-TnT was unaffected by HF etiology (ischemic versus nonischemic) or renal func-tion, and a 18 ng/L hs-TnT cut point provided indepen-dent prognostic value. These results provide conceptu-al support to the widespread use of hs-TnT in addition to BNPs for risk stratification in stable chronic HF.
AUTHORS Alberto Aimo, MD; James L. Januzzi Jr, MD; Giuseppe Vergaro, MD, PhD; Andrea Ripoli, EngD; Roberto Latini, MD; Serge Masson, PhD; Michela Magnoli, BSc; Inder S. Anand, MD, PhD; Jay N. Cohn, MD; Luigi Tavazzi, MD; Gianni Tognoni, MD; Jørgen Gravning, MD, PhD; Thor Ueland, PhD; Ståle H. Nymo, MD; Hans-Peter Brunner-La Rocca, MD; Antoni Bayes Genis, MD, PhD; Josep Lupón, MD; Rudolf A. de Boer, MD; Akiomi Yoshihisa, MD, PhD; Yasuchika Takeishi, MD; Michael Egstrup, MD, PhD; Ida Gustafsson, MD, PhD; Hanna K. Gaggin, MD, MPH; Kai M. Eggers, MD, PhD; Kurt Huber, MD; Ioannis Tentzeris, MD; Wai H.W. Tang, MD; Justin Grodin, BSc; Claudio Passino, MD; Michele Emdin, MD, PhD
SOURCES OF FUNDING None.
DISCLOSURESDr Januzzi has received grant support from Siemens, Singu-lex, and Prevencio; consulting income from Roche Diagnostics,
Table 3. Prognostic Value of the High-Sensitivity Troponin T (hs-TnT) Cutoff (18 ng/L)
All-Cause Death
All (n=9289)
Men (n=7122)
Women (n=2167)
Ischemic (n=5543)
Nonischemic(n=3746)
eGFR<30 (n=496)
eGFR30–59 (n=4535)
eGFR60–89 (n=3615)
eGFR≥90 (n=574)
HR 2.28 2.32 2.19 2.18 2.55 1.99 2.26 2.10 1.86
95% CI 2.03–2.57 2.02–2.65 1.70–2.82 1.88–2.53 2.08–3.12 1.04–3.84 1.92–2.66 1.72–2.56 1.06–3.26
Cardiovascular Death
All (n=7553)
M (n=6500)
W (n=1943)
Ischemic (n=5100)
Nonischemic (n=3343)
eGFR<30 (n=452)
eGFR30–59 (n=4249)
eGFR60–89 (n=3232)
eGFR≥90 (n=445)
HR 2.21 2.23 2.08 2.16 2.30 1.41 2.06 2.02 2.62
95% CI 1.92–2.54 1.91–2.61 1.54–2.81 1.83–2.56 1.81–2.94 0.69–2.86 1.71–2.48 1.59–2.56 1.22–5.63
Cardiovascular Hospitalization
All (n=7382)
M (n=6349)
W (n=1819)
Ischemic (n=5073)
Nonischemic (n=3094)
eGFR<30 (n=411)
eGFR30–59 (n=4120)
eGFR60–89 (n=3185)
eGFR≥90 (n=387)
HR 2.33 2.28 2.47 2.27 2.44 1.85 2.08 1.86 1.80
95% CI 2.07–2.63 1.99–2.61 1.92–3.18 1.96–2.63 2.00–2.98 0.95–3.59 1.77–2.46 1.53–2.27 1.02–3.18
Hazard ratio (HR) and 95% confidence interval (CI) values were calculated after adjustment for age, sex, heart failure (HF) etiology, left ventricular ejection fraction, estimated glomerular filtration rate (eGFR), and N-terminal fraction of pro-B-type natriuretic peptide (log2-transformed). eGFR is expressed as mL·min–1·1.73 m–2. All P values were <0.001, with the exception of all-cause death and eGFR <30 mL·min–1·1.73 m–2 (P=0.039) or ≥90 mL·min–1·1.73 m–2 (P=0.031), cardiovascular death and eGFR <30 mL·min–1·1.73 m–2 (P=0.345) or ≥90 mL·min–1·1.73 m–2 (P=0.017), cardiovascular hospitalization and eGFR <30 mL·min–1·1.73 m–2 (P=0.071) or ≥90 mL·min–1·1.73 m–2 (P=0.041).
by guest on January 18, 2018http://circ.ahajournals.org/
Dow
nloaded from

Aimo et al
January 16, 2018 Circulation. 2018;137:286–297. DOI: 10.1161/CIRCULATIONAHA.117.031560296
Critical Diagnostics, Sphingotec, Phillips, and Novartis; and par-ticipates in clinical end point committees for Novartis, Amgen, Janssen, and Boehringer Ingelheim. Drs Latini and Masson have received grant support and travel reimbursements from Roche Diagnostics. Dr Tavazzi reports personal fees from Servier, personal fees from CVIE Therapeutics, outside the submitted work. Dr Gravning reports lecture fees from AstraZeneca, Sie-mens and Abbott Laboratories, outside the submitted work. Dr Brunner-La Rocca reports unrestricted research grants and con-sulting fees from Roche Diagnostics, and unrestricted research grants from Novartis and GlaxoSmithKline outside this work, as well. Dr Bayes-Genis has received grant support from Roche Diagnosis, lecture honoraria from Roche Diagnostics and Criti-cal Diagnostics, and consulting income from Roche Diagnos-tics, Critical Diagnostics, and Novartis. Dr Lupón has received lecture honoraria from Roche Diagnostics. Dr de Boer reports that Roche, Novartis, and AstraZeneca offered consultancy to UMCG; he also reports grants from AstraZeneca, grants from Bristol Myers Squibb, and grants from Trevena, outside the submitted work. Dr Gustafsson reports personal fees from Boehringer-Ingelheim, personal fees from Novo Nordisk, per-sonal fees from Novartis, personal fees from MSD, personal fees from AstraZeneca, outside the submitted work. Dr Gaggin has received grant support from Roche and Portola; consult-ing income from Roche Diagnostics, Amgen and Ortho Clini-cal; research payments for clinical end point committees for EchoSense and Radiometer. Dr Eggers has received honoraria from Abbott Laboratories and AstraZeneca, and has served as a consultant for Abbott Laboratories and Fiomi Diagnostics. Dr Tang reports grants from National Institutes of Health, outside the submitted work. All other authors have nothing to disclose.
AFFILIATIONSScuola Superiore Sant’Anna, Pisa, Italy (A.A., G.V., C.P., M.E.). Massachusetts General Hospital and Harvard Clinical Research Institute, Boston (J.L.J., H.K.G.). Fondazione Toscana G. Monasterio, Pisa, Italy (G.V., A.R., C.P., M.E.). Department of Cardiovascular Research IRCCS - Istituto di Ricerche Farmacologiche - “Mario Negri,” Milano, Italy (R.L., S.M., M.M., G.T.). Division of Cardiovascular Medicine, University of Minnesota, Minneapolis (I.S.A., J.N.C.). Department of Cardiology, VA Medical Centre, Minneapolis, MN (I.S.A.). GVM Hospitals of Care and Research, E.S. Health Science Foundation, Cotignola, Italy (L.T.). Department of Cardiology, Oslo University Hospital, Ullevål, Norway (J.G.). Centre for Heart Failure Research, University of Oslo, Norway (J.G.). Research Institute of Internal Medicine, Oslo University Hospital, Rikshospitalet, Norway (T.U., S.H.N.). Faculty of Medicine, University of Oslo, Norway (T.U.). K. G. Jebsen Thrombosis Research and Expertise Centre, University of Tromsø, Norway (T.U.). Department of Cardiology, Maastricht University Medical Centre, The Netherlands (H.-P.G.-L.R.). Hospital Universitari Germans Trias i Pujol, Badalona (Barcelona), Spain (A.B.G., J.L.). University Medical Centre Groningen, The Netherlands (R.A.d.B.). Department of Cardiovascular Medicine, Fukushima Medical University, Japan (A.Y., Y.T.). Department of Cardiology, Copenhagen University Hospital Rigshospitalet, Denmark (M.E., I.G.). Department of Medical Sciences, Cardiology, Uppsala
University, Sweden (K.M.E.). Faculty of Internal Medicine, Wilhelminenspital and Sigmund Freud University, Medical School, Vienna, Austria (K.H., I.T.). Heart and Vascular Institute, Cleveland Clinic, OH (W.H.W.T.). Department of Internal Medicine, Division of Cardiology, University of Texas Southwestern Medical Center, Dallas (J.G.).
FOOTNOTESReceived September 7, 2017; accepted November 22, 2017.
The online-only Data Supplement is available with this ar-ticle at http://circ.ahajournals.org/lookup/suppl/doi:10.1161/CIRCULATIONAHA.117.031560/-/DC1.
Guest Editor for this article was Hugo A. Katus, Dr Med.Circulation is available at http://circ.ahajournals.org.
REFERENCES 1. Wu AH, Ford L. Release of cardiac troponin in acute coronary syndromes:
ischemia or necrosis? Clin Chim Acta. 1999;284:161–174. 2. Januzzi JL Jr, Filippatos G, Nieminen M, Gheorghiade M. Troponin eleva-
tion in patients with heart failure: on behalf of the third Universal Defini-tion of Myocardial Infarction Global Task Force: Heart Failure Section. Eur Heart J. 2012;33:2265–2271. doi: 10.1093/eurheartj/ehs191.
3. Yancy CW, Jessup M, Bozkurt B, Butler J, Casey DE Jr, Drazner MH, Fon-arow GC, Geraci SA, Horwich T, Januzzi JL, Johnson MR, Kasper EK, Levy WC, Masoudi FA, McBride PE, McMurray JJ, Mitchell JE, Peterson PN, Rie-gel B, Sam F, Stevenson LW, Tang WH, Tsai EJ, Wilkoff BL; WRITING COM-MITTEE MEMBERS; American College of Cardiology Foundation/American Heart Association Task Force on Practice Guidelines. 2013 ACCF/AHA guideline for the management of heart failure: a report of the American College of Cardiology Foundation/American Heart Association Task Force on practice guidelines. Circulation. 2013;128:e240–e327. doi: 10.1161/CIR.0b013e31829e8776.
4. Ponikowski P, Voors AA, Anker SD, Bueno H, Cleland JG, Coats AJ, Falk V, González-Juanatey JR, Harjola VP, Jankowska EA, Jessup M, Linde C, Nihoy-annopoulos P, Parissis JT, Pieske B, Riley JP, Rosano GM, Ruilope LM, Rus-chitzka F, Rutten FH, van der Meer P; Authors/Task Force Members. 2016 ESC Guidelines for the diagnosis and treatment of acute and chronic heart failure: The Task Force for the diagnosis and treatment of acute and chronic heart failure of the European Society of Cardiology (ESC) developed with the special contribution of the Heart Failure Association (HFA) of the ESC. Eur Heart J. 2016;37:2129–2200. doi: 10.1093/eurheartj/ehw128.
5. Nagarajan V, Hernandez AV, Tang WH. Prognostic value of cardiac troponin in chronic stable heart failure: a systematic review. Heart. 2012;98:1778–1786. doi: 10.1136/heartjnl-2012-301779.
6. Apple FS, Collinson PO; IFCC Task Force on Clinical Applications of Cardiac Biomarkers. Analytical characteristics of high-sensitivity cardiac troponin assays. Clin Chem. 2012;58:54–61. doi: 10.1373/clinchem.2011.165795
7. Thomas D, Radji S, Benedetti A. Systematic review of methods for indi-vidual patient data meta- analysis with binary outcomes. BMC Med Res Methodol. 2014;14:79. doi: 10.1186/1471-2288-14-79.
8. Moher D, Liberati A, Tetzlaff J, Altman DG; PRISMA Group. Preferred reporting items for systematic reviews and meta-analyses: the PRIS-MA statement. PLoS Med. 2009;6:e1000097. doi: 10.1371/journal.pmed.1000097.
9. The R Project for Statistical Computing. http://www.r-project.org/ Accessed October 25, 2017.
10. Zhang Z. Survival analysis in the presence of competing risks. Ann Transl Med. 2017;5:47. doi: 10.21037/atm.2016.08.62
11. Higgins JP, Thompson SG, Deeks JJ, Altman DG. Measuring incon-sistency in meta-analyses. BMJ. 2003;327:557–560. doi: 10.1136/bmj.327.7414.557.
12. Ahmed I, Sutton AJ, Riley RD. Assessment of publication bias, selection bias, and unavailable data in meta-analyses using individual participant data: a database survey. BMJ. 2012;344:d7762.
13. Pencina MJ, D’Agostino RB, Vasan RS. Statistical methods for assess-ment of added usefulness of new biomarkers. Clin Chem Lab Med. 2010;48:1703–1711. doi: 10.1515/CCLM.2010.340.
by guest on January 18, 2018http://circ.ahajournals.org/
Dow
nloaded from

High-Sensitivity Troponin T and Prognosis
Circulation. 2018;137:286–297. DOI: 10.1161/CIRCULATIONAHA.117.031560 January 16, 2018 297
STATE OF THE ART
14. Kerr KF, Wang Z, Janes H, McClelland RL, Psaty BM, Pepe MS. Net reclassi-fication indices for evaluating risk prediction instruments: a critical review. Epidemiology. 2014;25:114–121. doi: 10.1097/EDE.0000000000000018.
15. Alonso N, Lupón J, Barallat J, de Antonio M, Domingo M, Zamora E, Moliner P, Galán A, Santesmases J, Pastor C, Mauricio D, Bayes-Genis A. Impact of diabetes on the predictive value of heart failure biomarkers. Cardiovasc Diabetol. 2016;15:151. doi: 10.1186/s12933-016-0470-x.
16. Eggers KM, Nygren M, Venge P, Jernberg T, Wikström BG. High-sensitive troponin T and I are related to invasive hemodynamic data and mortality in patients with left-ventricular dysfunction and precapillary pulmonary hypertension. Clin Chim Acta. 2011;412:1582–1588. doi: 10.1016/j.cca.2011.05.007.
17. Egstrup M, Schou M, Tuxen CD, Kistorp CN, Hildebrandt PR, Gustafsson F, Faber J, Goetze JP, Gustafsson I. Prediction of outcome by highly sensitive troponin T in outpatients with chronic systolic left ventricular heart failure. Am J Cardiol. 2012;110:552–557. doi: 10.1016/j.amjcard.2012.04.033.
18. Gaggin HK, Szymonifka J, Bhardwaj A, Belcher A, De Berardinis B, Moti-wala S, Wang TJ, Januzzi JL Jr. Head-to-head comparison of serial solu-ble ST2, growth differentiation factor-15, and highly-sensitive troponin T measurements in patients with chronic heart failure. JACC Heart Fail. 2014;2:65–72. doi: 10.1016/j.jchf.2013.10.005.
19. Gravning J, Askevold ET, Nymo SH, Ueland T, Wikstrand J, McMurray JJ, Aukrust P, Gullestad L, Kjekshus J; CORONA Study Group. Prognostic ef-fect of high-sensitive troponin T assessment in elderly patients with chron-ic heart failure: results from the CORONA trial. Circ Heart Fail. 2014;7:96–103. doi: 10.1161/CIRCHEARTFAILURE.113.000450.
20. Masson S, Anand I, Favero C, Barlera S, Vago T, Bertocchi F, Maggio-ni AP, Tavazzi L, Tognoni G, Cohn JN, Latini R; Valsartan Heart Failure Trial (Val-HeFT) and Gruppo Italiano per lo Studio della Sopravvivenza nell’Insufficienza Cardiaca–Heart Failure (GISSI-HF) Investigators. Se-rial measurement of cardiac troponin T using a highly sensitive assay in patients with chronic heart failure: data from 2 large randomized clinical trials. Circulation. 2012;125:280–288. doi: 10.1161/CIRCULA-TIONAHA.111.044149.
21. Nakamura Y, Yoshihisa A, Takiguchi M, Shimizu T, Yamauchi H, Iwaya S, Owada T, Miyata M, Abe S, Sato T, Suzuki S, Oikawa M, Kobayashi A, Yamaki T, Sugimoto K, Kunii H, Nakazato K, Suzuki H, Saitoh S, Takeishi Y. High-sensitivity cardiac troponin T predicts non-cardiac mortality in heart failure. Circ J. 2014;78:890–895.
22. Sanders-van Wijk S, van Empel V, Davarzani N, Maeder MT, Handschin R, Pfisterer ME, Brunner-La Rocca HP; TIME-CHF investigators. Circulating biomarkers of distinct pathophysiological pathways in heart failure with preserved vs. reduced left ventricular ejection fraction. Eur J Heart Fail. 2015;17:1006–1014. doi: 10.1002/ejhf.414.
23. Schroten NF, Ruifrok WP, Kleijn L, Dokter MM, Silljé HH, Lambers Heer-spink HJ, Bakker SJ, Kema IP, van Gilst WH, van Veldhuisen DJ, Hillege HL, de Boer RA. Short-term vitamin D3 supplementation lowers plasma renin activity in patients with stable chronic heart failure: an open-label, blinded end point, randomized prospective trial (VitD-CHF trial). Am Heart J. 2013;166:357–364.e2. doi: 10.1016/j.ahj.2013.05.009.
24. Tentzeris I, Jarai R, Farhan S, Perkmann T, Schwarz MA, Jakl G, Wojta J, Huber K. Complementary role of copeptin and high-sensitivity troponin in predicting outcome in patients with stable chronic heart failure. Eur J Heart Fail. 2011;13:726–733. doi: 10.1093/eurjhf/hfr049.
25. Batlle M, Campos B, Farrero M, Cardona M, González B, Castel MA, Ortiz J, Roig E, Pulgarín MJ, Ramírez J, Bedini JL, Sabaté M, García de Frutos P, Pérez-Villa F. Use of serum levels of high sensitivity troponin T, galectin-3 and C-terminal propeptide of type I procollagen at long term follow-up in heart failure patients with reduced ejection fraction: Comparison with soluble AXL and BNP. Int J Cardiol. 2016;225:113–119. doi: 10.1016/j.ijcard.2016.09.079.
26. Jungbauer CG, Riedlinger J, Buchner S, Birner C, Resch M, Lubnow M, Debl K, Buesing M, Huedig H, Riegger G, Luchner A. High-sensitive tro-ponin T in chronic heart failure correlates with severity of symptoms, left ventricular dysfunction and prognosis independently from N-terminal pro-b-type natriuretic peptide. Clin Chem Lab Med. 2011;49:1899–1906. doi: 10.1515/CCLM.2011.251.
27. Lok DJ, Klip IT, Lok SI, Bruggink-André de la Porte PW, Badings E, van Wijngaarden J, Voors AA, de Boer RA, van Veldhuisen DJ, van der Meer P. Incremental prognostic power of novel biomarkers (growth-differentiation
factor-15, high-sensitivity C-reactive protein, galectin-3, and high-sensi-tivity troponin-T) in patients with advanced chronic heart failure. Am J Cardiol. 2013;112:831–837. doi: 10.1016/j.amjcard.2013.05.013.
28. Tsutamoto T, Kawahara C, Nishiyama K, Yamaji M, Fujii M, Yamamoto T, Horie M. Prognostic role of highly sensitive cardiac troponin I in patients with systolic heart failure. Am Heart J. 2010;159:63–67. doi: 10.1016/j.ahj.2009.10.022.
29. Grodin JL, Neale S, Wu Y, Hazen SL, Tang WH. Prognostic comparison of different sensitivity cardiac troponin assays in stable heart failure. Am J Med. 2015;128:276–282. doi: 10.1016/j.amjmed.2014.09.029.
30. Cohn JN, Tognoni G; Valsartan Heart Failure Trial Investigators. A random-ized trial of the angiotensin-receptor blocker valsartan in chronic heart fail-ure. N Engl J Med. 2001;345:1667–1675. doi: 10.1056/NEJMoa010713.
31. Tavazzi L, Maggioni AP, Marchioli R, Barlera S, Franzosi MG, Latini R, Lucci D, Nicolosi GL, Porcu M, Tognoni G; Gissi-HF Investigators. Effect of n-3 polyunsaturated fatty acids in patients with chronic heart failure (the GIS-SI-HF trial): a randomised, double-blind, placebo-controlled trial. Lancet. 2008;372:1223–1230. doi: 10.1016/S0140-6736(08)61239-8.
32. Giannitsis E, Kurz K, Hallermayer K, Jarausch J, Jaffe AS, Katus HA. Ana-lytical validation of a high-sensitivity cardiac troponin T assay. Clin Chem. 2010;56:254–261. doi: 10.1373/clinchem.2009.132654
33. Levey AS, Stevens LA. Estimating GFR using the CKD Epidemiology Col-laboration (CKD-EPI) creatinine equation: more accurate GFR estimates, lower CKD prevalence estimates, and better risk predictions. Am J Kidney Dis. 2010;55:622–627. doi: 10.1053/j.ajkd.2010.02.337.
34. Sterne JA, Sutton AJ, Ioannidis JP, Terrin N, Jones DR, Lau J, Carpenter J, Rücker G, Harbord RM, Schmid CH, Tetzlaff J, Deeks JJ, Peters J, Macaskill P, Schwarzer G, Duval S, Altman DG, Moher D, Higgins JP. Recommen-dations for examining and interpreting funnel plot asymmetry in meta-analyses of randomised controlled trials. BMJ. 2011;343:d4002.
35. Latini R, Masson S, Anand IS, Missov E, Carlson M, Vago T, Angelici L, Barlera S, Parrinello G, Maggioni AP, Tognoni G, Cohn JN; Val-HeFT Inves-tigators. Prognostic value of very low plasma concentrations of troponin T in patients with stable chronic heart failure. Circulation. 2007;116:1242–1249. doi: 10.1161/CIRCULATIONAHA.106.655076.
36. Aimo A, Vergaro G, Passino C, Ripoli A, Ky B, Miller WL, Bayes-Genis A, Anand I, Januzzi JL, Emdin M. Prognostic value of soluble suppression of tumorigenicity-2 in chronic heart failure: a meta-analysis. JACC Heart Fail. 2017;5:280–286. doi: 10.1016/j.jchf.2016.09.010.
37. Clerico A, Giannoni A, Prontera C, Giovannini S. High-sensitivity troponin: a new tool for pathophysiological investigation and clinical practice. Adv Clin Chem. 2009;49:1–30.
38. Ziebig R, Lun A, Hocher B, Priem F, Altermann C, Asmus G, Kern H, Krause R, Lorenz B, Möbes R, Sinha P. Renal elimination of troponin T and tropo-nin I. Clin Chem. 2003;49:1191–1193.
39. Motiwala SR, Gaggin HK, Gandhi PU, Belcher A, Weiner RB, Baggish AL, Szymonifka J, Januzzi JL Jr. Concentrations of highly sensitive cardiac troponin-I predict poor cardiovascular outcomes and adverse remodel-ing in chronic heart failure. J Cardiovasc Transl Res. 2015;8:164–172. doi: 10.1007/s12265-015-9618-4.
40. Shemisa K, Bhatt A, Cheeran D, Neeland IJ. Novel biomarkers of sub-clinical cardiac dysfunction in the general population. Curr Heart Fail Rep. 2017;14:301–310. doi: 10.1007/s11897-017-0342-z.
41. Apple FS, Jaffe AS. Clinical implications of a recent adjustment to the high-sensitivity cardiac troponin T assay: user beware. Clin Chem. 2012;58:1599–1600. doi: 10.1373/clinchem.2012.194985
42. Kjekshus J, Apetrei E, Barrios V, Böhm M, Cleland JG, Cornel JH, Dun-selman P, Fonseca C, Goudev A, Grande P, Gullestad L, Hjalmarson A, Hradec J, Jánosi A, Kamenský G, Komajda M, Korewicki J, Kuusi T, Mach F, Mareev V, McMurray JJ, Ranjith N, Schaufelberger M, Vanhaecke J, van Veldhuisen DJ, Waagstein F, Wedel H, Wikstrand J; CORONA Group. Rosuvastatin in older patients with systolic heart failure. N Engl J Med. 2007;357:2248–2261. doi: 10.1056/NEJMoa0706201.
43. Pfisterer M, Buser P, Rickli H, Gutmann M, Erne P, Rickenbacher P, Vuil-lomenet A, Jeker U, Dubach P, Beer H, Yoon SI, Suter T, Osterhues HH, Schieber MM, Hilti P, Schindler R, Brunner-La Rocca HP; TIME-CHF Inves-tigators. BNP-guided vs symptom-guided heart failure therapy: the Trial of Intensified vs Standard Medical Therapy in Elderly Patients With Con-gestive Heart Failure (TIME-CHF) randomized trial. JAMA. 2009;301:383–392. doi: 10.1001/jama.2009.2.
by guest on January 18, 2018http://circ.ahajournals.org/
Dow
nloaded from

Justin Grodin, Claudio Passino and Michele EmdinGustafsson, Hanna K. Gaggin, Kai M. Eggers, Kurt Huber, Ioannis Tentzeris, Wai H.W. Tang, Josep Lupón, Rudolf A. de Boer, Akiomi Yoshihisa, Yasuchika Takeishi, Michael Egstrup, IdaGravning, Thor Ueland, Ståle H. Nymo, Hans-Peter Brunner-La Rocca, Antoni Bayes Genis,
JørgenMasson, Michela Magnoli, Inder S. Anand, Jay N. Cohn, Luigi Tavazzi, Gianni Tognoni, Alberto Aimo, James L. Januzzi, Jr, Giuseppe Vergaro, Andrea Ripoli, Roberto Latini, Serge
Patient Data Meta-AnalysisPrognostic Value of High-Sensitivity Troponin T in Chronic Heart Failure: An Individual
Print ISSN: 0009-7322. Online ISSN: 1524-4539 Copyright © 2018 American Heart Association, Inc. All rights reserved.
is published by the American Heart Association, 7272 Greenville Avenue, Dallas, TX 75231Circulation doi: 10.1161/CIRCULATIONAHA.117.031560
2018;137:286-297Circulation.
http://circ.ahajournals.org/content/137/3/286World Wide Web at:
The online version of this article, along with updated information and services, is located on the
http://circ.ahajournals.org/content/suppl/2018/01/12/CIRCULATIONAHA.117.031560.DC1Data Supplement (unedited) at:
http://circ.ahajournals.org//subscriptions/
is online at: Circulation Information about subscribing to Subscriptions:
http://www.lww.com/reprints Information about reprints can be found online at: Reprints:
document. Permissions and Rights Question and Answer this process is available in the
click Request Permissions in the middle column of the Web page under Services. Further information aboutOffice. Once the online version of the published article for which permission is being requested is located,
can be obtained via RightsLink, a service of the Copyright Clearance Center, not the EditorialCirculationin Requests for permissions to reproduce figures, tables, or portions of articles originally publishedPermissions:
by guest on January 18, 2018http://circ.ahajournals.org/
Dow
nloaded from
Supplemental material
PRISMA checklist
Section/topic # Checklist item Reported on page #
TITLE
Title 1 Identify the report as a systematic review, meta-analysis, or both. 1
ABSTRACT
Structured summary 2 Provide a structured summary including, as applicable: background; objectives; data sources; study eligibility criteria, participants, and interventions; study appraisal and synthesis methods; results; limitations; conclusions and implications of key findings; systematic review registration number.
2
INTRODUCTION
Rationale 3 Describe the rationale for the review in the context of what is already known. 5
Objectives 4 Provide an explicit statement of questions being addressed with reference to participants, interventions, comparisons, outcomes, and study design (PICOS).
5
METHODS
Protocol and registration 5 Indicate if a review protocol exists, if and where it can be accessed (e.g., Web address), and, if available, provide registration information including registration number.
6
Eligibility criteria 6 Specify study characteristics (e.g., PICOS, length of follow-up) and report characteristics (e.g., years considered,
language, publication status) used as criteria for eligibility, giving rationale. 6
Information sources 7 Describe all information sources (e.g., databases with dates of coverage, contact with study authors to identify additional studies) in the search and date last searched.
6
Search 8 Present full electronic search strategy for at least one database, including any limits used, such that it could be repeated.
6
Study selection 9 State the process for selecting studies (i.e., screening, eligibility, included in systematic review, and, if applicable, included in the meta-analysis).
6
Data collection process 10 Describe method of data extraction from reports (e.g., piloted forms, independently, in duplicate) and any processes for obtaining and confirming data from investigators.
6
Data items 11 List and define all variables for which data were sought (e.g., PICOS, funding sources) and any assumptions and simplifications made.
6,7
Risk of bias in individual studies
12 Describe methods used for assessing risk of bias of individual studies (including specification of whether this was done at the study or outcome level), and how this information is to be used in any data synthesis.
8
Summary measures 13 State the principal summary measures (e.g., risk ratio, difference in means). 7
Synthesis of results 14 Describe the methods of handling data and combining results of studies, if done, including measures of consistency
(e.g., I2) for each meta-analysis.
7,8
Page 1 of 2
Section/topic # Checklist item Reported on page #
Risk of bias across studies 15 Specify any assessment of risk of bias that may affect the cumulative evidence (e.g., publication bias, selective reporting within studies).
8
Additional analyses 16 Describe methods of additional analyses (e.g., sensitivity or subgroup analyses, meta-regression), if done, indicating which were pre-specified.
8,9
RESULTS
Study selection 17 Give numbers of studies screened, assessed for eligibility, and included in the review, with reasons for exclusions at each stage, ideally with a flow diagram.
10
Study characteristics 18 For each study, present characteristics for which data were extracted (e.g., study size, PICOS, follow-up period) and provide the citations.
10
Risk of bias within studies 19 Present data on risk of bias of each study and, if available, any outcome level assessment (see item 12). 11
Results of individual studies 20 For all outcomes considered (benefits or harms), present, for each study: (a) simple summary data for each intervention group (b) effect estimates and confidence intervals, ideally with a forest plot.
10
Synthesis of results 21 Present results of each meta-analysis done, including confidence intervals and measures of consistency. 10
Risk of bias across studies 22 Present results of any assessment of risk of bias across studies (see Item 15). 12
Additional analysis 23 Give results of additional analyses, if done (e.g., sensitivity or subgroup analyses, meta-regression [see Item 16]). 12,13
DISCUSSION
Summary of evidence 24 Summarize the main findings including the strength of evidence for each main outcome; consider their relevance to key groups (e.g., healthcare providers, users, and policy makers).
13-15

Limitations 25 Discuss limitations at study and outcome level (e.g., risk of bias), and at review-level (e.g., incomplete retrieval of identified research, reporting bias).
15
Conclusions 26 Provide a general interpretation of the results in the context of other evidence, and implications for future research. 15
FUNDING
Funding 27 Describe sources of funding for the systematic review and other support (e.g., supply of data); role of funders for the systematic review.
17

Supplemental Table 1. Definition of high-sensitivity troponin T (hs-TnT) cut-offs
All-cause death
All
(n=9289)
M
(n=7122)
W
(n=2167)
Ischemic
HF
(n=5543)
Non-
ischemic
HF
(n=3746)
eGFR
<30 mL/min/
1.73 m2
(n=496)
eGFR
30-59 mL/min/
1.73 m2
(n=4535)
eGFR
60-89 mL/min/
1.73 m2
(n=3615)
eGFR
≥90 mL/min/
1.73 m2
(n=574)
AUC 0.723 0.720 0.735 0.719 0.730 0.660 0.708 0.699 0.683
Optimal cut-off (ng/L) 18 23 17 18 18 40 22 15 13
Sensitivity (%) 70 59 60 69 70 59 62 61 66
Specificity (%) 64 74 69 64 65 65 68 68 64
CV death
All
(n=8443)
M
(n=6500)
W
(n=1943)
Ischemic
HF
(n=5100)
Non-
ischemic
HF
(n=3343)
eGFR
<30 mL/min/
1.73 m2
(n=452)
eGFR
30-59 mL/min/
1.73 m2
(n=4249)
eGFR
60-89 mL/min/
1.73 m2
(n=3232)
eGFR
≥90 mL/min/
1.73 m2
(n=445)
AUC 0.711 0.708 0.724 0.708 0.718 0.605 0.699 0.681 0.707
Optimal cut-off (ng/L) 16 22 17 17 17 41 22 15 13
Sensitivity (%) 73 60 67 71 74 60 63 61 72
Specificity (%) 59 71 65 60 59 58 66 66 61

CV hospitalization
All
(n=8168)
M
(n=6349)
W
(n=1819)
Ischemic
HF
(n=5073)
Non-
ischemic
HF
(n=3095)
eGFR
<30 mL/min/
1.73 m2
(n=411)
eGFR
30-59 mL/min/
1.73 m2
(n=4120)
eGFR
60-89 mL/min/
1.73 m2
(n=3185)
eGFR
≥90 mL/min/
1.73 m2
(n=387)
AUC 0.678 0.674 0.696 0.670 0.690 0.572 0.670 0.671 0.660
Optimal cut-off (ng/L) 15 22 16 13 15 38 22 15 11
Sensitivity (%) 71 53 60 75 72 54 58 55 55
Specificity (%) 57 71 69 51 58 55 67 70 63
Unadjusted analyses considering log2(hs-TnT) values were performed. AUC, area under the curve; CV, cardiovascular; eGFR, estimated glomerular filtration
rate; HF, heart failure; M, men; W, women.

Supplemental Figure 1. High-sensitivity troponin T (hs-TnT) for the prediction of all-cause and cardiovascular (CV) death
Forest plot analysis exploring the prognostic value of hs-TnT (log2-transformed) after adjustment for age, sex, heart failure etiology, left ventricular
ejection fraction, estimated glomerular filtration rate, and log2-transformed N-terminal fraction of pro-B-type natriuretic peptide. Hazard ratio (HR)

values are ln-transformed. The HR could not be calculated for the Gaggin study1, because patients experiencing all-cause death (n=14) did not have
data available for all variables considered in the adjustment process. RE, random-effects model.

Supplemental Figure 2. High-sensitivity troponin T (hs-TnT) for the prediction of
cardiovascular (CV) death: subgroup analysis
The prognostic value of hs-TnT (log2-transformed) is considered in several patient subgroups, after
adjustment for age, sex, heart failure (HF) etiology, left ventricular ejection fraction (LVEF),
estimated glomerular filtration rate (eGFR), and log2-transformed N-terminal fraction of pro-B-type

natriuretic peptide (NT-proBNP). As a cut-point for age (expressed in years), mean value is
considered, while median values are reported for NT-proBNP (ng/L), and C-reactive protein (CRP;
mg/L). eGFR is expressed as ml/min/1.73 m2. All p values are <0.001 except for eGFR <30
mL/min/1.73 m2 (p=0.009) or ≥90 mL/min/1.73 m
2 (p=0.024), LVEF 40-49% (p=0.048), LVEF
≥50% (p=0.003), and absence of anemia (p=0.002).

Supplemental Figure 3. High-sensitivity troponin T (hs-TnT) for the prediction of
cardiovascular (CV) hospitalization: subgroup analysis
The prognostic value of hs-TnT (log2-transformed) is considered in several patient subgroups, after
adjustment for age, sex, heart failure (HF) etiology, left ventricular ejection fraction (LVEF),
estimated glomerular filtration rate (eGFR), and log2-transformed N-terminal fraction of pro-B-type

natriuretic peptide (NT-proBNP). As a cut-point for age (expressed in years), mean value is
considered, while median values are reported for NT-proBNP (ng/L), and C-reactive protein (CRP;
mg/L). eGFR is expressed as ml/min/1.73 m2. All p values are <0.001 except for eGFR <30
mL/min/1.73 m2 (p=0.110) or ≥90 mL/min/1.73 m
2 (p=0.007), and LVEF ≥50% (p=0.003).

Supplemental material references
1. Gaggin HK, Szymonifka J, Bhardwaj A, Belcher A, De Berardinis B, Motiwala S, Wang TJ,
Januzzi JL Jr. Head-to-head comparison of serial soluble ST2, growth differentiation factor-
15, and highly-sensitive troponin T measurements in patients with chronic heart failure. J Am
Coll Cardiol HF. 2014;2:65-72.
doi: 10.1016/j.jchf.2013.10.005