Embed Size (px)
Citation preview
Research ArticlePrognostic Value of MicroRNAs in Patients after MyocardialInfarction: A Substudy of PRAGUE-18
M. Hromádka,1 V. Černá ,2 M. Pešta ,2 A. Kučerová,2 J. Jarkovský ,3 D. Rajdl,4
R. Rokyta,1 and Z. Moťovská5
1Department of Cardiology, University Hospital and Faculty of Medicine of Charles University, Pilsen, Czech Republic2Department of Biology, Faculty of Medicine in Pilsen, Charles University, Czech Republic3Institute of Biostatistics and Analyses, Faculty of Medicine and the Faculty of Science, Masaryk University, Brno, Czech Republic4Department of Clinical Biochemistry and Hematology, University Hospital and Faculty of Medicine in Pilsen, Czech Republic5Cardiocentre, Third Faculty of Medicine, Charles University and University Hospital Kralovske Vinohrady, Prague, Czech Republic
Correspondence should be addressed to V. Černá; [email protected]
Received 8 April 2019; Revised 15 August 2019; Accepted 5 September 2019; Published 3 November 2019
Guest Editor: Ioana Mozos
Copyright © 2019 M. Hromádka et al. This is an open access article distributed under the Creative Commons Attribution License,which permits unrestricted use, distribution, and reproduction in any medium, provided the original work is properly cited.
Background. The evaluation of the long-term risk of major adverse cardiovascular events and cardiac death in patients after acutemyocardial infarction (AMI) is an established clinical process. Laboratory markers may significantly help with the risk stratificationof these patients. Our objective was to find the relation of selected microRNAs to the standard markers of AMI and determine ifthese microRNAs can be used to identify patients at increased risk. Methods. Selected microRNAs (miR-1, miR-133a, and miR-499) were measured in a cohort of 122 patients from the PRAGUE-18 study (ticagrelor vs. prasugrel in AMI treated with primarypercutaneous coronary intervention (pPCI)). The cohort was split into two subgroups: 116 patients who did not die (survivors)and 6 patients who died (nonsurvivors) during the 365-day period after AMI. Plasma levels of selected circulating miRNAs werethen assessed in combination with high-sensitivity cardiac troponin T (hsTnT) and N-terminal probrain natriuretic peptide(NT-proBNP). Results. miR-1, miR-133a, and miR-499 correlated positively with NT-proBNP and hsTnT 24 hours afteradmission and negatively with left ventricular ejection fraction (LVEF). Both miR-1 and miR-133a positively correlated withhsTnT at admission. Median relative levels of all selected miRNAs were higher in the subgroup of nonsurvivors (N = 6) incomparison with survivors (N = 116), but the difference did not reach statistical significance. All patients in the nonsurvivorsubgroup had miR-499 and NT-proBNP levels above the cut-off values (891.5 ng/L for NT-proBNP and 0.088 for miR-499),whereas in the survivor subgroup, only 28.4% of patients were above the cut-off values (p = 0:001). Conclusions. Statisticallysignificant correlation was found between miR-1, miR-133a, and miR-499 and hsTnT, NT-proBNP, and LVEF. In addition, thisanalysis suggests that plasma levels of circulating miR-499 could contribute to the identification of patients at increased risk ofdeath during the first year after AMI, especially when combined with NT-proBNP levels.
1. Introduction
The in-hospital mortality rate for acute myocardial infarctionis low, due to efficient antiplatelet treatment and primarypercutaneous coronary intervention (pPCI); unfortunately,the risk of cardiac death increases during the chronic phaseof ischemic heart disease that follows.
Decreased left ventricular systolic function with leftventricular ejection fraction ðLVEFÞ ≤ 35% and recurrent ven-
tricular tachycardia or ventricular fibrillation, beyond the earlyphase of myocardial infarction, are connected with a poorprognosis and are a potential indication for cardioverterimplantation [1].
Despite the clear benefit of these widely used predictors,they seem to be inadequate for identifying all patients at riskof sudden death, since it fails to identify about 50% of patientswho die suddenly [2] after acute myocardial infarction(AMI). Some of the standard laboratory markers associated
HindawiDisease MarkersVolume 2019, Article ID 2925019, 9 pageshttps://doi.org/10.1155/2019/2925019
with the risk of sudden death can be used in combination withLVEF to improve the risk assessment process, but unfortu-nately, well-defined cut-off values are still not known.
Among factors that can be used for risk stratification afterAMI, the following play an important role: elevated levels oftroponin T or I (TnT or TnI) [3, 4] and a combination of (A)increased TnT and CRP plasma levels, (B) increased levelsof N-terminal prohormone of brain natriuretic peptide(NT-proBNP) with LVEF < 40% [4–7], and (C) decreasedclearance of creatinine (with a reduced LVEF) [8].
A promising group of new biomarkers, released fromcells into circulation, is microRNAs (miRNAs), which aresmall noncoding RNA molecules, 20–22 nucleotides inlength, involved in posttranscriptional regulation of geneexpression. Mature miRNAs and Ago proteins (Argonauteproteins) form in the cytoplasm RISC complexes (RNA-induced silencing complexes) that interact with protein-coding mRNA molecules. This interaction usually leads tothe inhibition of translation or directly to the degradationof mRNA molecules. One particular microRNA can regulatemany genes (i.e., interacting with a variety of differentprotein-coding mRNAs), and one particular gene can beregulated by several different microRNAs. MicroRNAs canact directly within the cells where they are synthesized, orthey can be exported, in complexes with proteins or inmembrane-bound vesicles (exosomes or microvesicles), toother cells where they can also regulate gene expression.MicroRNAs are involved in the control of many processesin both healthy and infarcted myocardia, including prolifera-tion, differentiation, apoptosis, repair, and revascularization[9]. Additionally, miRNA dysregulation has been stronglyimplicated in the destabilization and rupture of atheroscle-rotic plaques [10] as well as being involved in the process ofmyocardial recovery.
In cardiovascular diseases (CVD), the use of miRNAs asbiomarkers for specific disease entities has been successfullyinvestigated in numerous studies [11]. Nonetheless, it is notyet possible to use them in clinical practice [12]. miRNAsalso have the potential for clinical use in CVD where proteinbiomarkers are not available.
More than 2500 mature miRNAs have been identified inhumans. Four of them, miR-1, miR-133, miR-208a, andmiR-499 have been found to be specific for the myocar-dium (or the myocardium and skeletal muscle) and aresometimes called “myomiRs” [13].
Many authors have shown that levels of circulating myo-miRs increase significantly during the first few hours after theonset of myocardial infarction symptoms. After reaching apeak, myomiRs return to normal after a few hours or a fewdays [14, 15].
We decided to retrospectively measure the relative levelsof circulating miR-1, miR-133a, miR-208a, and miR-499 ina well-described cohort of 122 patients with known one-year mortality, previously involved in the PRAGUE-18 study[16, 17]. The listed miRNAs were assessed alone and in com-bination with several standard markers in an effort to bettercharacterize the nonsurvivor subgroup, with the goal offinding additional predictors of patients at increased risk ofone-year cardiovascular death.
2. Material and Methods
2.1. Patients. The whole cohort of 122 patients was treatedin the Department of Cardiology, University Hospital andFaculty of Medicine of Charles University, Pilsen, CzechRepublic, which was one of the centers involved in phaseIV of a multicenter, open-label, randomized, controlledclinical trial called the PRAGUE-18 study [16, 17].
The PRAGUE-18 study, which compared prasugrel andticagrelor in the treatment of acute myocardial infarction,was the first randomized head-to-head comparison of thesetwo active substances, with regard to efficacy and safety inpatients after AMI undergoing pPCI. One of the outcomeswas the combined endpoint of cardiovascular death, MI, orstroke within the first year. Prasugrel and ticagrelor had beensimilarly effective during the first year after AMI [16, 17].Plasma samples from 122 patients in the study were usedfor this retrospective data analysis, where (I) levels of selectedcirculating microRNAs, (II) standard AMI biomarkers, and(III) LVEF were used to (A) look for correlations betweenmiRNAs and standard AMI markers, (B) identify differencesin biomarkers between survivors and nonsurvivors duringthe first year after AMI, and (C) better characterize the non-survivor subgroup relative to measures I, II, and III men-tioned above.
2.2. Echocardiography. Two-dimensional, M-mode, andDoppler echocardiograms were acquired using an ultrasoundsystem (Vivid 7, GE Medical Systems, Horton, Norway)using a 3.4MHz multifrequency transducer. The systolicfunction of the left ventricle was determined according tothe Simpson method from the apical 4-chamber view andthe apical 2-chamber view (the biplane Simpson method).
2.3. Levels of Biomarkers. Data for the basic characteristicsof all patients involved in the analysis were available fromthe PRAGUE-18 study. Levels of standard AMI biomarkerswere known, including hsTnT, NT-proBNP, cystatin C,myoglobin, growth/differentiation factor 15 (GDF-15), andcreatine kinase (CK) at patient admission and hsTnT alsoafter 24 hours.
NT-proBNP was determined using the original analyticalkits from Roche on a cobas® 8000 analyzer. NT-proBNP andhigh-sensitivity cardiac troponin were determined using theoriginal analytical kits from Roche with the electrochemilu-miniscence (ECLIA) principle on a cobas e602 analyzer.Imprecission of the hsTnT method on the 99th percentilewas below 10% which is the required analytical performancespecification. Growth/differentiation factor 15 (GDF-15)(RayBiotech, Norcross, USA) was determined using ELISAkits on a NEXgen Four ELISA reader (Adaltis, Rome, Italy).
Since hsTnT is themost frequently used standard biomarkerof AMI and NT-proBNP is a sensitive marker of left ventriculardysfunction, we used them in combination with the potentialnew microRNA biomarkers, in subsequent analyses.
2.4. MicroRNA Analysis
2.4.1. RNA Isolation. MicroRNA was isolated from plasmasamples taken 24 hours after admission (all patients were
2 Disease Markers
already after pPCI at that time) and stored at −80°C. Totalcell-free RNA was isolated from 200 μL of plasma using miR-Neasy Serum/Plasma Kits (miRNeasy Serum/Plasma Kit(50), Cat no./ID 217184; Qiagen, Hilden, Germany) accord-ing to the manufacturer’s instructions. Total RNA was elutedin 14 μL of ribonuclease-free water and stored at −80°C untilfurther analyses. MicroRNA-39 (C. elegansmiR-39) was usedas the RNA spike-in control. A fixed volume of 1μL of thisRNA eluate was used for each reverse transcription reaction.
2.4.2. Quantitative Estimation of MicroRNA Expression. Forreverse transcriptions and quantitative estimations ofselected microRNAs using real-time PCR reactions, Taq-Man® MicroRNA Assays and master mixes were used (cata-logue number 4440887: hsa-miR-133a-3p—Assay ID002246, hsa-miR-1-3p—Assay ID 002222, hsa-miR-499a-5p—Assay ID 001352, hsa-miR-208-3p—Assay ID 000511,and cel-miR-39-3p—Assay ID 000200; TaqMan UniversalMMIX II: catalogue number 4440049; and TaqMan®MicroRNA RT Kit: catalogue number 4366597). AT100TM thermal cycler (Bio-Rad, California, United States)was used for reverse transcription. The reaction volumewas 15 μL. A fixed volume of 2.5μL from this RT reactionwas used into each real-time PCR reaction. Due to eithertoo high or absent Ct values, levels of miR-208a couldnot be quantified and evaluated.
2.4.3. Processing of Real-Time PCR Data. Samples wereassessed in technical duplicate. The Ct values were correctedusing calibrators to eliminate differences between individualruns of the Stratagene Mx3000P Real-Time PCR apparatus(Agilent Technologies, CA, United States). In cases where adisagreement between results obtained from both technicalduplicates was found, the sample assessment was repeated.Plasma levels for each miRNA were calculated in the formof a relative expression. This relative expression was calcu-lated using the ΔCt method (i.e., the 2-ΔCt algorithm wasΔCt = CtmiR−x − CtmiR−39).
2.5. Objectives. Our objectives were to find relationshipsbetween selected miRNAs and the standard biomarkers ofAMI as well as to find a panel of standard and potentialbiomarkers that might contribute to the identification ofhigh-risk patients after acute myocardial infarction andpost-pPCI treatment. The whole cohort was split accord-ing to the primary outcome (death within 365 days afterAMI) into two subgroups (survivors and nonsurvivors),and both subgroups were characterized according to theirbiomarker levels.
2.6. Statistical Analysis. In this analysis, standard descriptivestatistics were applied; absolute and relative frequencies wereused for categorical variables and medians (supplementedwith the 5th and 95th percentiles) were used for continuousvariables (mean, SD, and CV were also used for the descrip-tion of miRs). The statistical significance of differencesamong groups of patients was tested using Fisher’s exact testfor categorical variables and the Mann-Whitney test for con-tinuous variables. The Spearman correlation coefficient wasused for the analysis of the statistical relationship between
miRNAs and the standard markers. Cut-off points (cut-offvalues) of predictors of all-cause death during 365 days wereestablished by ROC analysis. The point that guarantees thegreatest sum of sensitivity and specificity was chosen as thebest point. Risk factors for all-cause death during 365 dayswere analyzed by a Cox regression model of proportionalhazards. Analysis was performed in IBM SPSS Statistics24.0 with 5% level of significance.
3. Results
3.1. Baseline Characteristics. The analysis involved 122 adultpatients (78.7% men and 21.3% women) with AMI followedby pPCI; the median age was 61.1 years. All patients usedeither prasugrel (53.3%) or ticagrelor (46.7%) for antiplatelettherapy. The cohort of patients was split into two subgroups:nonsurvivors (N = 6) and survivors (N = 116). Only sixpatients died within one year after AMI (three patients fromthe prasugrel and three from the ticagrelor group): five diedsuddenly and one died while in the hospital from an uncon-firmed diagnosis of pulmonary embolism. All patients in thissubgroup had an LVEF ≥ 40% at their control visit, whichwas 2–3 months after discharge from the hospital. The base-line characteristics of all patients, and both subgroups,including their comparison, are shown in Table 1.
3.2. Correlation of miRNAs with Standard Biomarkers. Therelative levels of all three miRNAs were related to thelevels of standard biomarkers: hsTnT (at admission),hsTnT (24 hours after admission), NT-proBNP, GDF-15,cystatin C, and LVEF.
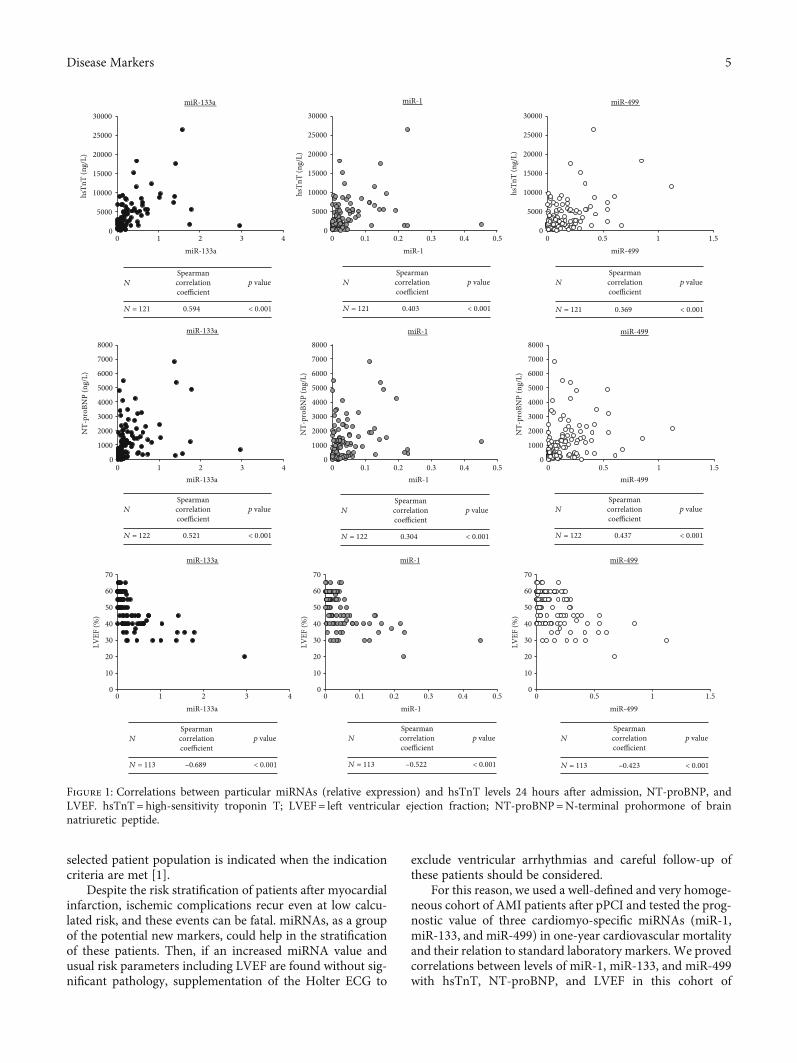
miR-133a and miR-1 weakly positively correlated withhsTnT at admission and strongly positively correlated withhsTnT 24 hours after admission (Figure 1). miR-499 moder-ately correlated with hsTnT 24 hours after admission. Astrong negative correlation was found between all three miR-NAs and the LVEF (Figure 1). A strong positive correlationwas identified between both miR-133a and miR-499 andNT-proBNP, and a moderate positive correlation was foundbetween miR-1 and NT-proBNP (Figure 1).
No correlation was found between any of the miRNAsand GDP-15 or cystatin C.
3.3. The Relationship between miRNAs and One-YearMortality. The assessment of the prognostic potential of theselected biomarkers, for the identification of patients atincreased risk of death, was based on their peripheral plasmalevels and one-year survival.
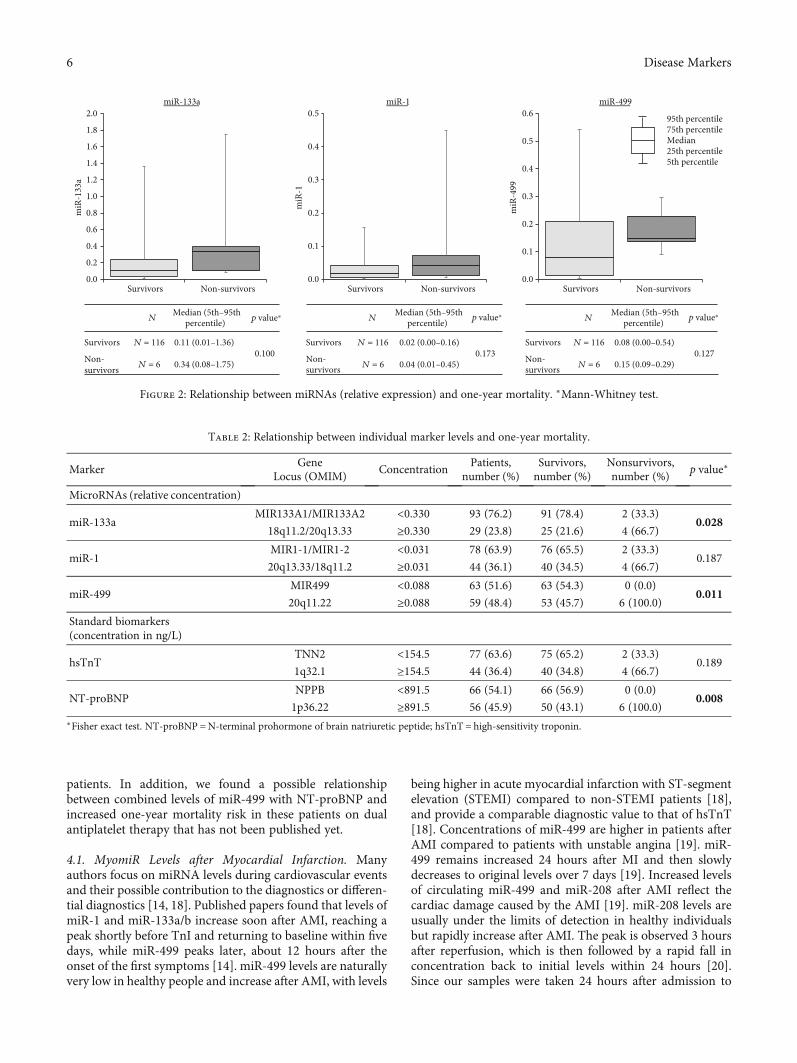
Median relative levels of miRNAs were higher in the non-survivor subgroup. But the total number of patients in thissubgroup was small in comparison with that in the groupof survivors (six vs. one hundred and sixteen), and the differ-ences found did not reach statistical significance for any ofthe tested microRNAs (Figure 2).
The calculated cut-off values for miR-1, miR-133a, andmiR-499 were 0.031, 0.330, and 0.088, respectively. RelativemiRNA concentrations below these cut-off values weredescribed as “low,” and those above the value were describedas “high.”
3Disease Markers

Comparisons of the number of patients with low andhigh concentrations of particular miRNAs were made in bothsubgroups; in the nonsurvivor group, the relative frequencyof high concentrations was higher, and in the case of miR-133a and miR-499, this difference reached statistical signifi-cance (Table 2, microRNAs). All 6 nonsurvivors had a highconcentration of miR-499, whereas, in the survivor sub-group, only 46% of patients had a high concentration.
3.4. Relationship between Standard Biomarkers and One-YearMortality. For the standard markers hsTnT and NT-proBNP,cut-off values were found in the same way as for miRNAs,and values were then described as either “low” or “high.”The cut-off value for hsTnT was 154.5 ng/L, and for NT-proBNP, it was 891.5 ng/L.
The number of patients with low and high concentrationsof these two biomarkers was compared in both subgroups,and in the nonsurvivor group, the frequency of high markerlevels was higher; in the case of NT-proBNP, this differencewas statistically significant (Table 3, standard biomarkers).All patients who died within one year had a high concentra-tion of NT-proBNP, whereas in the survivor group, only 43%had a high concentration of NT-proBNP.
3.5. Combinations of Biomarkers. Using the estimated cut-offvalues, two or three biomarkers were combined, in an effortto better describe the nonsurvivor subgroup and identifypatients at risk of death. Combinations included (A) com-binations of different microRNAs, (B) combinations ofstandard markers, and (C) combinations of microRNAsand standard markers. All tested combinations are shownin Table 3.
Based on a combination of NT-proBNP and miR-499levels, a test group of 39 “at-risk” patients was created, whichwas 32% of the entire (survivor+nonsurvivor) cohort. TheNT-proBNP and miR-499 combination criteria put all sixnonsurvivors in the “at-risk” group, where they represented15% of the “at-risk” group.
4. Discussion
In patients with a proven increased risk of death based oncardiovascular risk stratification during hospitalization,treatment with ACE inhibitors (or angiotensin AT1blockers), beta-blocker therapy, and aldosterone antagonistsare indicated when EF LK is ≤40% and/or there is heart fail-ure [1]. Implantation of cardioverter-defibrillator (ICD) in a
Table 1: Baseline characteristics.
All patients Survivors Nonsurvivors p values
Median (5th-95th percentile)
Number of patients 122 116 6
Age (years) 61.1 (40.4–76.8) 61.1 (40.1–76.7) 65.7 (56.1–81.0) 0.166
Men (number, %) 96 (78.7%) 91 (78.4%) 5 (83.3%) 0.999
BMI 27.6 (22.2–34.3) 27.6 (22.1–34.3) 26.7 (24.7–44.1) 0.929
Drug used: prasugrel (number, %) 65 (53.3%) 62 (53.4%) 3 (50.0%)0.999
Drug used: ticagrelor (number, %) 57 (46.7%) 54 (46.6%) 3 (50.0%)
STEMI (number, %) 121 (99.2%) 115 (99.1%) 6 (100.0%) 0.999
Left bundle branch block (LBBB) (number, %) 1 (0.8%) 1 (0.9%) 0 (0.0%) 0.999
Right bundle branch block (RBBB) (number, %) 1 (0.8%) 1 (0.9%) 0 (0.0%) 0.999
Hyperlipidaemia (number, %) 36 (29.5%) 35 (30.2%) 1 (16.7%) 0.669
Obesity (number, %) 23 (18.9%) 22 (19.0%) 1 (16.7%) 0.999
Arterial hypertension (number, %) 56 (45.9%) 52 (44.8%) 4 (66.7%) 0.412
Smoking (number, %) 84 (68.9%) 80 (69.0%) 4 (66.7%) 0.999
Diabetes mellitus (number, %) 17 (13.9%) 16 (13.8%) 1 (16.7%) 0.999
Time since the first symptoms to admission (hours) 3.0 (0.5–36.0) 3.0 (0.5–12.0) 6.0 (3.0–72.0) 0.061
Left ventricular ejection fraction (%) 50.0 (30.0–60.0) 55.0 (30.0–60.0) 45.0 (30.0–50.0) 0.054
Laboratory values (median (5th-95th percentile))
hsTnT (at admission) (ng/L) 86.0 (12.0–1325.0) 84.0 (12.0–1325.0) 201.5 (27.0–4978.0) 0.257
hsTnT (24 hours after admission) (ng/L) 2432.0 (377.0–9651.0) 2324.0 (368.0–9651.0) 4306.5 (1526.0–15114.0) 0.201
Myoglobin (at admission) (μg/L) 198.0 (30.0–1385.0) 176.0 (30.0–1547.0) 652.0 (161.0–1317.0) 0.066
Creatine kinase (at admission) (μkat/L) 3.9 (1.4–23.7) 3.8 (1.3–23.7) 6.4 (2.6–26.8) 0.097
NT-proBNP (at admission) (ng/L) 757.0 (105.0–4142.0) 666.5 (104.0–4285.0) 1373.5 (904.0–3096.0) 0.074
Cystatin C (at admission) (mg/L) 121; 0.99 (0.80–1.47) 1.00 (0.79–1.49) 0.92 (0.85–1.09) 0.417
GDF-15 (at admission) (ng/L) 807.1 (372.8–1827.7) 796.3 (372.8–1827.7) 1044.9 (357.3–1848.8) 0.305
GDF-15 = growth/differentiation factor 15; hsTnT = high-sensitivity troponin T; NT-proBNP =N-terminal prohormone of brain natriuretic peptide;STEMI = acute myocardial infarction with ST-segment elevation.
4 Disease Markers
selected patient population is indicated when the indicationcriteria are met [1].
Despite the risk stratification of patients after myocardialinfarction, ischemic complications recur even at low calcu-lated risk, and these events can be fatal. miRNAs, as a groupof the potential new markers, could help in the stratificationof these patients. Then, if an increased miRNA value andusual risk parameters including LVEF are found without sig-nificant pathology, supplementation of the Holter ECG to
exclude ventricular arrhythmias and careful follow-up ofthese patients should be considered.
For this reason, we used a well-defined and very homoge-neous cohort of AMI patients after pPCI and tested the prog-nostic value of three cardiomyo-specific miRNAs (miR-1,miR-133, and miR-499) in one-year cardiovascular mortalityand their relation to standard laboratory markers. We provedcorrelations between levels of miR-1, miR-133, and miR-499with hsTnT, NT-proBNP, and LVEF in this cohort of
0
5000
10000
15000
20000
25000
30000
0 1 2 3 4
hsTn
T (n
g/L)
miR-133a
0
5000
10000
15000
20000
25000
30000
0 0.1 0.2 0.3 0.4 0.5
hsTn
T (n
g/L)
miR-1
0
5000
10000
15000
20000
25000
30000
0 0.5 1 1.5
hsTn
T (n
g/L)
miR-499
miR-133a miR-1 miR-499
N Spearmancorrelationcoefficient
p value
N = 121 0.594 < 0.001
N Spearmancorrelationcoefficient
p value
N = 121 0.403 < 0.001
N Spearmancorrelationcoefficient
p value
N = 121 0.369 < 0.001
0
1000
2000
3000
4000
5000
6000
7000
8000
0 1 2 3 4
NT-
proB
NP
(ng/
L)
miR-133a
0
1000
2000
3000
4000
5000
6000
7000
8000
0 0.1 0.2 0.3 0.4 0.5
NT-
proB
NP
(ng/
L)
miR-1
0
1000
2000
3000
4000
5000
6000
7000
8000
0 0.5 1 1.5
NT-
proB
NP
(ng/
L)
miR-499
miR-133a miR-1 miR-499
N Spearmancorrelationcoefficient
p value
N = 122 0.521 < 0.001
N Spearmancorrelationcoefficient
p value
N = 122 0.304 < 0.001
N Spearmancorrelationcoefficient
p value
N = 122 0.437 < 0.001
0
10
20
30
40
50
60
70
0 1 2 3 4
LVEF
(%)
miR-133a
0
10
20
30
40
50
60
70
0 0.1 0.2 0.3 0.4 0.5
LVEF
(%)
miR-1
0
10
20
30
40
50
60
70
0 0.5 1 1.5
LVEF
(%)
miR-499
miR-133a miR-1 miR-499
N Spearmancorrelationcoefficient
p value
N = 113 –0.689 < 0.001
N Spearmancorrelationcoefficient
p value
N = 113 < 0.001
N Spearmancorrelationcoefficient
p value
N = 113 –0.423 < 0.001–0.522
Figure 1: Correlations between particular miRNAs (relative expression) and hsTnT levels 24 hours after admission, NT-proBNP, andLVEF. hsTnT= high-sensitivity troponin T; LVEF= left ventricular ejection fraction; NT-proBNP=N-terminal prohormone of brainnatriuretic peptide.
5Disease Markers
patients. In addition, we found a possible relationshipbetween combined levels of miR-499 with NT-proBNP andincreased one-year mortality risk in these patients on dualantiplatelet therapy that has not been published yet.
4.1. MyomiR Levels after Myocardial Infarction. Manyauthors focus on miRNA levels during cardiovascular eventsand their possible contribution to the diagnostics or differen-tial diagnostics [14, 18]. Published papers found that levels ofmiR-1 and miR-133a/b increase soon after AMI, reaching apeak shortly before TnI and returning to baseline within fivedays, while miR-499 peaks later, about 12 hours after theonset of the first symptoms [14]. miR-499 levels are naturallyvery low in healthy people and increase after AMI, with levels
being higher in acute myocardial infarction with ST-segmentelevation (STEMI) compared to non-STEMI patients [18],and provide a comparable diagnostic value to that of hsTnT[18]. Concentrations of miR-499 are higher in patients afterAMI compared to patients with unstable angina [19]. miR-499 remains increased 24 hours after MI and then slowlydecreases to original levels over 7 days [19]. Increased levelsof circulating miR-499 and miR-208 after AMI reflect thecardiac damage caused by the AMI [19]. miR-208 levels areusually under the limits of detection in healthy individualsbut rapidly increase after AMI. The peak is observed 3 hoursafter reperfusion, which is then followed by a rapid fall inconcentration back to initial levels within 24 hours [20].Since our samples were taken 24 hours after admission to
miR-133a miR-1 miR-499
0.0
0.2
0.4
0.6
0.8
1.0
1.2
1.4
1.6
1.8
2.0
Survivors Non-survivors
miR
-133
a
0.0
0.1
0.2
0.3
0.4
0.5
Survivors Non-survivorsm
iR-1
0.0
0.1
0.2
0.3
0.4
0.5
0.6
Survivors Non-survivors
miR
-499
N Median (5th–95th
percentile)
Survivors N = 116 0.11 (0.01–1.36)0.100 Non-
survivors N = 6 0.34 (0.08–1.75)
N
Survivors N = 116 0.02 (0.00–0.16)0.173 Non-
survivors N = 6 0.04 (0.01–0.45)
N
Survivors N = 116 0.08 (0.00–0.54)0.127 Non-
survivors N = 6 0.15 (0.09–0.29)
95th percentile 75th percentile Median 25th percentile 5th percentile
Median (5th–95thpercentile) p value⁎ Median (5th–95th
percentile) p value⁎ p value⁎
Figure 2: Relationship between miRNAs (relative expression) and one-year mortality. ∗Mann-Whitney test.
Table 2: Relationship between individual marker levels and one-year mortality.
MarkerGene
ConcentrationPatients,
number (%)Survivors,number (%)
Nonsurvivors,number (%)
p value∗Locus (OMIM)
MicroRNAs (relative concentration)
miR-133aMIR133A1/MIR133A2 <0.330 93 (76.2) 91 (78.4) 2 (33.3)
0.02818q11.2/20q13.33 ≥0.330 29 (23.8) 25 (21.6) 4 (66.7)
miR-1MIR1-1/MIR1-2 <0.031 78 (63.9) 76 (65.5) 2 (33.3)
0.18720q13.33/18q11.2 ≥0.031 44 (36.1) 40 (34.5) 4 (66.7)
miR-499MIR499 <0.088 63 (51.6) 63 (54.3) 0 (0.0)
0.01120q11.22 ≥0.088 59 (48.4) 53 (45.7) 6 (100.0)
Standard biomarkers(concentration in ng/L)
hsTnTTNN2 <154.5 77 (63.6) 75 (65.2) 2 (33.3)
0.1891q32.1 ≥154.5 44 (36.4) 40 (34.8) 4 (66.7)
NT-proBNPNPPB <891.5 66 (54.1) 66 (56.9) 0 (0.0)
0.0081p36.22 ≥891.5 56 (45.9) 50 (43.1) 6 (100.0)
∗Fisher exact test. NT-proBNP =N-terminal prohormone of brain natriuretic peptide; hsTnT = high-sensitivity troponin.
6 Disease Markers

Table 3: Relationship between various combinations of marker levels and one-year mortality.
Markers and their levels Patients, number (%) Survivors, number (%) Nonsurvivors, number (%) p value∗
MicroRNAs
miR-133a+miR-1
Both low 75 (61.5) 73 (62.9) 2 (33.3)
0.045One low and one high 21 (17.2) 21 (18.1) 0 (0.0)
Both high 26 (21.3) 22 (19.0) 4 (66.7)
miR-133a+miR-499
Both low 57 (46.7) 57 (49.1) 0 (0.0)
0.004One low and one high 42 (34.4) 40 (34.5) 2 (33.3)
Both high 23 (18.9) 19 (16.4) 4 (66.7)
miR-1+miR-499
Both low 47 (38.5) 47 (40.5) 0 (0.0)
0.019One low and one high 47 (38.5) 45 (38.8) 2 (33.3)
Both high 28 (23.0) 24 (20.7) 4 (66.7)
miR-133a+miR-1+miR-499
All low 47 (38.5) 47 (40.5) 0 (0.0)
0.003Minimum one low, minimum one high 55 (45.1) 53 (45.7) 2 (33.3)
All high 20 (16.4) 16 (13.8) 4 (66.7)
Standard biomarkers
hsTnT+NT-proBNP
Both low 42 (34.7) 42 (36.5) 0 (0.0)
0.006One low and one high 58 (47.9) 56 (48.7) 2 (33.3)
Both high 21 (17.4) 17 (14.8) 4 (66.7)
MicroRNAs and standard biomarkers
hsTnT+miR-133a
Both low 63 (52.1) 62 (53.9) 1 (16.7)
0.024One low and one high 43 (35.5) 41 (35.7) 2 (33.3)
Both high 15 (12.4) 12 (10.4) 3 (50.0)
hsTnT+miR-1
Both low 53 (43.8) 52 (45.2) 1 (16.7)
0.094One low and one high 48 (39.7) 46 (40.0) 2 (33.3)
Both high 20 (16.5) 17 (14.8) 3 (50.0)
hsTnT+miR-499
Both low 39 (32.2) 39 (33.9) 0 (0.0)
0.005One low and one high 61 (50.4) 59 (51.3) 2 (33.3)
Both high 21 (17.4) 17 (14.8) 4 (66.7)
NT-proBNP+miR-133a
Both low 59 (48.4) 59 (50.9) 0 (0.0)
0.003One low and one high 41 (33.6) 39 (33.6) 2 (33.3)
Both high 22 (18.0) 18 (15.5) 4 (66.7)
NT-proBNP+miR-1
Both low 51 (41.8) 51 (44.0) 0 (0.0)
0.014One low and one high 42 (34.4) 40 (34.5) 2 (33.3)
Both high 29 (23.8) 25 (21.6) 4 (66.7)
NT-proBNP+miR-499
Both low 46 (37.7) 46 (39.7) 0 (0.0)
0.001One low and one high 37 (30.3) 37 (31.9) 0 (0.0)
Both high 39 (32.0) 33 (28.4) 6 (100.0)∗Fisher exact test: difference between both subgroups. hsTnT = high-sensitivity troponin T; NT-proBNP =N-terminal prohormone of brain natriuretic peptide.
7Disease Markers
the hospital, the concentration of miR-208 was either underthe detection limit or too low to be quantified, so this miRNAwas not included in our analysis, and only levels of miR-1,miR-133a, and miR-499 were measured.
4.2. Correlations of miRNAs with Standard Markers. Wefocused on the correlation with selected standard biomarkersand found a significant positive correlation of the threemicroRNAs with hsTnT and NT-proBNP. Our findingsagree with other published papers, where levels of miR-499were found to be positively correlated with levels of troponinT and I [14, 19, 21], despite minor differences in methods, thecohort of MI patients, and time of sampling. A positive cor-relation (r = 0:596, p < 0:001) between miR-133a and cTnIwas previously published [19, 22] and reported a similartrend in levels of both markers in the early phase of AMI[22]; another work described an early miR-1, miRNA-133a,and miR-133b peak that occurred at a similar time as theTnI peak, whereas miR-499-5p exhibited a slower timecourse [14]. A correlation was also found between miR-499and creatinine kinase (CK) [18, 19].
All the three analyzed miRNAs were found to have amoderate or strong positive correlation with NT-proBNP,which was published to be an important independent predic-tor of poor outcomes [23]. Furthermore, we found a strongnegative correlation between all the three miRNAs andLVEF, which is in line with several other authors who founda similar negative correlation of miR-499 with LVEF(r = −0:36, p = 0:008) [16] or a weak negative correlation ofmiR-499-5p with LVEF (−0.11, p = 0:037) and miR-1 withLVEF (r = −0:16, p = 0:003) [21].
4.3. miRNAs in One-Year Prognosis. Finally, we looked fordifferences in the levels of laboratory markers betweenpatients at an increased risk of death (nonsurvivors) and sur-vivors. We found that all nonsurvivors had high levels of NT-proBNP and high levels of miR-499. Levels of NT-proBNPwere measured in all AMI patients shortly after admissionto the hospital before pPCI; in addition, the levels of micro-RNAs were also measured as potential new biomarkers.The choice of microRNAs was based on promising assess-ments for diagnostics or prognostics in recently published lit-erature [14, 21, 22, 24].
Current risk stratification is based primarily on left ven-tricular dysfunction, measured as left ventricular ejectionfraction [1, 2]. Many studies have found a clear relationshipbetween reduced LVEF and mortality, which increases whenLVEF falls under 50% and progressively increases whenLVEF declines under 40% [2]. Despite this important predic-tor, about 50% of patients who die suddenly do not meet theabovementioned LVEF criteria [2]. Also, in our cohort, only2 patients out of 6 in the nonsurvivor subgroup had anLVEF ≤ 35% during hospitalization and none at the time offollow-up. Our goal was to find a combination of laboratorymarkers that could contribute to the better identification ofpatients at increased risk of death after myocardial infarctionand thus decrease the relatively high post-AMI mortality thatreaches 7–20% at one year, 24–38% at five years, and 40–56%at ten years [2].
In our work, we analyzed cardio-enriched microRNAs,measurable 24 hours after patient admission to the hospital,to see if some of them could potentially fit into such a panelof biomarkers. Our results found that miR-499 in combina-tion with NT-proBNP was best able to characterize the non-survivor subgroup. The number of papers dealing withmyomiRs and AMI patients’ prognosis is relatively limited.A recently published work confirms increased levels ofcardio-enriched miRNAs (miR-499 and miR-208) in theblood of AMI patients and establishes an association ofincreased miRNA levels with reduced systolic function afterAMI and risk of death or heart failure within 30 days [21].Another work found that circulating levels of miR-133a andmiR-208b were associated with all-cause mortality at 6months, but this did not add prognostic information tohsTnT, the standard marker of AMI [25]. miR-133 was alsostudied in the high-risk STEMI patient cohort, where itslevels provided prognostic information but do not add inde-pendent prognostic information to traditional markers ofAMI [26].
In spite of the undeniable advantages of a well-definedand very homogeneous cohort of patients, this analysis waslimited by the low number of patients in the nonsurvivorsubgroup and by its retrospective character.
5. Conclusion
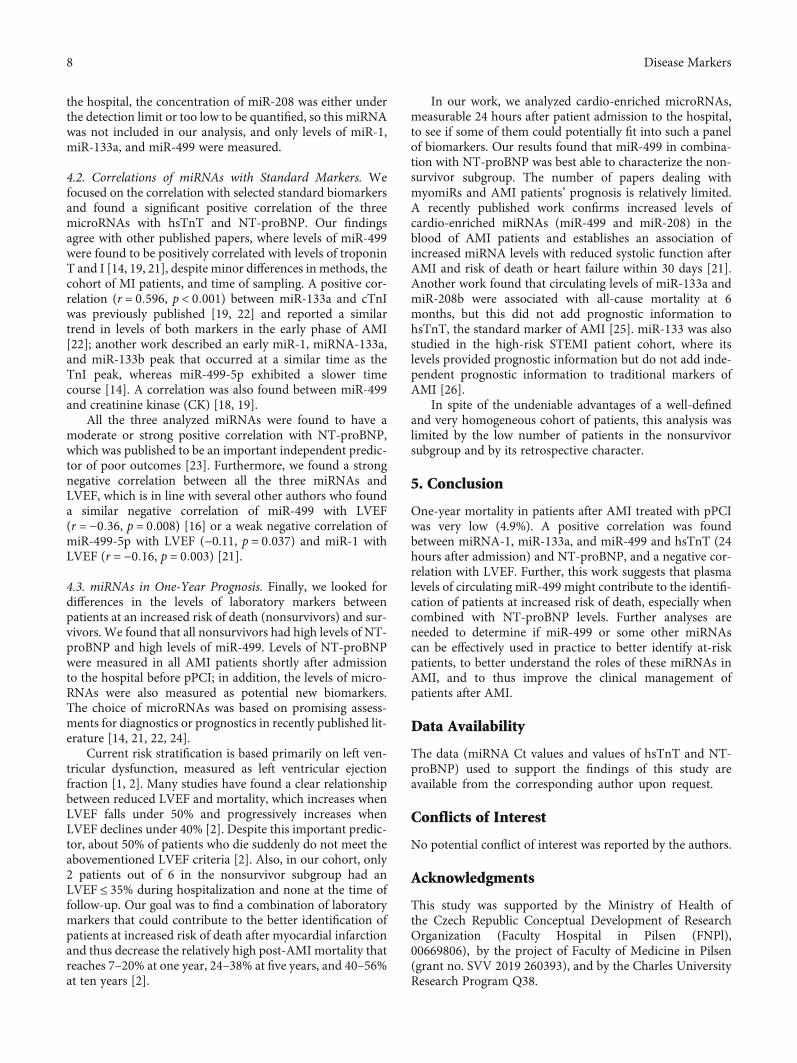
One-year mortality in patients after AMI treated with pPCIwas very low (4.9%). A positive correlation was foundbetween miRNA-1, miR-133a, and miR-499 and hsTnT (24hours after admission) and NT-proBNP, and a negative cor-relation with LVEF. Further, this work suggests that plasmalevels of circulating miR-499 might contribute to the identifi-cation of patients at increased risk of death, especially whencombined with NT-proBNP levels. Further analyses areneeded to determine if miR-499 or some other miRNAscan be effectively used in practice to better identify at-riskpatients, to better understand the roles of these miRNAs inAMI, and to thus improve the clinical management ofpatients after AMI.
Data Availability
The data (miRNA Ct values and values of hsTnT and NT-proBNP) used to support the findings of this study areavailable from the corresponding author upon request.
Conflicts of Interest
No potential conflict of interest was reported by the authors.
Acknowledgments
This study was supported by the Ministry of Health ofthe Czech Republic Conceptual Development of ResearchOrganization (Faculty Hospital in Pilsen (FNPl),00669806), by the project of Faculty of Medicine in Pilsen(grant no. SVV 2019 260393), and by the Charles UniversityResearch Program Q38.
8 Disease Markers
References
[1] B. Ibanez, S. James, S. Agewall et al., “2017 ESC Guidelines forthe management of acute myocardial infarction in patientspresenting with ST-segment elevation,” European Heart Jour-nal, vol. 39, no. 2, pp. 119–177, 2017.
[2] J. W. Waks and A. E. Buxton, “Risk stratification for suddencardiac death after myocardial infarction,” Annual Review ofMedicine, vol. 69, no. 1, pp. 147–164, 2018.
[3] G. Ndrepepa, S. Kufner, M. Hoyos et al., “High sensitivity car-diac troponin T and prognosis in patients with ST-segmentelevation myocardial infarction,” Journal of Cardiology,vol. 72, no. 3, pp. 220–226, 2018.
[4] S. Gupta, G. S. Pressman, and V. M. Figueredo, “Incidence of,predictors for, and mortality associated with malignant ven-tricular arrhythmias in non-ST elevation myocardial infarc-tion patients,” Coronary Artery Disease, vol. 21, no. 8,pp. 460–465, 2010.
[5] J. M. Tapanainen, K. S. Lindgren, T. H. Mäkikallio,O. Vuolteenaho, J. Leppäluoto, and H. V. Huikuri, “Natriureticpeptides as predictors of non-sudden and sudden cardiacdeath after acute myocardial infarction in the beta-blockingera,” Journal of the American College of Cardiology, vol. 43,no. 5, pp. 757–763, 2004.
[6] M. Grabowski, K. J. Filipiak, L. A. Malek et al., “Admission B-type natriuretic peptide assessment improves early risk strati-fication by Killip classes and TIMI risk score in patients withacute ST elevation myocardial infarction treated with primaryangioplasty,” International Journal of Cardiology, vol. 115,no. 3, pp. 386–390, 2007.
[7] H. V. Huikuri, J. M. Tapanainen, K. Lindgren et al., “Predic-tion of sudden cardiac death after myocardial infarction inthe beta-blocking era,” Journal of the American College of Car-diology, vol. 42, no. 4, pp. 652–658, 2003.
[8] L. Savic, I. Mrdovic, J. Perunicic et al., “Impact of the combinedleft ventricular systolic and renal dysfunction on one-year out-comes after primary percutaneous coronary intervention,”Journal of Interventional Cardiology, vol. 25, no. 2, pp. 132–139, 2012.
[9] T. Sun, Y. H. Dong, W. Du et al., “The role of microRNAs inmyocardial infarction: from molecular mechanism to clinicalapplication,” International Journal of Molecular Sciences,vol. 18, no. 4, p. 745, 2017.
[10] S. M. J. Welten, E. A. C. Goossens, P. H. A. Quax, and A. Y.Nossent, “The multifactorial nature of microRNAs in vascularremodelling,” Cardiovascular Research, vol. 110, no. 1, pp. 6–22, 2016.
[11] C. Schulte, M. Karakas, and T. Zeller, “MicroRNAs in car-diovascular disease - clinical application,” Clinical Chemis-try and Laboratory Medicine, vol. 55, no. 5, pp. 687–704,2017.
[12] E. Cavarretta and G. Frati, “MicroRNAs in coronary heart dis-ease: ready to enter the clinical arena?,” BioMed ResearchInternational, vol. 2016, Article ID 2150763, 10 pages, 2016.
[13] J. J. McCarthy, “The myomiR network in skeletal muscle plas-ticity,” Exercise and Sport Sciences Reviews, vol. 39, no. 3,pp. 150–154, 2011.
[14] Y. D’Alessandra, P. Devanna, F. Limana et al., “CirculatingmicroRNAs are new and sensitive biomarkers of myocardialinfarction,” European Heart Journal, vol. 31, no. 22,pp. 2765–2773, 2010.
[15] M. F. Corsten, R. Dennert, S. Jochems et al., “CirculatingmicroRNA-208b and microRNA-499 reflect myocardial dam-age in cardiovascular disease,” Circulation. CardiovascularGenetics, vol. 3, no. 6, pp. 499–506, 2010.
[16] Z. Motovska, O. Hlinomaz, P. Kala et al., “1-year outcomes ofpatients undergoing primary angioplasty for myocardialinfarction treated with prasugrel versus ticagrelor,” Journal ofthe American College of Cardiology, vol. 71, no. 4, pp. 371–381, 2018.
[17] Z. Motovska, O. Hlinomaz, R. Miklik et al., “Prasugrel versusticagrelor in patients with acute myocardial infarction treatedwith primary percutaneous coronary intervention: multicenterrandomized PRAGUE-18 study,” Circulation, vol. 134, no. 21,pp. 1603–1612, 2016.
[18] Y. Devaux, M. Vausort, E. Goretti et al., “Use of circulatingmicroRNAs to diagnose acute myocardial infarction,” ClinicalChemistry, vol. 58, no. 3, pp. 559–567, 2012.
[19] X. Chen, L. Zhang, T. Su et al., “Kinetics of plasma microRNA-499 expression in acute myocardial infarction,” Journal of Tho-racic Disease, vol. 7, no. 5, pp. 890–896, 2015.
[20] S. Białek, D. Górko, A. Zajkowska et al., “Release kinetics ofcirculating miRNA-208a in the early phase of myocardialinfarction,” Kardiologia Polska, vol. 73, no. 8, pp. 613–619,2015.
[21] O. Gidlöf, J. G. Smith, K. Miyazu et al., “Circulating cardio-enriched microRNAs are associated with long-term prognosisfollowing myocardial infarction,” BMC Cardiovascular Disor-ders, vol. 13, no. 1, p. 12, 2013.
[22] F. Wang, G. Long, Z. C et al., “Plasma microRNA-133a is anew marker for both acute myocardial infarction and underly-ing coronary artery stenosis,” Journal of Translational Medi-cine, vol. 11, no. 1, p. 222, 2013.
[23] J. A. Ezekowitz, P. Théroux, W. Chang et al., “N-terminal pro-brain natriuretic peptide and the timing, extent and mortalityin ST elevation myocardial infarction,” The Canadian Journalof Cardiology, vol. 22, no. 5, pp. 393–397, 2006.
[24] L. Zhang, X. Chen, T. Su et al., “Circulating miR-499 are noveland sensitive biomarker of acute myocardial infarction,” Jour-nal of Thoracic Disease, vol. 7, no. 3, pp. 303–308, 2015.
[25] C. Widera, S. K. Gupta, J. M. Lorenzen et al., “Diagnostic andprognostic impact of six circulating microRNAs in acute coro-nary syndrome,” Journal of Molecular and Cellular Cardiology,vol. 51, no. 5, pp. 872–875, 2011.
[26] I. Eitel, V. Adams, P. Dieterich et al., “Relation of circulatingmicroRNA-133a concentrations with myocardial damageand clinical prognosis in ST-elevation myocardial infarction,”American Heart Journal, vol. 164, no. 5, pp. 706–714, 2012.
9Disease Markers

Stem Cells International
Hindawiwww.hindawi.com Volume 2018
Hindawiwww.hindawi.com Volume 2018
MEDIATORSINFLAMMATION
of
EndocrinologyInternational Journal of
Hindawiwww.hindawi.com Volume 2018
Hindawiwww.hindawi.com Volume 2018
Disease Markers
Hindawiwww.hindawi.com Volume 2018
BioMed Research International
OncologyJournal of
Hindawiwww.hindawi.com Volume 2013
Hindawiwww.hindawi.com Volume 2018
Oxidative Medicine and Cellular Longevity
Hindawiwww.hindawi.com Volume 2018
PPAR Research
Hindawi Publishing Corporation http://www.hindawi.com Volume 2013Hindawiwww.hindawi.com
The Scientific World Journal
Volume 2018
Immunology ResearchHindawiwww.hindawi.com Volume 2018
Journal of
ObesityJournal of
Hindawiwww.hindawi.com Volume 2018
Hindawiwww.hindawi.com Volume 2018
Computational and Mathematical Methods in Medicine
Hindawiwww.hindawi.com Volume 2018
Behavioural Neurology
OphthalmologyJournal of
Hindawiwww.hindawi.com Volume 2018
Diabetes ResearchJournal of
Hindawiwww.hindawi.com Volume 2018
Hindawiwww.hindawi.com Volume 2018
Research and TreatmentAIDS
Hindawiwww.hindawi.com Volume 2018
Gastroenterology Research and Practice
Hindawiwww.hindawi.com Volume 2018
Parkinson’s Disease
Evidence-Based Complementary andAlternative Medicine
Volume 2018Hindawiwww.hindawi.com
Submit your manuscripts atwww.hindawi.com