Embed Size (px)
Citation preview
PROGRAM AND
RESOURCE PLAN
Fiscal Years
2016/17 through 2021/22
April 2017
Florida Department of TransportationOffice of Work Program and Budget
Finance, Program and Resource Allocation

i
TABLE OF CONTENTS
PROGRAM & RESOURCE PLAN ITEM
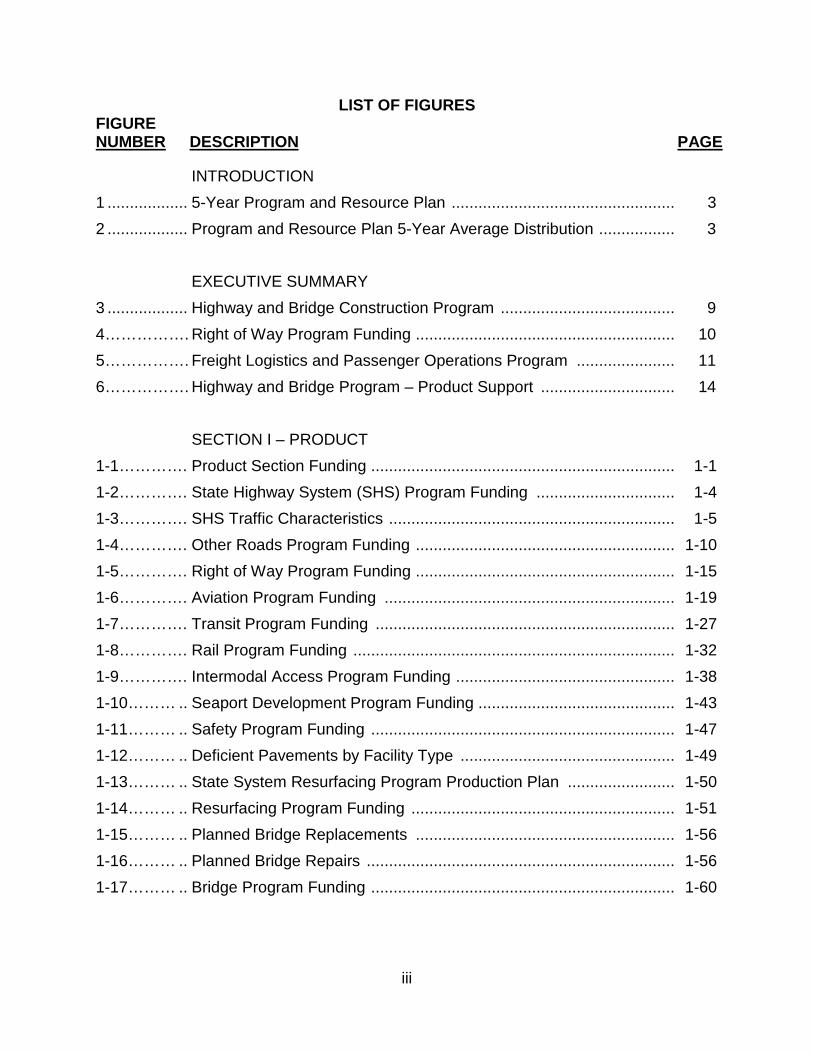
LIST OF FIGURES ................................................................................................... iii
INTRODUCTION ...................................................................................................... 1
EXECUTIVE SUMMARY .......................................................................................... 8
SECTION I – PRODUCT .......................................................................................... 1-1
State Highway System (SHS) ............................................................................. 1-2
Other Roads ....................................................................................................... 1-8
Right of Way Land .............................................................................................. 1-13
Aviation ............................................................................................................... 1-17
Transit ................................................................................................................. 1-24
Rail ...................................................................................................................... 1-30
Intermodal Access .............................................................................................. 1-36
Seaport Development ......................................................................................... 1-41
Safety .................................................................................................................. 1-46
Resurfacing ......................................................................................................... 1-49
Bridge ................................................................................................................. 1-54
SECTION II – PRODUCT SUPPORT ...................................................................... 2-1
Preliminary Engineering ...................................................................................... 2-2
Construction Engineering and Inspection ........................................................... 2-7
Right of Way Support .......................................................................................... 2-12
Environmental Mitigation ..................................................................................... 2-17
Materials and Research ...................................................................................... 2-22
Materials ............................................................................................................. 2-22
Applied Research ................................................................................................ 2-27
Planning and Environment .................................................................................. 2-31
Freight Logistics and Passenger Operations ...................................................... 2-39
ii
PROGRAM & RESOURCE PLAN ITEM
SECTION III – OPERATIONS AND MAINTENANCE ......................................... 3-1
Operations & Maintenance ............................................................................ 3-2
Traffic Engineering and Operations ............................................................... 3-11
Toll Operations .............................................................................................. 3-16
SECTION IV – ADMINISTRATION ..................................................................... 4-1
Administration ................................................................................................ 4-2
Fixed Capital Outlay ...................................................................................... 4-6
Office of Information Systems ........................................................................ 4-9
SECTION V – OTHER ........................................................................................ 5-1
Local Government Reimbursement ............................................................... 5-2
Miscellaneous ................................................................................................ 5-5
Offset For Administered Funds ...................................................................... 5-6
ATTACHMENT “A” .............................................................................................. 6-1
Program and Resource Plan Detail ............................................................... 6-2
iii
LIST OF FIGURES FIGURE NUMBER DESCRIPTION PAGE
INTRODUCTION
1 .................. 5-Year Program and Resource Plan .................................................. 3
2 .................. Program and Resource Plan 5-Year Average Distribution ................. 3
EXECUTIVE SUMMARY
3 .................. Highway and Bridge Construction Program ....................................... 9
4……………. Right of Way Program Funding .......................................................... 10
5……………. Freight Logistics and Passenger Operations Program ...................... 11
6……………. Highway and Bridge Program – Product Support .............................. 14
SECTION I – PRODUCT
1-1…………. Product Section Funding .................................................................... 1-1
1-2…………. State Highway System (SHS) Program Funding ............................... 1-4
1-3…………. SHS Traffic Characteristics ................................................................ 1-5
1-4…………. Other Roads Program Funding .......................................................... 1-10
1-5…………. Right of Way Program Funding .......................................................... 1-15
1-6…………. Aviation Program Funding ................................................................. 1-19
1-7…………. Transit Program Funding ................................................................... 1-27
1-8…………. Rail Program Funding ........................................................................ 1-32
1-9…………. Intermodal Access Program Funding ................................................. 1-38
1-10……… .. Seaport Development Program Funding ............................................ 1-43
1-11……… .. Safety Program Funding .................................................................... 1-47
1-12……… .. Deficient Pavements by Facility Type ................................................ 1-49
1-13……… .. State System Resurfacing Program Production Plan ........................ 1-50
1-14……… .. Resurfacing Program Funding ........................................................... 1-51
1-15……… .. Planned Bridge Replacements .......................................................... 1-56
1-16……… .. Planned Bridge Repairs ..................................................................... 1-56
1-17……… .. Bridge Program Funding .................................................................... 1-60
iv
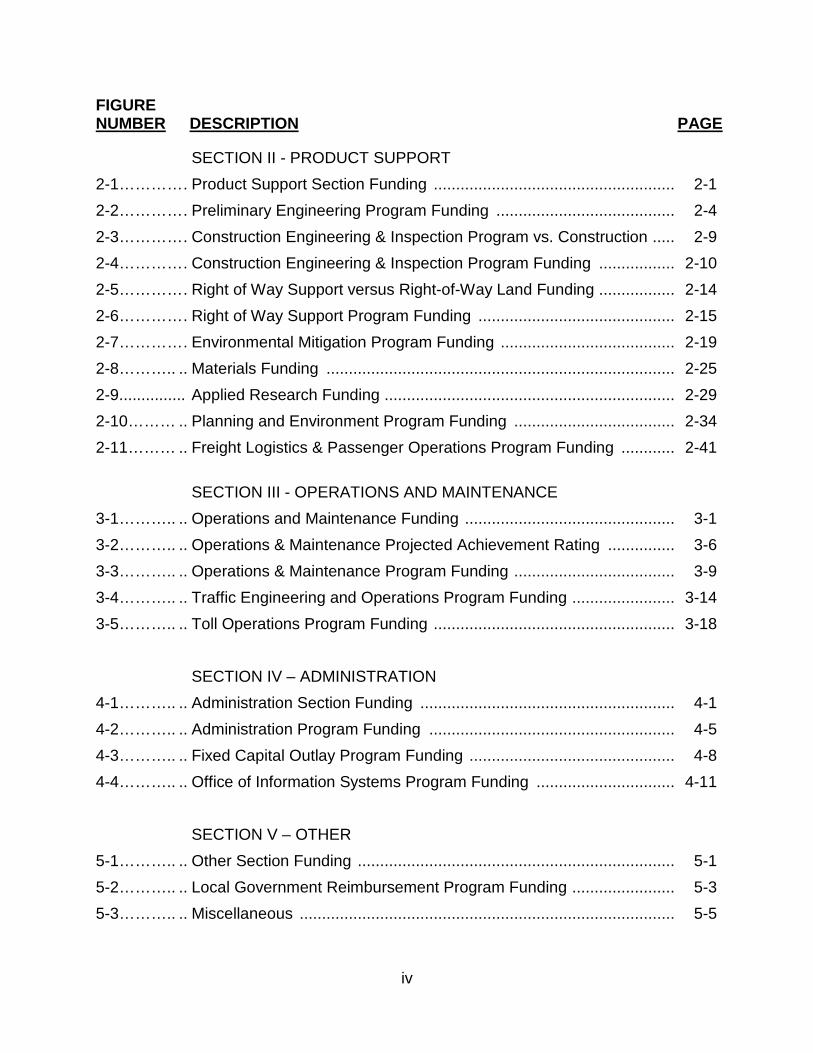
FIGURE NUMBER DESCRIPTION PAGE
SECTION II - PRODUCT SUPPORT
2-1………… . Product Support Section Funding ...................................................... 2-1
2-2………… . Preliminary Engineering Program Funding ........................................ 2-4
2-3………… . Construction Engineering & Inspection Program vs. Construction ..... 2-9
2-4………… . Construction Engineering & Inspection Program Funding ................. 2-10
2-5………… . Right of Way Support versus Right-of-Way Land Funding ................. 2-14
2-6………… . Right of Way Support Program Funding ............................................ 2-15
2-7………… . Environmental Mitigation Program Funding ....................................... 2-19
2-8……….. .. Materials Funding .............................................................................. 2-25
2-9............... Applied Research Funding ................................................................. 2-29
2-10……… .. Planning and Environment Program Funding .................................... 2-34
2-11……… .. Freight Logistics & Passenger Operations Program Funding ............ 2-41
SECTION III - OPERATIONS AND MAINTENANCE
3-1……….. .. Operations and Maintenance Funding ............................................... 3-1
3-2……….. .. Operations & Maintenance Projected Achievement Rating ............... 3-6
3-3……….. .. Operations & Maintenance Program Funding .................................... 3-9
3-4……….. .. Traffic Engineering and Operations Program Funding ....................... 3-14
3-5……….. .. Toll Operations Program Funding ...................................................... 3-18
SECTION IV – ADMINISTRATION
4-1……….. .. Administration Section Funding ......................................................... 4-1
4-2……….. .. Administration Program Funding ....................................................... 4-5
4-3……….. .. Fixed Capital Outlay Program Funding .............................................. 4-8
4-4……….. .. Office of Information Systems Program Funding ............................... 4-11
SECTION V – OTHER
5-1……….. .. Other Section Funding ....................................................................... 5-1
5-2……….. .. Local Government Reimbursement Program Funding ....................... 5-3
5-3……….. .. Miscellaneous .................................................................................... 5-5
1
INTRODUCTION
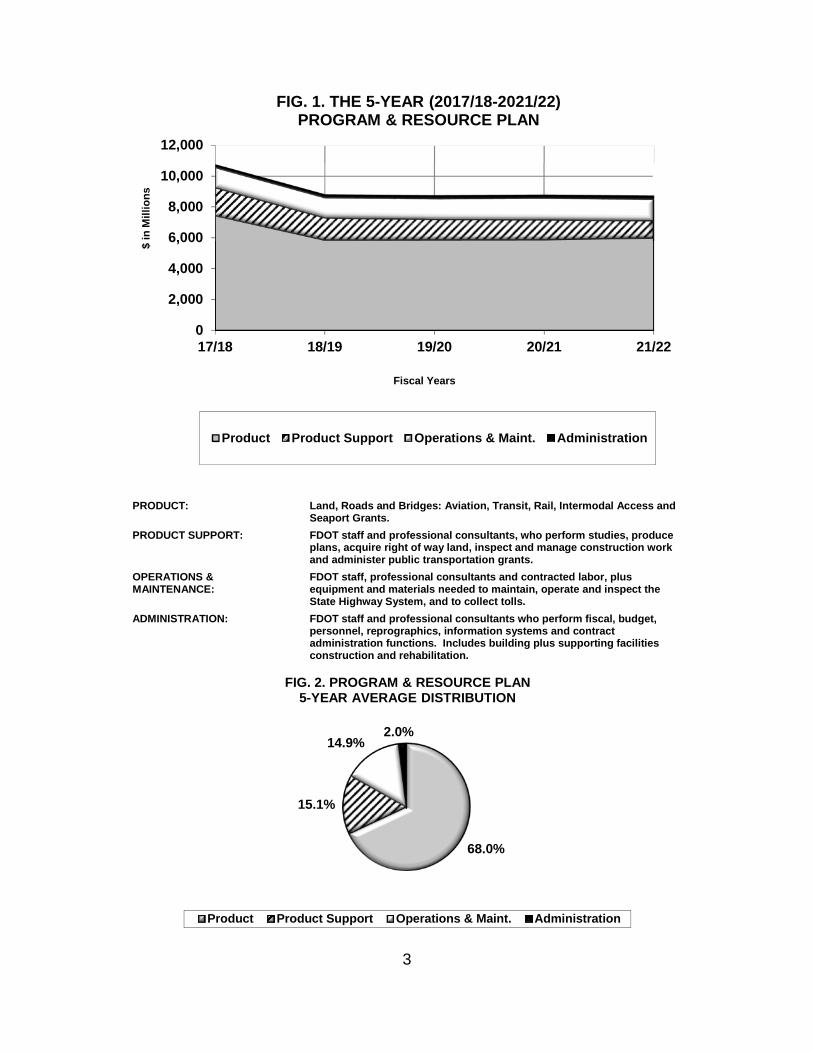
This is the Florida Department of Transportation’s Program and Resource Plan for Fiscal Years 2017/18 through 2021/22. The Program and Resource Plan (Plan) provides planned commitment levels by year for each of the department’s programs. The program levels form the basis for the Department’s Finance Plan, Tentative Five-Year Work Program, and Legislative Budget Request. This Plan contains the in-house levels appropriated to the department for FY2016/17. Product levels match the Tentative Work Program as of April 3, 2017.
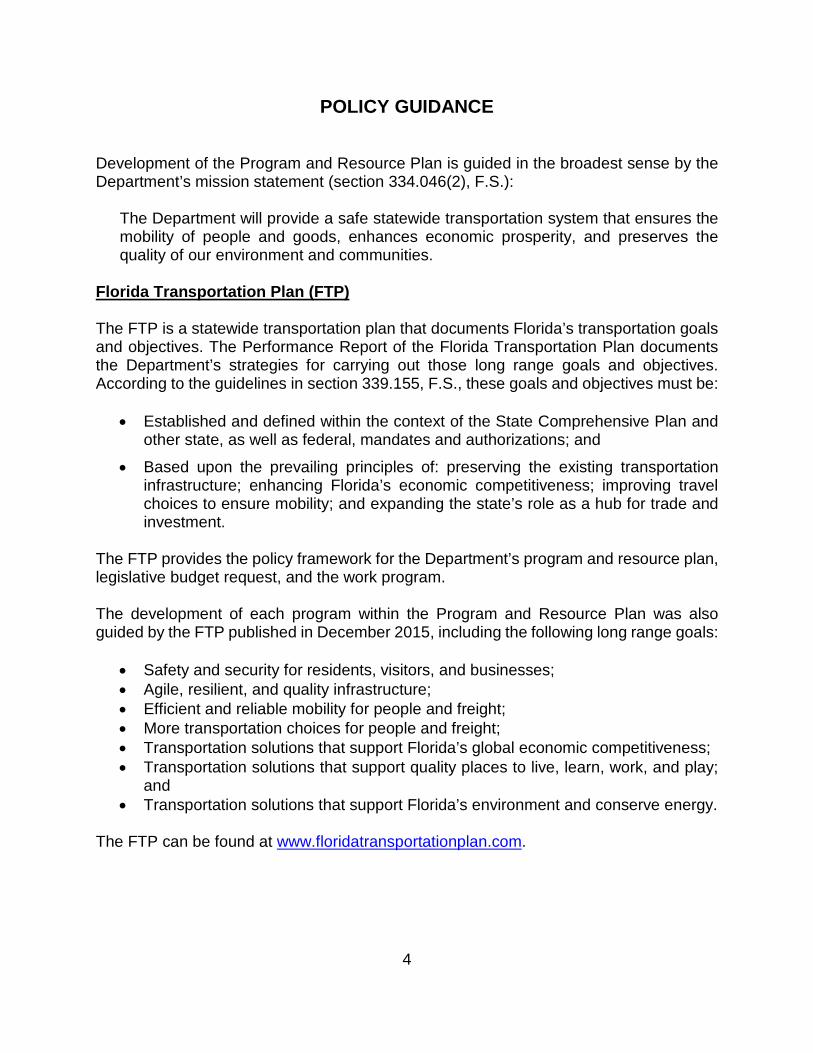
The plan reflects a total program of $45.6 Billion over a five-year period. This includes $31.0 Billion in product categories for construction, right of way, and public transportation projects (68.0%); $6.9 Billion for product support (15.1%); $6.8 Billion for operations and maintenance of transportation facilities (14.9%); and $0.9 Billion for administration (2.0%).
The department’s Legislative Budget Request for FY2017/18 includes 6,299 positions supporting the program. This represents a net decrease of 80 positions, compared to 6,379 appropriated in fiscal year 2016/17.
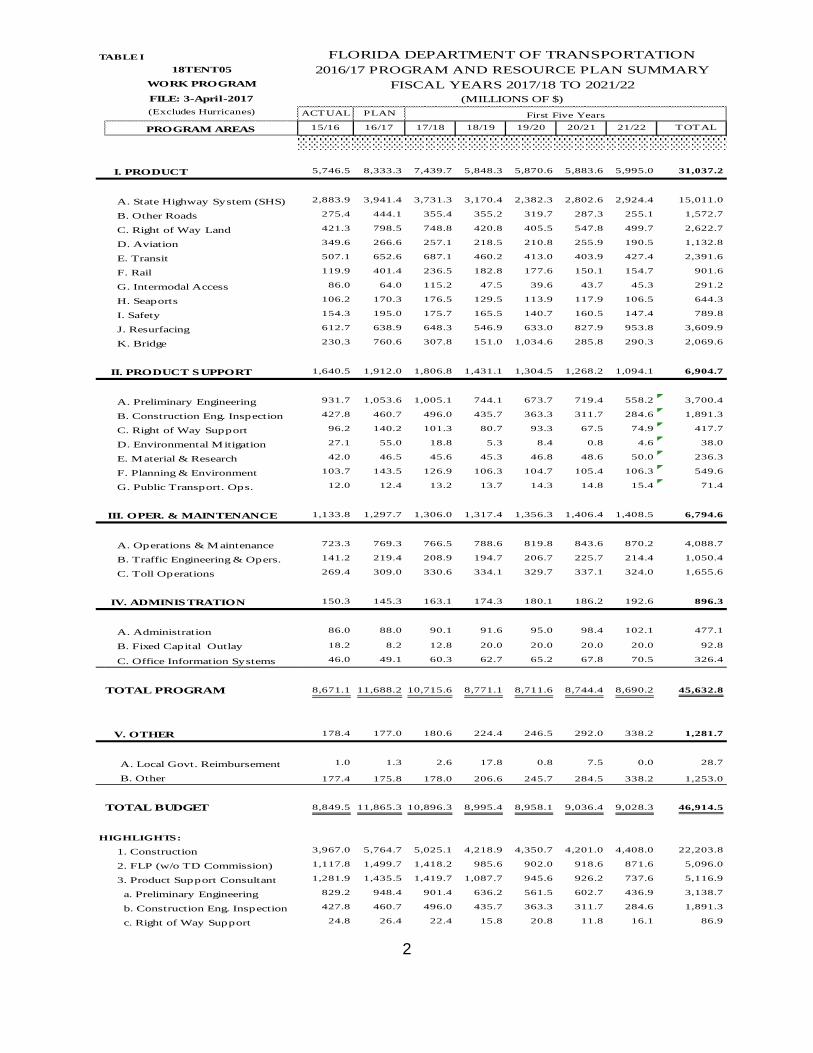
Figures 1 and 2 depict the overall Plan and the funding level of each general program category. Data for the graphs are contained in tabular form in TABLE I, the Five Year Program and Resource Plan Summary. TABLE I also shows the proposed commitments for construction contracts as well as other areas of transportation.
The “Total Budget” exceeds the “Total Program” on the Five Year Program and Resource Plan Summary. The “Total Budget” includes any non-operating transfers included in the Legislative Budget Request; the Local Government Reimbursement program; the offset for Administered Funds; Right of Way Bond debt service; GARVEE bond debt service; Transportation Finance Corporation repayments; Toll Facility Revolving Trust Fund repayments; and State Infrastructure Bank (SIB) loan repayments. The “Total Program” contains only the user charges and represents the actual commitments for FY 2015/16 with the planned commitments for FY 2016/17 through 2021/22.
2
TABLE I
18TENT05
WORK PROGRAM
FILE: 3-April-2017
(Excludes Hurricanes) ACTUAL PLAN
PROGRAM AREAS 15/16 16/17 17/18 18/19 19/20 20/21 21/22 TOT AL
I. PRODUCT 5,746.5 8,333.3 7,439.7 5,848.3 5,870.6 5,883.6 5,995.0 31,037.2
A. State Highway System (SHS) 2,883.9 3,941.4 3,731.3 3,170.4 2,382.3 2,802.6 2,924.4 15,011.0
B. Other Roads 275.4 444.1 355.4 355.2 319.7 287.3 255.1 1,572.7
C. Right of Way Land 421.3 798.5 748.8 420.8 405.5 547.8 499.7 2,622.7
D. Aviation 349.6 266.6 257.1 218.5 210.8 255.9 190.5 1,132.8
E. Transit 507.1 652.6 687.1 460.2 413.0 403.9 427.4 2,391.6
F. Rail 119.9 401.4 236.5 182.8 177.6 150.1 154.7 901.6
G. Intermodal Access 86.0 64.0 115.2 47.5 39.6 43.7 45.3 291.2
H. Seaports 106.2 170.3 176.5 129.5 113.9 117.9 106.5 644.3
I. Safety 154.3 195.0 175.7 165.5 140.7 160.5 147.4 789.8
J. Resurfacing 612.7 638.9 648.3 546.9 633.0 827.9 953.8 3,609.9
K. Bridge 230.3 760.6 307.8 151.0 1,034.6 285.8 290.3 2,069.6
II. PRODUCT SUPPORT 1,640.5 1,912.0 1,806.8 1,431.1 1,304.5 1,268.2 1,094.1 6,904.7
A. Preliminary Engineering 931.7 1,053.6 1,005.1 744.1 673.7 719.4 558.2 3,700.4
B. Construction Eng. Inspection 427.8 460.7 496.0 435.7 363.3 311.7 284.6 1,891.3
C. Right of Way Support 96.2 140.2 101.3 80.7 93.3 67.5 74.9 417.7
D. Environmental Mitigation 27.1 55.0 18.8 5.3 8.4 0.8 4.6 38.0
E. Material & Research 42.0 46.5 45.6 45.3 46.8 48.6 50.0 236.3
F. Planning & Environment 103.7 143.5 126.9 106.3 104.7 105.4 106.3 549.6
G. Public Transport. Ops. 12.0 12.4 13.2 13.7 14.3 14.8 15.4 71.4
III. OPER. & MAINTENANCE 1,133.8 1,297.7 1,306.0 1,317.4 1,356.3 1,406.4 1,408.5 6,794.6
A. Operations & Maintenance 723.3 769.3 766.5 788.6 819.8 843.6 870.2 4,088.7
B. Traffic Engineering & Opers. 141.2 219.4 208.9 194.7 206.7 225.7 214.4 1,050.4
C. Toll Operations 269.4 309.0 330.6 334.1 329.7 337.1 324.0 1,655.6
IV. ADMINISTRATION 150.3 145.3 163.1 174.3 180.1 186.2 192.6 896.3
A. Administration 86.0 88.0 90.1 91.6 95.0 98.4 102.1 477.1
B. Fixed Capital Outlay 18.2 8.2 12.8 20.0 20.0 20.0 20.0 92.8
C. Office Information Systems 46.0 49.1 60.3 62.7 65.2 67.8 70.5 326.4
TOTAL PROGRAM 8,671.1 11,688.2 10,715.6 8,771.1 8,711.6 8,744.4 8,690.2 45,632.8
V. OTHER 178.4 177.0 180.6 224.4 246.5 292.0 338.2 1,281.7
A. Local Govt. Reimbursement 1.0 1.3 2.6 17.8 0.8 7.5 0.0 28.7
B. Other 177.4 175.8 178.0 206.6 245.7 284.5 338.2 1,253.0
TOTAL BUDGET 8,849.5 11,865.3 10,896.3 8,995.4 8,958.1 9,036.4 9,028.3 46,914.5
HIGHLIGHTS:
1. Construction 3,967.0 5,764.7 5,025.1 4,218.9 4,350.7 4,201.0 4,408.0 22,203.8
2. FLP (w/o TD Commission) 1,117.8 1,499.7 1,418.2 985.6 902.0 918.6 871.6 5,096.0
3. Product Support Consultant 1,281.9 1,435.5 1,419.7 1,087.7 945.6 926.2 737.6 5,116.9
a. Preliminary Engineering 829.2 948.4 901.4 636.2 561.5 602.7 436.9 3,138.7
b. Construction Eng. Inspection 427.8 460.7 496.0 435.7 363.3 311.7 284.6 1,891.3
c. Right of Way Support 24.8 26.4 22.4 15.8 20.8 11.8 16.1 86.9
First Five Years
(MILLIONS OF $)
FISCAL YEARS 2017/18 TO 2021/22
2016/17 PROGRAM AND RESOURCE PLAN SUMMARY
FLORIDA DEPARTMENT OF TRANSPORTATION
3
PRODUCT: Land, Roads and Bridges: Aviation, Transit, Rail, Intermodal Access and Seaport Grants.
PRODUCT SUPPORT: FDOT staff and professional consultants, who perform studies, produce plans, acquire right of way land, inspect and manage construction work and administer public transportation grants.
OPERATIONS & MAINTENANCE:
FDOT staff, professional consultants and contracted labor, plus equipment and materials needed to maintain, operate and inspect the State Highway System, and to collect tolls.
ADMINISTRATION: FDOT staff and professional consultants who perform fiscal, budget, personnel, reprographics, information systems and contract administration functions. Includes building plus supporting facilities construction and rehabilitation.
0
2,000
4,000
6,000
8,000
10,000
12,000
17/18 18/19 19/20 20/21 21/22
$ i
n M
illi
on
s
Fiscal Years
FIG. 1. THE 5-YEAR (2017/18-2021/22)PROGRAM & RESOURCE PLAN
Product Product Support Operations & Maint. Administration
68.0%
15.1%
14.9%2.0%
FIG. 2. PROGRAM & RESOURCE PLAN5-YEAR AVERAGE DISTRIBUTION
Product Product Support Operations & Maint. Administration
4
POLICY GUIDANCE
Development of the Program and Resource Plan is guided in the broadest sense by the Department’s mission statement (section 334.046(2), F.S.):
The Department will provide a safe statewide transportation system that ensures the mobility of people and goods, enhances economic prosperity, and preserves the quality of our environment and communities.
Florida Transportation Plan (FTP)
The FTP is a statewide transportation plan that documents Florida’s transportation goals and objectives. The Performance Report of the Florida Transportation Plan documents the Department’s strategies for carrying out those long range goals and objectives. According to the guidelines in section 339.155, F.S., these goals and objectives must be:
• Established and defined within the context of the State Comprehensive Plan and other state, as well as federal, mandates and authorizations; and
• Based upon the prevailing principles of: preserving the existing transportation infrastructure; enhancing Florida’s economic competitiveness; improving travel choices to ensure mobility; and expanding the state’s role as a hub for trade and investment.
The FTP provides the policy framework for the Department’s program and resource plan, legislative budget request, and the work program.
The development of each program within the Program and Resource Plan was also guided by the FTP published in December 2015, including the following long range goals:
• Safety and security for residents, visitors, and businesses; • Agile, resilient, and quality infrastructure; • Efficient and reliable mobility for people and freight; • More transportation choices for people and freight; • Transportation solutions that support Florida’s global economic competitiveness; • Transportation solutions that support quality places to live, learn, work, and play;
and • Transportation solutions that support Florida’s environment and conserve energy.
The FTP can be found at www.floridatransportationplan.com.
5
Strategic Intermodal System
The Florida Legislature established Florida’s Strategic Intermodal System (SIS) in 2003 (section 339.61, F.S.). The establishment of the SIS was a fundamental shift in the way Florida views the development of (and makes investments in) its transportation system. The SIS is composed of transportation facilities and services of statewide and interregional significance. To be designated as part of the SIS, transportation facilities must meet criteria related to transportation or economic activity, as well as screening factors related to potential community and environmental impacts. It represents an effort to link Florida’s transportation policies and investments to the state’s economic development strategy. Development of the SIS focuses on complete end-to-end trips, rather than individual modes or facilities.
The goals of the SIS are:
• Ensure the efficiency and reliability of multimodal transportation connectivity between Florida’s economic regions and between Florida and other states and nations.
• Expand transportation choices and integrate modes for interregional trips. • Provide transportation systems to support Florida as a global hub for trade,
tourism, talent, innovation, business, and investment.
The Department, in cooperation with the Florida Transportation Commission and other partners, is required by section 339.64, F.S., to develop and update a Strategic Intermodal System Plan at least once every five years. The SIS Policy Plan was updated and published in February 2016.
Section 339.08(1), F.S., makes facilities and services designated on the SIS eligible for funding from the State Transportation Trust Fund, regardless of what entity owns the facility.
The SIS Policy Plan, funding plans, maps, and lists of designated SIS facilities can be found at http://www.fdot.gov/planning/sis/.
Allocation of Flexible Funds
The Department has the principle responsibility for the statewide and interregional movement of people and goods and shares responsibility with other public and private interests in addressing system safety, the preservation and operation of transportation facilities, and local and metropolitan area mobility needs. Accordingly, the Strategic Intermodal System (SIS), described above, is the Department’s highest transportation capacity investment priority. The Department is also increasing its emphasis on regional travel and improving regionally significant facilities.
6
Consistent with legislative action and based on input from the Florida Transportation Commission, and other partners, FDOT has adopted an allocation policy to implement its responsibilities. This policy specifies that FDOT will:
• Continue the state’s commitment to the safety and preservation of Florida’s transportation system
• Allocate 75 percent of new discretionary capacity funds to the SIS and Emerging SIS;
• Increase the state’s emphasis on regional travel and transport; and
• Address the state’s support for non-highway modes.
Other Guidance
The FTP goals and objectives, Florida’s Strategic Intermodal System Policy Plan and the allocation policy, combined with results of system and program performance evaluations for all program areas, are used in the decision-making process of developing the financial and production targets for each program in this Program and Resource Plan. Additional elements considered include:
• the needs, strategies, and recommended priorities contained in the SIS Policy Plan and Department modal plans consistent with the goals, objectives and strategies of the FTP;
• metropolitan planning organization plans;
• strategic regional policy plans;
• approved local government comprehensive plans;
• state and federal legislative mandates, including appropriations, proviso language and statutes; and
• the financial resources provided for the state transportation system (a review of the Department’s cash balance, Comptroller’s cash forecast, and Finance Plan).
*************** NOTE ***************
The body of this report contains paraphrased statutory mandates, FTP objectives, and selected operating policies and performance measures related to each of the program areas.
***************************************
Tables of funding levels contained in the Program and Resource Plan are rounded from data stored to six decimal places. Thus, table sums may not add up to the total printed due to rounding.
7
EXECUTIVE SUMMARY
HIGHWAY AND BRIDGE CONSTRUCTION PROGRAM
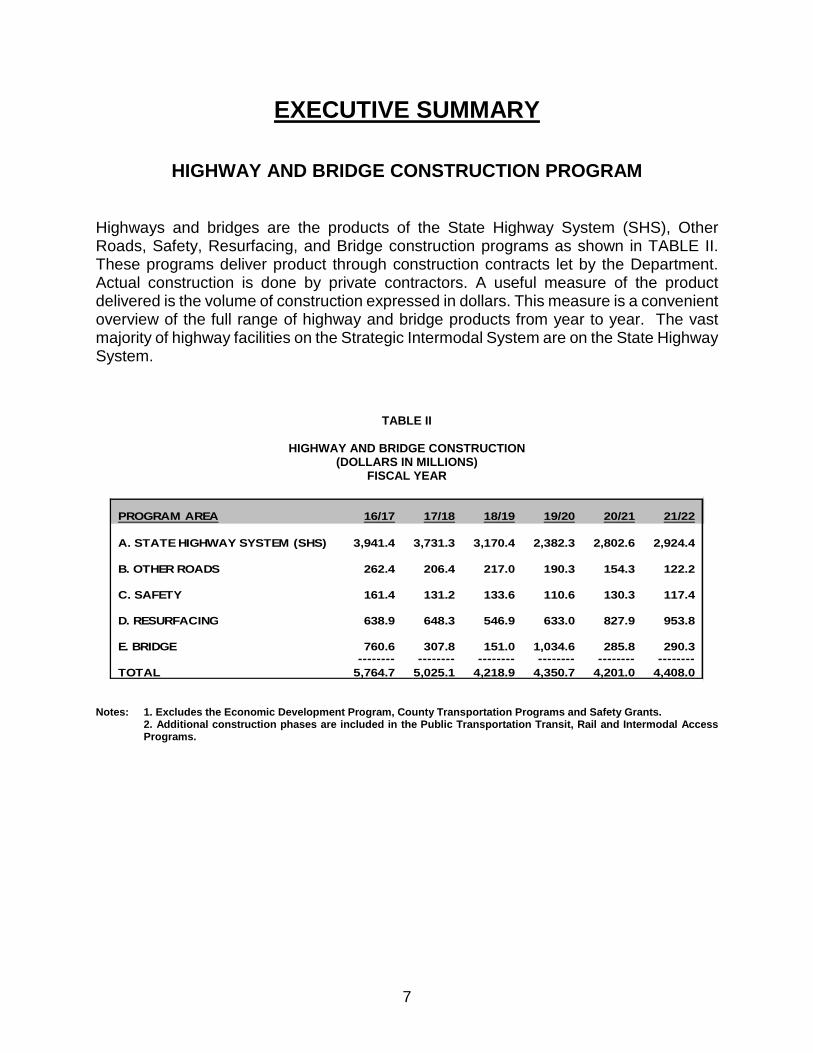
Highways and bridges are the products of the State Highway System (SHS), Other Roads, Safety, Resurfacing, and Bridge construction programs as shown in TABLE II. These programs deliver product through construction contracts let by the Department. Actual construction is done by private contractors. A useful measure of the product delivered is the volume of construction expressed in dollars. This measure is a convenient overview of the full range of highway and bridge products from year to year. The vast majority of highway facilities on the Strategic Intermodal System are on the State Highway System.
TABLE II
HIGHWAY AND BRIDGE CONSTRUCTION (DOLLARS IN MILLIONS)
FISCAL YEAR
Notes: 1. Excludes the Economic Development Program, County Transportation Programs and Safety Grants. 2. Additional construction phases are included in the Public Transportation Transit, Rail and Intermodal Access Programs.
PROGRAM AREA 16/17 17/18 18/19 19/20 20/21 21/22
A. STATE HIGHWAY SYSTEM (SHS) 3,941.4 3,731.3 3,170.4 2,382.3 2,802.6 2,924.4
B. OTHER ROADS 262.4 206.4 217.0 190.3 154.3 122.2
C. SAFETY 161.4 131.2 133.6 110.6 130.3 117.4
D. RESURFACING 638.9 648.3 546.9 633.0 827.9 953.8
E. BRIDGE 760.6 307.8 151.0 1,034.6 285.8 290.3 -------- -------- -------- -------- -------- --------
TOTAL 5,764.7 5,025.1 4,218.9 4,350.7 4,201.0 4,408.0
8
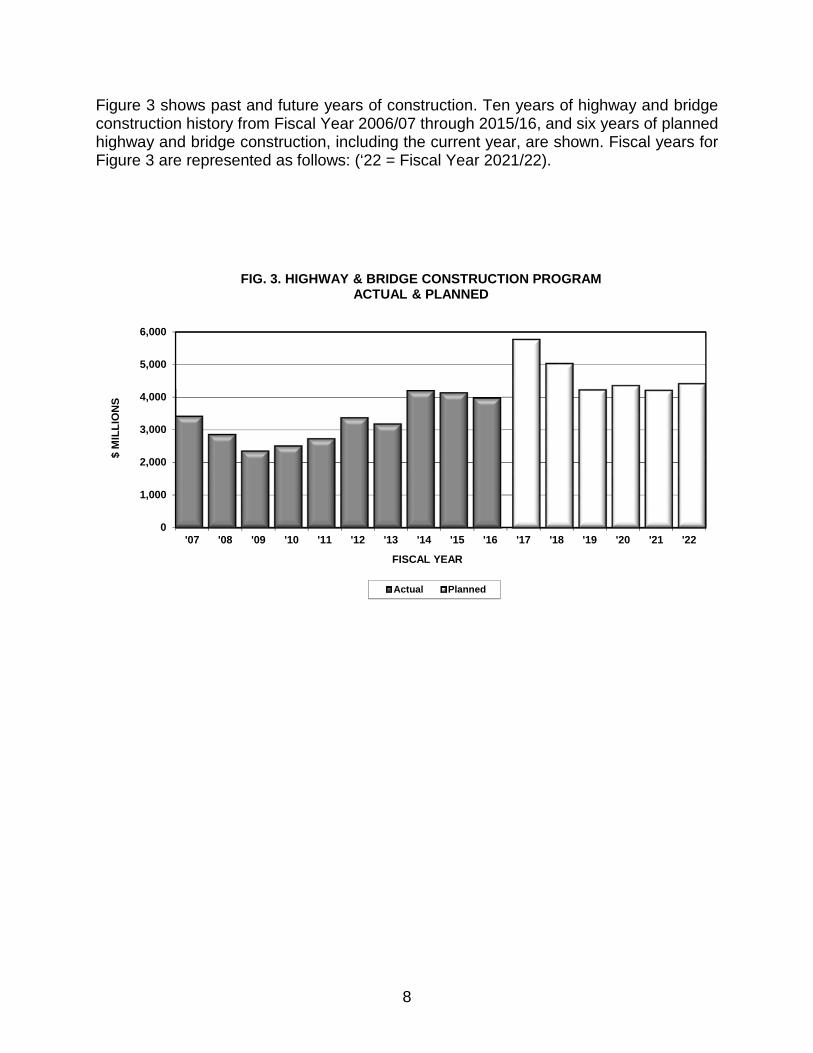
Figure 3 shows past and future years of construction. Ten years of highway and bridge construction history from Fiscal Year 2006/07 through 2015/16, and six years of planned highway and bridge construction, including the current year, are shown. Fiscal years for Figure 3 are represented as follows: (‘22 = Fiscal Year 2021/22).
0
1,000
2,000
3,000
4,000
5,000
6,000
'07 '08 '09 '10 '11 '12 '13 '14 '15 '16 '17 '18 '19 '20 '21 '22
$ M
ILL
ION
S
FISCAL YEAR
FIG. 3. HIGHWAY & BRIDGE CONSTRUCTION PROGRAM ACTUAL & PLANNED
Actual Planned
9
RIGHT OF WAY PROGRAM
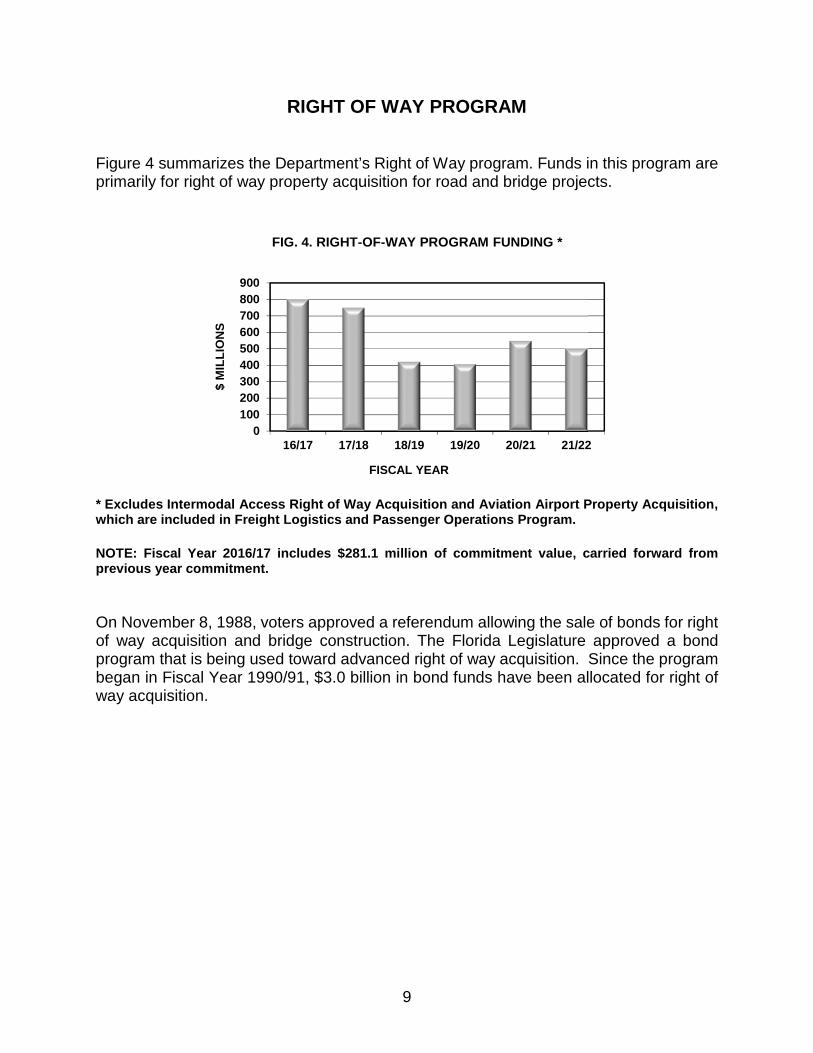
Figure 4 summarizes the Department’s Right of Way program. Funds in this program are primarily for right of way property acquisition for road and bridge projects.
* Excludes Intermodal Access Right of Way Acquisition and Aviation Airport Property Acquisition, which are included in Freight Logistics and Passenger Operations Program.
NOTE: Fiscal Year 2016/17 includes $281.1 million of commitment value, carried forward from previous year commitment.
On November 8, 1988, voters approved a referendum allowing the sale of bonds for right of way acquisition and bridge construction. The Florida Legislature approved a bond program that is being used toward advanced right of way acquisition. Since the program began in Fiscal Year 1990/91, $3.0 billion in bond funds have been allocated for right of way acquisition.
0
100
200
300
400
500
600
700
800
900
16/17 17/18 18/19 19/20 20/21 21/22
$ M
ILL
ION
S
FISCAL YEAR
FIG. 4. RIGHT-OF-WAY PROGRAM FUNDING *
10
FREIGHT LOGISTICS AND PASSENGER OPERATIONS PROGRAM
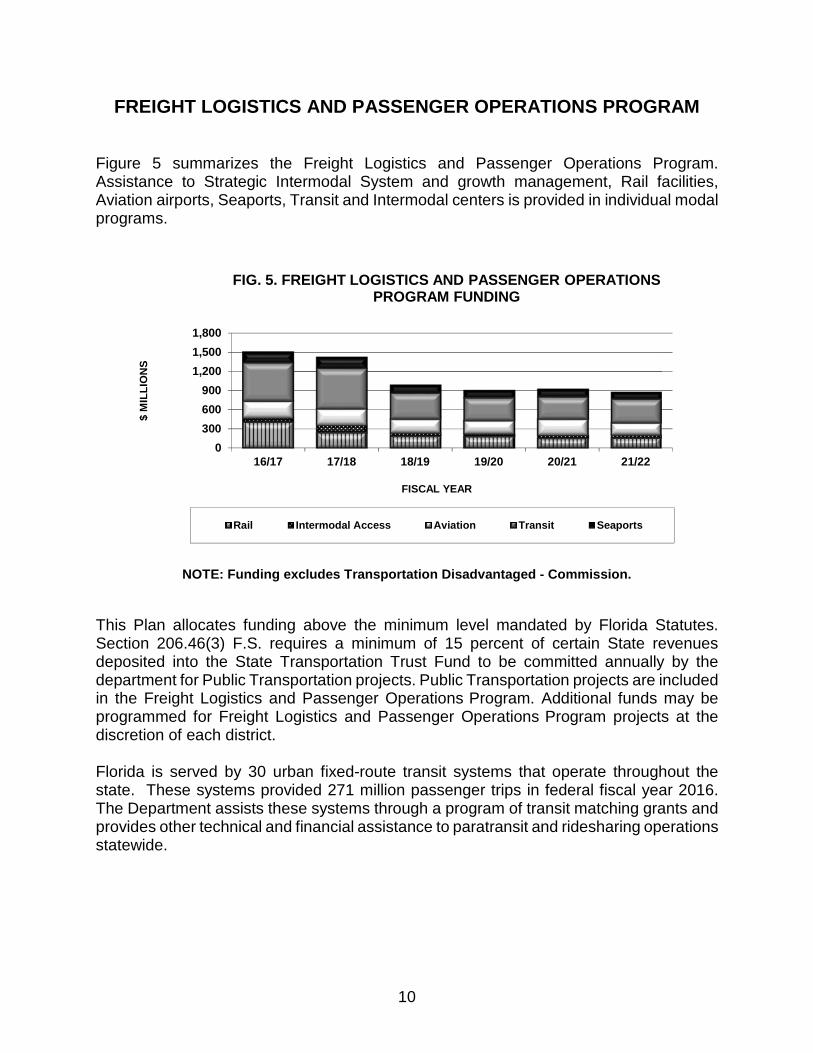
Figure 5 summarizes the Freight Logistics and Passenger Operations Program. Assistance to Strategic Intermodal System and growth management, Rail facilities, Aviation airports, Seaports, Transit and Intermodal centers is provided in individual modal programs.
NOTE: Funding excludes Transportation Disadvantaged - Commission.
This Plan allocates funding above the minimum level mandated by Florida Statutes.Section 206.46(3) F.S. requires a minimum of 15 percent of certain State revenues deposited into the State Transportation Trust Fund to be committed annually by the department for Public Transportation projects. Public Transportation projects are included in the Freight Logistics and Passenger Operations Program. Additional funds may be programmed for Freight Logistics and Passenger Operations Program projects at the discretion of each district.
Florida is served by 30 urban fixed-route transit systems that operate throughout the state. These systems provided 271 million passenger trips in federal fiscal year 2016. The Department assists these systems through a program of transit matching grants and provides other technical and financial assistance to paratransit and ridesharing operations statewide.
0
300
600
900
1,200
1,500
1,800
16/17 17/18 18/19 19/20 20/21 21/22
$ M
ILL
ION
S
FISCAL YEAR
FIG. 5. FREIGHT LOGISTICS AND PASSENGER OPERATIONS PROGRAM FUNDING
Rail Intermodal Access Aviation Transit Seaports
11
The Transit Program also includes local fixed-guideway system development, including bus rapid transit (BRT) and urban rail transit. Feasibility, environmental and planning studies for fixed guideway systems are underway in Hillsborough, Pinellas, Palm Beach, Broward and Miami-Dade Counties as well as Jacksonville and Orlando.
The Aviation Program provides assistance to Florida’s airports in the areas of development, improvement, land acquisition, airport access and economic enhancement. Matching funds assist local governments and airport authorities in planning, designing, purchasing, constructing and maintaining publicly owned public use aviation facilities.
The Rail Program includes passenger rail system development, rail safety inspections, acquisition of rail corridors, the development of intercity and commuter rail service, and the rehabilitation and improvement of rail facilities.
Tri-County Rail began operation on January 9, 1989 in Dade, Broward and Palm Beach counties. In 2003, Governor Bush signed legislation to create the South Florida Regional Transportation Authority (SFRTA), which includes Tri-Rail. This commuter rail system provides an alternative method for the movement of Southeast Florida commuters in the Interstate 95 corridor.
The Department recently acquired the 61 mile Central Florida Rail Corridor and has constructed the necessary improvements to implement SunRail Commuter Service. The first phase began service on May 1, 2014. The second phase of SunRail system, the southern expansion into Osceola County, is scheduled to begin service in 2018.
The Intermodal Access Program includes access to intermodal facilities, the acquisition of right of way, and other capital improvements that enhance the movement of people and goods. It improves surface transportation access to seaports and airports.
The Seaport Program provides funding for the development of the 15 public ports including such projects as road and rail access, dredging, construction of facilities and terminals, acquisition of container cranes and other equipment used in moving cargo and passengers.
12
COMPLIANCE WITH STATUTORY REQUIREMENTS
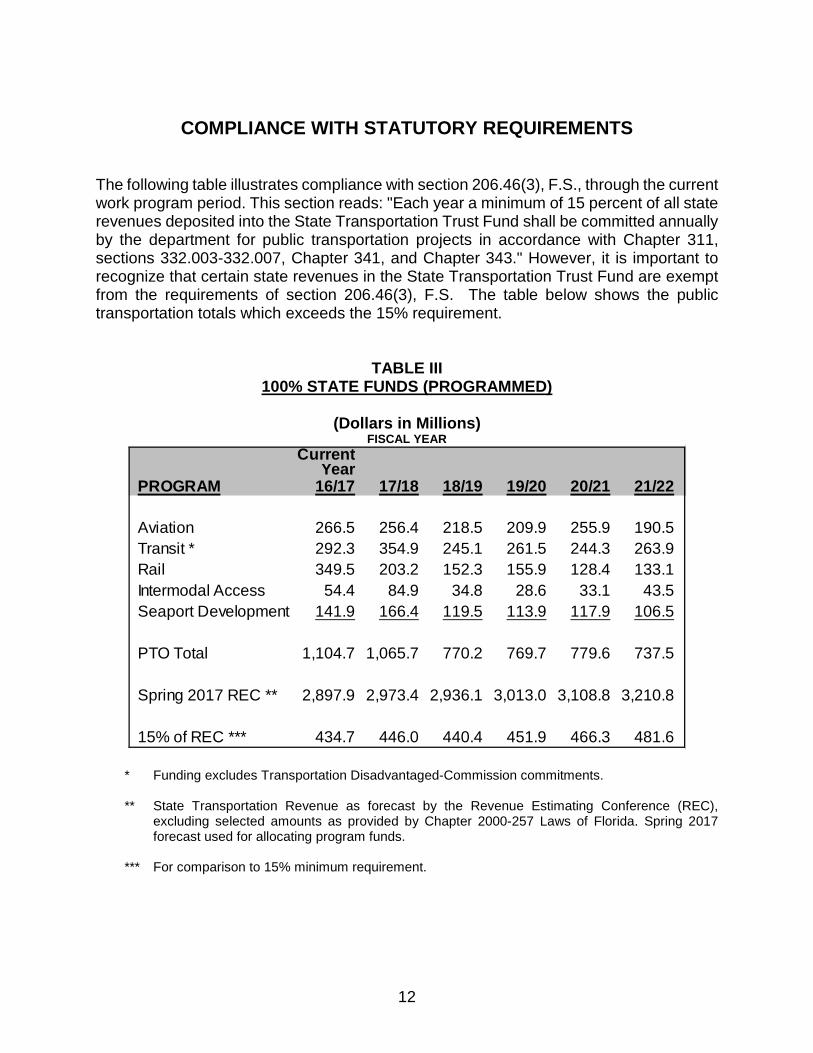
The following table illustrates compliance with section 206.46(3), F.S., through the current work program period. This section reads: "Each year a minimum of 15 percent of all state revenues deposited into the State Transportation Trust Fund shall be committed annually by the department for public transportation projects in accordance with Chapter 311, sections 332.003-332.007, Chapter 341, and Chapter 343." However, it is important to recognize that certain state revenues in the State Transportation Trust Fund are exempt from the requirements of section 206.46(3), F.S. The table below shows the public transportation totals which exceeds the 15% requirement.
TABLE III100% STATE FUNDS (PROGRAMMED)
(Dollars in Millions) FISCAL YEAR
* Funding excludes Transportation Disadvantaged-Commission commitments.
** State Transportation Revenue as forecast by the Revenue Estimating Conference (REC), excluding selected amounts as provided by Chapter 2000-257 Laws of Florida. Spring 2017 forecast used for allocating program funds.
*** For comparison to 15% minimum requirement.
CurrentYear
PROGRAM 16/17 17/18 18/19 19/20 20/21 21/22
Aviation 266.5 256.4 218.5 209.9 255.9 190.5
Transit * 292.3 354.9 245.1 261.5 244.3 263.9
Rail 349.5 203.2 152.3 155.9 128.4 133.1
Intermodal Access 54.4 84.9 34.8 28.6 33.1 43.5
Seaport Development 141.9 166.4 119.5 113.9 117.9 106.5
PTO Total 1,104.7 1,065.7 770.2 769.7 779.6 737.5
Spring 2017 REC ** 2,897.9 2,973.4 2,936.1 3,013.0 3,108.8 3,210.8
15% of REC *** 434.7 446.0 440.4 451.9 466.3 481.6
13
PRODUCT SUPPORT PROGRAMS
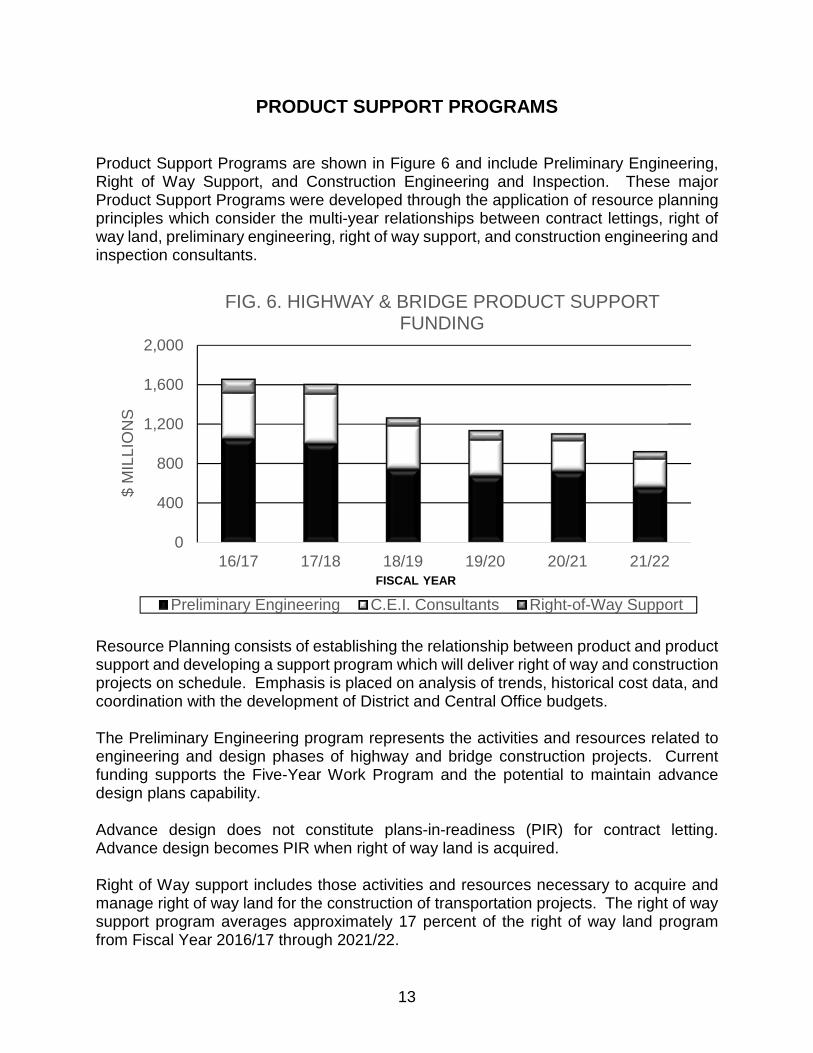
Product Support Programs are shown in Figure 6 and include Preliminary Engineering, Right of Way Support, and Construction Engineering and Inspection. These major Product Support Programs were developed through the application of resource planning principles which consider the multi-year relationships between contract lettings, right of way land, preliminary engineering, right of way support, and construction engineering and inspection consultants.
Resource Planning consists of establishing the relationship between product and product support and developing a support program which will deliver right of way and construction projects on schedule. Emphasis is placed on analysis of trends, historical cost data, and coordination with the development of District and Central Office budgets.
The Preliminary Engineering program represents the activities and resources related to engineering and design phases of highway and bridge construction projects. Current funding supports the Five-Year Work Program and the potential to maintain advance design plans capability.
Advance design does not constitute plans-in-readiness (PIR) for contract letting. Advance design becomes PIR when right of way land is acquired.
Right of Way support includes those activities and resources necessary to acquire and manage right of way land for the construction of transportation projects. The right of way support program averages approximately 17 percent of the right of way land program from Fiscal Year 2016/17 through 2021/22.
0
400
800
1,200
1,600
2,000
16/17 17/18 18/19 19/20 20/21 21/22
$ M
ILL
ION
S
FIG. 6. HIGHWAY & BRIDGE PRODUCT SUPPORT FUNDING
Preliminary Engineering C.E.I. Consultants Right-of-Way Support
FISCAL YEAR
14
The Construction Engineering and Inspection program includes those consultant activities and resources required to review and inspect construction projects. Average Construction Engineering and Inspection levels are approximately 8.5 percent of the annual Highway and Bridge Construction Program over the five years of the Work Program. These levels were based on current criteria for developing the Tentative Five Year Work Program.
CONCLUSION
Sound multimodal planning concepts and the best available forecasts of costs and funding have been used in preparing this Plan. However, this Plan is vulnerable to future circumstances and events which may have a positive or negative impact on transportation resources such as changes in revenue projections; changing of regulations and laws; fluctuations in construction inflation; and extraordinary and unpredictable changes in right of way land costs.
1-1
SECTION I
PRODUCT
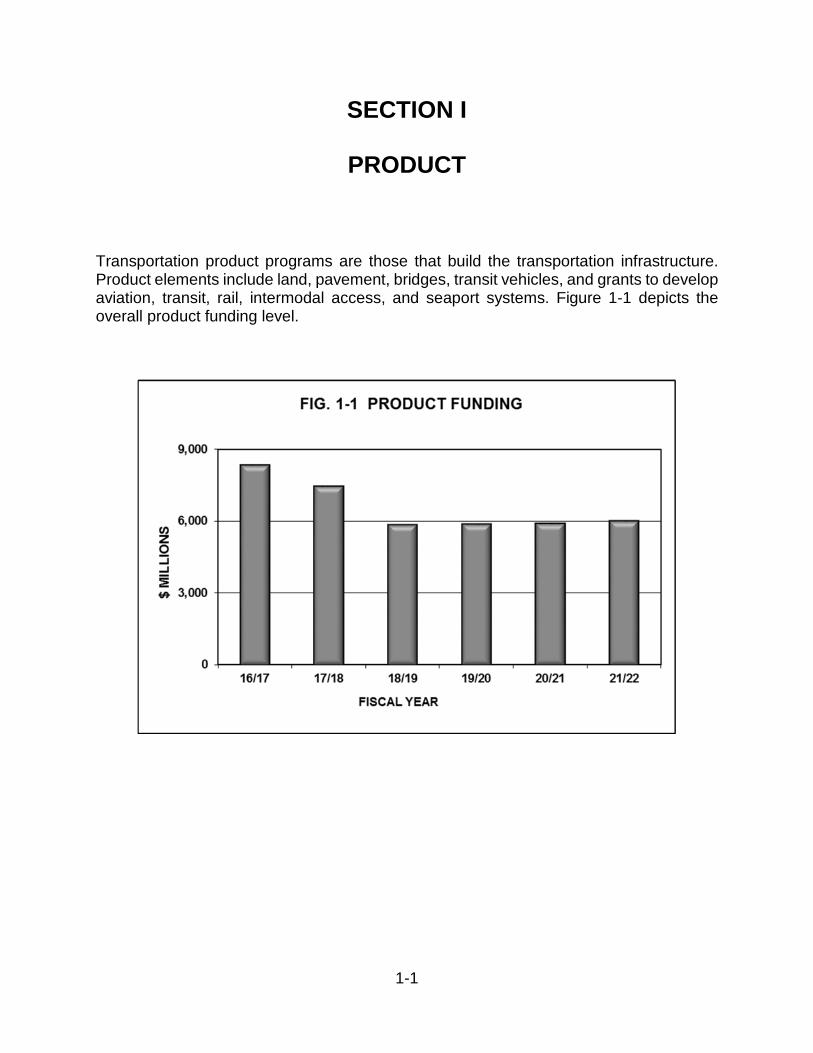
Transportation product programs are those that build the transportation infrastructure. Product elements include land, pavement, bridges, transit vehicles, and grants to develop aviation, transit, rail, intermodal access, and seaport systems. Figure 1-1 depicts the overall product funding level.
1-2
STATE HIGHWAY SYSTEM (SHS)
Program Description
The State Highway System (SHS) is a network of 12,116 centerline miles of highways owned and maintained by the state or state-created authorities. Major elements of the SHS include the Interstate, Arterial Highways, Florida’s Turnpike, and other toll facilities operated by transportation authorities.
The SHS includes highways which are on the Strategic Intermodal System (SIS) and those which are not on the Strategic Intermodal System (Non-SIS).
The SIS was created by the Florida Legislature in 2003 to enhance Florida’s economic prosperity and competitiveness. The system encompasses transportation facilities of statewide and interregional significance, and is focused on the efficient movement of passengers and freight.
As of December 31, 2015, the SIS constituted 18,964 lane miles. This is 43% of the total 43,763 lane miles on the state highway system.
The scopes of work included in this Program are the construction, addition or improvement of lanes, interchanges, entry/exit ramps, feeder roads, toll collection facilities, and motorist service facilities which are on or planned to be on the State Highway System.
Right of way acquisition, resurfacing, bridge repair and replacement, and routine maintenance activities performed on the SHS are a part of other programs. They are not a part of the State Highway System (SHS) Program.
The inventory mileage as of December 31, 2015 is as follows:
1-3
Program Funding
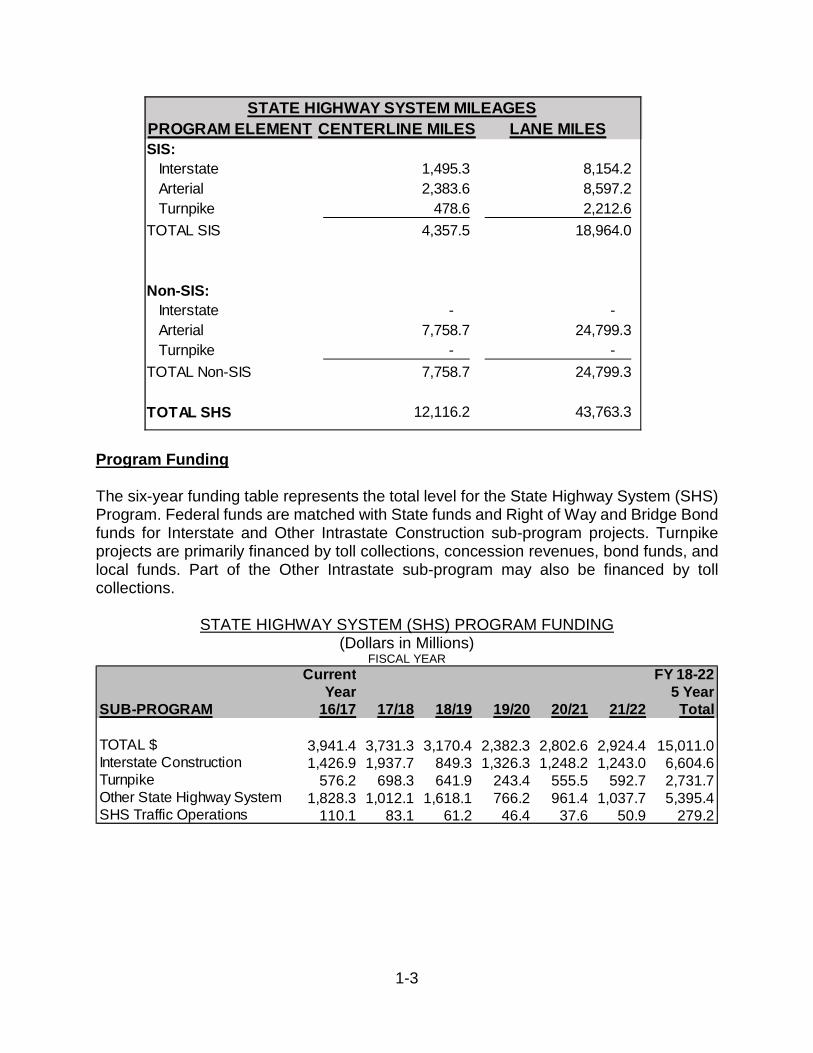
The six-year funding table represents the total level for the State Highway System (SHS) Program. Federal funds are matched with State funds and Right of Way and Bridge Bond funds for Interstate and Other Intrastate Construction sub-program projects. Turnpike projects are primarily financed by toll collections, concession revenues, bond funds, and local funds. Part of the Other Intrastate sub-program may also be financed by toll collections.
STATE HIGHWAY SYSTEM (SHS) PROGRAM FUNDING (Dollars in Millions)
FISCAL YEAR
STATE HIGHWAY SYSTEM MILEAGES
PROGRAM ELEMENT CENTERLINE MILES LANE MILES
SIS:
Interstate 1,495.3 8,154.2
Arterial 2,383.6 8,597.2
Turnpike 478.6 2,212.6
TOTAL SIS 4,357.5 18,964.0
Non-SIS:
Interstate - -
Arterial 7,758.7 24,799.3
Turnpike - -
TOTAL Non-SIS 7,758.7 24,799.3
TOTAL SHS 12,116.2 43,763.3
Current FY 18-22Year 5 Year
SUB-PROGRAM 16/17 17/18 18/19 19/20 20/21 21/22 Total
TOTAL $ 3,941.4 3,731.3 3,170.4 2,382.3 2,802.6 2,924.4 15,011.0Interstate Construction 1,426.9 1,937.7 849.3 1,326.3 1,248.2 1,243.0 6,604.6Turnpike 576.2 698.3 641.9 243.4 555.5 592.7 2,731.7Other State Highway System 1,828.3 1,012.1 1,618.1 766.2 961.4 1,037.7 5,395.4SHS Traffic Operations 110.1 83.1 61.2 46.4 37.6 50.9 279.2
1-4
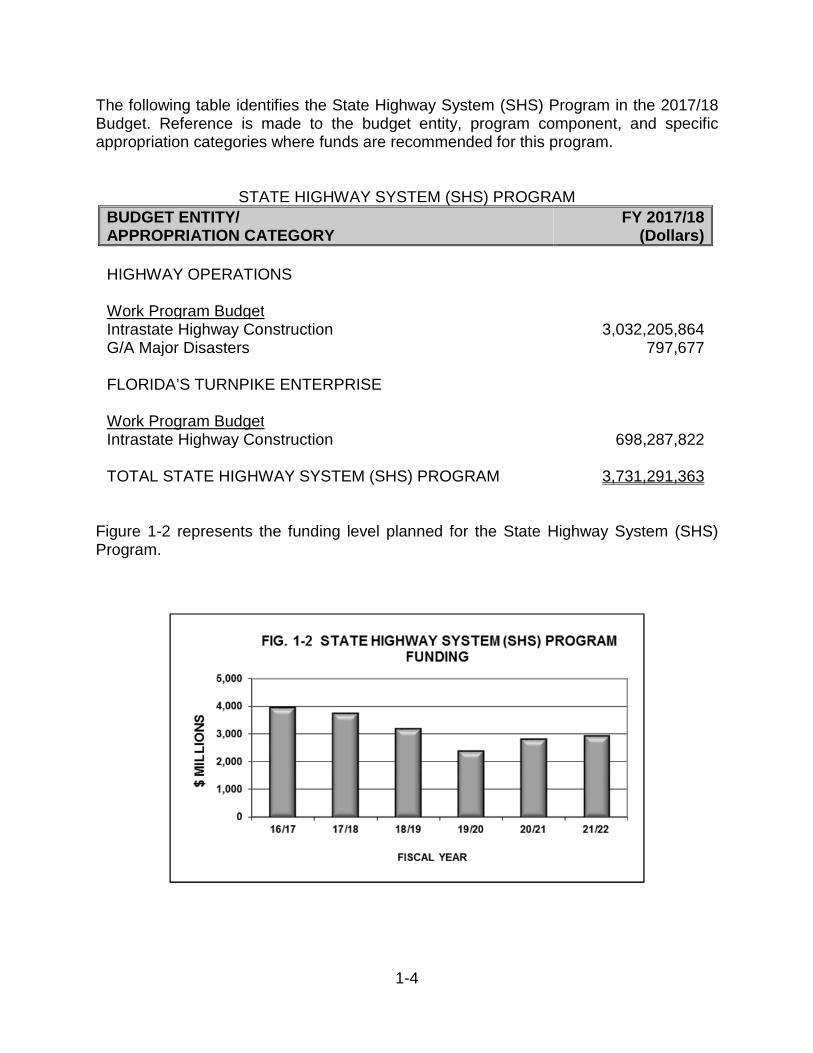
The following table identifies the State Highway System (SHS) Program in the 2017/18 Budget. Reference is made to the budget entity, program component, and specific appropriation categories where funds are recommended for this program.
STATE HIGHWAY SYSTEM (SHS) PROGRAM
BUDGET ENTITY/ APPROPRIATION CATEGORY
FY 2017/18(Dollars)
HIGHWAY OPERATIONS
Work Program BudgetIntrastate Highway Construction G/A Major Disasters
3,032,205,864797,677
FLORIDA’S TURNPIKE ENTERPRISE
Work Program BudgetIntrastate Highway Construction 698,287,822
TOTAL STATE HIGHWAY SYSTEM (SHS) PROGRAM 3,731,291,363
Figure 1-2 represents the funding level planned for the State Highway System (SHS) Program.
1-5
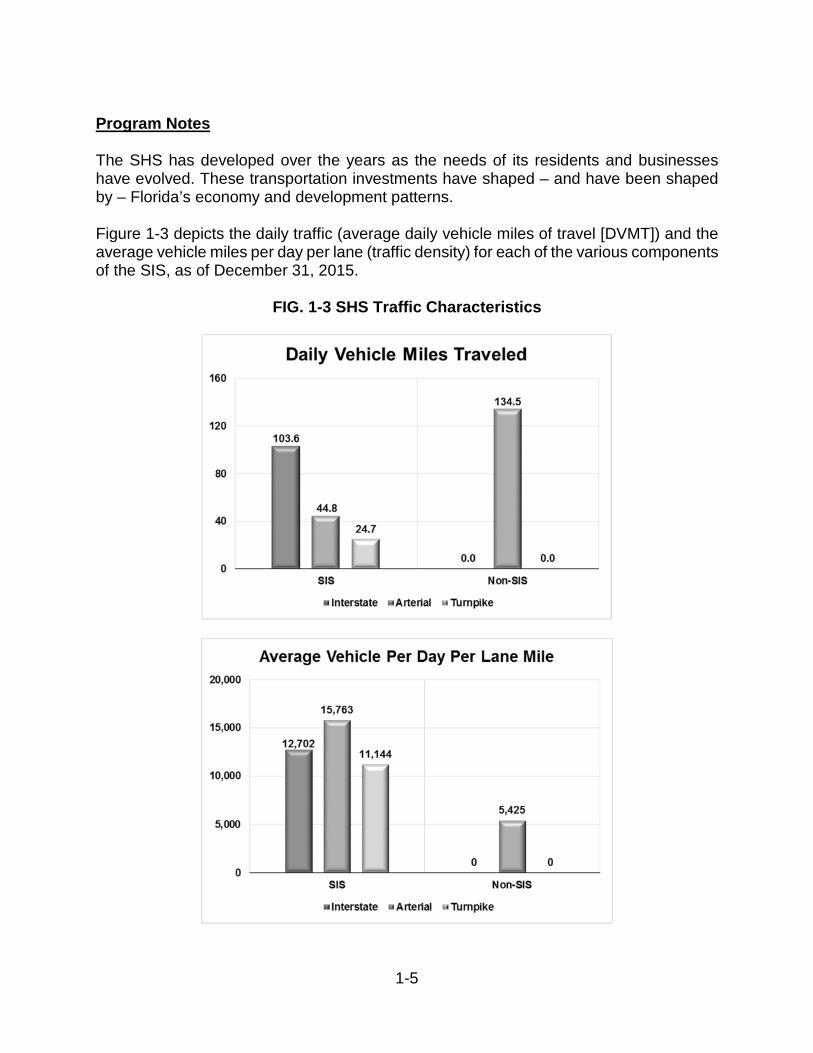
Program Notes
The SHS has developed over the years as the needs of its residents and businesses have evolved. These transportation investments have shaped – and have been shaped by – Florida’s economy and development patterns.
Figure 1-3 depicts the daily traffic (average daily vehicle miles of travel [DVMT]) and the average vehicle miles per day per lane (traffic density) for each of the various components of the SIS, as of December 31, 2015.
FIG. 1-3 SHS Traffic Characteristics
1-6
Primary Directives
Statutory Paraphrase: Department mission, goals, and objectives (Section 334.046(1), F.S.)
The prevailing principles to be considered in planning and developing an integrated, balanced statewide transportation system are: preserving the existing transportation infrastructure; enhancing Florida’s economic competitiveness; and improving travel choices to ensure mobility.
Statutory Paraphrase: Department mission, goals, and objectives (Section 334.046(2), F.S.)
The mission of the Department of Transportation shall be to provide a safe statewide transportation system that ensures the mobility of people and goods, enhances economic prosperity, and preserves the quality of our environment and communities.
Statutory Paraphrase: Work Program (Section 339.135(4)(a)2, F.S.)
The Department shall allocate at least 50 percent of any new discretionary highway capacity funds to the Florida Strategic Intermodal System.
Florida Transportation Plan Goals:
• Safety and security for residents, visitors, and businesses.
• Agile, resilient, and quality infrastructure.
• Efficient and reliable mobility for people and freight.
• More transportation choices for people and freight.
• Transportation solutions that support Florida’s global economic competitiveness.
• Transportation solutions that support quality places to live, learn, work, and play.
Florida Transportation Plan Objectives:
• Prevent transportation-related fatalities and serious injuries.
• Reduce the number of crashes on the transportation system.
• Prevent and mitigate transportation-related security risks.
• Provide transportation infrastructure and services to help prepare for, respond to, and recover from emergencies.
• Meet or exceed industry, state, national, or international standards for infrastructure quality, condition, and performance for all modes of transportation.
1-7
• Optimize the functionality and efficiency of existing infrastructure and right-of-way.
• Adapt transportation infrastructure and technologies to meet changing customer needs.
• Increase the resiliency of infrastructure to risks, including extreme weather and other environmental conditions.
• Reduce delays related to bottlenecks, gaps, and crashes and other incidents for all modes of Florida’s transportation system.
• Increase the reliability of all modes of Florida’s transportation system.
• Increase customer satisfaction with Florida’s transportation system and regulatory processes for residents, visitors, and businesses.
• Increase the efficiency of the supply chain for freight moving to, from, and through Florida.
• Increase the use of new mobility options and technologies such as share, automated, and connected vehicles.
• Increase the number of quality options for visitor travel to, from, and within Florida.
• Increase the number of quality options for moving freight to, from, and within Florida.
• Increase the efficiency and convenience of connecting between multiple modes of transportation.
• Provide transportation infrastructure and services to support job growth in transportation-dependent industries and clusters.
• Increase transportation connectivity between Florida’s economic centers and regions.
• Plan and develop transportation systems that reflect regional and community values, visions, and needs.
• Increase customer satisfaction with Florida’s transportation system.
• Provide convenient, efficient accessibility to the transportation system for Florida’s residents and visitors.
1-8
OTHER ROADS
Program Description
The Other Roads Program involves construction and improvement projects on roads which are not on the State Highway System (SHS) or are part of the County Transportation Program. The Other Roads Program does not include projects which are on the Strategic Intermodal System (SIS).
This program adds capacity, improves highway geometry, provides grade separations, and improves turning movements through signalization improvements and storage capacity within turn lanes. The County Transportation Program accounts for 43% of the Other Roads’ five year funding. The County Transportation Program covers three county incentive programs established in Florida Statutes. They are the County Incentive Grant Program, the Small County Outreach Program, and the Small County Road Assistance Program.
The County Incentive Grant Program was created in section 339.2817, F.S. for the purpose of providing grants to counties, to improve a transportation facility which is located on the State Highway System or which relieves traffic congestion on the State Highway System. The program is funded with 80% of the local option fuel tax revenues which are deposited in the state transportation trust fund pursuant to section five, Chapter 2000-257, Laws of Florida. The Small County Outreach Program was created in section 339.2818, F.S. to assist small county governments in resurfacing or reconstructing county roads or in constructing capacity or safety improvements to county roads. To be eligible for the Small County Outreach Program, the county must have a population size of 170,000 or less (beginning in FY 2016/17) as determined by the most recent official estimate. This program is funded by portions of four funding sources: Local Option Fuel Tax, Documentary Stamp Tax, Motor Vehicle Title Fees, and Motor Vehicle Registration Fees.
The third program is the Small County Road Assistance Program. For the purpose of this program the term “small county” means any county that has a population of 75,000 or less according to 1990 federal census data (section 339.2816 F.S.). Beginning with fiscal year 1999-2000 until fiscal year 2009-2010, and beginning again with fiscal year 2012-2013, up to $25 million annually from the State Transportation Trust Fund may be used for the purposes of funding the Small County Road Assistance Program. Small counties shall be eligible to compete for funds that have been designated for the Small County Road Assistance Program for resurfacing or reconstruction projects on county roads that were part of the county road system on June 10, 1995. Capacity improvements on county roads shall not be eligible for funding under the program.
1-9
Right of way acquisition, resurfacing, bridge repair and replacement, and routine maintenance activities done on Other Roads highways are a part of other programs. They are not a part of the Other Roads Program.
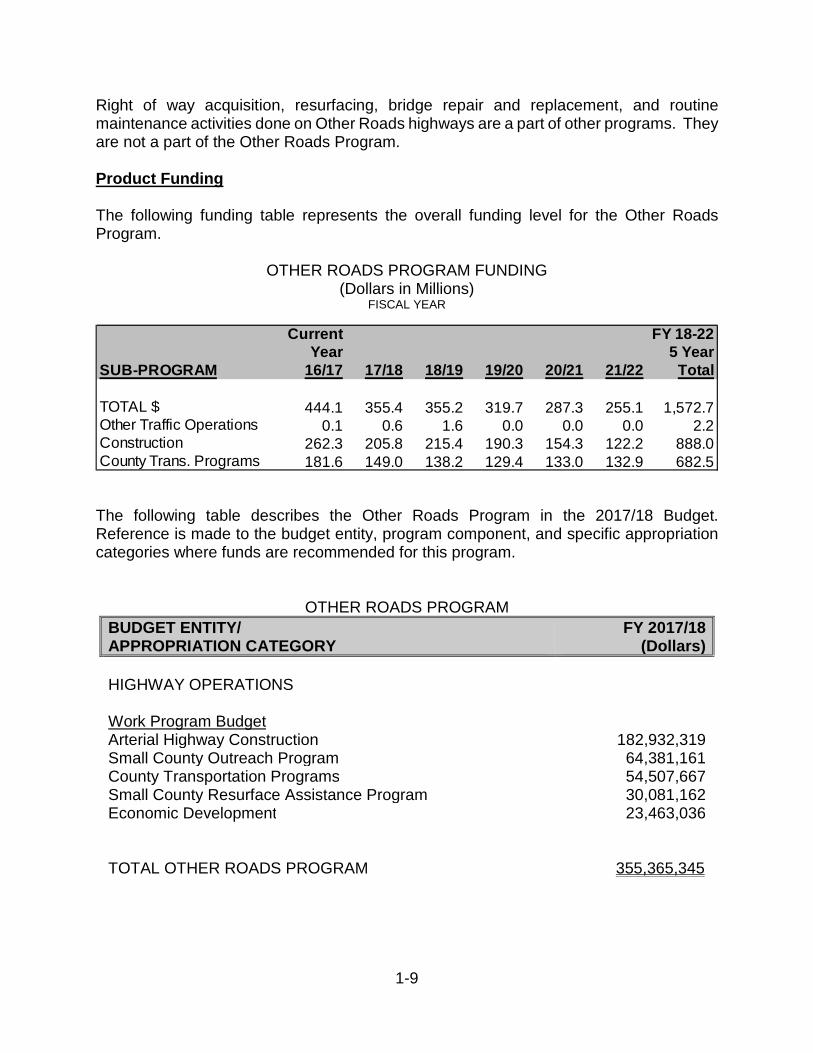
Product Funding
The following funding table represents the overall funding level for the Other Roads Program.
OTHER ROADS PROGRAM FUNDING (Dollars in Millions)
FISCAL YEAR
The following table describes the Other Roads Program in the 2017/18 Budget. Reference is made to the budget entity, program component, and specific appropriation categories where funds are recommended for this program.
OTHER ROADS PROGRAM
BUDGET ENTITY/ APPROPRIATION CATEGORY
FY 2017/18(Dollars)
HIGHWAY OPERATIONS
Work Program BudgetArterial Highway Construction 182,932,319Small County Outreach Program 64,381,161County Transportation Programs 54,507,667Small County Resurface Assistance Program 30,081,162Economic Development 23,463,036
TOTAL OTHER ROADS PROGRAM 355,365,345
Current FY 18-22Year 5 Year
SUB-PROGRAM 16/17 17/18 18/19 19/20 20/21 21/22 Total
TOTAL $ 444.1 355.4 355.2 319.7 287.3 255.1 1,572.7Other Traffic Operations 0.1 0.6 1.6 0.0 0.0 0.0 2.2Construction 262.3 205.8 215.4 190.3 154.3 122.2 888.0County Trans. Programs 181.6 149.0 138.2 129.4 133.0 132.9 682.5
1-10
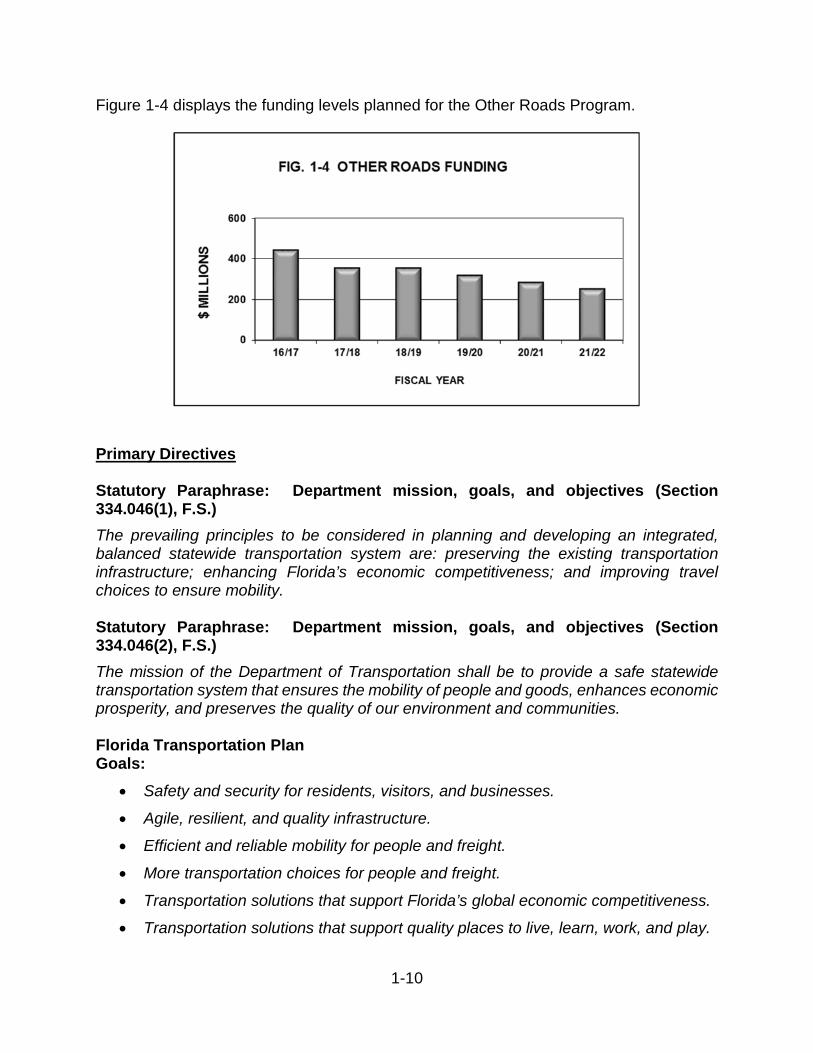
Figure 1-4 displays the funding levels planned for the Other Roads Program.
Primary Directives
Statutory Paraphrase: Department mission, goals, and objectives (Section 334.046(1), F.S.)
The prevailing principles to be considered in planning and developing an integrated, balanced statewide transportation system are: preserving the existing transportation infrastructure; enhancing Florida’s economic competitiveness; and improving travel choices to ensure mobility.
Statutory Paraphrase: Department mission, goals, and objectives (Section 334.046(2), F.S.)
The mission of the Department of Transportation shall be to provide a safe statewide transportation system that ensures the mobility of people and goods, enhances economic prosperity, and preserves the quality of our environment and communities.
Florida Transportation Plan Goals:
• Safety and security for residents, visitors, and businesses.
• Agile, resilient, and quality infrastructure.
• Efficient and reliable mobility for people and freight.
• More transportation choices for people and freight.
• Transportation solutions that support Florida’s global economic competitiveness.
• Transportation solutions that support quality places to live, learn, work, and play.
1-11
• Transportation solutions that support Florida’s environment and conserve energy.
Florida Transportation Plan Objectives:
• Prevent transportation-related fatalities and serious injuries.
• Reduce the number of crashes on the transportation system.
• Prevent and mitigate transportation-related security risks.
• Provide transportation infrastructure and services to help prepare for, respond to, and recover from emergencies.
• Meet or exceed industry, state, national, or international standards for infrastructure quality, condition, and performance for all modes of transportation.
• Optimize the functionality and efficiency of existing infrastructure and right-of-way.
• Adapt transportation infrastructure and technologies to meet changing customer needs.
• Increase the resiliency of infrastructure to risks, including extreme weather and other environmental conditions.
• Reduce delays related to bottlenecks, gaps, and crashes and other incidents for all modes of Florida’s transportation system.
• Increase the reliability of all modes of Florida’s transportation system.
• Increase customer satisfaction with Florida’s transportation system and regulatory processes for residents, visitors, and businesses.
• Increase the efficiency of the supply chain for freight moving to, from, and through Florida.
• Increase the use of new mobility options and technologies such as share, automated, and connected vehicles.
• Increase the number of quality options for visitor travel to, from, and within Florida.
• Increase the number of quality options for moving freight to, from, and within Florida.
• Increase the efficiency and convenience of connecting between multiple modes of transportation.
• Provide transportation infrastructure and services to support job growth in transportation-dependent industries and clusters.
• Increase transportation connectivity between Florida’s economic centers and regions.
• Plan and develop transportation systems that reflect regional and community values, visions, and needs.
1-12
• Increase customer satisfaction with Florida’s transportation system.
• Provide convenient, efficient accessibility to the transportation system for Florida’s residents and visitors.
• Plan and develop transportation systems and facilities in a manner that protects, and where feasible, restores the function and character of the natural environment and avoids or minimizes adverse environmental impacts.
1-13
RIGHT OF WAY LAND
Program Description
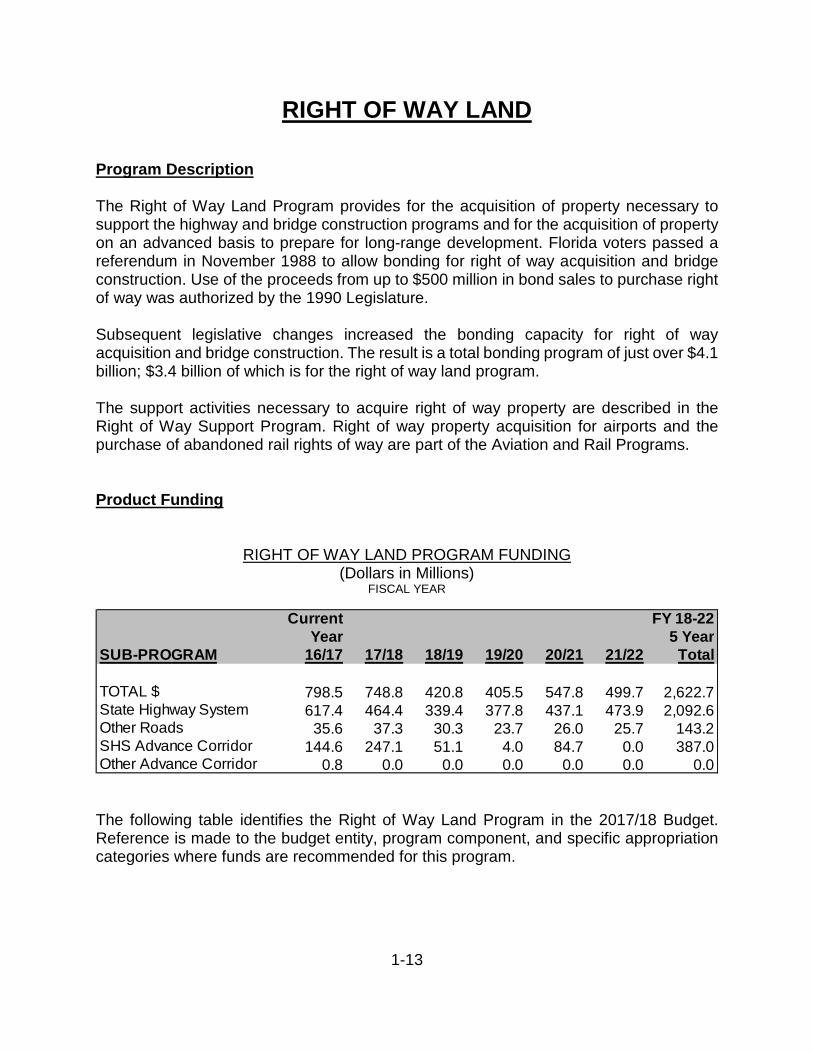
The Right of Way Land Program provides for the acquisition of property necessary to support the highway and bridge construction programs and for the acquisition of property on an advanced basis to prepare for long-range development. Florida voters passed a referendum in November 1988 to allow bonding for right of way acquisition and bridge construction. Use of the proceeds from up to $500 million in bond sales to purchase right of way was authorized by the 1990 Legislature.
Subsequent legislative changes increased the bonding capacity for right of way acquisition and bridge construction. The result is a total bonding program of just over $4.1 billion; $3.4 billion of which is for the right of way land program.
The support activities necessary to acquire right of way property are described in the Right of Way Support Program. Right of way property acquisition for airports and the purchase of abandoned rail rights of way are part of the Aviation and Rail Programs.
Product Funding
RIGHT OF WAY LAND PROGRAM FUNDING (Dollars in Millions)
FISCAL YEAR
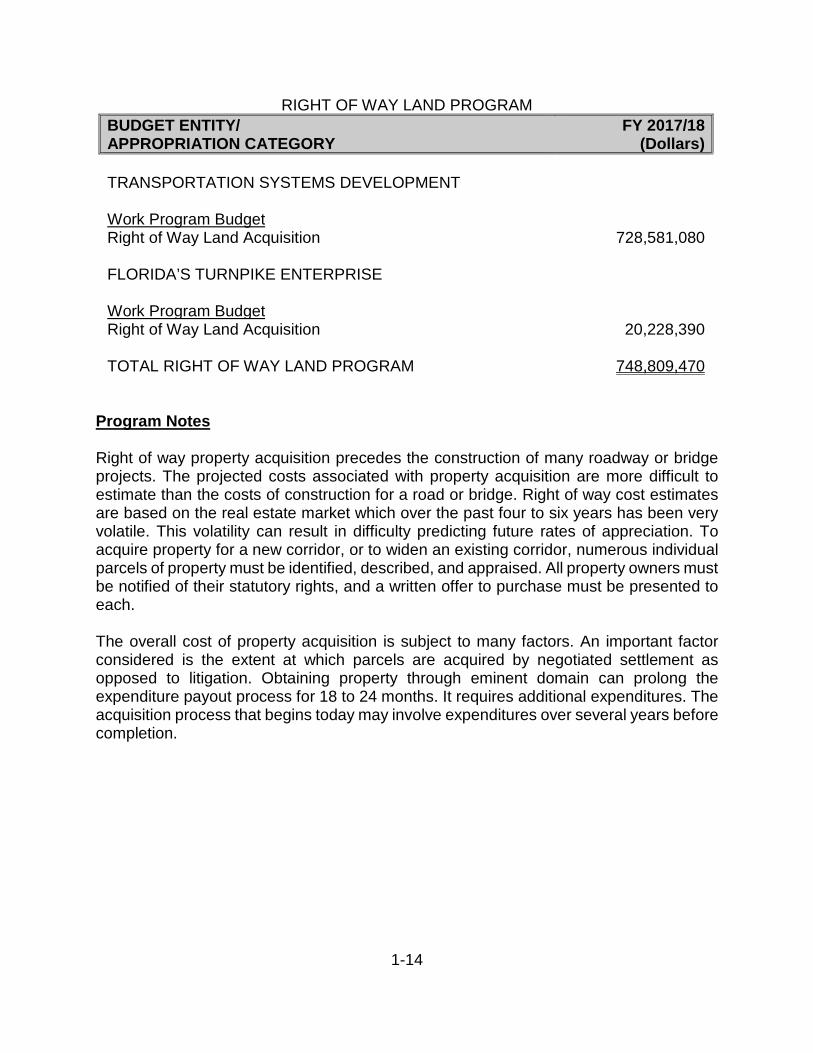
The following table identifies the Right of Way Land Program in the 2017/18 Budget. Reference is made to the budget entity, program component, and specific appropriation categories where funds are recommended for this program.
Current FY 18-22Year 5 Year
SUB-PROGRAM 16/17 17/18 18/19 19/20 20/21 21/22 Total
TOTAL $ 798.5 748.8 420.8 405.5 547.8 499.7 2,622.7State Highway System 617.4 464.4 339.4 377.8 437.1 473.9 2,092.6Other Roads 35.6 37.3 30.3 23.7 26.0 25.7 143.2SHS Advance Corridor 144.6 247.1 51.1 4.0 84.7 0.0 387.0Other Advance Corridor 0.8 0.0 0.0 0.0 0.0 0.0 0.0
1-14
RIGHT OF WAY LAND PROGRAM
BUDGET ENTITY/ APPROPRIATION CATEGORY
FY 2017/18(Dollars)
TRANSPORTATION SYSTEMS DEVELOPMENT
Work Program BudgetRight of Way Land Acquisition 728,581,080
FLORIDA’S TURNPIKE ENTERPRISE
Work Program BudgetRight of Way Land Acquisition 20,228,390
TOTAL RIGHT OF WAY LAND PROGRAM 748,809,470
Program Notes
Right of way property acquisition precedes the construction of many roadway or bridge projects. The projected costs associated with property acquisition are more difficult to estimate than the costs of construction for a road or bridge. Right of way cost estimates are based on the real estate market which over the past four to six years has been very volatile. This volatility can result in difficulty predicting future rates of appreciation. To acquire property for a new corridor, or to widen an existing corridor, numerous individual parcels of property must be identified, described, and appraised. All property owners must be notified of their statutory rights, and a written offer to purchase must be presented to each.
The overall cost of property acquisition is subject to many factors. An important factor considered is the extent at which parcels are acquired by negotiated settlement as opposed to litigation. Obtaining property through eminent domain can prolong the expenditure payout process for 18 to 24 months. It requires additional expenditures. The acquisition process that begins today may involve expenditures over several years before completion.
1-15
The right of way acquisition process is in different stages concurrently for different projects throughout the state. Therefore, the financial impacts of the program are difficult to estimate, measure, and monitor.
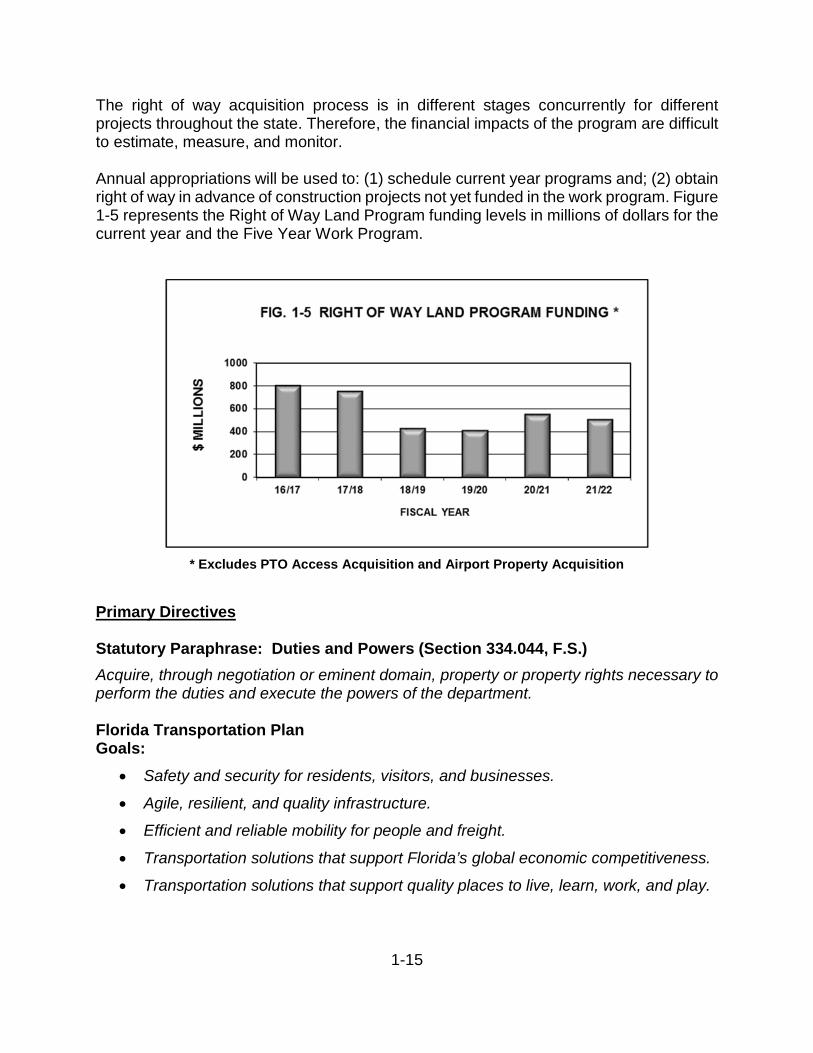
Annual appropriations will be used to: (1) schedule current year programs and; (2) obtain right of way in advance of construction projects not yet funded in the work program. Figure 1-5 represents the Right of Way Land Program funding levels in millions of dollars for the current year and the Five Year Work Program.
* Excludes PTO Access Acquisition and Airport Property Acquisition
Primary Directives
Statutory Paraphrase: Duties and Powers (Section 334.044, F.S.)
Acquire, through negotiation or eminent domain, property or property rights necessary to perform the duties and execute the powers of the department.
Florida Transportation Plan Goals:
• Safety and security for residents, visitors, and businesses.
• Agile, resilient, and quality infrastructure.
• Efficient and reliable mobility for people and freight.
• Transportation solutions that support Florida’s global economic competitiveness.
• Transportation solutions that support quality places to live, learn, work, and play.
1-16
Florida Transportation Plan Objectives:
• Provide transportation infrastructure and services to help prepare for, respond to, and recover from emergencies.
• Optimize the functionality and efficiency of existing infrastructure and right-of-way.
• Reduce delays related to bottlenecks, gaps, and crashes and other incidents for all modes of Florida’s transportation system.
• Provide transportation infrastructure and services to support job growth in transportation-dependent industries and clusters.
• Increase transportation connectivity between Florida’s economic centers and regions.
• Plan and develop transportation systems that reflect regional and community values, visions, and needs.
• Increase customer satisfaction with Florida’s transportation system.
1-17
AVIATION
Program Description
The Aviation Program provides financial and technical assistance to Florida’s public airports. Safety, security, planning, capacity enhancement, land acquisition, facility preservation, and economic development are eligible for financial assistance. Funds from this program assist local governments and airport authorities to plan, design, construct, and maintain airport facilities. All publicly owned airports, with special emphasis on seven major commercial service airports and two general aviation airports on the Strategic Intermodal System (SIS), and ten commercial service airports on the Emerging SIS are among the facilities eligible for funding under this program. The department may also issue grants to Space Florida for spaceport infrastructure improvements.
The department’s Aviation Office regulates Florida public and private airports under Florida law and rule. The Aviation Office licenses public airports based on safety standards. The Aviation Office protects Florida’s 128 public use airports and 25 military airfields from encroachment by imposing tall structure zoning protection requirements, coordinating with local government, and encouraging compatible land use.
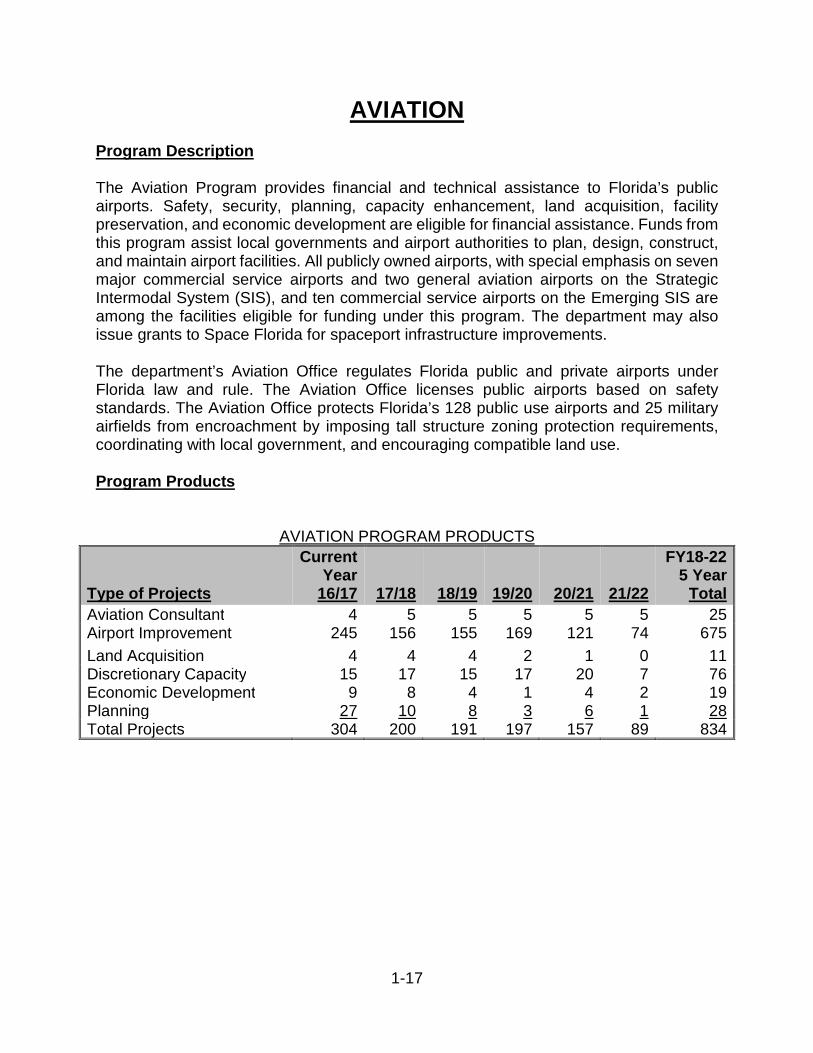
Program Products
AVIATION PROGRAM PRODUCTS
Type of Projects
CurrentYear
16/17 17/18 18/19 19/20 20/21 21/22
FY18-22 5 Year
Total
Aviation Consultant 4 5 5 5 5 5 25Airport Improvement 245 156 155 169 121 74 675
Land Acquisition 4 4 4 2 1 0 11Discretionary Capacity 15 17 15 17 20 7 76Economic Development 9 8 4 1 4 2 19Planning 27 10 8 3 6 1 28Total Projects 304 200 191 197 157 89 834
1-18
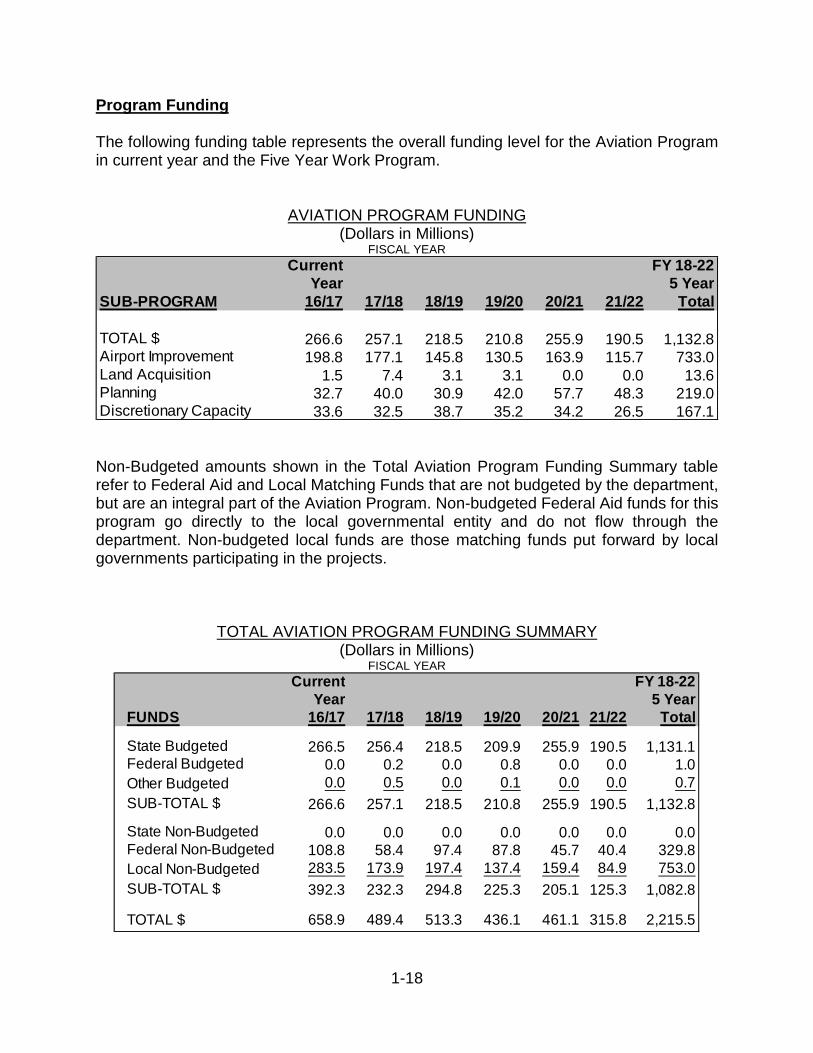
Program Funding
The following funding table represents the overall funding level for the Aviation Program in current year and the Five Year Work Program.
AVIATION PROGRAM FUNDING (Dollars in Millions)
FISCAL YEAR
Non-Budgeted amounts shown in the Total Aviation Program Funding Summary table refer to Federal Aid and Local Matching Funds that are not budgeted by the department, but are an integral part of the Aviation Program. Non-budgeted Federal Aid funds for this program go directly to the local governmental entity and do not flow through the department. Non-budgeted local funds are those matching funds put forward by local governments participating in the projects.
TOTAL AVIATION PROGRAM FUNDING SUMMARY (Dollars in Millions)
FISCAL YEAR
Current FY 18-22Year 5 Year
SUB-PROGRAM 16/17 17/18 18/19 19/20 20/21 21/22 Total
TOTAL $ 266.6 257.1 218.5 210.8 255.9 190.5 1,132.8Airport Improvement 198.8 177.1 145.8 130.5 163.9 115.7 733.0Land Acquisition 1.5 7.4 3.1 3.1 0.0 0.0 13.6Planning 32.7 40.0 30.9 42.0 57.7 48.3 219.0Discretionary Capacity 33.6 32.5 38.7 35.2 34.2 26.5 167.1
Current FY 18-22Year 5 Year
FUNDS 16/17 17/18 18/19 19/20 20/21 21/22 Total
State Budgeted 266.5 256.4 218.5 209.9 255.9 190.5 1,131.1Federal Budgeted 0.0 0.2 0.0 0.8 0.0 0.0 1.0
Other Budgeted 0.0 0.5 0.0 0.1 0.0 0.0 0.7
SUB-TOTAL $ 266.6 257.1 218.5 210.8 255.9 190.5 1,132.8
State Non-Budgeted 0.0 0.0 0.0 0.0 0.0 0.0 0.0Federal Non-Budgeted 108.8 58.4 97.4 87.8 45.7 40.4 329.8
Local Non-Budgeted 283.5 173.9 197.4 137.4 159.4 84.9 753.0
SUB-TOTAL $ 392.3 232.3 294.8 225.3 205.1 125.3 1,082.8
TOTAL $ 658.9 489.4 513.3 436.1 461.1 315.8 2,215.5
1-19
The following table identifies the Aviation Program in the 2017/18 Budget. Reference is made to the budget entity, program component, and specific appropriation categories where funds are recommended for this program.
AVIATION PROGRAM
BUDGET ENTITY/ APPROPRIATION CATEGORY
FY 2017/18(Dollars)
TRANSPORTATION SYSTEMS DEVELOPMENT
Work Program BudgetAviation Development Grants 257,056,198
TOTAL AVIATION PROGRAM 257,056,198
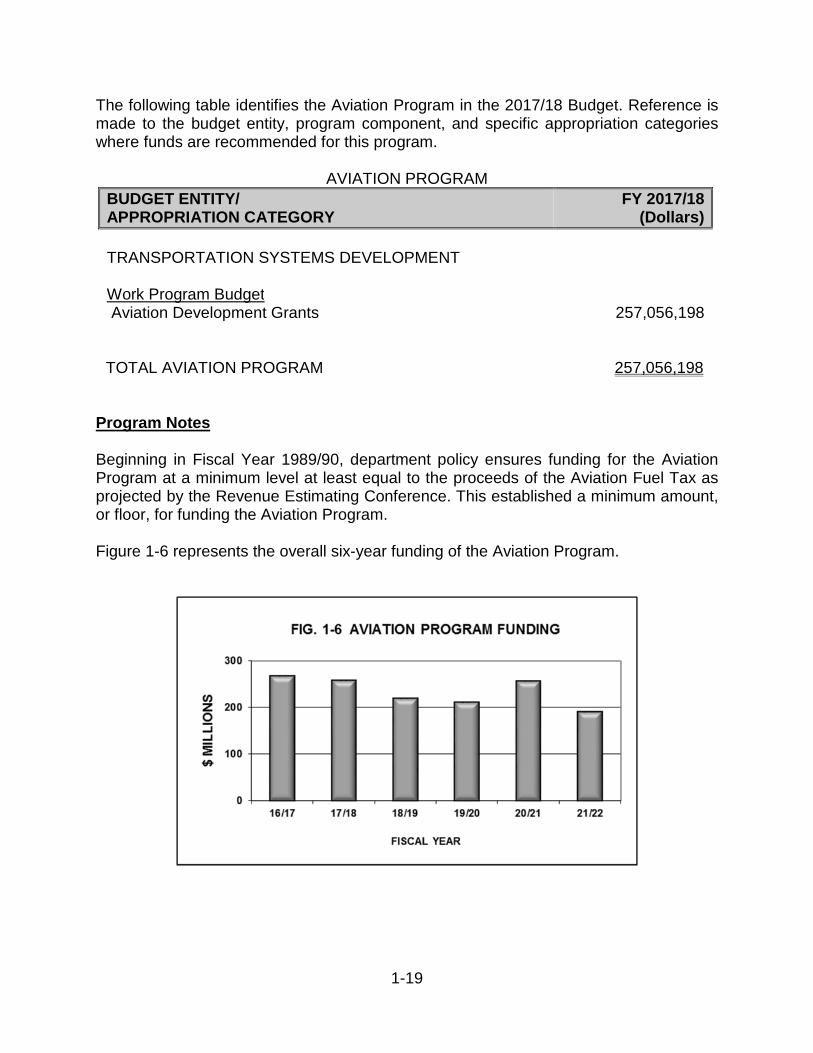
Program Notes
Beginning in Fiscal Year 1989/90, department policy ensures funding for the Aviation Program at a minimum level at least equal to the proceeds of the Aviation Fuel Tax as projected by the Revenue Estimating Conference. This established a minimum amount, or floor, for funding the Aviation Program.
Figure 1-6 represents the overall six-year funding of the Aviation Program.
1-20
Section 331.360, F.S., authorizes the department to enter into Joint Participation Agreements with Space Florida. The department provides up to 50% of eligible project costs for eligible spaceport infrastructure improvement projects.
Section 332.007(6), F.S., authorizes the department to fund up to 50% of the non-federal share of the costs of any eligible project at airports with scheduled commercial service. The department may fund up to 80% of project costs at general aviation airports. Also, the department may initially fund up to 75% of the cost of land acquisition for a new airport or for the expansion of an existing publicly owned, publicly operated airport, and shall be reimbursed to the normal project share when federal funds become available or within 10 years after the date of acquisition, whichever is earlier.
Section 332.007(11), F.S., authorizes the department to fund strategic airport investment projects up to 100% of the project’s cost that:
• Provide important access and on-airport capacity improvements;
• Provide capital improvements to strategically position the state to maximize opportunities in international trade, logistics, and the aviation industry;
• Achieve state goals of an integrated intermodal transportation system; and
• Demonstrate the feasibility and availability of matching funds through federal, local, or private partners.
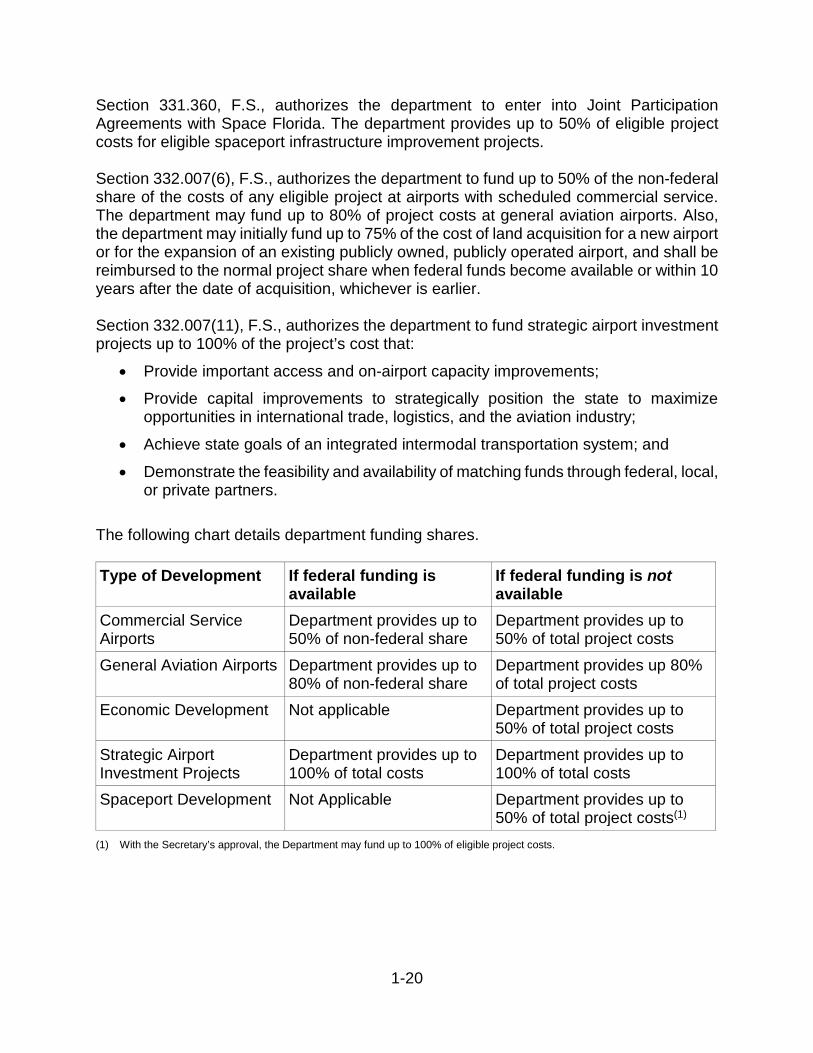
The following chart details department funding shares.
Type of Development If federal funding is available
If federal funding is notavailable
Commercial Service Airports
Department provides up to 50% of non-federal share
Department provides up to 50% of total project costs
General Aviation Airports Department provides up to 80% of non-federal share
Department provides up 80% of total project costs
Economic Development Not applicable Department provides up to 50% of total project costs
Strategic Airport Investment Projects
Department provides up to 100% of total costs
Department provides up to 100% of total costs
Spaceport Development Not Applicable Department provides up to 50% of total project costs(1)
(1) With the Secretary’s approval, the Department may fund up to 100% of eligible project costs.
1-21
Additionally, the Discretionary Capacity Improvement sub-program is funded from appropriated funds in excess of aviation fuel tax revenues. At the present time, six airports meet the eligibility criteria for discretionary capacity funding. These airports are Miami, Ft. Lauderdale, Orlando, Southwest Florida, Orlando-Sanford, and Tampa International Airports.
There are 128 airports that are open to the public in Florida, including a public terminal at Eglin Air Force Base. Twenty of these are commercial airports, which offer scheduled passenger service. Public use airports are annually inspected and licensed by the department. The department is also responsible for the electronic registration of over 650 private use airports and heliports.
As described in Chapter 331, F.S., the department may issue grants to Space Florida for spaceport infrastructure improvements. Space Florida’s ability to develop spaceport infrastructure using department funds is statutorily limited to within geographic areas called Spaceport Territories (section 331.305, F.S.). Those Spaceport Territories are defined in section 331.304, F.S. Since the ultimate method by which the Spaceport Infrastructure Development Program is executed is through Joint Participation Agreements between the department and Space Florida, the ability of the department to fund spaceport projects is also limited to within Spaceport Territories. Projects within these Spaceport Territories may be eligible for Spaceport Grants, while projects outside are not.
These territories include Kennedy Space Center, Cape Canaveral Air Force Station, Patrick Air Force Base, Cecil Airport, Cecil Commerce Park, Space Coast Regional Airport, Space Coast Regional Airport Industrial Park, Spaceport Commerce Park, and Eglin Air Force Base.
Primary Directives
Statutory Paraphrase: Department Program Objectives (Chapter 330, F.S.)
Regulation of aircraft, pilots, and airports.
Statutory Paraphrase: Department Program Objectives (Section 331.360, F.S.)
Spaceport planning and development.
Statutory Paraphrase: Department Program Objectives (Chapter 332, F.S.)
Planning and funding airports and other air navigation facilities.
Statutory Paraphrase: Department Program Objectives (Chapter 333, F.S.)
Airport zoning and airspace obstruction permitting.
1-22
Statutory Paraphrase: Department Program Objectives (Section 334.046, F.S.)
Plan an integrated, balanced statewide transportation system based on the prevailing principles: preserving the existing transportation infrastructure; enhancing Florida’s economic competitiveness; and improving travel choices to ensure mobility.
Florida Transportation Plan Goals:
• Safety and security for residents, visitors, and businesses.
• Agile, resilient, and quality transportation infrastructure.
• Efficient and reliable mobility for people and freight.
• More transportation choices for people and freight.
• Transportation solutions that support Florida’s global economic competitiveness.
• Transportation solutions that support quality places to live, learn, work, and play.
• Transportation solutions that support Florida’s environment and conserve energy.
Florida Transportation Plan Objectives:
• Prevent and mitigate transportation-related security risks.
• Meet or exceed industry, state, national, or international standards for infrastructure quality, condition, and performance for all modes of transportation.
• Optimize the functionality and efficiency of existing infrastructure and right-of-way.
• Adapt transportation infrastructure and technologies to meet changing customer needs.
• Increase the resiliency of infrastructure to risks, including extreme weather and other environmental conditions.
• Reduce delays related to bottlenecks, gaps, and crashes and other incidents for all modes of Florida’s transportation system.
• Increase the reliability of all modes of Florida’s transportation system.
• Increase customer satisfaction with Florida’s transportation system and regulatory processes for residents, visitors, and businesses.
• Increase the efficiency of the supply chain for freight moving to, from, and through Florida.
• Increase the number of quality options for visitor travel to, from, and within Florida.
• Increase the number of quality options for moving freight to, from, and within Florida.
1-23
• Increase the efficiency and convenience of connecting between multiple modes of transportation
• Provide transportation infrastructure and services to support job growth in transportation-dependent industries and clusters.
• Increase transportation connectivity between Florida’s economic centers and regions.
• Plan and develop transportation systems that reflect regional and community values, visions, and needs.
• Increase customer satisfaction with Florida’s transportation system.
• Provide convenient, efficient accessibility to the transportation system for Florida’s residents and visitors.
• Plan and develop transportation systems and facilities in a manner that protects, and where feasible, restores the function and character of the natural environment and avoids or minimizes adverse environmental impacts.
1-24
TRANSIT
Program Description
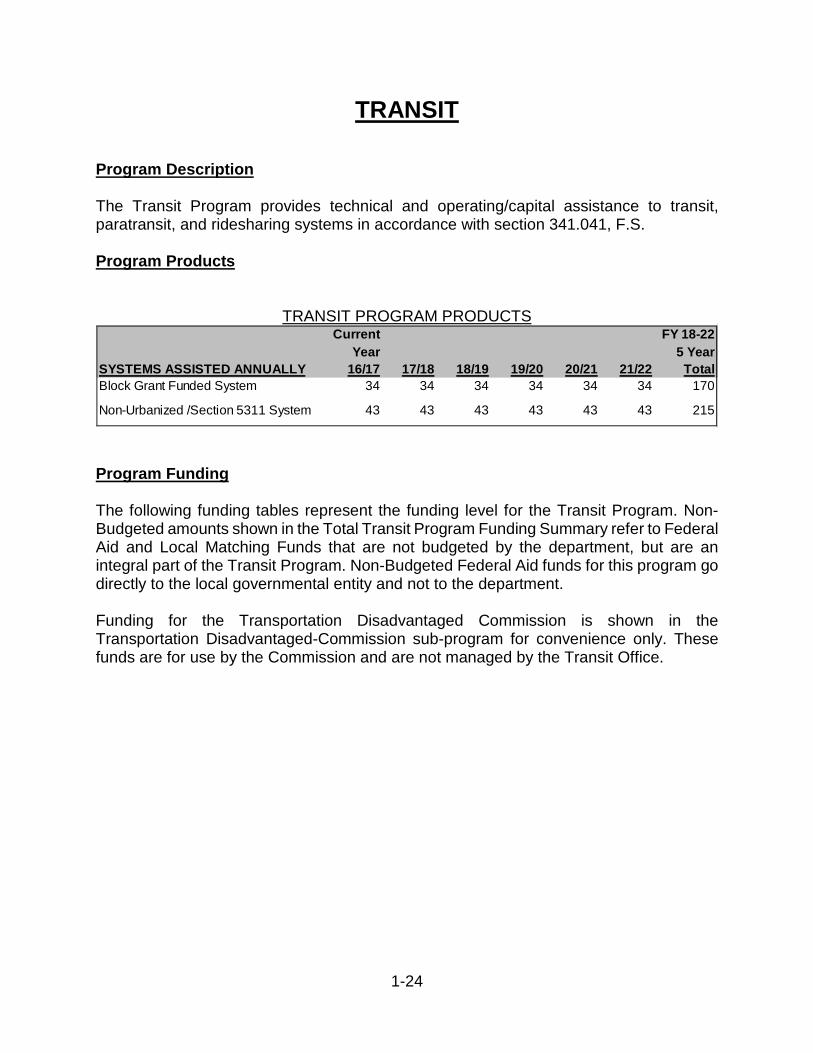
The Transit Program provides technical and operating/capital assistance to transit, paratransit, and ridesharing systems in accordance with section 341.041, F.S.
Program Products
TRANSIT PROGRAM PRODUCTS
Program Funding
The following funding tables represent the funding level for the Transit Program. Non-Budgeted amounts shown in the Total Transit Program Funding Summary refer to Federal Aid and Local Matching Funds that are not budgeted by the department, but are an integral part of the Transit Program. Non-Budgeted Federal Aid funds for this program go directly to the local governmental entity and not to the department.
Funding for the Transportation Disadvantaged Commission is shown in the Transportation Disadvantaged-Commission sub-program for convenience only. These funds are for use by the Commission and are not managed by the Transit Office.
Current FY 18-22
Year 5 Year
SYSTEMS ASSISTED ANNUALLY 16/17 17/18 18/19 19/20 20/21 21/22 Total
Block Grant Funded System 34 34 34 34 34 34 170
Non-Urbanized /Section 5311 System 43 43 43 43 43 43 215
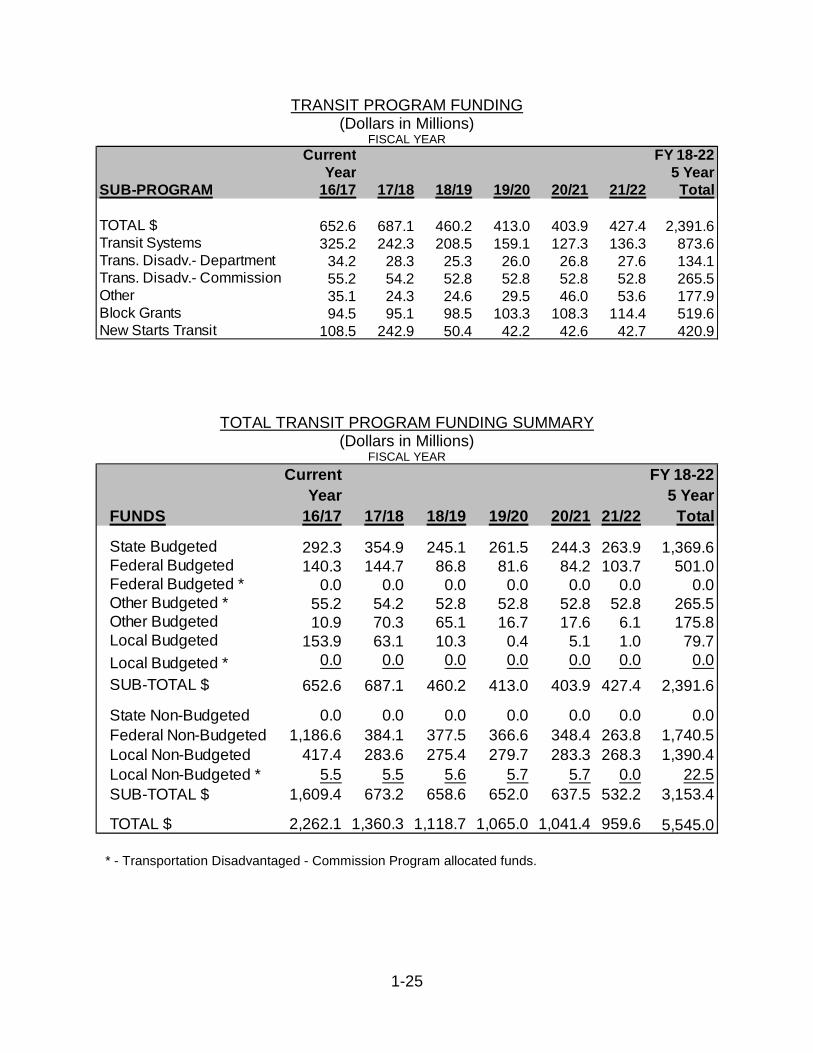
1-25
TRANSIT PROGRAM FUNDING (Dollars in Millions)
FISCAL YEAR
TOTAL TRANSIT PROGRAM FUNDING SUMMARY (Dollars in Millions)
FISCAL YEAR
* - Transportation Disadvantaged - Commission Program allocated funds.
Current FY 18-22Year 5 Year
SUB-PROGRAM 16/17 17/18 18/19 19/20 20/21 21/22 Total
TOTAL $ 652.6 687.1 460.2 413.0 403.9 427.4 2,391.6Transit Systems 325.2 242.3 208.5 159.1 127.3 136.3 873.6Trans. Disadv.- Department 34.2 28.3 25.3 26.0 26.8 27.6 134.1Trans. Disadv.- Commission 55.2 54.2 52.8 52.8 52.8 52.8 265.5Other 35.1 24.3 24.6 29.5 46.0 53.6 177.9Block Grants 94.5 95.1 98.5 103.3 108.3 114.4 519.6New Starts Transit 108.5 242.9 50.4 42.2 42.6 42.7 420.9
Current FY 18-22
Year 5 Year
FUNDS 16/17 17/18 18/19 19/20 20/21 21/22 Total
State Budgeted 292.3 354.9 245.1 261.5 244.3 263.9 1,369.6Federal Budgeted 140.3 144.7 86.8 81.6 84.2 103.7 501.0Federal Budgeted * 0.0 0.0 0.0 0.0 0.0 0.0 0.0Other Budgeted * 55.2 54.2 52.8 52.8 52.8 52.8 265.5Other Budgeted 10.9 70.3 65.1 16.7 17.6 6.1 175.8Local Budgeted 153.9 63.1 10.3 0.4 5.1 1.0 79.7
Local Budgeted * 0.0 0.0 0.0 0.0 0.0 0.0 0.0
SUB-TOTAL $ 652.6 687.1 460.2 413.0 403.9 427.4 2,391.6
State Non-Budgeted 0.0 0.0 0.0 0.0 0.0 0.0 0.0
Federal Non-Budgeted 1,186.6 384.1 377.5 366.6 348.4 263.8 1,740.5Local Non-Budgeted 417.4 283.6 275.4 279.7 283.3 268.3 1,390.4
Local Non-Budgeted * 5.5 5.5 5.6 5.7 5.7 0.0 22.5
SUB-TOTAL $ 1,609.4 673.2 658.6 652.0 637.5 532.2 3,153.4
TOTAL $ 2,262.1 1,360.3 1,118.7 1,065.0 1,041.4 959.6 5,545.0
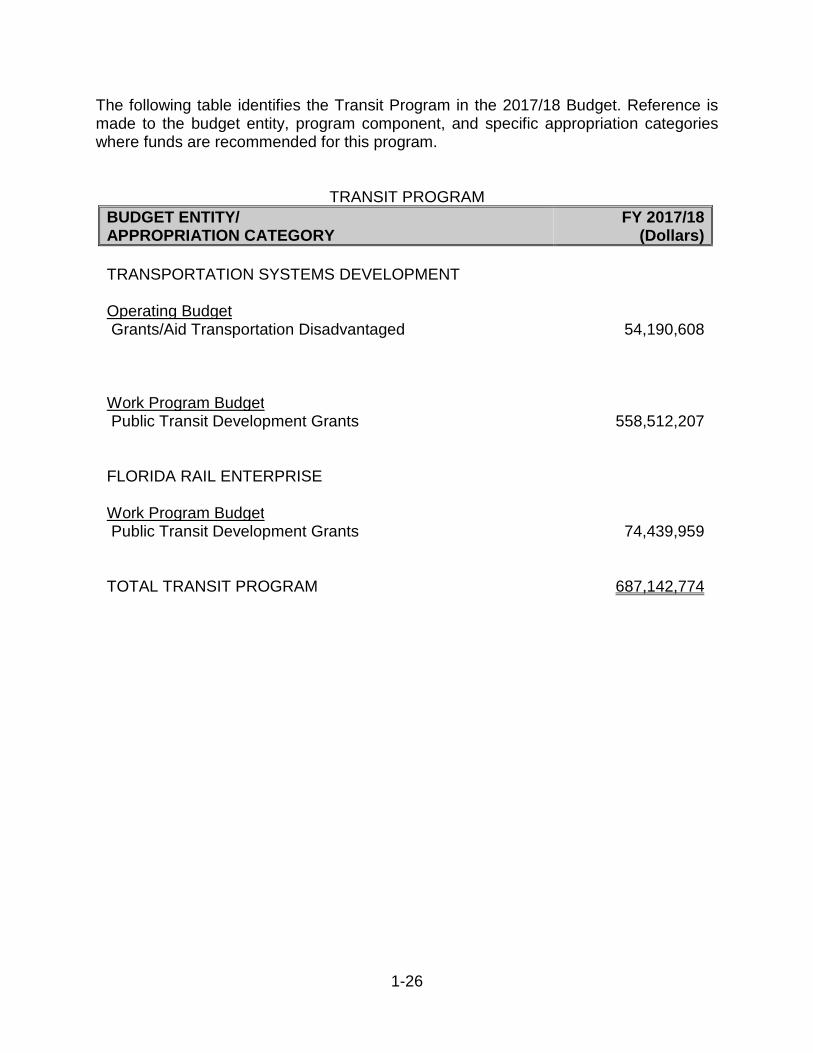
1-26
The following table identifies the Transit Program in the 2017/18 Budget. Reference is made to the budget entity, program component, and specific appropriation categories where funds are recommended for this program.
TRANSIT PROGRAM
BUDGET ENTITY/ APPROPRIATION CATEGORY
FY 2017/18(Dollars)
TRANSPORTATION SYSTEMS DEVELOPMENT
Operating BudgetGrants/Aid Transportation Disadvantaged 54,190,608
Work Program BudgetPublic Transit Development Grants 558,512,207
FLORIDA RAIL ENTERPRISE
Work Program BudgetPublic Transit Development Grants 74,439,959
TOTAL TRANSIT PROGRAM 687,142,774
1-27
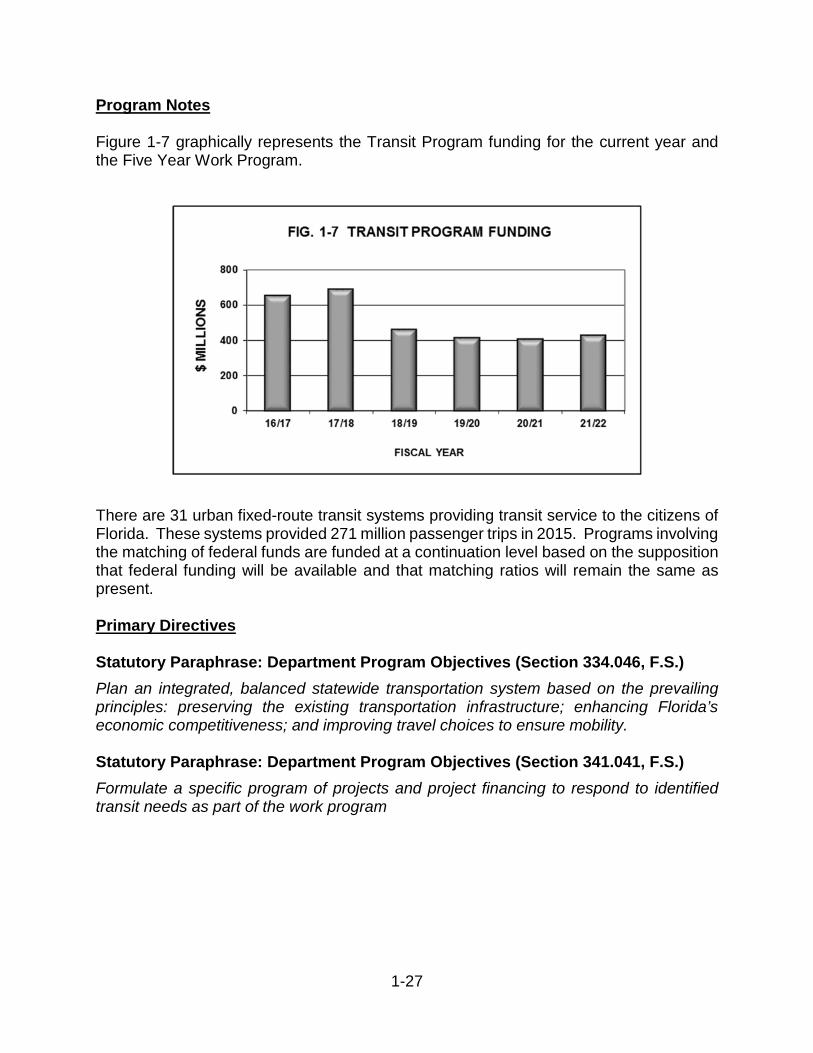
Program Notes
Figure 1-7 graphically represents the Transit Program funding for the current year and the Five Year Work Program.
There are 31 urban fixed-route transit systems providing transit service to the citizens of Florida. These systems provided 271 million passenger trips in 2015. Programs involving the matching of federal funds are funded at a continuation level based on the supposition that federal funding will be available and that matching ratios will remain the same as present.
Primary Directives
Statutory Paraphrase: Department Program Objectives (Section 334.046, F.S.)
Plan an integrated, balanced statewide transportation system based on the prevailing principles: preserving the existing transportation infrastructure; enhancing Florida’s economic competitiveness; and improving travel choices to ensure mobility.
Statutory Paraphrase: Department Program Objectives (Section 341.041, F.S.)
Formulate a specific program of projects and project financing to respond to identified transit needs as part of the work program
1-28
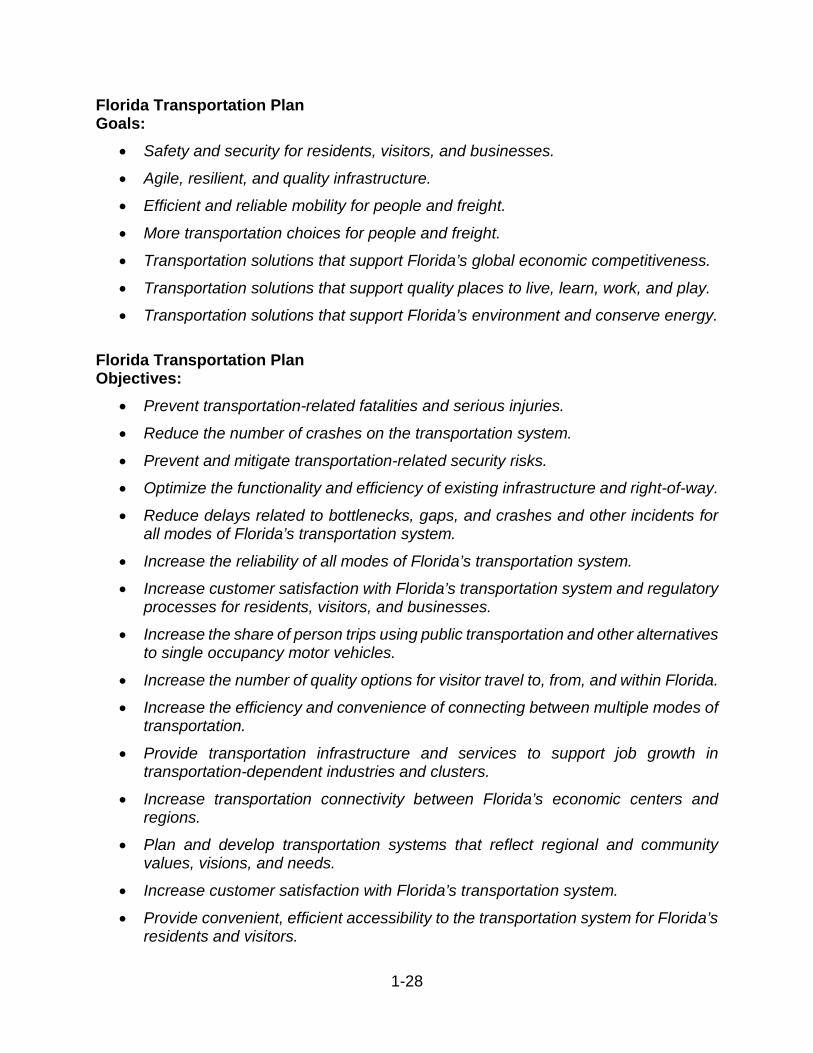
Florida Transportation Plan Goals:
• Safety and security for residents, visitors, and businesses.
• Agile, resilient, and quality infrastructure.
• Efficient and reliable mobility for people and freight.
• More transportation choices for people and freight.
• Transportation solutions that support Florida’s global economic competitiveness.
• Transportation solutions that support quality places to live, learn, work, and play.
• Transportation solutions that support Florida’s environment and conserve energy.
Florida Transportation Plan Objectives:
• Prevent transportation-related fatalities and serious injuries.
• Reduce the number of crashes on the transportation system.
• Prevent and mitigate transportation-related security risks.
• Optimize the functionality and efficiency of existing infrastructure and right-of-way.
• Reduce delays related to bottlenecks, gaps, and crashes and other incidents for all modes of Florida’s transportation system.
• Increase the reliability of all modes of Florida’s transportation system.
• Increase customer satisfaction with Florida’s transportation system and regulatory processes for residents, visitors, and businesses.
• Increase the share of person trips using public transportation and other alternatives to single occupancy motor vehicles.
• Increase the number of quality options for visitor travel to, from, and within Florida.
• Increase the efficiency and convenience of connecting between multiple modes of transportation.
• Provide transportation infrastructure and services to support job growth in transportation-dependent industries and clusters.
• Increase transportation connectivity between Florida’s economic centers and regions.
• Plan and develop transportation systems that reflect regional and community values, visions, and needs.
• Increase customer satisfaction with Florida’s transportation system.
• Provide convenient, efficient accessibility to the transportation system for Florida’s residents and visitors.
1-29
• Provide transportation solutions that contribute to improved public health.
• Plan and develop transportation systems and facilities in a manner that protects, and where feasible, restores the function and character of the natural environment and avoids or minimizes adverse environmental impacts.
• Decrease transportation-related air quality pollutants and greenhouse gas emissions.
• Increase the energy efficiency of transportation
• Increase the diversity of transportation-related energy sources, with emphasis on cleaner and more efficient fuels.
1-30
RAIL
Program Description
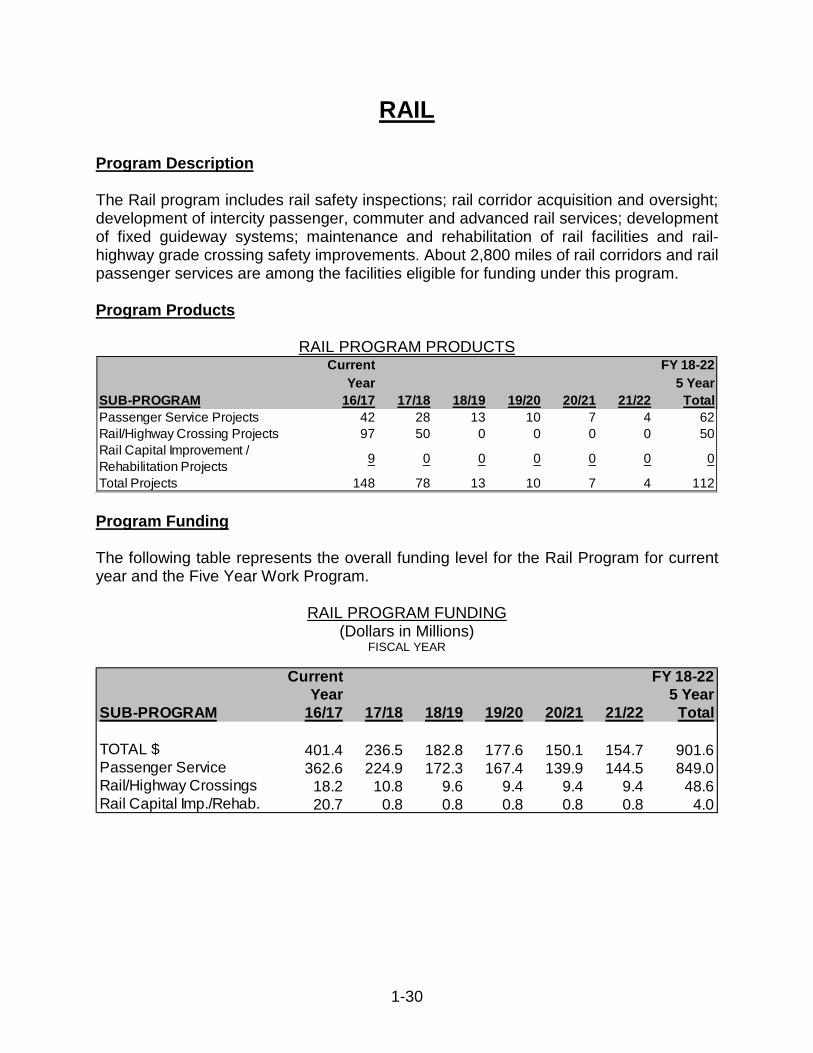
The Rail program includes rail safety inspections; rail corridor acquisition and oversight; development of intercity passenger, commuter and advanced rail services; development of fixed guideway systems; maintenance and rehabilitation of rail facilities and rail-highway grade crossing safety improvements. About 2,800 miles of rail corridors and rail passenger services are among the facilities eligible for funding under this program.
Program Products
RAIL PROGRAM PRODUCTS
Program Funding
The following table represents the overall funding level for the Rail Program for current year and the Five Year Work Program.
RAIL PROGRAM FUNDING (Dollars in Millions)
FISCAL YEAR
Current FY 18-22
Year 5 Year
SUB-PROGRAM 16/17 17/18 18/19 19/20 20/21 21/22 Total
Passenger Service Projects 42 28 13 10 7 4 62Rail/Highway Crossing Projects 97 50 0 0 0 0 50Rail Capital Improvement / Rehabilitation Projects
9 0 0 0 0 0 0
Total Projects 148 78 13 10 7 4 112
Current FY 18-22Year 5 Year
SUB-PROGRAM 16/17 17/18 18/19 19/20 20/21 21/22 Total
TOTAL $ 401.4 236.5 182.8 177.6 150.1 154.7 901.6Passenger Service 362.6 224.9 172.3 167.4 139.9 144.5 849.0Rail/Highway Crossings 18.2 10.8 9.6 9.4 9.4 9.4 48.6Rail Capital Imp./Rehab. 20.7 0.8 0.8 0.8 0.8 0.8 4.0
1-31
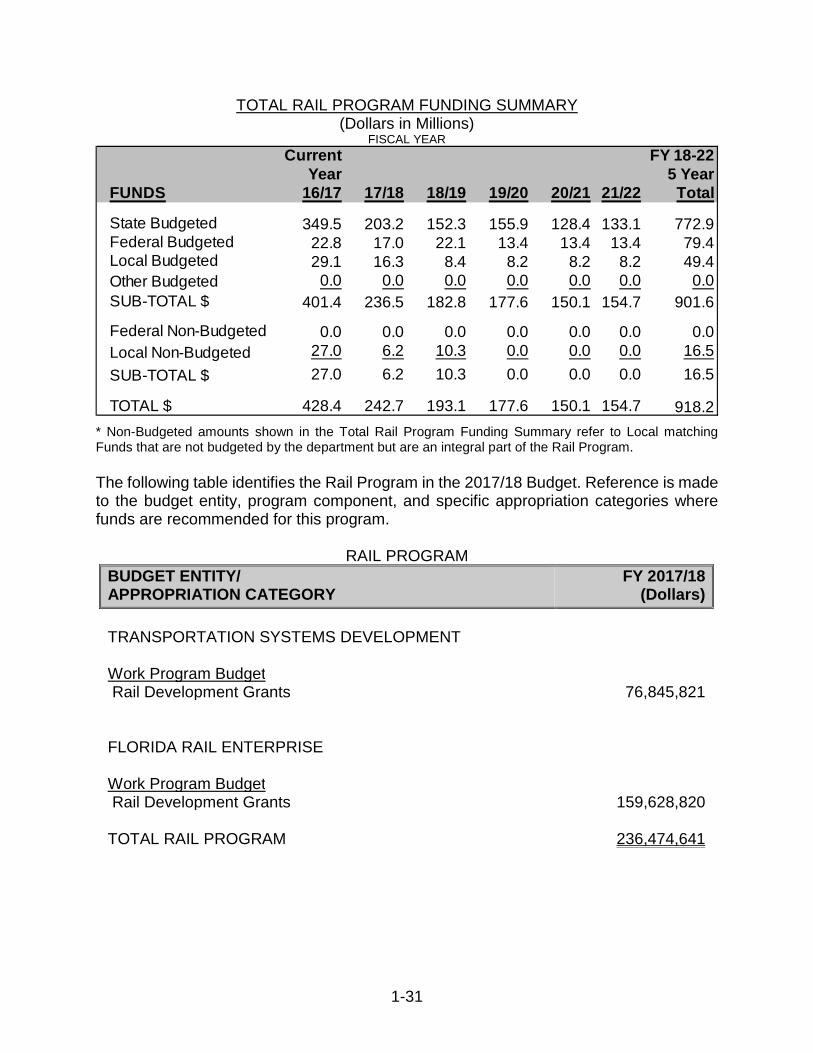
TOTAL RAIL PROGRAM FUNDING SUMMARY (Dollars in Millions)
FISCAL YEAR
* Non-Budgeted amounts shown in the Total Rail Program Funding Summary refer to Local matching Funds that are not budgeted by the department but are an integral part of the Rail Program.
The following table identifies the Rail Program in the 2017/18 Budget. Reference is made to the budget entity, program component, and specific appropriation categories where funds are recommended for this program.
RAIL PROGRAM
BUDGET ENTITY/ APPROPRIATION CATEGORY
FY 2017/18(Dollars)
TRANSPORTATION SYSTEMS DEVELOPMENT
Work Program BudgetRail Development Grants 76,845,821
FLORIDA RAIL ENTERPRISE
Work Program BudgetRail Development Grants 159,628,820
TOTAL RAIL PROGRAM 236,474,641
Current FY 18-22Year 5 Year
FUNDS 16/17 17/18 18/19 19/20 20/21 21/22 Total
State Budgeted 349.5 203.2 152.3 155.9 128.4 133.1 772.9Federal Budgeted 22.8 17.0 22.1 13.4 13.4 13.4 79.4Local Budgeted 29.1 16.3 8.4 8.2 8.2 8.2 49.4Other Budgeted 0.0 0.0 0.0 0.0 0.0 0.0 0.0
SUB-TOTAL $ 401.4 236.5 182.8 177.6 150.1 154.7 901.6
Federal Non-Budgeted 0.0 0.0 0.0 0.0 0.0 0.0 0.0
Local Non-Budgeted 27.0 6.2 10.3 0.0 0.0 0.0 16.5
SUB-TOTAL $ 27.0 6.2 10.3 0.0 0.0 0.0 16.5
TOTAL $ 428.4 242.7 193.1 177.6 150.1 154.7 918.2
1-32
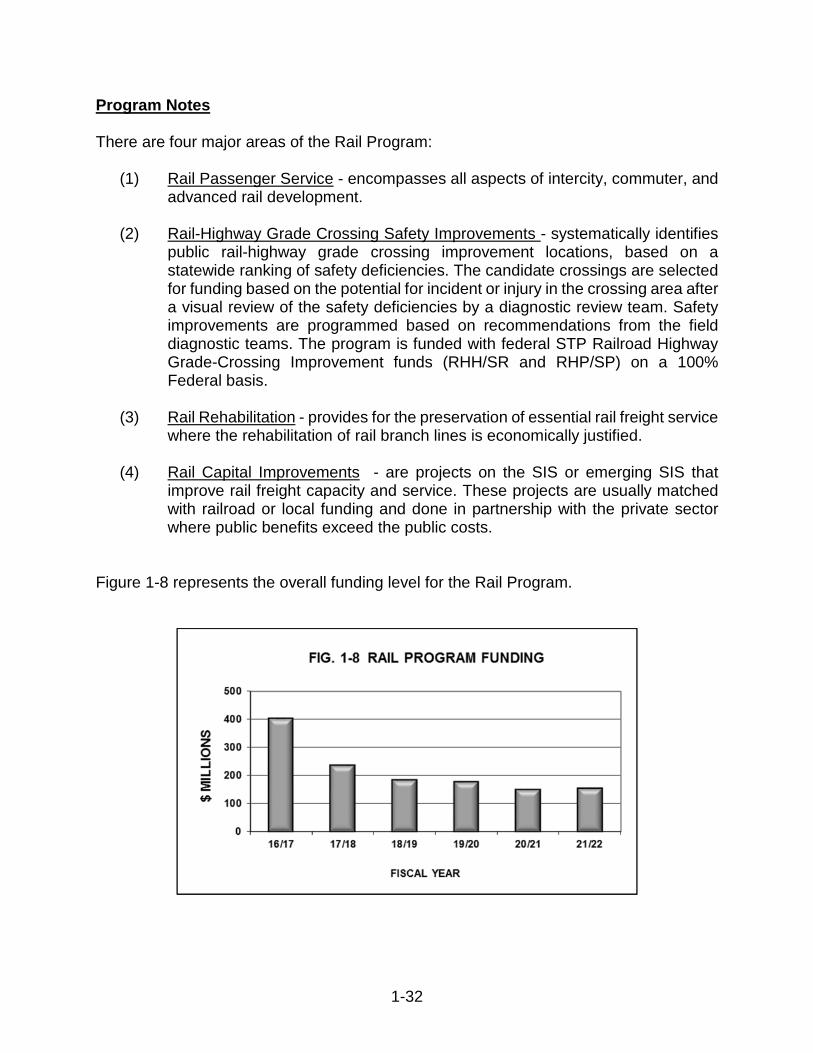
Program Notes
There are four major areas of the Rail Program:
(1) Rail Passenger Service - encompasses all aspects of intercity, commuter, and advanced rail development.
(2) Rail-Highway Grade Crossing Safety Improvements - systematically identifies public rail-highway grade crossing improvement locations, based on a statewide ranking of safety deficiencies. The candidate crossings are selected for funding based on the potential for incident or injury in the crossing area after a visual review of the safety deficiencies by a diagnostic review team. Safety improvements are programmed based on recommendations from the field diagnostic teams. The program is funded with federal STP Railroad Highway Grade-Crossing Improvement funds (RHH/SR and RHP/SP) on a 100% Federal basis.
(3) Rail Rehabilitation - provides for the preservation of essential rail freight service where the rehabilitation of rail branch lines is economically justified.
(4) Rail Capital Improvements - are projects on the SIS or emerging SIS that improve rail freight capacity and service. These projects are usually matched with railroad or local funding and done in partnership with the private sector where public benefits exceed the public costs.
Figure 1-8 represents the overall funding level for the Rail Program.
1-33
Since 1983, the department has been actively involved in planning and implementing commuter rail service in Southeast Florida. The Tri-County Rail Organization was created in January 1986 and changed to the Tri-County Rail Authority (TCRA) in 1989. TCRA was formed to oversee implementation and operation of the commuter rail service. In 2003, Governor Bush signed legislation to create the South Florida Regional Transportation Authority (SFRTA), which includes Tri-Rail. The department provides technical support and funding to the SFRTA in implementing Florida’s first regional commuter rail service.
This service, which began operating in January 1989, initially was conceived as part of a comprehensive plan to alleviate traffic disruption during the reconstruction of I-95, but is now considered a permanent feature of the regional transportation system.
The department recently acquired the 61 mile Central Florida Rail Corridor and has constructed the necessary improvements to implement the SunRail Commuter Service. The first phase began service in 2014. The second phase of the SunRail system, south southern expansion into Osceola County, is scheduled to begin service in 2018.
The Rail-Highway Grade Crossing Safety Improvement Program enables the department to identify high hazard rail grade crossing locations, develop hazard reducing safety improvement projects and evaluate project effectiveness.
Primary Directives
Statutory Paraphrase: Department Program Objectives (Section 334.046, F.S.)
Plan an integrated, balanced statewide transportation system based on the prevailing principles: preserve the existing transportation infrastructure; enhance Florida’s economic competitiveness; and improve travel choices to ensure mobility.
Statutory Paraphrase: Department Program Objectives (Section 341.302, F.S.)
Improve rail safety and service.
Develop and implement a rail program of statewide application designed to assure proper maintenance, safety, revitalization and expansion of the Florida Rail System to ensure its continued and increased ability to respond to statewide mobility needs.
1-34
Florida Transportation Plan Goals:
• Safety and security for residents, visitors, and businesses.
• Agile, resilient, and quality infrastructure.
• Efficient and reliable mobility for people and freight.
• More transportation choices for people and freight.
• Transportation solutions that support Florida’s global economic competitiveness.
• Transportation solutions that support quality places to live, learn, work, and play.
• Transportation solutions that support Florida’s environment and conserve energy.
Florida Transportation Plan Objectives:
• Prevent transportation-related fatalities and serious injuries.
• Reduce the number of crashes on the transportation system.
• Prevent and mitigate transportation-related security risks.
• Meet or exceed industry, state, national, or international standards for infrastructure quality, condition, and performance for all modes of transportation.
• Optimize the functionality and efficiency of existing infrastructure and right-of-way.
• Reduce delays related to bottlenecks, gaps, and crashes and other incidents for all modes of Florida’s transportation system.
• Increase the reliability of all modes of Florida’s transportation system.
• Increase customer satisfaction with Florida’s transportation system and regulatory processes for residents, visitors, and businesses.
• Increase the efficiency of the supply chain for freight moving to, from, and through Florida.
• Increase the share of person trups using public transportation and other alternatives to single occupancy motor vehicles
• Increase the number of quality options for visitor travel to, from, and within Florida.
• Increase the number of quality options for moving freight to, from, and within Florida.
• Increase the efficiency and convenience of connecting between multiple modes of transportation.
• Provide transportation infrastructure and services to support job growth in transportation-dependent industries and clusters.
1-35
• Increase transportation connectivity between Florida’s economic centers and regions.
• Increase transportation connectivity between Florida and global and national trading partners and visitor origin markets.
• Plan and develop transportation systems that reflect regional and community values, visions, and needs.
• Increase customer satisfaction with Florida’s transportation system.
• Provide convenient, efficient accessibility to the transportation system for Florida’s residents and visitors.
• Provide transportation solutions that contribute to improved public health.
• Plan and develop transportation systems and facilities in a manner that protects, and where feasible, restores the function and character of the natural environment and avoids or minimizes adverse environmental impacts.
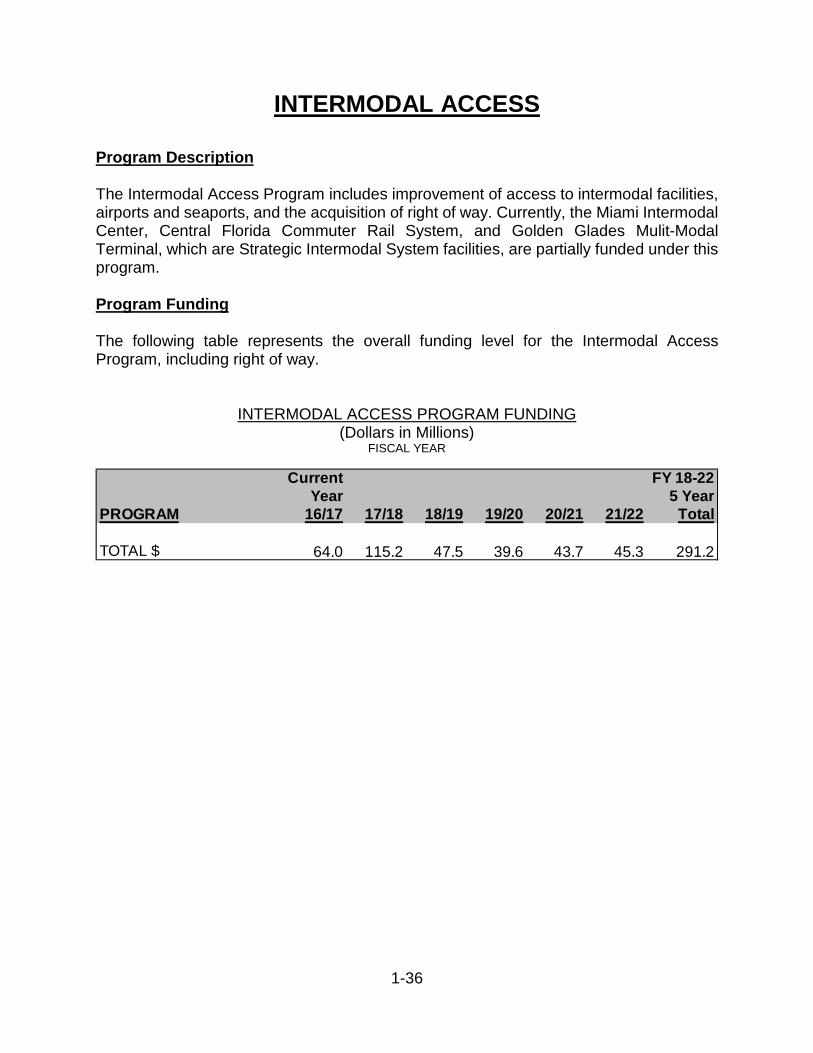
1-36
INTERMODAL ACCESS
Program Description
The Intermodal Access Program includes improvement of access to intermodal facilities, airports and seaports, and the acquisition of right of way. Currently, the Miami Intermodal Center, Central Florida Commuter Rail System, and Golden Glades Mulit-Modal Terminal, which are Strategic Intermodal System facilities, are partially funded under this program.
Program Funding
The following table represents the overall funding level for the Intermodal Access Program, including right of way.
INTERMODAL ACCESS PROGRAM FUNDING (Dollars in Millions)
FISCAL YEAR
Current FY 18-22Year 5 Year
PROGRAM 16/17 17/18 18/19 19/20 20/21 21/22 Total
TOTAL $ 64.0 115.2 47.5 39.6 43.7 45.3 291.2
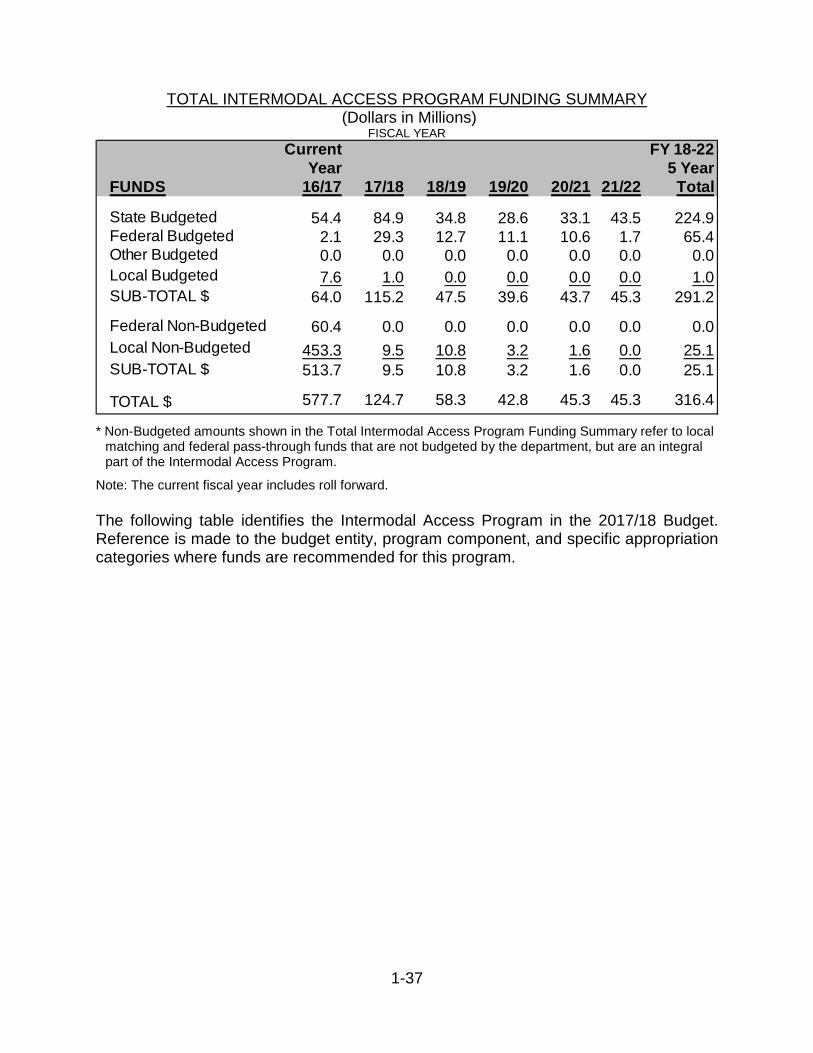
1-37
TOTAL INTERMODAL ACCESS PROGRAM FUNDING SUMMARY (Dollars in Millions)
FISCAL YEAR
* Non-Budgeted amounts shown in the Total Intermodal Access Program Funding Summary refer to local matching and federal pass-through funds that are not budgeted by the department, but are an integral part of the Intermodal Access Program.
Note: The current fiscal year includes roll forward.
The following table identifies the Intermodal Access Program in the 2017/18 Budget. Reference is made to the budget entity, program component, and specific appropriation categories where funds are recommended for this program.
Current FY 18-22Year 5 Year
FUNDS 16/17 17/18 18/19 19/20 20/21 21/22 Total
State Budgeted 54.4 84.9 34.8 28.6 33.1 43.5 224.9Federal Budgeted 2.1 29.3 12.7 11.1 10.6 1.7 65.4Other Budgeted 0.0 0.0 0.0 0.0 0.0 0.0 0.0
Local Budgeted 7.6 1.0 0.0 0.0 0.0 0.0 1.0SUB-TOTAL $ 64.0 115.2 47.5 39.6 43.7 45.3 291.2
Federal Non-Budgeted 60.4 0.0 0.0 0.0 0.0 0.0 0.0
Local Non-Budgeted 453.3 9.5 10.8 3.2 1.6 0.0 25.1SUB-TOTAL $ 513.7 9.5 10.8 3.2 1.6 0.0 25.1
TOTAL $ 577.7 124.7 58.3 42.8 45.3 45.3 316.4
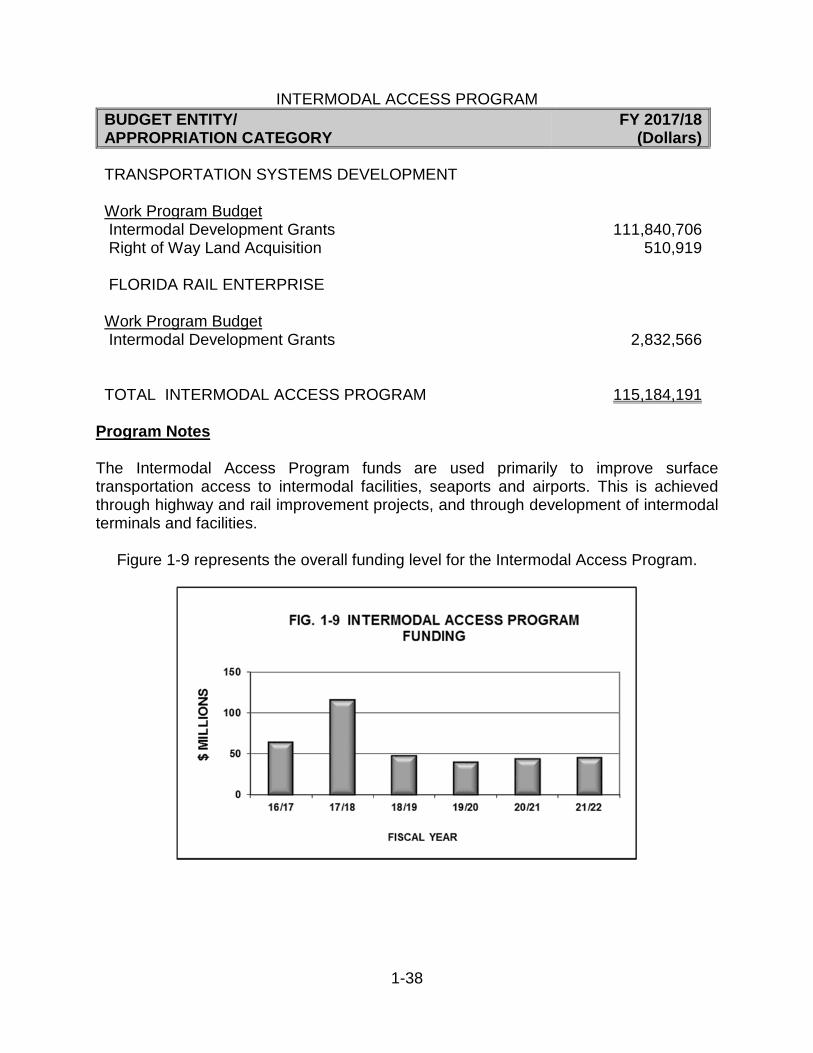
1-38
INTERMODAL ACCESS PROGRAM
BUDGET ENTITY/ APPROPRIATION CATEGORY
FY 2017/18(Dollars)
TRANSPORTATION SYSTEMS DEVELOPMENT
Work Program Budget Intermodal Development Grants Right of Way Land Acquisition
111,840,706510,919
FLORIDA RAIL ENTERPRISE
Work Program BudgetIntermodal Development Grants 2,832,566
TOTAL INTERMODAL ACCESS PROGRAM 115,184,191
Program Notes
The Intermodal Access Program funds are used primarily to improve surface transportation access to intermodal facilities, seaports and airports. This is achieved through highway and rail improvement projects, and through development of intermodal terminals and facilities.
Figure 1-9 represents the overall funding level for the Intermodal Access Program.
1-39
Primary Directives
Statutory Paraphrase: Department Program Objectives (Section 334.046, F.S.)
Planning an integrated, balanced statewide transportation system, preserving the existing transportation infrastructure; enhancing Florida’s economic competitiveness; and improving travel choices to ensure mobility.
Statutory Paraphrase: Department Program Objectives (Section 341.053, F.S.)
Implement Florida’s Intermodal Development Program to provide for major capital investments in fixed-guideway transportation systems, access to seaports, airports and other transportation terminals, providing for the construction of intermodal or multimodal terminals; and to otherwise facilitate the intermodal or multimodal movement of people and goods.
Florida Transportation Plan Goals:
• Agile, resilient, and quality infrastructure.
• Efficient and reliable mobility for people and freight.
• More transportation choices for people and freight.
• Transportation solutions that support Florida’s global economic competitiveness.
• Transportation solutions that support quality places to live, learn, work, and play.
• Transportation solutions that support Florida’s environment and conserve energy.
Florida Transportation Plan Objectives:
• Optimize the functionality and efficiency of existing infrastructure and right-of-way.
• Increase the reliability of all modes of Florida’s transportation system.
• Reduce delays related to bottlenecks, gaps, and crashes and other incidents for all modes of Florida’s transportation system.
• Increase customer satisfaction with Florida’s transportation system and regulatory processes for residents, visitors, and businesses.
• Increase the efficiency of the supply chain for freight moving to, from, and through Florida.
• Increase the share of person trips using public transportation and other alternatives to a single occupancy motor vehicle.
• Increase the number of quality options for visitor travel to, from, and within Florida.
• Increase the number of quality options for moving freight to, from, and within Florida.
1-40
• Increase the efficiency and convenience of connecting between multiple modes of transportation.
• Provide transportation infrastructure and services to support job growth in transportation-dependent industries and clusters.
• Increase transportation connectivity between Florida’s economic centers and regions.
• Increase transportation connectivity between Florida and global and national trading partners and visitor origin markets.
• Plan and develop transportation systems that reflect regional and community values, visions, and needs.
• Increase customer satisfaction with Florida’s transportation system.
• Provide convenient, efficient accessibility to the transportation system for Florida’s residents and visitors.
• Provide transportation solutions that contribute to improved public health.
• Plan and develop transportation systems and facilities in a manner that protects, and where feasible, restores the function and character of the natural environment and avoids or minimizes adverse environmental impacts.
• Decrease transportation-related air quality pollutants and greenhouse has emissions.
• Increase the energy efficiency of transportation.
1-41
SEAPORT DEVELOPMENT
Program Description
The Seaport Development Program provides funding for the development of public deep-water ports including such projects as security infrastructure and law enforcement measures, land acquisition, dredging, construction of storage facilities and terminals, and acquisition of container cranes and other equipment used in moving cargo and passengers.
The department provides $35 million in annual funding to repay three bond issues. Section 320.20, F.S., provided for two bond Issues; the 1996 bond program, of the Florida Ports Financing Commission, funded port capital improvements and security infrastructure improvements. The 1999 bond program funded port access improvements and security infrastructure improvements. Section 339.0801, F.S., provided a bond issue in FY 2013/14 for the purpose of funding seaport projects identified in the adopted work program and Seaport Investment Program.
Section 311.07, F.S., allocates a minimum of $25 million of annual funding to the Florida Seaport Transportation and Economic Development (FSTED) Council. The FSTED Council uses these funds to administer their program and allocate funding to individual seaport projects based on a process and criteria established in Florida Statutes.
Section 311.10, F.S., requires that at least $35 million in annual funding be allocated by Florida Department of Transportation (FDOT) to Seaport Strategic Investment Initiative (SPII) projects; this funding comes primarily from Strategic Intermodal System funds.
The above Seaport Programs provide for an annual minimum funding level of $60 million to support Seaport Development. Seaports can also receive additional FDOT funding from other sources including Strategic Intermodal System (SIS) funds, and funds provided directly from FDOT ‘District’ programs.
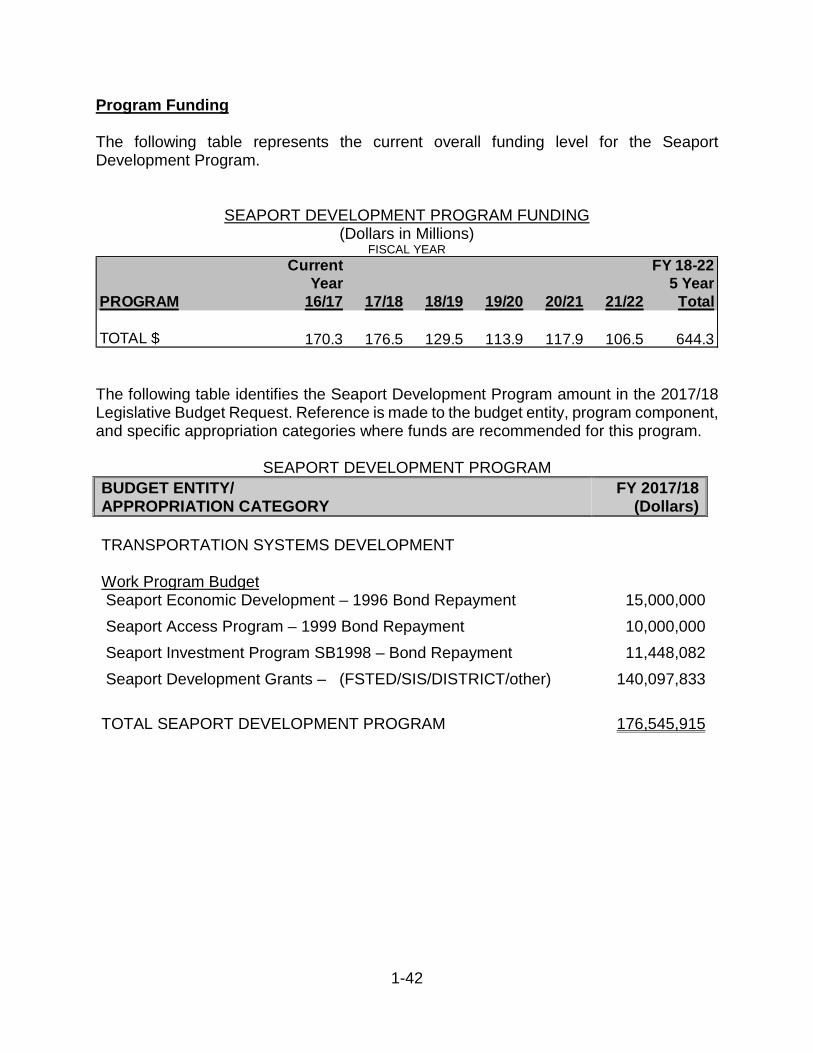
1-42
Program Funding
The following table represents the current overall funding level for the Seaport Development Program.
SEAPORT DEVELOPMENT PROGRAM FUNDING (Dollars in Millions)
FISCAL YEAR
The following table identifies the Seaport Development Program amount in the 2017/18 Legislative Budget Request. Reference is made to the budget entity, program component, and specific appropriation categories where funds are recommended for this program.
SEAPORT DEVELOPMENT PROGRAM
BUDGET ENTITY/ APPROPRIATION CATEGORY
FY 2017/18(Dollars)
TRANSPORTATION SYSTEMS DEVELOPMENT
Work Program Budget Seaport Economic Development – 1996 Bond Repayment 15,000,000
Seaport Access Program – 1999 Bond Repayment 10,000,000
Seaport Investment Program SB1998 – Bond Repayment
Seaport Development Grants – (FSTED/SIS/DISTRICT/other)
11,448,082
140,097,833
TOTAL SEAPORT DEVELOPMENT PROGRAM 176,545,915
Current FY 18-22Year 5 Year
PROGRAM 16/17 17/18 18/19 19/20 20/21 21/22 Total
TOTAL $ 170.3 176.5 129.5 113.9 117.9 106.5 644.3
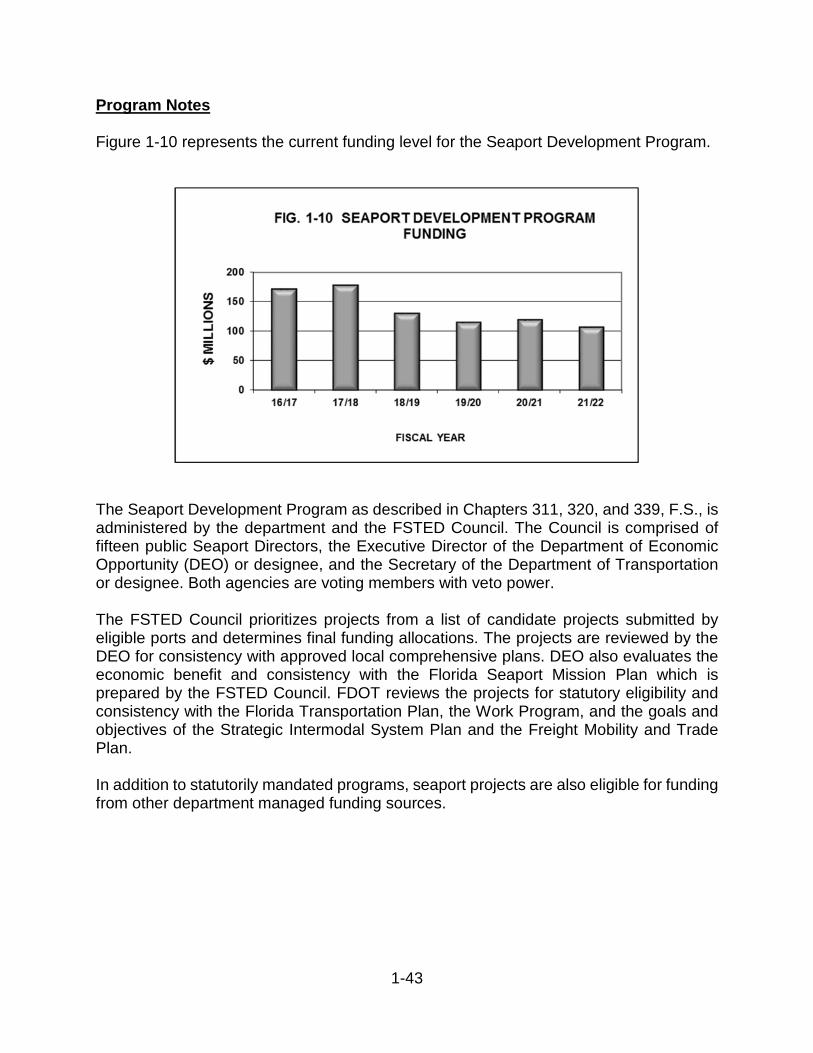
1-43
Program Notes
Figure 1-10 represents the current funding level for the Seaport Development Program.
The Seaport Development Program as described in Chapters 311, 320, and 339, F.S., is administered by the department and the FSTED Council. The Council is comprised of fifteen public Seaport Directors, the Executive Director of the Department of Economic Opportunity (DEO) or designee, and the Secretary of the Department of Transportation or designee. Both agencies are voting members with veto power.
The FSTED Council prioritizes projects from a list of candidate projects submitted by eligible ports and determines final funding allocations. The projects are reviewed by the DEO for consistency with approved local comprehensive plans. DEO also evaluates the economic benefit and consistency with the Florida Seaport Mission Plan which is prepared by the FSTED Council. FDOT reviews the projects for statutory eligibility and consistency with the Florida Transportation Plan, the Work Program, and the goals and objectives of the Strategic Intermodal System Plan and the Freight Mobility and Trade Plan.
In addition to statutorily mandated programs, seaport projects are also eligible for funding from other department managed funding sources.
1-44
Primary Directives
Statutory Paraphrase: Department Program Objectives (Sections 311.07, 311.09, 311.22, 320.20(3), 320.20(4), & 339.0801(1)(a), F. S.)
Implement the Florida Seaport Transportation and Economic Development Program.
Statutory Paraphrase: Program Objectives (Section 311.10, F.S.)
Department of Transportation shall work with the deepwater ports listed in s. 311.09 to develop and maintain a priority list of strategic investment projects. Project selection shall be based on projects that meet the state’s economic development goal of becoming a hub for trade, logistics, and export-oriented activities.
Statutory Paraphrase: Department Program Objectives (Section 334.046, F.S.)
Plan an integrated, balanced statewide transportation system based on the prevailing principles: preserving the existing transportation infrastructure; enhancing Florida’s economic competitiveness; and improving travel choices to ensure mobility.
Florida Transportation Plan Goals:
• Safety and security for residents, visitors, and businesses.
• Agile, resilient, and quality infrastructure.
• Efficient and reliable mobility for people and freight.
• More transportation choices for people and freight.
• Transportation solutions that support Florida’s global economic competitiveness.
• Transportation solutions that support quality places to live, learn, work, and play.
• Transportation solutions that support Florida’s environment and conserve energy.
Florida Transportation Plan Objectives:
• Prevent and mitigate transportation-related security risks.
• Meet or exceed industry, state, national, or international standards for infrastructure quality, condition, and performance for all modes of transportation.
• Optimize the functionality and efficiency of existing infrastructure and right-of-way.
• Reduce delays related to bottlenecks, gaps, and crashes and other incidents for all modes of Florida’s transportation system.
• Increase the reliability of all modes of Florida’s transportation system.
1-45
• Increase customer satisfaction with Florida’s transportation system and regulatory processes for residents, visitors, and businesses.
• Increase the efficiency of the supply chain for freight moving to, from, and through Florida.
• Increase the number of quality options for visitor travel to, from, and within Florida.
• Increase the number of quality options for moving freight to, from, and within Florida.
• Increase the efficiency and convenience of connecting between multiple modes of transportation.
• Provide transportation infrastructure and services to support job growth in transportation-dependent industries and clusters.
• Increase transportation connectivity between Florida’s economic centers and regions.
• Increase transportation connectivity between Florida and global and national trading partners and visitor origin markets.
• Plan and develop transportation systems that reflect regional and community values, visions, and needs.
• Increase customer satisfaction with Florida’s transportation system.
• Provide convenient, efficient accessibility to the transportation system for Florida’s residents and visitors.
• Provide transportation solutions that contribute to improved public health.
• Plan and develop transportation systems and facilities in a manner that protects, and where feasible, restores the function and character of the natural environment and avoids or minimizes adverse environmental impacts.
• Decrease transportation-related air quality pollutants and greenhouse gas emissions.
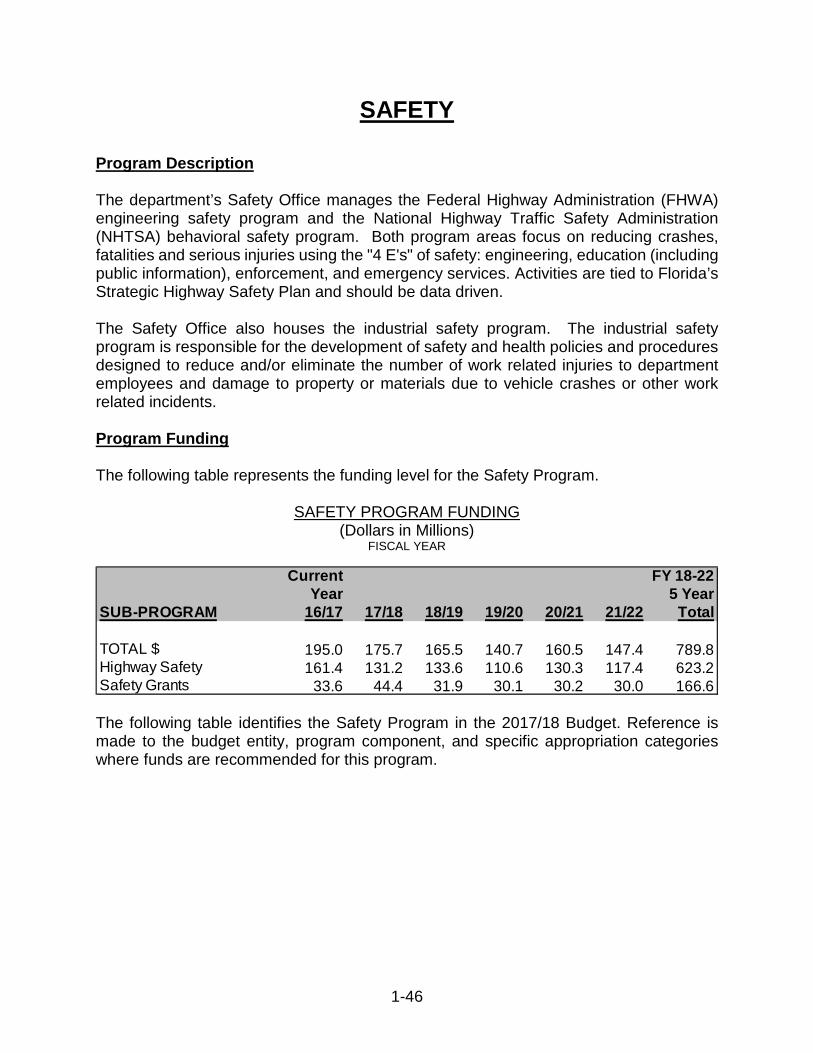
1-46
SAFETY
Program Description
The department’s Safety Office manages the Federal Highway Administration (FHWA) engineering safety program and the National Highway Traffic Safety Administration (NHTSA) behavioral safety program. Both program areas focus on reducing crashes, fatalities and serious injuries using the "4 E's" of safety: engineering, education (including public information), enforcement, and emergency services. Activities are tied to Florida’s Strategic Highway Safety Plan and should be data driven.
The Safety Office also houses the industrial safety program. The industrial safety program is responsible for the development of safety and health policies and procedures designed to reduce and/or eliminate the number of work related injuries to department employees and damage to property or materials due to vehicle crashes or other work related incidents.
Program Funding
The following table represents the funding level for the Safety Program.
SAFETY PROGRAM FUNDING (Dollars in Millions)
FISCAL YEAR
The following table identifies the Safety Program in the 2017/18 Budget. Reference is made to the budget entity, program component, and specific appropriation categories where funds are recommended for this program.
Current FY 18-22Year 5 Year
SUB-PROGRAM 16/17 17/18 18/19 19/20 20/21 21/22 Total
TOTAL $ 195.0 175.7 165.5 140.7 160.5 147.4 789.8Highway Safety 161.4 131.2 133.6 110.6 130.3 117.4 623.2Safety Grants 33.6 44.4 31.9 30.1 30.2 30.0 166.6
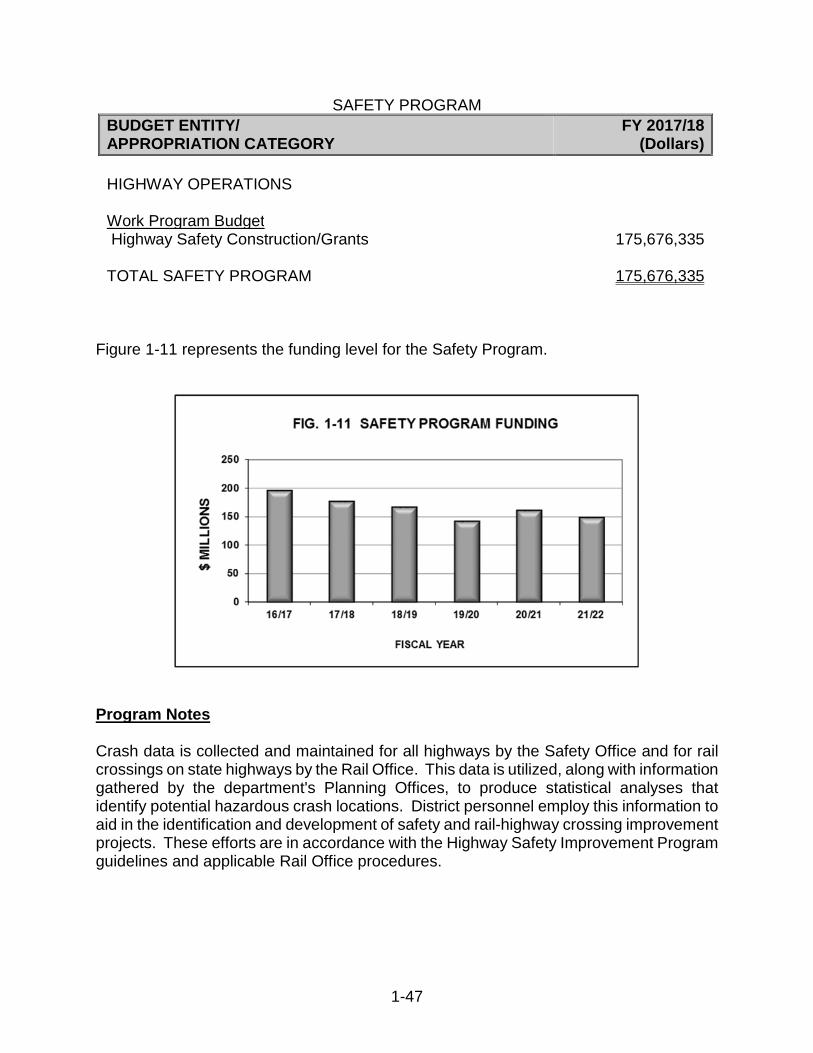
1-47
SAFETY PROGRAM
BUDGET ENTITY/ APPROPRIATION CATEGORY
FY 2017/18(Dollars)
HIGHWAY OPERATIONS
Work Program BudgetHighway Safety Construction/Grants 175,676,335
TOTAL SAFETY PROGRAM 175,676,335
Figure 1-11 represents the funding level for the Safety Program.
Program Notes
Crash data is collected and maintained for all highways by the Safety Office and for rail crossings on state highways by the Rail Office. This data is utilized, along with information gathered by the department's Planning Offices, to produce statistical analyses that identify potential hazardous crash locations. District personnel employ this information to aid in the identification and development of safety and rail-highway crossing improvement projects. These efforts are in accordance with the Highway Safety Improvement Program guidelines and applicable Rail Office procedures.
1-48
Primary Directives
Statutory Paraphrase: Statistical studies relating to traffic count and accidents. (Section 334.063, F.S.)
The department shall include in the criteria for the planning, construction, and maintenance of the State Highway System statistical studies of accidents and fatalities as well as traffic count.
Florida Transportation Plan Goals:
• Safety and security for residents, visitors, and businesses.
• Efficient and reliable mobility for people and freight.
• Transportation solutions that support quality places to live, learn, work, and play.
Florida Transportation Plan Objectives:
• Prevent transportation-related fatalities and serious injuries.
• Reduce the number of crashes on the transportation system.
• Reduce delays related to bottlenecks, gaps, and crashes and other incidents for all modes of Florida’s transportation system.
• Increase customer satisfaction with Florida’s transportation system.
• Provide transportation solutions that contribute to improved public health.
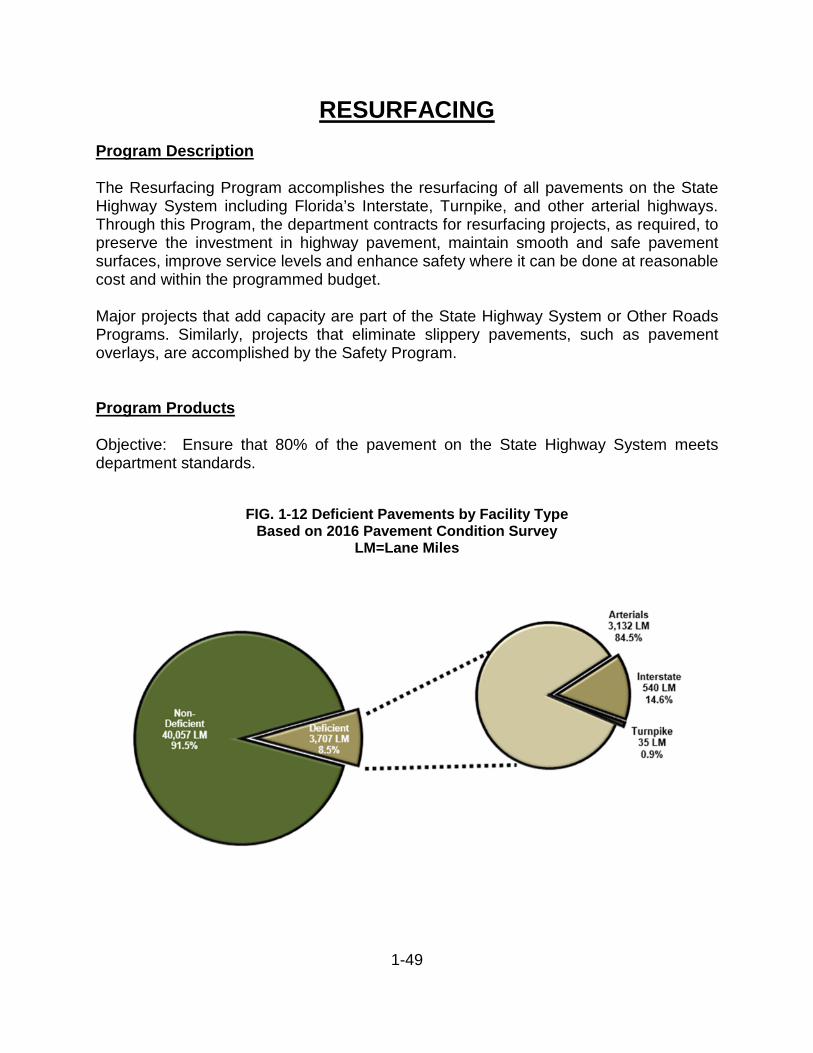
1-49
RESURFACING
Program Description
The Resurfacing Program accomplishes the resurfacing of all pavements on the State Highway System including Florida’s Interstate, Turnpike, and other arterial highways. Through this Program, the department contracts for resurfacing projects, as required, to preserve the investment in highway pavement, maintain smooth and safe pavement surfaces, improve service levels and enhance safety where it can be done at reasonable cost and within the programmed budget.
Major projects that add capacity are part of the State Highway System or Other Roads Programs. Similarly, projects that eliminate slippery pavements, such as pavement overlays, are accomplished by the Safety Program.
Program Products
Objective: Ensure that 80% of the pavement on the State Highway System meets department standards.
FIG. 1-12 Deficient Pavements by Facility Type Based on 2016 Pavement Condition Survey
LM=Lane Miles
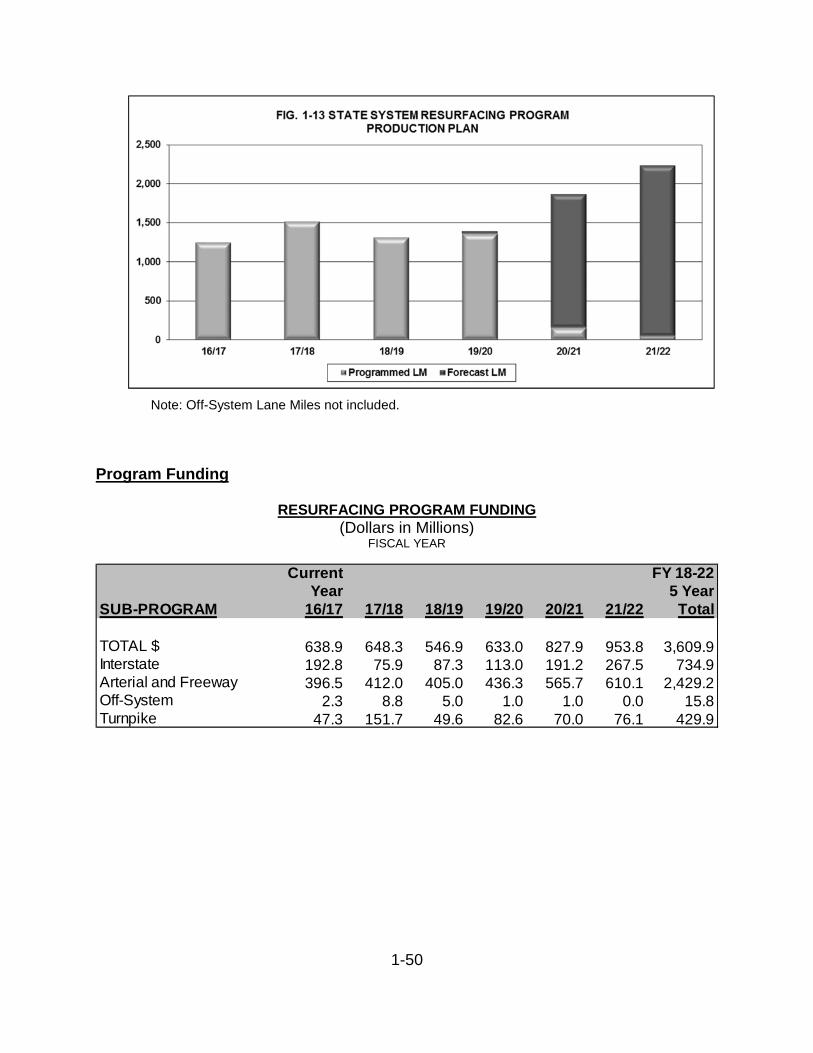
1-50
Note: Off-System Lane Miles not included.
Program Funding
RESURFACING PROGRAM FUNDING (Dollars in Millions)
FISCAL YEAR
Current FY 18-22Year 5 Year
SUB-PROGRAM 16/17 17/18 18/19 19/20 20/21 21/22 Total
TOTAL $ 638.9 648.3 546.9 633.0 827.9 953.8 3,609.9Interstate 192.8 75.9 87.3 113.0 191.2 267.5 734.9Arterial and Freeway 396.5 412.0 405.0 436.3 565.7 610.1 2,429.2Off-System 2.3 8.8 5.0 1.0 1.0 0.0 15.8Turnpike 47.3 151.7 49.6 82.6 70.0 76.1 429.9
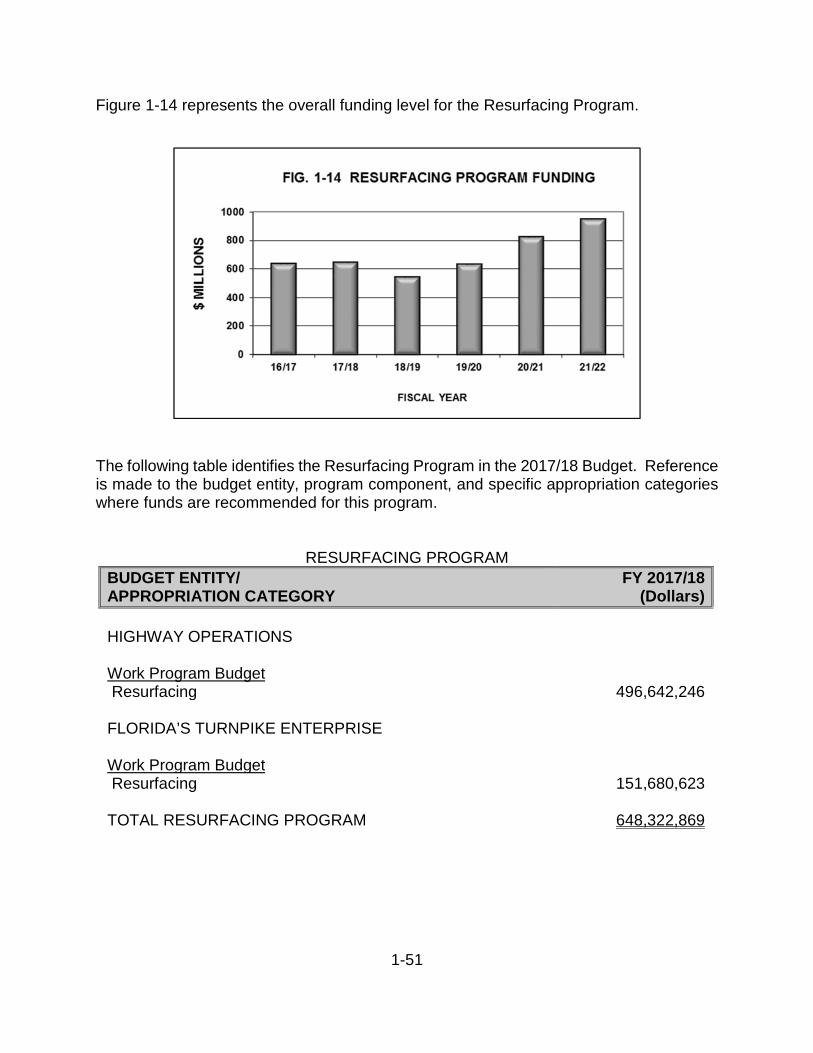
1-51
Figure 1-14 represents the overall funding level for the Resurfacing Program.
The following table identifies the Resurfacing Program in the 2017/18 Budget. Reference is made to the budget entity, program component, and specific appropriation categories where funds are recommended for this program.
RESURFACING PROGRAM
BUDGET ENTITY/ APPROPRIATION CATEGORY
FY 2017/18(Dollars)
HIGHWAY OPERATIONS
Work Program BudgetResurfacing 496,642,246
FLORIDA’S TURNPIKE ENTERPRISE
Work Program BudgetResurfacing 151,680,623
TOTAL RESURFACING PROGRAM 648,322,869
1-52
Program Notes
The condition of Florida pavements is measured annually through the Pavement Condition Survey conducted by the Pavement Evaluation Section of the State Materials Office in Gainesville. Pavements are rated on a scale of 0 to 10 (with 10 being the best) in each of three criteria: ride smoothness, pavement cracking and wheel path rutting.
Ride smoothness and wheel path rutting are measured mechanically using lasers. Pavement cracking is measured by visual observation by experienced survey crews using a consistent methodology. The condition rating scales were set by a statewide committee of pavement engineers, so that a pavement segment receiving a rating of six or less in any of the three rating criteria is designated a deficient pavement segment. An exception is observed in urban areas where the legal speed limit is less than or equal to 45 miles per hour; the ride rating must be 5.4 or less to cause the pavement to be judged deficient due to ride.
Primary Directives
Statutory Paraphrase: Department Program Objectives (Section 334.046, F.S.)
Plan an integrated, balanced statewide transportation system based on the prevailing principles: preserving the existing transportation infrastructure; enhancing Florida’s economic competitiveness; and improving travel choices to ensure mobility. Preservation includes...Ensuring that 80 percent of pavement on the State Highway System meets department standards.
Florida Transportation Plan Goals:
• Safety and security for residents, visitors, and businesses.
• Agile, resilient, and quality transportation infrastructure.
• Transportation solutions that support quality places to live, learn, work, and play.
Florida Transportation Plan Objectives:
• Prevent transportation-related fatalities and serious injuries.
• Reduce the number of crashes on the transportation system.
• Meet or exceed industry, state, national, or international standards for infrastructure quality, condition, and performance for all modes of transportation.
• Increase the resiliency of infrastructure to risks, including extreme weather and other environmental conditions.
• Increase customer satisfaction with Florida’s transportation system.
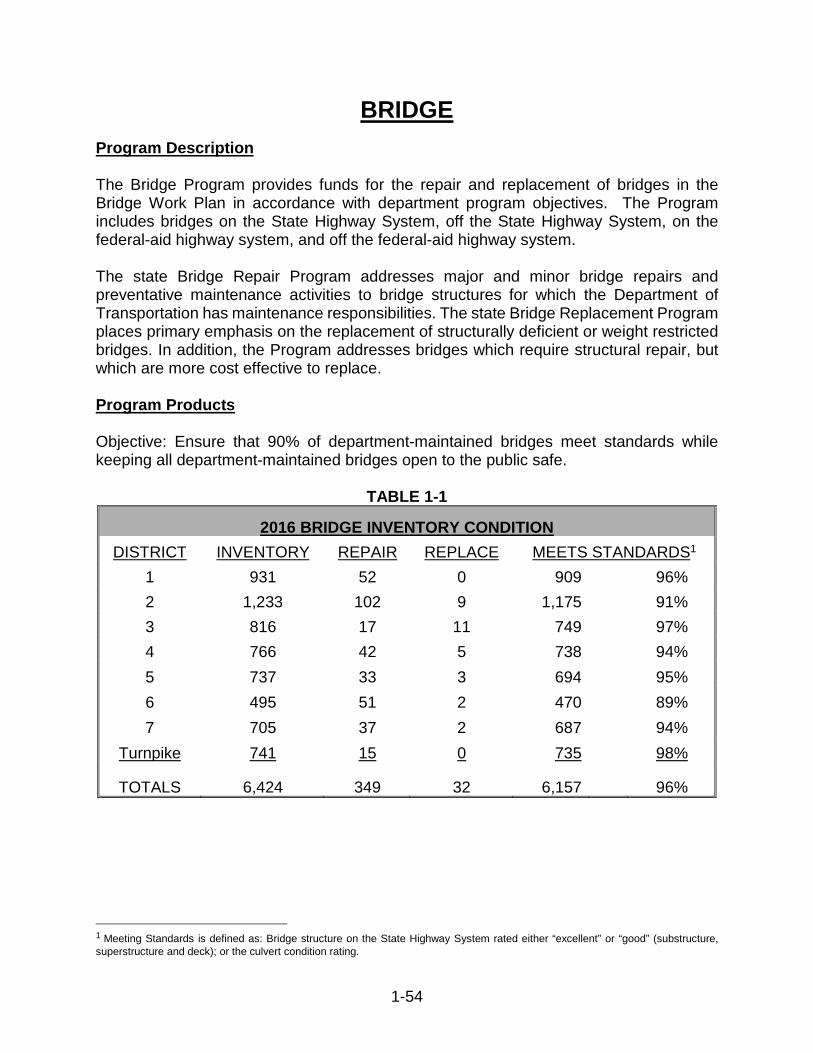
1-54
BRIDGE
Program Description
The Bridge Program provides funds for the repair and replacement of bridges in the Bridge Work Plan in accordance with department program objectives. The Program includes bridges on the State Highway System, off the State Highway System, on the federal-aid highway system, and off the federal-aid highway system.
The state Bridge Repair Program addresses major and minor bridge repairs and preventative maintenance activities to bridge structures for which the Department of Transportation has maintenance responsibilities. The state Bridge Replacement Program places primary emphasis on the replacement of structurally deficient or weight restricted bridges. In addition, the Program addresses bridges which require structural repair, but which are more cost effective to replace.
Program Products
Objective: Ensure that 90% of department-maintained bridges meet standards while keeping all department-maintained bridges open to the public safe.
TABLE 1-1
2016 BRIDGE INVENTORY CONDITION
DISTRICT INVENTORY REPAIR REPLACE MEETS STANDARDS1
1 931 52 0 909 96%
2 1,233 102 9 1,175 91%
3 816 17 11 749 97%
4 766 42 5 738 94%
5 737 33 3 694 95%
6 495 51 2 470 89%
7 705 37 2 687 94%
Turnpike 741 15 0 735 98%
TOTALS 6,424 349 32 6,157 96%
1 Meeting Standards is defined as: Bridge structure on the State Highway System rated either “excellent” or “good” (substructure, superstructure and deck); or the culvert condition rating.
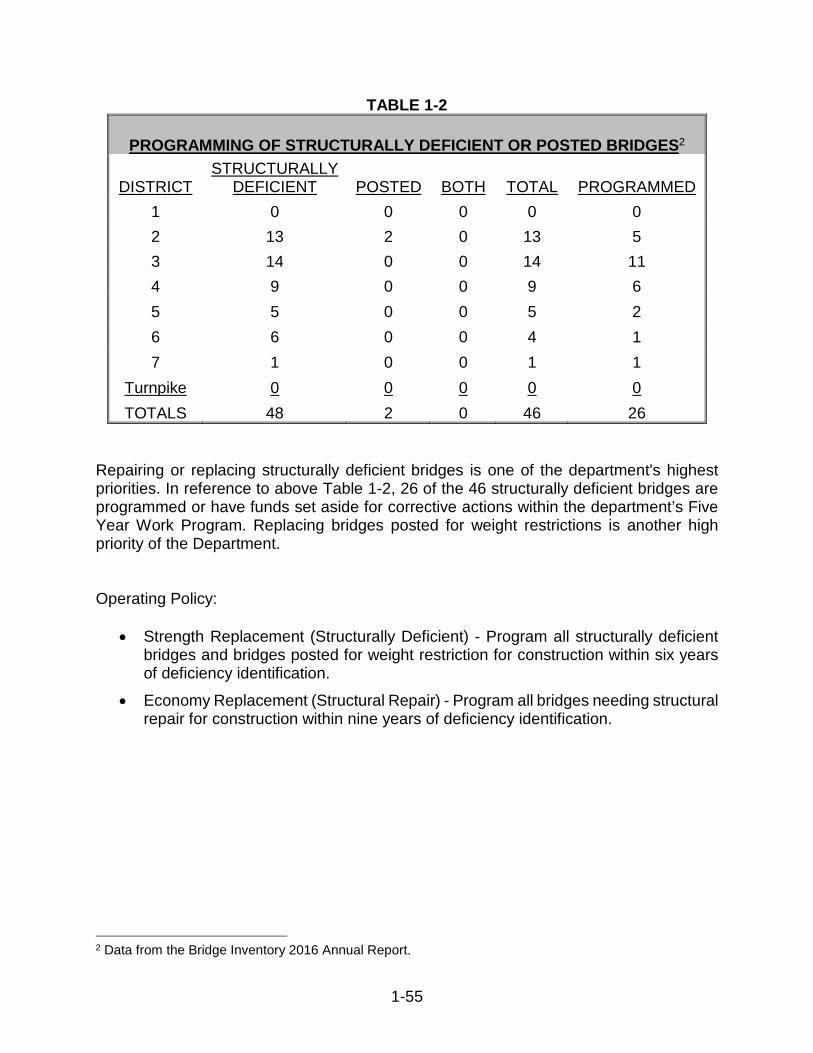
1-55
TABLE 1-2
PROGRAMMING OF STRUCTURALLY DEFICIENT OR POSTED BRIDGES2
DISTRICTSTRUCTURALLY
DEFICIENT POSTED BOTH TOTAL PROGRAMMED
1 0 0 0 0 0
2 13 2 0 13 5
3 14 0 0 14 11
4 9 0 0 9 6
5 5 0 0 5 2
6 6 0 0 4 1
7 1 0 0 1 1
Turnpike 0 0 0 0 0
TOTALS 48 2 0 46 26
Repairing or replacing structurally deficient bridges is one of the department's highest priorities. In reference to above Table 1-2, 26 of the 46 structurally deficient bridges are programmed or have funds set aside for corrective actions within the department’s Five Year Work Program. Replacing bridges posted for weight restrictions is another high priority of the Department.
Operating Policy:
• Strength Replacement (Structurally Deficient) - Program all structurally deficient bridges and bridges posted for weight restriction for construction within six years of deficiency identification.
• Economy Replacement (Structural Repair) - Program all bridges needing structural repair for construction within nine years of deficiency identification.
2 Data from the Bridge Inventory 2016 Annual Report.
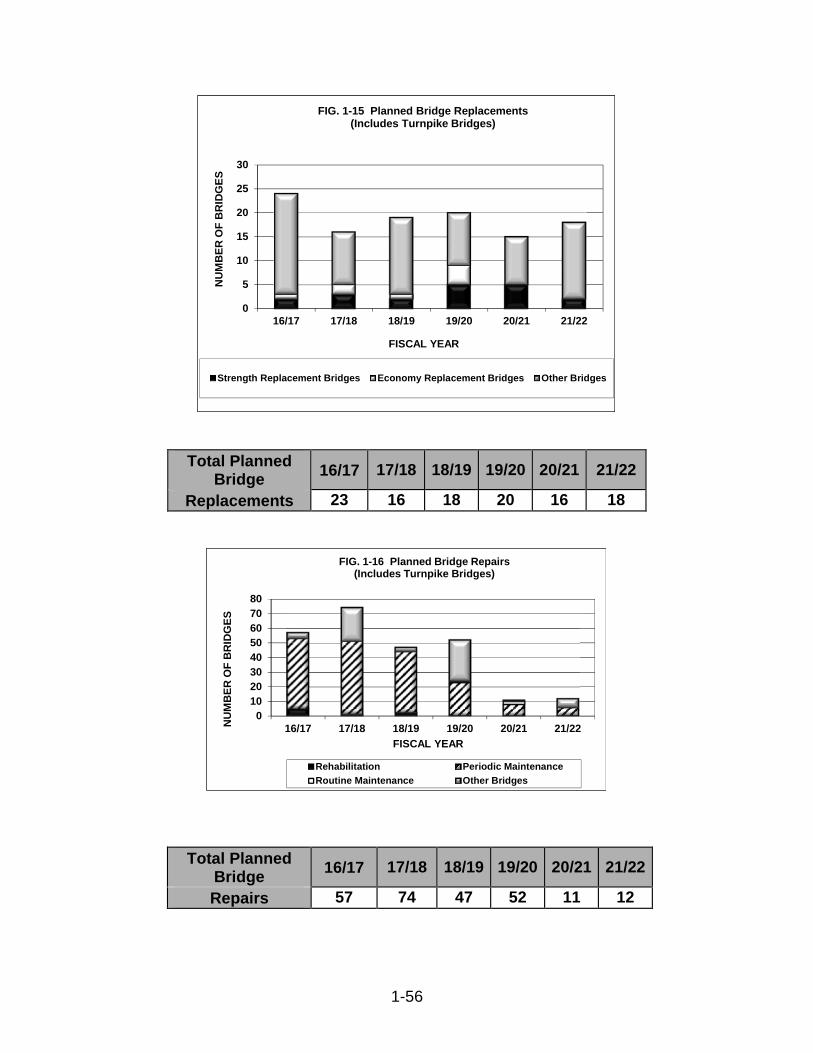
1-56
Total Planned Bridge
16/17 17/18 18/19 19/20 20/21 21/22
Replacements 23 16 18 20 16 18
Total Planned Bridge
16/17 17/18 18/19 19/20 20/21 21/22
Repairs 57 74 47 52 11 12
0
5
10
15
20
25
30
16/17 17/18 18/19 19/20 20/21 21/22
NU
MB
ER
OF
BR
IDG
ES
FISCAL YEAR
FIG. 1-15 Planned Bridge Replacements (Includes Turnpike Bridges)
Strength Replacement Bridges Economy Replacement Bridges Other Bridges
0
10
20
30
40
50
60
70
80
16/17 17/18 18/19 19/20 20/21 21/22NU
MB
ER
OF
BR
IDG
ES
FISCAL YEAR
FIG. 1-16 Planned Bridge Repairs(Includes Turnpike Bridges)
Rehabilitation Periodic Maintenance
Routine Maintenance Other Bridges
1-57
Program Funding
The department’s policies for funding bridge replacements are as follows:
• Bridges on the State Highway System (SHS) and on the Federal-Aid Highway System (FHS) – Projects will be funded using state, federal and/or bond funds. Strength Replacement (Structurally Deficient) bridges will be programmed for construction within six (6) years of deficiency identification. Economy replacement (Structural Repair) bridges will be programmed for construction within nine (9) years of deficiency identification.
• Bridges on the SHS and off the FHS – Projects will be funded using state and/or bond funds. Strength Replacement (Structurally Deficient) bridges will be programmed for construction within six (6) years of deficiency identification. Economy Replacement (Structural Repair) bridges will be programmed for construction within nine (9) years of deficiency identification.
• Bridges off the SHS and on the FHS – Projects will be funded using federal and/or local funds.
o Up to $15 million in federal funds are set-aside annually for replacement and rehabilitation projects which have been prioritized for funding on the statewide local bridge replacement ranking formula listing. Below are the policies for use of the $15 million set-aside.
Bridges in Rural Areas of Opportunity or in counties eligible for SCOP or SCRAP will be funded 100% from the set-aside with no match required. Once a programmed project is eligible, it will remain eligible.
For bridges that do not qualify for the above funding, all phases (excluding in-house phases) are to be split 75% Federal (from the set-aside) and 25% owner up to a total cost of $5 million (limiting federal participation on each bridge to $3.75 million). This limitation excludes in-house phases. If a design phase is programmed 100% owner, the amount above 25% will be credited towards their match required for the other phases.
Bridges on toll roads do not qualify for funding under this program.
Exception requests may be directed to the Chief Engineer for consideration by the Secretary.
o Other district managed federal funds may be used to fund bridges which are not funded with the $15 million set-aside with the approval from central office Work Program Development and Operations Office.
1-58
• Bridges off the SHS and off FHS - Title 23 United States Code, Section 133, requires an amount not less than 15 percent of the State’s FY 2009 Highway Bridge Program apportionment be set-aside. These funds are allocated on a statewide basis using the ACBZ/BRTZ fund code. First priority for funds will be bridge inspection programs. The department will use any remaining funds for replacement and rehabilitation projects prioritized for funding on the statewide local bridge replacement ranking formula listing.
o Below are the policies for use of the federal funds which are set-aside for this purpose.
Bridges in Rural Areas of Opportunity or in counties eligible for SCOP or SCRAP will be funded 100% from the set-aside with no match required. Once a programmed project is eligible, it will remain eligible.
For bridges that do not qualify for the above funding, the engineering costs will be the owners responsibility. All other phases (excluding in-house phases) are to be split 75% Federal (from the set-aside) and 25% owner up to a total cost of $5 million (limiting federal participation on each bridge to $3.75 million). This limitation excludes in-house phases. If a design phase is programmed 100% owner, the amount above 25% will be credited towards their match required for the other phases.
Bridges on toll roads do not qualify for funding under this program.
Exception requests may be directed to the Chief Engineer for consideration by the Secretary.
• Other district managed federal funds may be used to fund bridges which are not funded with the set-aside with the approval from central office Work Program Development and Operations Office. However, this would be an extreme circumstance and the district should be prepared to explain why district managed federal funds are being used to cover what should be the responsibility of the local government which owns the bridge.
Structurally deficient bridges off the State Highway System are classified by the Federal Highway Administration definition. Local bridges are included in the Local Government Deficient Bridge List.
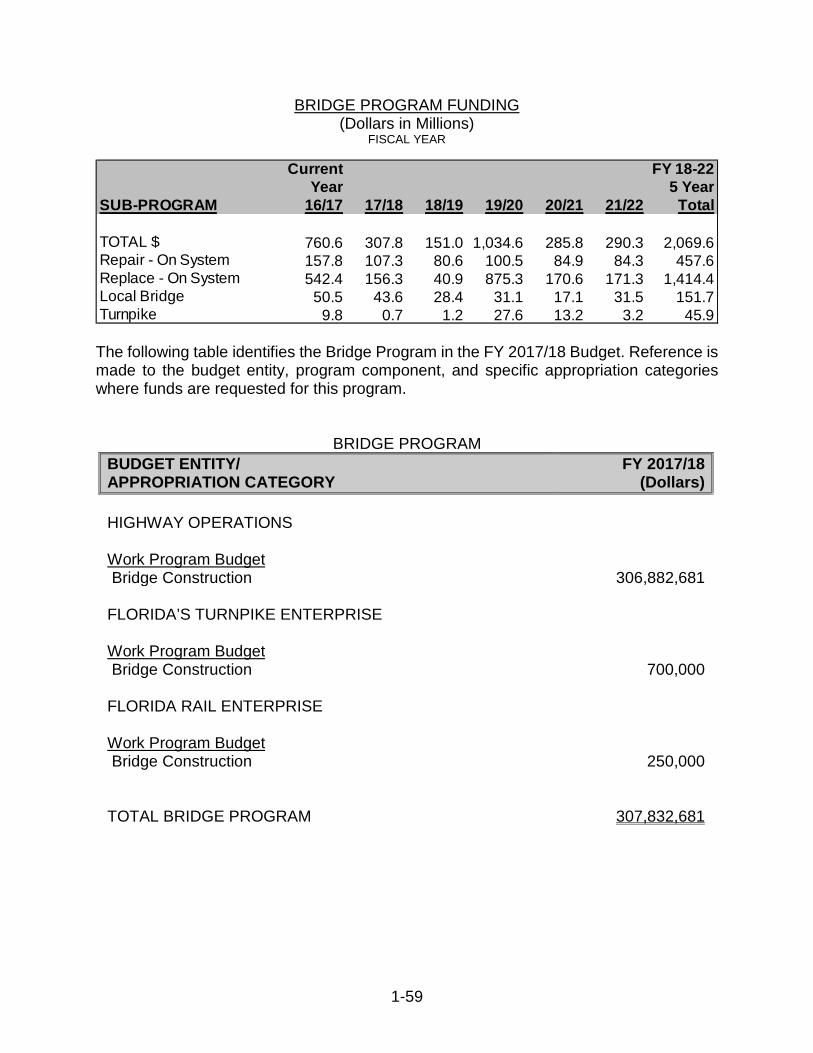
1-59
BRIDGE PROGRAM FUNDING (Dollars in Millions)
FISCAL YEAR
The following table identifies the Bridge Program in the FY 2017/18 Budget. Reference is made to the budget entity, program component, and specific appropriation categories where funds are requested for this program.
BRIDGE PROGRAM
BUDGET ENTITY/ APPROPRIATION CATEGORY
FY 2017/18(Dollars)
HIGHWAY OPERATIONS
Work Program BudgetBridge Construction 306,882,681
FLORIDA’S TURNPIKE ENTERPRISE
Work Program BudgetBridge Construction 700,000
FLORIDA RAIL ENTERPRISE
Work Program Budget Bridge Construction 250,000
TOTAL BRIDGE PROGRAM 307,832,681
Current FY 18-22Year 5 Year
SUB-PROGRAM 16/17 17/18 18/19 19/20 20/21 21/22 Total
TOTAL $ 760.6 307.8 151.0 1,034.6 285.8 290.3 2,069.6Repair - On System 157.8 107.3 80.6 100.5 84.9 84.3 457.6Replace - On System 542.4 156.3 40.9 875.3 170.6 171.3 1,414.4Local Bridge 50.5 43.6 28.4 31.1 17.1 31.5 151.7Turnpike 9.8 0.7 1.2 27.6 13.2 3.2 45.9
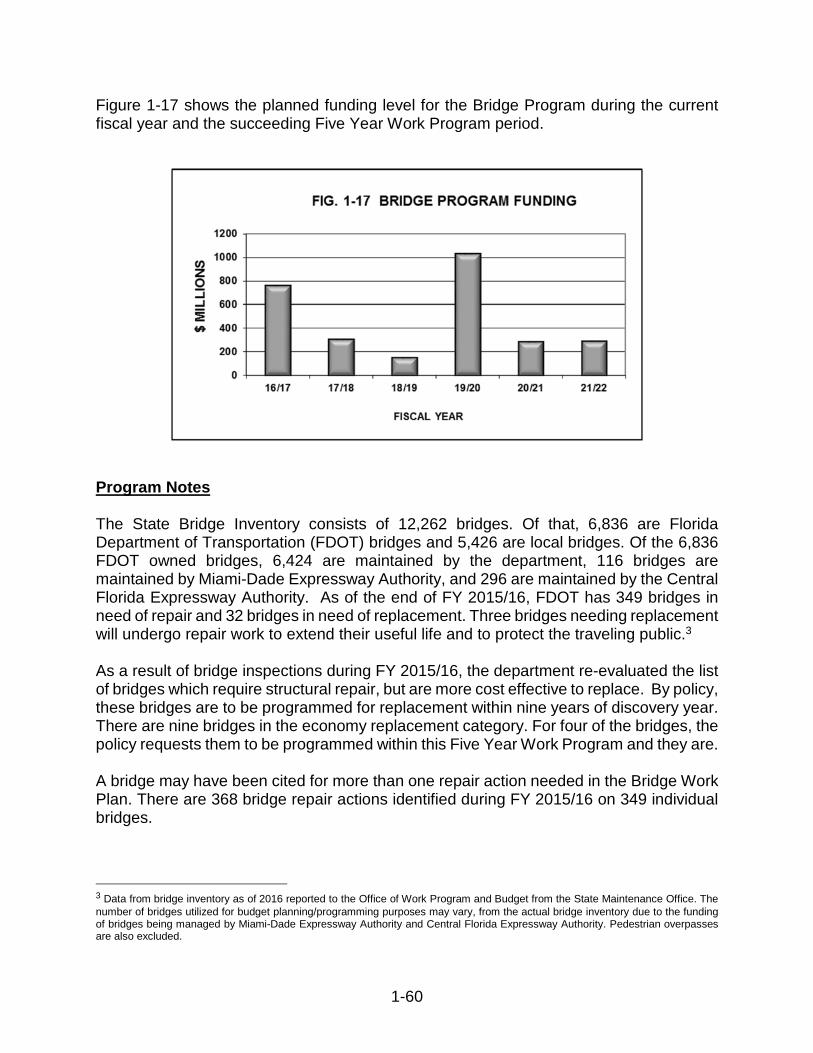
1-60
Figure 1-17 shows the planned funding level for the Bridge Program during the current fiscal year and the succeeding Five Year Work Program period.
Program Notes
The State Bridge Inventory consists of 12,262 bridges. Of that, 6,836 are Florida Department of Transportation (FDOT) bridges and 5,426 are local bridges. Of the 6,836 FDOT owned bridges, 6,424 are maintained by the department, 116 bridges are maintained by Miami-Dade Expressway Authority, and 296 are maintained by the Central Florida Expressway Authority. As of the end of FY 2015/16, FDOT has 349 bridges in need of repair and 32 bridges in need of replacement. Three bridges needing replacement will undergo repair work to extend their useful life and to protect the traveling public.3
As a result of bridge inspections during FY 2015/16, the department re-evaluated the list of bridges which require structural repair, but are more cost effective to replace. By policy, these bridges are to be programmed for replacement within nine years of discovery year. There are nine bridges in the economy replacement category. For four of the bridges, the policy requests them to be programmed within this Five Year Work Program and they are.
A bridge may have been cited for more than one repair action needed in the Bridge Work Plan. There are 368 bridge repair actions identified during FY 2015/16 on 349 individual bridges.
3 Data from bridge inventory as of 2016 reported to the Office of Work Program and Budget from the State Maintenance Office. The number of bridges utilized for budget planning/programming purposes may vary, from the actual bridge inventory due to the funding of bridges being managed by Miami-Dade Expressway Authority and Central Florida Expressway Authority. Pedestrian overpasses are also excluded.
1-61
There are currently 48 bridges of the 6,424 bridges on the State Highway System that are considered structurally deficient and in need of repair. Twenty-Six of the 48 structurally deficient bridges are programmed in the Five Year Work Program.4
Primary Directives
Statutory Paraphrase: Department Program Objectives (Section 334.046, F.S.)
Plan an integrated, balanced statewide transportation system based on the prevailing principles: preserving the existing transportation infrastructure; enhancing Florida’s economic competitiveness; and improving travel choices to ensure mobility. Preservation includes...Ensuring that 90 percent of department-maintained bridges meet department standards.
Florida Transportation Plan Goals:
• Safety and security for residents, visitors, and businesses.
• Agile, resilient, and quality transportation infrastructure.
• Transportation solutions that support quality places to live, learn, work, and play.
Florida Transportation Plan Objectives:
• Prevent transportation-related fatalities and serious injuries.
• Meet or exceed industry, state, national, or international standards for infrastructure quality, condition, and performance for all modes of transportation.
• Optimize the functionality and efficiency of existing infrastructure and right-of-way. • Adapt transportation infrastructure and technologies to meet changing customer
needs. • Increase the resiliency of infrastructure to risks, including extreme weather and
other environmental conditions.
• Increase customer satisfaction with Florida’s transportation system.
4 Data from bridge inventory as of 2016 reported to the Office of Work Program and Budget from the State Maintenance Office. The number of bridges utilized for budget planning/programming purposes may vary, from the actual bridge inventory due to the funding of bridges being managed by Miami-Dade Expressway Authority and Orlando-Orange County Expressway Authority. Pedestrian overpasses are also excluded.
1-62
Bridge Replacement Program Operating Policies are:
1. FDOT maintained bridges meeting one of the following conditions will qualify for replacement. Bridges to be replaced under these conditions are listed on the Bridge Work Plan developed by the Office of Maintenance:
▪ “Strength Replacement” bridges are identified as either (1) structurally deficient that cannot be repaired, or (2) posted for weight restrictions.
▪ “Economy Replacement” bridges are others which require structural repair but which are more cost effective to replace.
2. Program all deficient bridges having a “Strength Replacement” qualifying definition for construction within six years of deficiency identification.
3. Program all deficient bridges having an “Economy Replacement” qualifying definition for construction within nine years of deficiency identification.
4. Deficient bridges scheduled for replacement will continue to be monitored and interim repairs made if necessary to safeguard the traveling public.
5. Allow, by exception, certain bridges identified as deficient but not to be programmed for replacement.
6. Within funds available, permit the replacement of a bridge which is classified functionally obsolete when (a) documented history of crashes attributed to the structure exists, or (b) when the bridge is a major bridge (costing more than $10 million) and it is of regional significance or it is situated within a capacity improvement corridor.
Bridge Repair Program Operating Policies are:
1. Deficient bridges needing repair should originate from the annual Bridge Work Plan developed by the Office of Maintenance and will be identified by one of the following Qualifying Definitions:
▪ “Rehabilitation” - To rebuild bridge to current design standards. Activities include: strengthening a bridge to increase its load carrying capacity, deck replacement, deck rehabilitation, or superstructure rehabilitation.
▪ “Periodic Maintenance” - To restore bridge to original condition. Activities include: moveable rebuild, deck major repair, superstructure or substructure major repair, paint system replacement, deck joint replacement, deck/slab overlay, scour countermeasures, or fender repair/replacement.
1-63
▪ “Routine Maintenance” - Maintenance and repair activities that are prescheduled. Activities include: deck joint maintenance and repair, deck maintenance and repair, railing maintenance and repair, superstructure maintenance and repair, substructure maintenance and repair, channel maintenance and repair, electrical maintenance and repair, mechanical maintenance and repair, or movable structural maintenance and repair.
2. Program all structurally deficient bridges needing repair for construction within six years of deficiency identification.
3. Program all bridges needing repair for construction at the earliest date within funds available.
4. Actually monitor trend of number of bridges identified as needing repair to determine adequacy of funding.
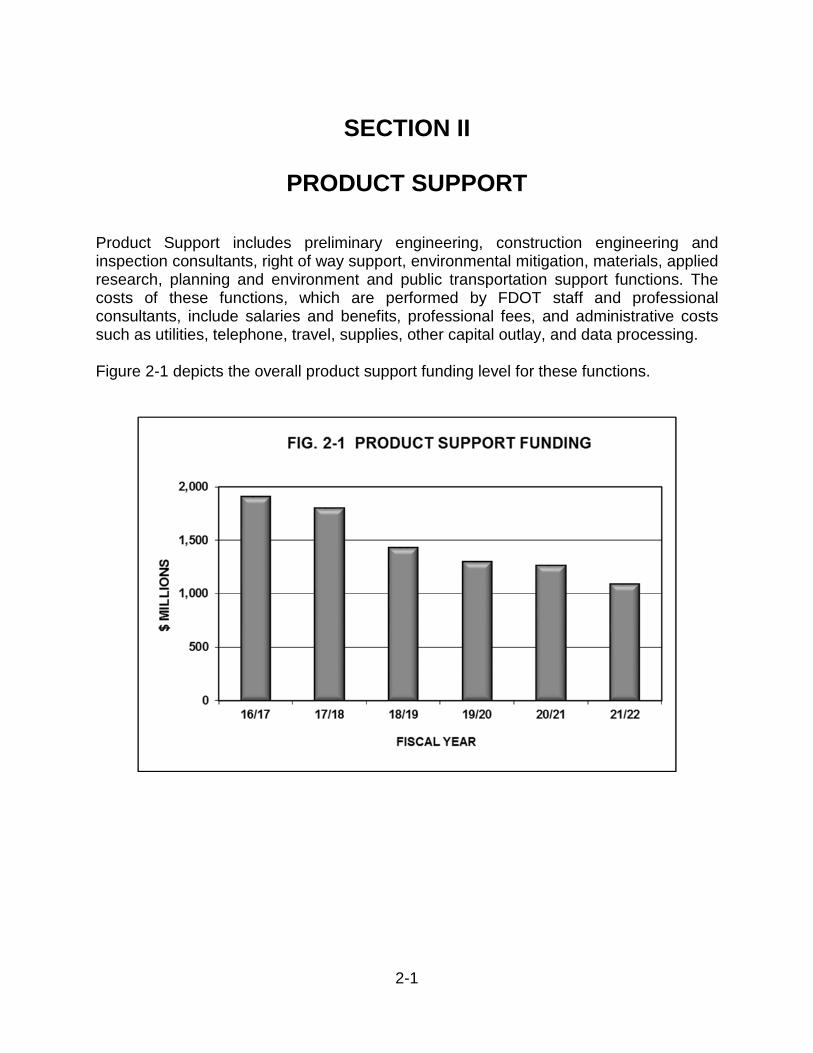
2-1
SECTION II
PRODUCT SUPPORT
Product Support includes preliminary engineering, construction engineering and inspection consultants, right of way support, environmental mitigation, materials, applied research, planning and environment and public transportation support functions. The costs of these functions, which are performed by FDOT staff and professional consultants, include salaries and benefits, professional fees, and administrative costs such as utilities, telephone, travel, supplies, other capital outlay, and data processing.
Figure 2-1 depicts the overall product support funding level for these functions.
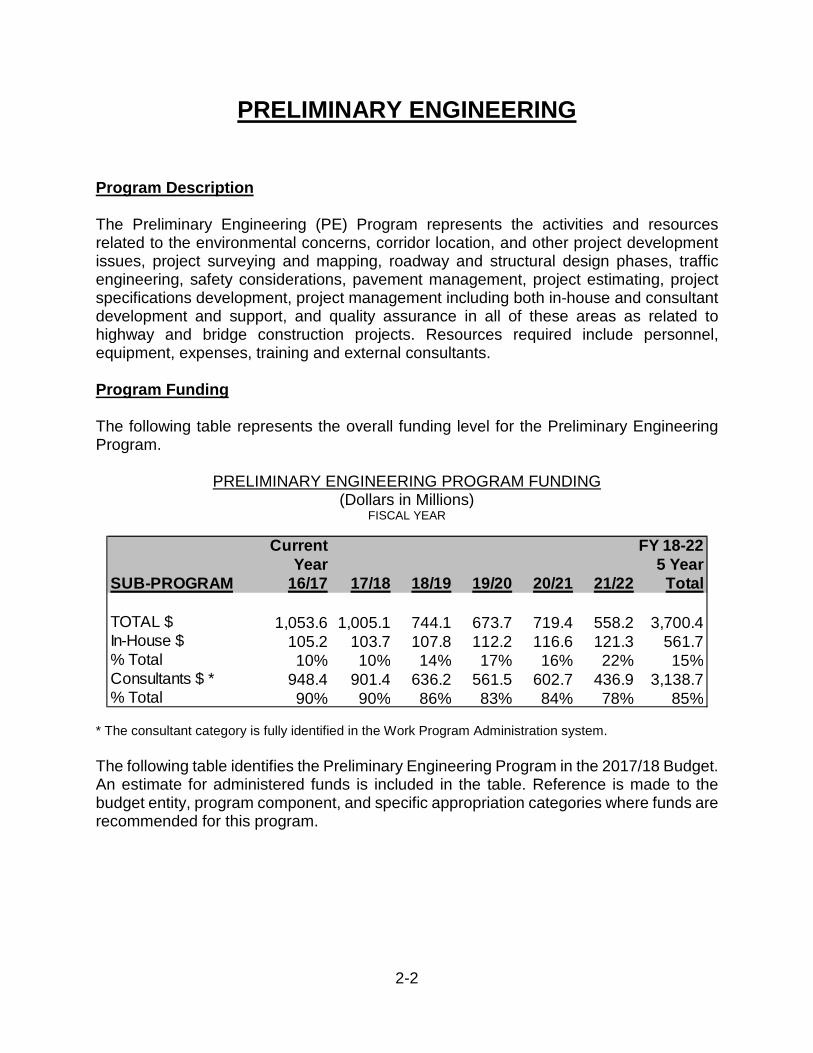
2-2
PRELIMINARY ENGINEERING
Program Description
The Preliminary Engineering (PE) Program represents the activities and resources related to the environmental concerns, corridor location, and other project development issues, project surveying and mapping, roadway and structural design phases, traffic engineering, safety considerations, pavement management, project estimating, project specifications development, project management including both in-house and consultant development and support, and quality assurance in all of these areas as related to highway and bridge construction projects. Resources required include personnel, equipment, expenses, training and external consultants.
Program Funding
The following table represents the overall funding level for the Preliminary Engineering Program.
PRELIMINARY ENGINEERING PROGRAM FUNDING (Dollars in Millions)
FISCAL YEAR
* The consultant category is fully identified in the Work Program Administration system.
The following table identifies the Preliminary Engineering Program in the 2017/18 Budget. An estimate for administered funds is included in the table. Reference is made to the budget entity, program component, and specific appropriation categories where funds are recommended for this program.
Current FY 18-22Year 5 Year
SUB-PROGRAM 16/17 17/18 18/19 19/20 20/21 21/22 Total
TOTAL $ 1,053.6 1,005.1 744.1 673.7 719.4 558.2 3,700.4In-House $ 105.2 103.7 107.8 112.2 116.6 121.3 561.7% Total 10% 10% 14% 17% 16% 22% 15%Consultants $ * 948.4 901.4 636.2 561.5 602.7 436.9 3,138.7% Total 90% 90% 86% 83% 84% 78% 85%
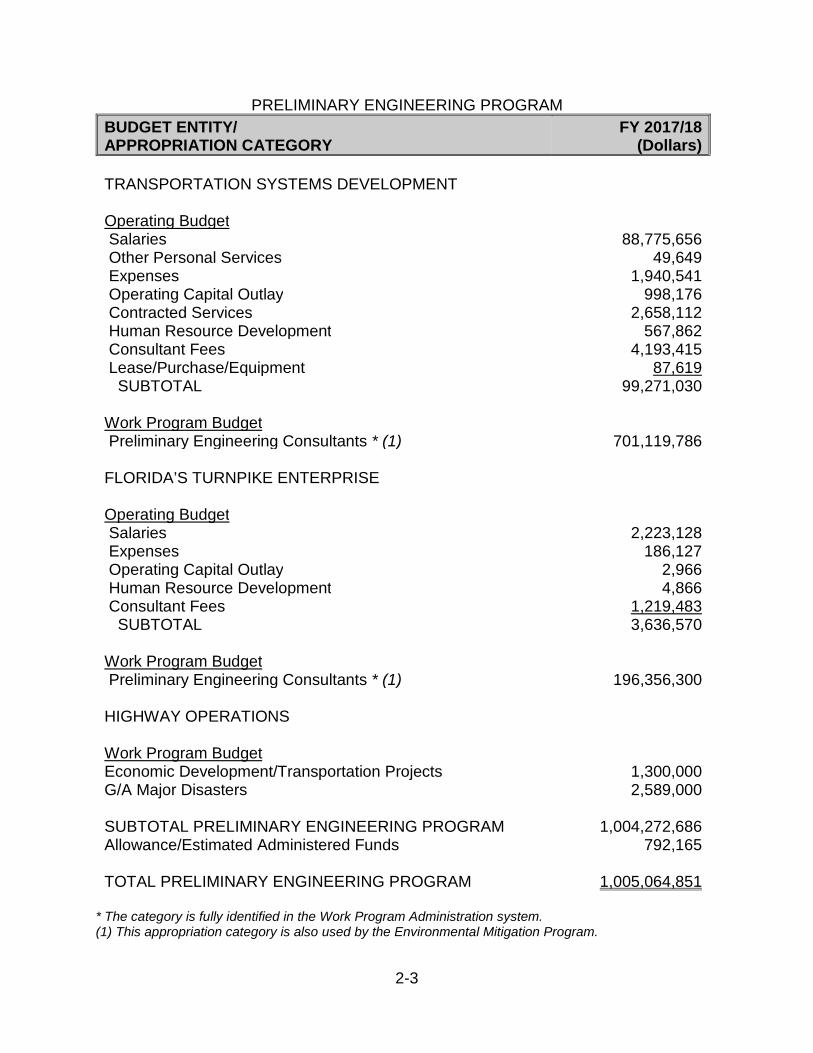
2-3
PRELIMINARY ENGINEERING PROGRAM
BUDGET ENTITY/ APPROPRIATION CATEGORY
FY 2017/18(Dollars)
TRANSPORTATION SYSTEMS DEVELOPMENT
Operating BudgetSalaries 88,775,656Other Personal Services 49,649Expenses 1,940,541Operating Capital Outlay 998,176Contracted Services 2,658,112Human Resource Development 567,862Consultant Fees 4,193,415Lease/Purchase/Equipment 87,619
SUBTOTAL 99,271,030
Work Program BudgetPreliminary Engineering Consultants * (1) 701,119,786
FLORIDA’S TURNPIKE ENTERPRISE
Operating BudgetSalaries 2,223,128Expenses 186,127Operating Capital Outlay 2,966Human Resource Development 4,866Consultant Fees 1,219,483
SUBTOTAL 3,636,570
Work Program BudgetPreliminary Engineering Consultants * (1) 196,356,300
HIGHWAY OPERATIONS
Work Program Budget Economic Development/Transportation Projects G/A Major Disasters
SUBTOTAL PRELIMINARY ENGINEERING PROGRAM
1,300,0002,589,000
1,004,272,686Allowance/Estimated Administered Funds 792,165
TOTAL PRELIMINARY ENGINEERING PROGRAM 1,005,064,851
* The category is fully identified in the Work Program Administration system.(1) This appropriation category is also used by the Environmental Mitigation Program.
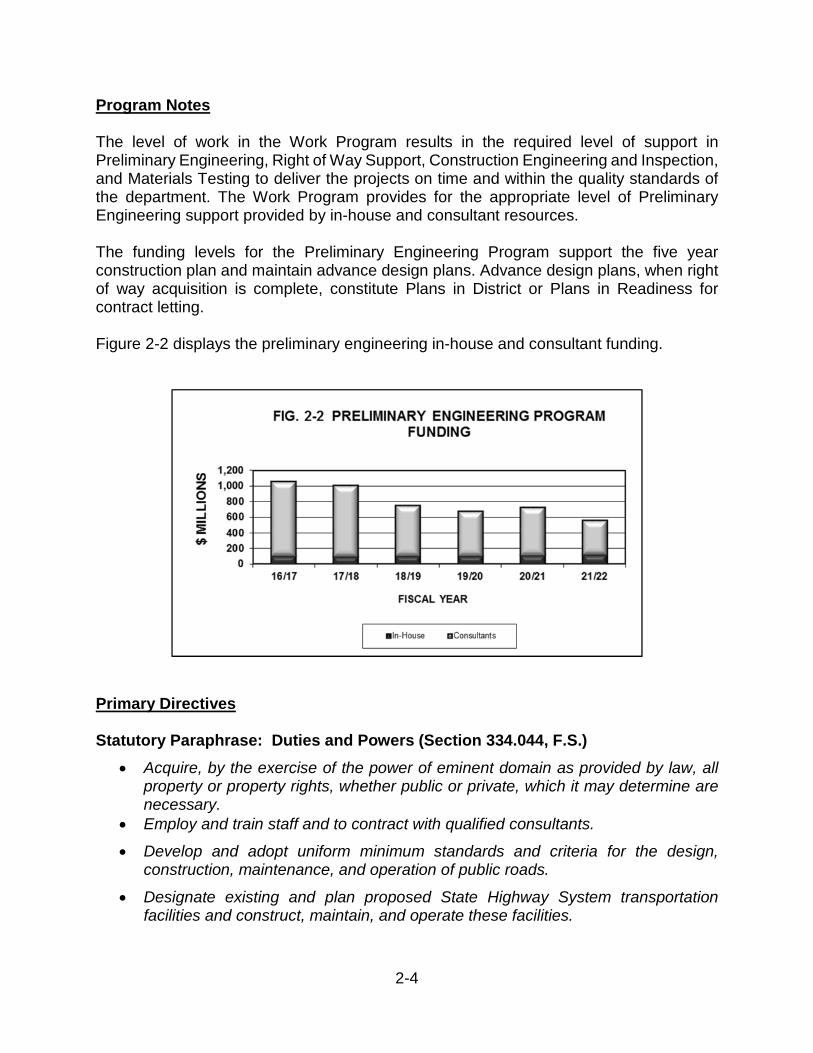
2-4
Program Notes
The level of work in the Work Program results in the required level of support in Preliminary Engineering, Right of Way Support, Construction Engineering and Inspection, and Materials Testing to deliver the projects on time and within the quality standards of the department. The Work Program provides for the appropriate level of Preliminary Engineering support provided by in-house and consultant resources.
The funding levels for the Preliminary Engineering Program support the five year construction plan and maintain advance design plans. Advance design plans, when right of way acquisition is complete, constitute Plans in District or Plans in Readiness for contract letting.
Figure 2-2 displays the preliminary engineering in-house and consultant funding.
Primary Directives
Statutory Paraphrase: Duties and Powers (Section 334.044, F.S.)
• Acquire, by the exercise of the power of eminent domain as provided by law, all property or property rights, whether public or private, which it may determine are necessary.
• Employ and train staff and to contract with qualified consultants.
• Develop and adopt uniform minimum standards and criteria for the design, construction, maintenance, and operation of public roads.
• Designate existing and plan proposed State Highway System transportation facilities and construct, maintain, and operate these facilities.
2-5
• Establish and control ingress and egress points on the State Highway System as necessary to ensure safe and efficient operation.
• Designate limited access facilities on the State Highway System; plan, construct, maintain, and operate service roads in connection with such facilities.
• To establish and maintain bicycle and pedestrian ways.
• To conduct research studies, and to collect data necessary for the improvement of the state transportation system.
• To conduct research and demonstration projects relative to innovative transportation technologies.
• To provide for the conservation of natural roadside growth and scenery and for the implementation and maintenance of roadside beautification programs.
Florida Transportation Plan Goals:
• Safety and security for residents, visitors, and businesses.
• Agile, resilient, and quality infrastructure.
• Efficient and reliable mobility for people and freight.
• More transportation choices for people and freight.
• Transportation solutions that support quality places to live, learn, work, and play.
• Transportation solutions that support Florida’s environment and conserve energy.
Florida Transportation Plan Objectives:
• Meet or exceed industry, state, national, or international standards for infrastructure quality, condition, and performance for all modes of transportation.
• Plan and develop transportation systems and facilities in a manner that protects, and where feasible, restores the function and character of the natural environment and avoids or minimizes adverse environmental impacts.
• Plan and develop transportation systems that reflect regional and community values, visions, and needs.
• Optimize the functionality and efficiency of existing infrastructure and right-of-way.
• Increase the resiliency of infrastructure to risks, including extreme weather and other environmental conditions.
• Adapt transportation infrastructure and technologies to meet changing customer needs.
• Prevent transportation-related fatalities and serious injuries.

2-6
• Reduce the number of crashes on the transportation system.
• Reduce delays related to bottlenecks, gaps, and crashes and other incidents for all modes of Florida’s transportation system.
• Provide transportation infrastructure and services to help prepare for, respond to, and recover from emergencies.
• Increase the use of new mobility options and technologies such as share, automated, and connected vehicles.
• Increase the efficiency and convenience of connecting between multiple modes of transportation.
• Increase customer satisfaction with Florida’s transportation system.
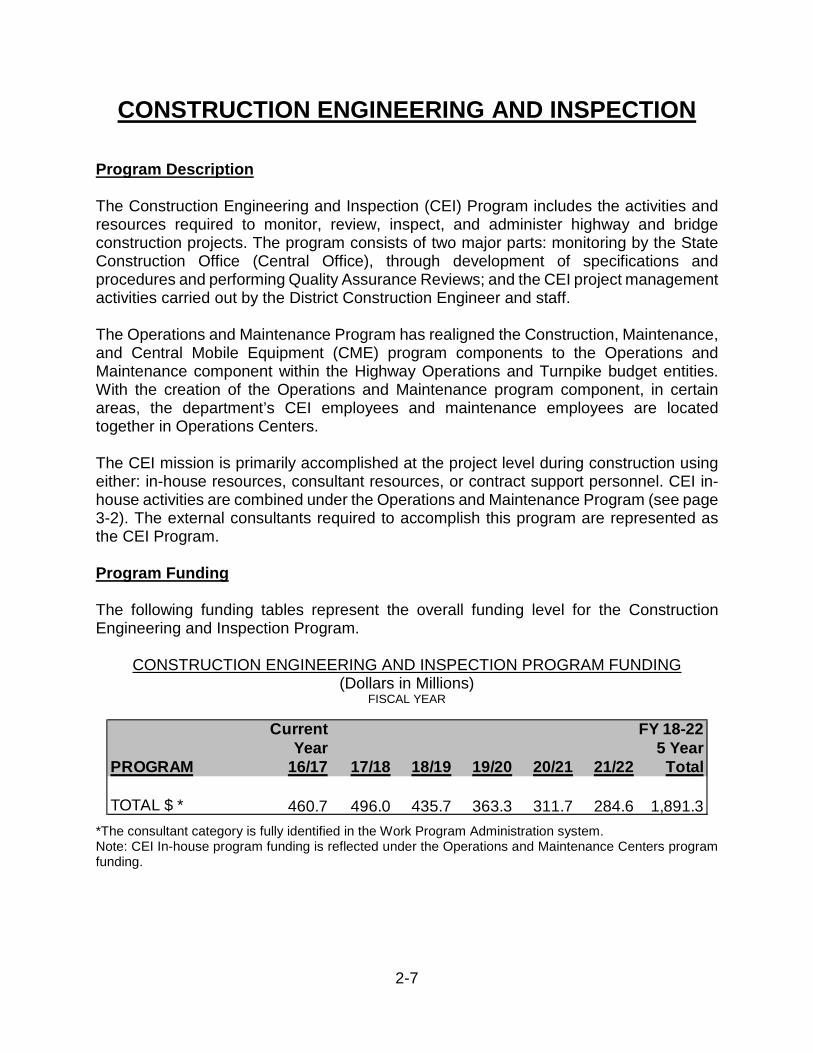
2-7
CONSTRUCTION ENGINEERING AND INSPECTION
Program Description
The Construction Engineering and Inspection (CEI) Program includes the activities and resources required to monitor, review, inspect, and administer highway and bridge construction projects. The program consists of two major parts: monitoring by the State Construction Office (Central Office), through development of specifications and procedures and performing Quality Assurance Reviews; and the CEI project management activities carried out by the District Construction Engineer and staff.
The Operations and Maintenance Program has realigned the Construction, Maintenance, and Central Mobile Equipment (CME) program components to the Operations and Maintenance component within the Highway Operations and Turnpike budget entities. With the creation of the Operations and Maintenance program component, in certain areas, the department’s CEI employees and maintenance employees are located together in Operations Centers.
The CEI mission is primarily accomplished at the project level during construction using either: in-house resources, consultant resources, or contract support personnel. CEI in-house activities are combined under the Operations and Maintenance Program (see page 3-2). The external consultants required to accomplish this program are represented as the CEI Program.
Program Funding
The following funding tables represent the overall funding level for the Construction Engineering and Inspection Program.
CONSTRUCTION ENGINEERING AND INSPECTION PROGRAM FUNDING (Dollars in Millions)
FISCAL YEAR
*The consultant category is fully identified in the Work Program Administration system.Note: CEI In-house program funding is reflected under the Operations and Maintenance Centers program funding.
Current FY 18-22Year 5 Year
PROGRAM 16/17 17/18 18/19 19/20 20/21 21/22 Total
TOTAL $ * 460.7 496.0 435.7 363.3 311.7 284.6 1,891.3
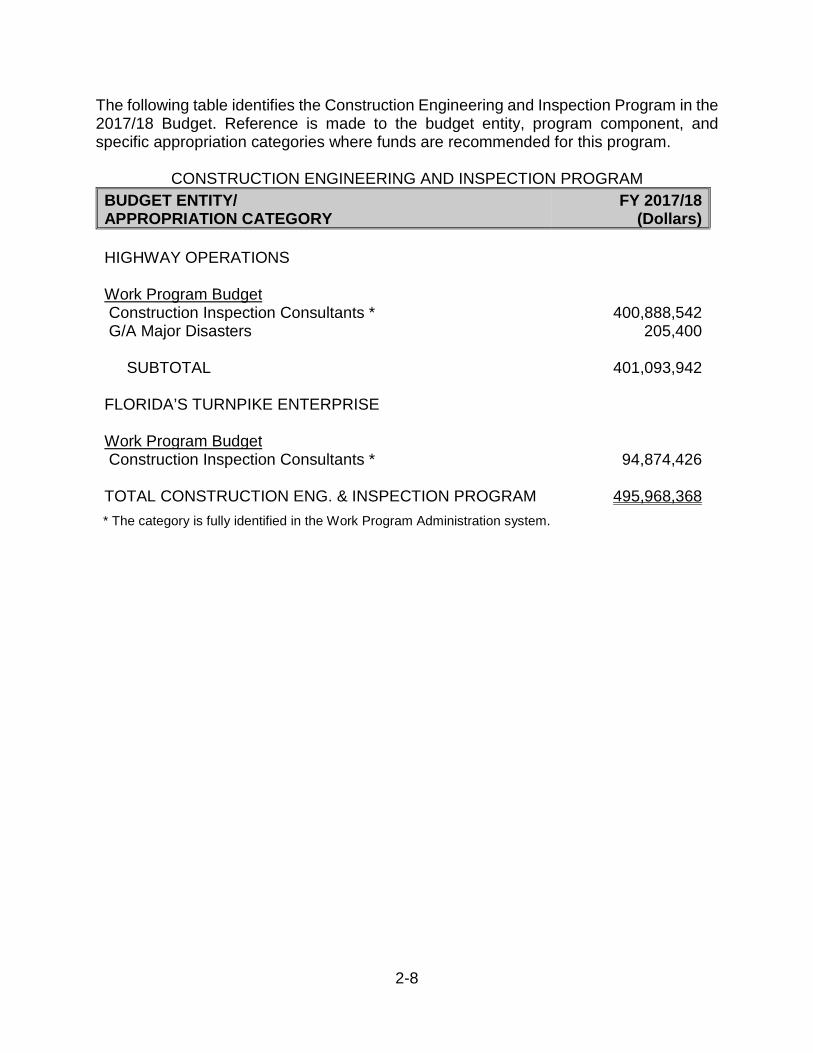
2-8
The following table identifies the Construction Engineering and Inspection Program in the 2017/18 Budget. Reference is made to the budget entity, program component, and specific appropriation categories where funds are recommended for this program.
CONSTRUCTION ENGINEERING AND INSPECTION PROGRAM
BUDGET ENTITY/ APPROPRIATION CATEGORY
FY 2017/18(Dollars)
HIGHWAY OPERATIONS
Work Program BudgetConstruction Inspection Consultants * 400,888,542
G/A Major Disasters
SUBTOTAL
205,400
401,093,942
FLORIDA’S TURNPIKE ENTERPRISE
Work Program BudgetConstruction Inspection Consultants * 94,874,426
TOTAL CONSTRUCTION ENG. & INSPECTION PROGRAM 495,968,368
* The category is fully identified in the Work Program Administration system.
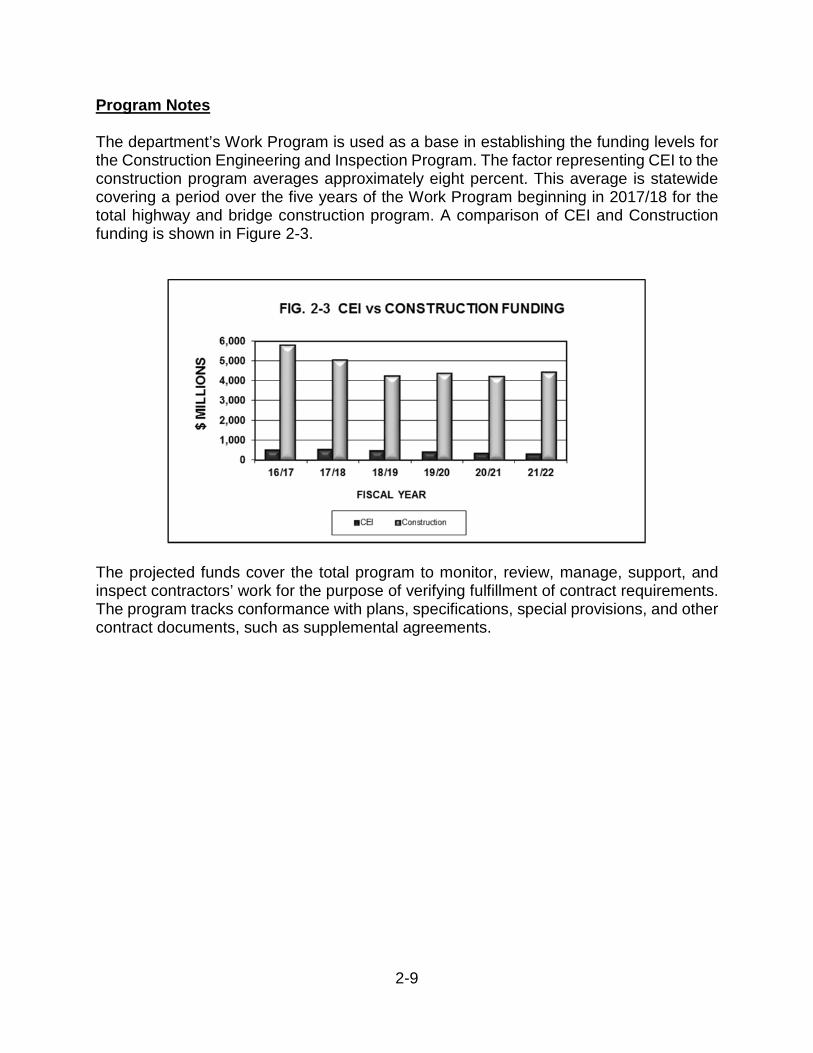
2-9
Program Notes
The department’s Work Program is used as a base in establishing the funding levels for the Construction Engineering and Inspection Program. The factor representing CEI to the construction program averages approximately eight percent. This average is statewide covering a period over the five years of the Work Program beginning in 2017/18 for the total highway and bridge construction program. A comparison of CEI and Construction funding is shown in Figure 2-3.
The projected funds cover the total program to monitor, review, manage, support, and inspect contractors’ work for the purpose of verifying fulfillment of contract requirements. The program tracks conformance with plans, specifications, special provisions, and other contract documents, such as supplemental agreements.
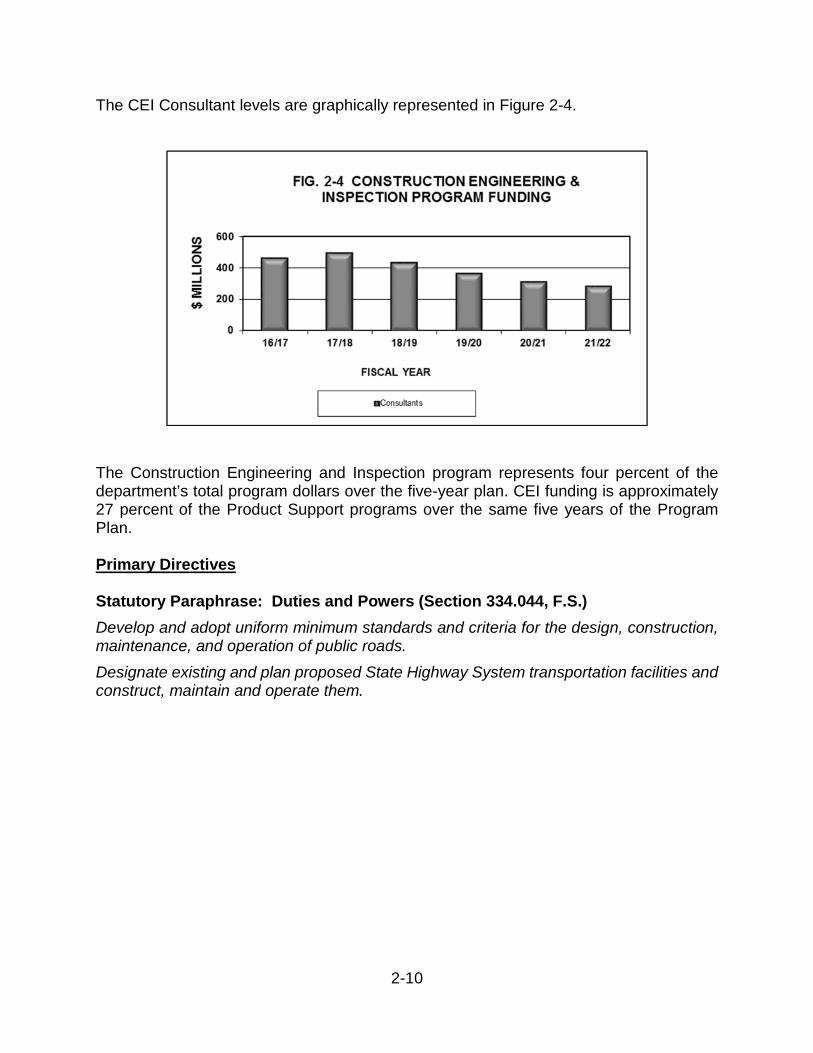
2-10
The CEI Consultant levels are graphically represented in Figure 2-4.
The Construction Engineering and Inspection program represents four percent of the department’s total program dollars over the five-year plan. CEI funding is approximately 27 percent of the Product Support programs over the same five years of the Program Plan.
Primary Directives
Statutory Paraphrase: Duties and Powers (Section 334.044, F.S.)
Develop and adopt uniform minimum standards and criteria for the design, construction, maintenance, and operation of public roads.
Designate existing and plan proposed State Highway System transportation facilities and construct, maintain and operate them.
2-11
Florida Transportation Plan Goals:
• Agile, resilient, and quality transportation infrastructure.
• Transportation solutions that support quality places to live, learn, work, and play.
• Transportation solutions that enhance Florida’s environment and conserve energy.
Florida Transportation Plan Objectives:
• Meet or exceed industry, state, national, or international standards for infrastructure quality, condition, and performance for all modes of transportation.
• Plan and develop transportation systems and facilities in a manner that protects, and where feasible, restores the function and character of the natural environment and avoids or minimizes adverse environmental impacts.
• Plan and develop transportation systems that reflect regional and community values, visions, and needs.
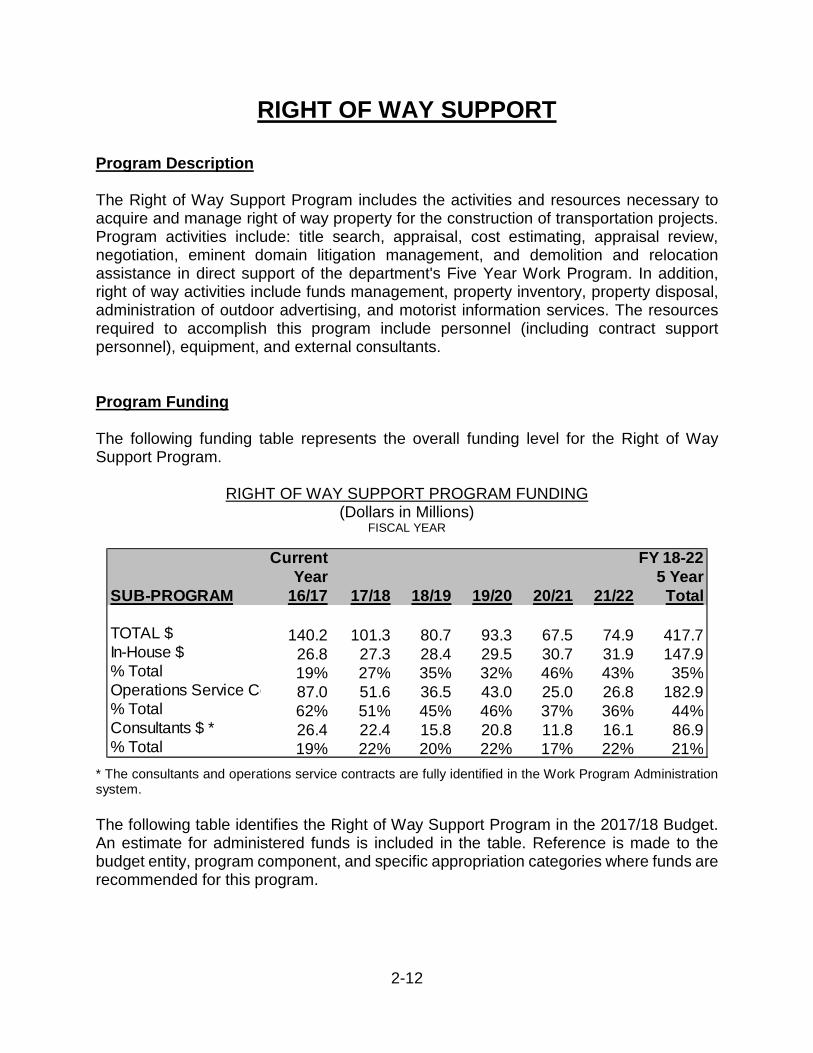
2-12
RIGHT OF WAY SUPPORT
Program Description
The Right of Way Support Program includes the activities and resources necessary to acquire and manage right of way property for the construction of transportation projects. Program activities include: title search, appraisal, cost estimating, appraisal review, negotiation, eminent domain litigation management, and demolition and relocation assistance in direct support of the department's Five Year Work Program. In addition, right of way activities include funds management, property inventory, property disposal, administration of outdoor advertising, and motorist information services. The resources required to accomplish this program include personnel (including contract support personnel), equipment, and external consultants.
Program Funding
The following funding table represents the overall funding level for the Right of Way Support Program.
RIGHT OF WAY SUPPORT PROGRAM FUNDING (Dollars in Millions)
FISCAL YEAR
* The consultants and operations service contracts are fully identified in the Work Program Administration system.
The following table identifies the Right of Way Support Program in the 2017/18 Budget. An estimate for administered funds is included in the table. Reference is made to the budget entity, program component, and specific appropriation categories where funds are recommended for this program.
Current FY 18-22Year 5 Year
SUB-PROGRAM 16/17 17/18 18/19 19/20 20/21 21/22 Total
TOTAL $ 140.2 101.3 80.7 93.3 67.5 74.9 417.7In-House $ 26.8 27.3 28.4 29.5 30.7 31.9 147.9% Total 19% 27% 35% 32% 46% 43% 35%Operations Service Contracts $ *87.0 51.6 36.5 43.0 25.0 26.8 182.9% Total 62% 51% 45% 46% 37% 36% 44%Consultants $ * 26.4 22.4 15.8 20.8 11.8 16.1 86.9% Total 19% 22% 20% 22% 17% 22% 21%
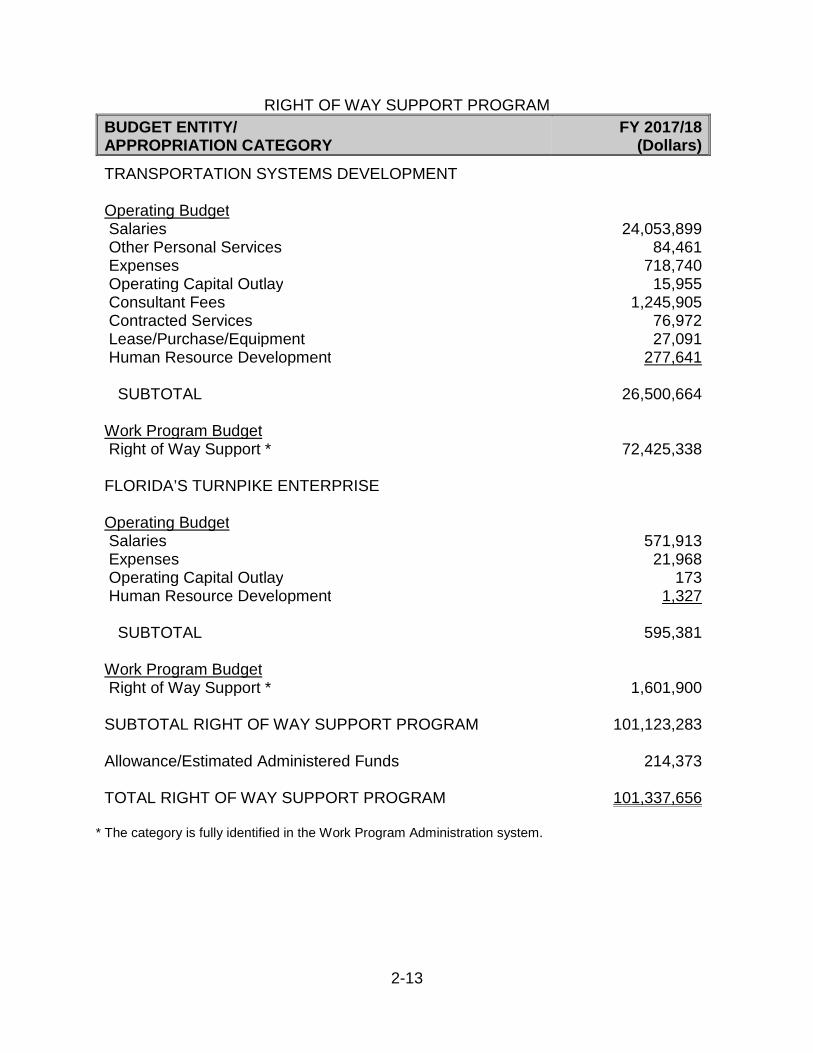
2-13
RIGHT OF WAY SUPPORT PROGRAM
BUDGET ENTITY/ APPROPRIATION CATEGORY
FY 2017/18(Dollars)
TRANSPORTATION SYSTEMS DEVELOPMENT
Operating BudgetSalaries 24,053,899Other Personal Services 84,461Expenses 718,740Operating Capital Outlay 15,955Consultant Fees 1,245,905
Contracted Services Lease/Purchase/Equipment
76,97227,091
Human Resource Development 277,641
SUBTOTAL 26,500,664
Work Program BudgetRight of Way Support * 72,425,338
FLORIDA’S TURNPIKE ENTERPRISE
Operating BudgetSalaries 571,913Expenses 21,968Operating Capital Outlay 173Human Resource Development 1,327
SUBTOTAL 595,381
Work Program BudgetRight of Way Support * 1,601,900
SUBTOTAL RIGHT OF WAY SUPPORT PROGRAM 101,123,283
Allowance/Estimated Administered Funds 214,373
TOTAL RIGHT OF WAY SUPPORT PROGRAM 101,337,656
* The category is fully identified in the Work Program Administration system.
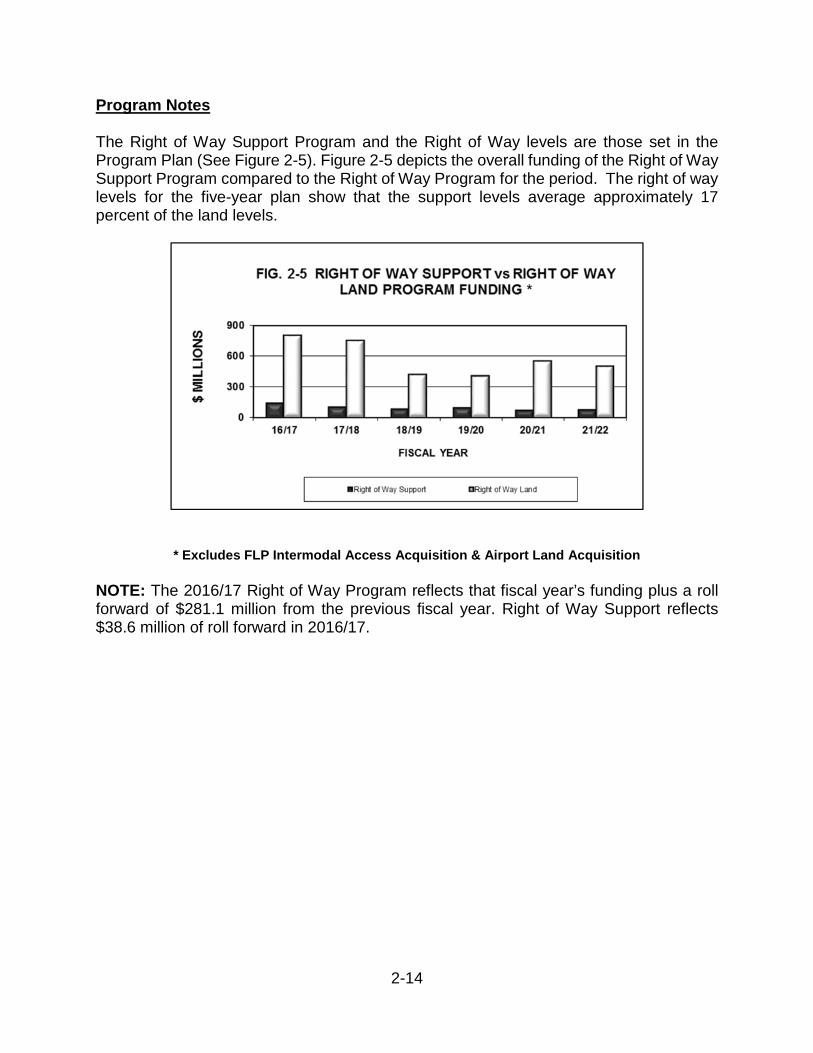
2-14
Program Notes
The Right of Way Support Program and the Right of Way levels are those set in the Program Plan (See Figure 2-5). Figure 2-5 depicts the overall funding of the Right of Way Support Program compared to the Right of Way Program for the period. The right of way levels for the five-year plan show that the support levels average approximately 17 percent of the land levels.
* Excludes FLP Intermodal Access Acquisition & Airport Land Acquisition
NOTE: The 2016/17 Right of Way Program reflects that fiscal year’s funding plus a roll forward of $281.1 million from the previous fiscal year. Right of Way Support reflects $38.6 million of roll forward in 2016/17.
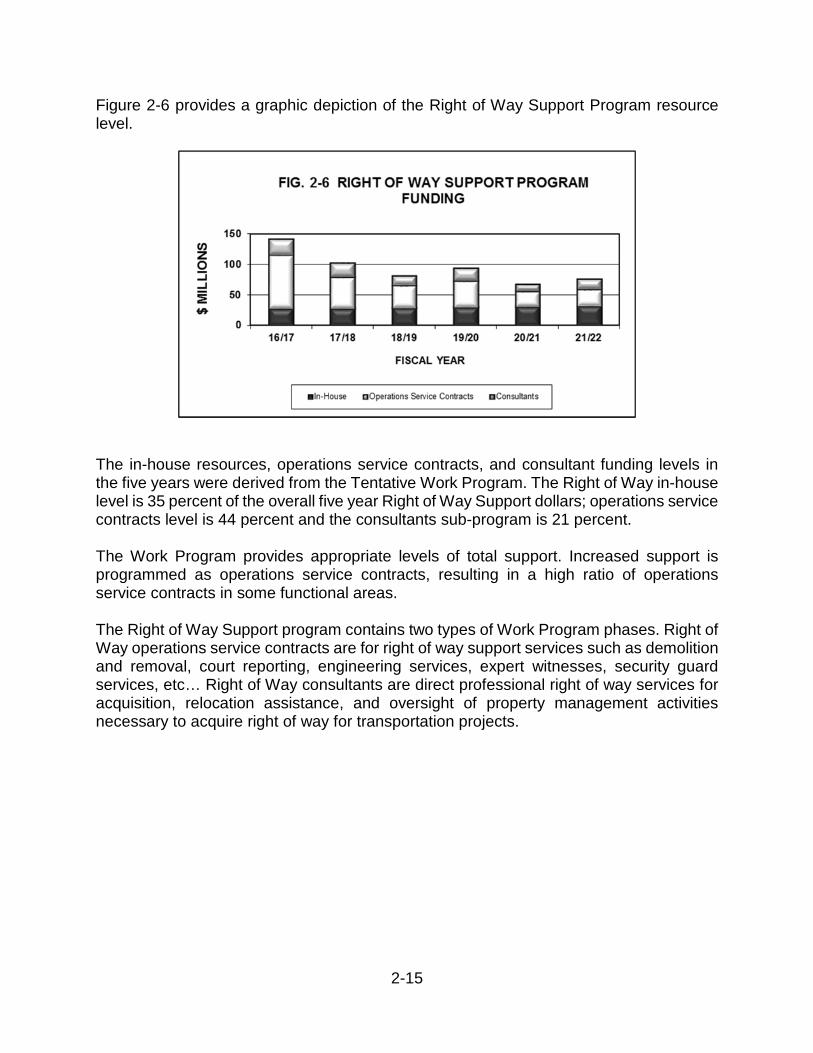
2-15
Figure 2-6 provides a graphic depiction of the Right of Way Support Program resource level.
The in-house resources, operations service contracts, and consultant funding levels in the five years were derived from the Tentative Work Program. The Right of Way in-house level is 35 percent of the overall five year Right of Way Support dollars; operations service contracts level is 44 percent and the consultants sub-program is 21 percent.
The Work Program provides appropriate levels of total support. Increased support is programmed as operations service contracts, resulting in a high ratio of operations service contracts in some functional areas.
The Right of Way Support program contains two types of Work Program phases. Right of Way operations service contracts are for right of way support services such as demolition and removal, court reporting, engineering services, expert witnesses, security guard services, etc… Right of Way consultants are direct professional right of way services for acquisition, relocation assistance, and oversight of property management activities necessary to acquire right of way for transportation projects.
2-16
Primary Directives
Statutory Paraphrase: Duties and Powers (Section 334.044, F.S.)
Acquire, through negotiation or eminent domain, property or property rights necessary to perform the duties and execute the powers of the department.
Florida Transportation Plan Goals:
• Agile, resilient, and quality transportation infrastructure.
• Transportation solutions that support quality places to live, learn, work, and play.
• Transportation solutions that enhance Florida’s environment and conserve energy.
Florida Transportation Plan Objectives:
• Meet or exceed industry, state, national, or international standards for infrastructure quality, condition, and performance for all modes of transportation.
• Plan and develop transportation systems and facilities in a manner that protects, and where feasible, restores the function and character of the natural environment and avoids or minimizes adverse environmental impacts.
• Plan and develop transportation systems that reflect regional and community values, visions, and needs.
• Optimize the functionality and efficiency of existing infrastructure and right-of-way.
2-17
ENVIRONMENTAL MITIGATION
Program Description
The Environmental Mitigation Program consists of the offsetting of impacts from highway improvements on wetlands and surface waters that are regulated by state and federal agencies for their environmental resource values. Through section 373.4137, F.S., the Florida Legislature requires the Florida Department of Transportation (FDOT) to provide an inventory of anticipated impacts to wetlands and surface waters to the five Water Management Districts (WMDs) or the Florida Department of Environmental Protection (FDEP), as appropriate, on an annual basis. State Transportation Trust Funds are programmed in the FDOT work program for use by the FDOT, WMDs, FDEP, or mitigation banks to mitigate for the impacts identified in the annual inventory.
The Environmental Mitigation Program includes activities and resources required to:
• Coordinate with federal and state regulatory and resource agencies; • Comply with federal and state permitting requirements; and • Provide mitigation through FDOT, WMDs, FDEP, or mitigation banks to offset the
impacts of transportation improvement projects.
Program Funding
The Environmental Mitigation Program sets aside State Transportation Trust Fund dollars for use in wetland mitigation. The Legislature has provided that funds transferred would be computed based on actual cost of mitigation developed by WMDs, FDEP, or purchases of mitigation credits. For mitigation activities occurring on existing WMDs or FDEP mitigation sites initiated with FDOT mitigation funds before July 1, 2013, the WMDs or the FDEP, as appropriate, will invoice the DOT or a participating transportation authority at a cost per acre of $75,000 multiplied by the projected acres of impact as identified in the environmental impact inventory. The cost per acre is adjusted annually based on the Cosumer Price Index. The adjusted unit cost for 2016/17 is forecasted to be $113,975 per impacted acre.
2-18
The following table represents the overall funding level for the Environmental Mitigation Program.
ENVIRONMENTAL MITIGATION PROGRAM FUNDING (Dollars in Millions)
FISCAL YEAR
* The category is fully identified in the Work Program Administration system.
The following table identifies the Environmental Mitigation Program in the 2017/18 Budget. Reference is made to the budget entity, program component, and specific appropriation categories where funds are recommended for this program.
ENVIRONMENTAL MITIGATION PROGRAM
BUDGET ENTITY/ APPROPRIATION CATEGORY
FY 2017/18(Dollars)
TRANSPORTATION SYSTEMS DEVELOPMENT
Work Program Budget Preliminary Engineering Consultants * (1) 16,299,465
FLORIDA’S TURNPIKE ENTERPRISE
Work Program Budget Preliminary Engineering Consultant (1) 2,525,000
TOTAL ENVIRONMENTAL MITIGATION PROGRAM 18,824,465
* The category is fully identified in the Work Program Administration system. (1) This appropriation category is also used by the Preliminary Engineering Program.
Current FY 18-22Year 5 Year
PROGRAM 16/17 17/18 18/19 19/20 20/21 21/22 Total
TOTAL $ * 55.0 18.8 5.3 8.4 0.8 4.6 38.0
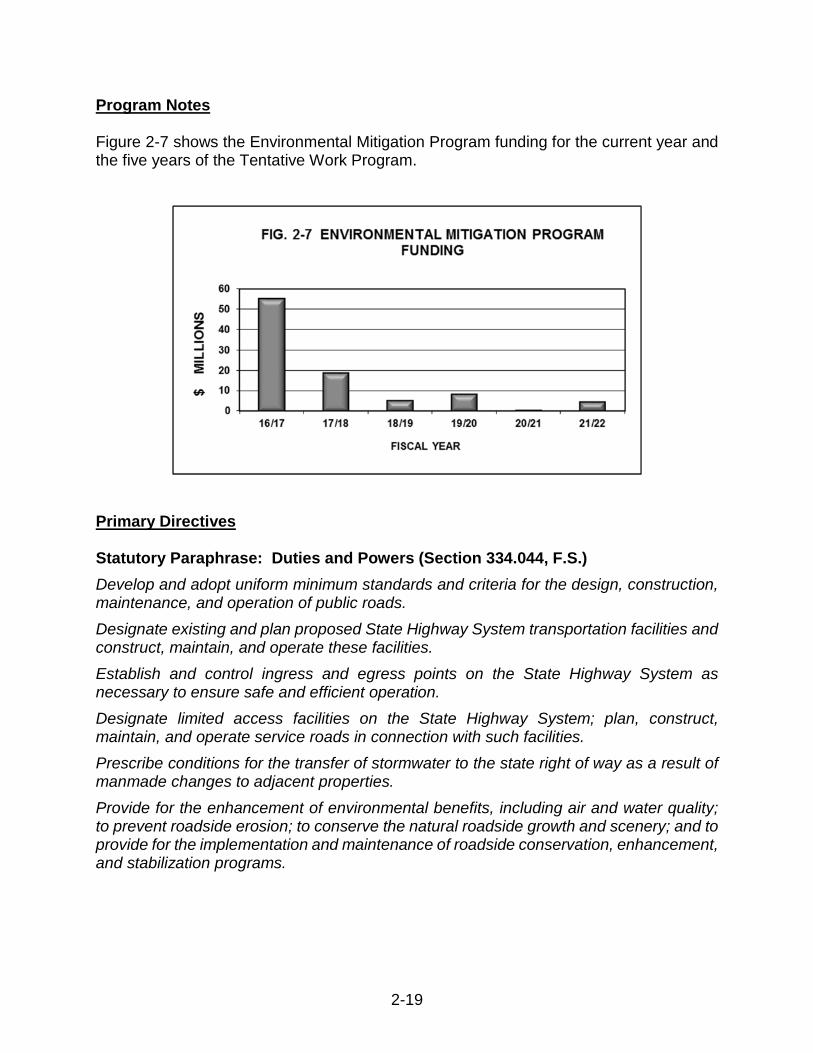
2-19
Program Notes
Figure 2-7 shows the Environmental Mitigation Program funding for the current year and the five years of the Tentative Work Program.
Primary Directives
Statutory Paraphrase: Duties and Powers (Section 334.044, F.S.)
Develop and adopt uniform minimum standards and criteria for the design, construction, maintenance, and operation of public roads.
Designate existing and plan proposed State Highway System transportation facilities and construct, maintain, and operate these facilities.
Establish and control ingress and egress points on the State Highway System as necessary to ensure safe and efficient operation.
Designate limited access facilities on the State Highway System; plan, construct, maintain, and operate service roads in connection with such facilities.
Prescribe conditions for the transfer of stormwater to the state right of way as a result of manmade changes to adjacent properties.
Provide for the enhancement of environmental benefits, including air and water quality; to prevent roadside erosion; to conserve the natural roadside growth and scenery; and to provide for the implementation and maintenance of roadside conservation, enhancement, and stabilization programs.
2-20
Statutory Paraphrase: Department mission, goals and objectives (Section 334.046, F.S.)
Provide a safe statewide transportation system that ensures the mobility of people and goods, enhances economic prosperity, and preserves the quality of our environment and communities.
Statutory Paraphrase: Transportation Planning (Section 339.155, F.S.)
Protect and enhance the environment, promote energy conservation, and improve quality of life.
Statutory Paraphrase: Mitigation Requirements for Specified Transportation Projects (Section 373.4137, F.S.)
Mitigation to offset the adverse effects of transportation projects funded by the Department of Transportation and carried out by the water management districts.
The Department of Transportation may fund any mitigation activities for future projects using current year funds.
Florida Transportation Plan Goals:
• Agile, resilient, and quality transportation infrastructure.
• Efficient and reliable mobility for people and freight.
• Transportation solutions that support quality places to live, learn, work, and play.
• Transportation solutions that enhance Florida’s environment and conserve energy.
Florida Transportation Plan Objectives:
• Meet or exceed industry, state, national, or international standards for infrastructure quality, condition, and performance for all modes of transportation.
• Increase customer satisfaction with Florida’s transportation system and regulatory processes for residents, visitors, and businesses.
• Plan and develop transportation systems that reflect regional and community values, visions, and needs.
• Provide transportation solutions that contribute to improved public health.
• Plan and develop transportation systems and facilities in a manner that protects, and where feasible, restores the function and character of the natural environment and avoids or minimizes adverse environmental impacts.
2-22
MATERIALS AND RESEARCH:
MATERIALS PROGRAM
Program Description
The Materials Program, a part of the Materials Testing and Research Program, refers to the combined operation of the State Materials Office (SMO), also known as the Central Laboratory, and the six district materials offices. The district materials offices each have main district laboratories and strategically located branch laboratories.
Activities include geo-technical investigation, analysis, and design; specifications production; materials testing for compliance; inspection of statewide materials production; investigations during and after construction; evaluation of the state maintained roadway system for pavement structural condition and friction; and assurance of the quality of materials incorporated into the department’s projects in accordance with federal guidelines. The program also utilizes personnel, laboratories, and mobile pavement evaluation equipment. The Director, Office of Materials and District Materials and Research Engineers are required to certify materials on construction projects.
As extensions of the SMO, district offices and their laboratories assist with this mission. They also provide, at the project level, preliminary engineering, construction testing and monitoring activities.
Program Funding
The following table represents the overall six-year funding level for the Materials Program portion of Materials and Research.
MATERIALS PROGRAM FUNDING (Dollars in Millions)
FISCAL YEAR
* The consultants are fully identified in the Work Program Administration system.
Current FY 18-22Year 5 Year
SUB-PROGRAM 16/17 17/18 18/19 19/20 20/21 21/22 Total
TOTAL $ 29.6 30.4 31.6 32.8 34.2 35.5 164.5In-House $ 29.6 30.4 31.6 32.8 34.2 35.5 164.5% Total 100% 100% 100% 100% 100% 100% 100%Consultants $ * 0.0 0.0 0.0 0.0 0.0 0.0 0.0% Total 0% 0% 0% 0% 0% 0% 0%
2-23
The following table identifies the Materials Program in the 2017/18 Budget. An estimate for administered funds is included in the table. Reference is made to the budget entity, program component, and specific appropriation categories where funds are recommended for this program.
MATERIALS PROGRAM
BUDGET ENTITY/ APPROPRIATION CATEGORY
FY 2017/18(Dollars)
HIGHWAY OPERATIONS
Operating BudgetSalaries 25,966,411Other Personal Services 77,081Expenses 1,838,138Operating Capital Outlay 1,358,044Human Resource Development 209,206Consultant Fees 293,982Contracted Services 306,538
Acquisition/Motor Vehicles Lease/Purchase/Equipment
74,00011,274
Transportation Materials & Equipment 7,868
SUBTOTAL 30,142,542
Allowance/Estimated Administered Funds 226,043
TOTAL MATERIALS PROGRAM 30,368,585
Program Notes
The Materials Program supports the state highway system, other roads, safety, bridge and resurfacing programs. The funding levels establish a technological base of resources augmented with consultants.
Consultant funding in the State Materials Office includes evaluation of materials and conditions not project specific. District consultant funding provides project specific resources to supplement in-house forces and ensure quality control against previously established materials specifications. State personnel or consultants acting as state representatives must perform materials sampling and testing functions on federal aid projects to meet Federal requirements.
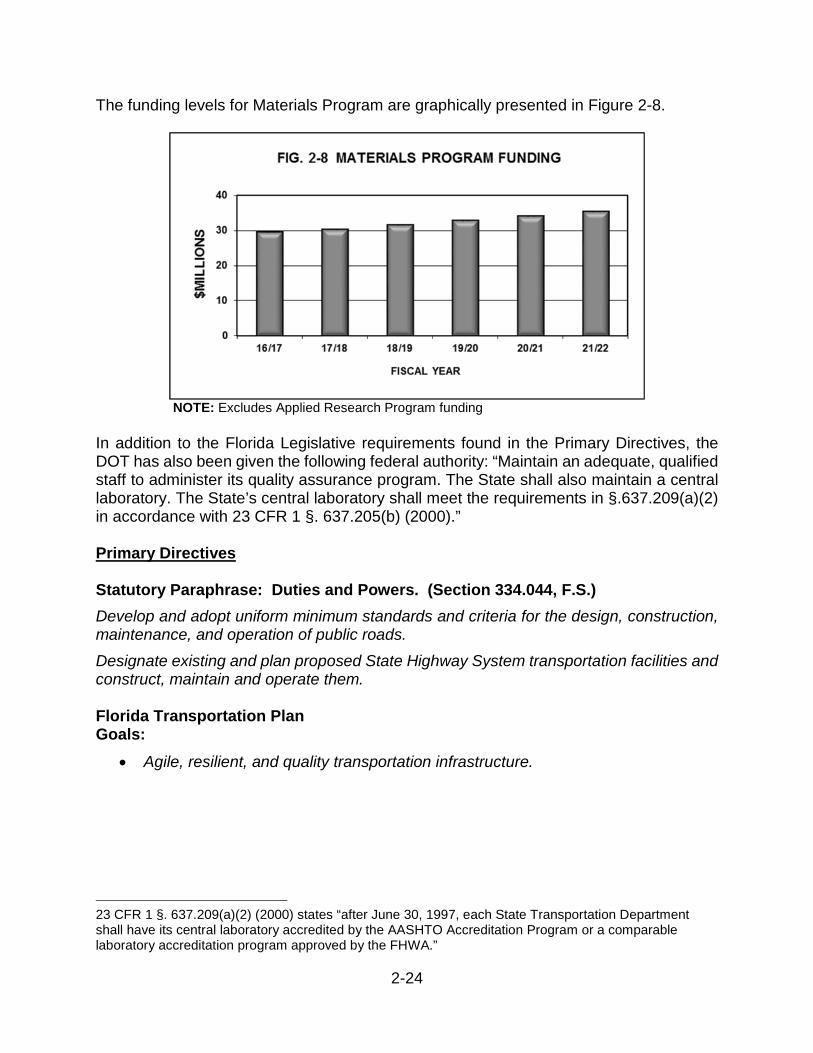
2-24
The funding levels for Materials Program are graphically presented in Figure 2-8.
NOTE: Excludes Applied Research Program funding
In addition to the Florida Legislative requirements found in the Primary Directives, the DOT has also been given the following federal authority: “Maintain an adequate, qualified staff to administer its quality assurance program. The State shall also maintain a central laboratory. The State’s central laboratory shall meet the requirements in §.637.209(a)(2) in accordance with 23 CFR 1 §. 637.205(b) (2000).”
Primary Directives
Statutory Paraphrase: Duties and Powers. (Section 334.044, F.S.)
Develop and adopt uniform minimum standards and criteria for the design, construction, maintenance, and operation of public roads.
Designate existing and plan proposed State Highway System transportation facilities and construct, maintain and operate them.
Florida Transportation Plan Goals:
• Agile, resilient, and quality transportation infrastructure.
23 CFR 1 §. 637.209(a)(2) (2000) states “after June 30, 1997, each State Transportation Department shall have its central laboratory accredited by the AASHTO Accreditation Program or a comparable laboratory accreditation program approved by the FHWA.”
2-25
Florida Transportation Plan Objectives:
• Meet or exceed industry, state, national, or international standrds for infrastructure quality, condition, and performance for all modes of transportation.
• Increase the resiliency of infrastructure to risks, including extreme weather and other environmental conditions.
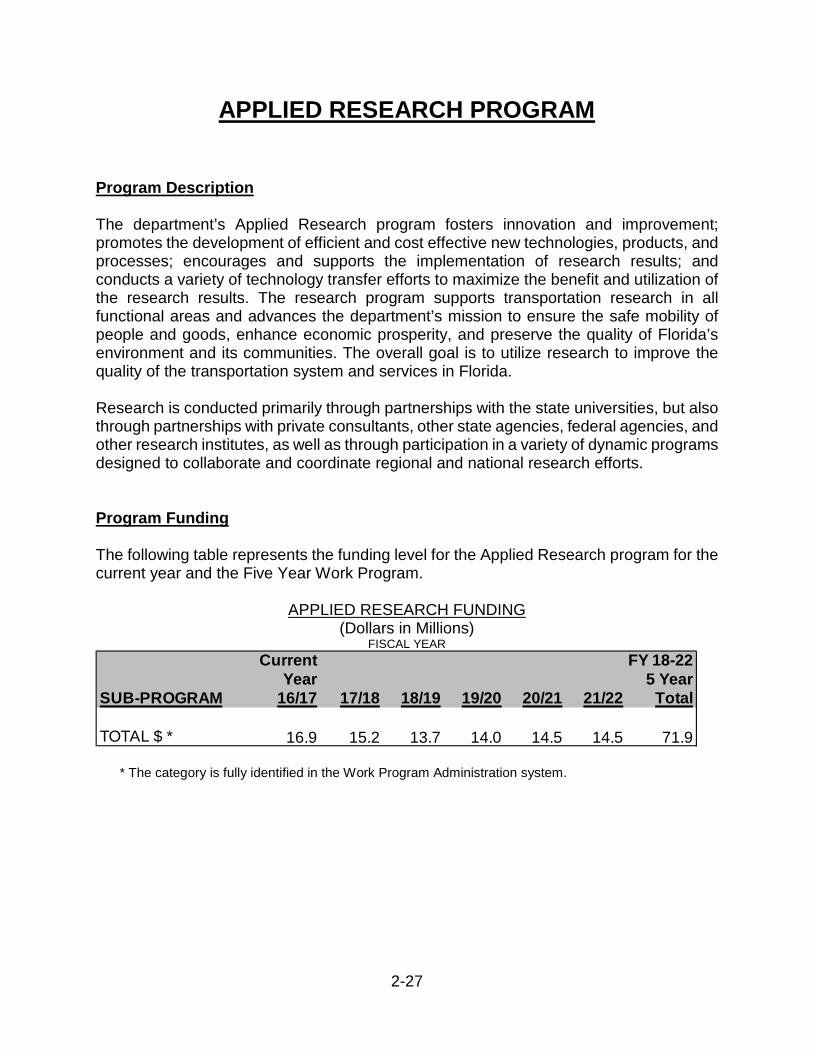
2-27
APPLIED RESEARCH PROGRAM
Program Description
The department’s Applied Research program fosters innovation and improvement; promotes the development of efficient and cost effective new technologies, products, and processes; encourages and supports the implementation of research results; and conducts a variety of technology transfer efforts to maximize the benefit and utilization of the research results. The research program supports transportation research in all functional areas and advances the department’s mission to ensure the safe mobility of people and goods, enhance economic prosperity, and preserve the quality of Florida’s environment and its communities. The overall goal is to utilize research to improve the quality of the transportation system and services in Florida.
Research is conducted primarily through partnerships with the state universities, but also through partnerships with private consultants, other state agencies, federal agencies, and other research institutes, as well as through participation in a variety of dynamic programs designed to collaborate and coordinate regional and national research efforts.
Program Funding
The following table represents the funding level for the Applied Research program for the current year and the Five Year Work Program.
APPLIED RESEARCH FUNDING (Dollars in Millions)
FISCAL YEAR
* The category is fully identified in the Work Program Administration system.
Current FY 18-22Year 5 Year
SUB-PROGRAM 16/17 17/18 18/19 19/20 20/21 21/22 Total
TOTAL $ * 16.9 15.2 13.7 14.0 14.5 14.5 71.9
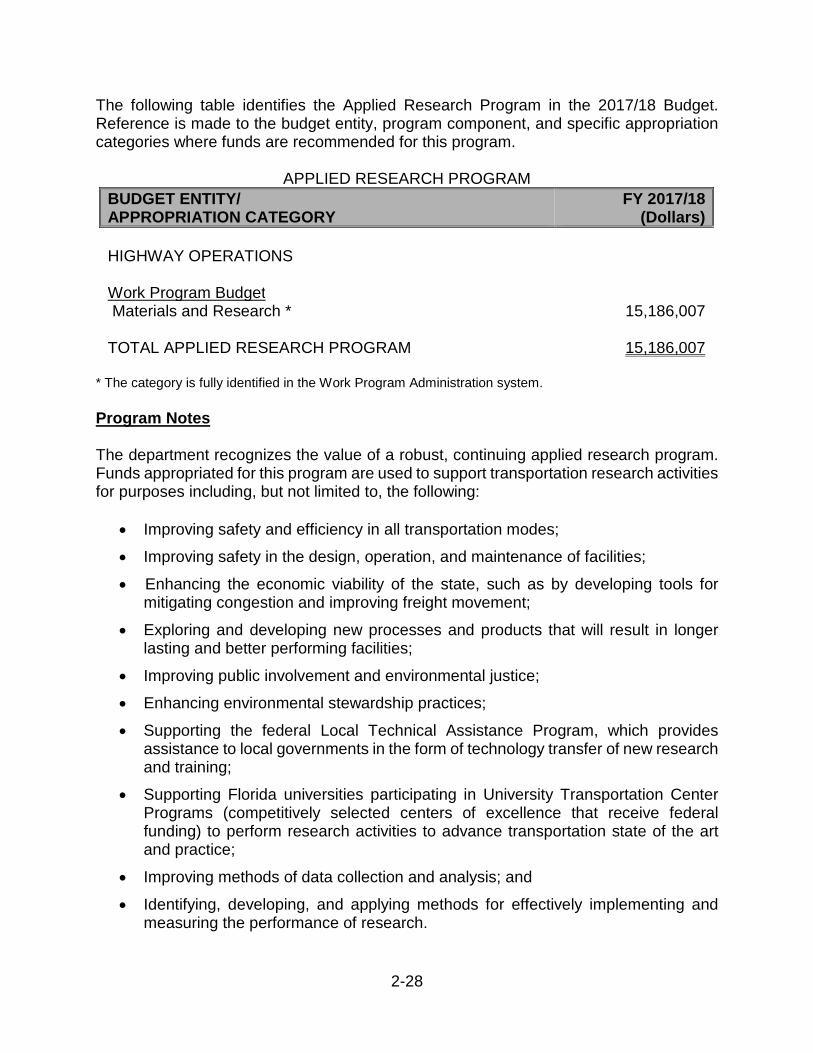
2-28
The following table identifies the Applied Research Program in the 2017/18 Budget. Reference is made to the budget entity, program component, and specific appropriation categories where funds are recommended for this program.
APPLIED RESEARCH PROGRAM
BUDGET ENTITY/ APPROPRIATION CATEGORY
FY 2017/18(Dollars)
HIGHWAY OPERATIONS
Work Program BudgetMaterials and Research * 15,186,007
TOTAL APPLIED RESEARCH PROGRAM 15,186,007
* The category is fully identified in the Work Program Administration system.
Program Notes
The department recognizes the value of a robust, continuing applied research program. Funds appropriated for this program are used to support transportation research activities for purposes including, but not limited to, the following:
• Improving safety and efficiency in all transportation modes;
• Improving safety in the design, operation, and maintenance of facilities;
• Enhancing the economic viability of the state, such as by developing tools for mitigating congestion and improving freight movement;
• Exploring and developing new processes and products that will result in longer lasting and better performing facilities;
• Improving public involvement and environmental justice;
• Enhancing environmental stewardship practices;
• Supporting the federal Local Technical Assistance Program, which provides assistance to local governments in the form of technology transfer of new research and training;
• Supporting Florida universities participating in University Transportation Center Programs (competitively selected centers of excellence that receive federal funding) to perform research activities to advance transportation state of the art and practice;
• Improving methods of data collection and analysis; and
• Identifying, developing, and applying methods for effectively implementing and measuring the performance of research.
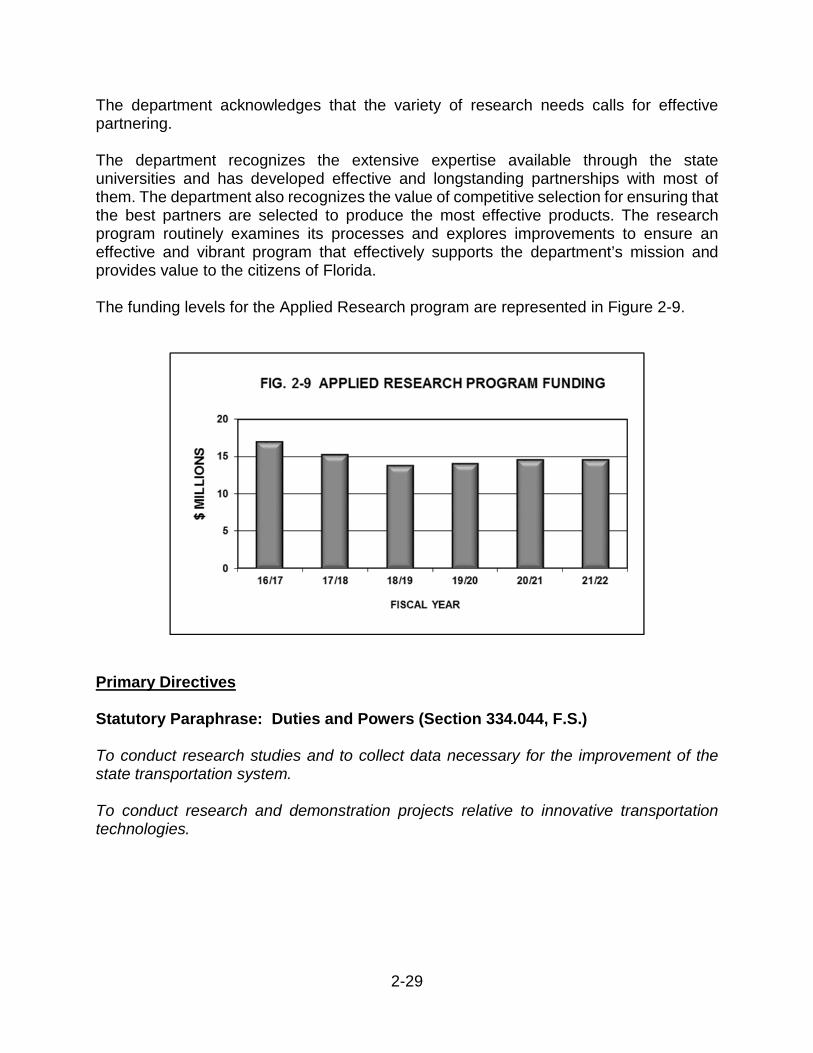
2-29
The department acknowledges that the variety of research needs calls for effective partnering.
The department recognizes the extensive expertise available through the state universities and has developed effective and longstanding partnerships with most of them. The department also recognizes the value of competitive selection for ensuring that the best partners are selected to produce the most effective products. The research program routinely examines its processes and explores improvements to ensure an effective and vibrant program that effectively supports the department’s mission and provides value to the citizens of Florida.
The funding levels for the Applied Research program are represented in Figure 2-9.
Primary Directives
Statutory Paraphrase: Duties and Powers (Section 334.044, F.S.)
To conduct research studies and to collect data necessary for the improvement of the state transportation system.
To conduct research and demonstration projects relative to innovative transportation technologies.
2-30
Florida Transportation Plan Goals:
• Safety and security for residents, visitors, and businesses.
• Agile, resilient, and quality transportation infrastructure.
• Transportation solutions that support quality places to live, learn, work, and play.
Florida Transportation Plan Objectives:
• Prevent transportation-related fatalities and serious injuries.
• Reduce the number of crashes on the transportation system.
• Prevent and mitigate transportation-related security risks.
• Provide transportation infrastructure and services to help prepare for, respond to, and recover from emergencies.
• Meet or exceed industry, state, national, or international standards for infrastructure quality, condition, and performance for all modes of transportation.
• Increase the resiliency of infrastructure to risks, including extreme weather and other environmental conditions.
• Plan and develop transportation systems that reflect regional and community values, visions, and needs.
2-31
PLANNING AND ENVIRONMENT
Program Description
The Planning and Environment Program includes activities and resources required to:
• Establish a transportation policy framework, including coordination and development of the Florida Transportation Plan;
• Collect and analyze data to support decision making;
• Evaluate the effectiveness of the state’s transportation system;
• Document transportation needs;
• Set program direction;
• Suggest project priorities;
• Develop and ensure the implementation of quality environmental policies, procedures and practices in the development of transportation improvements;
• Perform Efficient Transportation Decision Making activities during Planning to set the stage for Project Development and Environment (PD&E) activities;
• PD&E activities to advance projects through the National Environmental Policy Act to fulfill federal requirements and maintain eligibility for federal funds; and
• Perform Environmental Management activities.
All the above activities are necessary to ensure that programs and projects support the department’s mission and that the department meets all state and federal planning and environment responsibilities.
Federal and state planning and environment responsibilities include:
• Serving as Florida’s principal transportation policy advisor;
• Coordinating planning and environmental considerations for a safe, viable and balanced transportation system serving all regions of the state, assuring the compatibility of all components, including multi modal facilities;
• Coordinating with federal and state resource and regulatory agencies;
• Mitigating for unavoidable environmental effects of transportation improvements;
• Implementing federal mandates;
• Complying with federal and state environmental requirements;
• Maintaining federal funding eligibility, when appropriate;
• Providing training and guidance for transportation projects;
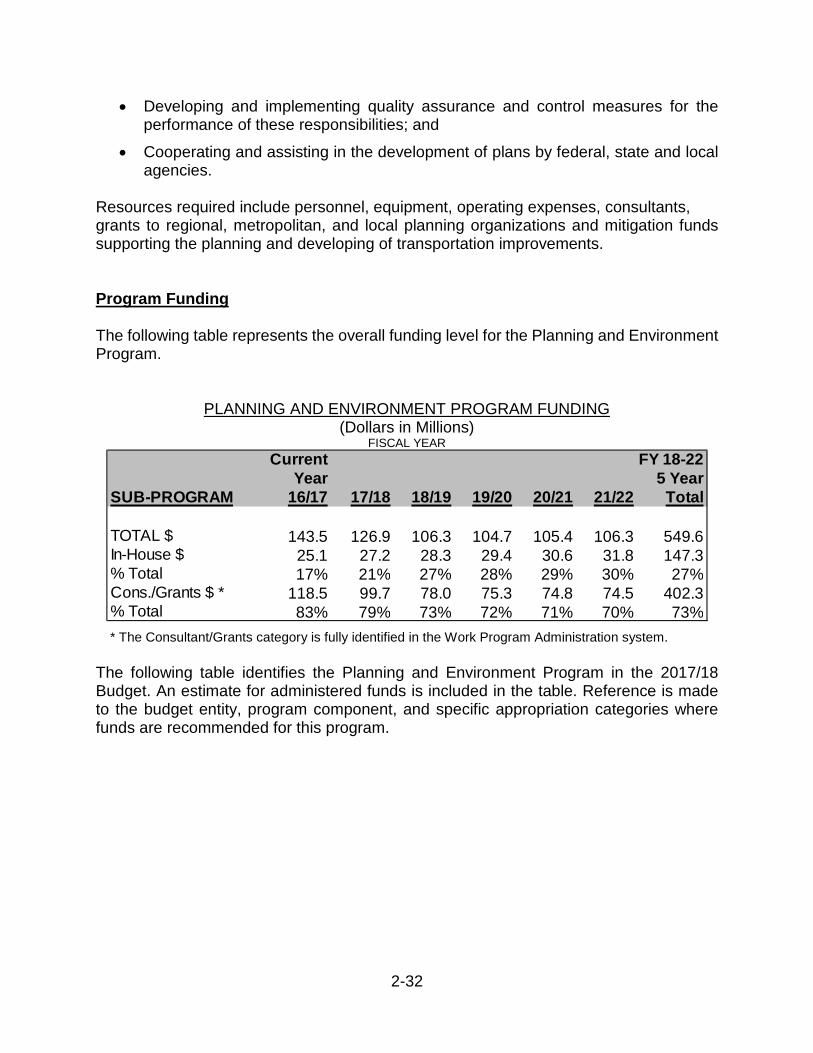
2-32
• Developing and implementing quality assurance and control measures for the performance of these responsibilities; and
• Cooperating and assisting in the development of plans by federal, state and local agencies.
Resources required include personnel, equipment, operating expenses, consultants, grants to regional, metropolitan, and local planning organizations and mitigation funds supporting the planning and developing of transportation improvements.
Program Funding
The following table represents the overall funding level for the Planning and Environment Program.
PLANNING AND ENVIRONMENT PROGRAM FUNDING (Dollars in Millions)
FISCAL YEAR
* The Consultant/Grants category is fully identified in the Work Program Administration system.
The following table identifies the Planning and Environment Program in the 2017/18 Budget. An estimate for administered funds is included in the table. Reference is made to the budget entity, program component, and specific appropriation categories where funds are recommended for this program.
Current FY 18-22Year 5 Year
SUB-PROGRAM 16/17 17/18 18/19 19/20 20/21 21/22 Total
TOTAL $ 143.5 126.9 106.3 104.7 105.4 106.3 549.6In-House $ 25.1 27.2 28.3 29.4 30.6 31.8 147.3% Total 17% 21% 27% 28% 29% 30% 27%Cons./Grants $ * 118.5 99.7 78.0 75.3 74.8 74.5 402.3% Total 83% 79% 73% 72% 71% 70% 73%
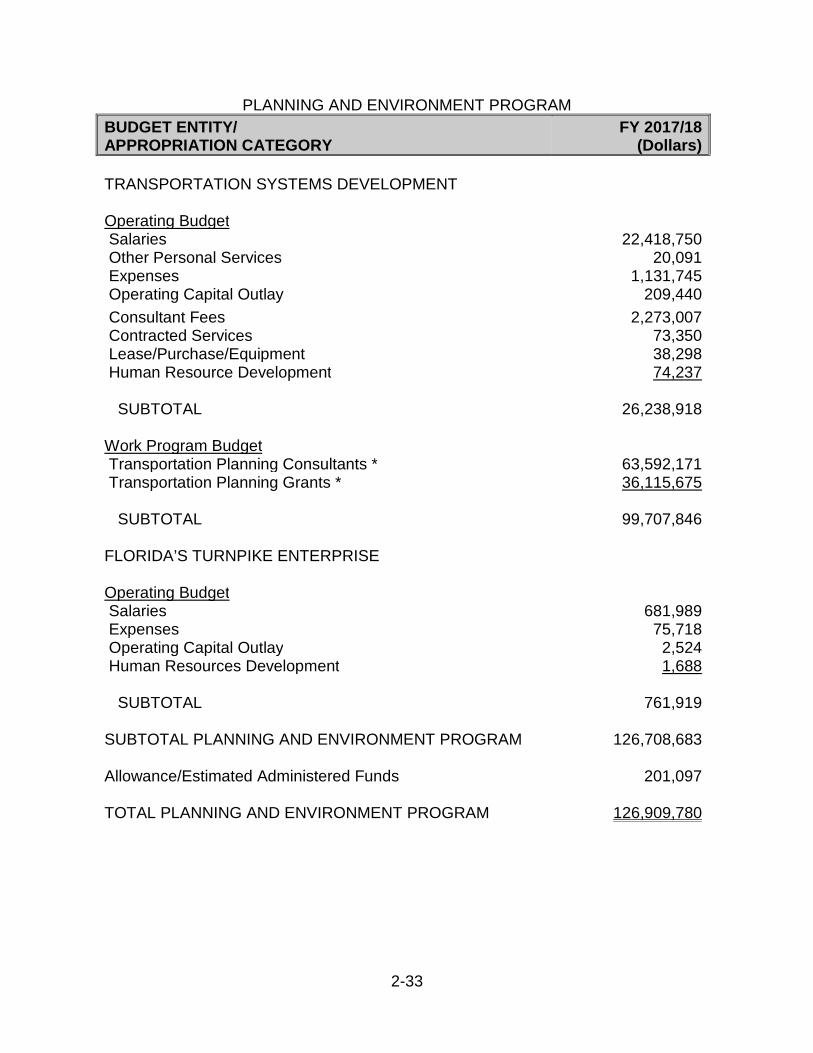
2-33
PLANNING AND ENVIRONMENT PROGRAM
BUDGET ENTITY/ APPROPRIATION CATEGORY
FY 2017/18(Dollars)
TRANSPORTATION SYSTEMS DEVELOPMENT
Operating BudgetSalaries 22,418,750Other Personal Services 20,091Expenses 1,131,745
Operating Capital Outlay 209,440
Consultant Fees 2,273,007 Contracted Services Lease/Purchase/Equipment
73,35038,298
Human Resource Development 74,237
SUBTOTAL 26,238,918
Work Program BudgetTransportation Planning Consultants * 63,592,171Transportation Planning Grants * 36,115,675
SUBTOTAL 99,707,846
FLORIDA’S TURNPIKE ENTERPRISE
Operating BudgetSalaries 681,989Expenses 75,718Operating Capital Outlay 2,524Human Resources Development 1,688
SUBTOTAL 761,919
SUBTOTAL PLANNING AND ENVIRONMENT PROGRAM 126,708,683
Allowance/Estimated Administered Funds 201,097
TOTAL PLANNING AND ENVIRONMENT PROGRAM 126,909,780
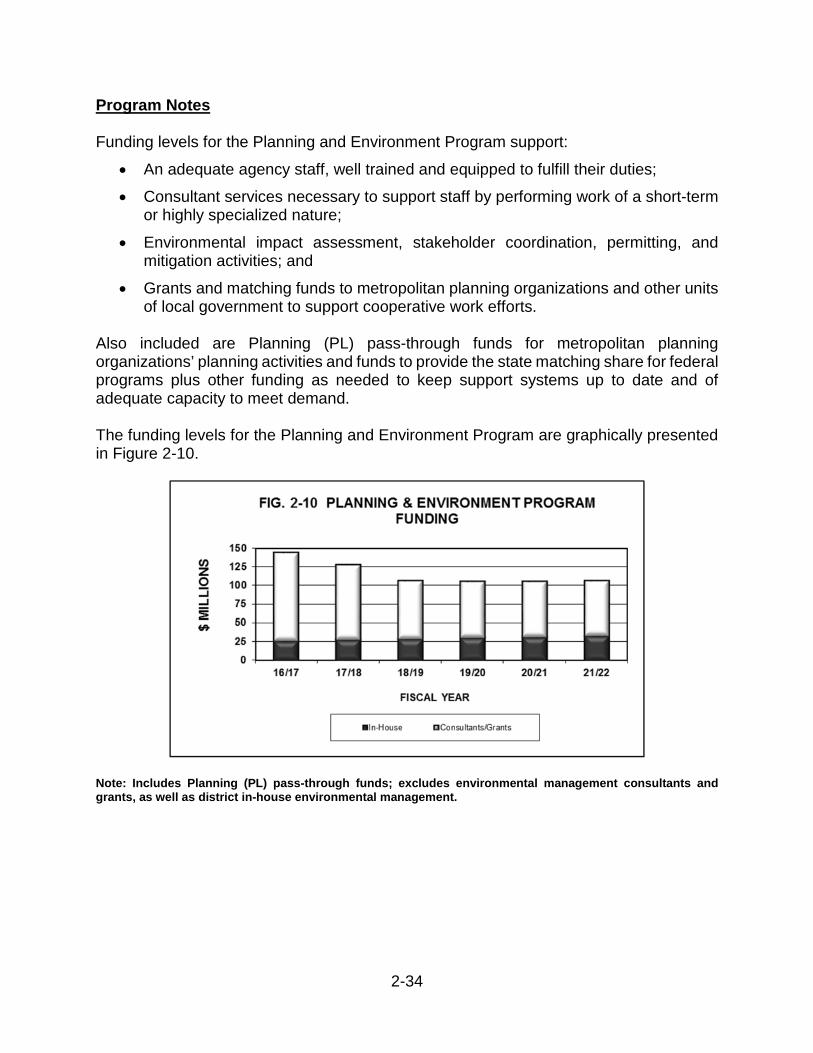
2-34
Program Notes
Funding levels for the Planning and Environment Program support:
• An adequate agency staff, well trained and equipped to fulfill their duties;
• Consultant services necessary to support staff by performing work of a short-term or highly specialized nature;
• Environmental impact assessment, stakeholder coordination, permitting, and mitigation activities; and
• Grants and matching funds to metropolitan planning organizations and other units of local government to support cooperative work efforts.
Also included are Planning (PL) pass-through funds for metropolitan planning organizations’ planning activities and funds to provide the state matching share for federal programs plus other funding as needed to keep support systems up to date and of adequate capacity to meet demand.
The funding levels for the Planning and Environment Program are graphically presented in Figure 2-10.
Note: Includes Planning (PL) pass-through funds; excludes environmental management consultants and grants, as well as district in-house environmental management.
2-35
Primary Directives
Statutory Paraphrase: Department of Transportation (Section 20.23, F.S.)
Perform assigned policy planning, systems planning, and transportation statistics responsibilities.
Statutory Paraphrase: Long-range Program Plans (Section 186.021, F.S.)
Develop a long-range program plan that provides the framework and context for designing and interpreting the agency budget request. The plan shall be used by the agency to implement the state’s goals and objectives.
Statutory Paraphrase: Duties and Powers (Section 334.044, F.S.)
Coordinate the planning of a safe, viable and balanced state transportation system serving all regions of the state and assure compatibility of all components, including multimodal facilities.
Designate existing and plan proposed State Highway System transportation facilities.
Encourage and promote the development of multi-modal transportation alternatives.
Conduct research studies and collect data necessary for the improvements of the state transportation system.
Conduct research and demonstration projects relative to innovative transportation technologies.
Prescribe conditions for the transfer of stormwater to the state right of way as a result of man-made changes to adjacent properties.
Provide for the enhancement of environmental benefits, including air and water quality; to prevent roadside erosion; to conserve the natural roadside growth and scenery; and to provide for the implementation and maintenance of roadside conservation, enhancement, and stabilization programs.
Statutory Paraphrase: Department mission, goals and objectives (Section 334.046, F.S.)
Provide a safe statewide transportation system that ensures the mobility of people and goods, enhances economic prosperity, and preserves the quality of our environment and communities.
Statutory Paraphrase: Florida Limited Access Highway System (Section 338.01, F.S.)
Establish a system of limited access roadways with the primary function of providing high speed, high volume movements with access to abuting properties as a secondary function.
2-36
Statutory Paraphrase: Florida Strategic Intermodal System (Sections 339.61-65, F.S.)
The designation of a strategic intermodal system, composed of facilities and services of statewide and interregional significance, will efficiently serve the mobility needs of Florida’s citizens, businesses, and visitors and will help Florida become a worldwide economic leader, enhance economic prosperity and competitiveness, enrich quality of life, and reflect responsible environmental stewardship.
The department also shall plan for the Strategic Highway Network and the Strategic Rail Corridor Network transportation facilities that either is included in the Strategic Intermodal System or that provide a direct connection between military installations and the Strategic Intermodal System.
The department will plan and develop the Strategic Intermodal System Highway Component consisting of an integrated network of limited and controlled access highways linking metropolitan areas across the state and a system of highway connectors providing access to Strategic Intermodal System Intermodal Terminals and Hubs.
During the development of updates to the Strategic Intermodal System Plan, the department shall provide metropolitan planning organizations, regional planning councils, local governments, transportation providers, affected public agencies, and citizens with an opportunity to participate in and comment on the development of the update.
Statutory Paraphrase: Transportation Planning (Section 339.155, F.S.)
Develop and update a statewide transportation plan, to be known as the Florida Transportation Plan.
Define the relationship between the long-range goals and the short-range objectives and specify those objectives against which the department’s achievement of such goals will be measured.
Provide citizens, affected public agencies, representatives of transportation agency employees, and other known interested parties with an opportunity to comment on the Florida Transportation Plan. The plan must also be developed in consultation with affected local officials in regional planning councils, metropolitan planning organizations and nonmetropolitan areas and with any affected Indian tribal governments.
During development of major transportation improvements, the department shall hold one or more hearings prior to the selection of the facility to be provided; prior to the selection of the site or corridor of the proposed facility; and prior to the selection of and commitment to a specific design proposal for the proposed facility.
Statutory Paraphrase: Legislative intent with respect to department management accountability and monitoring systems (Section 334.048, F.S.)
Adopt policies, rules, procedures and standards.
Monitor district and central office units that provide transportation programs to assess performance; determine compliance with all applicable laws, rules and procedures; and
2-37
provide useful information for department managers to take corrective action when necessary.
Florida Transportation Plan Goals:
• Safety and security for residents, visitors, and businesses.
• Agile, resilient, and quality infrastructure.
• Efficient and reliable mobility for people and freight.
• More transportation choices for people and freight.
• Transportation solutions that support Florida’s global economic competitiveness.
• Transportation solutions that support quality places to live, learn, work, and play.
• Transportation solutions that support Florida’s environment and conserve energy.
Florida Transportation Plan Objectives:
• Prevent transportation-related fatalities and injuries.
• Reduce the number of crashes on the transportation system.
• Prevent and mitigate transportation-related security risks.
• Provide transportation infrastructure and services to help prepare for, respond to, and recover from emergencies.
• Meet or exceed industry, state, national, or international standards for infrastructure quality, condition, and performance for all modes of transportation.
• Optimize the functionality and efficiency of existing infrastructure and right-of-way.
• Adapt transportation infrastructure and technologies to meet changing customer needs.
• Increase the resiliency of infrastructure to risks, including extreme weather and other environmental conditions.
• Reduce delays related to bottlenecks, gaps, and crashes and other incidents for all modes of Florida’s transportation system.
• Increase the reliability of all modes of Florida’s transportation system.
• Increase customer satisfaction with Florida’s transportation system and regulatory processes for residents, visitors, and businesses.
• Increase the efficiency of the supply chain for freight moving to, from, and through Florida.
2-38
• Increase the efficiency and flexibility of transportation-related regulatory processes.
• Increase the use of new mobility options and technologies.
• Increase the share of person trips using public transportation and other alternatives to single-occupancy motor vehicles.
• Increase the number of quality options for visitor travel to, from, and within Florida.
• Increase the number of quality options for moving freight to, from, and within Florida.
• Increase the efficiency and convenience of connecting between multiple modes of transportation.
• Provide transportation infrastructure and services to support job growth in transportation-dependent industries and clusters.
• Increase transportation connectivity between Florida’s economic centers and regions.
• Increase transportation connectivity between Florida and global and national trading partners and visitor origin markets.
• Plan and develop transportation systems that reflect regional and community values, visions, and needs.
• Provide convenient, efficient accessibility to the transportation system for Florida’s residents and visitors.
• Provide transportation solutions that contribute to improved health.
• Plan and develop transportation systems and faciltiies in a manner that protects, and where feasible, restores the function and character of the natural environment and avoids or minimizes adverse environemental impacts.
• Increase the energy efficiency of transportation.
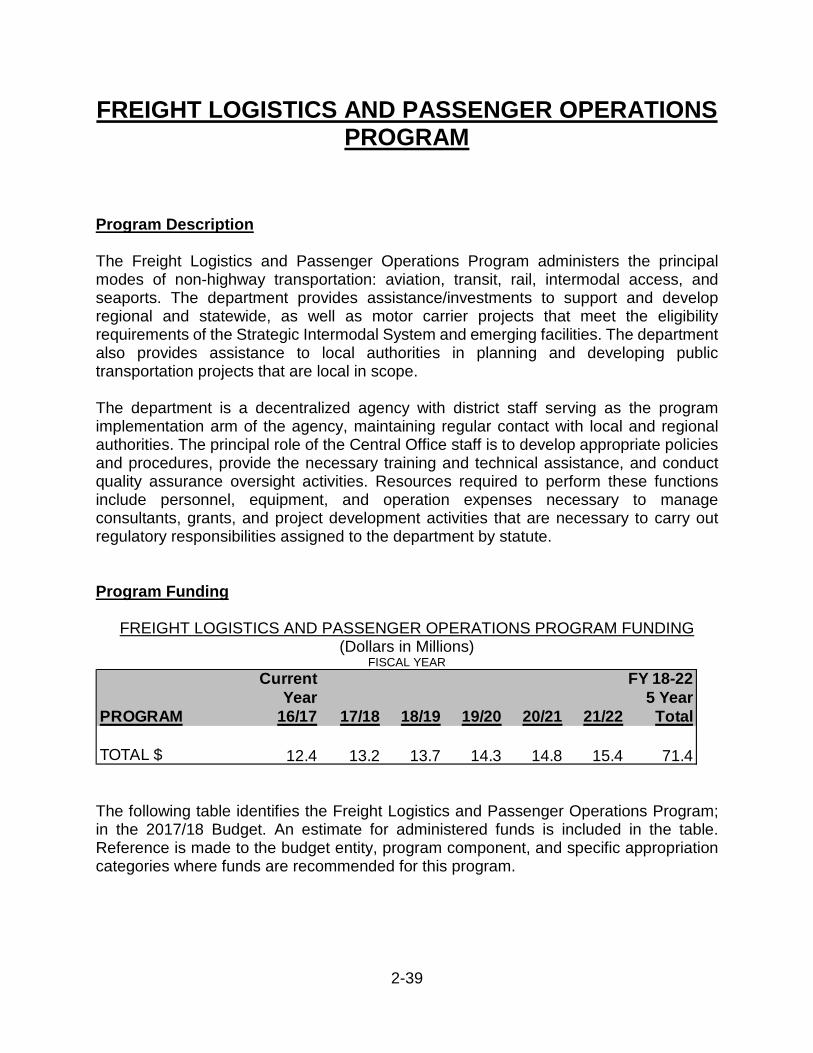
2-39
FREIGHT LOGISTICS AND PASSENGER OPERATIONS PROGRAM
Program Description
The Freight Logistics and Passenger Operations Program administers the principal modes of non-highway transportation: aviation, transit, rail, intermodal access, and seaports. The department provides assistance/investments to support and develop regional and statewide, as well as motor carrier projects that meet the eligibility requirements of the Strategic Intermodal System and emerging facilities. The department also provides assistance to local authorities in planning and developing public transportation projects that are local in scope.
The department is a decentralized agency with district staff serving as the program implementation arm of the agency, maintaining regular contact with local and regional authorities. The principal role of the Central Office staff is to develop appropriate policies and procedures, provide the necessary training and technical assistance, and conduct quality assurance oversight activities. Resources required to perform these functions include personnel, equipment, and operation expenses necessary to manage consultants, grants, and project development activities that are necessary to carry out regulatory responsibilities assigned to the department by statute.
Program Funding
FREIGHT LOGISTICS AND PASSENGER OPERATIONS PROGRAM FUNDING (Dollars in Millions)
FISCAL YEAR
The following table identifies the Freight Logistics and Passenger Operations Program; in the 2017/18 Budget. An estimate for administered funds is included in the table. Reference is made to the budget entity, program component, and specific appropriation categories where funds are recommended for this program.
Current FY 18-22Year 5 Year
PROGRAM 16/17 17/18 18/19 19/20 20/21 21/22 Total
TOTAL $ 12.4 13.2 13.7 14.3 14.8 15.4 71.4
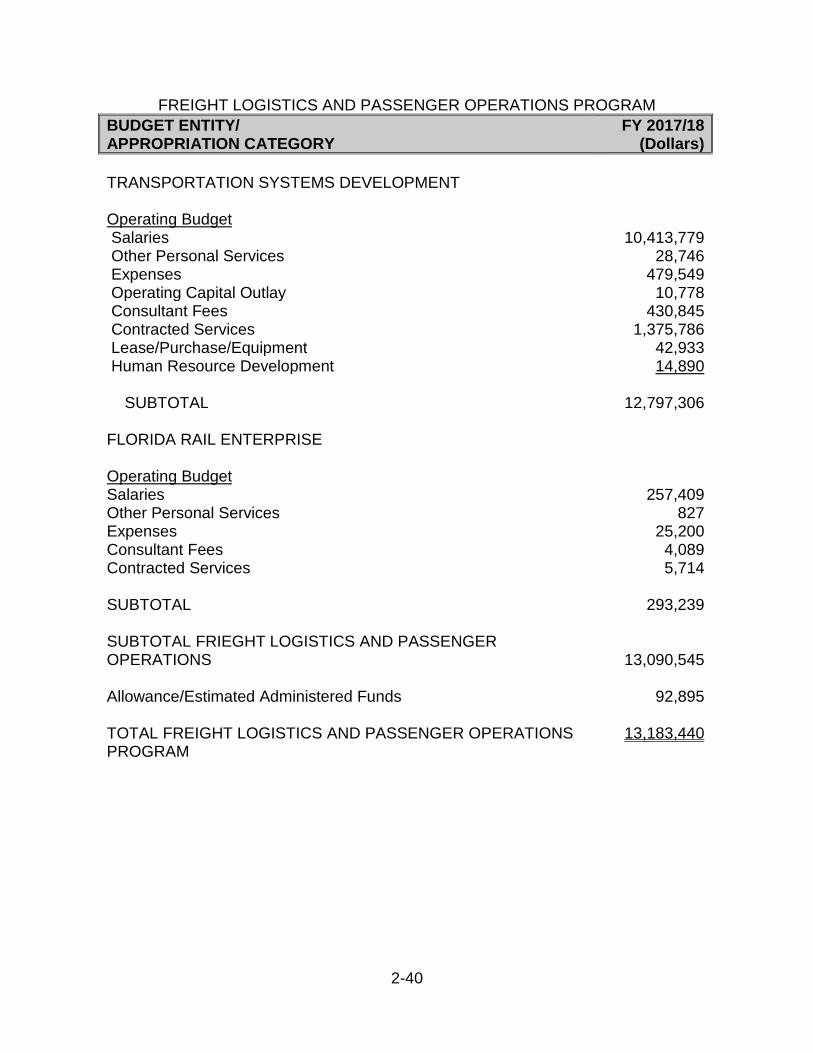
2-40
FREIGHT LOGISTICS AND PASSENGER OPERATIONS PROGRAM
BUDGET ENTITY/ APPROPRIATION CATEGORY
FY 2017/18(Dollars)
TRANSPORTATION SYSTEMS DEVELOPMENT
Operating BudgetSalaries 10,413,779Other Personal Services 28,746Expenses 479,549Operating Capital Outlay 10,778Consultant Fees 430,845
Contracted Services Lease/Purchase/Equipment
1,375,78642,933
Human Resource Development 14,890
SUBTOTAL 12,797,306
FLORIDA RAIL ENTERPRISE
Operating Budget Salaries Other Personal Services Expenses Consultant Fees Contracted Services
SUBTOTAL
SUBTOTAL FRIEGHT LOGISTICS AND PASSENGER OPERATIONS
257,409827
25,2004,0895,714
293,239
13,090,545
Allowance/Estimated Administered Funds 92,895
TOTAL FREIGHT LOGISTICS AND PASSENGER OPERATIONS PROGRAM
13,183,440
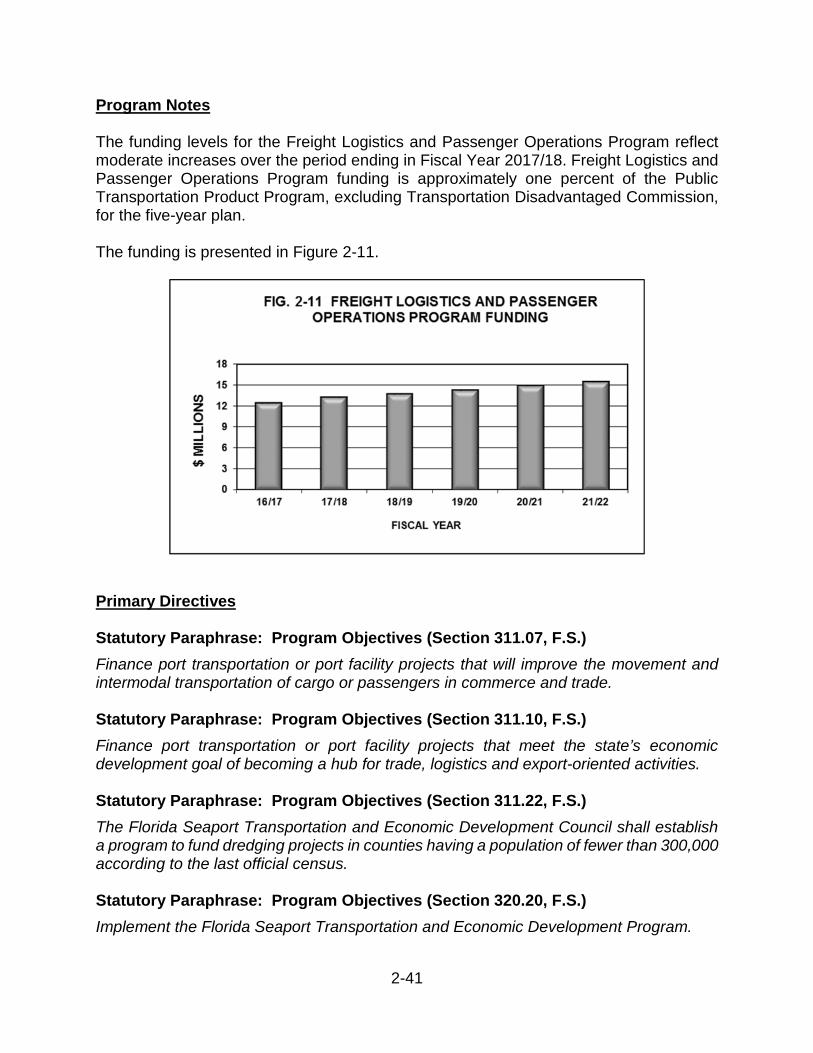
2-41
Program Notes
The funding levels for the Freight Logistics and Passenger Operations Program reflect moderate increases over the period ending in Fiscal Year 2017/18. Freight Logistics and Passenger Operations Program funding is approximately one percent of the Public Transportation Product Program, excluding Transportation Disadvantaged Commission, for the five-year plan.
The funding is presented in Figure 2-11.
Primary Directives
Statutory Paraphrase: Program Objectives (Section 311.07, F.S.)
Finance port transportation or port facility projects that will improve the movement and intermodal transportation of cargo or passengers in commerce and trade.
Statutory Paraphrase: Program Objectives (Section 311.10, F.S.)
Finance port transportation or port facility projects that meet the state’s economic development goal of becoming a hub for trade, logistics and export-oriented activities.
Statutory Paraphrase: Program Objectives (Section 311.22, F.S.)
The Florida Seaport Transportation and Economic Development Council shall establish a program to fund dredging projects in counties having a population of fewer than 300,000 according to the last official census.
Statutory Paraphrase: Program Objectives (Section 320.20, F.S.)
Implement the Florida Seaport Transportation and Economic Development Program.
2-42
Statutory Paraphrase: Program Objectives (Section 331.360, F.S.)
Promote the further development and improvement of aerospace transportation facilities by entering into joint participation agreements with Space Florida and allocate funds for such purposes in its work program
Statutory Paraphrase: Program Objectives (Section 332.006, F.S.)
Develop a viable aviation system in this state.
Statutory Paraphrase: Program Objectives (Section 334.044 (33), F.S.)
Develop a freight mobility and trade plan.
Statutory Paraphrase: Program Objectives (Section 334.046, F.S.)
Plan an integrated, balanced statewide transportation system based on the prevailing principles: preserving the existing transportation infrastructure; enhancing Florida’s economic competitiveness; and improving travel choices to ensure mobility.
Statutory Paraphrase: Duties and Powers (Section 341.051, F.S.)
Administration and financing of public transit and intercity bus service programs and projects.
Statutory Paraphrase: Duties and Powers (Section 341.053, F.S.)
Provide for major capital investments in fixed guideway transportation systems, access to seaports, airports, and other transportation terminals, and assist in the development of dedicated bus lanes.
Statutory Paraphrase: Duties and Powers (Section 341.302, F.S.)
Develop and implement a rail program of statewide application.
Florida Transportation Plan Goals:
• Agile, resilient, and quality infrastructure.
• Efficient and reliable mobility for people and freight.
• More transportation choices for people and freight.
• Transportation solutions that support Florida’s global economic competitiveness.
• Transportation solutions that support quality places to live, learn, work, and play.
Florida Transportation Plan Objectives:
• Meet or exceed industry, state, national, or international standards for infrastructure quality, condition, and performance for all modes of transportation.
2-43
• Adapt transportation infrastructure and technologies to meet changing customer needs.
• Reduce delays related to bottlenecks, gaps, and crashes and other incidents for all modes of Florida’s transportation system.
• Increase the reliability of all modes of Florida’s transportation system.
• Increase the efficiency and flexibility of transportation-related regulatory processes.
• Increase the use of new mobility options and technologies such as share, automated, and connected vehicles.
• Increase the share of person trips using public transportation and other alternatives to single occupancy motor vehicles.
• Increase the number of quality options for visitor travel to, from, and within Florida.
• Increase the number of quality options for moving freight to, from, and within Florida.
• Increase the efficiency and convenience of connecting between multiple modes of transportation.
• Provide transportation infrastructure and services to support job growth in transportation-dependent industries and clusters.
• Increase transportation connectivity between Florida’s economic centers and regions.
• Increase transportation connectivity between Florida and global and national trading partners and visitor origin markets.
• Plan and develop transportation systems that reflect regional and community values, visions, and needs.
• Increase customer satisfaction with Florida’s transportation system.
• Provide convenient, efficient accessibility to the transportation system for Florida’s residents and visitors.
• Provide transportation solutions that contribute to improved public health.
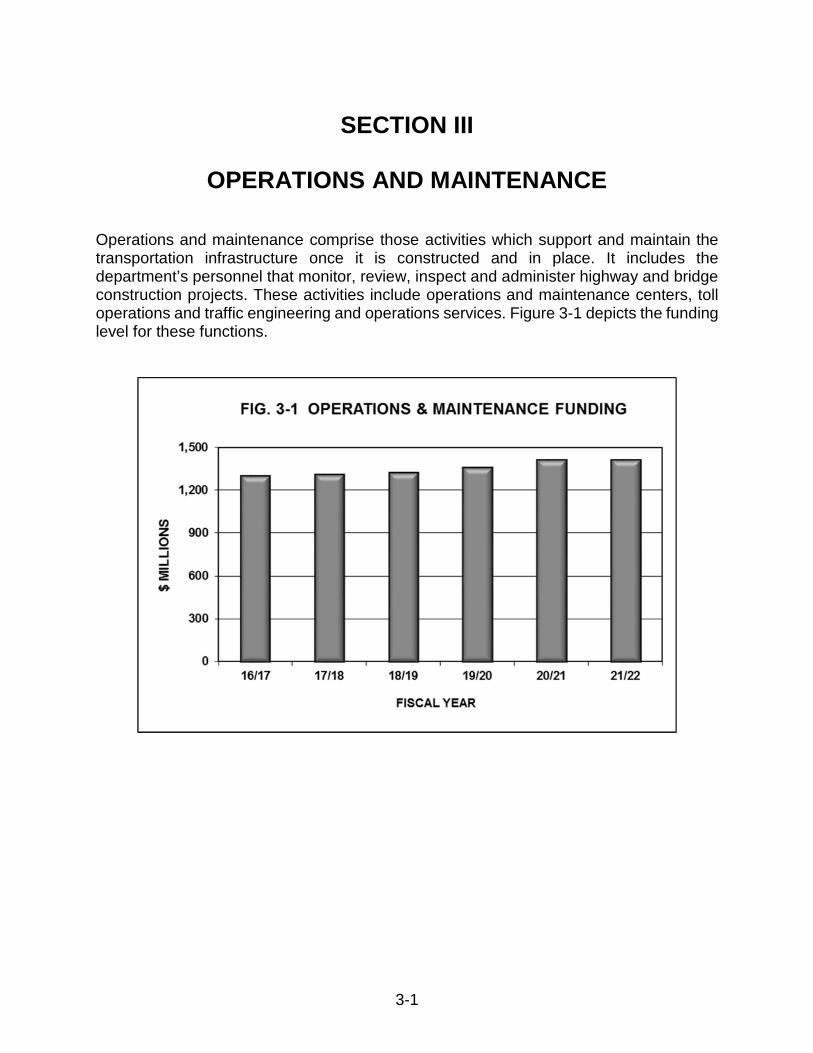
3-1
SECTION III
OPERATIONS AND MAINTENANCE
Operations and maintenance comprise those activities which support and maintain the transportation infrastructure once it is constructed and in place. It includes the department’s personnel that monitor, review, inspect and administer highway and bridge construction projects. These activities include operations and maintenance centers, toll operations and traffic engineering and operations services. Figure 3-1 depicts the funding level for these functions.
3-2
OPERATIONS & MAINTENANCE PROGRAM
Program Description
The Operations and Maintenance Program consists of: Construction, Engineering, and Inspection (CEI); Maintenance; Warehouse Operations; and Central Mobile Equipment (CME). The Operations and Maintenance Program exists within the Highway Operations and Turnpike budget entities. Highway Maintenance contracts and consultants are represented in the Operations and Maintenance Program. CEI consultants are aligned with the CEI Program.
The department has consolidated various construction resident offices, maintenance yards, and CME shops into Operations and Maintenance Centers (OMCs). This consolidation enabled these units to operate more efficiently. The OMCs are managed by either a maintenance engineer or a construction engineer.
The combining of all construction, maintenance, and CME employees allowed the Department to increase flexibility in its workforce, thus eliminating organizational and managerial reporting relationship issues in People First.
The CEI in-house unit utilizes resources required to monitor, review, inspect, and administer highway and bridge construction projects. These actions are carried out with:
• Monitoring by the State Construction Office (Central Office), through the development of specifications and/or procedures;
• Performing Quality Assurance Reviews; and
• Ensuring the execution of CEI project management activities by the District Construction Engineer and staff.
The CME and Warehouse Operations units are an enterprise structured program funded by the State Transportation Trust Fund. The units’ function involves: acquisition and maintenance of Department motor vehicles, maintenance equipment, and housing of vehicle parts and maintenance supplies in support of the department’s Five Year Work Program.
The units operate a sign and structure shop that manufactures traffic signs and Department specialty items and equipment. Budgeted resources required to accomplish the program's activities include personnel, equipment, and operating expenses.
The CME unit acquires, maintains, and disposes of all state owned vehicles (automobiles, trucks) and equipment (tractors, mowers, compressors, generators, trailers and maintenance equipment) used by the Department. The equipment replacement value is approximately $175 million. The CME repair shops and refueling stations are located throughout the state.
3-3
The Warehouse Operations unit oversees 27 warehouse locations (25 warehouses, a sign fabrication shop, and a structures fabrication shop) with a total inventory value of approximately $6.1 million. Inventory in excess of over 10,000 active commodities consists of:
• Automotive replacement parts and service items;
• Janitorial supplies;
• Safety equipment, roadway maintenance materials and signs; and
• Horticultural supplies, tools, concrete and other materials.
The Maintenance unit ensures the routine maintenance of roadways and bridges. The State Highway System Inventory consists of 43,763 lane miles. Of that, 43,198 lane miles are maintained under the Routine Maintenance Program. Five Hundred Fifteen (515) and Two Hundred Seven (207) lane miles are maintained by the Central Florida Expressway Authority and by the Miami-Dade County Expressway Authority.
The State Bridge Inventory consists of 12,262 bridges1. Of that, 6,836 are Florida Department of Transportation (FDOT) bridges and 5,426 are local bridges. Of the 6,836 FDOT owned bridges, 6,424 are maintained and inspected by FDOT, 116 are maintained and inspected by Miami-Dade County Expressway Authority and 296 are maintained and inspected by Central Florida Expressway Authority. Scheduled major repairs or replacements, such as resurfacing, bridge replacement, or traffic operations improvements are part of the product programs of Resurfacing, Bridge, State Highway System, and Other Roads.
Program Products
The quality and effectiveness of the maintenance portion of the Operations and Maintenance Program is monitored by periodic surveys. A Maintenance Rating Program (MRP) has been developed which evaluates and rates actual field conditions in five elements. Those elements that are identified (below) were developed to assess the condition of maintenance items. To preserve the investment in transportation facilities, maintenance must be provided with an adequate level of funding.
By consistently achieving a maintenance rating of 80, the system can be maintained at a desired level and a stable planned cycle of repairs or resurfacing can be programmed. (The Florida Transportation Plan objective is to achieve and maintain a MRP of 80). A maintenance rating evaluation is conducted every four months by the department. Composite scores are developed for each of the five rating elements. The results are compared to previous surveys and attention is focused to achieve a MRP of 80 on
1 Data from bridge inventory as of 2016 reported to the Office of Work Program and Budget from the State Maintenance Office. Pedestrian overpasses are excluded.
3-4
individual and overall ratings. Comparisons between districts are also made. The five rating elements and characteristics are:
1. Roadway - Flexible potholes, edge ravelings, shovings, depressions/bumps, paved shoulders/turnouts, rigid potholes, and joints/crackings.
2. Roadside - Shoulder unpaved, front slope, slope pavement, sidewalk, and fence.
3. Vegetation/Aesthetics - Roadside mowing, slope mowing, landscaping, tree trimming, curb/sidewalk edging, litter removal, and turf condition.
4. Traffic Services - Raised pavement markers, striping, pavement symbols, guardrails, attenuators, signs less than and equal to 30 square feet, signs greater than 30 square feet, object markers, delineators and lighting.
5. Drainage Side/cross drains, roadside/median ditches, outfall ditches, inlets, miscellaneous drainages, and roadway sweeping.
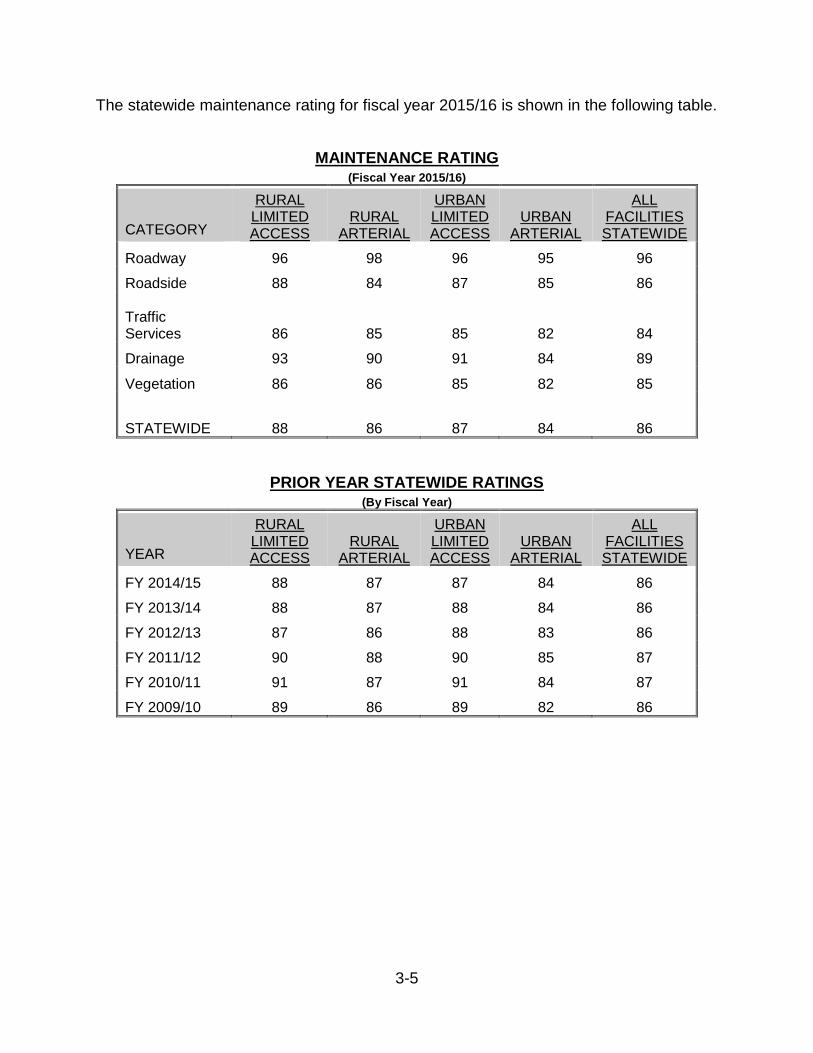
3-5
The statewide maintenance rating for fiscal year 2015/16 is shown in the following table.
MAINTENANCE RATING (Fiscal Year 2015/16)
CATEGORY
RURAL LIMITED ACCESS
RURAL ARTERIAL
URBAN LIMITED ACCESS
URBAN ARTERIAL
ALL FACILITIES STATEWIDE
Roadway 96 98 96 95 96
Roadside 88 84 87 85 86
Traffic Services 86 85 85 82 84
Drainage 93 90 91 84 89
Vegetation 86 86 85 82 85
STATEWIDE 88 86 87 84 86
PRIOR YEAR STATEWIDE RATINGS (By Fiscal Year)
YEAR
RURAL LIMITED ACCESS
RURAL ARTERIAL
URBAN LIMITED ACCESS
URBAN ARTERIAL
ALL FACILITIES STATEWIDE
FY 2014/15 88 87 87 84 86
FY 2013/14 88 87 88 84 86
FY 2012/13 87 86 88 83 86
FY 2011/12 90 88 90 85 87
FY 2010/11 91 87 91 84 87
FY 2009/10 89 86 89 82 86
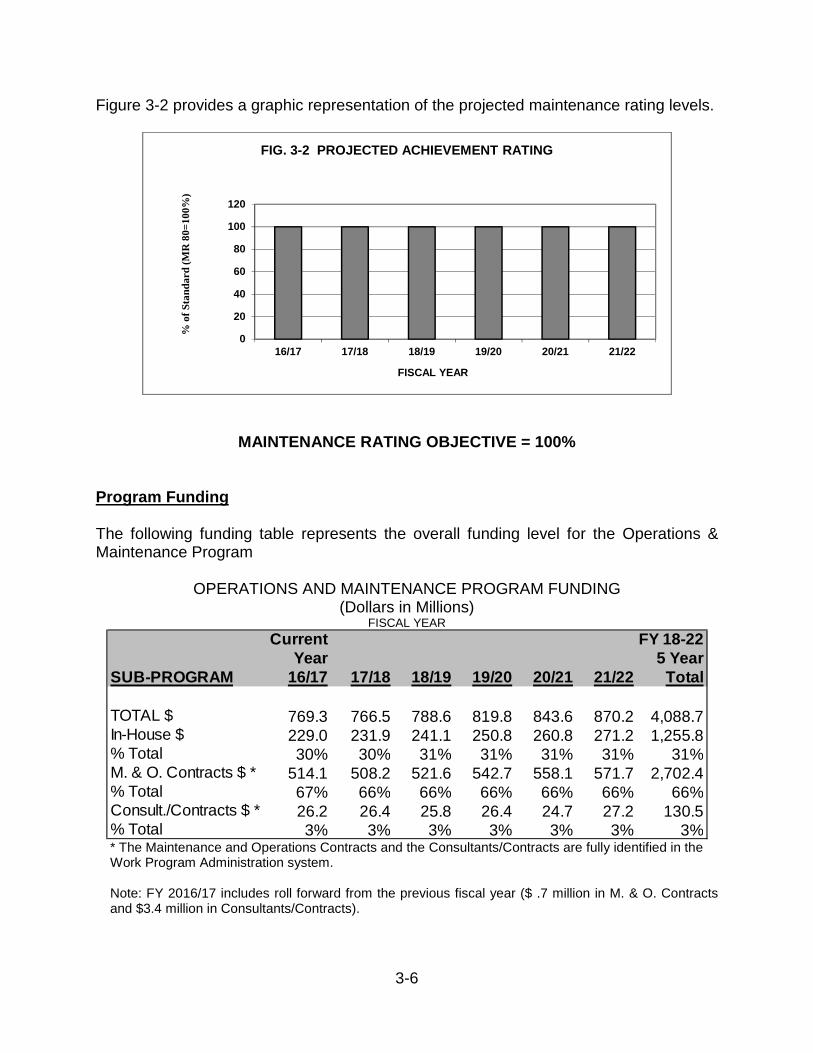
3-6
Figure 3-2 provides a graphic representation of the projected maintenance rating levels.
MAINTENANCE RATING OBJECTIVE = 100%
Program Funding
The following funding table represents the overall funding level for the Operations & Maintenance Program
OPERATIONS AND MAINTENANCE PROGRAM FUNDING (Dollars in Millions)
FISCAL YEAR
* The Maintenance and Operations Contracts and the Consultants/Contracts are fully identified in the Work Program Administration system.
Note: FY 2016/17 includes roll forward from the previous fiscal year ($ .7 million in M. & O. Contracts and $3.4 million in Consultants/Contracts).
0
20
40
60
80
100
120
16/17 17/18 18/19 19/20 20/21 21/22
% o
f S
tan
da
rd (
MR
80
=1
00
%)
FISCAL YEAR
FIG. 3-2 PROJECTED ACHIEVEMENT RATING
Current FY 18-22Year 5 Year
SUB-PROGRAM 16/17 17/18 18/19 19/20 20/21 21/22 Total
TOTAL $ 769.3 766.5 788.6 819.8 843.6 870.2 4,088.7In-House $ 229.0 231.9 241.1 250.8 260.8 271.2 1,255.8% Total 30% 30% 31% 31% 31% 31% 31%M. & O. Contracts $ * 514.1 508.2 521.6 542.7 558.1 571.7 2,702.4% Total 67% 66% 66% 66% 66% 66% 66%Consult./Contracts $ * 26.2 26.4 25.8 26.4 24.7 27.2 130.5% Total 3% 3% 3% 3% 3% 3% 3%
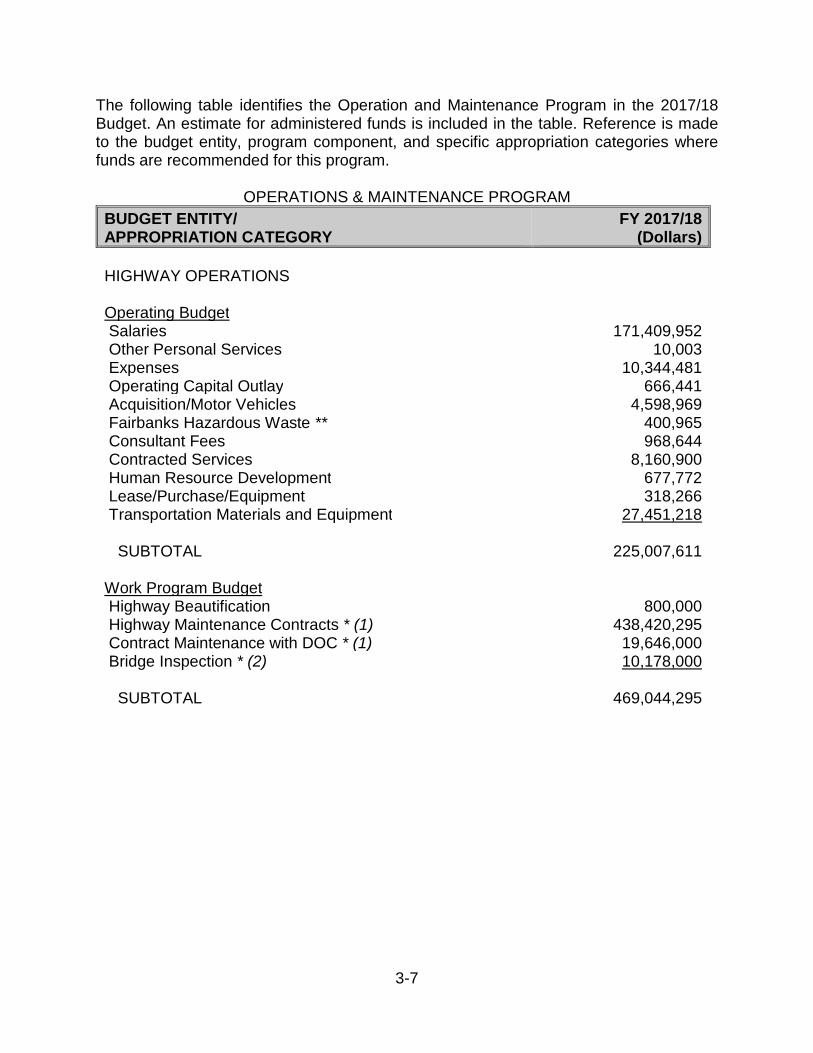
3-7
The following table identifies the Operation and Maintenance Program in the 2017/18 Budget. An estimate for administered funds is included in the table. Reference is made to the budget entity, program component, and specific appropriation categories where funds are recommended for this program.
OPERATIONS & MAINTENANCE PROGRAM
BUDGET ENTITY/ APPROPRIATION CATEGORY
FY 2017/18(Dollars)
HIGHWAY OPERATIONS
Operating BudgetSalaries 171,409,952Other Personal Services 10,003Expenses 10,344,481Operating Capital Outlay 666,441Acquisition/Motor Vehicles 4,598,969Fairbanks Hazardous Waste ** 400,965Consultant Fees 968,644Contracted Services 8,160,900Human Resource Development 677,772Lease/Purchase/Equipment 318,266Transportation Materials and Equipment 27,451,218
SUBTOTAL 225,007,611
Work Program BudgetHighway Beautification 800,000Highway Maintenance Contracts * (1) 438,420,295Contract Maintenance with DOC * (1) 19,646,000Bridge Inspection * (2) 10,178,000
SUBTOTAL 469,044,295
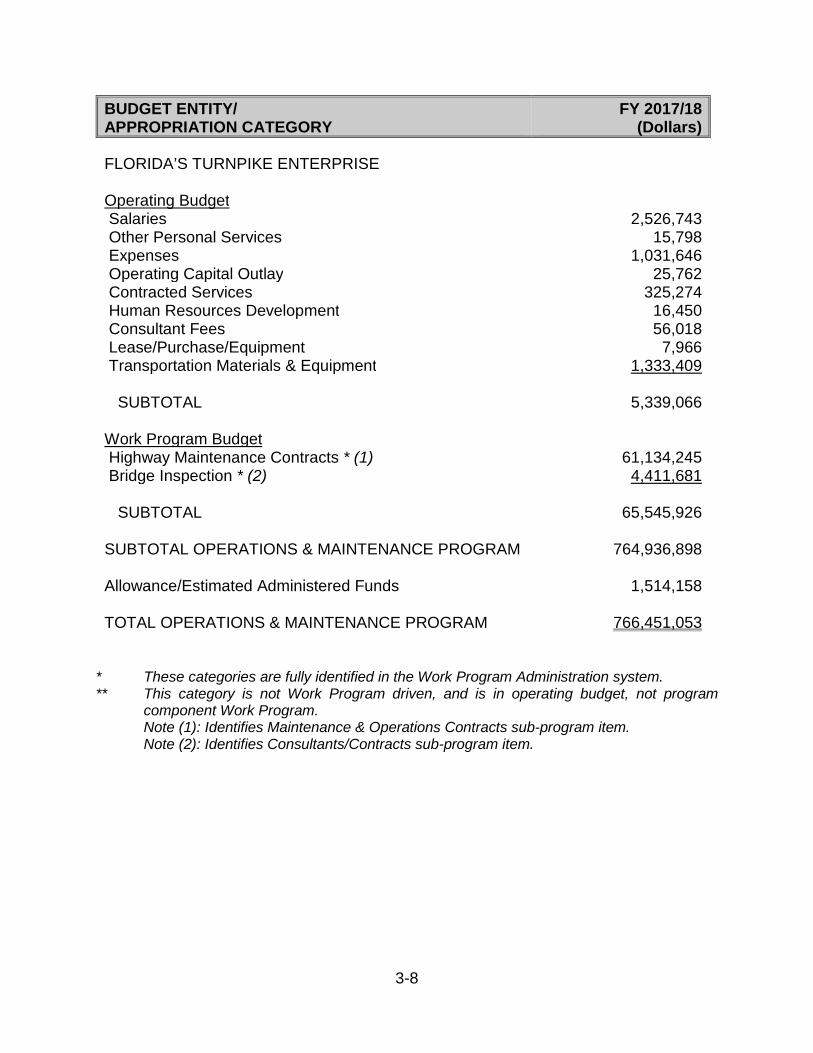
3-8
BUDGET ENTITY/ APPROPRIATION CATEGORY
FY 2017/18(Dollars)
FLORIDA’S TURNPIKE ENTERPRISE
Operating BudgetSalaries 2,526,743Other Personal Services 15,798Expenses 1,031,646Operating Capital Outlay 25,762Contracted Services 325,274Human Resources Development 16,450
Consultant Fees Lease/Purchase/Equipment
56,0187,966
Transportation Materials & Equipment 1,333,409
SUBTOTAL 5,339,066
Work Program Budget Highway Maintenance Contracts * (1) Bridge Inspection * (2)
61,134,2454,411,681
SUBTOTAL 65,545,926
SUBTOTAL OPERATIONS & MAINTENANCE PROGRAM 764,936,898
Allowance/Estimated Administered Funds 1,514,158
TOTAL OPERATIONS & MAINTENANCE PROGRAM 766,451,053
* These categories are fully identified in the Work Program Administration system. ** This category is not Work Program driven, and is in operating budget, not program
component Work Program. Note (1): Identifies Maintenance & Operations Contracts sub-program item. Note (2): Identifies Consultants/Contracts sub-program item.
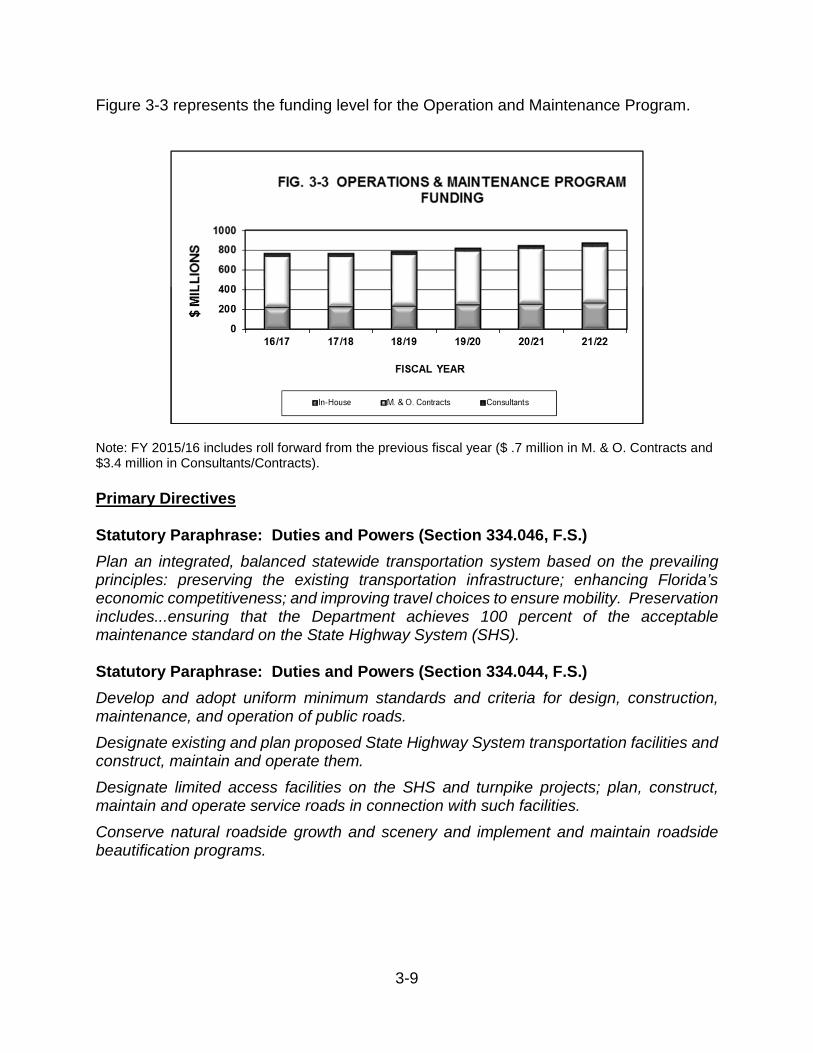
3-9
Figure 3-3 represents the funding level for the Operation and Maintenance Program.
Note: FY 2015/16 includes roll forward from the previous fiscal year ($ .7 million in M. & O. Contracts and $3.4 million in Consultants/Contracts).
Primary Directives
Statutory Paraphrase: Duties and Powers (Section 334.046, F.S.)
Plan an integrated, balanced statewide transportation system based on the prevailing principles: preserving the existing transportation infrastructure; enhancing Florida’s economic competitiveness; and improving travel choices to ensure mobility. Preservation includes...ensuring that the Department achieves 100 percent of the acceptable maintenance standard on the State Highway System (SHS).
Statutory Paraphrase: Duties and Powers (Section 334.044, F.S.)
Develop and adopt uniform minimum standards and criteria for design, construction, maintenance, and operation of public roads.
Designate existing and plan proposed State Highway System transportation facilities and construct, maintain and operate them.
Designate limited access facilities on the SHS and turnpike projects; plan, construct, maintain and operate service roads in connection with such facilities.
Conserve natural roadside growth and scenery and implement and maintain roadside beautification programs.
3-10
Statutory Paraphrase: Duties and Powers (Section 334.044, F.S.)
To purchase, lease, or otherwise acquire property, materials, equipment, and supplies and to sell, exchange, or otherwise dispose of any property which is no longer needed by the Department.
Florida Transportation Plan Goals:
• Safety and security for residents, visitors, and businesses.
• Agile, resilient, and quality transportation infrastructure.
• Efficient and reliable mobility for people and freight.
Florida Transportation Plan Objectives:
• Prevent transportation-related fatalities and serious injuries.
• Provide transportation infrastructure and services to help prepare for, respond to, and recover from emergencies.
• Meet or exceed industry, state, national, or international standards for infrastructure quality, condition, and performance for all modes of transportation.
• Increase the resiliency of infrastructure to risks, including extreme weather and other environmental conditions.
• Reduce delays related to bottlenecks, gaps, and crashes and other incidents for all modes of Florida’s transportation system.
• Increase the reliability of all modes of Florida’s transportation system.
3-11
TRAFFIC ENGINEERING AND OPERATIONS
Program Description
The objective of this program is to develop and apply solutions to traffic engineering problems that do not require major structural alterations of existing or planned roadways. The Traffic Engineering and Operations program applies to Central Office (Tallahassee) and District Offices.
Central Office is responsible for monitoring and evaluating the District Office’s performance in several program areas (Operations, Traffic Engineering Studies, Signing, and Traffic Signals). Additionally, Central Office provides certification of all traffic control signal devices purchased and installed in the state. Other key programs are the Intelligent Transportation Systems Program (ITS), the Statewide Incident Management Program, and the Safe Mobility for Life Program.
Central Office establishes standards, specifications, policies, and procedures for traffic operations applications as well as develop special statewide operations projects.
District Offices collect and analyze data, carry out access management strategies, review and comment on various construction and maintenance design plans, and complete operational and safety studies. The districts also implement the department’s standard traffic signal operation strategies, and oversee a system of uniform traffic control devices.
The implementation of the statewide ITS plan is done by District Office staff. The resources required to perform these activities include personnel, equipment, operating expenses, and external consultants.
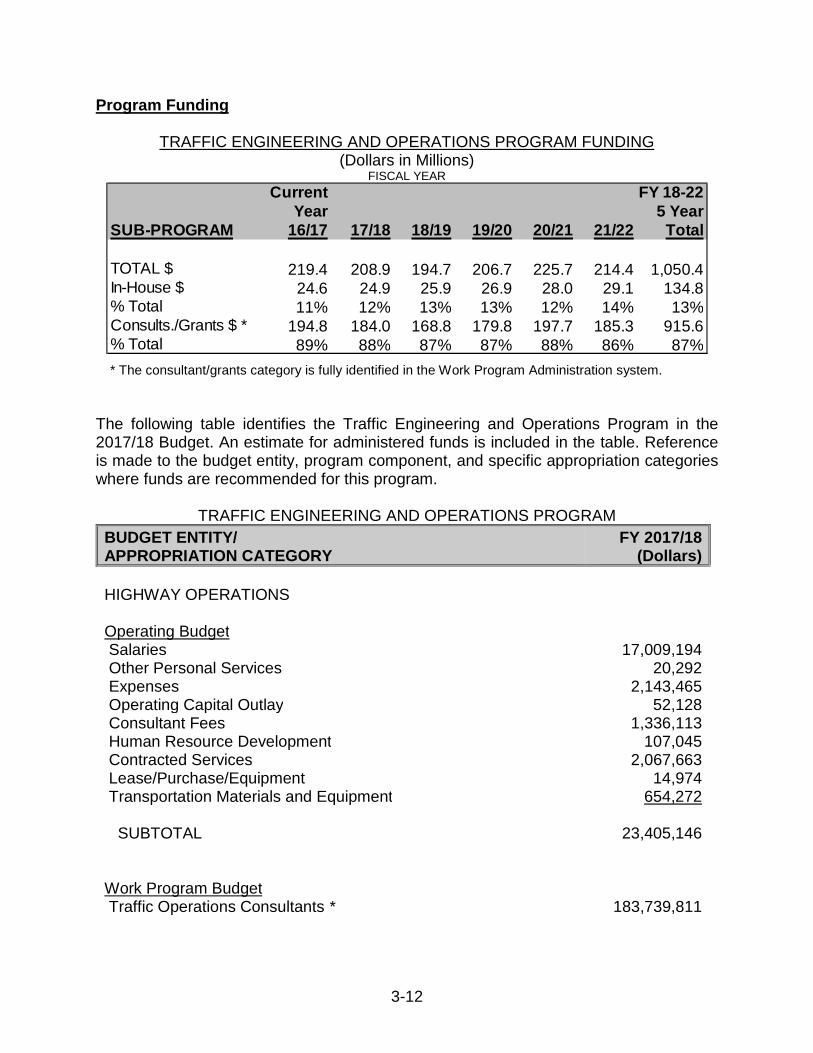
3-12
Program Funding
TRAFFIC ENGINEERING AND OPERATIONS PROGRAM FUNDING (Dollars in Millions)
FISCAL YEAR
* The consultant/grants category is fully identified in the Work Program Administration system.
The following table identifies the Traffic Engineering and Operations Program in the 2017/18 Budget. An estimate for administered funds is included in the table. Reference is made to the budget entity, program component, and specific appropriation categories where funds are recommended for this program.
TRAFFIC ENGINEERING AND OPERATIONS PROGRAM
BUDGET ENTITY/ APPROPRIATION CATEGORY
FY 2017/18(Dollars)
HIGHWAY OPERATIONS
Operating BudgetSalaries 17,009,194Other Personal Services 20,292Expenses 2,143,465Operating Capital Outlay 52,128Consultant Fees 1,336,113Human Resource Development 107,045Contracted Services 2,067,663Lease/Purchase/Equipment 14,974Transportation Materials and Equipment 654,272
SUBTOTAL 23,405,146
Work Program BudgetTraffic Operations Consultants * 183,739,811
Current FY 18-22Year 5 Year
SUB-PROGRAM 16/17 17/18 18/19 19/20 20/21 21/22 Total
TOTAL $ 219.4 208.9 194.7 206.7 225.7 214.4 1,050.4In-House $ 24.6 24.9 25.9 26.9 28.0 29.1 134.8% Total 11% 12% 13% 13% 12% 14% 13%Consults./Grants $ * 194.8 184.0 168.8 179.8 197.7 185.3 915.6% Total 89% 88% 87% 87% 88% 86% 87%
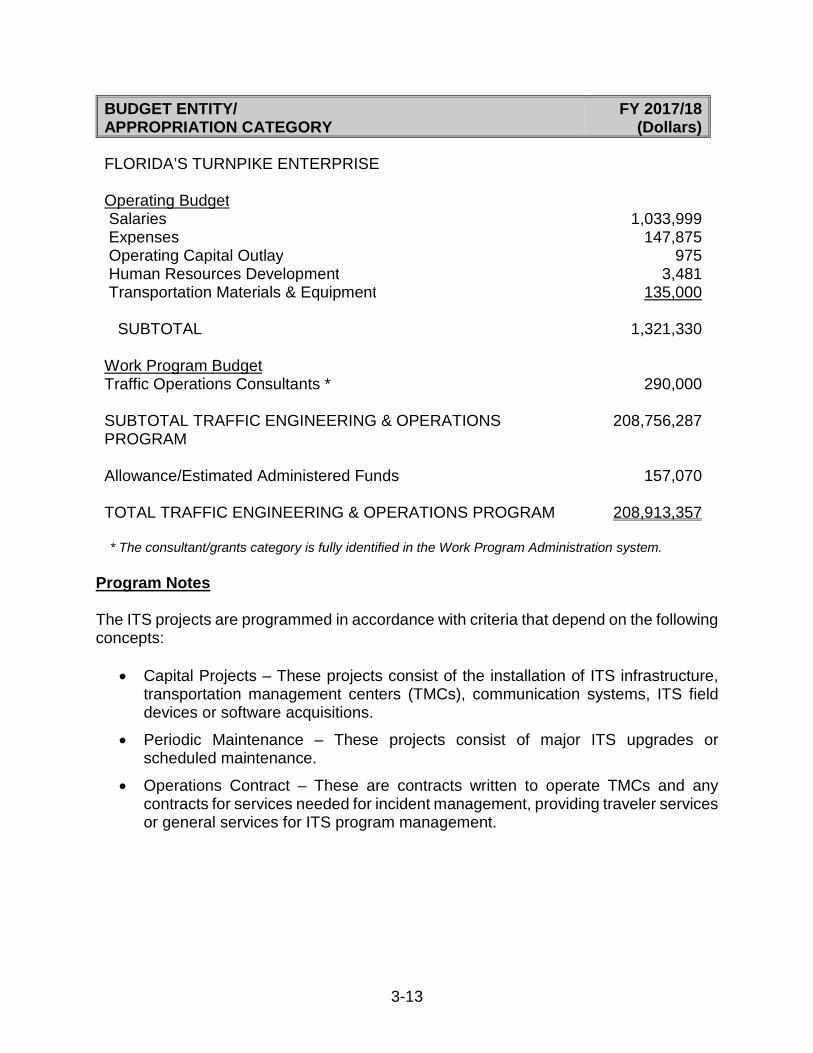
3-13
BUDGET ENTITY/ APPROPRIATION CATEGORY
FY 2017/18(Dollars)
FLORIDA’S TURNPIKE ENTERPRISE
Operating BudgetSalaries 1,033,999Expenses 147,875Operating Capital Outlay 975Human Resources Development 3,481Transportation Materials & Equipment 135,000
SUBTOTAL 1,321,330
Work Program Budget Traffic Operations Consultants * 290,000
SUBTOTAL TRAFFIC ENGINEERING & OPERATIONS PROGRAM
208,756,287
Allowance/Estimated Administered Funds 157,070
TOTAL TRAFFIC ENGINEERING & OPERATIONS PROGRAM 208,913,357
* The consultant/grants category is fully identified in the Work Program Administration system.
Program Notes
The ITS projects are programmed in accordance with criteria that depend on the following concepts:
• Capital Projects – These projects consist of the installation of ITS infrastructure, transportation management centers (TMCs), communication systems, ITS field devices or software acquisitions.
• Periodic Maintenance – These projects consist of major ITS upgrades or scheduled maintenance.
• Operations Contract – These are contracts written to operate TMCs and any contracts for services needed for incident management, providing traveler services or general services for ITS program management.
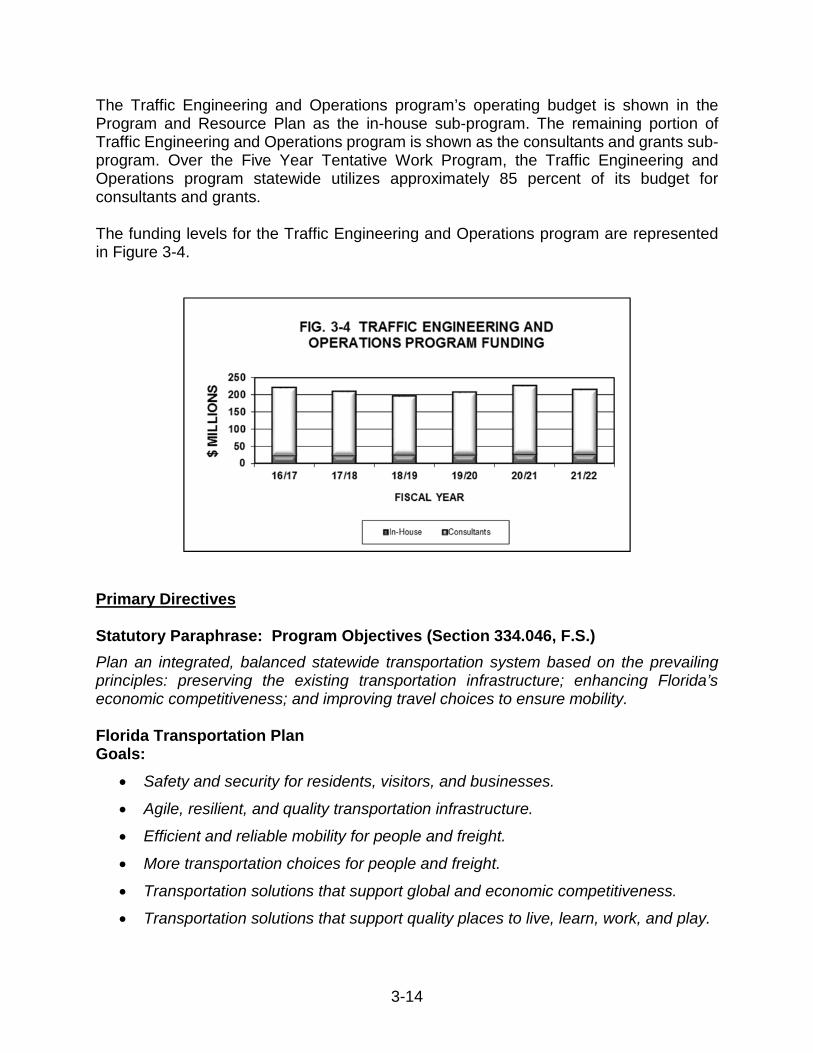
3-14
The Traffic Engineering and Operations program’s operating budget is shown in the Program and Resource Plan as the in-house sub-program. The remaining portion of Traffic Engineering and Operations program is shown as the consultants and grants sub-program. Over the Five Year Tentative Work Program, the Traffic Engineering and Operations program statewide utilizes approximately 85 percent of its budget for consultants and grants.
The funding levels for the Traffic Engineering and Operations program are represented in Figure 3-4.
Primary Directives
Statutory Paraphrase: Program Objectives (Section 334.046, F.S.)
Plan an integrated, balanced statewide transportation system based on the prevailing principles: preserving the existing transportation infrastructure; enhancing Florida’s economic competitiveness; and improving travel choices to ensure mobility.
Florida Transportation Plan Goals:
• Safety and security for residents, visitors, and businesses.
• Agile, resilient, and quality transportation infrastructure.
• Efficient and reliable mobility for people and freight.
• More transportation choices for people and freight.
• Transportation solutions that support global and economic competitiveness.
• Transportation solutions that support quality places to live, learn, work, and play.
3-15
Florida Transportation Plan Objectives:
• Prevent transportation-related fatalities and serious injuries.
• Reduce the number of crashes on the transportation system.
• Prevent and mitigate transportation-related security risks.
• Provide transportation infrastructure and services to help prepare for, respond to, and recover from emergencies.
• Adapt transportation infrastructure and technologies to meet changing customer needs.
• Reduce delays related to bottlenecks, gaps, and crashes and other incidents for all modes of Florida’s transportation system.
• Increase the reliability of all modes of Florida’s transportation system.
• Increase the efficiency of the supply chain for freight moving to, from, and through Florida.
• Increase the use of new mobility options and technologies such as share, automated, and connected vehicles.
• Increase the efficiency and convenience of connecting between multiple modes of transportation.
• Provide transportation infrastructure and services to support job growth in transportation-dependent industries and clusters.
• Plan and develop transportation systems that reflect regional and community values, visions, and needs.
• Increase customer satisfaction with Florida’s transportation system.
• Provide convenient, efficient accessibility to the transportation system for Florida’s residents and visitors.
• Provide transportation solutions that contribute to improved public health.
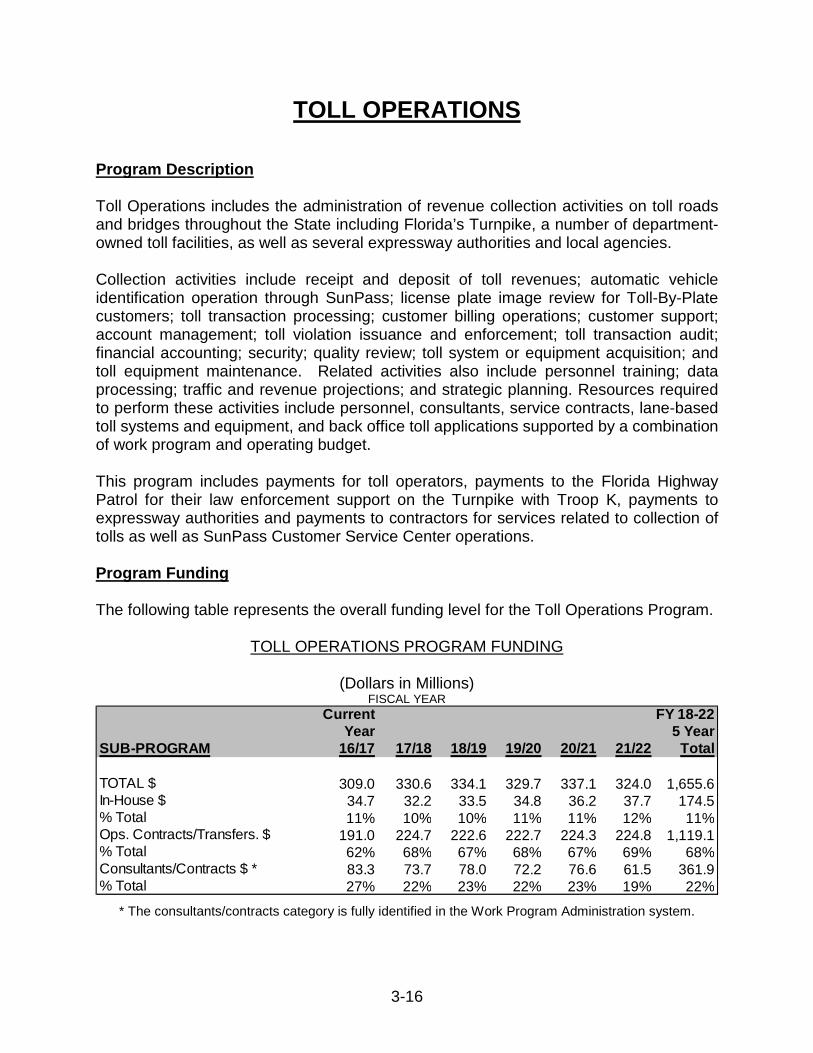
3-16
TOLL OPERATIONS
Program Description
Toll Operations includes the administration of revenue collection activities on toll roads and bridges throughout the State including Florida’s Turnpike, a number of department-owned toll facilities, as well as several expressway authorities and local agencies.
Collection activities include receipt and deposit of toll revenues; automatic vehicle identification operation through SunPass; license plate image review for Toll-By-Plate customers; toll transaction processing; customer billing operations; customer support; account management; toll violation issuance and enforcement; toll transaction audit; financial accounting; security; quality review; toll system or equipment acquisition; and toll equipment maintenance. Related activities also include personnel training; data processing; traffic and revenue projections; and strategic planning. Resources required to perform these activities include personnel, consultants, service contracts, lane-based toll systems and equipment, and back office toll applications supported by a combination of work program and operating budget.
This program includes payments for toll operators, payments to the Florida Highway Patrol for their law enforcement support on the Turnpike with Troop K, payments to expressway authorities and payments to contractors for services related to collection of tolls as well as SunPass Customer Service Center operations.
Program Funding
The following table represents the overall funding level for the Toll Operations Program.
TOLL OPERATIONS PROGRAM FUNDING
(Dollars in Millions) FISCAL YEAR
* The consultants/contracts category is fully identified in the Work Program Administration system.
Current FY 18-22Year 5 Year
SUB-PROGRAM 16/17 17/18 18/19 19/20 20/21 21/22 Total
TOTAL $ 309.0 330.6 334.1 329.7 337.1 324.0 1,655.6In-House $ 34.7 32.2 33.5 34.8 36.2 37.7 174.5% Total 11% 10% 10% 11% 11% 12% 11%Ops. Contracts/Transfers. $ 191.0 224.7 222.6 222.7 224.3 224.8 1,119.1% Total 62% 68% 67% 68% 67% 69% 68%Consultants/Contracts $ * 83.3 73.7 78.0 72.2 76.6 61.5 361.9% Total 27% 22% 23% 22% 23% 19% 22%
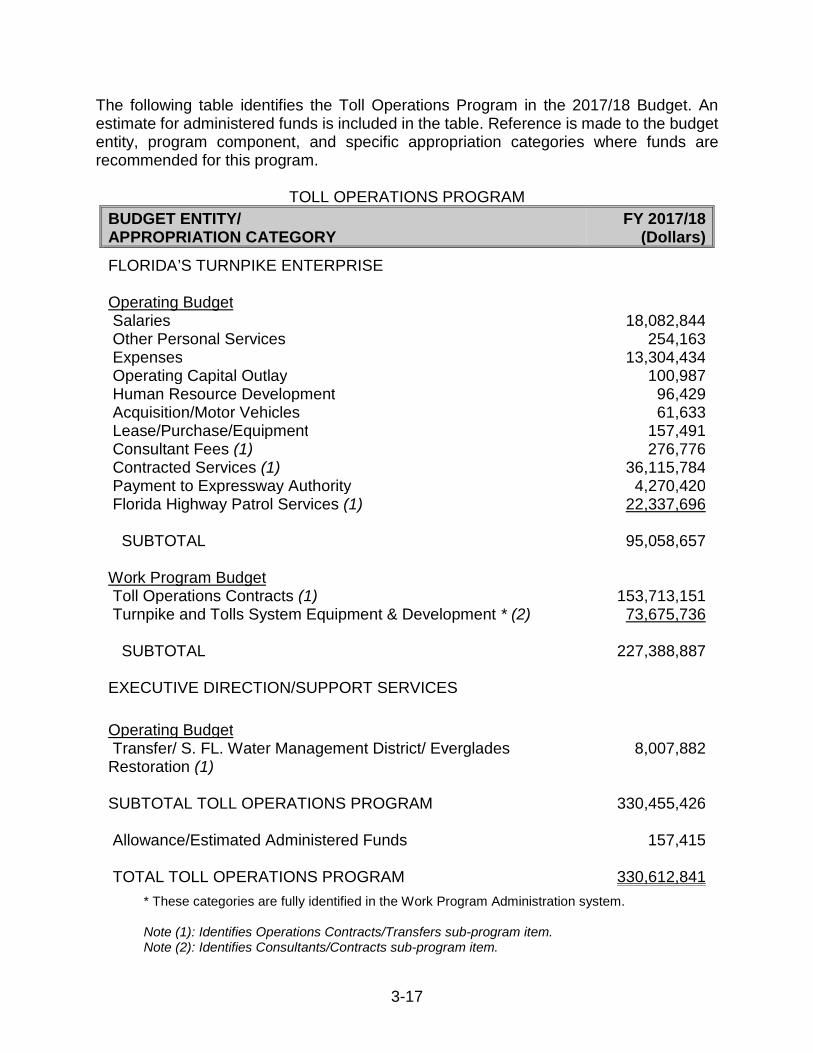
3-17
The following table identifies the Toll Operations Program in the 2017/18 Budget. An estimate for administered funds is included in the table. Reference is made to the budget entity, program component, and specific appropriation categories where funds are recommended for this program.
TOLL OPERATIONS PROGRAM
BUDGET ENTITY/ APPROPRIATION CATEGORY
FY 2017/18(Dollars)
FLORIDA’S TURNPIKE ENTERPRISE
Operating BudgetSalaries 18,082,844Other Personal Services 254,163Expenses 13,304,434Operating Capital Outlay 100,987Human Resource Development 96,429Acquisition/Motor Vehicles 61,633Lease/Purchase/Equipment 157,491Consultant Fees (1) 276,776Contracted Services (1) 36,115,784Payment to Expressway Authority 4,270,420Florida Highway Patrol Services (1) 22,337,696
SUBTOTAL 95,058,657
Work Program Budget Toll Operations Contracts (1) 153,713,151Turnpike and Tolls System Equipment & Development * (2) 73,675,736
SUBTOTAL 227,388,887
EXECUTIVE DIRECTION/SUPPORT SERVICES
Operating Budget Transfer/ S. FL. Water Management District/ Everglades Restoration (1)
8,007,882
SUBTOTAL TOLL OPERATIONS PROGRAM 330,455,426
Allowance/Estimated Administered Funds 157,415
TOTAL TOLL OPERATIONS PROGRAM 330,612,841
* These categories are fully identified in the Work Program Administration system.
Note (1): Identifies Operations Contracts/Transfers sub-program item. Note (2): Identifies Consultants/Contracts sub-program item.
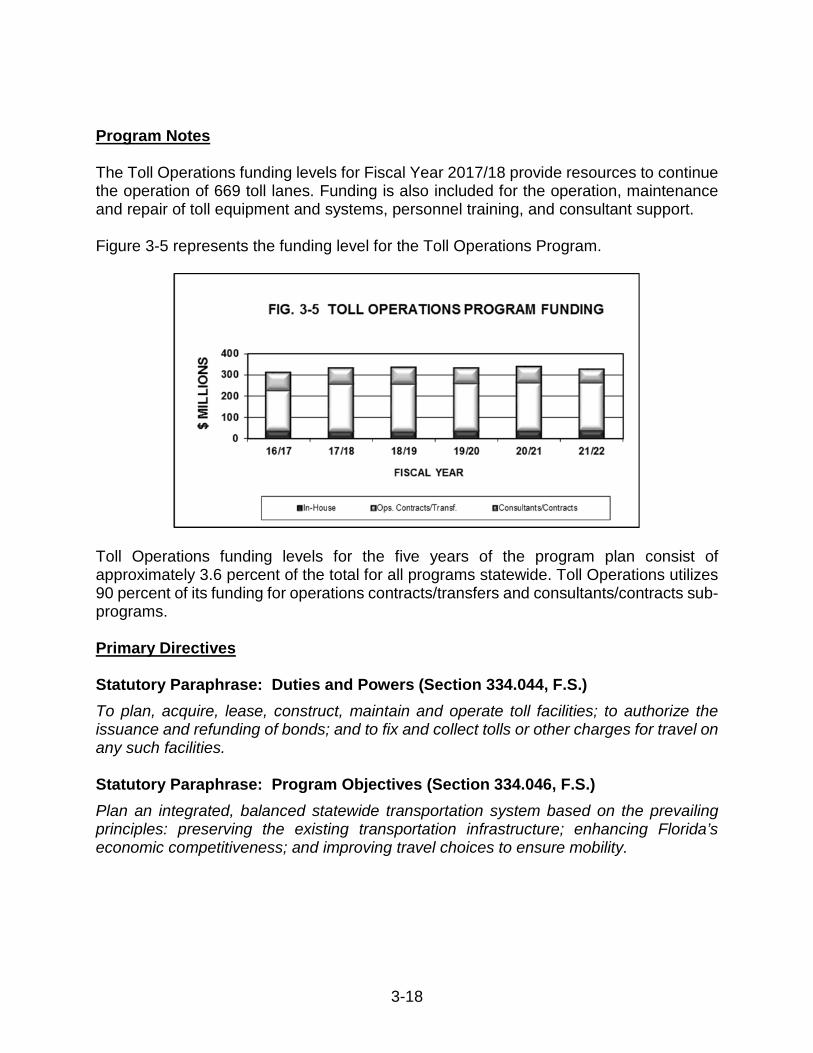
3-18
Program Notes
The Toll Operations funding levels for Fiscal Year 2017/18 provide resources to continue the operation of 669 toll lanes. Funding is also included for the operation, maintenance and repair of toll equipment and systems, personnel training, and consultant support.
Figure 3-5 represents the funding level for the Toll Operations Program.
Toll Operations funding levels for the five years of the program plan consist of approximately 3.6 percent of the total for all programs statewide. Toll Operations utilizes 90 percent of its funding for operations contracts/transfers and consultants/contracts sub-programs.
Primary Directives
Statutory Paraphrase: Duties and Powers (Section 334.044, F.S.)
To plan, acquire, lease, construct, maintain and operate toll facilities; to authorize the issuance and refunding of bonds; and to fix and collect tolls or other charges for travel on any such facilities.
Statutory Paraphrase: Program Objectives (Section 334.046, F.S.)
Plan an integrated, balanced statewide transportation system based on the prevailing principles: preserving the existing transportation infrastructure; enhancing Florida’s economic competitiveness; and improving travel choices to ensure mobility.
3-19
Florida Transportation Plan Goals:
• Safety and security for residents, visitors, and businesses.
• Agile, resilient, and quality transportation infrastructure.
• Efficient and reliable mobility for people and freight.
• More transportation choices for people and freight.
• Transportation solutions that support global and economic competitiveness.
• Transportation solutions that support quality places to live, learn, work, and play.
• Transportation solutions that enhance Florida’s environment and conserve energy.
Florida Transportation Plan Objectives:
• Prevent transportation-related fatalities ansd serious injuries.
• Reduce the number of crashes on the transportation system.
• Prevent and mitigate transportation-related security risks.
• Provide transportation infrastructure and services to help prepare for, respond to and recover from emergencies.
• Optimize the functionality and efficiency of existing infrastructure and right-of-way.
• Adapt transportation infrastructure and technologies to meet changing customer needs.
• Increase customer satisfaction with Florida’s transportation system..
• Decrease transportation-related air quality pollutants and greenhouse gas emissions.
• Reduce delays related to bottlenecks, gaps, and crashes and other incidents for all modes of Florida’s transportation system.
• Increase the reliability of all modes of Florida’s transportation system.
• Increase the efficiency of the supply chain for freight moving to, from, and through Florida.
• Increase the use of new mobility options and technologies such as share, automated, and connected vehicles.
• Increase the efficiency and convenience of connecting between multiple modes of transportation.
• Provide transportation infrastructure and services to support job growth in transportation-dependent industries and clusters.
3-20
• Increase transportation connectivity between Florida’s economic centers and regions.
• Plan and develop transportation systems that reflect regional and community values, visions, and needs.
• Provide convenient, efficient accessibility to the transportation system for Florida’s residents and visitors.
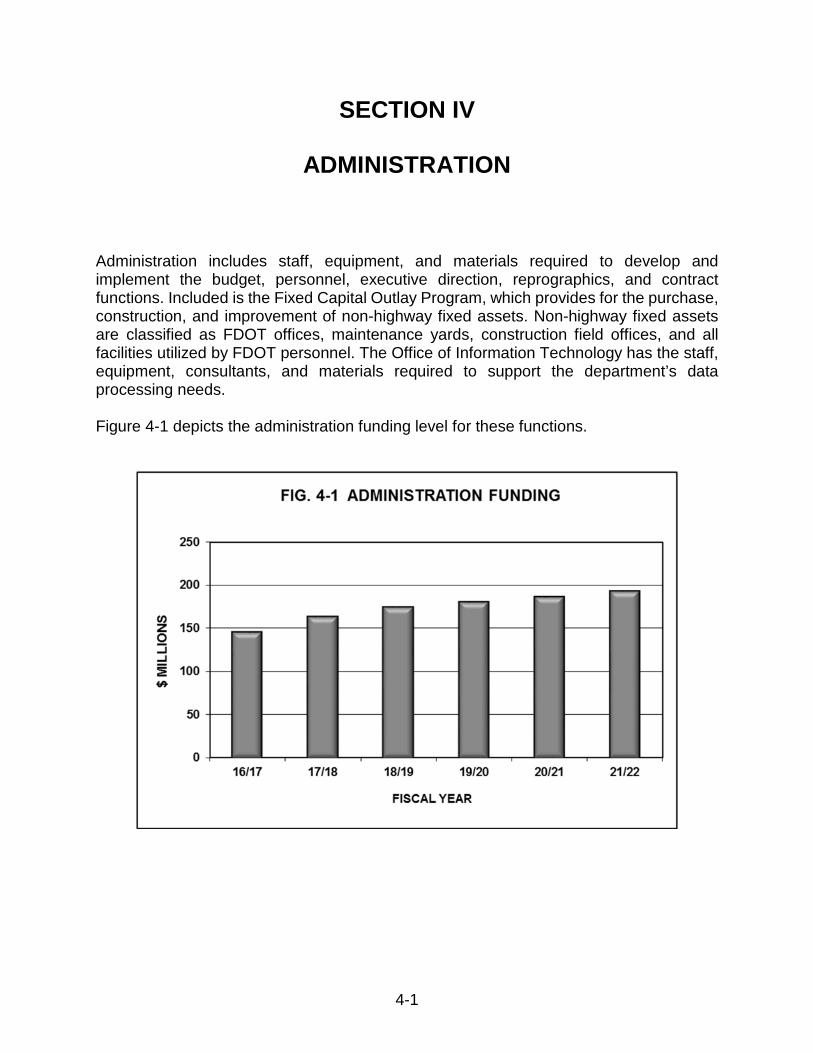
4-1
SECTION IV
ADMINISTRATION
Administration includes staff, equipment, and materials required to develop and implement the budget, personnel, executive direction, reprographics, and contract functions. Included is the Fixed Capital Outlay Program, which provides for the purchase, construction, and improvement of non-highway fixed assets. Non-highway fixed assets are classified as FDOT offices, maintenance yards, construction field offices, and all facilities utilized by FDOT personnel. The Office of Information Technology has the staff, equipment, consultants, and materials required to support the department’s data processing needs.
Figure 4-1 depicts the administration funding level for these functions.
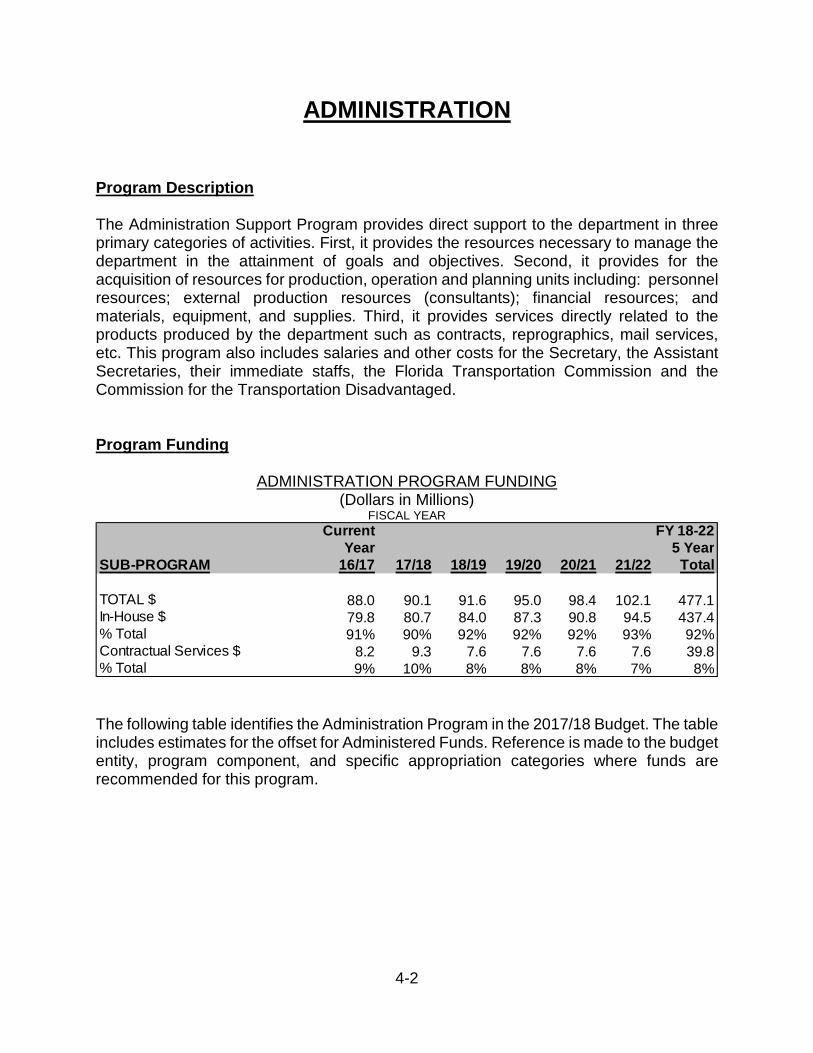
4-2
ADMINISTRATION
Program Description
The Administration Support Program provides direct support to the department in three primary categories of activities. First, it provides the resources necessary to manage the department in the attainment of goals and objectives. Second, it provides for the acquisition of resources for production, operation and planning units including: personnel resources; external production resources (consultants); financial resources; and materials, equipment, and supplies. Third, it provides services directly related to the products produced by the department such as contracts, reprographics, mail services, etc. This program also includes salaries and other costs for the Secretary, the Assistant Secretaries, their immediate staffs, the Florida Transportation Commission and the Commission for the Transportation Disadvantaged.
Program Funding
ADMINISTRATION PROGRAM FUNDING (Dollars in Millions)
FISCAL YEAR
The following table identifies the Administration Program in the 2017/18 Budget. The table includes estimates for the offset for Administered Funds. Reference is made to the budget entity, program component, and specific appropriation categories where funds are recommended for this program.
Current FY 18-22Year 5 Year
SUB-PROGRAM 16/17 17/18 18/19 19/20 20/21 21/22 Total
TOTAL $ 88.0 90.1 91.6 95.0 98.4 102.1 477.1In-House $ 79.8 80.7 84.0 87.3 90.8 94.5 437.4% Total 91% 90% 92% 92% 92% 93% 92%Contractual Services $ 8.2 9.3 7.6 7.6 7.6 7.6 39.8% Total 9% 10% 8% 8% 8% 7% 8%
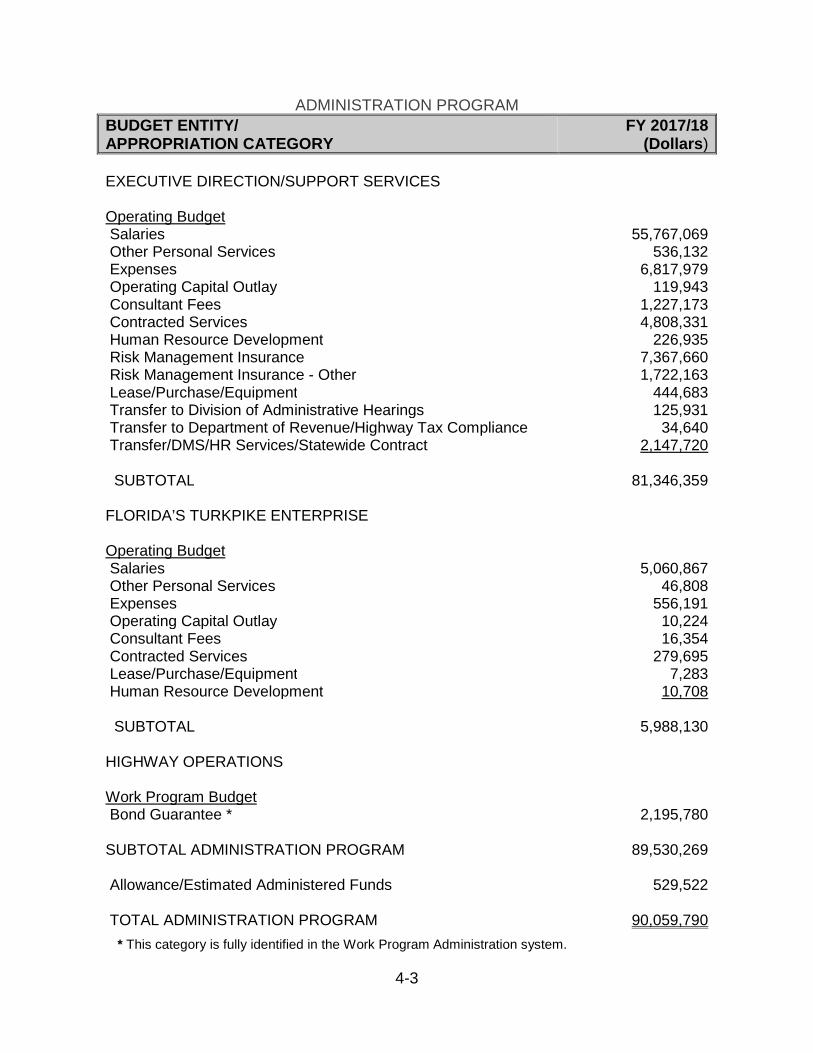
4-3
ADMINISTRATION PROGRAM
BUDGET ENTITY/ APPROPRIATION CATEGORY
FY 2017/18(Dollars)
EXECUTIVE DIRECTION/SUPPORT SERVICES
Operating BudgetSalaries 55,767,069Other Personal Services 536,132Expenses 6,817,979
Operating Capital Outlay 119,943Consultant Fees 1,227,173Contracted Services 4,808,331Human Resource Development 226,935Risk Management Insurance 7,367,660
Risk Management Insurance - Other 1,722,163Lease/Purchase/Equipment 444,683Transfer to Division of Administrative Hearings 125,931Transfer to Department of Revenue/Highway Tax Compliance 34,640Transfer/DMS/HR Services/Statewide Contract 2,147,720
SUBTOTAL 81,346,359
FLORIDA’S TURKPIKE ENTERPRISE
Operating Budget Salaries 5,060,867Other Personal Services 46,808Expenses 556,191Operating Capital Outlay 10,224
Consultant Fees 16,354 Contracted Services Lease/Purchase/Equipment
279,6957,283
Human Resource Development 10,708
SUBTOTAL 5,988,130
HIGHWAY OPERATIONS
Work Program Budget Bond Guarantee * 2,195,780
SUBTOTAL ADMINISTRATION PROGRAM 89,530,269
Allowance/Estimated Administered Funds 529,522
TOTAL ADMINISTRATION PROGRAM 90,059,790
* This category is fully identified in the Work Program Administration system.
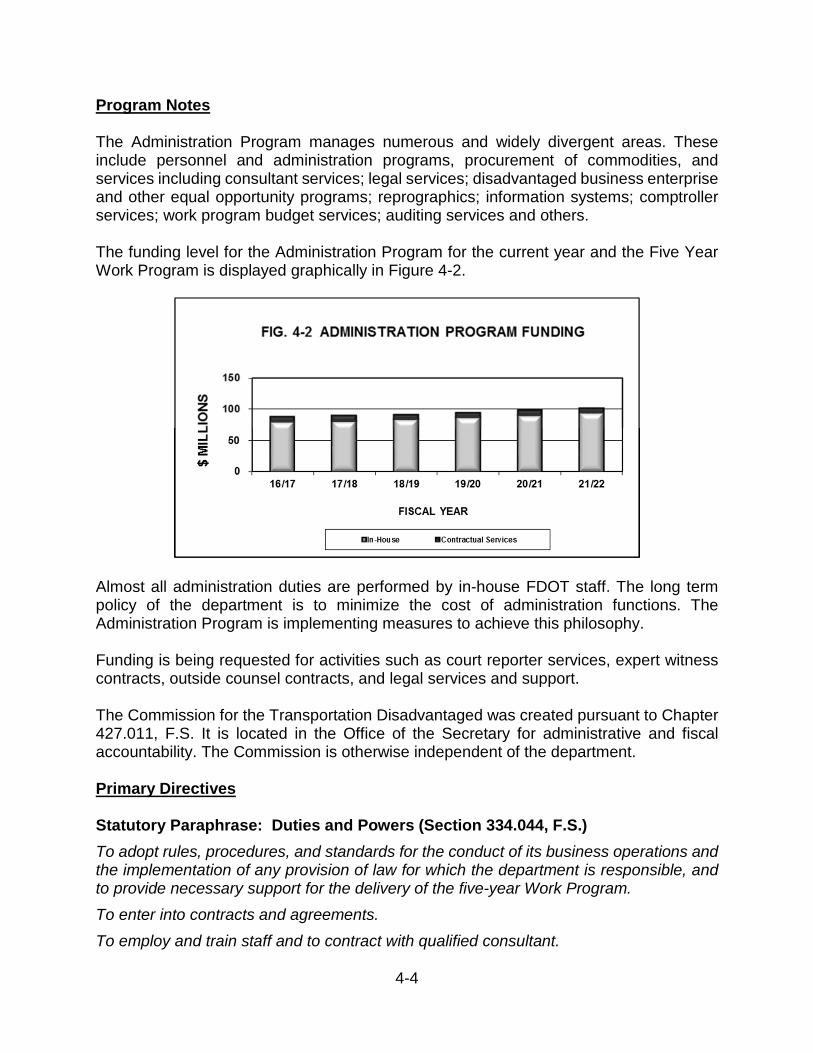
4-4
Program Notes
The Administration Program manages numerous and widely divergent areas. These include personnel and administration programs, procurement of commodities, and services including consultant services; legal services; disadvantaged business enterprise and other equal opportunity programs; reprographics; information systems; comptroller services; work program budget services; auditing services and others.
The funding level for the Administration Program for the current year and the Five Year Work Program is displayed graphically in Figure 4-2.
Almost all administration duties are performed by in-house FDOT staff. The long term policy of the department is to minimize the cost of administration functions. The Administration Program is implementing measures to achieve this philosophy.
Funding is being requested for activities such as court reporter services, expert witness contracts, outside counsel contracts, and legal services and support.
The Commission for the Transportation Disadvantaged was created pursuant to Chapter 427.011, F.S. It is located in the Office of the Secretary for administrative and fiscal accountability. The Commission is otherwise independent of the department.
Primary Directives
Statutory Paraphrase: Duties and Powers (Section 334.044, F.S.)
To adopt rules, procedures, and standards for the conduct of its business operations and the implementation of any provision of law for which the department is responsible, and to provide necessary support for the delivery of the five-year Work Program.
To enter into contracts and agreements.
To employ and train staff and to contract with qualified consultant.
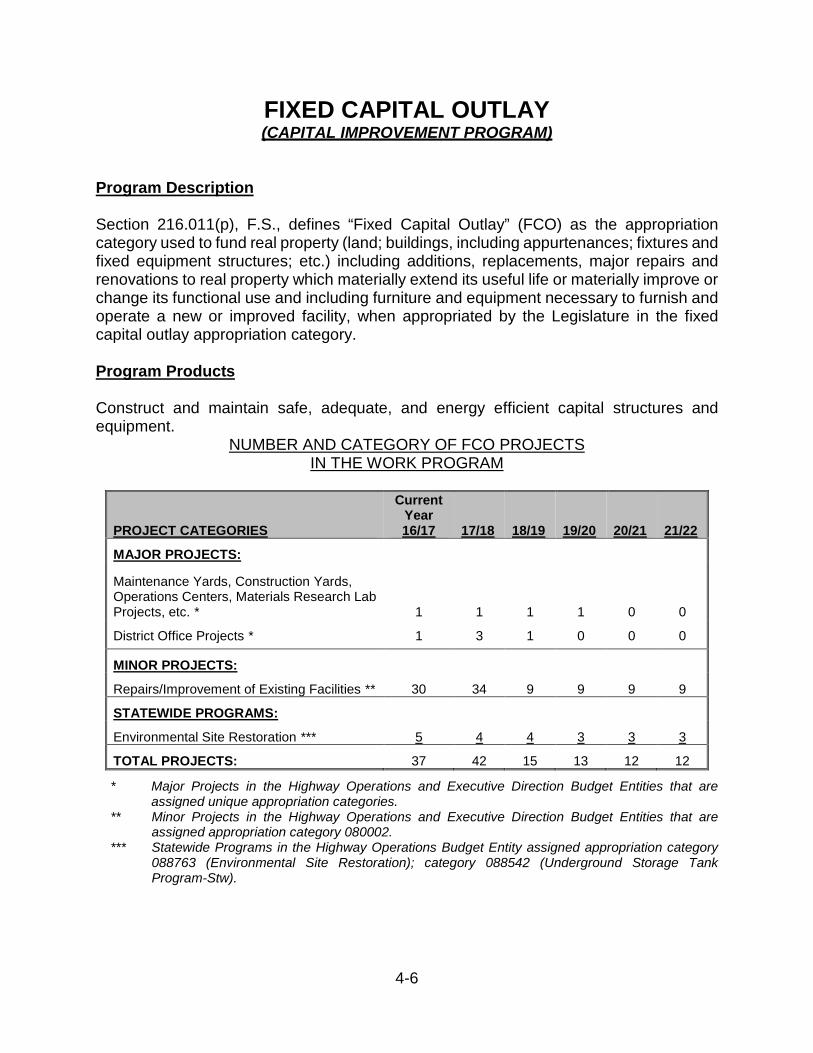
4-6
FIXED CAPITAL OUTLAY (CAPITAL IMPROVEMENT PROGRAM)
Program Description
Section 216.011(p), F.S., defines “Fixed Capital Outlay” (FCO) as the appropriation category used to fund real property (land; buildings, including appurtenances; fixtures and fixed equipment structures; etc.) including additions, replacements, major repairs and renovations to real property which materially extend its useful life or materially improve or change its functional use and including furniture and equipment necessary to furnish and operate a new or improved facility, when appropriated by the Legislature in the fixed capital outlay appropriation category.
Program Products
Construct and maintain safe, adequate, and energy efficient capital structures and equipment.
NUMBER AND CATEGORY OF FCO PROJECTS IN THE WORK PROGRAM
PROJECT CATEGORIES
Current Year 16/17 17/18 18/19 19/20 20/21 21/22
MAJOR PROJECTS:
Maintenance Yards, Construction Yards, Operations Centers, Materials Research Lab Projects, etc. * 1 1 1 1 0 0
District Office Projects * 1 3 1 0 0 0
MINOR PROJECTS:
Repairs/Improvement of Existing Facilities ** 30 34 9 9 9 9
STATEWIDE PROGRAMS:
Environmental Site Restoration *** 5 4 4 3 3 3
TOTAL PROJECTS: 37 42 15 13 12 12
* Major Projects in the Highway Operations and Executive Direction Budget Entities that are assigned unique appropriation categories.
** Minor Projects in the Highway Operations and Executive Direction Budget Entities that are assigned appropriation category 080002.
*** Statewide Programs in the Highway Operations Budget Entity assigned appropriation category 088763 (Environmental Site Restoration); category 088542 (Underground Storage Tank Program-Stw).
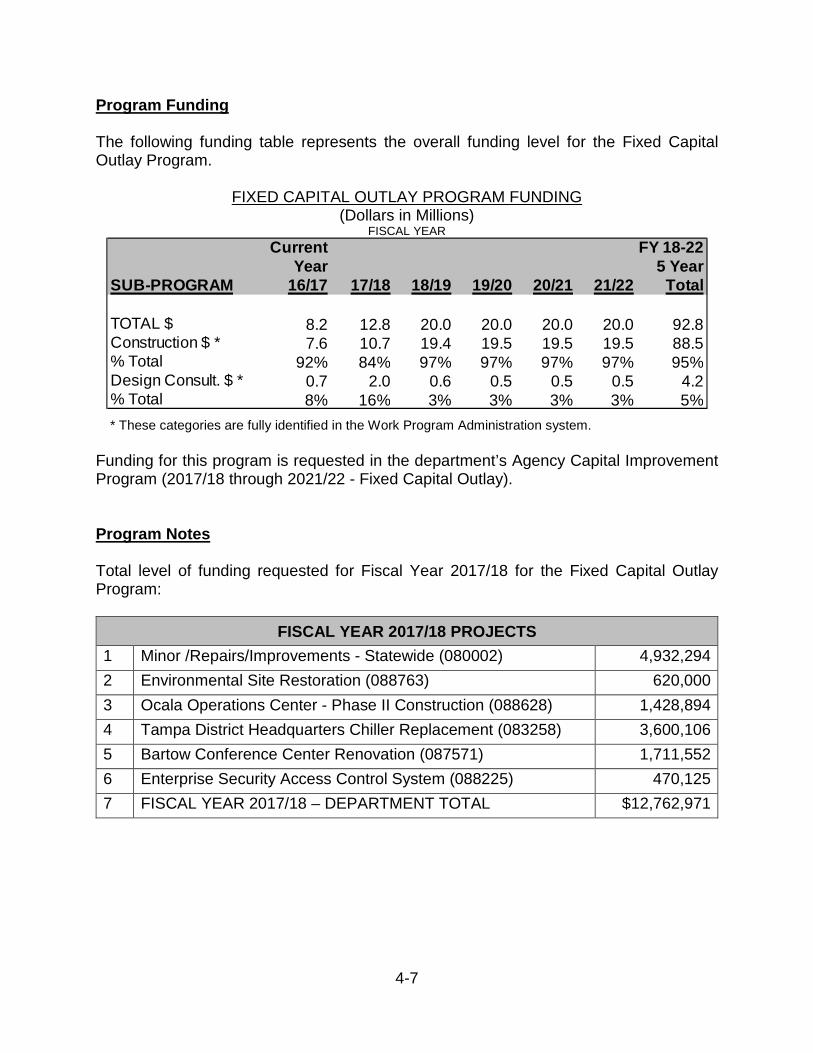
4-7
Program Funding
The following funding table represents the overall funding level for the Fixed Capital Outlay Program.
FIXED CAPITAL OUTLAY PROGRAM FUNDING (Dollars in Millions)
FISCAL YEAR
* These categories are fully identified in the Work Program Administration system.
Funding for this program is requested in the department’s Agency Capital Improvement Program (2017/18 through 2021/22 - Fixed Capital Outlay).
Program Notes
Total level of funding requested for Fiscal Year 2017/18 for the Fixed Capital Outlay Program:
FISCAL YEAR 2017/18 PROJECTS
1 Minor /Repairs/Improvements - Statewide (080002) 4,932,294
2 Environmental Site Restoration (088763) 620,000
3 Ocala Operations Center - Phase II Construction (088628) 1,428,894
4 Tampa District Headquarters Chiller Replacement (083258) 3,600,106
5 Bartow Conference Center Renovation (087571) 1,711,552
6 Enterprise Security Access Control System (088225) 470,125
7 FISCAL YEAR 2017/18 – DEPARTMENT TOTAL $12,762,971
Current FY 18-22Year 5 Year
SUB-PROGRAM 16/17 17/18 18/19 19/20 20/21 21/22 Total
TOTAL $ 8.2 12.8 20.0 20.0 20.0 20.0 92.8Construction $ * 7.6 10.7 19.4 19.5 19.5 19.5 88.5% Total 92% 84% 97% 97% 97% 97% 95%Design Consult. $ * 0.7 2.0 0.6 0.5 0.5 0.5 4.2% Total 8% 16% 3% 3% 3% 3% 5%
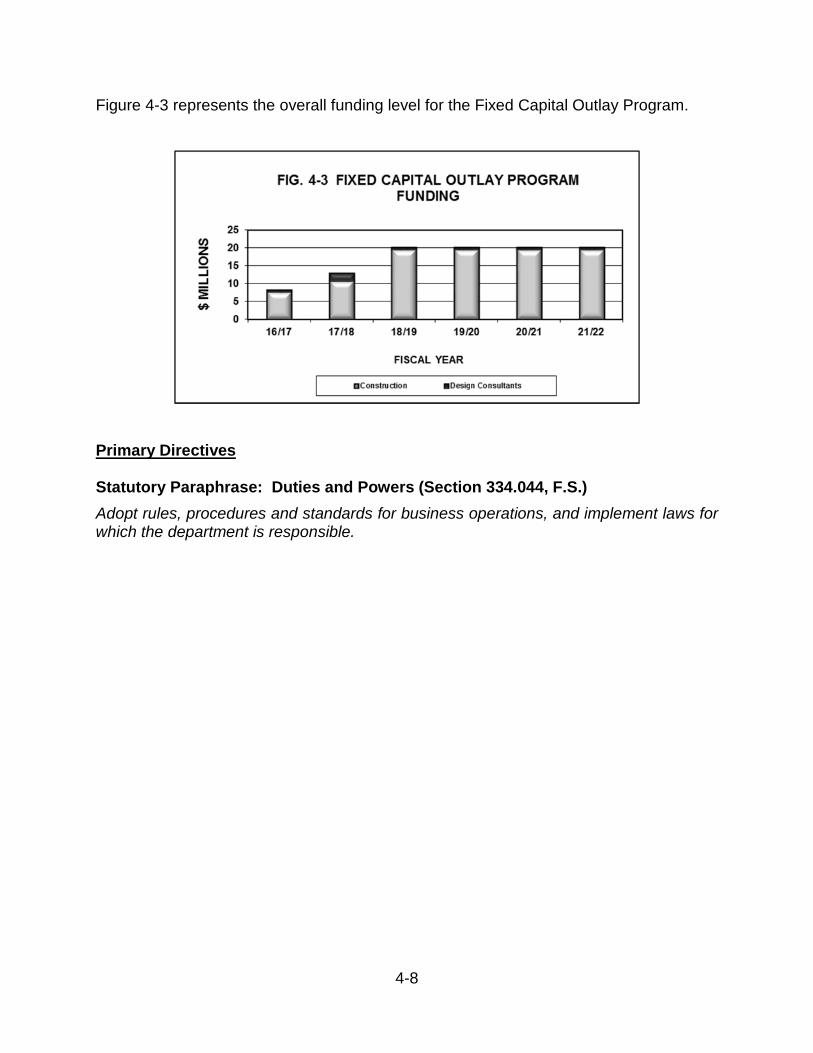
4-8
Figure 4-3 represents the overall funding level for the Fixed Capital Outlay Program.
Primary Directives
Statutory Paraphrase: Duties and Powers (Section 334.044, F.S.)
Adopt rules, procedures and standards for business operations, and implement laws for which the department is responsible.
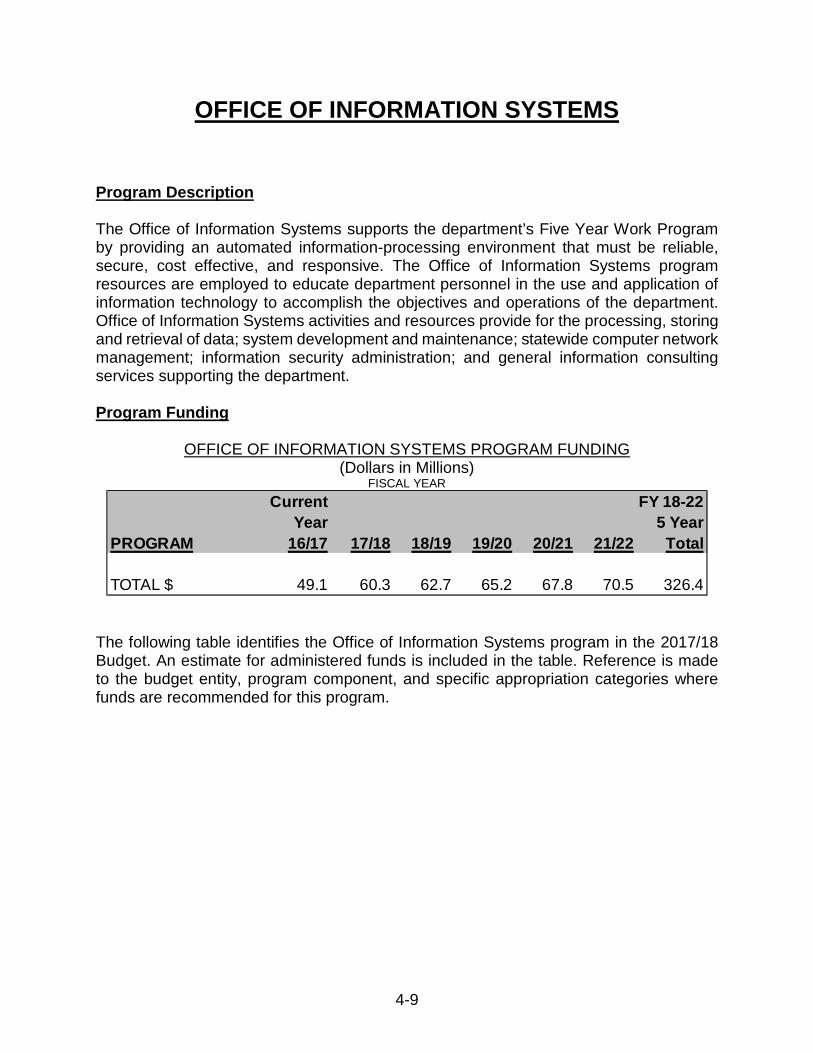
4-9
OFFICE OF INFORMATION SYSTEMS
Program Description
The Office of Information Systems supports the department’s Five Year Work Program by providing an automated information-processing environment that must be reliable, secure, cost effective, and responsive. The Office of Information Systems program resources are employed to educate department personnel in the use and application of information technology to accomplish the objectives and operations of the department. Office of Information Systems activities and resources provide for the processing, storing and retrieval of data; system development and maintenance; statewide computer network management; information security administration; and general information consulting services supporting the department.
Program Funding
OFFICE OF INFORMATION SYSTEMS PROGRAM FUNDING (Dollars in Millions)
FISCAL YEAR
The following table identifies the Office of Information Systems program in the 2017/18 Budget. An estimate for administered funds is included in the table. Reference is made to the budget entity, program component, and specific appropriation categories where funds are recommended for this program.
Current FY 18-22
Year 5 Year
PROGRAM 16/17 17/18 18/19 19/20 20/21 21/22 Total
TOTAL $ 49.1 60.3 62.7 65.2 67.8 70.5 326.4
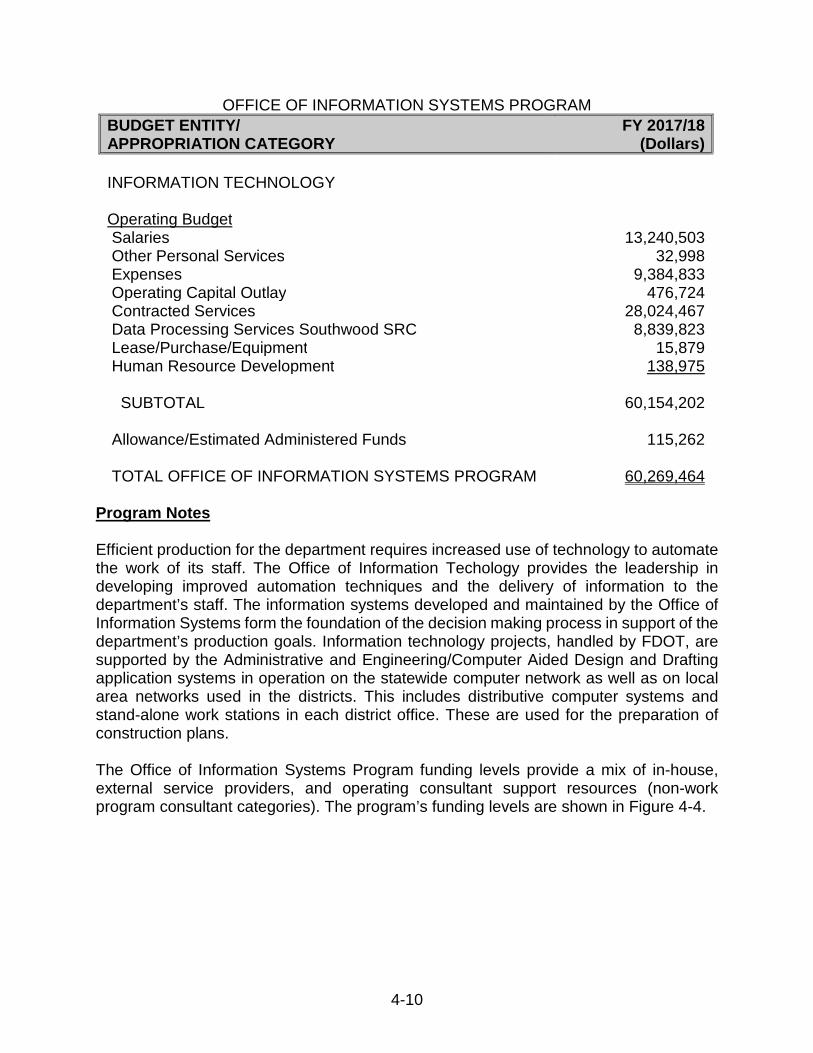
4-10
OFFICE OF INFORMATION SYSTEMS PROGRAM
BUDGET ENTITY/ APPROPRIATION CATEGORY
FY 2017/18(Dollars)
INFORMATION TECHNOLOGY
Operating BudgetSalaries 13,240,503Other Personal Services 32,998Expenses 9,384,833Operating Capital Outlay 476,724Contracted Services 28,024,467
Data Processing Services Southwood SRC Lease/Purchase/Equipment
8,839,82315,879
Human Resource Development 138,975
SUBTOTAL 60,154,202
Allowance/Estimated Administered Funds 115,262
TOTAL OFFICE OF INFORMATION SYSTEMS PROGRAM 60,269,464
Program Notes
Efficient production for the department requires increased use of technology to automate the work of its staff. The Office of Information Techology provides the leadership in developing improved automation techniques and the delivery of information to the department’s staff. The information systems developed and maintained by the Office of Information Systems form the foundation of the decision making process in support of the department’s production goals. Information technology projects, handled by FDOT, are supported by the Administrative and Engineering/Computer Aided Design and Drafting application systems in operation on the statewide computer network as well as on local area networks used in the districts. This includes distributive computer systems and stand-alone work stations in each district office. These are used for the preparation of construction plans.
The Office of Information Systems Program funding levels provide a mix of in-house, external service providers, and operating consultant support resources (non-work program consultant categories). The program’s funding levels are shown in Figure 4-4.
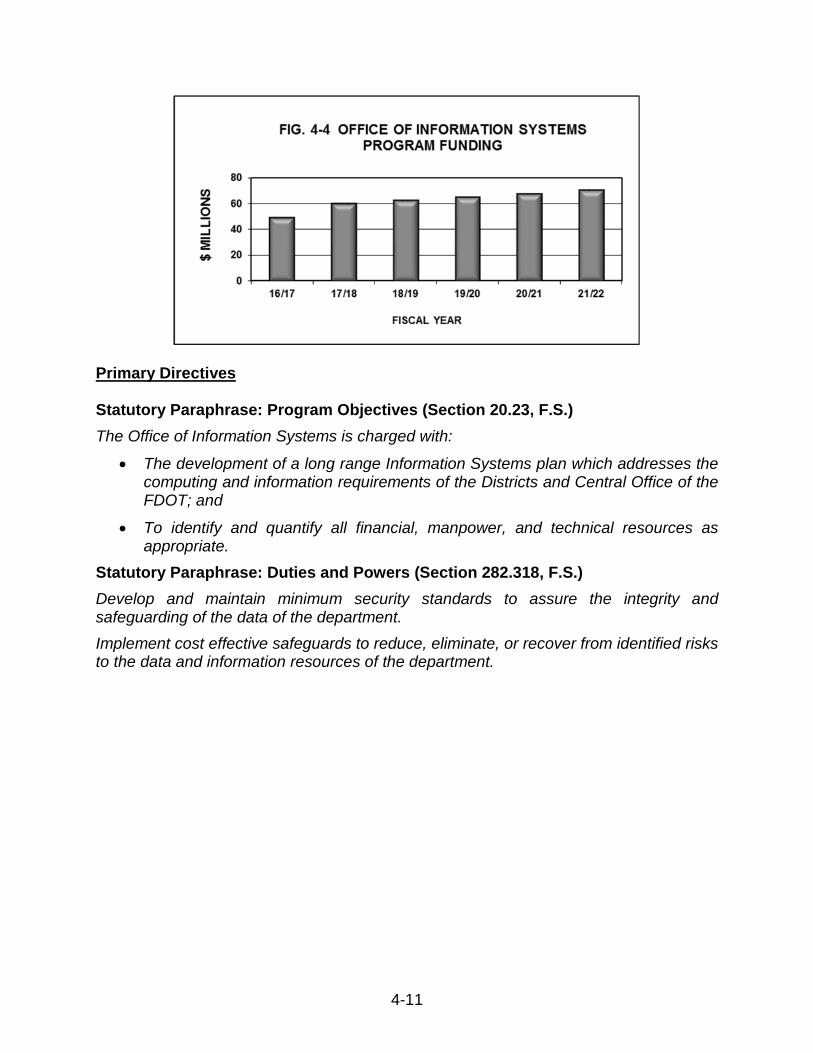
4-11
Primary Directives
Statutory Paraphrase: Program Objectives (Section 20.23, F.S.)
The Office of Information Systems is charged with:
• The development of a long range Information Systems plan which addresses the computing and information requirements of the Districts and Central Office of the FDOT; and
• To identify and quantify all financial, manpower, and technical resources as appropriate.
Statutory Paraphrase: Duties and Powers (Section 282.318, F.S.)
Develop and maintain minimum security standards to assure the integrity and safeguarding of the data of the department.
Implement cost effective safeguards to reduce, eliminate, or recover from identified risks to the data and information resources of the department.
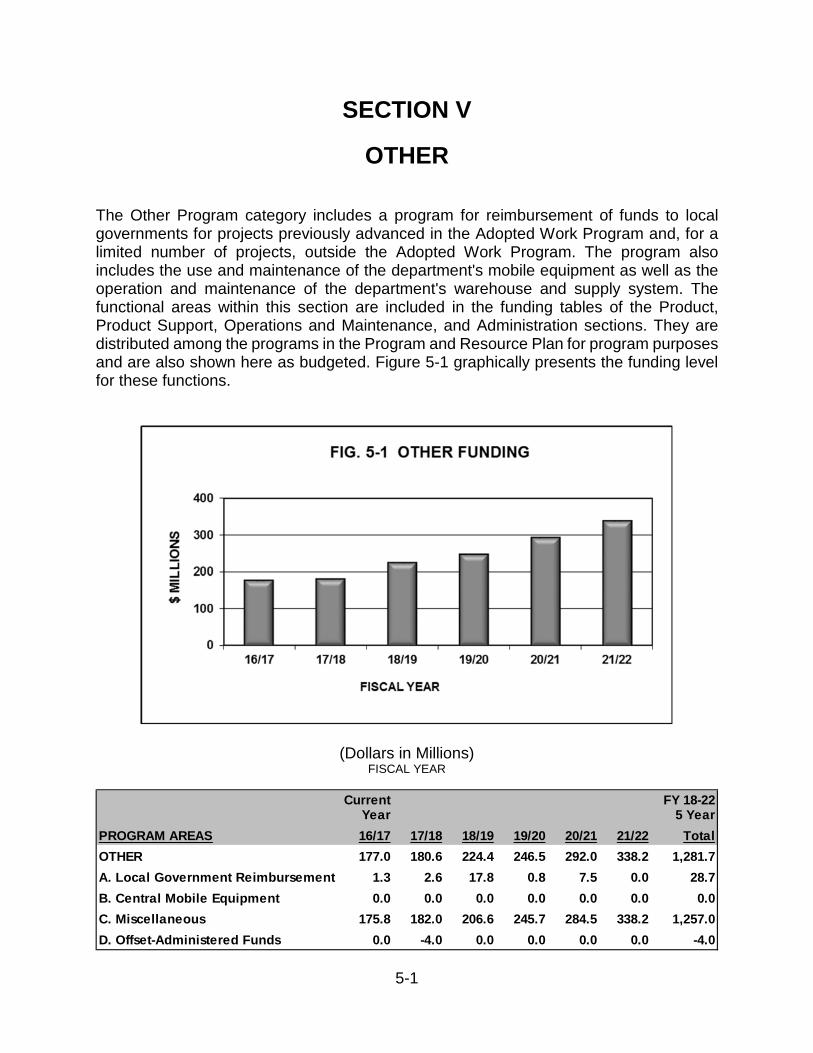
5-1
SECTION V
OTHER
The Other Program category includes a program for reimbursement of funds to local governments for projects previously advanced in the Adopted Work Program and, for a limited number of projects, outside the Adopted Work Program. The program also includes the use and maintenance of the department's mobile equipment as well as the operation and maintenance of the department's warehouse and supply system. The functional areas within this section are included in the funding tables of the Product, Product Support, Operations and Maintenance, and Administration sections. They are distributed among the programs in the Program and Resource Plan for program purposes and are also shown here as budgeted. Figure 5-1 graphically presents the funding level for these functions.
(Dollars in Millions) FISCAL YEAR
Current FY 18-22Year 5 Year
PROGRAM AREAS 16/17 17/18 18/19 19/20 20/21 21/22 Total
OTHER 177.0 180.6 224.4 246.5 292.0 338.2 1,281.7
A. Local Government Reimbursement 1.3 2.6 17.8 0.8 7.5 0.0 28.7
B. Central Mobile Equipment 0.0 0.0 0.0 0.0 0.0 0.0 0.0
C. Miscellaneous 175.8 182.0 206.6 245.7 284.5 338.2 1,257.0
D. Offset-Administered Funds 0.0 -4.0 0.0 0.0 0.0 0.0 -4.0
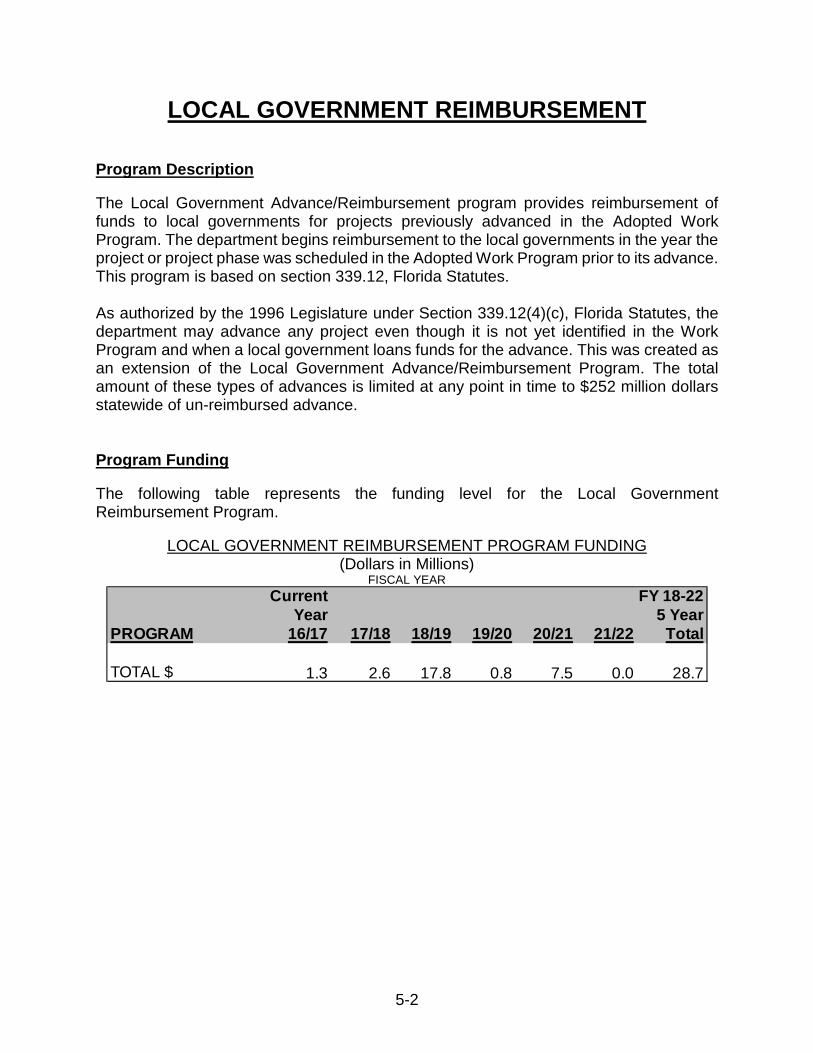
5-2
LOCAL GOVERNMENT REIMBURSEMENT
Program Description
The Local Government Advance/Reimbursement program provides reimbursement of funds to local governments for projects previously advanced in the Adopted Work Program. The department begins reimbursement to the local governments in the year the project or project phase was scheduled in the Adopted Work Program prior to its advance. This program is based on section 339.12, Florida Statutes.
As authorized by the 1996 Legislature under Section 339.12(4)(c), Florida Statutes, the department may advance any project even though it is not yet identified in the Work Program and when a local government loans funds for the advance. This was created as an extension of the Local Government Advance/Reimbursement Program. The total amount of these types of advances is limited at any point in time to $252 million dollars statewide of un-reimbursed advance.
Program Funding
The following table represents the funding level for the Local Government Reimbursement Program.
LOCAL GOVERNMENT REIMBURSEMENT PROGRAM FUNDING (Dollars in Millions)
FISCAL YEAR
Current FY 18-22Year 5 Year
PROGRAM 16/17 17/18 18/19 19/20 20/21 21/22 Total
TOTAL $ 1.3 2.6 17.8 0.8 7.5 0.0 28.7
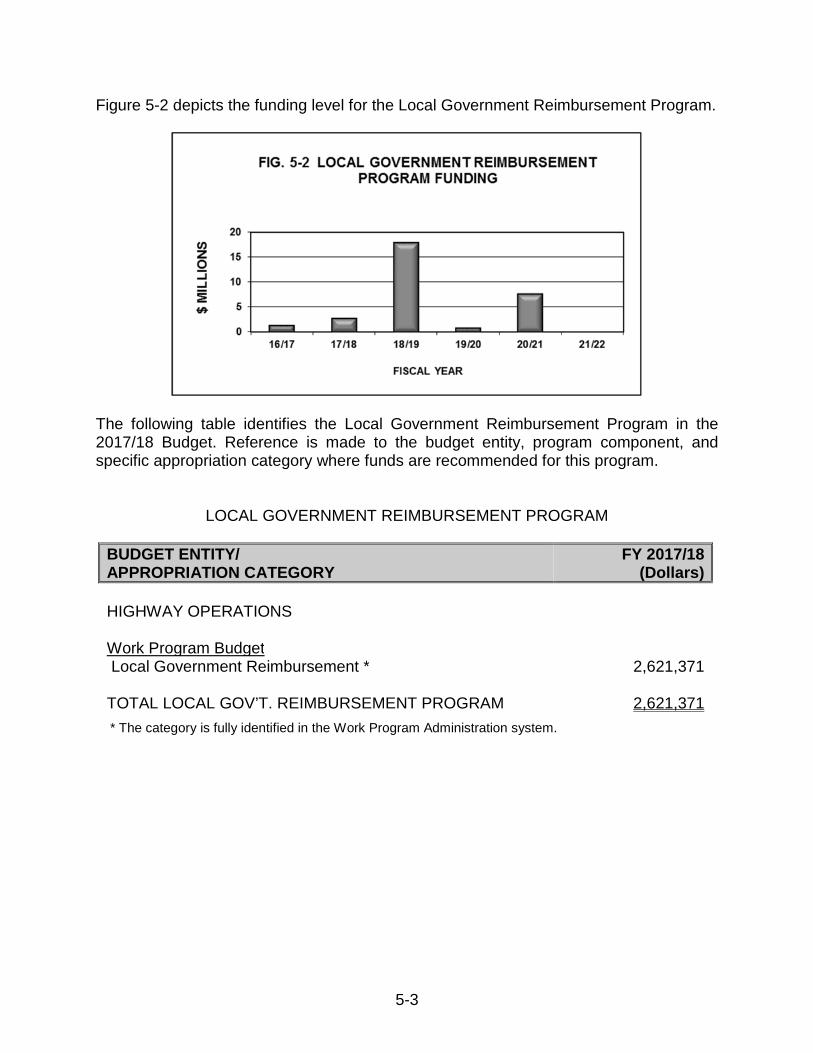
5-3
Figure 5-2 depicts the funding level for the Local Government Reimbursement Program.
The following table identifies the Local Government Reimbursement Program in the 2017/18 Budget. Reference is made to the budget entity, program component, and specific appropriation category where funds are recommended for this program.
LOCAL GOVERNMENT REIMBURSEMENT PROGRAM
BUDGET ENTITY/ APPROPRIATION CATEGORY
FY 2017/18(Dollars)
HIGHWAY OPERATIONS
Work Program BudgetLocal Government Reimbursement * 2,621,371
TOTAL LOCAL GOV’T. REIMBURSEMENT PROGRAM 2,621,371
* The category is fully identified in the Work Program Administration system.
5-4
Primary Directives
Statutory Paraphrase: Department Program Objectives (Section 339.12, F.S.)
A governmental entity may agree to perform or to contribute bond proceeds, cash, time warrants, or goods and services to the department’s performance of a project or project phase in the Adopted Work Program and on the State Highway System. The department may agree to reimburse the governmental entity for the full amount provided for use on such project or phase in the year the project or phase is scheduled in the Adopted Work Program.
Statutory Paraphrase: Department Program Objectives (Section 339.12(4) (c), F.S.)
The department is authorized to enter into agreements under this subsection for a project or project phase not included in the Adopted Work Program. Reimbursement must be made from funds appropriated by the Legislature. At no time shall the total amount of project agreements for projects or project phases not included in the Adopted Work Program exceed $250 million. However, notwithstanding such $250 million limit and any similar limit in s. 334.30, project advances for any inland county with a population greater than 500,000 dedicating amounts equal to $500 million or more of its Local Government Infrastructure Surtax pursuant to s. 212.055(2) for improvements to the State Highway System which are included in the local metropolitan planning organization’s or the department’s long-range transportation plans shall be excluded from the calculation of the statewide limit of project advances.
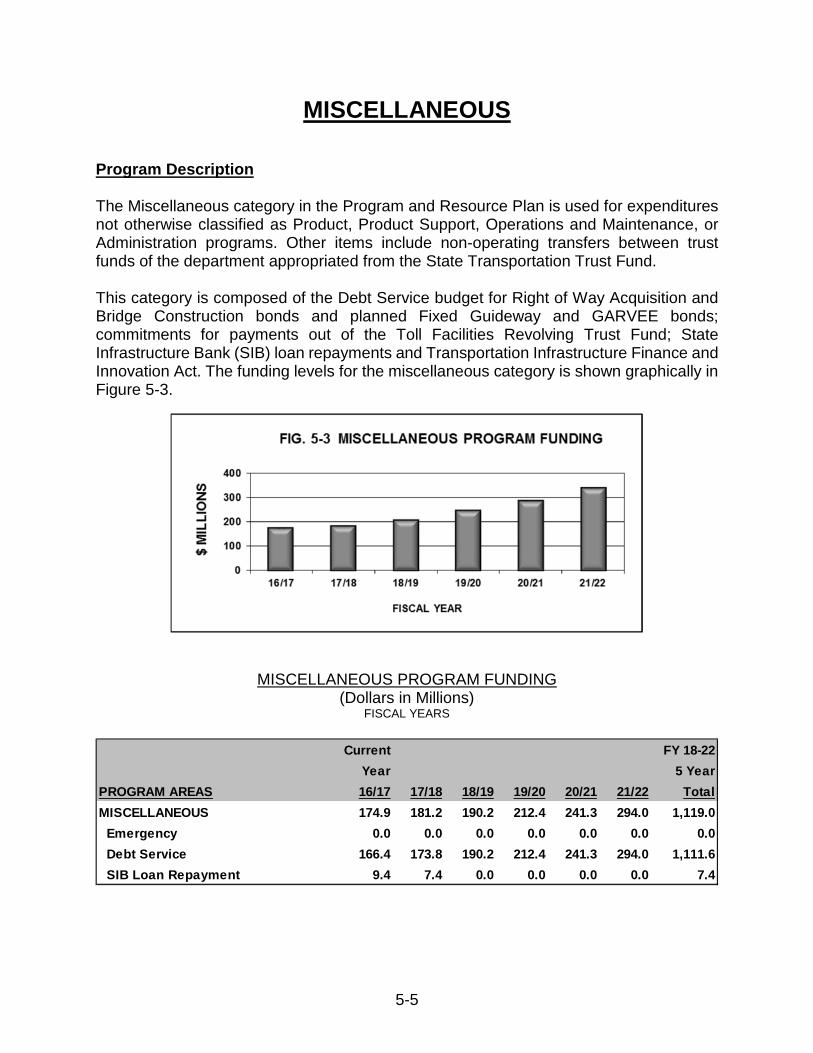
5-5
MISCELLANEOUS
Program Description
The Miscellaneous category in the Program and Resource Plan is used for expenditures not otherwise classified as Product, Product Support, Operations and Maintenance, or Administration programs. Other items include non-operating transfers between trust funds of the department appropriated from the State Transportation Trust Fund.
This category is composed of the Debt Service budget for Right of Way Acquisition and Bridge Construction bonds and planned Fixed Guideway and GARVEE bonds; commitments for payments out of the Toll Facilities Revolving Trust Fund; State Infrastructure Bank (SIB) loan repayments and Transportation Infrastructure Finance and Innovation Act. The funding levels for the miscellaneous category is shown graphically in Figure 5-3.
MISCELLANEOUS PROGRAM FUNDING (Dollars in Millions)
FISCAL YEARS
Current FY 18-22
Year 5 Year
PROGRAM AREAS 16/17 17/18 18/19 19/20 20/21 21/22 Total
MISCELLANEOUS 174.9 181.2 190.2 212.4 241.3 294.0 1,119.0
Emergency 0.0 0.0 0.0 0.0 0.0 0.0 0.0
Debt Service 166.4 173.8 190.2 212.4 241.3 294.0 1,111.6
SIB Loan Repayment 9.4 7.4 0.0 0.0 0.0 0.0 7.4
5-6
OFFSET FOR ADMINISTRERED FUNDS
Program Description
Administered Funds are budget appropriated at a statewide level in the General Appropriations Act which are subsequently distributed to agencies via budget amendment by the Executive Office of the Governor. Specific estimates are included each year for salary and benefit increases/decreases, periodic risk management increases/decreases for the Florida State Retirement System, and employee health insurance. Estimates for appropriation of administered funds are included in the in-house portions of Product Support, Operations and Maintenance, and Administration.
The Offset for Administered Funds category accounts for the total estimate each year. It is subtracted from the “Total Program” in order to balance to the Legislative Budget Request which does not include these estimates. The Legislature appropriates funds statewide for these items in the annual budget process without state agency request.
6-1
ATTACHMENT “A”
Florida Department of Transportation 2016/17 Program and Resource Plan Summary
Fiscal Years 2017/18 to 2021/22
The Florida Department of Transportation Program and Resource Plan Summary contains the planned commitment levels by year for each of the department’s programs. The plan forms the basis for the department’s Finance Plan, Tentative Five-Year Work Program, and Legislative Budget Request. The information contained in this attachment breaks out the data in the overall Program and Resource Plan in a variety of ways.
Page 6-2 is a one page summary of the planned commitment levels for each of the department’s program categories.
Pages 6-3 through 6-5 details the Program Plan Sub-Categories for each program within the Product, Product Support, Operations & Maintenance, Administration, and Other areas.
Page 6-6 provides a high level overview of Construction, Right of Way Land, Freight, Logistics and Passenger Operations, as well as In-house funding.
Pages 6-7 through 6-10 break out the Program and Resource Plan data by four frequently requested funding sources or systems:
• STATE (Page 6-7) – Summarizes commitments planned with State funds.
• TURNPIKE (Page 6-8) – Summarizes commitments planned with Turnpike Enterprise funds.
• ALL BUT TURNPIKE (Page 6-9) – Summarizes commitments planned with all funds, excluding Turnpike funds.
• STRATEGIC INTERMODAL SYSTEM (SIS) (excludes operating) (Page 6-10) – Summarizes commitments planned on the Strategic Intermodal System, which include SIS Highway, Emerging SIS Highway, SIS Highway Connector, and the SIS Highway Pending. In 2003, the Florida Legislature and the Governor established the SIS to enhance transportation, mobility, and economic competitiveness. The SIS is a statewide network of high priority transportation facilities, including the state’s largest and most significant airports, spaceport, deepwater seaports, freight rail terminals, passenger rail and intercity bus terminals, rail corridors, waterways, and highways.
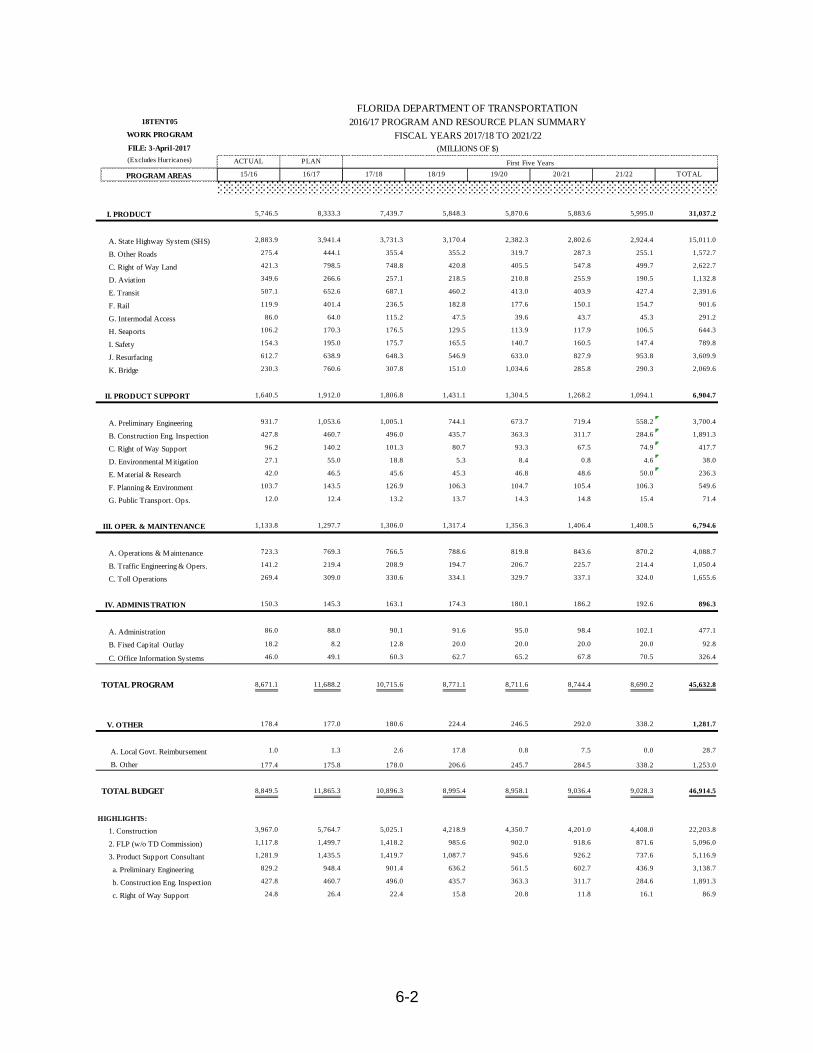
6-2
18TENT05
WORK PROGRAM
FILE: 3-April-2017
(Excludes Hurricanes) ACT UAL PLAN
PROGRAM AREAS 15/16 16/17 17/18 18/19 19/20 20/21 21/22 T OTAL
I. PRODUCT 5,746.5 8,333.3 7,439.7 5,848.3 5,870.6 5,883.6 5,995.0 31,037.2
A. State Highway System (SHS) 2,883.9 3,941.4 3,731.3 3,170.4 2,382.3 2,802.6 2,924.4 15,011.0
B. Other Roads 275.4 444.1 355.4 355.2 319.7 287.3 255.1 1,572.7
C. Right of Way Land 421.3 798.5 748.8 420.8 405.5 547.8 499.7 2,622.7
D. Aviation 349.6 266.6 257.1 218.5 210.8 255.9 190.5 1,132.8
E. Transit 507.1 652.6 687.1 460.2 413.0 403.9 427.4 2,391.6
F. Rail 119.9 401.4 236.5 182.8 177.6 150.1 154.7 901.6
G. Intermodal Access 86.0 64.0 115.2 47.5 39.6 43.7 45.3 291.2
H. Seaports 106.2 170.3 176.5 129.5 113.9 117.9 106.5 644.3
I. Safety 154.3 195.0 175.7 165.5 140.7 160.5 147.4 789.8
J. Resurfacing 612.7 638.9 648.3 546.9 633.0 827.9 953.8 3,609.9
K. Bridge 230.3 760.6 307.8 151.0 1,034.6 285.8 290.3 2,069.6
II. PRODUCT SUPPORT 1,640.5 1,912.0 1,806.8 1,431.1 1,304.5 1,268.2 1,094.1 6,904.7
A. Preliminary Engineering 931.7 1,053.6 1,005.1 744.1 673.7 719.4 558.2 3,700.4
B. Construction Eng. Inspection 427.8 460.7 496.0 435.7 363.3 311.7 284.6 1,891.3
C. Right of Way Support 96.2 140.2 101.3 80.7 93.3 67.5 74.9 417.7
D. Environmental Mitigation 27.1 55.0 18.8 5.3 8.4 0.8 4.6 38.0
E. Material & Research 42.0 46.5 45.6 45.3 46.8 48.6 50.0 236.3
F. Planning & Environment 103.7 143.5 126.9 106.3 104.7 105.4 106.3 549.6
G. Public Transport. Ops. 12.0 12.4 13.2 13.7 14.3 14.8 15.4 71.4
III. OPER. & MAINTENANCE 1,133.8 1,297.7 1,306.0 1,317.4 1,356.3 1,406.4 1,408.5 6,794.6
A. Operations & Maintenance 723.3 769.3 766.5 788.6 819.8 843.6 870.2 4,088.7
B. Traffic Engineering & Opers. 141.2 219.4 208.9 194.7 206.7 225.7 214.4 1,050.4
C. Toll Operations 269.4 309.0 330.6 334.1 329.7 337.1 324.0 1,655.6
IV. ADMINISTRATION 150.3 145.3 163.1 174.3 180.1 186.2 192.6 896.3
A. Administration 86.0 88.0 90.1 91.6 95.0 98.4 102.1 477.1
B. Fixed Capital Outlay 18.2 8.2 12.8 20.0 20.0 20.0 20.0 92.8
C. Office Information Systems 46.0 49.1 60.3 62.7 65.2 67.8 70.5 326.4
TOTAL PROGRAM 8,671.1 11,688.2 10,715.6 8,771.1 8,711.6 8,744.4 8,690.2 45,632.8
V. OTHER 178.4 177.0 180.6 224.4 246.5 292.0 338.2 1,281.7
A. Local Govt. Reimbursement 1.0 1.3 2.6 17.8 0.8 7.5 0.0 28.7
B. Other 177.4 175.8 178.0 206.6 245.7 284.5 338.2 1,253.0
TOTAL BUDGET 8,849.5 11,865.3 10,896.3 8,995.4 8,958.1 9,036.4 9,028.3 46,914.5
HIGHLIGHTS:
1. Construction 3,967.0 5,764.7 5,025.1 4,218.9 4,350.7 4,201.0 4,408.0 22,203.8
2. FLP (w/o TD Commission) 1,117.8 1,499.7 1,418.2 985.6 902.0 918.6 871.6 5,096.0
3. Product Support Consultant 1,281.9 1,435.5 1,419.7 1,087.7 945.6 926.2 737.6 5,116.9
a. Preliminary Engineering 829.2 948.4 901.4 636.2 561.5 602.7 436.9 3,138.7
b. Construction Eng. Inspection 427.8 460.7 496.0 435.7 363.3 311.7 284.6 1,891.3
c. Right of Way Support 24.8 26.4 22.4 15.8 20.8 11.8 16.1 86.9
First Five Years
(MILLIONS OF $)
FISCAL YEARS 2017/18 TO 2021/22
2016/17 PROGRAM AND RESOURCE PLAN SUMMARY
FLORIDA DEPARTMENT OF TRANSPORTATION
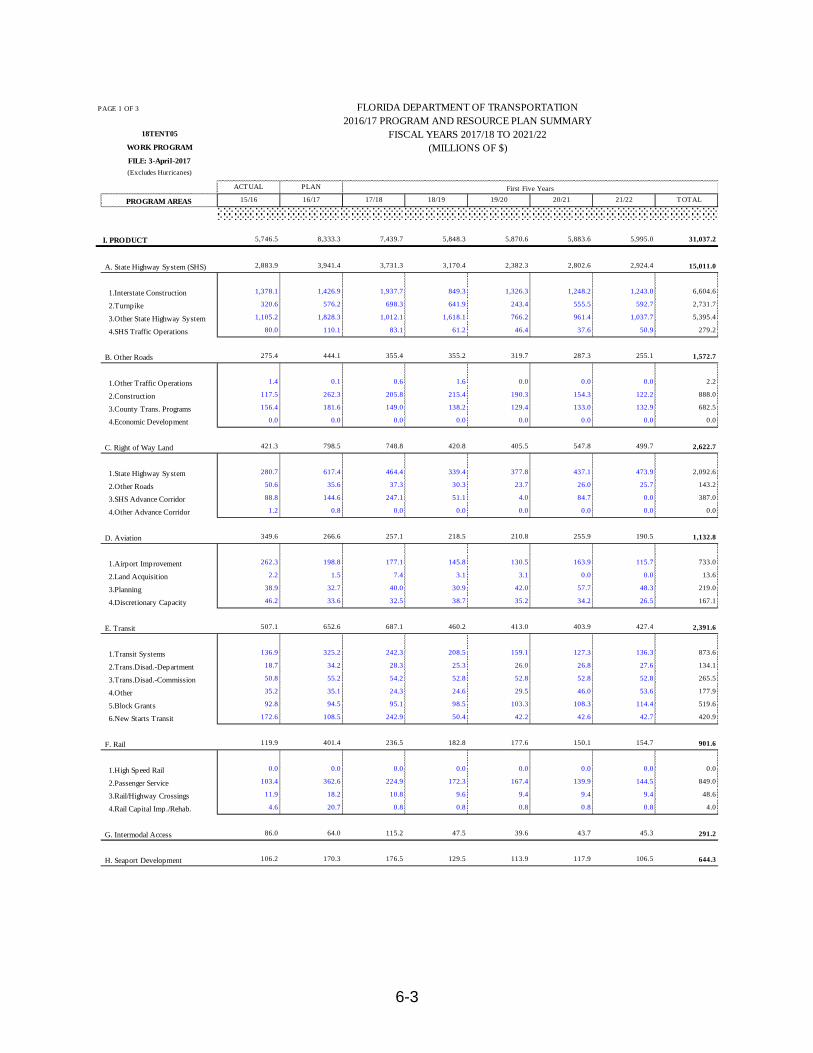
6-3
PAGE 1 OF 3 FLORIDA DEPARTMENT OF TRANSPORTATION
2016/17 PROGRAM AND RESOURCE PLAN SUMMARY18TENT05 FISCAL YEARS 2017/18 TO 2021/22
WORK PROGRAM (MILLIONS OF $)FILE: 3-April-2017
(Excludes Hurricanes)
ACT UAL PLAN First Five Years
PROGRAM AREAS 15/16 16/17 17/18 18/19 19/20 20/21 21/22 T OTAL
I. PRODUCT 5,746.5 8,333.3 7,439.7 5,848.3 5,870.6 5,883.6 5,995.0 31,037.2
A. State Highway System (SHS) 2,883.9 3,941.4 3,731.3 3,170.4 2,382.3 2,802.6 2,924.4 15,011.0
1.Interstate Construction 1,378.1 1,426.9 1,937.7 849.3 1,326.3 1,248.2 1,243.0 6,604.6
2.Turnpike 320.6 576.2 698.3 641.9 243.4 555.5 592.7 2,731.7
3.Other State Highway System 1,105.2 1,828.3 1,012.1 1,618.1 766.2 961.4 1,037.7 5,395.4
4.SHS Traffic Operations 80.0 110.1 83.1 61.2 46.4 37.6 50.9 279.2
B. Other Roads 275.4 444.1 355.4 355.2 319.7 287.3 255.1 1,572.7
1.Other Traffic Operations 1.4 0.1 0.6 1.6 0.0 0.0 0.0 2.2
2.Construction 117.5 262.3 205.8 215.4 190.3 154.3 122.2 888.0
3.County Trans. Programs 156.4 181.6 149.0 138.2 129.4 133.0 132.9 682.5
4.Economic Development 0.0 0.0 0.0 0.0 0.0 0.0 0.0 0.0
C. Right of Way Land 421.3 798.5 748.8 420.8 405.5 547.8 499.7 2,622.7
1.State Highway System 280.7 617.4 464.4 339.4 377.8 437.1 473.9 2,092.6
2.Other Roads 50.6 35.6 37.3 30.3 23.7 26.0 25.7 143.2
3.SHS Advance Corridor 88.8 144.6 247.1 51.1 4.0 84.7 0.0 387.0
4.Other Advance Corridor 1.2 0.8 0.0 0.0 0.0 0.0 0.0 0.0
D. Aviation 349.6 266.6 257.1 218.5 210.8 255.9 190.5 1,132.8
1.Airport Improvement 262.3 198.8 177.1 145.8 130.5 163.9 115.7 733.0
2.Land Acquisition 2.2 1.5 7.4 3.1 3.1 0.0 0.0 13.6
3.Planning 38.9 32.7 40.0 30.9 42.0 57.7 48.3 219.0
4.Discretionary Capacity 46.2 33.6 32.5 38.7 35.2 34.2 26.5 167.1
E. Transit 507.1 652.6 687.1 460.2 413.0 403.9 427.4 2,391.6
1.Transit Systems 136.9 325.2 242.3 208.5 159.1 127.3 136.3 873.6
2.Trans.Disad.-Department 18.7 34.2 28.3 25.3 26.0 26.8 27.6 134.1
3.Trans.Disad.-Commission 50.8 55.2 54.2 52.8 52.8 52.8 52.8 265.5
4.Other 35.2 35.1 24.3 24.6 29.5 46.0 53.6 177.9
5.Block Grants 92.8 94.5 95.1 98.5 103.3 108.3 114.4 519.6
6.New Starts Transit 172.6 108.5 242.9 50.4 42.2 42.6 42.7 420.9
F. Rail 119.9 401.4 236.5 182.8 177.6 150.1 154.7 901.6
1.High Speed Rail 0.0 0.0 0.0 0.0 0.0 0.0 0.0 0.0
2.Passenger Service 103.4 362.6 224.9 172.3 167.4 139.9 144.5 849.0
3.Rail/Highway Crossings 11.9 18.2 10.8 9.6 9.4 9.4 9.4 48.6
4.Rail Capital Imp./Rehab. 4.6 20.7 0.8 0.8 0.8 0.8 0.8 4.0
G. Intermodal Access 86.0 64.0 115.2 47.5 39.6 43.7 45.3 291.2
H. Seaport Development 106.2 170.3 176.5 129.5 113.9 117.9 106.5 644.3
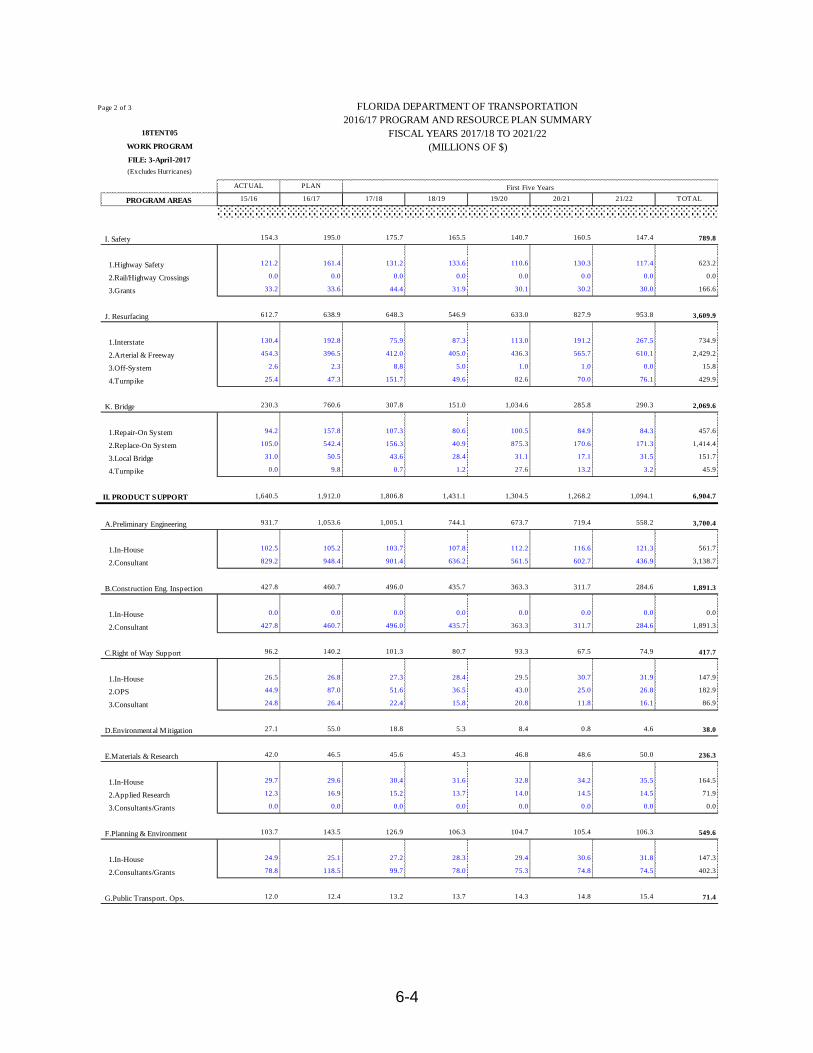
6-4
Page 2 of 3 FLORIDA DEPARTMENT OF TRANSPORTATION
2016/17 PROGRAM AND RESOURCE PLAN SUMMARY18TENT05 FISCAL YEARS 2017/18 TO 2021/22
WORK PROGRAM (MILLIONS OF $)FILE: 3-April-2017
(Excludes Hurricanes)
ACT UAL PLAN First Five Years
PROGRAM AREAS 15/16 16/17 17/18 18/19 19/20 20/21 21/22 T OTAL
I. Safety 154.3 195.0 175.7 165.5 140.7 160.5 147.4 789.8
1.Highway Safety 121.2 161.4 131.2 133.6 110.6 130.3 117.4 623.2
2.Rail/Highway Crossings 0.0 0.0 0.0 0.0 0.0 0.0 0.0 0.0
3.Grants 33.2 33.6 44.4 31.9 30.1 30.2 30.0 166.6
J. Resurfacing 612.7 638.9 648.3 546.9 633.0 827.9 953.8 3,609.9
1.Interstate 130.4 192.8 75.9 87.3 113.0 191.2 267.5 734.9
2.Arterial & Freeway 454.3 396.5 412.0 405.0 436.3 565.7 610.1 2,429.2
3.Off-System 2.6 2.3 8.8 5.0 1.0 1.0 0.0 15.8
4.Turnpike 25.4 47.3 151.7 49.6 82.6 70.0 76.1 429.9
K. Bridge 230.3 760.6 307.8 151.0 1,034.6 285.8 290.3 2,069.6
1.Repair-On System 94.2 157.8 107.3 80.6 100.5 84.9 84.3 457.6
2.Replace-On System 105.0 542.4 156.3 40.9 875.3 170.6 171.3 1,414.4
3.Local Bridge 31.0 50.5 43.6 28.4 31.1 17.1 31.5 151.7
4.Turnpike 0.0 9.8 0.7 1.2 27.6 13.2 3.2 45.9
II. PRODUCT SUPPORT 1,640.5 1,912.0 1,806.8 1,431.1 1,304.5 1,268.2 1,094.1 6,904.7
A.Preliminary Engineering 931.7 1,053.6 1,005.1 744.1 673.7 719.4 558.2 3,700.4
1.In-House 102.5 105.2 103.7 107.8 112.2 116.6 121.3 561.7
2.Consultant 829.2 948.4 901.4 636.2 561.5 602.7 436.9 3,138.7
B.Construction Eng. Inspection 427.8 460.7 496.0 435.7 363.3 311.7 284.6 1,891.3
1.In-House 0.0 0.0 0.0 0.0 0.0 0.0 0.0 0.0
2.Consultant 427.8 460.7 496.0 435.7 363.3 311.7 284.6 1,891.3
C.Right of Way Support 96.2 140.2 101.3 80.7 93.3 67.5 74.9 417.7
1.In-House 26.5 26.8 27.3 28.4 29.5 30.7 31.9 147.9
2.OPS 44.9 87.0 51.6 36.5 43.0 25.0 26.8 182.9
3.Consultant 24.8 26.4 22.4 15.8 20.8 11.8 16.1 86.9
D.Environmental Mitigation 27.1 55.0 18.8 5.3 8.4 0.8 4.6 38.0
E.Materials & Research 42.0 46.5 45.6 45.3 46.8 48.6 50.0 236.3
1.In-House 29.7 29.6 30.4 31.6 32.8 34.2 35.5 164.5
2.Applied Research 12.3 16.9 15.2 13.7 14.0 14.5 14.5 71.9
3.Consultants/Grants 0.0 0.0 0.0 0.0 0.0 0.0 0.0 0.0
F.Planning & Environment 103.7 143.5 126.9 106.3 104.7 105.4 106.3 549.6
1.In-House 24.9 25.1 27.2 28.3 29.4 30.6 31.8 147.3
2.Consultants/Grants 78.8 118.5 99.7 78.0 75.3 74.8 74.5 402.3
G.Public Transport. Ops. 12.0 12.4 13.2 13.7 14.3 14.8 15.4 71.4
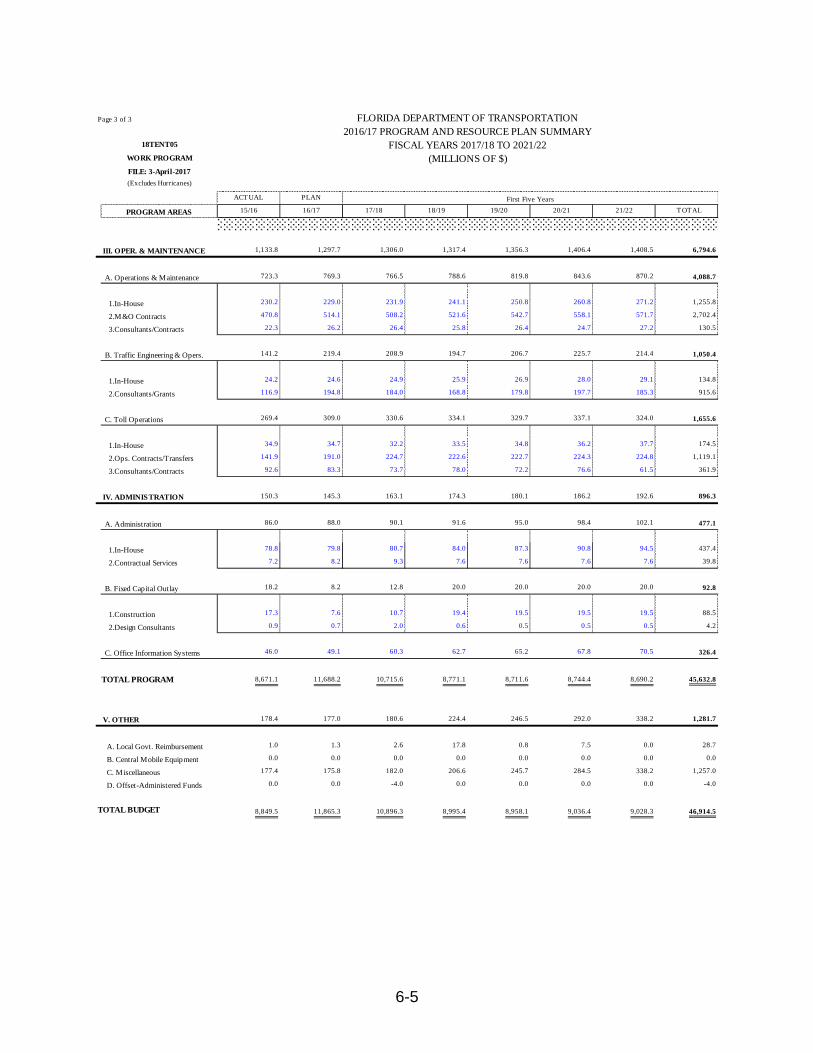
6-5
Page 3 of 3 FLORIDA DEPARTMENT OF TRANSPORTATION
2016/17 PROGRAM AND RESOURCE PLAN SUMMARY18TENT05 FISCAL YEARS 2017/18 TO 2021/22
WORK PROGRAM (MILLIONS OF $)FILE: 3-April-2017
(Excludes Hurricanes)
ACT UAL PLAN First Five Years
PROGRAM AREAS 15/16 16/17 17/18 18/19 19/20 20/21 21/22 T OTAL
III. OPER. & MAINTENANCE 1,133.8 1,297.7 1,306.0 1,317.4 1,356.3 1,406.4 1,408.5 6,794.6
A. Operations & Maintenance 723.3 769.3 766.5 788.6 819.8 843.6 870.2 4,088.7
1.In-House 230.2 229.0 231.9 241.1 250.8 260.8 271.2 1,255.8
2.M&O Contracts 470.8 514.1 508.2 521.6 542.7 558.1 571.7 2,702.4
3.Consultants/Contracts 22.3 26.2 26.4 25.8 26.4 24.7 27.2 130.5
B. Traffic Engineering & Opers. 141.2 219.4 208.9 194.7 206.7 225.7 214.4 1,050.4
1.In-House 24.2 24.6 24.9 25.9 26.9 28.0 29.1 134.8
2.Consultants/Grants 116.9 194.8 184.0 168.8 179.8 197.7 185.3 915.6
C. Toll Operations 269.4 309.0 330.6 334.1 329.7 337.1 324.0 1,655.6
1.In-House 34.9 34.7 32.2 33.5 34.8 36.2 37.7 174.5
2.Ops. Contracts/Transfers 141.9 191.0 224.7 222.6 222.7 224.3 224.8 1,119.1
3.Consultants/Contracts 92.6 83.3 73.7 78.0 72.2 76.6 61.5 361.9
IV. ADMINISTRATION 150.3 145.3 163.1 174.3 180.1 186.2 192.6 896.3
A. Administration 86.0 88.0 90.1 91.6 95.0 98.4 102.1 477.1
1.In-House 78.8 79.8 80.7 84.0 87.3 90.8 94.5 437.4
2.Contractual Services 7.2 8.2 9.3 7.6 7.6 7.6 7.6 39.8
B. Fixed Capital Outlay 18.2 8.2 12.8 20.0 20.0 20.0 20.0 92.8
1.Construction 17.3 7.6 10.7 19.4 19.5 19.5 19.5 88.5
2.Design Consultants 0.9 0.7 2.0 0.6 0.5 0.5 0.5 4.2
C. Office Information Systems 46.0 49.1 60.3 62.7 65.2 67.8 70.5 326.4
TOTAL PROGRAM 8,671.1 11,688.2 10,715.6 8,771.1 8,711.6 8,744.4 8,690.2 45,632.8
V. OTHER 178.4 177.0 180.6 224.4 246.5 292.0 338.2 1,281.7
A. Local Govt. Reimbursement 1.0 1.3 2.6 17.8 0.8 7.5 0.0 28.7
B. Central Mobile Equipment 0.0 0.0 0.0 0.0 0.0 0.0 0.0 0.0
C. Miscellaneous 177.4 175.8 182.0 206.6 245.7 284.5 338.2 1,257.0
D. Offset-Administered Funds 0.0 0.0 -4.0 0.0 0.0 0.0 0.0 -4.0
TOTAL BUDGET 8,849.5 11,865.3 10,896.3 8,995.4 8,958.1 9,036.4 9,028.3 46,914.5
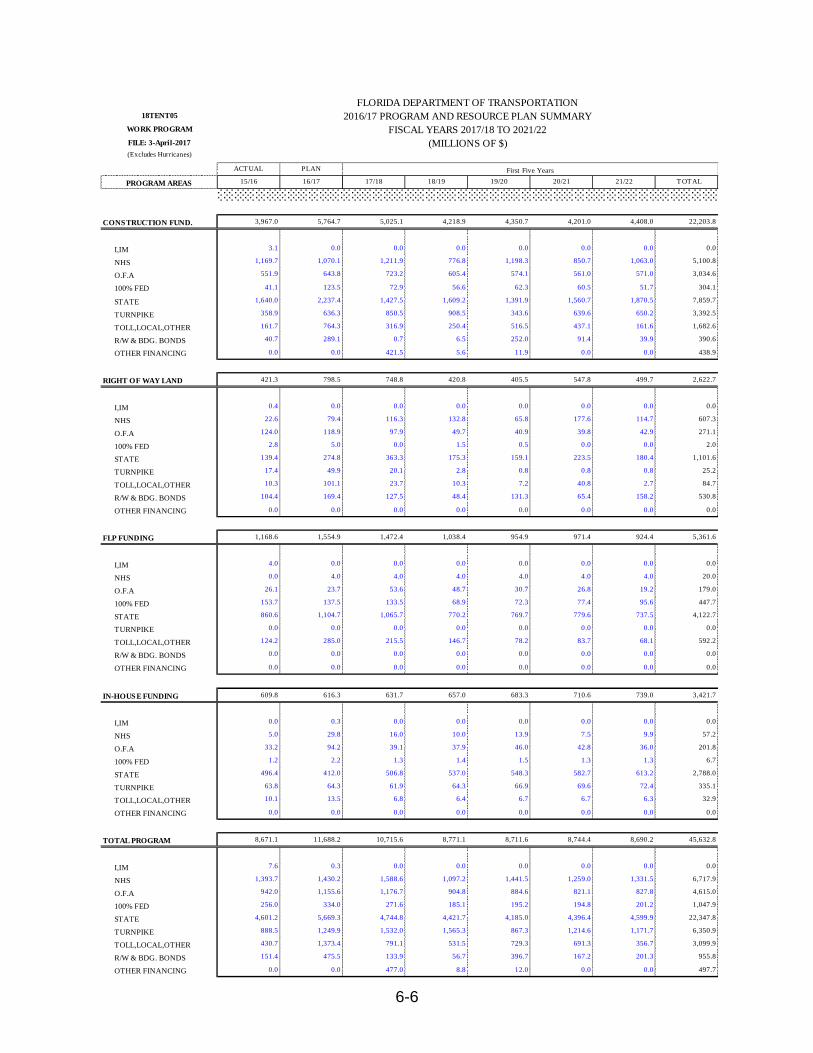
6-6
FLORIDA DEPARTMENT OF TRANSPORTATION18TENT05 2016/17 PROGRAM AND RESOURCE PLAN SUMMARY
WORK PROGRAM FISCAL YEARS 2017/18 TO 2021/22FILE: 3-April-2017 (MILLIONS OF $)(Excludes Hurricanes)
ACT UAL PLAN First Five Years
PROGRAM AREAS 15/16 16/17 17/18 18/19 19/20 20/21 21/22 T OTAL
CONSTRUCTION FUND. 3,967.0 5,764.7 5,025.1 4,218.9 4,350.7 4,201.0 4,408.0 22,203.8
I,IM 3.1 0.0 0.0 0.0 0.0 0.0 0.0 0.0
NHS 1,169.7 1,070.1 1,211.9 776.8 1,198.3 850.7 1,063.0 5,100.8
O.F.A 551.9 643.8 723.2 605.4 574.1 561.0 571.0 3,034.6
100% FED 41.1 123.5 72.9 56.6 62.3 60.5 51.7 304.1
STATE 1,640.0 2,237.4 1,427.5 1,609.2 1,391.9 1,560.7 1,870.5 7,859.7
TURNPIKE 358.9 636.3 850.5 908.5 343.6 639.6 650.2 3,392.5
TOLL,LOCAL,OTHER 161.7 764.3 316.9 250.4 516.5 437.1 161.6 1,682.6
R/W & BDG. BONDS 40.7 289.1 0.7 6.5 252.0 91.4 39.9 390.6
OTHER FINANCING 0.0 0.0 421.5 5.6 11.9 0.0 0.0 438.9
RIGHT OF WAY LAND 421.3 798.5 748.8 420.8 405.5 547.8 499.7 2,622.7
I,IM 0.4 0.0 0.0 0.0 0.0 0.0 0.0 0.0
NHS 22.6 79.4 116.3 132.8 65.8 177.6 114.7 607.3
O.F.A 124.0 118.9 97.9 49.7 40.9 39.8 42.9 271.1
100% FED 2.8 5.0 0.0 1.5 0.5 0.0 0.0 2.0
STATE 139.4 274.8 363.3 175.3 159.1 223.5 180.4 1,101.6
TURNPIKE 17.4 49.9 20.1 2.8 0.8 0.8 0.8 25.2
TOLL,LOCAL,OTHER 10.3 101.1 23.7 10.3 7.2 40.8 2.7 84.7
R/W & BDG. BONDS 104.4 169.4 127.5 48.4 131.3 65.4 158.2 530.8
OTHER FINANCING 0.0 0.0 0.0 0.0 0.0 0.0 0.0 0.0
FLP FUNDING 1,168.6 1,554.9 1,472.4 1,038.4 954.9 971.4 924.4 5,361.6
I,IM 4.0 0.0 0.0 0.0 0.0 0.0 0.0 0.0
NHS 0.0 4.0 4.0 4.0 4.0 4.0 4.0 20.0
O.F.A 26.1 23.7 53.6 48.7 30.7 26.8 19.2 179.0
100% FED 153.7 137.5 133.5 68.9 72.3 77.4 95.6 447.7
STATE 860.6 1,104.7 1,065.7 770.2 769.7 779.6 737.5 4,122.7
TURNPIKE 0.0 0.0 0.0 0.0 0.0 0.0 0.0 0.0
TOLL,LOCAL,OTHER 124.2 285.0 215.5 146.7 78.2 83.7 68.1 592.2
R/W & BDG. BONDS 0.0 0.0 0.0 0.0 0.0 0.0 0.0 0.0
OTHER FINANCING 0.0 0.0 0.0 0.0 0.0 0.0 0.0 0.0
IN-HOUSE FUNDING 609.8 616.3 631.7 657.0 683.3 710.6 739.0 3,421.7
I,IM 0.0 0.3 0.0 0.0 0.0 0.0 0.0 0.0
NHS 5.0 29.8 16.0 10.0 13.9 7.5 9.9 57.2
O.F.A 33.2 94.2 39.1 37.9 46.0 42.8 36.0 201.8
100% FED 1.2 2.2 1.3 1.4 1.5 1.3 1.3 6.7
STATE 496.4 412.0 506.8 537.0 548.3 582.7 613.2 2,788.0
TURNPIKE 63.8 64.3 61.9 64.3 66.9 69.6 72.4 335.1
TOLL,LOCAL,OTHER 10.1 13.5 6.8 6.4 6.7 6.7 6.3 32.9
OTHER FINANCING 0.0 0.0 0.0 0.0 0.0 0.0 0.0 0.0
TOTAL PROGRAM 8,671.1 11,688.2 10,715.6 8,771.1 8,711.6 8,744.4 8,690.2 45,632.8
I,IM 7.6 0.3 0.0 0.0 0.0 0.0 0.0 0.0
NHS 1,393.7 1,430.2 1,588.6 1,097.2 1,441.5 1,259.0 1,331.5 6,717.9
O.F.A 942.0 1,155.6 1,176.7 904.8 884.6 821.1 827.8 4,615.0
100% FED 256.0 334.0 271.6 185.1 195.2 194.8 201.2 1,047.9
STATE 4,601.2 5,669.3 4,744.8 4,421.7 4,185.0 4,396.4 4,599.9 22,347.8
TURNPIKE 888.5 1,249.9 1,532.0 1,565.3 867.3 1,214.6 1,171.7 6,350.9
TOLL,LOCAL,OTHER 430.7 1,373.4 791.1 531.5 729.3 691.3 356.7 3,099.9
R/W & BDG. BONDS 151.4 475.5 133.9 56.7 396.7 167.2 201.3 955.8
OTHER FINANCING 0.0 0.0 477.0 8.8 12.0 0.0 0.0 497.7
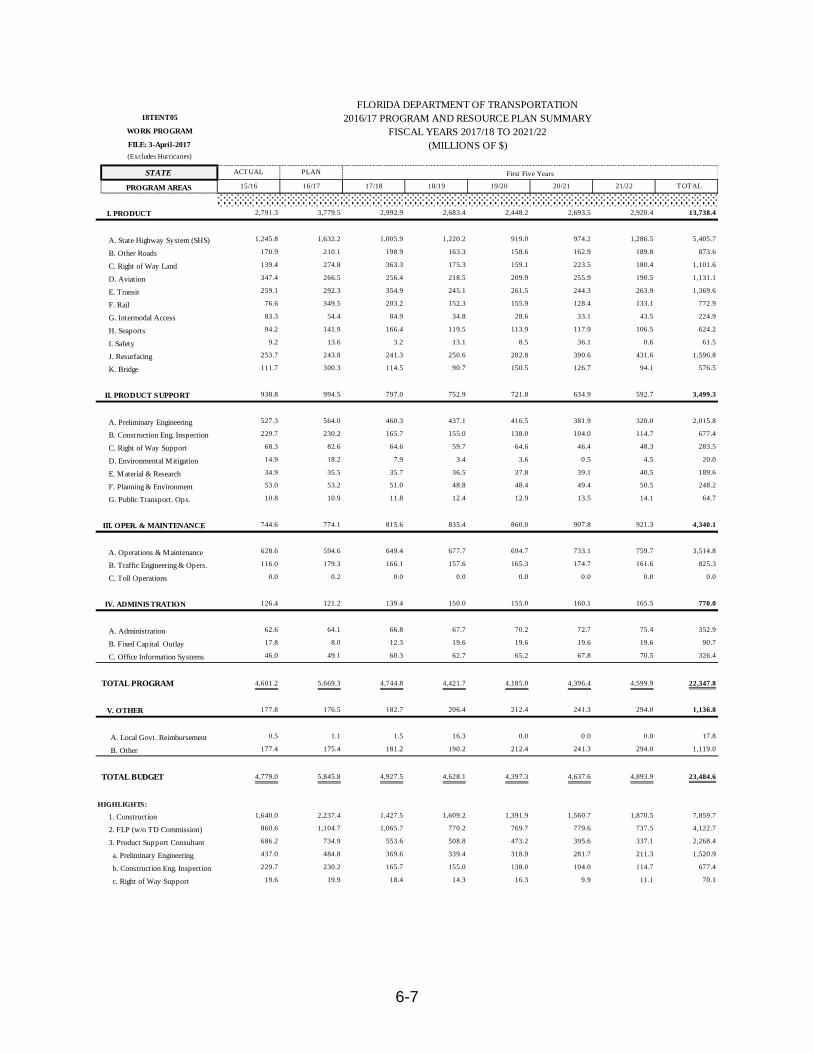
6-7
FLORIDA DEPARTMENT OF TRANSPORTATION18TENT05 2016/17 PROGRAM AND RESOURCE PLAN SUMMARY
WORK PROGRAM FISCAL YEARS 2017/18 TO 2021/22FILE: 3-April-2017 (MILLIONS OF $)(Excludes Hurricanes)
STATE ACT UAL PLAN First Five Years
PROGRAM AREAS 15/16 16/17 17/18 18/19 19/20 20/21 21/22 T OTAL
I. PRODUCT 2,791.3 3,779.5 2,992.9 2,683.4 2,448.2 2,693.5 2,920.4 13,738.4
A. State Highway System (SHS) 1,245.8 1,632.2 1,005.9 1,220.2 919.0 974.2 1,286.5 5,405.7
B. Other Roads 170.9 210.1 198.9 163.3 158.6 162.9 189.8 873.6
C. Right of Way Land 139.4 274.8 363.3 175.3 159.1 223.5 180.4 1,101.6
D. Aviation 347.4 266.5 256.4 218.5 209.9 255.9 190.5 1,131.1
E. Transit 259.1 292.3 354.9 245.1 261.5 244.3 263.9 1,369.6
F. Rail 76.6 349.5 203.2 152.3 155.9 128.4 133.1 772.9
G. Intermodal Access 83.3 54.4 84.9 34.8 28.6 33.1 43.5 224.9
H. Seaports 94.2 141.9 166.4 119.5 113.9 117.9 106.5 624.2
I. Safety 9.2 13.6 3.2 13.1 8.5 36.1 0.6 61.5
J. Resurfacing 253.7 243.8 241.3 250.6 282.8 390.6 431.6 1,596.8
K. Bridge 111.7 300.3 114.5 90.7 150.5 126.7 94.1 576.5
II. PRODUCT SUPPORT 938.8 994.5 797.0 752.9 721.8 634.9 592.7 3,499.3
A. Preliminary Engineering 527.3 564.0 460.3 437.1 416.5 381.9 320.0 2,015.8
B. Construction Eng. Inspection 229.7 230.2 165.7 155.0 138.0 104.0 114.7 677.4
C. Right of Way Support 68.3 82.6 64.6 59.7 64.6 46.4 48.3 283.5
D. Environmental Mitigation 14.9 18.2 7.9 3.4 3.6 0.5 4.5 20.0
E. Material & Research 34.9 35.5 35.7 36.5 37.8 39.1 40.5 189.6
F. Planning & Environment 53.0 53.2 51.0 48.8 48.4 49.4 50.5 248.2
G. Public Transport. Ops. 10.8 10.9 11.8 12.4 12.9 13.5 14.1 64.7
III. OPER. & MAINTENANCE 744.6 774.1 815.6 835.4 860.0 907.8 921.3 4,340.1
A. Operations & Maintenance 628.6 594.6 649.4 677.7 694.7 733.1 759.7 3,514.8
B. Traffic Engineering & Opers. 116.0 179.3 166.1 157.6 165.3 174.7 161.6 825.3
C. Toll Operations 0.0 0.2 0.0 0.0 0.0 0.0 0.0 0.0
IV. ADMINISTRATION 126.4 121.2 139.4 150.0 155.0 160.1 165.5 770.0
A. Administration 62.6 64.1 66.8 67.7 70.2 72.7 75.4 352.9
B. Fixed Capital Outlay 17.8 8.0 12.3 19.6 19.6 19.6 19.6 90.7
C. Office Information Systems 46.0 49.1 60.3 62.7 65.2 67.8 70.5 326.4
TOTAL PROGRAM 4,601.2 5,669.3 4,744.8 4,421.7 4,185.0 4,396.4 4,599.9 22,347.8
V. OTHER 177.8 176.5 182.7 206.4 212.4 241.3 294.0 1,136.8
A. Local Govt. Reimbursement 0.5 1.1 1.5 16.3 0.0 0.0 0.0 17.8
B. Other 177.4 175.4 181.2 190.2 212.4 241.3 294.0 1,119.0
TOTAL BUDGET 4,779.0 5,845.8 4,927.5 4,628.1 4,397.3 4,637.6 4,893.9 23,484.6
HIGHLIGHTS:
1. Construction 1,640.0 2,237.4 1,427.5 1,609.2 1,391.9 1,560.7 1,870.5 7,859.7
2. FLP (w/o TD Commission) 860.6 1,104.7 1,065.7 770.2 769.7 779.6 737.5 4,122.7
3. Product Support Consultant 686.2 734.9 553.6 508.8 473.2 395.6 337.1 2,268.4
a. Preliminary Engineering 437.0 484.8 369.6 339.4 318.9 281.7 211.3 1,520.9
b. Construction Eng. Inspection 229.7 230.2 165.7 155.0 138.0 104.0 114.7 677.4
c. Right of Way Support 19.6 19.9 18.4 14.3 16.3 9.9 11.1 70.1
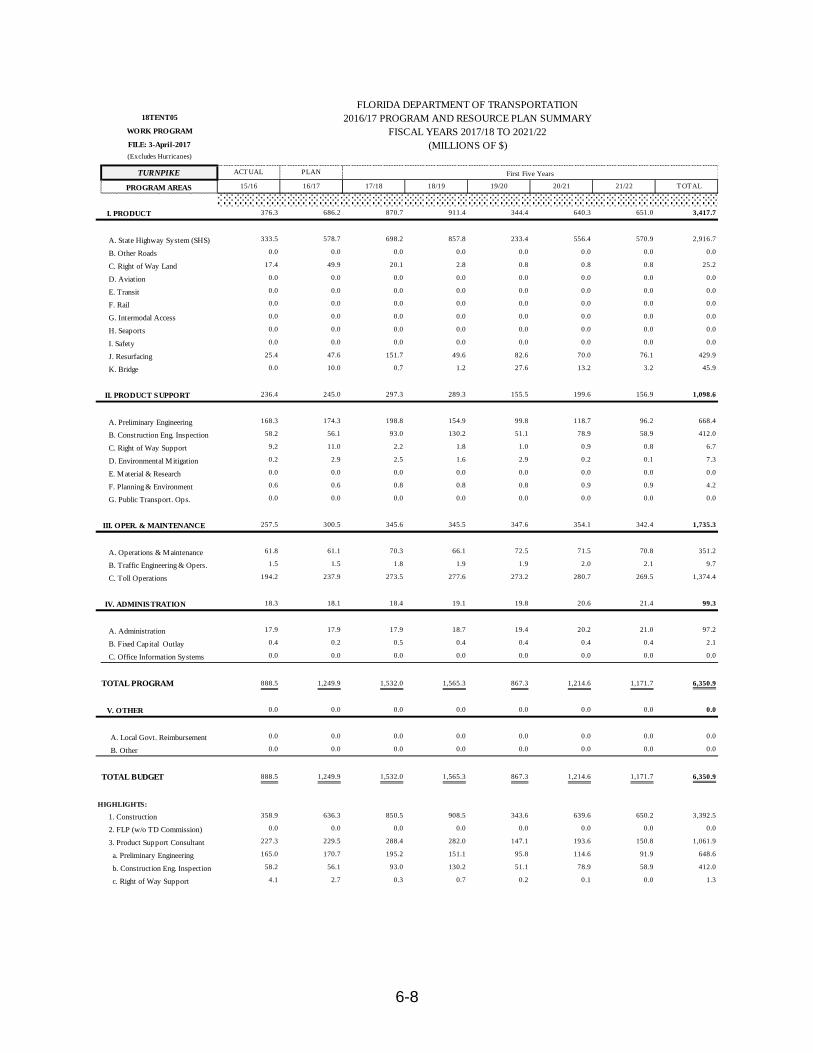
6-8
FLORIDA DEPARTMENT OF TRANSPORTATION18TENT05 2016/17 PROGRAM AND RESOURCE PLAN SUMMARY
WORK PROGRAM FISCAL YEARS 2017/18 TO 2021/22FILE: 3-April-2017 (MILLIONS OF $)(Excludes Hurricanes)
TURNPIKE ACT UAL PLAN First Five Years
PROGRAM AREAS 15/16 16/17 17/18 18/19 19/20 20/21 21/22 T OTAL
I. PRODUCT 376.3 686.2 870.7 911.4 344.4 640.3 651.0 3,417.7
A. State Highway System (SHS) 333.5 578.7 698.2 857.8 233.4 556.4 570.9 2,916.7
B. Other Roads 0.0 0.0 0.0 0.0 0.0 0.0 0.0 0.0
C. Right of Way Land 17.4 49.9 20.1 2.8 0.8 0.8 0.8 25.2
D. Aviation 0.0 0.0 0.0 0.0 0.0 0.0 0.0 0.0
E. Transit 0.0 0.0 0.0 0.0 0.0 0.0 0.0 0.0
F. Rail 0.0 0.0 0.0 0.0 0.0 0.0 0.0 0.0
G. Intermodal Access 0.0 0.0 0.0 0.0 0.0 0.0 0.0 0.0
H. Seaports 0.0 0.0 0.0 0.0 0.0 0.0 0.0 0.0
I. Safety 0.0 0.0 0.0 0.0 0.0 0.0 0.0 0.0
J. Resurfacing 25.4 47.6 151.7 49.6 82.6 70.0 76.1 429.9
K. Bridge 0.0 10.0 0.7 1.2 27.6 13.2 3.2 45.9
II. PRODUCT SUPPORT 236.4 245.0 297.3 289.3 155.5 199.6 156.9 1,098.6
A. Preliminary Engineering 168.3 174.3 198.8 154.9 99.8 118.7 96.2 668.4
B. Construction Eng. Inspection 58.2 56.1 93.0 130.2 51.1 78.9 58.9 412.0
C. Right of Way Support 9.2 11.0 2.2 1.8 1.0 0.9 0.8 6.7
D. Environmental Mitigation 0.2 2.9 2.5 1.6 2.9 0.2 0.1 7.3
E. Material & Research 0.0 0.0 0.0 0.0 0.0 0.0 0.0 0.0
F. Planning & Environment 0.6 0.6 0.8 0.8 0.8 0.9 0.9 4.2
G. Public Transport. Ops. 0.0 0.0 0.0 0.0 0.0 0.0 0.0 0.0
III. OPER. & MAINTENANCE 257.5 300.5 345.6 345.5 347.6 354.1 342.4 1,735.3
A. Operations & Maintenance 61.8 61.1 70.3 66.1 72.5 71.5 70.8 351.2
B. Traffic Engineering & Opers. 1.5 1.5 1.8 1.9 1.9 2.0 2.1 9.7
C. Toll Operations 194.2 237.9 273.5 277.6 273.2 280.7 269.5 1,374.4
IV. ADMINISTRATION 18.3 18.1 18.4 19.1 19.8 20.6 21.4 99.3
A. Administration 17.9 17.9 17.9 18.7 19.4 20.2 21.0 97.2
B. Fixed Capital Outlay 0.4 0.2 0.5 0.4 0.4 0.4 0.4 2.1
C. Office Information Systems 0.0 0.0 0.0 0.0 0.0 0.0 0.0 0.0
TOTAL PROGRAM 888.5 1,249.9 1,532.0 1,565.3 867.3 1,214.6 1,171.7 6,350.9
V. OTHER 0.0 0.0 0.0 0.0 0.0 0.0 0.0 0.0
A. Local Govt. Reimbursement 0.0 0.0 0.0 0.0 0.0 0.0 0.0 0.0
B. Other 0.0 0.0 0.0 0.0 0.0 0.0 0.0 0.0
TOTAL BUDGET 888.5 1,249.9 1,532.0 1,565.3 867.3 1,214.6 1,171.7 6,350.9
HIGHLIGHTS:
1. Construction 358.9 636.3 850.5 908.5 343.6 639.6 650.2 3,392.5
2. FLP (w/o TD Commission) 0.0 0.0 0.0 0.0 0.0 0.0 0.0 0.0
3. Product Support Consultant 227.3 229.5 288.4 282.0 147.1 193.6 150.8 1,061.9
a. Preliminary Engineering 165.0 170.7 195.2 151.1 95.8 114.6 91.9 648.6
b. Construction Eng. Inspection 58.2 56.1 93.0 130.2 51.1 78.9 58.9 412.0
c. Right of Way Support 4.1 2.7 0.3 0.7 0.2 0.1 0.0 1.3
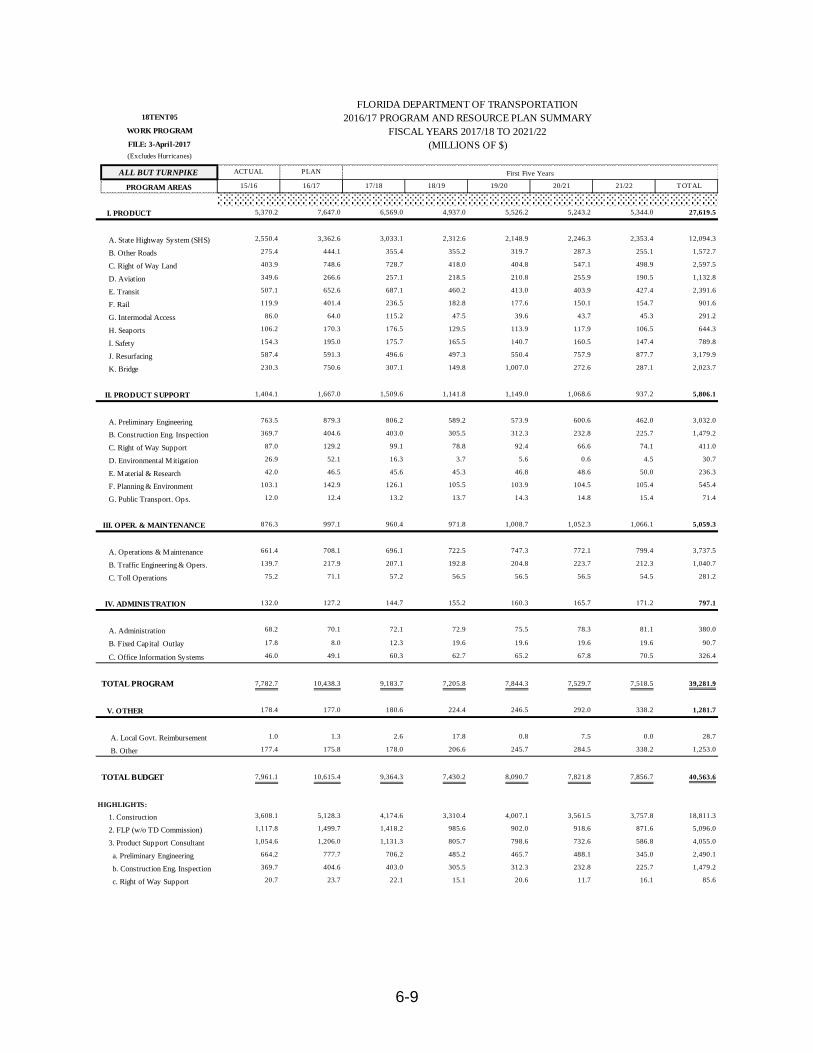
6-9
FLORIDA DEPARTMENT OF TRANSPORTATION18TENT05 2016/17 PROGRAM AND RESOURCE PLAN SUMMARY
WORK PROGRAM FISCAL YEARS 2017/18 TO 2021/22FILE: 3-April-2017 (MILLIONS OF $)(Excludes Hurricanes)
ALL BUT TURNPIKE ACT UAL PLAN First Five Years
PROGRAM AREAS 15/16 16/17 17/18 18/19 19/20 20/21 21/22 T OTAL
I. PRODUCT 5,370.2 7,647.0 6,569.0 4,937.0 5,526.2 5,243.2 5,344.0 27,619.5
A. State Highway System (SHS) 2,550.4 3,362.6 3,033.1 2,312.6 2,148.9 2,246.3 2,353.4 12,094.3
B. Other Roads 275.4 444.1 355.4 355.2 319.7 287.3 255.1 1,572.7
C. Right of Way Land 403.9 748.6 728.7 418.0 404.8 547.1 498.9 2,597.5
D. Aviation 349.6 266.6 257.1 218.5 210.8 255.9 190.5 1,132.8
E. Transit 507.1 652.6 687.1 460.2 413.0 403.9 427.4 2,391.6
F. Rail 119.9 401.4 236.5 182.8 177.6 150.1 154.7 901.6
G. Intermodal Access 86.0 64.0 115.2 47.5 39.6 43.7 45.3 291.2
H. Seaports 106.2 170.3 176.5 129.5 113.9 117.9 106.5 644.3
I. Safety 154.3 195.0 175.7 165.5 140.7 160.5 147.4 789.8
J. Resurfacing 587.4 591.3 496.6 497.3 550.4 757.9 877.7 3,179.9
K. Bridge 230.3 750.6 307.1 149.8 1,007.0 272.6 287.1 2,023.7
II. PRODUCT SUPPORT 1,404.1 1,667.0 1,509.6 1,141.8 1,149.0 1,068.6 937.2 5,806.1
A. Preliminary Engineering 763.5 879.3 806.2 589.2 573.9 600.6 462.0 3,032.0
B. Construction Eng. Inspection 369.7 404.6 403.0 305.5 312.3 232.8 225.7 1,479.2
C. Right of Way Support 87.0 129.2 99.1 78.8 92.4 66.6 74.1 411.0
D. Environmental Mitigation 26.9 52.1 16.3 3.7 5.6 0.6 4.5 30.7
E. Material & Research 42.0 46.5 45.6 45.3 46.8 48.6 50.0 236.3
F. Planning & Environment 103.1 142.9 126.1 105.5 103.9 104.5 105.4 545.4
G. Public Transport. Ops. 12.0 12.4 13.2 13.7 14.3 14.8 15.4 71.4
III. OPER. & MAINTENANCE 876.3 997.1 960.4 971.8 1,008.7 1,052.3 1,066.1 5,059.3
A. Operations & Maintenance 661.4 708.1 696.1 722.5 747.3 772.1 799.4 3,737.5
B. Traffic Engineering & Opers. 139.7 217.9 207.1 192.8 204.8 223.7 212.3 1,040.7
C. Toll Operations 75.2 71.1 57.2 56.5 56.5 56.5 54.5 281.2
IV. ADMINISTRATION 132.0 127.2 144.7 155.2 160.3 165.7 171.2 797.1
A. Administration 68.2 70.1 72.1 72.9 75.5 78.3 81.1 380.0
B. Fixed Capital Outlay 17.8 8.0 12.3 19.6 19.6 19.6 19.6 90.7
C. Office Information Systems 46.0 49.1 60.3 62.7 65.2 67.8 70.5 326.4
TOTAL PROGRAM 7,782.7 10,438.3 9,183.7 7,205.8 7,844.3 7,529.7 7,518.5 39,281.9
V. OTHER 178.4 177.0 180.6 224.4 246.5 292.0 338.2 1,281.7
A. Local Govt. Reimbursement 1.0 1.3 2.6 17.8 0.8 7.5 0.0 28.7
B. Other 177.4 175.8 178.0 206.6 245.7 284.5 338.2 1,253.0
TOTAL BUDGET 7,961.1 10,615.4 9,364.3 7,430.2 8,090.7 7,821.8 7,856.7 40,563.6
HIGHLIGHTS:
1. Construction 3,608.1 5,128.3 4,174.6 3,310.4 4,007.1 3,561.5 3,757.8 18,811.3
2. FLP (w/o TD Commission) 1,117.8 1,499.7 1,418.2 985.6 902.0 918.6 871.6 5,096.0
3. Product Support Consultant 1,054.6 1,206.0 1,131.3 805.7 798.6 732.6 586.8 4,055.0
a. Preliminary Engineering 664.2 777.7 706.2 485.2 465.7 488.1 345.0 2,490.1
b. Construction Eng. Inspection 369.7 404.6 403.0 305.5 312.3 232.8 225.7 1,479.2
c. Right of Way Support 20.7 23.7 22.1 15.1 20.6 11.7 16.1 85.6
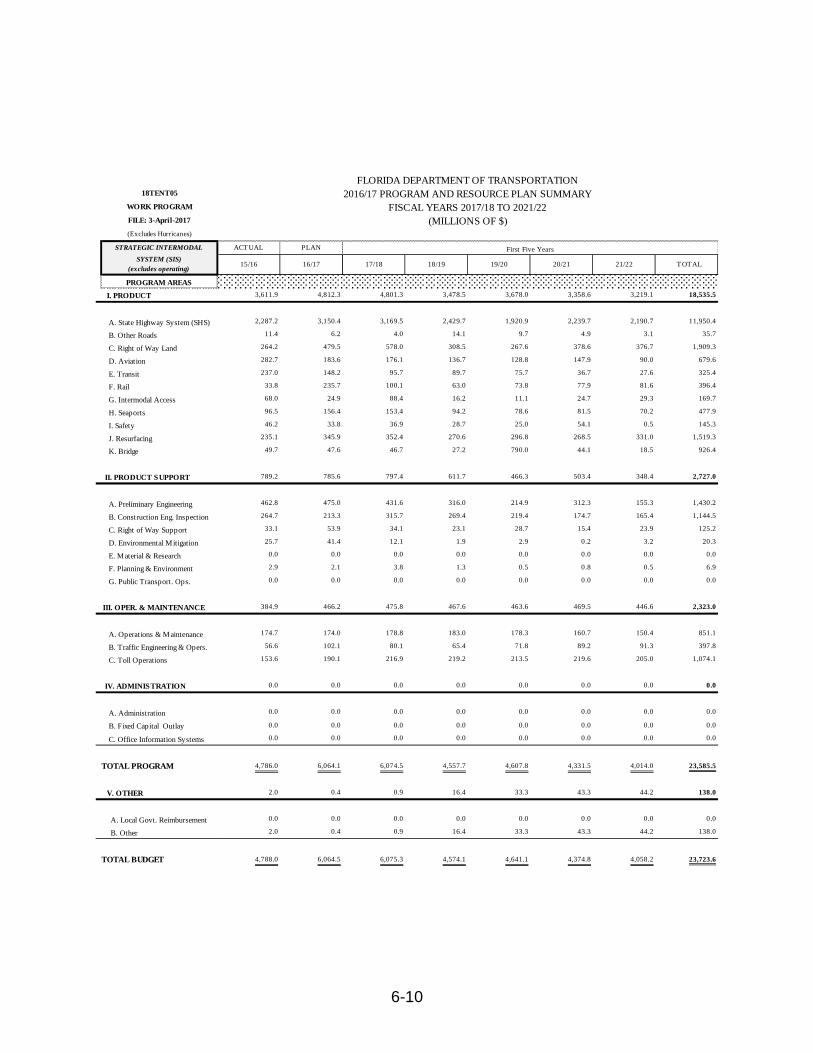
6-10
FLORIDA DEPARTMENT OF TRANSPORTATION18TENT05 2016/17 PROGRAM AND RESOURCE PLAN SUMMARY
WORK PROGRAM FISCAL YEARS 2017/18 TO 2021/22FILE: 3-April-2017 (MILLIONS OF $)(Excludes Hurricanes)
STRATEGIC INTERMODAL ACT UAL PLAN First Five Years
SYSTEM (SIS)
(excludes operating)15/16 16/17 17/18 18/19 19/20 20/21 21/22 T OTAL
PROGRAM AREAS
I. PRODUCT 3,611.9 4,812.3 4,801.3 3,478.5 3,678.0 3,358.6 3,219.1 18,535.5
A. State Highway System (SHS) 2,287.2 3,150.4 3,169.5 2,429.7 1,920.9 2,239.7 2,190.7 11,950.4
B. Other Roads 11.4 6.2 4.0 14.1 9.7 4.9 3.1 35.7
C. Right of Way Land 264.2 479.5 578.0 308.5 267.6 378.6 376.7 1,909.3
D. Aviation 282.7 183.6 176.1 136.7 128.8 147.9 90.0 679.6
E. Transit 237.0 148.2 95.7 89.7 75.7 36.7 27.6 325.4
F. Rail 33.8 235.7 100.1 63.0 73.8 77.9 81.6 396.4
G. Intermodal Access 68.0 24.9 88.4 16.2 11.1 24.7 29.3 169.7
H. Seaports 96.5 156.4 153.4 94.2 78.6 81.5 70.2 477.9
I. Safety 46.2 33.8 36.9 28.7 25.0 54.1 0.5 145.3
J. Resurfacing 235.1 345.9 352.4 270.6 296.8 268.5 331.0 1,519.3
K. Bridge 49.7 47.6 46.7 27.2 790.0 44.1 18.5 926.4
II. PRODUCT SUPPORT 789.2 785.6 797.4 611.7 466.3 503.4 348.4 2,727.0
A. Preliminary Engineering 462.8 475.0 431.6 316.0 214.9 312.3 155.3 1,430.2
B. Construction Eng. Inspection 264.7 213.3 315.7 269.4 219.4 174.7 165.4 1,144.5
C. Right of Way Support 33.1 53.9 34.1 23.1 28.7 15.4 23.9 125.2
D. Environmental Mitigation 25.7 41.4 12.1 1.9 2.9 0.2 3.2 20.3
E. Material & Research 0.0 0.0 0.0 0.0 0.0 0.0 0.0 0.0
F. Planning & Environment 2.9 2.1 3.8 1.3 0.5 0.8 0.5 6.9
G. Public Transport. Ops. 0.0 0.0 0.0 0.0 0.0 0.0 0.0 0.0
III. OPER. & MAINTENANCE 384.9 466.2 475.8 467.6 463.6 469.5 446.6 2,323.0
A. Operations & Maintenance 174.7 174.0 178.8 183.0 178.3 160.7 150.4 851.1
B. Traffic Engineering & Opers. 56.6 102.1 80.1 65.4 71.8 89.2 91.3 397.8
C. Toll Operations 153.6 190.1 216.9 219.2 213.5 219.6 205.0 1,074.1
IV. ADMINISTRATION 0.0 0.0 0.0 0.0 0.0 0.0 0.0 0.0
A. Administration 0.0 0.0 0.0 0.0 0.0 0.0 0.0 0.0
B. Fixed Capital Outlay 0.0 0.0 0.0 0.0 0.0 0.0 0.0 0.0
C. Office Information Systems 0.0 0.0 0.0 0.0 0.0 0.0 0.0 0.0
TOTAL PROGRAM 4,786.0 6,064.1 6,074.5 4,557.7 4,607.8 4,331.5 4,014.0 23,585.5
V. OTHER 2.0 0.4 0.9 16.4 33.3 43.3 44.2 138.0
A. Local Govt. Reimbursement 0.0 0.0 0.0 0.0 0.0 0.0 0.0 0.0
B. Other 2.0 0.4 0.9 16.4 33.3 43.3 44.2 138.0
TOTAL BUDGET 4,788.0 6,064.5 6,075.3 4,574.1 4,641.1 4,374.8 4,058.2 23,723.6