Embed Size (px)
Citation preview

1

1
TABLE OF CONTENT
Foreword 2
Vice-Chancellor of Universiti Sains Malaysia 2
Dean, School of Computer Sciences 3
Chair & Co-Chair of Big Data Summit 2 (2018) 4
Co-Chairs of PRAGMA Steering Committee 5
Background of Big Data Summit 2 6
Programme Objectives 6
Program Theme 6
Background of PRAGMA 8
Keynote & Invited Speakers 10
Programme Schedule of BDS2 18
BDS2 Poster Listing 23
PRAGMA 35 Poster Listing 24
BDS2 Project Abstracts 27
BDS2 Poster Abstracts 36
PRAGMA 35 Poster Abstracts 56
PRAGMA 35 Demo Abstracts 82
Program Committees 93
Partners & Sponsors 95
Personal Notes 96

2
FOREWORD
Professor Datuk Dr. Asma Ismail, FASc.
Vice-Chancellor Universiti Sains Malaysia
Assalamualaikum and Good Day, The term ‘Big Data’ has been around for some time now. The ‘Big Data’ concept surfaced resulting from the increased amounts of data available ever since the digital era started. All these data and information that have been collected especially from the use of the Internet and technology requires an efficient data storage system. Seeing that the digital realm is evolving together with the increasingly large amounts of data, we can no longer rely on previously-practised ways of storing data in small quantities. We are not only moving towards accommodating bigger storage repositories but also on how to manipulate and programme computers in order to provide advantages across many different areas. Data that are being generated at this moment represent the past and present and at the same time can foretell future outcomes of a situation. Some processes in Big Data include comparing different data to create relationships, building models from the collected data, running simulation, data tweaking, etc. which are done in an automated manner to cater to a specified or defined problem. This is where ‘analytics’ plays a role, such as using Artificial Intelligence or A.I. and machine learning to make sense of all the data. Many sectors such as healthcare, transportation, business, etc. are already exploring the benefit of data analytics. This paradigm shift has led to an increase in the demands for powerful data analysing tools. With powerful data tools, data can be analysed effectively, hence increasing the ability to describe, predict and prescribe outcomes based on the available data. That is why we are now moving towards an ecosystem that utilizes large resources and amounts of data along with effective analytics. The 2018 Big Data Summit 2 is co-located with the PRAGMA 35th Meeting and is a satellite event to the Big Data Week Asia held in Kuala Lumpur. This Summit focuses on empowering existing data analytics with the advantages of High Performance Computing and Artificial Intelligence. This is part of the efforts to provide a common platform for the Asia Pacific communities in Big Data where recent works can be shared and international collaboration opportunities can be explored. Through such efforts, it is hoped that future potentials in data analytics can be further uncovered and which would benefit many different areas. Therefore, I would like to thank the people who have worked hard to realise this event, particularly the School of Computer Sciences and the National Advanced IPv6 Centre at USM in collaboration with the PRAGMA community as well as the industry players within Malaysia. All of these parties have made a big effort in making the summit a platform where activities to explore the Big Data field can take place. I sincerely hope that this Summit will turn out to be beneficial and fruitful to the delegates and participants, and able to open up doors for future collaborations on research and innovations among them.

3
FOREWORD
Professor Dr. Ahamad Tajudin Khader Dean
School of Computer Sciences Universiti Sains Malaysia
Assalamualaikum and Good Day, Big Data. Initially, the term refers to the size and complexity of the data itself that traditional data processing softwares are insufficient equipped to manage. But over the years, the term refers more to the use of predictive analytics, user behaviour analytics and others to extract valuable data from such huge data repositories. Everyone is aware of the benefits of having big data but there is no specific method that fits all user goals. It can be seen in today’s scientists, business managers, healthcare practitioners and even governments that there are difficulties in effectively utilizing big data in their daily activities. It is easy to invest in big data projects but utilizing big data is hard and complex. Hence, more recent research on improving big data usage and analytics has begun emerging. The ability to describe, predict and prescribe outcomes based on existing data is the very essence in building an ecosystem that supports large data resources through effective analytics methods. This is where today’s Big Data Summit 2 which is co-located with PRAGMA 35th Meeting and is a satellite event to the Big Data Week Asia held in Kuala Lumpur, focuses on improving existing data analytics through the use of High-Performance Computing and Artificial Intelligence. By integrating the two areas, a more comprehensive and automated analytics approaches could be integrated into existing big data applications. By providing a common platform such as this Summit for the EU and SEA communities in Big Data to share their recent works and explore international collaboration opportunities, it is hope that further enhancements to the area could be produced for the benefit of many areas. Hence, I commend the effort made by the people who worked hard to realise this event particularly the team from the School of Computer Sciences and the National Advanced IPv6 Centre in collaboration with the PRAGMA community. It is also hope that these Summit would be an advantageous platform for researchers to identify strategies and challenges that not only focuses on the area of Big Data, but also in other research areas. This can be seen in some of the projects ideas that would be introduced throughout the summit. I sincerely hoped that by the end of this Summit, we all would be able to come together will be able to initiate collaboration on research and innovation among the participants presence here today. Thank you.

4
FOREWORD
Dr. Nurul Hashimah Ahamed Hassain Malim & Dr. Gan Keng Hoon
Chair & Co-Chair Big Data Summit 2 (2018)
Greetings! We welcome you to the Big Data Summit 2: HPC & AI Empowering Data Analytics (BDS2) held October 3–6, 2018 in Penang, Malaysia. As a premier event in the field, BDS2 provides a collaborative platform for reporting the latest developments in the research and application of High Performance Computing and Artificial Intelligence. Big Data Summit was first held in 2016, with the collaboration with CONNECT2SEA. This year, we welcome the PRAGMA delegates and proudly present the summit as a jointly event with the 35th PRAGMA meeting. This setting allows all the participants to take advantage on the networking opportunities that could be leveraged from the PRAGMA community of practice that spans through the Pacific Rim. Although it is only in its second installment, BDS2 has already witnessed significant growth in its participations. The summit has attracted numerous abstract submissions from both academia and industries from our calls for poster presentation as well as project speakers. Spanning from tracks of big data, AI, HPC to data analytics, the summit will show case a total of 44 posters comprising of late-breaking results, technical descriptions, student projects etc., 11 project demonstrations and 8 exciting project talks with partnering opportunities. Apart of that, we are also proud to announce that the summit has attracted a total of 130 participations from PRAGMA members, academics and industries. Internally, BDS2 is a collaborative effort between three divisions in USM i.e. the School of Computer Sciences, National Advanced IPv6 Center (NAv6) and Nexus (Sciences). Hence, we wish to thank the many people who have contributed their time, energy, and creativity to support this year’s summit. Our thanks go first to all our patrons, presenters, speakers and delegates. Next, we would like to warmly thank the technical reviewers who devoted much of their time to review submissions and provide the comprehensive and constructive reviews. We would also like to thank the keynotes and invited speakers for their invaluable contribution and for sharing their vision in their talks. As for our partners, MDEC and PRAGMA, as well as our sponsors, Vitrox, Silverlake, Hilti, Fusionex, Novorient, Intel and Sophic, this summit would like to thank you for your generous and kind supports. And lastly, to our team of organizing committee, this summit would not be possible without the excellent work of yours. Once again, we welcome you to this wonderful event and hope that our exciting programs will further stimulate the research and networking in the areas of big data. Enjoy the summit!

5
FOREWORD
Shava Smallen & Shinji Shimojo
Co-Chairs PRAGMA Steering Committee
Greetings! We would like to welcome everyone to the PRAGMA 35 workshop, HPC and AI empowering Data Analytics. The Pacific Rim Application and Grid Middleware Assembly, PRAGMA, is an open, grass-roots, international organization that makes cyberinfrastructure accessible, easy to use, and useful for long-tail-of-science communities to advance their science and address societally important problems. Through active participation and contributions of all members, PRAGMA focuses on how to make these new and rapidly changing CI technologies usable by these communities of scientists, within a trusted envelop of shared, easy-to-use computer and data resources and fosters new generations of researchers. PRAGMA workshops are held twice a year and are an opportunity to share progress with one another and plan our future activities. We are very happy to partner with the Big Data Summit 2 and explore opportunities for future collaboration. We would like to acknowledge the work of the PRAGMA Program Committee, in particular its Chair Dr. Nurul Malim, and the Big Data 2 Summit Committee members for their careful planning of this event. Our thanks as well to our gracious hosts at Universiti Sains Malaysia as well as MDEC and the sponsors, namely Vitrox, Silverlake, Hilti, Fusionex and Novorient. Also, a thank you to all of our participants for the excellent posters and demonstrations and our Expedition and Working Group chairs for leading discussions that help us define our future activities and directions. We encourage everyone to participate in the breakout sessions and provide us feedback that may improve future workshops and collaborations. Finally, we thank all participants for attending and we encourage everyone to participate, identify activities for collaborations, engage others in those ideas for future projects, and provide us feedback that may improve future workshops and collaborations.

6
BIG DATA SUMMIT 2 (BDS2)
Programme Objectives
The Big Data Summit 2 (BDS2): HPC & AI Empowering Data Analytics co-locating with
PRAGMA 35 Meeting is a continuity of Big Data Summit (BDS) 2016 which was held on 5–6
May 2016 at Hotel Bangi Putrajaya in collaboration with CONNECT2SEA.
BDS2 is co-located with PRAGMA 35 and is a satellite event to Big Data Week Asia that is held
in Kuala Lumpur on 2 – 9 October 2018 hosted by Malaysia Digital Economy Corporation
(MDEC). As such, this summit is more focused and specific to the applications of HPC and AI
for Data Analytics with the following objectives:
To enlighten Malaysian Researchers the impact of HPC & AI progression in empowering
(transforming) analytics
To highlight recent works on HPC & AI (e.g. Deep Learning) throughout the globe
To provide a platform for International collaboration to Malaysian researchers via
PRAGMA network
Program Theme
“HPC and AI: Empowering Data Analytics”
Data analytics and insights are fueling innovation across scientific research, product and service
design, customer experience management, and process optimization. The trend has emerged
from generating insights (descriptive analytics) to predicting future trends (predictive analytics).
Four years ago, we never would have thought data analytics could evolved to prescriptive
analytics in a near future. Prescriptive analytics involves decision making based on viable
solutions to a problem and the impact of considering a solution on future trend. Certainly, its a
massive and complex solution with tremendous data points to begin with. High Performance
Computing (HPC) accelerates innovation in diverse areas - ranging from molecular chemistry to
genome sequencing, energy exploration, and financial trading. Its capabilities to support real-time
analytics with in-memory computing; big data analytics; and simulation and modelling
empowered users to execute compute- and data-intensive workloads quickly and accurately.
Artificial Intelligence (AI) is the foundation for cognitive computing, an approach that enables
machines to mimic the neural pathways of the human brain to analyze vast datasets, make

7
decisions in real time, and even predict future outcomes. Predictive analytics with AI are core
capabilities required by data-driven organizations looking to gain competitive advantage with
their digital transformation initiatives. Over the last several years, the computing community
witnessed the convergence of HPC and AI in predictive analytics. Predictive analytics with AI
applications are expected to execute increasingly difficult tasks and forecast evolving trends to
solve some of the world’s biggest scientific, engineering, and technological problems. These
“high-performance computation” requires support of an advanced technology solution. HPC
environments is a good foundation for AI. By aggregating computing power to handle data-
intensive tasks, HPC provide the extreme levels of scalability, performance, and efficiency
required by these complex applications.
The intertwined future of HPC and AI is changing the analytics landscape. Its accelerating
analytics towards prescriptive analytics. As more powerful purposely-built HPC solutions (e.g
DGX by Nvidia) being developed and new AI applications that took advantage of these
infrastructures e.g. Deep Learning, this accelerated analytics pushes us towards prescriptive
analytics. Although limited, but such applications are already on the way. Google’s self-driving
car is a perfect example of prescriptive analytics. It analyzes the environment and decides the
direction to take based on data. It decides whether to slow down or speed up, to change lane or
not, to take a long cut to avoid traffic or prefer shorter route etc. In this way, it functions just
like a human driver by using data analysis at scale. While AI applications, such as machine
learning and deep learning, are transforming industries across the globe, HPC technologies
works silently behind-the-scenes to empower AI applications. The HPC infrastructure enables
AI applications to handle high-performance workloads, such as advanced analytics. HPC are
now becoming the engine of AI. Hence, any progression in AI or HPC will definitely
empowered (transformed) analytics. Therefore, this summit is a platform for Malaysian and
International researchers to showcase their efforts in both fields of supporting analytics and to
seek collaboration opportunities, international and local.

8
PACIFIC RIM APPLICATION AND GRID
MIDDLEWARE ASSEMBLY (PRAGMA)
The Pacific Rim Application and Grid Middleware Assembly (PRAGMA) is an international,
distributed community of practice for technology and approaches that supports the long tail of
science, namely enabling small- to medium-sized international groups, to make rapid progress in
conducting research and education by providing and developing international, experimental
cyberinfrastructure. To realize this mission, PRAGMA's current activities include four
interrelated activities:
Fostering international "scientific expeditions" by forging teams of domain scientists and
cyberinfrastructure researchers who develop and test information technologies that are
needed to solve specific scientific questions and create usable, international-scale, cyber
environments;
Developing and improving a grassroots, international cyberinfrastructure for testing,
computer science insight and, advancing scientific applications by sharing resources,
expertise and software;
Infusing new ideas by developing young researchers who gain experience in cross-border
science and by extending engagements with strategic partners;
Building and enhancing the essential people-to-people trust and organization developed
through regular, face-to-face meetings - a core foundation of PRAGMA's success.
PRAGMA’s community of practice comprising individuals and institutions from around the
Pacific Rim that actively collaborate and meet-up to discuss progresses, issues and concerns by
groups. PRAGMA meetings are held twice a year in its distributed communities countries.
Malaysia had been the host for the 15th meeting in 2008. This summit is intended to co-locate
with the 35th PRAGMA meeting to take advantage on the networking opportunities that could
be leveraged from the PRAGMA community of practice that spans through the Pacific Rim.

9
PRAGMA Expeditions
PRAGMA forges collaborative, multidisciplinary teams to address scientific questions of high
societal impact. These questions define and drive PRAGMA's technology development efforts.
There are three current expeditions:
Biodiversity: Understanding adaption in extreme environments.
Limnology: Predicting impact of eutrophication on lake ecosystem services.
ENT: Creating and utilizing an Experimental software-defined Network Testbed.
PRAGMA Working Groups
The goal of PRAGMA’s Working Groups is to identify activities for international collaborations
and engage others in those ideas for future projects. The current PRAGMA Working Groups
are described below:
Resources and Data: Investigates current technology trends and evaluates their
potential beneficial impact on applications from PRAGMA’s applications. Current
projects include the PRAGMA Cloud Testbed, the Experimental Networking Testbed,
Open Data Platform, Containers/Kubernetes, GPUs/Machine learning, and
Monitoring.
Chairs: Nadya Williams (University of California, San Diego), Hsiu-Mei Chou (National
Center For High-Performance Computing)
Telescience: Making and improving access to or use of remote equipment (e.g., tiled-
display walls or sensors). Current application areas of the group include environmental
monitoring and traffic flow.
Chairs: Shinji Shimojo (Osaka University, Fang-Pang Lin (National Center For High-
Performance Computing)
Biosciences: Creating stable infrastructure to perform computational genomics analyses
with a focus on rice breeding and integrating technologies to create an infrastructure to
advance the screening of potential compounds to combat infectious diseases
Chairs: Jason Haga (National Institute Of Advanced Industrial Science And Technology)
At the beginning of the PRAGMA workshop, Working Group updates will be given by the
chairs. It is followed by two breakout sessions where attendees will have an opportunity to dive
deeper into topics, discuss new project ideas, have an open discussion, and set goals for the next
workshop. At the end of the workshop, the Working Group chairs will summarize the results of
the discussions to everyone.

10
KEYNOTE & INVITED SPEAKERS
Title: Democratizing AI Abstract: As we transition into another industrial revolution, AI, in conjunction with the 3rd and 4th Platforms, has become a key technology megatrend that is poised to further accelerate the 4th Industrial Revolution. AI is not a new technology, but one that which become significant due the lowering cost of computing and storage by hyper-scale cloud, access to huge amounts of data and tools that has made applying AI and Data Science simpler and more productive; in short Democratization of AI. It is the author’s opinion there is an urgency to make AI a mainstream in education and a core skill for everyone that deals with science and technology for work or and research.
Dr. Dzaharudin Mansor is the National Technology Officer (“NTO”) for Microsoft Malaysia. As the NTO, Dzahar drives the engagement with key national technology stakeholders, which include academics, policy makers & advisors, and interest groups with the intention to builds trust while contribute to national development. Dr Dzahar joined Microsoft in 2005 and has more than 33 years of professional experience in ICT and telecommunications. He started his career as a lecturer at the department of Computer Science, La Trobe University, and moved on to as a R&D engineer at Telecom Australia Research Laboratories in Melbourne. On returning to Malaysia, he joined Celcom as a R&D manager, and left the company as the Vice President for R&D, Intelligent Network and IT divisions. He subsequently worked at HP in Singapore and other technology companies in R&D, operations, business, as well as leadership positions. He also presently holds, and has held, several associate positions including as an Adjunct Professor at IIUM, a councillor at PIKOM and academic advisor at several public and private universities. In 2010, he had the honour of leading the Business Services Economic Transformation Program (ETP) Labs that has been one of the key initiatives by the Malaysian Government to transform Malaysia into a developed nation by 2020. He is a senior member of IEEE. Dr. Dzahar received a First Class Honors Degree in Computer Systems Engineering from Monash University, Australia in 1985, and subsequently awarded Australian University Graduate scholarships to completed his PhD in Computer Science in 1988. In 1985, he was awarded the Digital Award for Computer Engineering, the University Tasmania award for achieving top 10 position in HSC, and the MCE Top Student Award at MCKK in 1979. Dr. Dzahar is passionate about technology, where he works closely with academia and research on topics such as Software Engineering, Computer Architectures, Cyber Security, Telecommunications, Data Science and AI. He aspires to contribute towards the nation’s Digital Economy initiative.
Keynote 1 Dr. Dzaharudin Mansor National Technology Officer
Microsoft Malaysia

11
KEYNOTE & INVITED SPEAKERS
Title: Immersive Visualization and Analytics for Understanding Large-scale Datasets Abstract: Today, data is accumulating at an unprecedented rate and is expected to reach tens of zettabytes by the year 2020. These troves of big data can provide significant value to all sectors of society, especially research activities. However, the sheer amount of data is creating significant challenges to data-intensive science. To address this challenge, the visualization and analysis of data requires an interdisciplinary effort and next generation technologies, specifically interactive environments that can immerse the user in data and provide tools for data analytics. Several types of immersive technologies are becoming a viable, innovative solutions for a wide variety of applications. To highlight this concept, this keynote will showcase scalable high-resolution display technologies, virtual reality, and augmented reality technologies for data-intensive applications through different application examples. These applications explore how combinations of 2D and 3D representations of data can support and enhance data-intensive efforts using these new technology platforms. This presentation is designed to inspire any research community looking for novel data visualization solutions.
Dr. Jason Haga is currently a member of the Cyber-Physical Cloud Research Group in the Information Technology Research Institute of The National Institute of Advanced Industrial Science and Technology (AIST). For over 20 years, Dr. Haga has focused on multidisciplinary research. Past research includes the design and implementation of biomedical applications for grid computing environments and tiled display walls. He also has collaborated with cultural heritage institutions to deploy novel interactive exhibits to engage the public in learning. Current projects of interest include immersive visualization of data and user experience/user interface for data intensive applications. He is actively involved with the Pacific Rim Application and Grid Middleware Assembly (PRAGMA) community, where he leads the Biosciences working group and has mentored over 70 students from around the world. Dr. Haga is continuing this mentorship effort at AIST by leading an international internship program that strategically positions AIST as an international hub for computer science research training. With over 14 years of global collaborative efforts with technologists and domain scientists in the PRAGMA community, he continues to look for interdisciplinary research opportunities connecting scientists to advance research on a global scale. Dr. Haga earned a PhD in biomedical engineering from the University of Tennessee, Memphis and did postdoctoral work at UC San Diego. He currently lives in Tsukuba, Japan.
Keynote 2 Dr. Jason Haga
Cyber-Physical Cloud Research Group The National Institiute of Advanced Industrial
Science and Technology (AIST), Japan

12
KEYNOTE & INVITED SPEAKERS
Title: Big Data and Artificial Intelligence Meet Biology Abstract: Donald Knuth in an interview with Computer Literacy Bookshops (CLB) on 7th December, 1993 said, “Biology easily has 500 years of exciting problems to work on”. After 25 years, we are witnessing an exciting era of data explosion in biology where biological data from various data sources is growing at an exponential rate. There is now demand for new approaches and techniques to manage, organize and analyze this massive amount of data. In this talk, we will present an overview on big data and artificial intelligence, how both technologies are poised to solve the challenges in Big Biology.
Rosni Abdullah is a Professor in Parallel Computing at the School of Computer Sciences, Universiti Sains Malaysia (USM) and is one of the national pioneers in this field. She obtained her PhD in April 1997 from Loughborough University, United Kingdom specializing in the area of Parallel Numerical Algorithms. Both her Bachelors degree and Masters degree in Computer Science were obtained from Western Michigan University, Kalamazoo, Michigan, U.S.A. in 1984 and 1986 respectively. She has served as Dean of the School of Computer Sciences at Universiti Sains Malaysia (USM) from 2004 to 2012, after having served as its Deputy Dean (Postgraduate and Research) since 1999. She is also the Head of the Parallel and Distributed Processing Research Group at the School since its inception in 1994. Her research areas include Parallel and Distributed Computing, Parallel Numerical Algorithms and Parallel Algorithms for Bioinformatics. 20 PhD students have graduated under her supervision. She has led more than 20 research grants including 2 European Union grants and 2 Intel grants, and has published more than 100 papers in journals and conference proceedings. She is currently the Director of the National Advanced IPv6 Center (Nav6), a center of research excellence in USM that focus on Cybersecurity and Internet of Things (IoT).
Keynote 3 Prof. Dr. Rosni Abdullah
Director National Advance IPv6 Centre
Universiti Sains Malaysia

13
KEYNOTE & INVITED SPEAKERS
Title: HPC in Applications of Big Data and IoT Abstract: High performance computing (HPC) has been developed in order to achieve extreme scale modeling for high-resolution floating-point solutions on traditional challenge of big science such as high energy physics, astronomy, brain science, molecular structure and turbulence … etc. The international competition on whose machine is the fastest is only getting harsher and more intense nowadays. Yet, with the rising of optical networks, 4G/5G wireless networks and the advance of smart and connected end devices ranging from sensors, mobile phones, data collected has been in exponential growth. To understand the data is usually not what traditional HPC concerns. The modern machine learning technology, e.g. deep learning, requires only lower resolution floating point solutions. It is easy to find the analogy between data observed from the galaxy and the data from the sensors that deployed around the world. Compute power, however, is still the key to solutions of Big Data (BD) analytics. In this talk, the previous efforts in NCHC on applications of BD and IOT will be introduced and it will be used to explain why our new peta-scale machine needs to converge both HPC and BD for both modeling physics and learning from data.
Dr Fang-Pang Lin is the Senior Research Fellow at National Center for High Performance Computing and Joint Appointment Professor at National Central University of Taiwan. He is one of the key developers for developing the national cyber-infrastructure of Taiwan, namely Knowledge Innovation National Grid. He co-founded the Global Lake Ecological Observational Network and Global Coral Reef Environmental Observational Network. His major research focuses on cyberinfrastructure for long term environmental and ecological observation. Recent development includes Taiwan Earth Science Observatory Knowledgebase, EU FP7 Fish4Knowledge collaboration, real-time wide area flood monitoring and government big data. The efforts also lead to US-East Asia collaborations to enable transnational cyberinfrastructure applications, which based on shared software defined systems applying to issues on disaster management, environmental monitoring and simulation, and smart cities. Dr. Fang-Pang Lin obtained his PhD in University of Wales at Swansea, UK. He worked in Rolls-Royce University Computing Center in Oxford University for his postdoctoral research. He joined NCHC in Oct., 1997 and has been working in numerical simulation and software engineering regarding application integration. He was the winner of 2006 Outstanding Achievement Award in Science and Technology, the Executive Yuan of Taiwan.
Keynote 4 Dr. Fang-Pang Lin
National Center for High Performance Computing, NARLabs Taiwan

14
KEYNOTE & INVITED SPEAKERS
Title: ABCI: An Open Innovation Platform for Advancing AI Research and Deployment Abstract: ABCI is an open innovation platform with world-class computing resources of 0.55 AI-EFLOPS / 37 PFLOPS (DP) for AI research and development. Through industry and academia collaboration, Algorithms, Big Data, and Computing Power are leveraged in a single common public platform. ABCI rapidly accelerates the deployment of AI into real business and society. ABCI is ranked at number 5 in the June 2018 TOP500 supercomputer ranking and the operation starts from August, 2018.
Ryousei Takano is a research group leader of the Information Technology Research Institute, the Institute of Advanced Industrial Science and Technology (AIST), Japan. He received his Ph.D. from the Tokyo University of Agriculture and Technology in 2008. He joined AXE, Inc. in 2003 and then, in 2008, moved to AIST. His research interests include operating systems and distributed parallel computing. He is currently exploring a highly efficient data center for AI and Big Data processing, and an operating system for heterogeneous accelerator clouds.
Invited Talk 1 Dr. Ryousei Takano
Information Technology Research Institute The National Institiute of Advanced Industrial
Science and Technology (AIST), Japan

15
KEYNOTE & INVITED SPEAKERS
Title: On Lakes and Clouds: A Retrospective on the PRAGMA/GLEON Lake Expedition Abstract: The PRAGMA Lake Expedition is an interdisciplinary collaboration with GLEON (The Global Lake Ecological Observatory Network) that is advancing the current understanding of the effects of climate change and eutrophication (i.e., increased nutrient pollution of nitrogen and phosphorus, leading to increased plant growth) on harmful algal blooms in lakes. Since its inception in 2014, the lake expedition has brought together computer scientists and lake ecologists (faculty, graduate, and undergraduate students) to address science questions using state-of-the-art (yet easy to use) cyber-infrastructure. In particular, the team has successfully developed and deployed GRAPLEr, a novel system that combines open-source technologies developed by PRAGMA (IP-over-P2P, IPOP overlay virtual networks) and leveraged from other projects (HTCondor high-throughput computing) to provide a user-friendly platform to execute hundreds of thousands of lake model runs from a user's familiar R/R-Studio desktop environment in cloud computing infrastructures (including PRAGMA-Cloud). More recently, the lake expedition is investigating approaches that allow small computing devices (sensor gateways) deployed in the field, at the network's "edge", to connect to the cloud infrastructure via software-defined overlays. The talk will provide a retrospective on the lake expedition activities, with a summary of techniques, technologies and lessons learned along the way.
Renato J. Figueiredo is a Professor at the Department of Electrical and Computer Engineering of the University of Florida. Dr. Figueiredo received the B.S. and M.S. degrees in Electrical Engineering from the Universidade de Campinas in 1994 and 1995, respectively, and the Ph.D. degree in Electrical and Computer Engineering from Purdue University in 2001. From 2001 until 2002 he was on the faculty of the School of Electrical and Computer Engineering of Northwestern University at Evanston, Illinois, and from 2012 to 2013 he was a visiting researcher at Vrije Universiteit, the Netherlands. His research interests are in the areas of virtualization, distributed systems, overlay and software-defined networks, cloud and edge computing, and their applications in support of computational science in domains including lake ecology, bio-diversity, and smart and connected communities. Dr. Figueiredo’s research team leads the IPOP (IP-over-P2P) open-source overlay virtual network project.
Invited Talk 2 Prof. Dr. Renato J. Figueiredo
Department of Electrical and Computer Engineering University of Florida, USA

16
KEYNOTE & INVITED SPEAKERS
Title: Toward the Global Research Platform Abstract: From biomedical data to particle physics, today nearly all research and data analysis involves remote collaboration. In order to work effectively and efficiently on multi-institutional projects, researchers depend heavily on high-speed access to large datasets and computing resources. To meet the needs of researchers in California and beyond, the National Science Foundation (NSF) in the United States has awarded a five-year, $5 million grant to fund the Pacific Research Platform (PRP). The PRP’s data-sharing architecture, with end-to-end 10-100Gbps connections, enables region-wide virtual co-location of data with computing resources. The PRP establishes a science-driven high-capacity data-centric network, enabling researchers to move data between labs and collaborators’ sites, supercomputer centers or data repositories without performance degradation. Today, dozens of top universities and research centers are doing work across a broad range of data-intensive research projects that will have wide-reaching impacts on science and technology worldwide in the areas of cancer genomics, galaxy evolution research, and climate modeling. In this keynote, Nadya Williams will provide an overview of the PRP and it’s architecture and describe a few use cases that describe how scientists are leveraging the PRP to help them achieve their scientific goals.
Nadya Williams is a Research Scientist at the San Diego Supercomputer Center at UC San Diego. She served as a functional lead in the design, specification and evaluation of software architectures for the scientific computing environments focusing on high performance, hight throughput and virtual environments for PRAGMA and NBCR projects at UCSD. She is actively involved with PRAGMA since 2007 where she now leads Resources and Data working group. Nadya has years of global collaborative experience working with the scientists from Europe, PRAGMA and other communities. She recently joined the technical team for the Pacific Research Platform where she continues to work in the area ofvirtualization, distributed applications and cloud computing to provide a computational science support to the domain scientists. Nadya earned an M.S. in Oceanography and an M.S. in Computer Science.
Invited Talk 3 Nadya Williams Research Scientist
San Diego Supercomputer Center University of California, San Diego, USA

17
KEYNOTE & INVITED SPEAKERS
Title: Enabling Global HPC Collaboration through MYREN and NSRC Abstract: Collaboration is key in this age of research and education both local and at international level. I will give an introduction for MYREN as the National Research & Education Network (NREN) in Malaysia and Network Startup Research Center (NSRC), an organization based at University of Oregon. This talk will highlight efforts to improve the network capabilities and engineering setup at R&E organization around the world, particularly our recent joint effort during PRAGMA35 and Big Data Summit 2 to MYREN technical community.
Graduated from Sheffield Hallam University, UK in Bachelor of Computing (Networks & Communications), Kamal Hisham Kamaruddin is currently the Head of Operation at Malaysia MYREN. Kamal has been with MYREN since its inception in 2005 and instrumental in developing MYREN2, MYREN3 network and all its sub projects to get Polytechnics, Community Colleges and Teaching Hospitals connected to MYREN. He is the Governor for Malaysia in an Asia- Europe collaboration project – Trans Eurasia Information Network (TEIN) connecting Research & Education Network (REN) in Asia Pacific to Europe. He is also a Steering Committee member for Asi@Connect project, a successor project for TEIN4. Kamal is actively promoting REN best practices in the area of network design, security and network operation both locally in Malaysia and in the region particularly in the ASEAN region. He continues to assist network engineers from MYREN user community in Malaysia and voluntarily runs technical workshops for MYREN user groups.
Invited Talk 4 Kamal Hisham Kamaruddin
Head of Operation MYREN Network Sdn. Bhd.

18
PROGRAMME SCHEDULE OF BDS2
Big Data Summit 2 2018
(3-6 October 2018)
Day 1 – 3rd October 2018, Wednesday Venue TIME PROGRAM
0830-0900 Registration Lobby Auditorium Murad Muhammad Noor
0900-0915 Welcoming & Introduction to Big Data Summit 2
Dr. Nurul Hashimah Ahamed Hassain Malim Chair, Big Data Summit 2
Dr. Gan Keng Hoon Co-Chair, Big Data Summit 2
Auditorium Murad Muhammad Noor
0915-0930 Introduction to PRAGMA Shava Smallen Interim Co-Chair, PRAGMA
Auditorium Murad Muhammad Noor
0930-1010 KEYNOTE 1: DEMOCRATIZING AI Dr. Dzaharudin Mansor Microsoft Malaysia
Auditorium Murad Muhammad Noor
1010-1030 COFFEE BREAK (Sponsored by HILTI) Lobby Ground Floor
1030-1110 KEYNOTE 2: (PRAGMA) IMMERSIVE VISUALIZATION AND ANALYTICS FOR UNDERSTANDING LARGE-SCALE DATASETS Dr. Jason Haga National Institute of Advanced Industrial Science and Technology (AIST), Japan
Auditorium Murad Muhammad Noor
1110-1310 Project Speaker Slots
1110 – 1130 [BS01] Reliability Assessment Framework using Test-Defect Coverage Analytics Model Dr. Sharifah Mashita Syed Mohamad, Universiti Sains Malaysia
1130 – 1150 [BS02] Type-2 Fuzzy Systems and the Variations in the Uncertain Environments Dr. Nur Syibrah Mohd Naim, Universiti Sains Malaysia
1150 – 1210 [BS03] Data Mining System to Detect Finger Motion in Offline Handwriting Forgery Dr. Loh Wei Ping, Universiti Sains Malaysia
1210 – 1230 [BS04] Strategic Cyber Threat Intelligence Using External Unstructured Data Mr. Kew Yoke Ling, KewMann
1230 – 1250 [BS05] Fiber Tractography using Grid Computing Dr. Anusha Achuthan, Universiti Sains Malaysia
1250 – 1310 [BS06] Can I Trust You? Towards Modelling Trust at Zero Acquaintance Dr. Syaheerah Lebai Lutfi, Universiti Sains Malaysia
Auditorium Murad Muhammad Noor

19
1310 -1410 BUSINESS LUNCH (Sponsored by VITROX) Lobby Ground Floor
1410-1450 KEYNOTE 3: BIG DATA AND ARTIFICIAL INTELLIGENCE MEET BIOLOGY Prof Rosni Abdullah National Advance IPv6 Centre, Universiti Sains Malaysia
Auditorium Murad Muhammad Noor
1450-1530 KEYNOTE 4: (PRAGMA) HPC IN APPLICATIONS OF BIG DATA AND IOT Dr. Fang-Pang Lin National Center for High-Performance Computing, NARLabs, Taiwan
Auditorium Murad Muhammad Noor
1530-1610 Project Speaker Slots
1530 – 1550 [BS07] Data Science Analytics for Manufacturing and Supply Chain Dr. Umi Kalsom Yusof, Universiti Sains Malaysia
1550 - 1610 [BS08] Interfacing Chatbot with Data Retrieval and Analytics Queries for Decision Making Dr. Gan Keng Hoon, Universiti Sains Malaysia
Auditorium Murad Muhammad Noor
1610-1630 COFFEE BREAK (Sponsored by HILTI) + POSTER SESSION NETWORKING
Lobby Auditorium Murad Muhammad Noor
1630 -1805 Poster Session (Please refer to BDS2 poster listing)
Lobby Auditorium Murad Muhammad Noor
1830 -2030 PRAGMA Welcoming Reception (PRAGMA members + BDS2 Committee only)
Clubhouse
Day 2 – 4th October 2018, Thursday Venue TIME PROGRAM
0830-0900 Registration Arrival of the Vice Chancellor, USM
Lobby Auditorium Murad Muhammad Noor
0905-1015 Opening Ceremony
National & USM Anthem Prayer Recitation Welcoming Speech by Prof. Ahamad Tajudin Khader, Main Patron BDS2 & Dean, School of Computer Sciences Speech by Dr. Peter Arzberger, Founder, The Pacific Rim Application and Grid Middleware Assembly (PRAGMA) Opening Speech by Prof. Datuk Dr. Asma Ismail Vice Chancellor, Universiti Sains Malaysia Video Presentation Group Photo
Auditorium Murad Muhammad Noor

20
1015-1035 COFFEE BREAK (Sponsored by Fusionex) Lobby Ground Floor
1035-1100 PRAGMA Welcoming Statement Shava Smallen
Auditorium Murad Muhammad Noor
1100-1130 INVITED TALK 1: (PRAGMA) ABCI: AN OPEN INNOVATION PLATFORM FOR ADVANCING AI RESEARCH AND DEPLOYMENT Dr. Ryousei Takano National Institute of Advanced Industrial Science and Technology (AIST) Japan
Auditorium Murad Muhammad Noor
1130-1200 INVITED TALK 2: (PRAGMA) ON LAKES AND CLOUDS: A RETROSPECTIVE ON THE PRAGMA/GLEON LAKE EXPEDITION Prof. Dr. Renato J. Figueiredo University of Florida
Auditorium Murad Muhammad Noor
1200-1300 PRAGMA Working groups and Expedition updates
Auditorium Murad Muhammad Noor
1300-1400 BUSINESS LUNCH (Sponsored by Silverlake) Lobby Ground Floor
1400-1500 PRAGMA Working Groups (WG) Breakouts 1: Resources WG + Cyberlearning WG Telescience WG Data/Geo/Bioscience WG
Auditorium B Main Board Room Seminar Room 3
1500-1530 PRAGMA Lightning Talks Chair: Wassapon Watanakeesuntorn
Auditorium Murad Muhammad Noor
1530-1600 COFFEE BREAK (Sponsored by Fusionex) POSTER SESSION NETWORKING
Lobby Auditorium Murad Muhammad Noor
1600-1630 PRAGMA Poster Session (Please refer to PRAGMA 35 poster listing)
Lobby Auditorium Murad Muhammad Noor
1630-1730 PRAGMA Demo Session 1 Session Chair: Assoc Prof. Dr. Kohei Ichikawa
1630 – 1645 [PD01] Integrating PRAGMA-ENT and Inter-Cloud Platform using Dynamic L2VLAN Service Kohei Ichikawa, Atsuko Takefusa, Yoshiyuki Kido, Yasuhiro Watashiba and Susumu Date
1645 – 1700 [PD02] Extending SDN Networks from Cloud-to-Edge using Virtual Private Networks with Peer-to-Peer Overlay Links Kensworth Subratie and Renato Figueiredo
1700 – 1715 [PD03] Analysis of Load Balancing Performance on Cluster Computing with PROXMOX VE Andi R. Darsono
1715 – 1730 [PD04] Performance Comparison of Load Balancing using Honeybee and Threshold Algorithm Aditya Efrian, Sri Chusri Haryanti, Sri Puji Utami and Ridho Yanevan Pratama
Auditorium Murad Muhammad Noor

21
1750-2245 CONFERENCE DINNER Butterworth 4 & 5, Holiday Inn, Batu Feringghi
1750 Departure from SAINS@USM 1900 Bus Arrival at Holiday Inn, Batu Feringghi
Participant can walk around or prepare for prayers 1945 Participants take place in ballroom 2000 VIP Arrival 2010 National & USM Anthems 2015 Appreciation Speech by Chair of Big Data Summit 2
Dr. Nurul Hashimah Ahamed Hassain Malim 2025 Speech by Vice Chancellor Universiti Sains Malaysia
Prof. Datuk Dr. Asma Ismail 2035 Dinner & Performances 2135 PRAGMA Appreciation Session
Shava Smallen & Dr. Peter Arzberger 2200 Adjourn – Night market walk 2245 Buses departure to Equatorial Hotel & sains@usm
Holiday Inn, Batu Feringghi
Day 3 – 5th October 2018, Friday Venue
TIME PROGRAM
0900-0930 INVITED TALK 3: (PRAGMA) TOWARD THE GLOBAL RESEARCH PLATFORM Nadya Williams San Diego Supercomputer Center University of California San Diego
Auditorium Murad Muhammad Noor
0930-1000 INVITED TALK 4: ENABLING GLOBAL HPC COLLABORATION THROUGH MYREN AND NSRC Kamal Hisham Kamaruddin MYREN Network Sdn. Bhd.
Auditorium Murad Muhammad Noor
1000-1020 PRAGMA Wide Mentoring Update Chair: Dr. Jason Haga
Auditorium Murad Muhammad Noor
1020-1040 COFFEE BREAK (Sponsored by Novorient) + NETWORKING Lobby Ground Floor
1040-1210 PRAGMA Demo Session 2 Session Chair: Dr. Yoshiyuki Kido
1040 – 1055 [PD05] EDISON Data Platform for Computational Science Data Jaesung Kim, Jeongcheol Lee, Sunil Ahn and Jongsuk Lee
1055 – 1110 [PD06] Web-based Compute-Data Research Environment for Aircraft Airfoil Aerodynamics James Junghun Shin, Kumwon Cho and Jonsuk Ruth Lee
1110 – 1125 [PD07] Mobile-based Augmented Reality for Sundanese Alphabets Education Muhammad Reza Aditya, Resskytha Sari, Adri Nursimarsiyan and Nova Eka Diana
1125 – 1140 [PD08] Tuberculosis (TB) Disease Interactive Map in Jakarta Capital Special Region Nuraisah and Ummi Azizah Rachmawati
Auditorium Murad Muhammad Noor

22
1140 – 1155 [PD09] Neuro Data Platform for Neuroscientist Nurul Hashimah Ahamed Hassain Malim, Jafri Malin Abdullah, Sharifah Aida Sheikh Ibrahim, Nurfaten Hamzah, Ariffin Marzuki Mokhtar, Putra Sumari, Ahamad Tajudin Khader and Muhammad Jaziem Mohamad Javeed
1155 – 1210 [PD10] Deep Learning Classification for Liver Disease Andi Batari Ahmad and Nova Eka Diana
1210-1445 LUNCH and PRAGMA Steering Committee Meeting Auditorium B Lobby Ground Floor
1445-1630 PRAGMA Working Groups (WG) Breakouts 2: Resources WG + Cyberlearning WG Telescience WG Data/Geo/Bioscience WG
Auditorium B Main Board Room Seminar Room 3
1630-1645 COFFEE BREAK (Sponsored by Novorient) + NETWORKING Lobby Ground Floor
1645-1730 CLOSING CEREMONY
PRAGMA Best Poster Award & Student Presentation
PRAGMA Working groups wrap-up
PRAGMA 35 Wrap up by Shava
Video presentation
Invitation to PRAGMA 36 in Korea
Big Data Summit 2 Poster Award
Big Data Summit 2 wrap up by Prof. Dr. Rosni Abdullah, Director, National Advanced IPv6 Centre, USM
Auditorium Murad Muhammad Noor Auditorium Murad Muhammad Noor
1800-2030 PRAGMA Dinner (PRAGMA members & BDS2 committees only) 1800: Bus Departure to Bangkok Tomyam 1845: Dinner 2030: Bus Departure to Equatorial Hotel
Bangkok Tomyam Sunway Tunas
Day 4 – 6th October 2018, Saturday
TIME PROGRAM
0830-1700 Excursion – (PRAGMA member only) Pick-up point: Equatorial Hotel
0830 Participants gather at Equatorial Hotel 0845 Bus Departure from Equatorial Hotel to Penang Hill 0915 Arrival at Penang Hill 1200 Departure from Penang Hill to Esplanade 1245 Arrival at Esplanade (Lunch) 1400 Departure to Penang Heritage Trail 1600 Departure from Penang Heritage Trail to Equatorial Hotel & airport

23
BDS2 POSTER LISTING
Poster Presentation
Poster ID
Title and Author
BP01 Towards Large-scale Text Annotation for Sentiment Analysis using Semi-supervised Deep Learning
Vivian Lay Shan Lee, Gan Keng Hoon
BP02 Big-spatial Data Pre-processing Framework towards Flood Assessment
Ahmed Ndanusa, Zulhairi Dahalin, Azman Ta'a
BP03 Data Analytics of Malaysia’s Most Influential Entities in Social Media for Commercial Purpose
Yasmin M Yacob, Tong Hau Lee
BP04 Low Resolution to High Resolution Video Surveillance Image Enhancement Using Deep Learning
Muhamad Faris Che Aminudin, Shahrel Azmin Suandi
BP05 Classification of Manufacturing High Dimensional Data Using Deep Learning-based Approach
Mohd Nor Akmal Khalid, Umi Kalsom Yusof
BP06 Copy-Move Forgery Detection Using Convolutional Neural Networks
Arfa Zainal Abidin, Azurah A. Samah, Hairudin Abdul Majid, Saleha Safie, Muhamad Faiz Misman
BP07 Cognitive-based Approach for Business Intelligence
Herison Surbakti, Azman Taa
BP08 iFR: A New Framework for Real Time Face Recognition with Machine Learning
Syazwan Syafiqah Sukri, Nur Intan Raihana Ruhaiyem
BP09 Automatic Liver Tumor Detection using Deep Learning: Triplanar Convolutional Neural Network Approach
Chung Sheng Hung, Gan Keng Hoon, Anusha Achuthan, Mandava Rajeswari
BP10 Selection Drought Index Calculation Methods Using ELECTRE (Elimination and Choice Translation Reality)
Addy Suyatno Hadisuwito, Fadratul Hafinaz Hassan
BP11 Deep Bayesian for Opinion-Target Identification
Omar Al-Janabi, Cheah Yu-N, Nurul Hashimah Ahamed Hassain Malim
BP12 The Effect of Vocal Cues on Trust at Zero Acquaintance
Deborah Ooi, Syaheerah Lebai Lutfi

24
BP13 EEG Channels Selection Using Hybridizing Flower Pollination and β-Hill Climbing Algorithm for Person Identification
Zaid Alyasseri, Ahamad Tajudin Khader
BP14 Exploring Whole-Brain Functional Networks of Music-Linguistic from Rhythmic Quranic Recitations and Language Proficiency
Mas Syazwanee Shab, Muzaimi Mustapha, Aini Ismafairus Abd Hamid, Amiri Ab Ghani, Nidal S. Kamel
BP15 Parallel Text Acquisition and English-Malay Machine Translation
Tan Tien Ping, Yin Lai Yeong, Gan Keng Hoon, Siti Khaotijah Mohammad
BP16 Characterizing Compute-Intensive Tasks as a Factor of Network Congestion
Norfazlin Rashid, Umi Kalsom Yusof
BP17 A Hyper-heuristic based Artificial Bee Colony Algorithm for the Traveling Salesman Problem
Choong Shin Siang, Wong Li Pei
BP18 The Application of Machine Learning in Classifying Potential Vector Borne Disease Awareness
Abrar Noor Akramin Kamarudin, Zurinahni Zainol, Nur Faeza Abu Kassim
BP19 Supersymmetry Feature Decomposition for Classification Purpose
Nu’man Badrud’din
PRAGMA POSTER LISTING
Poster Presentation
Poster ID
Title and Author
PP01 Mobile-based Augmented Reality for Sundanese Alphabets Education
Muhammad Reza Aditya, Resskytha Permata Sari, Adri Nursimarsiyan and Nova Eka Diana
PP02 Deep Learning Classification for Liver Disease
Andi Batari Ahmad and Nova Eka Diana
PP03 Application of Deep Learning and Fingerprint Modeling Methods to Predict Cannabinoid and Cathinone Derivatives
Widya Dwi Aryati, Gerry May Susanto, Muhammad Siddiq Winarko, Heru Suhartanto and Arry Yanuar

25
PP04 Building Smart City Datasets with Crowdsourcing for Safe Direction in Bangkok, Thailand
Manassanan Boonnavasin, Suchanat Mangkhangjaroen and Prapaporn Rattanatamrong
PP05 A Network Performance Measurement in a Low-Cost Containerized Cluster System
Thitiwut Chamornmarn, Vasaka Visoottiviseth and Ryousei Takano
PP06 A Prototype of Collaborative Augment Reality Environment for HoloLens
Dawit Chusetthagarn, Vasaka Visoottiviseth and Jason Haga
PP07 Analysis of Load Balancing Performance on Cluster Computing with Proxmox VE
Andi Rasuna Dharsono and Sri Chusri Haryanti
PP08 Performance Comparison of Load Balancing using Honeybee and Threshold Algorithm
Aditya Efrian, Sri Chusri Haryanti, Sri Puji Utami Atmoko and Ridho Yanevan Pratama
PP09 Data-centric Modeling of Gainesville Businesses
Michael Elliott, Erik Bredfeldt, Matthew Collins, Renato Figueiredo, Mark Girson, Amardeep Siglani, Lila Stewart and Jose Fortes
PP10 Performance Analysis of GTX 980 GPU on Colon Histopathology Images Training Based on Convolutional Neural Network
Toto Haryanto, Aniati Murni, Kusmardi Kusmardi, Li Xue and Suhartanto Heru
PP11 Dengue Hemorrhagic Fever Disease Data Clustering Based on Interactive Map in Special Region Jakarta Capital
Brian Hogantara and Ummi Azizah Rachmawati
PP12 Curating Target-Activity Information for Nadi Compounds Based on CHEMBL using Similarity Searching
Muhammad Jaziem Mohamed Javeed, Aini Atirah Rozali, Siti Zuraidah Mohamad Zobir, Habibah Abdul Wahab and Nurul Hashimah Ahamed Hassain Malim
PP13 Design AR application using the tiled display walls
Jidapa Kongsakoonwong, Jason Haga and Boonsit Yimwadsana
PP14 Decision Support System based on Interactive Map of Measles and Rubella Data in Jakarta
Pravin Kumar, Elan Suherlan and Ummi Azizah Rachmawati
PP15 RNA-seq transcriptome profiling of Desmos chinensis: revealing the molecular basis of petal evolution in the custard apple family Annonaceae
Amy Wing-Sze Leung, Sangtae Kim and Richard Mark Kingsley Saunders
26
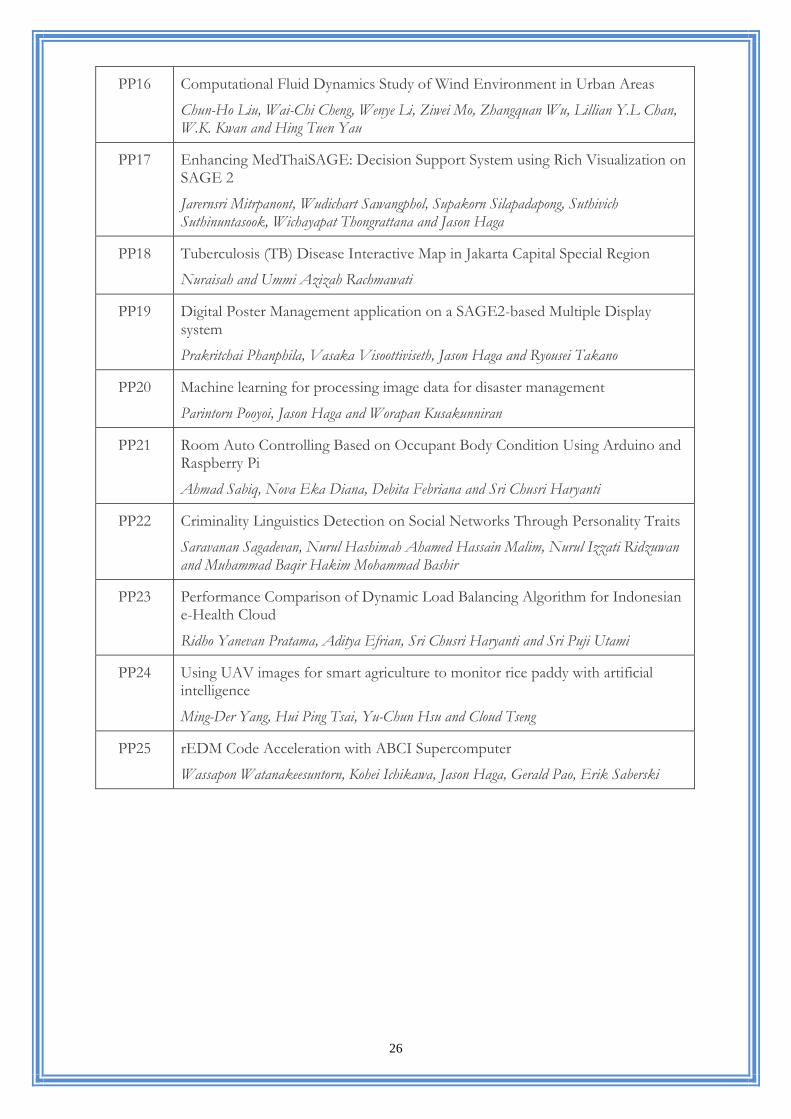
PP16 Computational Fluid Dynamics Study of Wind Environment in Urban Areas
Chun-Ho Liu, Wai-Chi Cheng, Wenye Li, Ziwei Mo, Zhangquan Wu, Lillian Y.L Chan, W.K. Kwan and Hing Tuen Yau
PP17 Enhancing MedThaiSAGE: Decision Support System using Rich Visualization on SAGE 2
Jarernsri Mitrpanont, Wudichart Sawangphol, Supakorn Silapadapong, Suthivich Suthinuntasook, Wichayapat Thongrattana and Jason Haga
PP18 Tuberculosis (TB) Disease Interactive Map in Jakarta Capital Special Region
Nuraisah and Ummi Azizah Rachmawati
PP19 Digital Poster Management application on a SAGE2-based Multiple Display system
Prakritchai Phanphila, Vasaka Visoottiviseth, Jason Haga and Ryousei Takano
PP20 Machine learning for processing image data for disaster management
Parintorn Pooyoi, Jason Haga and Worapan Kusakunniran
PP21 Room Auto Controlling Based on Occupant Body Condition Using Arduino and Raspberry Pi
Ahmad Sabiq, Nova Eka Diana, Debita Febriana and Sri Chusri Haryanti
PP22 Criminality Linguistics Detection on Social Networks Through Personality Traits
Saravanan Sagadevan, Nurul Hashimah Ahamed Hassain Malim, Nurul Izzati Ridzuwan and Muhammad Baqir Hakim Mohammad Bashir
PP23 Performance Comparison of Dynamic Load Balancing Algorithm for Indonesian e-Health Cloud
Ridho Yanevan Pratama, Aditya Efrian, Sri Chusri Haryanti and Sri Puji Utami
PP24 Using UAV images for smart agriculture to monitor rice paddy with artificial intelligence
Ming-Der Yang, Hui Ping Tsai, Yu-Chun Hsu and Cloud Tseng
PP25 rEDM Code Acceleration with ABCI Supercomputer
Wassapon Watanakeesuntorn, Kohei Ichikawa, Jason Haga, Gerald Pao, Erik Saberski

27
BDS2 PROJECT ABSTRACTS

28
[BS01] Reliability Assessment Framework using Test-Defect Coverage Analytics Model
S. M. Syed-Mohamad1,*, M. H. Husin1, W. M. N. W. Zainon1
1: School of Computer Sciences, Universiti Sains Malaysia, Malaysia
* Correspondent author: [email protected]
Keywords: Software Analytics, Software Testing, Visual Analytics, Software Reliability
Software testing is a process by which quality of the software
under test can be identified. Information collected during testing
such as defect models is used to decide whether a piece of software
is ready to be released. An early process was to freeze the software
code to prevent further additions to the software functionality and
then test it. Any defects revealed by the testing process were then
fixed and retested. The rate of detection and fixing of outstanding
defects and the overall decline in the number of outstanding defects
with respect to time or testing effort indicates the level of reliability
and this has led to various software reliability growth models [1].
However, these depended on being able to hold the code steady for
a fixed period in order to observe the growing reliability. The
emergence of incremental development in its various forms such as
Agile and DevOps requires a different approach in determining the
readiness of the software for release [2]. This approach needs to
predict how reliable the software is likely to be based on continuous-
planning tests, not defect growth and decline. Continuous testing and
automation are a key aspect of rapidly evolving software which
results in continuous stabilization throughout the development
process. Yet, there has been little formalization of quality assurance
practices that support decision making for software developed using
the contemporary software practices. The ultimate goal of this
research project is therefore to establish an integrative reliability
assessment framework, driven by metrics and analytics-based
insight.
There is a positive correlation between coverage and failures
[3]. The more coverage, the greater the chances for a defect to be
detected. Yet, test coverage should not be the main indicator to test
effectiveness [4]. These and, possibly other factors can be used to
predict differing levels of test coverage for different parts of software
under test. Therefore, Test-Defect Coverage Analytics model
(TDCAM) is proposed to assist decision-making about quality of
software, in particular related to reliability assessment. TDCAM
integrates test coverage and defect coverage related metrics into a
visual form, enabling users to observe the information. Test coverage
measures the amount of testing performed by a set of tests (a test
suite). It includes gathering information about which parts of a
program are actually executed when running the test suite. It is used
to gauge the effectiveness and completeness of testing and indicates
reliability [1]. Currently, TDCAM focuses on code coverage, in
which it measures the degree of testing of the source code. An
example of the measure of control flow is branch coverage which is
the percentage of branches that have been exercised by a test suite.
The second data element of TDCAM is defect coverage. Defect
coverage is the fraction of defects detected by a test suite during
testing. In our study, the defect coverage provides defect related
metrics such as number, types and severity of defects.
A case study on Apache POI, an open source project, has been
conducted to validate the proposed model, visualized in a bubble
chart, as depicted in Figure 1. The x- and y-axes represent test
coverage (in branch unit) and defect coverage (defect numbers),
respectively. The bubble size represents severity of defects. Based
on this empirical study, the “xssf” component contains the most high
severity or critical defects compared to other components. Testing
team may strategize their testing effort to focus on any critical
functions and resolving the defects.
Our future work is to extend TDCAM to become a suite of test
analytics tool with support from artificial intelligence and
visualization techniques. A more focused test effort can be achieved
by using algorithms to automatically optimize test cases, for
instance, tests that cover a recurring issue making it ideal for
optimization. The new proposed framework will give a significant
impact on how software stakeholders can make an informed decision
about quality and deliver reliable software releases at higher
velocities which the modern society is increasingly relying upon [5].
Fig. 1. Test-defect coverage metrics mapped against severity of defects
References
[1]. Lyu, M. R., “Software Reliability Engineering: A Roadmap”. In 2007 Future of Software Engineering IEEE Computer Society. pp. 153-170,
2007.
[2]. Syed-Mohamad, S. M., Haron, N. H. & McBride, T., (2017), “Test Adequacy Assessment Using Test-Defect Coverage Analytic Model”.
Journal of Telecommunication, Electronic and Computer Engineering
(JTEC), Vol. 9, Issue 3-5, pp.191-196. [3]. Herzig, K. & Nagappan, A. N. (2014), “The impact of test ownership
and team structure on the reliability and effectiveness of quality test
runs”, Proceedings of the 8th ACM/IEEE International Symposium on Empirical Software Engineering and Measurement.
[4]. Inozemtseva, L. & Holmes, R. (2014), “Coverage Is Not Strongly Correlated with Test Suite Effectiveness”, ICSE ’14, ACM, pp. 435-
445.
[5]. Elberzhager, F., Arif, T., Naab, M., Süß, I., Koban, S. (2017), “From agile development to DevOps: going towards faster releases at high
quality – experiences from an industrial context. Springer. vol. 269,
pp. 33–44. Authors Biographies
SHARIFAH MASHITA SYED-MOHAMAD is a senior
lecturer at the School of Computer Sciences, USM. Her research interests include software analytics, software
reliability and testing, empirical software engineering,
agile development and software metrics and measurement.
MOHD HEIKAL HUSIN is a senior lecturer at the School
of Computer Sciences, USM. His research interests
include e-government technology, Web 2.0, social media adoptions, project development management and software
testing approaches.
WAN MOHD NAZMEE WAN ZAINON is a senior lecturer at the School of Computer Sciences, USM. His
research interests are at the intersection of Visual
Computing and software engineering with focus on
software reuse, requirement engineering practices, visual
data mining and multimedia information retrieval.

29
[BS02] Type-2 Fuzzy Systems and the Variations in the Uncertain Environments
Syibrah Naim
School of Computer Sciences, Universiti Sains Malaysia, Malaysia
Keywords: type-2 fuzzy sets, interval type-2 fuzzy sets, general type-2 fuzzy sets, intuitionistic fuzzy sets
Fuzzy system utilises set theory in a mathematical form to
represent vagueness of parameters by using fuzzy set representation.
In fuzzy system, the basic idea is that statements are not merely ‘true’
or ‘false’ since partial truth is also accepted by introducing a degree
of membership from 0 to 1 in a fuzzy set (Uzokaa et al., 2011). It is
much closer to human thinking and natural language by providing
an effective means of capturing the approximate, inexact nature of
the real world.
Type-2 Fuzzy Sets
Fuzzy sets have tremendously developed over the years. Firstly, in
1998, Karnik and Mendel proposed Type-2 Fuzzy Logic System
(T2FLS) based on Type-2 Fuzzy Sets (T2FS), which was proposed
by Zadeh (1975). Nowadays, the Interval Type-2 Sets (IT2FS) are
the common application of type-2 fuzzy sets. It has shown to be very
powerful in handling the uncertainties when compared to Type-1
Fuzzy Sets (T1FS, conventional fuzzy sets since 1975). Recently,
several researchers have started to explore the application of General
Type-2 Fuzzy Sets (GT2FS) and systems. Wagner and Hagras (2010)
first introduced GT2FS, which is one of the advanced extensions of
the type-2 fuzzy sets to capture high level of uncertainties.
In simple terms, general type-2 comprehends an nth number of
interval fuzzy set simultaneously rather than just an interval (interval
type-2) during fuzzification. The conventional type-1 fuzzy set
handles a single fuzzy value, whilst the interval type-2 fuzzy set
defines an interval type-2 fuzzy value to measure the uncertainties.
Apart from this, fuzzy sets have developed in many ways to interpret
uncertainties, such as intuitionistic fuzzy set, which takes both
membership and non-membership values of fuzziness. In 2014,
Naim and Hagras have proposed Intuitionistic Interval Type-2 Fuzzy
Sets.
Type-2 Fuzzy System
However, Mendel and John (2002) stated that the type-2 fuzzy sets
are more difficult to use and understand than the type-1 fuzzy sets;
hence, their use is not yet widespread. Researchers had difficulties
to make type-2 fuzzy sets easy to use and understand with the aim
that they would be widely used. This statement generalises the
interval type-2 fuzzy sets (IT2FS) and it was stated 5 years ago. It is
known now that the application of the general type-2 system
(GT2FS) are minimal since Wagner and Hagras proposed Zslices in
2010. In the literature, we found that when utilising the general type-
2 fuzzy sets, the complexity of the system increases in order to
evaluate the higher level of uncertainties. Several works on the
general type-2 applications have been done in clustering and
classifier problems (Golsefid and Zarandin (2016), Rakshit et al.
(2016)). The remaining works mainly published results on the FLS
(tuning general type-2 parameters) and the mathematical operators
(Zhai and Mendel (2011), Almaraashi et al. (2016)).
The Application of Type-2 Fuzzy System
Currently, my research interest is to adapt type-2 fuzzy theories
into any potential application in fuzzy environments. The focus of
my research plan is to learn the basic system, finding the problem
and simultaneously applying the system to generate the optimised
output. Several fuzzy type-2 applications such as in the intelligent
environments (intelligent lighting for reading) and social surveys
(postgraduate surveys) have been done. Moreover, secondary
datasets and expert opinions from clinicians have been acquired to
diagnose new baby born condition (collaboration with Prof Jonathan
Garibaldi, University of Nottingham) to study the level of
uncertainties in type-1 and type-2 fuzzy theories. The results show
that by increasing number of experts/decision makers (also
increasing the data volume), general type-2 fuzzy system
outperformed interval type-2, intuitionistic interval type-2, and type-
1.
Different real-world applications using higher-ordered fuzzy
system such as science maritime, ambient intelligent in smart home
laboratory for elderly and higher voltage insulator have been
investigated. Collaborations have been established in different
application areas such as to predict index deprivation in household,
predict performance and health index from the students’ database,
and currently learning fuzzy rule-based from the sensor signal to
recognise human activity.
The aim is to expand the potential of implementing type-2 fuzzy
sets in big data analytics in many important application areas. The
result is expected to improve the conventional system and decision-
making techniques to provide a system that able to mimic groups of
human decision.
Uzokaa F E, Obotb O, K Barkerc, Osujid J (2011) An
experimental comparison of fuzzy logic and analytic hierarchy
process for medical decision support systems. Computer
Methods and Programs in Biomedicine 103:10-27.
Naim N, Hagras H (2014) A type 2-hesitation fuzzy logic based
multi-criteria group decision-making system for intelligent
shared environments. Journal of Soft Computing 18(7): 1305–
1319.
Zadeh L A (1975) The concepts of a linguistic variable and its
application to approximate reasoning part I. Information
Sciences 8:199–249.
Wagner C, Hagras H (2010) Toward general type-2 fuzzy logic
systems based on zSlices. IEEE Transactions on Fuzzy Systems
18(4):637-660.
Mendel J M, John R I B (2002) Type-2 fuzzy sets made simple.
IEEE Transactions on Fuzzy System 10(2):117-127.
Golsefid S M M, Zarandin M H F (2016) Multi-central general
type-2 fuzzy clustering approach for pattern recognitions.
Information Sciences 328:172-188.
Rakshit P. Saha S, Konar A (2016) A type-2 fuzzy classifier for
gesture induced pathological disorder recognition. Fuzzy Sets
and Systems 305:95-130.
Zhai D, Mendel J (2011) Uncertainty measures for general Type-
2 fuzzy sets. Information Sciences 181(3):503-518.
Almaraashi M, John R, Hopgood A, Ahmadi S (2016) Learning
of interval and general type-2 fuzzy logic systems using
simulated annealing: Theory and practice. Information Science
360:21-42.
Syibrah Naim is a senior lecturer at School of Computer
Science, Universiti Sains Malaysia since 2016. Syibrah completed her Ph.D. at University of Essex, her master
and undergraduate studies at Universiti Malaysia
Terengganu. Her research interests are type-2 fuzzy sets, fuzzy logic, fuzzy decision-making, and
optimisation. She has higher interest to adapt higher-
ordered fuzzy theories into any potential application in fuzzy environments.

30
[BS03] Data Mining System to Detect Finger Motion in Offline Handwriting Forgery
W. P. Loh1*, C. S. Cheng2
1: School of Mechanical Engineering, Engineering Campus, Universiti Sains Malaysia, 14300 Nibong Tebal, Penang, Malaysia.
2: Faculty of Information Sciences and Engineering, Management and Science University, University Drive, Seksyen 13, 40100 Shah Alam,
Selangor, Malaysia.
* Correspondent author: [email protected]
Keywords: Data Mining, Finger Motion, Offline Handwriting, Classification, Forgery
Abstract
Introduction: Every individual has their own unique handwriting
characters which may differ by line quality, spacing (line or spaces
between character and word), height, width and size of letters, pen
lifts and separations, connection strokes, beginning and ending
strokes, unusual letter formation, shading (pen pressure), slant,
baseline habits, flourishment, and embellishments and diacritic
placement.
Problem Statement: It is difficult to judge the genuine or
fraudulent nature of handwritten documents on the visual inspection
basis. In the pasts, the offline handwriting classification was
determined solely based on the handwriting pattern recognition [1]-
[4]. The offline handwriting forgery issues are still unsolvable as the
counterfeiters’ tricky attempts on offline handwriting forgery are not
properly understood. In particular, there was no work that predicts
handwriting patterns from the finger motions.
Objectives: Therefore, this study aims to integrate finger motion
captures into offline handwriting data pattern detection with specific
goals (i) to recognize finger motion features to classify similar
handwriting patterns, (ii) to develop a data mining system that
detects offline handwriting patterns characterized by finger motion
(iii) to analyze and compare the differences between genuine and
forged offline handwritings.
Method: A total of 30 subjects was tasked to write the phrase
"Sphinx of black quartz, judge my vow" using their dominant hands
with a provided Pilot G2 05 gel ink rollerball pen for two repetitions;
under 60 fps video capture using 16 MP sports camera. The
handwritings were executed on a desk at 0.74 m height (elbow
height) with a sheet of survey form on it.
Data analysis was conducted at two-phase data mining analyses:
data pre-processing (video-image-numeric transformation, numeric
data screening) and handwriting feature classification using the J48
algorithm on 10-fold cross-validation mode aided by the WEKA
tool. The initial phase analysis translated the raw data into 15
attributes: writing time, three-finger (thumb, middle, index)
coordinates, pen-grip angles, and phrase length in two replicates; and
phrase inclination, demographic data (gender, handedness). The
second phase analysis grouped data by similar handwriting patterns
(phrase length, inclination angle) with the rule-reasoning
relationship application. The Neuroph OCR (Optical Character
Recognition) system in Java language was developed to recognize
handwriting characteristics (phrase length and inclination angle) on
different class patterns. The capability of the developed system will
be tested on Aspects of Consistency Level (ACL).
Results: Findings show consistent classification accuracies on the
handwriting inclination angle using Tree classifier algorithms. The
classification accuracy that was trained on the J48 algorithm could
achieve 98% with the thumb angle being the most discriminant
feature. A system which includes the finger motion features (three-
finger coordinates) data to identify offline handwriting patterns is to
be developed.
Conclusion: This paper reports an ongoing sustainable research
in developing a data mining system to detect finger motion for
distinguishing the offline handwriting patterns. The experiment data
collection with its analyses was completed at the data mining level.
The findings from the data classification level were obtained and
significant finger motion attribute was identified. A system was
developed from Neuroph OCR (Optical Character Recognition) to
recognize handwritten letters and characters. Further efforts were
required to compare between the genuine and forged online
handwritings and to integrate finger motion data into the system.
This study contributes to the advancement of data analytics via an
automated process for forensic handwriting examination in the
cyber-security industry. Future extended works may involve the
Division of Commercial Crime Investigation Department, Royal
Malaysia Police and potential software development company to
support the system implementation and testing.
References [1] Zamora-Martínez F, Frinken V, España-Boquera S, Castro-
Bleda MJ, Fischer A, and Bunke H (2014) Neural network
language models for off-line handwriting recognition. Pattern
Recognition 47(4):1642–1652.
[2] Jayech K, Mahjoub MA, and Ben Amara NE (2016)
Synchronous multi-stream Hidden Markov Model for offline
Arabic handwriting recognition without explicit segmentation.
Neurocomputing 214:958–971. [3] Kamble PM and Hegadi RS (2015) Handwritten Marathi
character recognition using R-HOG feature. Procedia Comput.
Sci. 45:266–274.
[4] Sueiras J, Ruiz V, Sanchez A, and Velez JF (2018) Offline
continous handwriting recognition using sequence to sequence
neural networks. Neurocomputing 289:119–128.
Authors Biographies
Loh Wei Ping received her Ph.D in Applied Mathematics,
from the School of Mathematical Sciences of Universiti
Sains Malaysia in 2009. She currently works as a senior lecturer in School of Mechanical Engineering, Universiti
Sains Malaysia. She serves as a member of the Society
for Industrial & Applied Mathematics (SIAM) and American Mathematical Society (AMS). Her main
research and
interests nclude data mining, mathematical modelling applied biomechanics. She won the “Best Paper Award” in the International
Conference on Computer Science and Information Technology (ICCSIT
2018) in a joint research paper. To date, she has published over 50 journals, conference proceedings and textbooks in these areas.
Cheng Chun Seong received his B.Sc Hons. Degree in
Computer Forensic, from Faculty of Information Sciences and Engineering of Management and Science
University, Malaysia in 2018. He received the Best
Project Award for his excellent achievement in the Final Year Project (2018). In 2016, he received his Diploma
in Computer Forensic and an Academic Award during
the 19th Convocation Ceremony 2016. He currently works as a Software Engineer (Java) in SecureMetric Technology Sdn. Bhd.
He will be pursuing his MSc. in Computer Science soon in 2018.

31
Big Data Summit 2: HPC & AI Empowering Data Analytics (co-locate with PRAGMA 35 Meeting), Penang, Malaysia, Oct 3 - 6, 2018
[BS04]Strategic Cyber Threat Intelligence Using External Unstructured Data
Mohamad Nizam Kassim1,*, Kew Yoke Ling2
1: Cyber Security Responsive Services Division, CyberSecurity Malaysia
2: KewMann Sdn Bhd
* Correspondent author: [email protected]
Keywords: Cyber Threat Intelligence, Cybersecurity, Robotic Process Automation, Natural Language Processing, Unstructured Data
Purpose
Cyber threats are continuously evolving, and represent potential
threats to national security. With the increasing number and variety
of cyber threats, cyber security analysts face multiple challenges in
obtaining the required data and performing the necessary analysis to
detect, monitor and respond to such threats in a timely manner. The
goal of this project was to automatically acquire, process and analyze
cybersecurity news from external online sources, enabling cyber
security analysts to perform data exploration and discovery through
a series of dashboards, resulting in actionable insights and enhancing
their ability to formulate the right strategies to respond to possible
cyber threats.
The project was a research and development collaboration
between CyberSecurity Malaysia (project owner and subject matter
expert), KewMann (consultant and solution developer) and UTM
Skudai (through Cyber Threat Intelligence Lab, Faculty of
Computing). The scope of the project consisted of Threat Actors
Landscape, Global Cyber Attack Landscape, Terrorism Events in
South East Asia and South China Sea Conflict News Landscape.
Method
Multiple software robots were designed and configured to acquire
unstructured data from specified cybersecurity online news websites
and news aggregators through Robotic Process Automation (RPA).
The collected data then underwent text pre-processing in preparation
for further text analysis, which involved extensive use of Natural
Language Processing (NLP) techniques (Schatz, Bashroush, & Wall,
2017). Text preprocessing was first conducted to clean and structure
the collected texts, which included tokenization, stemming, text
duplication removal and filtering of irrelevant content. Term
frequency–inverse document frequency (TFIDF) (Ramos, 2013)
was then applied to extract relevant keywords, while customized
Name Entity Recognition (NER) was used to obtain security-related
information such as dates, persons (i.e. threat actors), methods (i.e.
cyber-attacks), organizations (i.e. industry verticals) and locations.
Text analytic techniques enabled cyber threats profiles to be
visualized based on best practices set out by Tufte, Goeler, & Benson
(1990), leading to strategic insights on cyber-attacks and threat
actors against specific industry verticals. This allowed important
questions to be addressed accurately and in a timely manner:
What are the main cyber threats against each industry vertical?
What are the impacts of specified cyber threats to target victims?
What are the cyber threats trends for specified time periods?
Do threat actors change their tactics?
How do these cyber threats impact our national cyber security?
Results
The cyber threat landscape Overview consists of a composite
visualization of the number of occurrences of cyber security news in
the last 30 days by category (Threat Actors, Cyber Attack Methods,
Terrorism Events, and South China Sea Conflict News). Data from
each category was then visualized based on time series or geo-
location, allowing cyber security analysts to discover any trends or
patterns within the collected data. Full-text search and filtering
capabilities were implemented so that cyber security analysts could
easily locate data points of interest and perform data drill-down
where required. As a result, the analysts were able to visually analyze
the data, detect specific events, and monitor entities of interest
(people, groups, companies, industries, methods and locations). For
future works, deep learning techniques will be employed,
particularly Recurrent Neural Networks (RNN), to extract
knowledge and hidden patterns once a sufficiently large volume of
security-related news has been collected,
Conclusion
This project demonstrated that automatic processes can be applied
to data acquisition and analysis, greatly reducing the time and effort
between obtaining the raw data and useful end-user interactions,
allowing actionable insights to be derived in a timely manner.
References
Journal article: Ramos, J. (2003, December). Using tf-idf to
determine word relevance in document queries. In Proceedings
of the first instructional conference on machine learning (Vol.
242, pp. 133-142).
Journal article: Schatz, D., Bashroush, R., & Wall, J. (2017).
Towards a more representative definition of cyber security.
Journal of Digital Forensics, Security and Law, 12(2), 8.
Book: Tufte, E. R., Goeler, N. H., & Benson, R.
(1990). Envisioning information (Vol. 126). Cheshire, CT:
Graphics press.
Authors Biographies
Mohamad Nizam Kassim works as Specialist at Cyber
Security Responsive Services Division, CyberSecurity Malaysia. He has a degree in Power Electrical Engineering
from University of Wollongong (Australia) and Master of
Computer Science from Universiti Teknologi Malaysia (Malaysia). Currently, he is pursuing his postgraduate studies in machine
learning and natural language processing. His current research analytic
projects at CyberSecurity Malaysia are developing predictive algorithm to detect scams and frauds websites and developing analytics platform for cyber
threat intelligence profiling.
Kew Yoke Ling is the founder and executive director of KewMann, a regional big data and behavioral science
company. KewMann helps organizations predict and
influence human behaviors through cutting-edge big data technologies, and provides consulting services to government
agencies, financial services, telco and other large organizations. Yoke Ling
has a Degree (Hons) in Computing from Staffordshire University, UK and
Postgraduate Diploma of Chartered Institute of Marketing (CIM), UK.
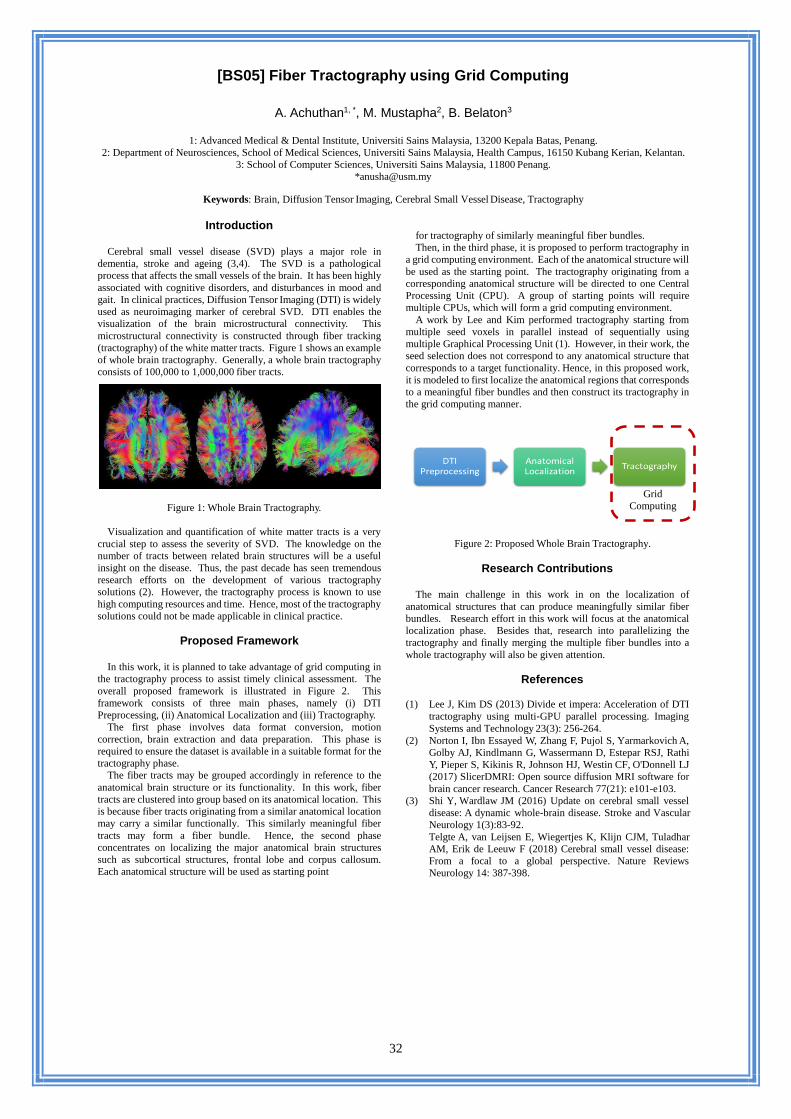
32
[BS05] Fiber Tractography using Grid Computing
A. Achuthan1, *, M. Mustapha2, B. Belaton3
1: Advanced Medical & Dental Institute, Universiti Sains Malaysia, 13200 Kepala Batas, Penang.
2: Department of Neurosciences, School of Medical Sciences, Universiti Sains Malaysia, Health Campus, 16150 Kubang Kerian, Kelantan.
3: School of Computer Sciences, Universiti Sains Malaysia, 11800 Penang.
Keywords: Brain, Diffusion Tensor Imaging, Cerebral Small Vessel Disease, Tractography
Introduction
Cerebral small vessel disease (SVD) plays a major role in
dementia, stroke and ageing (3,4). The SVD is a pathological
process that affects the small vessels of the brain. It has been highly
associated with cognitive disorders, and disturbances in mood and
gait. In clinical practices, Diffusion Tensor Imaging (DTI) is widely
used as neuroimaging marker of cerebral SVD. DTI enables the
visualization of the brain microstructural connectivity. This
microstructural connectivity is constructed through fiber tracking
(tractography) of the white matter tracts. Figure 1 shows an example
of whole brain tractography. Generally, a whole brain tractography
consists of 100,000 to 1,000,000 fiber tracts.
Figure 1: Whole Brain Tractography.
Visualization and quantification of white matter tracts is a very
crucial step to assess the severity of SVD. The knowledge on the
number of tracts between related brain structures will be a useful
insight on the disease. Thus, the past decade has seen tremendous
research efforts on the development of various tractography
solutions (2). However, the tractography process is known to use
high computing resources and time. Hence, most of the tractography
solutions could not be made applicable in clinical practice.
Proposed Framework
In this work, it is planned to take advantage of grid computing in
the tractography process to assist timely clinical assessment. The
overall proposed framework is illustrated in Figure 2. This
framework consists of three main phases, namely (i) DTI
Preprocessing, (ii) Anatomical Localization and (iii) Tractography.
The first phase involves data format conversion, motion
correction, brain extraction and data preparation. This phase is
required to ensure the dataset is available in a suitable format for the
tractography phase.
The fiber tracts may be grouped accordingly in reference to the
anatomical brain structure or its functionality. In this work, fiber
tracts are clustered into group based on its anatomical location. This
is because fiber tracts originating from a similar anatomical location
may carry a similar functionally. This similarly meaningful fiber
tracts may form a fiber bundle. Hence, the second phase
concentrates on localizing the major anatomical brain structures
such as subcortical structures, frontal lobe and corpus callosum.
Each anatomical structure will be used as starting point
for tractography of similarly meaningful fiber bundles.
Then, in the third phase, it is proposed to perform tractography in
a grid computing environment. Each of the anatomical structure will
be used as the starting point. The tractography originating from a
corresponding anatomical structure will be directed to one Central
Processing Unit (CPU). A group of starting points will require
multiple CPUs, which will form a grid computing environment.
A work by Lee and Kim performed tractography starting from
multiple seed voxels in parallel instead of sequentially using
multiple Graphical Processing Unit (1). However, in their work, the
seed selection does not correspond to any anatomical structure that
corresponds to a target functionality. Hence, in this proposed work,
it is modeled to first localize the anatomical regions that corresponds
to a meaningful fiber bundles and then construct its tractography in
the grid computing manner.
Figure 2: Proposed Whole Brain Tractography.
Research Contributions
The main challenge in this work in on the localization of
anatomical structures that can produce meaningfully similar fiber
bundles. Research effort in this work will focus at the anatomical
localization phase. Besides that, research into parallelizing the
tractography and finally merging the multiple fiber bundles into a
whole tractography will also be given attention.
References
(1) Lee J, Kim DS (2013) Divide et impera: Acceleration of DTI
tractography using multi‐GPU parallel processing. Imaging
Systems and Technology 23(3): 256-264.
(2) Norton I, Ibn Essayed W, Zhang F, Pujol S, Yarmarkovich A,
Golby AJ, Kindlmann G, Wassermann D, Estepar RSJ, Rathi
Y, Pieper S, Kikinis R, Johnson HJ, Westin CF, O'Donnell LJ
(2017) SlicerDMRI: Open source diffusion MRI software for
brain cancer research. Cancer Research 77(21): e101-e103.
(3) Shi Y, Wardlaw JM (2016) Update on cerebral small vessel
disease: A dynamic whole-brain disease. Stroke and Vascular
Neurology 1(3):83-92.
Telgte A, van Leijsen E, Wiegertjes K, Klijn CJM, Tuladhar
AM, Erik de Leeuw F (2018) Cerebral small vessel disease:
From a focal to a global perspective. Nature Reviews
Neurology 14: 387-398.
Grid
Computing
Framework

33
[BS06] Can I Trust You? Towards Modelling Trust at Zero Acquaintance
Deborah Y. H. Ooi1, Zaher Bamasud, Syaheerah L. Lutfi*
Dept. of Computer Science, Universiti Sains Malaysia, Malaysia
Corresponding author: [email protected]
Keywords: Facial expression, Gesture, Trust modelling, Zero Acquaintance, Voice
Introduction
Much research has already been carried out in this field of
affective computing. Research trying to identify emotions from face,
gesture and voice are abounding in number, each with their own
specific outcomes. However, there is one area that has yet to be
looked into. Trust. Can you trust me? Will you trust what I am going
to present? Will you trust that I will deliver? How did I make you
trust me? These are the questions we are seeking to answer through
our work thus far. Why is this important, you may ask?
Commercial dealings would never happen as neither party would
trust the other enough to deliver what they have promised. E-
commerce would never grow. Relationships would not last long and
more often than not end up in arguments or conflict. Even in a
classroom setting, students would have a hard time believing the
things taught by the teacher if they lack trust in the teacher.
Similarly, teachers would have a hard time teaching the students if
they don’t trust that the students would readily absorb all that has
been given. This situation is especially prevalent in online tutoring,
where there is a lack of personal connection between teacher and
student. If technology was able to accurately measure how
“trustworthy” the teacher is, the teachers could then take steps to
improve themselves in that area. For example, the teachers could
speak with more authority, or lower their voices to a more gentle
tone. Maybe smile more, or smile less. Such feedback would prove
invaluable to improve the teaching and learning process.
In recent years, several researches have been conducted on the
factors that determine trustworthiness. Particularly, many studies
have shown the significance and importance of voice in perceived
trustworthiness. For instance, from a medical perspective, a research
has found that audio communication shows a more significant
emergence of trust as compared to text chat. Yet another
investigation has studied facial features and identified that men with
greater facial width were more likely to exploit the trust of others
and that people were more likely to trust male counterparts with
narrow rather than wide faces. This study attempts to model trust
using machine learning methods towards achieving a larger effort in
building synthetic agents that that can gauge trust, especially when
in a learning domain.
As of this moment, this gargantuan task is still in its early stages.
We have identified the modality (cues) that would used to mine
features of trust - face, voice and gesture. Cues through expressions
conveyed via these sources would be analysed and quantified into a
machine readable form, using image and voice processing
technologies. A model would be constructed using a machine
learning methods.
Method
To carry out this investigation, a total of 120 different video
samples have been obtained from the OMG-Emotion behaviour
dataset (Barros et al., 2018). Each of these video samples will be
cropped to form a 10 second long video clip. To investigate the effect
of facial features and gestures on trustworthiness, each video clip
will be muted and subjected to analysis by using a video data
analysis software.
Each participant in this study will be asked to rate the
trustworthiness of 5 different video clips. The participant will submit
their ratings via a simple online assessment indicating the amount of
trust they would place in the speaker. Two different sets of
participants will rate how much they trust the speaker -- the first set
is based on face and gesture of the speaker in the videos that are
muted, and the second only based on vocal cues in a set of voice
clips extracted from the above mentioned videos.
The characteristics of each video clip will also be analysed, along
with the ratings from the participants. This will be analysed by using
a correlation matrix to determine the features that have a significant
impact on perceived trustworthiness.
Expected Results
The potential outcomes of this investigation are plentiful. In
addition to precisely measuring the sole impact of facial features and
gestures, as well as pitch or speech rate on perceived trustworthiness,
this investigation would also be able to identify the effects of the
semantic content by analysing the difference in trustworthiness
rating from one original audio clip and another. The outcomes are
truly endless and at the very least, a relationship is hoped to be
identified between facial features, gestures and voice characteristics
and perceived trustworthiness.
References
Barros, P., Churamani, N., Lakomkin, E. et al (2018). The omg-
emotion behaviour dataset. doi: arXiv preprint arXiv:1803.05434
Smith, B. L., Brown, B. L., Strong, W. J. et al (1975). Effects of
speech rate on personality perception. Language and Speech, 18 (2),
145-152. doi: 10.1177/002383097501800203
Trouvain, J., Schmidt, S., Schröder, M., Schmitz, M., & Barry, W.
J. (2006). Modelling personality features by changing prosody in
synthetic speech. doi:10.22028/D291-25920

34
Big Data Summit 2: HPC & AI Empowering Data Analytics (co-locate with PRAGMA 35 Meeting), Penang, Malaysia, Oct 3 - 6, 2018
[BS07] Data Science Analytics for Manufacturing and Supply Chain
Umi Kalsom Yusof1,* and Mohd Nor Akmal Khalid1
1: School of Computer Sciences, University Science Malaysia, Pulau Pinang, Malaysia
* Correspondent author: [email protected]
Keywords: Data analytics, industry 4.0, manufacturing, supply chain, big data, internet of things, artificial intelligence, cyber physical
system.
Background and Motivation
The paradigm of research had moved from empirical, theoretical,
simulation and to currently exploration of data or data-driven (Hey
et al., 2009). The cycle of a research is supported by its data, from
data capture and data curation to data analysis and data visualization.
However, good tools for both data curation and data analysis are still
lacking.
Since the advent of “big data”, lots of research efforts have
devoted themselves to this new research topic, and most of them
focus on social or commercial mining (Lee et al., 2014). However,
those researches mostly focus on ‘human-generated data’ instead of
‘machine-generated data’, which include machine controllers,
sensors, and manufacturing systems. The latter leads to the emergent
of industrial big data that leads to predictive analytics in
manufacturing, in realizing the demand of Industry 4.0.
In addition, under the Industry 4.0 concept, astounding growth in
the adoption of information technology and social media networks
has increasingly influenced consumers’ perception on product
innovation, quality, variety and speed of delivery (Zhong et al.,
2017) in supply chain. As such, data analytics provide an opportunity
to the supply chain management through service innovation that
transparent throughout the product lifecycle; enabling to adapt to the
market requirements that are highly customizable and very tractable
demands.
Data Science and Analytics in Manufacturing and Supply Chain
A unified information grid based on the recent developments of
the Internet of things (IoT) framework and the emergence of sensing
technology have created a tightly connected systems and humans,
which further populates the big data environment of the industry. In
today’s competitive business environment, big data, cloud
computing and advance analytics are the necessary framework to
systematically process data for intelligent decision-making (Lee et
al., 2014).
Cyber Physical System (CPS) and service innovations are two
inevitable trends for manufacturing industries. On one hand, CPS are
automated systems that enable communication of the operations of
the physical reality using computing infrastructures, utilizing
networked devices (Jazdi 2014). On the other, service innovations
that laid the foundation for Product Service System (PSS), in the
form of software and embedded intelligence, are integrated into the
industrial products and systems (Lee et al., 2014).
CPS goes with the trend of having information and services
everywhere at hand encompassing the communication activities and
infrastructures such as Internet of things (IoT), Internet of Services
(IoS) and Internet of People (IoP) (Hermann et al., 2016).
Manufacturing systems are able to monitor physical processes,
create a “digital twin” (or “cyber twin”) of the physical world, and
make smart decisions through real-time communication and
cooperation with humans, machines, sensors, and so forth (Zhong et
al., 2017). This enables all physical processes and information flows
to be available across holistic manufacturing supply chains, small
and medium-sized enterprises, and large companies.
PSS involves electronics and tether-free intelligence that
intertwine predictive technologies with intelligent algorithms to
predict, manage and optimize autonomously product performance
and product services. This enable the product to be uniquely
identified for its entire life cycle as an active entity where self-aware
and self-maintenance can be performed; thus, encourage
transparency among manufacturers, supply chains, and customers
(Lee et al., 2014). This fundamentally changes how the
manufacturing operates, from reactive to proactive operations and
ultimately predictive operating models.
Achieving these feats require certain underpinning technologies to
allow problems to be solved and adaptive decisions to be made with
minimum human involvement. Artificial intelligence (AI) allows
such features by learning and reasoning that ultimately realize a
connected, intelligent, and ubiquitous industrial practice (Zhong et
al., 2017). In tandem with the industry 4.0 framework, AI-enabled
technologies with advanced data analytical capabilities, would
realize a prognostic-monitoring system that can derive competitive
advantage in design, monitoring, control, planning and execution
level of both the manufacturing and supply chain.
Opportunities and Outlooks
With big data environment and emergent of industry 4.0, the
prognostic-monitoring system is the major prospect for the
realization of an industry-wide revolution. It would involve
advanced analytical tools and AI-enabled technologies that
“proactively” materialize data-driven modeling, big data analytics,
data-enabled prediction, smart design and prototyping, real-time
information sharing and monitoring, and collaborative decision
making (Zhong et al., 2017).
Data-driven modelling and data-enabled prediction would drive
the quality, efficiency and agility of the manufacturing through
knowledge and insights gained from the data deluge. Real-time
information sharing and collaborative decision making would
augment the cognitive ability of humans while complement
limitations of the machine. Smart design and prototyping would
enable the creation of more industry-wide value added processes and
services (Lee et al., 2014; Zhong et al., 2017).
Nevertheless, materializing the intelligent factory of the future,
through the prognostic-monitoring system with respect to industrial
settings, remain a huge challenge which requires a collaborative
effort by scientist, researcher, and practitioner.
References
Hey, T., Tansley, S. and Tolle, K. M. The fourth paradigm: data-
intensive scientific discovery. Vol. 1. Redmond, WA: Microsoft
research, 2009.
Hermann, M., Pentek, T. and Otto, B. “Design principles for
industrie 4.0 scenarios.” In System Sciences (HICSS), 2016 49th
Hawaii International Conference on, pp. 3928-3937. IEEE, 2016.
Lee, J., Kao, H. A. and Yang, S. “Service innovation and smart
analytics for industry 4.0 and big data environment.” Procedia Cirp
16 (2014): 3-8.
Tjahjono, B., Esplugues, C., Ares, E. and Pelaez, G. “What does
industry 4.0 mean to supply chain?” Procedia Manufacturing 13
(2017): 1175-1182.
Zhong, R. Y., Xu, X., Klotz, E. and Newman, S. T. “Intelligent
manufacturing in the context of industry 4.0: a review.” Engineering
3, no. 5 (2017): 616-630.

35
Big Data Summit 2: HPC & AI Empowering Data Analytics (co-locate with PRAGMA 35 Meeting), Penang, Malaysia, Oct 3 - 6, 2018
[BS08] Interfacing Chatbot with Data Retrieval and Analytics Queries for Decision
Making
Gan Keng Hoon 1,*, Loo Ji Yong1
1: School of Computer Sciences, Universiti Sains Malaysia, Malaysia
* Correspondent author: [email protected]
Keywords: Chatbot, Information Extraction, Unstructured Texts, Natural Language Parsing, Structured Retrieval
Motivation
Conventional data analytics process uses dashboard with tables,
charts, summaries, search tool in projecting its analysis outcome to
its user with the goal of enabling discovery of useful information,
suggesting conclusions etc. to support decision-making [1][3]. Such
decision-making mechanisms can be improved further by using
natural language interface in the dashboard components, e.g. using
natural language keywords to search the sales performance of a
product. Motivated by the needs to enable a user friendlier
interaction with analytics outcome, this project proposes a natural
language chatbot who can assist in the role of decision making by
delivering information of dashboard components with human like
conversational pattern.
From User Intent to Data Retrieval and Analytics
The process of data analytics started from data cleansing,
transforming, modeling data and finally delivering the processed
data to the user. The data to be accessed is communicated using
dashboard via visual and information lookup tools. The needs of
better mechanism to communicate analytics data with user [2] can
be seen from the rapid development of many commercialized
business intelligence or analytics dashboard (e.g. Sisense, Kautilya
BI, Wizdee Natural Language BI, Pentaho etc.) on the market.
From data retrieval to analytics, current interaction between
users and the system can be improvised with the usage of human like
conversational chat agent. To connect the two ends between user
input and business data, the intent posed by the user must be able to
be interpreted to a corresponding business logic. The business logic
decides how data will be accessed and manipulated before it is sent
back as response to user.
Chatbot Scenario
A scenario of chatbot usage in data retrieval and analytics is
shown in Figure 1. A question, i.e. "what is the sales increment for
second quarter compare to first" was posed by the user to check the
sales of his company. Although the information needs are clearly
stated using standard question-type language, its corresponding
business logic is complex. The intent of finding out about
“increment” requires data retrieval process to obtain the sales
amount of two quarters, followed by an increment function to
perform calculation on the difference between the quarters.
An example translated intent, i.e. from natural language intent to its
corresponding actionable statements for data interfaces (e.g. SQL,
SOLR query) and functional interfaces (e.g. APIs calls) are as
follows.
Data interface
SELECT ‘period’, SUM(‘sales_amount’) FROM SALES WHERE
‘period’ = “1Q” or ‘period’ = “2Q” GROUP by ‘period’;
Functional interface
function difference_values(pre_value, post_value) return ar-
ray(status_increase_decrease, diff_percentage, diff_value)
From the above example, although the desired result is to have
the chatbot to inform the user that sales has increased; there could be
other variant of outcomes that partially satisfy the information needs,
e.g. display both sales of Q1 and Q2 (see example response in Figure
1), letting user to figure out the increment.
Figure 1: Example of chatbot conversation in data retrieval and
analytics scene.
Project Prospect
In conclusion, the uniqueness of the work lies in connecting natural
language with data accessing interface for analytics and decision
making. This project covers several areas of research and
development such as data storage and retrieval, domain analytics
specification, natural language conversational modelling and query
transformation. Prospective collaborators include dashboard
solution providers, HPC centers and relevant interested parties.
References
[1] H. Chen, R.H.L. Chiang, V.C. Storey, Business intelligence and
analytics: From big data to big impact, MIS Quarterly, 36 (4) (2012),
pp. 1165-1188.
[2] Ron Kohavi, Neal J. Rothleder, and Evangelos Simoudis. 2002. Emerging
trends in business analytics. Commun. ACM 45, 8 (August 2002), 45-48.
[3] Ee-Peng Lim, Hsinchun Chen, and Guoqing Chen. 2013. Business
Intelligence and Analytics: Research Directions. ACM Trans. Manage.
Inf. Syst. 3, 4, Article 17 (January 2013).
Business Logic Flow "what is the sales increment for second quarter compare to first" // generate a corresponding JSON object with the following contents intent: comparison (from keyword "compare") target entity: sales constraint entity: period, amount comparing_object entity: 1Q, 2Q // from the object, SQL processing engine will generate a query as following SELECT 'period', SUM('sales_amount') FROM SALES WHERE 'period' = "1Q" or 'period' = "2Q" GROUP by 'period'

36
BDS2 POSTER ABSTRACTS

37
[BP01] Towards Large-scale Text Annotation for Sentiment Analysis using Semi-supervised Deep Learning
Vivian Lay Shan Lee1,*, Keng Hoon Gan1
1: Sch. of Computer Sciences, Universiti Sains Malaysia, Malaysia
* Correspondent author: [email protected]
Keywords: Data annotation, Sentiment classification, Semi-supervised learning, Deep learning
Background
Sentiment classification is a task of classifying an opinion text as
expressing a positive or negative sentiment. In general, methods
used in sentiment classification can be divided into two groups,
lexicon-based methods and machine learning-based methods. In
both methods, fully annotated corpora are required in evaluation
stage and model training stage respectively. Along with the success
of deep learning application in many other domains, researchers in
sentiment classification also following in their footsteps (Nogueira
et al. 2014; Kim 2014). However, it takes tremendous amount of
time, cost and effort to build high quality fully annotated corpora.
Semi-supervised learning is proposed by the researchers with the
aim to minimize time and cost in creating a fully annotated corpus.
Semi-supervised learning is a method that make use of a
combination of labelled data and unlabelled data. In recent past year
studies, researchers made efforts in exploring semi-supervised deep
learning models in performing sentiment classification and they
offer good results (Dai and Le 2015; Guan et al. 2016).
Motivation
In this internet era, massive amount of user generated data makes
unlabeled data inexpensive and easy to acquire. To avoid the time
consuming and expensive process of labelling massive amount of
data without compromising model performances, semi-supervised
learning appears as the most promising method to use. While many
studies promote an optimistic view that unlabeled data is useful in
improving model performances in semi-supervised learning (Nigam
et al. 2000; Dai and Le 2015), yet there are also publications reported
that adding unlabeled data reducing accuracy of the model (Zhang et
al. 2015; Iosifidis and Ntoutsi 2017; Levatić et al. 2017). Therefore,
researchers are motivated to add in only the informative unlabeled
instances that have positive impacts on the model performances.
Also, model trained in semi-supervised methods tends to produce
unbalanced output without any constraints on data proportion
(Iosifidis and Ntoutsi 2017; Levatić et al. 2017). In extreme cases,
the classifier will classify all the unlabeled data into one of the
classes which is undesirable.
In this work, we will focus on the document level sentiment
classification. Compared to aspect level or sentence level sentiment
classification, document level classification is more difficult as it is
highly subjective and often contain variables of opinions. Hence,
rule-based method has difficulties in capturing the variations of how
opinions are presented in reviews (Guan et al. 2016). With the
accessibility of large amount of data, deep learning serves as an
encouraging solution with its ability in modelling the classifier.
Whereas in semi-supervised deep learning, it is essential to select the
unlabeled data subset with care and to apply appropriate constraints
on data class proportions with the intentions of producing a good
accuracy learner. To this end, we proposed to address following three
problems: (1) demand of extensive labelling in supervised deep
learning sentiment classification (2) unravel characteristics of
unlabeled data that have positive impacts in classifier performances
(3) tendency of bias propagation in semi-supervised methods.
Method
To address the first problem, two popular semi-supervised
methods self-learning and co-learning will be explored and
compared. For deep learning models, we proposed to use
sophisticated types of recurrent neural network (RNN) based models
which free from exploding gradient problem in modelling
representations for sentiment classification. The idea to use RNN
models is because it can learn long-term knowledge, the knowledge
that does not change much overtime, and does not suffer high model
complexity as RNN shares same parameters across whole learning
process (Lai et al. 2015; Chen et al. 2016).
As for the second problem, we will find out the text features that
are significant to classify an opinionated text. Our hypothesis is that
by labelling the text that are sentiment relevance, we can improve
the accuracy of classification. Subjective statements refer to internal
state of a person which cannot be directly observed. In contrast,
objective statements expressed factual information. But a subjective
statement does not always contain opinion and an objective
statement might express an opinion.
Lastly, for the third problem, we will review on previous works in
balancing class proportion of unlabeled data to reduce bias
propagation of model. There are three groups of approaches in
tackling the issue: data level approaches, algorithmic level
approaches and cost-sensitive approaches. Methods under these
three categories will be explored and analyzed.
References Chen, Sun, Tu, et al (2016) Neural Sentiment Classification with
User and Product Attention. In: Proc 2016 Conf Empir
Methods Nat Lang Process.
Dai, Le (2015) Semi-supervised sequence learning. In: NIPS’15
Proc 28th Int Conf Neural Inf Process Syst.
Guan, Chen, Zhao, et al (2016) Weakly-Supervised deep learning for
customer review sentiment classification. In: IJCAI’16 Proc
25th Int Jt Conf Artif Intell.
Iosifidis, Ntoutsi (2017) Large scale sentiment learning with limited
labels. In: Proc 23rd ACM SIGKDD Int Conf Knowl Discov
Data Min - KDD ’17.
Kim (2014) Convolutional neural networks for sentence
classification. In: Proc Annu Meet Assoc Comput Linguist
(ACL, 2014).
Lai, Xu, Liu, Jun (2015) Recurrent convolutional neural networks
for text classificaton. In: AAAI’15 Proc 29th AAAI Conf Artif
Intell.
Levatić, Ceci, Kocev, Džeroski (2017) Semi-supervised
classification trees. J Intell Inf Syst 49:461–486.
Nigam, Mccallum, Thrun, Mitchell (2000) Text Classification from
Labeled and Unlabeled Documents using EM. Mach Learn
39:103–134.
Nogueira, Santos, Gatti (2014) Deep convolutional neural networks
for sentiment analysis of short texts. In: Proc COLING 2014,
25th Int Conf Comput Linguist.
Zhang, Tang, Yoshida (2015) TESC: An approach to TExt
classification using semi-supervised clustering. Knowledge-
Based Syst 75:152–160.

38
[BP02] Big-spatial Data Pre-processing Framework towards Flood Assessment
Z. Dahalin1,*, A. Ta’a2, A. Ndanusa3
1,2,3: Faculty of Information Technology Universiti Utara Malaysia,
* Correspondent author: [email protected]
Keywords: Flood causative factors, Flood vulnerability, GIS
Introduction
Floods are the most common natural hazards in the world, leading
to severe havocs on both lives and properties. Assessing flood
vulnerability and its related risks has long been identified as an
important approach for the formulation of policies as well as
strategies aimed at mitigating the impacts resulting from any
potential flooding events. Therefore, in this research, a framework
that integrates multiple, heterogenous and voluminous spatial data
sets was developed to obtain the required insights or knowledge that
can efficiently aid in flood vulnerability assessment for proper
mitigating measures.
Significance
Currently, some studies propose the use of structural means, such
as dams and dikes as employed in Malaysia, Netherlands, Ngeria as
well as the Sponge City in China (Sang & Yang, 2017),(Abdul Mohit
& Mohamed Sellu, 2017),(Baghel, 2014),(Olukanni, Adejumo, &
Salami, 2016), for flood mitigation, however, these measures have
overly not been efficient due to the current climate change. While
some have adopted topographical spatial data set for flood
vulnerability assessment, as in the case of Nigeria (Ikusemoran,
Kolawole, & Martins, 2014). Nonetheless, mitigating these risks are
neither uniquely the product of structural systems, nor are they
efficiently assessed by concentrating homogenous non-structural
factors alone without considering the multiple flood causative
factors (FCFs) to derive a holistic insight on geomorphological
features of the Earth. This is because, the use of homogenous and
scanty features is constrained in revealing other FCFs, such as
topography, hydrology and vegetation of the study area. Therefore,
to address these limitations, a framework based on heterogenous
FCFs is developed to have a holistic insight on the geomorphological
contents of the study area.
Method
In addressing the aforementioned limitations, Figure 1 below
gives an illustrative approach.
Figure 1: Big-SPAPFA Flowchart
As illustrated by this procedural flowchart in Figure 1, the
derivation of the framework is from the formulation of big spatial
data, which were pre-processed from various sources and of varied
forms. Precisely, the map representing the study area was clipped
from LandSat-8, SRTM and TRMM. After this initial stage, the
output was corrected geometrically and radiometrically to have
corresponding outputs depicting the hydrological, topographical and
vegetal contents of the study area. The accuracy of the final output
was assessed using flood inventory and other GIS means.
Results
From the approaches employed in the preceding section, flood
vulnerability maps and their corresponding regional severity was
classified based on the pre-processed multiple FCFs, which
eventually produced the Big-SPAPFA framework as illustrated in
Figure 2.
Figure 2: Big-SPAPFA Framework
From the above Figure, various FCFs were used to map out regional
flood vulnerability and the corresponding levels of severity.
Conclusion
Flood risk assessment and mapping approach which classifies
floodplains, are required in flood mitigation and proper decision-
making. Thus, Big-SPAPFA framework was developed using
multiple flood causative factors. Ultimately, the accuracy and the
reliability of the framework was ensured using a decadal flood
inventory.
References
Abdul Mohit, M., & Mohamed Sellu, G. (2017). Development of
Non-structural Flood Mitigation Policies and Measures for
Pekan town, Malaysia. Asian Journal of Behavioural Studies,
2(6), 9.
Baghel, R. (2014). River Control in India: Spatial, Governmental
and Subjective Dimensions. Springer International
Publishing.
Ikusemoran, M., Kolawole, M. S., & Martins, A. K. (2014). Terrain
Analysis for Flood Disaster Vulnerability Assessment : A
Case Study of Niger State , Nigeria. American Journal of
Georaphic Information System, 3(3), 122–134.
Olukanni, D. O., Adejumo, A., & Salami, W. (2016). Assessment of
jebba hydropower dam operation for improved energy
production and flood management. ARPN Journal of
Engineering and Applied Sciences, 11(13), 8450–8467.
Sang, Y. F., & Yang, M. (2017). Urban waterlogs control in China:
more effective strategies and actions are needed. Natural
Hazards, 85(2), 1291–1294.

39
[BP03] Data Analytics of Malaysia’s Most Influential Entities in Social Media for Commercial Purpose
T.H. Lee1, Y.M. Yacob1
1: School of Computer and Communication Engineering, Universiti Malaysia Perlis, Malaysia
* Correspondent author: [email protected]
Keywords: data analytics, prediction, social media, key-influencer
Abstract
The social media agents such as Facebook and Twitter are
powerful tools to capture pools of interest, sentiment and preference
of the social media users. Thus, the agents are extremely useful for
commercial purpose. Analyses of influential people were conducted
in Sina Weibo [1], the most popular social media platform in China
and, Facebook [2]. Meanwhile, [3] performed predictions of Sina
Weibo users. [4] determined influential actors in Twitter. However,
to date, no work was conducted to determine key-influencer for
Malaysian scope. This work is to determine Malaysia’s most
influential entities in social media for commercial-related purpose.
The entities in this study include people and business organizations.
This study is significant because it can benefit marketer as the
influential entities become the market-movers that may affect the
fans’ buying decision making. The key-influencers can bring much
more impact on the products that they promote due to their higher
popularity. Thus, a lot of profit will be earned by company as the
more the followers get to see the products, the more the business
opportunities.
This work analyzed Malaysians 10 most influential entities as
business and marketing key-influencer. On top of that, analysis and
predictions of number of followers gained for a specified period of
time for the influential entities were determined. Two sets of 10,000
data were collected within a duration of one month; April 2018 and,
covered social media users in Malaysia. The data sets were acquired
from Followerwonk and Twitter API which were obtained via a
subscription of US$29 per month.
In order to determine Malaysia’s 10 most influential entities, the
Twitter data were imported to R Studio and edited from comma
characters. Then, bar chart was plotted and listed 10 entities with
the highest number of followers in ascending order. In order to
determine number of followers gained in a month, 2 data sets were
imported and cleaned from comma characters. Ten entities with the
highest number of followers were selected from each data set and
then merged. Bar chart was plotted based on the number of
differences of number of followers of the two merged data sets.
In order to predict number of followers gained, 100 tweets for each
most influential entity was imported via Twitter API. Average
number of retweets of each entity was calculated and the results were
combined in a data frame. Then, the data frame was merged with the
data set. Later, suitable attributes were determined via correlation
plot and employed to be executed in linear regression function. If the
result is satisfactory, then the output is considered as a good
prediction.
As shown in Figure 1(a), Dato’ Seri Najib Tun Razak has the
highest number of followers followed by Khairy Jamaluddin. Air
Asia as business organization was ranked second of the entities with
3,191,072 followers in April 2018. The former prime minister also
topped in the number of followers gained in April 2018. Air Asia and
Khairy Jamaluddin came in second and third, respectively in the
mentioned category in Figure 1(b).
Astro AWANI is predicted to have the highest number of followers
gain with 1,468,834 new followers. The prediction results are based
on the targeted average number of retweets. In summary, data
analytics is a powerful analysis tool to aid the market brand
compared to local brand traditional marketing way.
(a)
(b)
Figure 1 Bar chart of (a) Malaysians top 10 influential entities, (b)
number of follower gained in each influencer in April 2018
Table 1 Prediction of number of followers gained in April 2018
[1] Liao Q, Wang W, Han Y, and Zhang Q (2013) Analyzing the
Influential People in Sina Weibo Dataset. GLOBECOM - IEEE
Global Telecommunication Conference, pp 3066–3071.
[2] Kao LJ, Huang YP and Sandnes FE (2016) Mining Time-
Dependent Influential Users in Facebook Fans Group. IEEE Int.
Conf. Syst. Man, Cybernetics, pp. 718–723.
[3] Zhou J, Wu G, Tu M, Wang B, Zhang V, and Yan Y (2017)
Predicting User Influence Under the Environment of Big Data.
IEEE 2nd Intl. Conf. Cloud Comp. on Big Data Analysis, pp
133–138.
[4] Qasem Z, Jansen M, Hecking T, and Hoppe HU (2015) On the
Detection of Influential Actors in Social Media. 11th Int. Conf.
Signal-Image Technol. Internet-Based Syst. (SITIS 2015), pp
421–427.

40
Big Data Summit 2: HPC & AI Empowering Data Analytics (co-locate with PRAGMA 35 Meeting), Penang, Malaysia, Oct 3 - 6, 2018
[BP04] Low Resolution to High Resolution Video Surveillance Image Enhancement Using Deep Learning
Muhamad Faris1,*, Shahrel Azmin Suandi1
1: Intelligent Biometric Group,
School of Electrical and Electronics Engineering, Universiti Sains Malaysia,
Engineering Campus, Nibong Tebal 14300, Malaysia
* Correspondent author: [email protected]
Keywords: Deep Learning, Convolutional Neural Network, Image Enhancement
Abstract
Surveillance cameras are widely used in this age to help
improving the security and surveillance. The abundant of
surveillance cameras and its placement cause variation in image
quality captured by the camera because not all surveillance cameras
have the same quality. These factors would affect the overall image
quality capture by the surveillance camera. The low-quality
surveillance camera usually has low-resolution image and this would
cause problem for face recognition. The low-resolution (LR) image
usually is pixelated and the person face is hard to be identified. Face
recognition requires a good-quality image to extract all the features
but with low-resolution image, there is fewer information that can
be extracted. Therefore, image enhancement that able to improve the
quality of LR image could improve the overall surveillance cameras
system.
The propose method to enhance the LR image is by employing
deep convolutional neural network (CNN). Based on research by
Kim et al. (2015), the LR image can be enhanced by utilizing the
end-to-end relationship of CNN and reconstruct the image using
Super Resolution approach. In this research, SCface database is used
as training sample because it contains a good-quality image
(mugshot) and low-resolution image (camera variation) (Grgic et al.,
2011). Low-resolution to High-resolution (LR-to-HR) Network is
trained using mugshot image as a good-quality image reference for
the network. The depth of network influences the performance. The
mugshot image is trained using 25 convolutional layer between each
layer contain rectified linear unit as activation function as shown in
Figure 1. The 25 layers show the most optimum choice considering
training time and its performance.
Figure 1: The architecture of LR-to-HR Network.
The trained LR-to-HR Network reconstructed the surveillance
image based on the learned parameter in the last residual layer. The
reconstruct image can be defined as:
𝐼 𝐻𝑅 = F(I𝐿𝑅) (1)
where I𝐿𝑅 is the LR image and 𝐼 𝐻𝑅 is the reconstructed high-
resolution image based on the last residual layer F. F is the last layer
in the architecture in this case, F is the 25th convolution layer. The
aim of LR-to-HR Network is to reconstruct I𝐿𝑅 as similar as 𝐼 𝐻𝑅
based on the residual layer that are trained with mugshot image. The
network is trained using base learning rate of 0.1 and gradually
decreases by factor of 10 overtime. To avoid exploding gradient
dynamic gradient clipping is introduced using −𝜃
𝛼,𝜃
𝛼 , where α is the
current learning rate and θ is the gradient. As the learning rate
decrease, the gradient clipping also changes. This make gradient
clipping more dynamic and prevent the exploding gradient.
LR-to-HR Network is tested using surveillance image and the
enhanced image is analyzed using Peak-Signal to Noise Ratio
(PSNR) and Structural Similarity Index (SSIM). PSNR and SSIM
are method to assess image quality. PSNR quantifies the noise in the
image based on the pixel difference between two images (Hore and
Ziou, 2010). SSIM evaluates the image quality based on three visual
impacts; luminance, contrast, and structure (Wang et al., 2004). The
results of LR-to-HR Network are shown in Table 1, 2, and 3. Table 1 : Comparison between original images with mugshot images.
PSNR(dB)/SSIM
Distance 1 Distance 2 Distance 3
Cam 1 10.140/0.246 10.432/0.3036 10.661/0.3137
Cam 2 10.173/0.2517 10.204/0.3025 10.217/0.3223
Cam 3 10.584/0.2599 10.517/0.3038 10.297/0.3288
Cam 4 9.552/0.2356 9.433/0.2915 9.288/0.3097
Cam 5 8.630/0.2346 8.617/0.2740 8.555/0.2550
Cam 6 9.185/0.2947 9.979/0.3122 9.866/0.3412
Table 2: Comparison between enhanced images with mugshot images.
PSNR(dB)/SSIM
Distance 1 Distance 2 Distance 3
Cam 1 10.810/0.2635 10.686/0.3251 10.813/0.3418
Cam 2 10.403/0.2678 10.401/0.3214 10.366/0.3504
Cam 3 10.782/0.2738 10.679/0.3238 10.428/0.3577
Cam 4 9.796/0.2631 9.601/0.3204 9.412/0.3467
Cam 5 9.048/0.2511 8.975/0.2971 8.860/0.2953
Cam 6 9.856/0.3220 10.856/0.3560 10.264/0.3600
Table 3: Difference between enhanced image and original images.
PSNR(dB)/SSIM
Distance 1 Distance 2 Distance 3
Cam 1 0.67/0.018 0.254/0.022 0.152/0.0281
Cam 2 0.23/0.016 0.197/0.019 0.149/0.0281
Cam 3 0.198/0.014 0.162/0.020 0.131/0.029
Cam 4 0.244/0.028 0.168/0.0289 0.124/0.037
Cam 5 0.418/0.017 0.358/0.023 0.305/0.04
Cam 6 0.671/0.027 0.877/0.044 0.398/0.019
The results show there is improvement after the image is enhanced
using LR-to-HR Network based on PSNR and SSIM values. The
higher PSNR value and the closer SSIM value to 1 meaning that the
better the image quality.
The proposed LR-to-HR Network shows that it capable to enhance
the low resolution image by utilizing deep learning to learn required
parameters to reconstruct the image based on the good-quality
image. The pixelated image is smoothen out using this approach, and
this would help in analyzing the image further.
Reference Grgic, M., Delac, K., and Grgic, S. (2011) SCface – Surveillance
camera face database. Multimedia Tools and Applications,
51(3):863-879.
Hore, A. and Ziou, D. (2010). Image quality metrics: PSNR vs.
SSIM. In 2010 20th International Conference on Pattern
Recognition, pages 2366-2369.
Kim, J., Lee, J. K., and Lee, K. M. (2015). Accurate Image Super
Resolution Using Very Deep Convolutional Network. IEEE
Transactions on Pattern Analysis and Machine Intelligence,
(32(2):295-307.
Wang, Z., Bovik, A. C., Sheikh, H. R., and Simoncelli, E. P
(2004). Image quality assessment: from error visibility to
structural similarity. IEEE Transactions on Image Processing,
13(4):600-612.

41
Big Data Summit 2: HPC & AI Empowering Data Analytics (co-locate with PRAGMA 35 Meeting), Penang, Malaysia, Oct 3 - 6, 2018
[BP05] Classification of Manufacturing High Dimensional Data Using Deep Learning-based Approach
Umi Kalsom Yusof1,* and Mohd Nor Akmal Khalid1
1: School of Computer Sciences, Universiti Sains Malaysia, Pulau Pinang, Malaysia
* Correspondent author: [email protected]
Keywords: Industry 4.0, big data analytics, high dimensional data, classification, machine learning and deep learning-based.
Background and Motivation
In recent years, manufacturing equipment are equipped with
sensors to facilitate real-time monitoring of the production process
(Tello et al., 2018). This provides an opportunity to perform quality
control by predicting which manufactured products are at risk of
being defective. Traditionally, defect was recognized by human
experts inspecting each wafer. However, the size of electronic chips
has decreased over time and is currently ≈65 nm, while wafers are
becoming larger. A typical wafer may carry 1500–3000 chips,
making expert evaluation impractical (Kim et al., 2016).
Recent adoption of information technologies in the manufacturing
sector have prompted the emergence of the “smart factory” that
employs an advanced information technologies such as the Internet
of Things (IoT), the cloud, big data analytics and cyber-physical
systems. The concept of a smart factory was introduced in the
Hannover Fair 2011 with the vision of Industry 4.0. The concept
affects most manufacturing activities such as demand forecasting,
production planning and control, scheduling, inventory and logistics
management (Kim et al., 2016).
A predictive analytics system that identifies defects in products
before they are finalized, or even shipped, can result in significant
savings for the manufacturer (Maurya, 2016). However, predicting
defect in manufactured products is a challenging machine learning
task due to the rarity of such failures in modern manufacturing
processes. As such, the product defects can be predicted by
classifying such rarity as data points with binary classes.
Classification is an important task of knowledge discovery in
databases and data mining. Classification modelling is to learn a
function from training data while makes as few errors as possible
when being applied to data previously unseen (Sun et al., 2007).
With the emergence of “big data”, many classification algorithms in
manufacturing are facing challenges, even though they used to be
successful in different fields. High-dimensional data have been
ubiquitous in various fields, such as biomedicine, cancer diagnosis
using DNA data, and image classification (Yin and Gai, 2015).
Classification of High Dimensional Data
Classifying high dimensional data poses a challenge for
classification due to the following two factors (Erfani et al., 2016):
(i) Exponential search space – The number of potential feature
subspaces grows exponentially with increasing input dimensionality.
(ii) Irrelevant features – A high proportion of irrelevant features
effectively creates noise in the input data, which mask the true class
of the data. The challenge is to choose a subspace of the data that
highlights the relevant attributes or features known as “curse of
dimensionality” (Yin and Gai, 2015).
As was reported by Kim et al. (2016), most of the features of high-
dimensional data are irrelevant to the target feature and the
proportion of relevant features. Finding relevant features simplifies
learning process and increases classification accuracy. Classification
performance could severely degenerate if the learning methods
directly implemented on high-dimensional or small sample data sets.
Alternatively, a deep learning model is one of the methods that can
circumvent the challenges of feature extraction and has achieved a
commanding lead on the state-of-the-art for solving high
dimensional data. In recent years, interest in deep learning models
have triggered due to several factors: (i) the availability of much
larger training sets with labeled examples; (ii) powerful GPU
implementations, making the training of very large models practical
and (iii) better model regularization strategies (Xie et al., 2017).
These factors enabled the training of truly deep learning models. In
addition, deep learning models can learn to recognize high-level
features by themselves.
Deep Learning and Future Outlooks
The layers of deep learning networks have escalated from several
to hundreds in just few years when applied to large amount of data
with more abstract and expressive representations (Xie et al., 2017).
However, simply stacking more layers onto current architectures is
not a reasonable solution, which incurs vanishing gradients by the
time it reaches the end of the network.
Looking from another perspective, the classification problem is
actually a dynamic process where the context is important although
the input may be static (Kim et al., 2016). To utilize this information,
a top-down (or feedback) connections that propagate the input
downwards can be found in deep belief networks (DBNs). Deep
belief networks (DBNs) are multi-layer generative models that learn
one layer of features at a time from unlabeled data (Erfani et al.,
2016). DBNs perform non-linear dimensionality reduction on very
large data sets and learn high-dimensional manifolds from the data.
As such, a novel classification model based on a prominent deep
learning and DBNs model which addresses high-dimensional data
would potentially provide high predictive accuracy with practical
computational efficiency.
References Erfani, S. M., Rajasegarar, S., Karunasekera, S., and Leckie, C.
(2016). High-dimensional and large-scale anomaly detection using a
linear one-class svm with deep learning. Pattern Recognition 58,
121–134.
Kim, H., Choi, B. S., and Huh, M. Y. (2016). Booster in high
dimensional data classification. IEEE Transactions on Knowledge
and Data Engineering 28(1), 29–40.
Maurya, A. (2016). Bayesian optimization for predicting rare
internal failures in manufacturing processes. In 2016 IEEE
International Conference on Big Data (Big Data), pp. 2036–2045.
IEEE.
Sun, Y., Kamel, M. S., Wong, A. K., and Wang, Y. (2007). Cost-
sensitive boosting for classification of imbalanced data. Pattern
Recognition 40(12), 3358–3378.
Tello, G., Al-Jarrah, O. Y., Yoo, P. D., Al-Hammadi, Y., Muhaidat,
S. and Lee, U. (2018). Deep structured machine learning model for
the recognition of mixed-defect patterns in semiconductor
fabrication processes. IEEE Transactions on Semiconductor
Manufacturing 31(2), 315–322.
Yin, H. and K. Gai (2015). An empirical study on preprocessing
high-dimensional class imbalanced data for classification. In High
Performance Computing and Communications (HPCC), pp. 1314–
1319. IEEE.
Xie, D., Xiong, J. and Pu, S. (2017). All you need is beyond a good
init: exploring better solution for training extremely deep
convolutional neural networks with orthonormality and modulation.
In Proceedings of the IEEE Conference on Computer Vision and
Pattern Recognition, pp. 6176—6185.

42
Big Data Summit 2: HPC & AI Empowering Data Analytics (co-locate with PRAGMA 35 Meeting), Penang, Malaysia, Oct 3 - 6, 2018
[BP06] Copy-Move Forgery Detection Using Convolutional Neural Networks
A. Z Abidin, A. A Samah*, H. A Majid, S. Safie, M. F Misman
School of Computing, Faculty of Engineering, Universiti Teknologi Malaysia
* Correspondent author: [email protected]
Keywords: copy-move, video forgery, deep-learning, video tampering, video forensic, convolutional neural networks
Video is widely used as supporting evidences and historical records
in various field as an entertainment industry, video surveillance,
medical imaging, military, legal evidence, political videos, video
tutorials, advertisements, etc. (Gavade & Chougule, 2015; Pandey,
Singh, & Shukla, 2016). Unfortunately, the growth of user friendly
and easy-to-use multimedia editing tools, the editing or tampering
video sequence has become easier and faster without leaving any
noticeable traces of the tampering operations. The result of the
tampering has become a serious social security event (Rocha, 2011).
Therefore, effective detection of video tampering is of great
importance for digital video forensics which is the main focus of this
study. Copy-move video forgery is classified under spatial
tampering attack which is a typical video tampering that needs to be
done on all related frames to tamper some regions due to the
correlation between frames (Chen et al., 2012). Although many
forgery detection techniques have been proposed till date, there is
still less study focusing on video copy-move forgery detection. The
difficulty on tampering detection is due to the original and tampered
region might be having the same artifacts or the forged area undergo
geometric transformations and retouching (Sitara & Mehtre, 2016).
Deep learning (DL) is a particular kind of machine learning that
accomplish significant ability and flexibility by learning using the
concept of nested hierarchy, with each concept defined in relation to
simpler concepts. In this study, we investigate and develop the deep
learning method used on features extraction which helps to reduce
the computational time. DL provides a novel approach to the
identification of features for the forged regions, which inherently
represent characteristics of the forged regions appearing in the
dataset. Thus, this method greatly saves time and energy to find new
features from a set of videos. Although some DL methods have been
implemented in video forgery detection, only a few have been
studied for video copy-move forgery. The successful of DL in
producing the excellent prediction results depend on the right
architecture because of every architecture has their strengths and
limitations. DL architecture is including the development of pre-
training layers and training layers, back propagation for parameters
optimization and regularization. The goal of DL architecture is to
find the optimal parameters in each layer. Therefore, by choosing
right architecture with the right type of data can boost the result
analysis. Hence in this on-going study, a method in Deep Learning,
ConvNet are proposed to detect video copy-move forgery. ConvNet
is one of the deep learning method which capable to extract features
instead of using the handcrafted feature. The network will extract the
most suitable feature and output in the form of feature map. The
performances of the proposed method will be measured using
classification accuracy, specificity and sensitivity. The measured
performance will be compared with previous method on video copy-
move forgery by using SULFA dataset. Recently, video forensics in
particular video forgery detection has emerged as an indispensable
research field. Our ongoing study has identified that video forensics
still presents many unexplored research issues, due to many factors
such as peculiarities of video signals with respect to images and the
wider range of possible alterations that can be applied on this type
of digital content. Thus the research field offers a lot of additional
research work and potential future works that can be done in
collaboration with other researchers. We welcome partnership
opportunities from other research institutes, industry and
government.
Chen, R., Dong, Q., Ren, H. and Fu, J. (2012). Video forgery
detection based on non subsampled contourlet transform and
gradient information. Information Technology Journal.
11(10):1456-1462.
Gavade, J. D. and Chougule, S. R. (2015). Review of techniques
of digital video forgery detection. Advances in Computer Science
and Information Technology (ACSIT). 2(3): 233-236.
Pandey, R. C., Singh, S. K. and Shukla, K. K. (2016). Passive
forensics in image and video using noise features: A review.
Digital Investigation. 19:1-28.
Rocha, A., Scheirer, W., Boult, T., et al.: Vision of the Unseen:
Current Trends and Challenges in Digital Image and Video
Forensics. ACM Computing Surveys 43(5), article number:26
(2011).
K. Sitara, B.M. Mehtre, Digital video tampering detection: An
overview of passive techniques, Digital Investigation, Volume 18,
2016, Pages 8-22, ISSN 1742-2876.
Authors Biographies
A. Z Abidin is currently a MSc full time research student
at School of Computing, UTM Skudai. Her research area is on Video Forgery Detection using Convolutional Neural
Network (CNN).
A.A Samah is a senior lecturer at School of Computing,
Her research interest includes Simulation Modelling, Image Processing and Business Intelligence.
H.A Majid is a lecturer at School of Computing. His research area is on Optimization, Image Processing, and
Business Intelligence.
S. Safie is currently a PhD student at School of
Computing, UTM Skudai. Her research area is on Video Forgery Detection using Optical Flow Method.
M.F Misman is currently a PhD student at School of Computing, UTM. His works is on Video Forgery
Detection using Convolutional Neural Network (CNN)
and Long Short Term Memory (LSTM).

43
[BP07] COGNITIVE-BASED APPROACH FOR BUSINESS INTELLIGENCE
Herison Surbakti1,2, Azman Ta’a2
1: Fakultas Sains dan Teknologi, Program Studi Sistem Informasi, Universitas Respati Yogyakarta, Indonesia.
2: School of Computing, College of Arts and Sciences, Universiti Utara Malaysia, 06010 UUM Sintok, Malaysia.
E-mail: [email protected], [email protected]
Keywords: Business Intelligence, Cognitive-based Approach, Data Analytics, Tacit Knowledge, Unstructured Data
Purpose of study
Business intelligence (BI) plays key role to empowering the
data and knowledge within the organization and uses extract,
transform, and load (ETL) functions to capture, transform, and
integrate the structured and unstructured data into a structured data
warehouse (DW). Noticeably, the tacit knowledge in a higher
institution, especially in libraries department contains huge of
information and knowledge arises from the librarian inspiration and
experiences during exploring solutions to the various problems
(Sihui and Xueguo, 2016). This situation has resulted multiple data
sources in the institutions often contradict each other, and cause poor
outcome in data analysis. Therefore, this study introduced an
enhanced BI framework with cognitive-based approach to
systematically manage this problem.
Significance of study
Cognitive-based approach is a technique that ideally suited for
the capturing tacit knowledge from among the massive data available
these days. Moreover, the current BI system not be able to capture
the data from the human skills and experiences due to the limitation
of its framework (Bakar and Ta’a, 2014). Therefore, the BI
framework produced from this study will helps developers to manage
tacit knowledge in data analytics efficiently.
Research method
This research has investigated the limitations of BI framework
in capturing various data types to identify the problem in handling
the tacit knowledge for data analysis. The proposed model for
managing tacit knowledge was adapted from Knowledge
Information Data (KID) and cognitive approach model that proposed
by Sato and Huang (2015). The approaches are able to develop a new
data centric model that works with traditional structured data as well
as unstructured data including video, image, and digital signal
processing. The design will be used as the method to develop the
cognitive-approach for capturing tacit knowledge and combines with
the cognitive analytics to make the tacit knowledge as codified data
source in a BI system.
The Business Intelligence Framework
Tacit knowledge can enrich the data analysis process. The form
of tacit knowledge need to be converted as the codify data according
to the ability of BI framework in processing the available data. The
use of cognitive as an advanced approach to capture and extract tacit
knowledge by elaborating the methods of predictive analytics,
stochastic analytics, and cognitive computing in BI system. Thus, the
new BI framework can be illustrated as shown in Figure 1.
Furthermore, to convert the tacit knowledge to be a codify data or
explicit knowledge, the cognitive approach will be needed such as
cognitive mapping and cognitive analytics process. The converted
tacit knowledge will be stored in the repository as the available data
to re-use by instantiation, interpretation, and assimilation cycle
process as shown in Figure 2.
Figure 1. BI Framework Using Cognitive Approach
The proposed model of BI framework has been developed by
adapting KID model for data cycle and cognitive analytics to capture
and extract tacit knowledge as shown in Figure 2.
Figure 2. The KID model used in BI Framework
Conclusion
Cognitive system is the process of replicating the human
thought processes in a computerized system or a model. Thus, the
new approach for data analytics can be achieved by having the tacit
knowledge to be analyzed in BI system. This research will assess the
technique in capturing tacit knowledge, such as cognitive mapping
technique, convert the captured tacit knowledge into unstructured
data using cognitive analytics method, and absorb the incoming data
as well as update knowledge as it happens by human tasks using the
KID method. Thus, the captured tacit knowledge as mostly presented
in unstructured data can be used in BI system for data analysis
successfully.
References Bakar, M. S. A. & Ta’a, A. (2014). Business Intelligence Modelling
for Graduate Enterpreneur Programme. Journal of Information and
Communication Technology (JICT), 13(1), 55–86. Sato, A. & Huang, R. (2015). From Data to Knowledge: A Cognitive
Approach to Retail Business Intelligence. 210-217.
doi:10.1109/dsdis.2015.106.

44
Big Data Summit 2: HPC & AI Empowering Data Analytics (co-locate with PRAGMA 35 Meeting), Penang, Malaysia, Oct 3 - 6, 2018
[BP08] iFR: A New Framework for Real Time Face Recognition with Machine Learning
Syazwan Syafiqah Sukri1,*, Nur Intan Raihana Ruhaiyem1
1: School of Computer Sciences, Universiti Sains Malaysia, Malaysia
Keywords: Face Recognition, Machine Learning, Tensorflow, Deep learning, Eye blink detection
Abstract
Face authentication has a significant usage in various
applications. The trend of using face identification technology to
unlock screen in smartphones shows a good acceptances of face
authentication as a viable security measure. Other than security
purposes, face authentication can be used for taking the attendance.
Although we have fingerprint option to take the attendance, there are
some flaws that we can highlight such as fingerprint can be
contaminated and hygienic issue could arise as fingerprint is a
contact-based authentication.
This research is carried out to study about deep learning
and Tensorflow framework which are implemented in developing a
real time face recognition. As deep learning is using gradient-based
optimization, Tensorflow is especially suitable for it [1]. Apart from
that, we also want to eliminate spoofing by using eye blink detection.
We use eye blink detection to differentiate between real face and
photo attack. In average, a normal person will blink 15-20 times per
minute which is a person blinks in every four seconds. Besides, we
intent to develop a system without human intervention as machine
learning is capable to learn things and make decision by itself with
the given data.
This system starts with face detection, eye blink
detection and face recognition. In face detection phase, we are using
pre-built classifier which is Haar cascade classifier from OpenCV in
Python language to detect a face. We use two classifiers which are
haarcascade_eye.xml and haarcascade_frontalface_alt.xml. The
accuracy of face detected will be handled by scaleFactor parameter.
The lower the scaleFactor, the face detection will be less accurate
and vice versa. A bounding box will be drawn around the face(s)
detected.
Next is eye blink detection. In this phase, we make use
of OpenCV and dlib in Python language. Eye blink detection process
starts with facial landmark detection to localize the eyes in given
frame from video stream (webcam). Then, eye aspect ratio (EAR)
for each eye is computed. It gives us a singular value, relating the
distance between the vertical eye landmark points to the distances
between the horizontal eye landmark points. To determine a person
is blinking or not, threshold is set where EAR will remain
approximately constant when the eyes are open and will rapidly
approach zero during a blink, then increase again when the eyes are
open. The system will terminate if the face is detected but eye blink
is not detected. For early stage, we set a time constraint for the
system to detect eye blink of the face detected. If the time constraint
is exceeded, then the system will not proceed to recognition phase.
The process is followed by recognition phase. This is
where deep leaning in Tensorflow framework is applied. We use a
pre-trained model, FaceNet [2] to build the face recognition network
in this system. In FaceNet model, the triplet loss is calculated for
training. Triplet loss is about minimizing the distance between an
anchor and a positive which both have the same identity and
maximizing the distance between an anchor a negative which both
have different identity. For our training data, we use CASIA Face
Image Database Version 5.0 which has 2500 color facial images of
500 subjects. This dataset has typical variations which include
illuminations, poses, expressions, eye-glasses and imaging distance.
Apart from that, we also use Labeled Faces in Wild (LFW) as our
benchmarks in recognizing face [3]. During the training process, the
faces are aligned using Multi-task Convolutional Neural Networks
(MTCNN) [4] to identify detect and align the faces by making eyes
and bottom lip appear in the same location on each image.
Deep learning is the leading subset of artificial
intelligence currently been discussed among researches and
developers. Thus, this system is developed to take the advantage of
latest technology to improve the previous system [5]. In this research
study, we are mainly focusing on developing a system that is not
hardware-dependent and that is why we emphasize on implementing
deep learning and eye blink detection in this system. As our future
work, we will focus on twin problem which is one of the challenging
problems in face recognition.
References
1. Pattanayak, S. (2017). Introduction to Deep-Learning Concepts
and TensorFlow. Pro Deep Learning with TensorFlow, 89-152.
doi:10.1007/978-1-4842-3096-1_2
2. Schroff, F., Kalenichenko, D., & Philbin, J. (2015). FaceNet: A
unified embedding for face recognition and clustering. 2015
IEEE Conference on Computer Vision and Pattern Recognition
(CVPR). doi:10.1109/cvpr.2015.7298682
3. G. B. Huang, M. Ramesh, T. Berg, and E. Learned-Miller.
Labeled faces in the wild: A database for studying face
recognition in unconstrained environments. Technical report,
Technical Report 07-49, University of Massachusetts, Amherst,
2007.
4. Liu, X., Fang, Z., Liu, X., Zhang, X., Gu, J., & Xu, Q. (2017).
Driver Fatigue Detection Using Multitask Cascaded
Convolutional Networks. IFIP Advances in Information and
Communication Technology Intelligence Science I, 143-152.
doi:10.1007/978-3-319-68121-4_15
5. Sukri, S. S., Ruhaiyem, N. I., & Mohamed, A. S. (2017). Face
Recognition with Real Time Eye Lid Movement Detection.
Advances in Visual Informatics Lecture Notes in Computer

45
Big Data Summit 2: HPC & AI Empowering Data Analytics (co-locate with PRAGMA 35 Meeting), Penang, Malaysia, Oct 3 - 6, 2018
[BP09] Automatic Liver Tumor Detection using Deep Learning: Triplanar Convolutional Neural Network Approach
S. H. Chung1, 4*, K. H. Gan1, A. Anusha2, R. Mandava3,
1: School of Computer Sciences, Universiti Sains Malaysia, Malaysia
2: Advanced Medical and Dental Institute, Universiti Sains Malaysia, Malaysia
3: Faculty of Computing Engineering and Technology, Asia Pacific University, Malaysia
4: Centre for Research and Development in Learning, Nanyang Technological University, Singapore
* Correspondent author: [email protected]
Keywords: Deep Learning, Triplanar Convolutional Neural Network, Liver Tumor Detection
Introduction
Convolutional Neural Networks (LeCun et al., 1990) have
recently demonstrated successes in computer vision tasks such as
classification, segmentation and object recognition (LeCun et al.,
2015), (Greenspan et al., 2016). This study proposed Triplanar
Convolutional Neural Network (ConvNet) for automatic liver tumor
detection in Computed Tomography (CT) images. The Triplanar
ConvNet incorporates three different views of liver tumor, namely
axial, sagittal and coronal planes extracted based on center voxel of
interests (VOI) to classify liver tumor and healthy liver in the Liver
CT dataset obtained from MICCAI 2008 Liver Tumor Grand
Challenge (4 training, 6 test images) and MICCAI 2017 Liver Tumor
Segmentation Challenge (LiTS) (131 training, 70 test images) in
512x512 image resolution. Liver tumor is the second major causes
of cancer death for 745,000 patients (World Health Organization,
2014) and 788,000 patients (World Health Organization, 2015)
worldwide. In clinical routine, CT image is the most commonly used
modality for evaluation, surgery planning and progression
evaluation of liver tumor. However, challenges arise in segmenting
liver tumor from liver tissues such as low-contrast, variation of sizes
and irregular shapes. In this study, we overcome these limitations
using Triplanar ConvNet to automatically detect liver tumor based
on the discriminative features learnt from three orthogonal views of
liver tumor and healthy liver.
Background
A variety of algorithms including level-set, graph-cuts,
morphological operations, SVM and AdaBoost have been developed
for liver tumor classification and segmentation tasks. However, the
approach employed depend on hand-crafted features, the needs of
user interactions and the algorithms performance highly depend on
the correct parameters during extraction and selection of features.
Inspired by the improved accuracy of Triplanar ConvNet shown in
medical imaging diagnosis work carried out in knee cartilage
segmentation, anatomical brain segmentation, lung nodule
classification and lymph node detection, we evaluated Single-view
ConvNet and Triplanar ConvNet for liver tumor segmentation.
Methodology
Fig. 1 and Fig. 2 illustrate Single-view and Triplanar ConvNet
respectively. Single-view ConvNet consists of 2 Conv. layers, 2
Max-pooling layers and fully-connected layer. Triplanar ConvNet is
built from three ConvNet architectures and accepts three streams of
inputs (1st input: Axial; 2nd input: Sagittal; 3rd input: Coronal). The
three views are subsequently merged using Merge layer (Fig.2) to
extract learnable representation at the final layer.
Fig.1 Single-view Convolutional Neural Network framework
Fig.2 Triplanar Convolutional Neural Network framework.
Findings and Discussion
We trained Single-view and Triplanar ConvNet using GPU Tesla
K40 acceleration with 2880 cores. We used patches of 17x17 pixels
as the recommended optimum input dimension (Li et al., 2015)
extracted from the CT volumes for our ConvNet approaches. As
observed from the preliminary results (Table 1), the initial findings
of 5.5% accuracy improvement observed from 50 epochs to 300
epochs in the training dataset are promising to demonstrate the use
of Triplanar views in gaining additional insights and comparative
evaluation for liver tumor segmentation in future work.
Table 1. Preliminary Evaluation Results
Methods Trainable
Params
Accuracy
Improvement
Training
epochs
Runtime
(average)
Triplanar 29474 ~95% to ~97.5% 50 to 300 8s 17µs*
per epoch
Single-view 9826 ~90% to ~92% 50 to 300 2s 58µs*
per epoch
Acknowledgement
The authors would like to thank National Supercomputing
Computer, Singapore (https://www.nscc.sg). The computational
work for this article was done on resources of the National
Supercomputing Computer, Singapore.
References
Greenspan, H., Van Ginneken, B., & Summers, R. M. (2016). Guest editorial
deep learning in medical imaging: Overview and future promise of an
exciting new technique. IEEE transactions on medical imaging, 35(5), 1153-1159.
LeCun, Y., Bengio, Y., & Hinton, G. (2015). Deep learning. Nature,
521(7553), 436-444. LeCun, Y., Boser, B. E., Denker, J. S., Henderson, D., Howard, R. E.,
Hubbard, W. E., & Jackel, L. D. (1990). Handwritten digit recognition with
a back-propagation network. Advances in neural information processing systems.
Li, W., Jia, F., & Hu, Q. (2015). Automatic segmentation of liver tumor in CT
images with deep convolutional neural networks. Journal of Computer and Communications, 3(11), 146.
World Health Organization, W. (2014). World Cancer Report (Vol. 978-92-
832-0429-9). World Health Organization, W. (2015). Cancer Factsheet.
*11 Microseconds (µs) = 1.0×10⁻⁶ Seconds

46
[BP10] Selection Drought Index Calculation Methods Using ELECTRE (Elimination and Choice Translation Reality)
Addy Suyatno Hadisuwito1,* and Fadratul Hafinaz Hassan1
1: School of Computer Sciences, Universiti Sains Malaysia, 11800 Pulau Pinang, Malaysia
*Correspondent author: [email protected]
Keywords: Drought Index, Electre, Calculation Methods, KBDI
Drought index is an important measurement to monitor a forest
from potential fires. In most cases, forest fires occur because the
forests have a high drought index. One of the causes of the high
drought index is a low rainfall condition. Drought is a recurring
natural hazard characterized as having below normal precipitation
over an extended period of time ranging from months to years (Dai,
2011).
This research to find out the suitable methods to calculate
the drought index in a tropical forest. The Taman Hutan
Rakyat Suharto, District of Kutai Kartanegara, East
Kalimantan, Indonesia will be chosen as the case study as it
is one of the tropical forest. Also, the Taman Hutan Rakyat
Suharto are among the tropical forest with high risk in suffers
from forest fire. The outcome of this study is that the
recommended alternative becomes a reference in calculating
the drought index in the tropical forest. Comparison between methods has also been done by Homdee,
(2016) and Jain, (2015). (Homdee, Pongput and Kanae, 2016)
conducted a comparison the performance of three climatic drought
indices to characterize drought trends in the Chi River basin in
Northeast Thailand. Initially, the drought assessment was conducted
using the Standardized Precipitation Index (SPI), a precipitation-
based index, and the Standardized Precipitation Evapotranspiration
Index (SPEI), an index taking into account the difference between
precipitation and potential evapotranspiration (PET). (Jain et al.,
2015) did research to compare Standardized Precipitation Index
(SPI), Effective Drought Index (EDI), statistical Z-Score, China Z-
Index (CZI), Rainfall Departure (RD), Rainfall Decile based
Drought Index (RDDI) for their suitability in drought prone districts
of the Ken River Basin. Based on our knowledge both studies
compare the results, not the elements of the method.
In this paper we will compare seven types of drought index
calculation methods which are also known as ‘alternatives’. There
are (1) the Palmer Drought Severity Index (PDSI; Palmer, 1965), (2)
Keetch-Byram Drought Index (KBDI; Keetch et al., 1968), (3)
Bhalme and Mooley Drought Index (BMDI), (4) the Standardized
Precipitation Index (SPI; McKee et al., 1993), (5) Effective Drought
Index (EDI), (6) The McArthur Forest Fire Danger Index (MFFDI)
and (7) the Standardized Precipitation Evapotranspiration Index
(SPEI; Vicente-Serrano et al., 2010).
The method used to compare seven alternatives is the ELECTRE
(Elimination and Choice Translation Reality) algorithm. The electre
algorithm uses a matrix calculation basis using five variables which
are also known as ‘criteria’ referenced in the decision. There are (1)
calculation period, (2) the type of data needed for calculation, (3) the
complexity of the formula used, (4) suitable for use in the tropical
forests, and (5) the type of calculation result scale. Rating suitability
of each alternative on each criteria, rated 1 to 5 with the provisions
of 1 for ‘Very bad score’, 2 for ‘Bad score’, 3 for ‘Enough score’, 4
for ‘Good score’, and 5 for ‘Very Good score’. For example, decision
makers give preference weights as W = [5, 3, 4, 4, 5].
ELECTRE consists of seven steps: (1) Normalization decision
matrix; (2) Weighted matrix normalized; (3) Determine the set of
concordance and discordance index; (4) Calculate the matrix of
concordance and discordance; (5) Determine the dominant matrix of
concordance dan discordance; (6) Determine of agregat the
dominant matrix; (7) Elimination of less favourable alternative.
The calculation results show that an alternative elimination matrix
that has a value of 1 is the element e65 and e26. The e65 element
means that the 6th alternative (MFFDI) is more recommended than
the 5th alternative (EDI). Whereas the e26 element means that the
2nd alternative (KBDI) is more recommended than the 6th
alternative (MFFDI). So it can be concluded that the 2nd alternative
(KBDI / Keetch-Byram Drought Index), the most recommended
alternative to calculate drought index at The Taman Hutan Rakyat
Suharto.
References
Dai, A. (2011) Drought under global warming: a review. Wiley
Interdiscip. Rev. Clim. Change 2, 45e65.
Homdee, T., Pongput, K. and Kanae, S. (2016) ‘A comparative
performance analysis of three standardized climatic drought
indices in the Chi River basin, Thailand’, Agriculture and Natural
Resources. Elsevier Ltd, 50(3), pp. 211–219. doi:
10.1016/j.anres.2016.02.002.
Jain, V. K. et al. (2015) ‘Comparison of drought indices for
appraisal of drought characteristics in the Ken River Basin’,
Weather and Climate Extremes. Elsevier, 8, pp. 1–11. doi:
10.1016/j.wace.2015.05.002.
McKee, T.B., Doesken, N.J., Kleist, J. (1993) The relationship of
drought frequency and duration to time scales. In: Proceedings of
the 8th Conference on Applied Climatology Boston, MA, USA,
pp. 179e183.
Palmer, W.C. (1965) Meteorological Drought. US Department of
Commerce, Weather Bureau Washington, DC, USA.
Vicente-Serrano, S.M., Begueria, S., Lopaz-Moreno, J.I. (2010) A
multiscalar drought index sentitive to global warming: the
standardized precipitation evapotranspiration index. J. Clim. 23,
1696e1718.
Authors Biographies
Addy Suyatno Hadisuwito is postgraduated student
(PhD) at the School of Computer Sciences,
Universiti Sains Malaysia. Completed bachelor's
degree in Informatics Engineering, University of
Technology Yogyakarta, and completed master's
degree in Master of Computer Science, The
University of Gadjah Mada, Yogyakarta. The field of
research that is artificial intelligence, especially artificial neural
networks, expert systems, decission support system, fuzzy logic, and
algorithm analysis.
Fadratul Hafinaz Hassan is senior lecturer at School
of Computer Sciences, Universiti Sains Malaysia.
PhD graduate computer science in the Centre for
Intelligent Data Analysis, Brunel University, West
London in 2013 and completed master’s degree in
Master of Science, Information Technology,
University of Science Malaysia. Specialising in
optimisation algorithms, also highly experience in statistical analysis
and pedestrian simulation, familiarity with pedestrian flow planning,
crowd behaviours and spatial planning.

47
[BP11] Deep Bayesian for Opinion-target identification
Omar Mustafa Al-janabi1, Nurul Hashimah Ahamed Hassain Malim2& Yu-N Cheah3
1,2,3: Universiti Sains Malaysia, School of Computer Sciences, Malaysia
*Correspondent author: [email protected]
Keywords: Deep Learning, Bayesian Inference, Opinion Mining, opinion-target
Purpose
The purpose of this work is to seek if the Deep Learning models can
be adapted to improve the performance of Bayesian nonparametric
model. The nonparametric Stick Breaking process potently has
infinite number of components. It is proposed to identify the opinion-
target in opinion mining task. Nonparametric model is powerful to
determine the number of topics from the data. The given data are the
documents and the components are the distributions of terms that
reflect the topics (or “clusters”). Implementing nonparametric model
on huge data requires multiple passes through all data and it’s
interactable for large scale application (Wang, Paisley, & Blei, 2011).
To improve the divergence with large scale of data (or “big data”), a
deep learning algorithm is being proposed to be integrated as
sampling algorithm into the nonparametric Stick Breaking process.
Background
Nonparametric Bayesian models like Stick Breaking process is a
powerful model for unsupervised analysis of grouped data(Guo, Pan,
& Cai, 2017). Stick Breaking process is applied to document
collections, it’s provide a nonparametric topic model, where
document is viewed as group of observed opinion-target (or “words”),
and components are (presented as topics) distribution over words.
Unlike normal/traditional clustering, Stick Breaking process infer the
number of topics from the data. However, Bayesian probabilistic
model allows very flexible interaction with the observed points of the
data. It is mainly concerned with insight and learning from the data.
The Stick Breaking process is inherently experience the Bayesian.
Where it is a joint distribution of hidden variables Z and observed
variables X as shown in the equation 1:
P Z, X 1
Inference about unknown/hidden variable is through the posterior,
the conditional distribution in equation 2 gives the observations.
P Z X = P(Z, X)
P(X) 2
The Posterior inference or the denominator of the posterior is
intractable, and much research is dedicated to developing an inference
algorithm to tackle this deficiency(The, et al. 2006) (Zhuolin, et al,
2014). Variational Inference has been recently developed (Wang et
al., 2011) to draw the samples from the posteriors. E.g. fit a
distribution (e.g. normal distribution) to the posterior turning a
sampling problem into an optimization problem. Unfortunately, when
it is come the implementation of the variational inference on the
Machine Learning problems e.g. clustering algorithms, it faces
inadequacies. Such as, it’s often play second fiddle with posterior
inference in terms of accuracy and scalability. However, we have
proposed the deep learning mechanism to confront this issue as
elaborated in the next section.
Method
The Deep Bayesian is the prior distributions on the weight. We tend
to put normal distribution over the weights to improve the
performance of the Bayesian nonparametric model while it’s infer the
posterior of hidden variables.
Generally, Deep learning uses many heuristics to train huge data and
perform perfect prediction with highly sophisticated models (Silver
et al., 2016). Neural network is a parametrized function, where the
parameters are the weights and biases of the neural network. From a
statistical point of view, neural networks are efficient non-linear
function approximators and representation learners. While mostly
used for classifications, and they have been extended to unsupervised
learning with AutoEncoders to estimate multimodal distribution
(Kingma & Welling, 2013).
However, as has been stated in the background, to infer the opinion-
target (or “word”) in hidden variable, a posterior inference
approximation is required. In this work we propose deep learning to
infer the posterior by denoting the weight of neural network as the
posterior.
Conclusion
The performance of nonparametric probabilistic models has attracted
many researchers because it infers the topics (or “clusters”) based on
the given data. It is unlike the parametric/traditional clustering that is
required to specify the number of cluster in advance. Yet, the
deficiency of nonparametric models experiences the Bayesian
posterior inference, where these posteriors are intractable in when it’s
conducting massive amount of data. This deficiency generated
because the sampling algorithms are required high number of
iteration to produce better inference. And that leads into inaccurate
clustering and time consuming. To improve the posterior inference a
deep learning is proposed to represent the weights in the neural
network as posterior in the nonparametric Stick Breaking process.
References
Guo, X., Pan, B., & Cai, D. (2017). Robust Asymmetric Bayesian
Adaptive Matrix Factorization.
Kingma, D. P., & Welling, M. (2013). Auto-Encoding Variational
Bayes.
Silver, D., Huang, A., Maddison, C. J., Guez, A., Sifre, L., Van Den
Driessche, G., … Hassabis, D. (2016). Mastering the game of
Go with deep neural networks and tree search.
Teh, Y. W., Jordan, M. I., Beal, M. J., & Blei, D. M. (2006).
Hierarchical Dirichlet Processes. Journal of the American
Statistical Association,
Wang, C., Paisley, J., & Blei, D. M. (2011). Online Variational
Inference for the Hierarchical Dirichlet Process. Aistats 2011.
Zhuolin, Qiu Bin, Wu Bai, W., Chuan, S., & Le, Y. (2014). Collapsed
Gibbs Sampling for Latent Dirichlet Allocation on Spark.
JMLR: Workshop and Conference Proceedings, (2004), 17–
28.

48
[BP12] The Effect of Vocal Cues on Trust at Zero Acquaintance
Deborah Y. H. Ooi1, Syaheerah L. Lutfi2
1: Dept. of Computer Science, Universiti Sains Malaysia, Malaysia
2: Dept. of Computer Science, Universiti Sains Malaysia, Malaysia
Corresponding author: [email protected]
Keywords: Vocal Cues, Prosody, Trust, Zero Acquaintance, Voice
Trust is essential in many human relationships. In fact, trust is
vital wherever risk, uncertainty, or interdependence exist. Without
trust, education in general would be much more difficult as the
students would lack trust in their teachers and vice versa. Trust is
necessary to maximise learning in a teacher-student relationship.
Furthermore, trustworthiness can be gauged in a zero-acquaintance
situation. Zero acquaintance is a situation in which perceivers make
judgments about targets they are given no opportunity to interact
with. Intuitive judgments at zero acquaintance are proven to be
strong predictors of the performance of teachers, salespeople, and
other professionals.
In recent years, several researches have been conducted on the
factors that determine trustworthiness. Particularly, many studies
have shown the significance of voice in perceived trustworthiness.
For instance, a research has found that verbal exchanges between a
neonatal-care nurse and mother greatly influences a woman's
confidence. Another research supports that fact by indicating that
audio communication shows a more significant emergence of trust
than text chat.
Despite recent few research works that analysed the effect of
various vocal cues (e.g., phonetic segmentation, speech rates, and
fundamental frequency(f0)) on trustworthiness, research addressing
the factors of trustworthiness at zero acquaintance is scarce and
limited. Especially, we are still far from consensus regarding the
direction of association between different vocal features ---in
particular, speech rate and fundamental frequency (f0)--- and
trustworthiness. Thus, there is a need to investigate deeper into this
area and this paper plans to do just that. Furthermore, this paper also
aims to identify the characteristics that different ethnics in Malaysia
base their judgement of trustworthiness on.
Method
Figure 1: A general overview of the investigation flow
To carry out this investigation, 120 different voice samples have
been obtained from the OMG-Emotion behaviour dataset (Barros et
al., 2018). Each of these voice samples will be cropped, acoustically-
analysed and digitally manipulated in 4 different ways, namely
increasing and decreasing the rate and f0 respectively. The extent to
which it will be manipulated is based on previous research conducted
by Trouvain et al. (2006) and Smith et al. (1975). This will result in
the formation of 600 audio clips, which are then divided into 120
sets respectively. Figure 1 shows a graphical representation of the
overall methodology used in this investigation. In this manner, the
semantic content of the audio clips within each set are completely
identical and controlled, hence enabling the researcher to more
clearly identify the impact of rate and f0 on trustworthiness ratings.
Each participant in this study will be asked to rate the
trustworthiness of 5 different sets on a scale of 1 to 10 (1 being least
trustworthy and 10 being most trustworthy). Since Peninsular
Malaysia consists of 3 main ethnic groups, namely Malay, Indian
and Chinese, this research will also include participants from all
these races. The ratings given by each ethnic group will be recorded
and analysed accordingly. Each set will be rated 3 times, one from
each ethnic group. The participants will submit their ratings via a
simple online assessment indicating the amount of trust they would
place in the speaker.
Albeit a traditional approach, the assessment method will be able
to investigate the reasons behind perceived trustworthiness of an
individual. A more conventional approach such as the trust game is
not applicable to this study as the responses obtained might be
affected by the attitudes of the sender and receiver (whether they are
risk taking individuals, cautious individuals, etc).
Finally, the ratings of each set are analysed. Firstly, the effects of
rate and f0 on the trustworthiness ratings, as compared to the original
will be analysed. This scope of analysis will be termed ``intra-set''.
Within each set, the correlation between speech rate, f0 and the
trustworthiness ratings will be analysed by using a correlation
matrix. The difference in ratings between each ethnic group will also
be evaluated and examined.
Next, the effects of the semantic content of the audio clips will
also be analysed. This can be carried out by investigating and
comparing the ratings between sets. Characteristics such as number
of pauses, stutters and non-lexical conversation sounds (filler
sounds) such as “um”, “uh”, and “hmm” will be taken into
consideration. The correlation between these characteristics and the
trustworthiness ratings will be analysed. This scope of analysis will
be called “inter-set''. The results will be accurately documented,
analysed and discussed.
Expected Results
By manipulating only the f0 and speech rate of each audio clip
and grouping the audio clips into sets of 5, the semantic content
(what is being said), as well as all the other paralinguistic effects
such as pauses will be controlled. Hence, the effects of those
characteristics will be nullified, enabling the research to be
conducted solely on speech rate and f0. Having 600 audio clips (120
sets) to analyse will provide a wide and broad sample size to enable
evaluation from a variety of different aspects. Hence, the potential
outcomes of this investigation are plentiful. In addition to precisely
measuring the sole impact of pitch or speech rate on perceived
trustworthiness, this investigation would also be able to identify the
effects of the semantic content by analysing the difference in
trustworthiness ratings from one original audio clip and another.
Furthermore, given sufficient participants from each ethnic group,
the difference in characteristics of perceived trustworthiness based
on ethnic groups (if any) will be identified. The outcomes are truly
endless and at the very least, a relationship is hoped to be identified
between voice characteristics and perceived trustworthiness.
References
Barros, P., Churamani, N., Lakomkin, E. et al (2018). The omg-
emotion behaviour dataset. doi: arXiv preprint arXiv:1803.05434
Smith, B. L., Brown, B. L., Strong, W. J. et al (1975). Effects of
speech rate on personality perception. Language and Speech, 18 (2),
145-152. doi: 10.1177/002383097501800203
Trouvain, J., Schmidt, S., Schröder, M. et al (2006). Modelling
personality features by changing prosody in synthetic speech.
doi:10.22028/D291-25920

49
[BP13] EEG Channels Selection Using Hybridizing Flower Pollination and β-Hill Climbing Algorithm for Person Identification
Zaid Abdi Alkareem Alyasseri1,2, *, Ahamad Tajudin Khader1, Mohammed Azmi Al-Betar3
1: School of Computer Sciences, Universiti Sains Malaysia (USM), Malaysia
2: Dept. of ECE, Faculty of Engineering, University of Kufa, Iraq
3: Dept. of IT, Al-Huson University College, Al-Balqa Applied University, Al-Huson, Irbid, Jordan
* Correspondent author: [email protected]
Keywords: EEG, Biometric Authentication, Feature selection, Flower pollination algorithm, β-hill climbing
abstract
Recently, electroencephalogram (EEG) signal present a great
potential for a new biometric system. Several studies showed that
EEG presents uniqueness features, universality, and natural
robustness to spoofing attacks. The EEG signals represent the
graphical recording of the brain electrical activity which can be
measured by placing electrodes (sensors) in various positions of the
scalp. This paper proposes a new method for EEG channels selection
that maximizes the accuracy recognition rate, which is measured by
means of the radial basis function kernel support vector machine
(RBF-SVM) classifier. The proposed method using a hybridizing
meta-heuristic method based on binary flower pollination algorithm
(FPA) and β-hill climbing (FPA-βhc) for reducing the required
electrodes (channels) while maintaining accuracy rate performance.
The EEG autoregressive with three different coefficients have been
used as features extraction. The (FPA- βhc) is tested using a standard
EEG signal dataset, namely, EEG motor movement/imagery dataset.
The experimental results show the proposed approach can make use
of less than a half of the number of channels while maintaining
recognition rates up to 96%, which is crucial towards the effective
use of EEG in biometric applications. It is worth mentioning that the
proposed method can achieve results that are better than the state-of-
the-art ones, as well as we draw future directions towards the
research area.
Proposed Method This section provides a discussion of the proposed methodology
of the hybridizing flower pollination and β-hill climbing algorithm
for person identification. The proposed method (FPA-βhc)
framework run through four phases where the result of each phase is
an input to the consecutive one. The four phases are presented in
Figure 1.
Results and Discussion Figure 2 shows the comparison based the convergence rate between
the proposed method (FPA-βhc) and standard (FPA). It is clear to
observe that the hybridization method (FPA-βhc) achieve better than
standard FPA algorithm where it is achieved recognition rates up to
96%.
Figure 2 Convergence rate of the proposed method and FPA.
References
Alyasseri, Z. A. A., Khader, A. T., Al-Betar, M. A., & Awadallah,
M. A. (2018). Hybridizing β-hill climbing with wavelet
transform for denoising ECG signals. Information
Sciences, 429, 229-246. Rodrigues, D., Silva, G. F., Papa, J. P., Marana, A. N., & Yang,
X. S. (2016). EEG-based person identification through binary
flower pollination algorithm. Expert Systems with
Applications, 62, 81-90. Alyasseri, Z. A. A., Khader, A. T., Al-Betar, M. A., Awadallah,
M. A., & Yang, X. S. (2018). Variants of the flower pollination
algorithm: a review. In Nature-Inspired Algorithms and Applied
Optimization (pp. 91-118). Springer, Cham.
Authors Biographies Z.A.A. Alyasseri is a lecturer at the University of Kufa,
Iraq. received the BSc in computer science from Babylon
University in 2007 and MSc in computer science from University Science Malaysia (USM) in 2013. Since
September 2016, He has joined the Computational
Intelligence research group at the School of Computer Sciences, University Science Malaysia (USM) for pursuing
Doctor of philosophy in the field of Artificial Intelligence (Brain-Inspired
Computing). A.T. Khader received the BSc. and M.Sc. in Mathematics
from the University of Ohio,USA, in 1982 and 1983,
respectively. He obtained his Ph.D. in Computer Science from University of Strathclyde, U.K., in 1993. He is
currently a Professor in the School of Computer Sciences,
Universiti Sains Malaysia. His current position is the Dean of School of Computer Sciences, USM. His research
interest Mainly focuses on Optimization and Scheduling.
M.A. Al-Betar is an associate professor in the Dept of Computer Science at Al-Huson University College, Al-
Balqa Applied Univ., Jourdan. He received a B.Sc and
M.Sc from Computer Science Department at Yarmouk University, Jordan in 2001 and 2003 respectively. He
obtained PhD from the School of Computer Sciences,
USM in 2010. His research interests are mainly directed to metaheuristic optimization methods and hard combinatorial optimization problems.

50
[BP14] Exploring Whole-Brain Functional Networks of Music-Linguistic from Rhythmic Quranic Recitations and Language Proficiency
M.S. Shab1,*, A.I. Abd Hamid1, A. Ab Ghani2, N.S. Kamel3, M. Muzaimi1
1: Dept. of Neurosciences, School of Medical Sciences, Universiti Sains Malaysia (USM) Health Campus, Malaysia
2: Kolej Islam Antarabangsa Sultan Ismail Petra (KIAS), Malaysia
3: Centre for Intelligent Signal and Imaging Research (CISIR), Universiti Teknologi Petronas (UTP), Malaysia
*Correspondent author: [email protected]
Keywords: Rhythmic Quranic recitations, Language proficiency, fMRI, Functional networks
Introduction
Prior research to extend our understanding of neural bases
underlying music and language input typically used songs to feature
the two cognitive domains. Manifesting related properties with
music, Quranic recitation can be considered in the same
perspectives. By manipulating either the linguistic or musical
dimensions (or both) of Quranic recitation and studying their
interconnection, it is possible to get further insight regarding neural
networks that are fundamental to music and language cognition.
Background and Objective
Quranic verses have been synonymously recited in melodious and
rhythmic ways in Muslim cultures. Despite expressing both
combination of music and language, neuroimaging studies using
Quranic stimulations focused exclusively on the musical elements
[1-3] while very little addresses the language impact [4-5], meaning,
the musical and linguistic components of Quranic stimuli are studied
on separate basis. Employing functional magnetic resonance
imaging (fMRI) recordings as measured by the blood-oxygenation-
level-dependent (BOLD) signal fluctuations, this study seeks the
neural foundation for melodic, rhythmic recitation of Quranic verse
when integrated with subjects’ language proficiency level.
Methods
Thirty (N=30) healthy, Muslim subjects will be divided into two
groups: native Arabic speakers, n=15, and non-native Arabic
speakers, n=15 with inclusion and exclusion criteria. The
determination of Arabic language proficiency among the subjects
will be done by administering the Basic Inventory of Natural
Languages to assign them as native or non-native speakers. Seven
modes of listening will be presented as auditory stimuli; pre-test
resting condition, three Quranic recitations (Ayatul Kursi verse in
Murattal Asim, Murattal Susi and Tarannum Asli styles, with each
characterized by distinctive qiraat, tempo and accentuation), two
non-Quranic stimuli (Arabic news and Arabic poem) and post-test
resting condition. Each stimulus will be given in random order.
Imaging data of the subjects will be acquired using a 3-Tesla MRI
scanner at Hospital USM (HUSM). Following preprocessing, the
functional images will be registered to Montreal Neurological
Institute (MNI) standard human brain template. Functional neural
networks will be extracted and distinguished by applying the
Independent Component Analysis (ICA). Resulting spatial maps
(indicative of brain region’s activation and functional connectivity
strength) from SPM12 and MATLAB software will be used to test
for groups’ differences. Applying Bonferroni test, the result will be
considered significant at p<0.05.
Anticipated Result
Different functional neural networks will be manifested, among
them, plausibly: language network, default mode network, attention
network, working memory network, attention network, emotional
network and etc., with each corresponding to a distinct set of neural
substrates. Diverse spatial distributions and activation patterns may
be exhibited between:
(i) Native Arabic speakers and non-native Arabic speakers
(ii) Quranic and non-Quranic stimuli
(iii) Different styles of Quranic verse recitations
Significance
By investigating functional connectivity during auditory task, by
unbiased whole-brain and data-driven approach, it is hoped that
different networks bearing significant importance in learning can be
delineated. Understanding the interconnection can aid in outlining
theoretical foundations of music-language processing at brain level
from the manipulation of music properties (rhythm, melody, tempo)
and language proficiency, as demonstrated by huffaz (those who
have completely memorized the Quran), and from application view,
in improving the outcomes of learning and listening-related tasks.
References
[1] Abdurrochman, A., Wulandari, R. & Fatimah, N. (2007).
The Comparison of Classical Music, Relaxation Music
and the Quranic Recital: an AEP Study. Abstrak.
[2] Fauzan, N., Shahidan, S. N. & Amran, N. H. (2017).
Identification of Dominant Wave during the Recitation of
Al-Mulk Verse with (without) Understanding Using EEG
Signal. O-JIE: Online Journal of Islamic Education, 3, 1-
7.
[3] Hassan, M. S. S. A. O. & Othman, S. A. (2013). Effects of
Quran Listening and Music On Electroencephalogram
Brain Waves. The Egyptian Journal of Experimental
Biology (Zoology), 9(1), 119-121.
[4] Nasir, S. A. M. & Mahmud, W. M. H. W. (2015). Brain
Signal Analysis Using Different Types of Music.
International Journal of Integrated Engineering, 7(3).
[5] Saleem, A. (2015). Does memorization without
comprehension result in language learning?
(Dissertation). Cardiff University

51
[BP15] Parallel Text Acquisition and English-Malay Machine Translation
T.-P. Tan*, Y.-L. Yeong K. H. Gan, S. K. Mohammad,
School of Computer Sciences, Universiti Sains Malaysia, 11800 USM, Pulau Pinang, Malaysia
Keywords: Parallel Text Acquisition, Statistical Machine Translation, Neural Machine Translation
Introduction
Machine Translation (MT) is a process of translating text from a
source language (for example English) to a target language (for
example Malay) using a software. MT provides the convenience of
translation that is fast and at a low cost to consumers, and the quality
of the translation produced are improving. Two state-of-the-art MT
architectures are Statistical Machine Translation (SMT) and Neural
Machine Translation (NMT). SMT modeling translations by
extracting the statistics from text corpora. On the other hand, NMT
learns translation patterns using a neural network architecture. Both
approaches create a translation model from translation examples for
a pair of languages, which is known as parallel text. A parallel text
consists of aligned bilingual phrases or sentence pairs that are
translation of each other. Usually, the bigger the parallel text corpus,
the better the quality of the translation produced.
Parallel Text Acquisition
We collected an English-Malay PArallel Text (EMPAT) corpus.
This corpus consists of parallel text for training and testing. The
parallel text for training was extracted from bilingual dictionaries,
theses, and articles. The testing part on the other hand was extracted
from news articles and exam questions.
A bilingual dictionary contains many of translation examples that
can be a good resource for building a parallel text corpus. An OCR
was first used to scan dictionaries. Normally, the translation
examples are in a particular order. Thus, regular expressions can be
applied to extract these sentences. In some cases, language
identification algorithm has to be used to separate the sentences. One
way to determine the language of a sentence is by using n-gram
language model. Spelling correction were also carried out. This were
done using minimum edit distance and n-gram model. Another
source to acquire English-Malay parallel sentences is theses and
articles. In Malaysia, it is customary in many journals and theses to
have the abstract to be written in Malay and English. In addition, an
abstract from an article also contain many recent terms from
different domains that are useful in translation. Thus, the abstract of
these documents provides another source for us to extract English-
Malay parallel text. The other source where English-Malay parallel
text can be found is in the abstract of a document. The theses
produced by Universiti Sains Malaysia and journal articles were
downloaded from an open access repository web site using web
crawlers. These documents were from various fields such as social
science, humanities, business, computer science, engineering and so
forth. The title and abstract were identified using keywords. The text
was segmented based on sentence, and some pre-processing was
performed such as separating the punctuations from words and
converting uppercase letters to lowercase letters. The last step is to
align the sentences in the English abstract file to the corresponding
sentence in the Malay abstract file automatically using an alignment
algorithm. This was done because the sentences in both languages
are not necessarily in the same order. In addition, not every sentence
in the abstract was translated. The BleuAlign tool (Sennrich & Volk,
2010) was used for aligning the sentences. The reference translation
was generated using an initial SMT. BleuAlign will then find the
target language sentence that have the highest BLEU score for each
reference translation.
For testing a MT, a different set of parallel text test was collected.
The tests evaluate MTs in both the news and computer science
domain. For news domain, parallel text was extracted from
MalaysiaKini news portal that produces news in English and Malay.
Most of the news generated by this portal contains passages and
sentences that are similar. To match English and Malay news
sentences, the BleuAlign sentence alignment algorithm was applied.
For testing MT on a specialized domain, we extracted sentences in
the computer science domain from the exam questions of the School
of Computer Sciences, Universiti Sains Malaysia. These
examination papers are a good source for building a parallel text
corpus because the exam questions exist in bilingual since the year
2000.
Experiments and Results
We manage to collect more than 300 thousand English-Malay
parallel sentences for training. About 250 thousand pairs from
bilingual dictionaries and 70 thousand pairs from thesis and articles.
On the other hand, 200 thousand and 70 thousand parallel sentences
for testing were extracted from news and computer science domain
respectively. We randomly selected 4 thousand sentences for testing
on SMT and NMT. Moses toolkit (Koehn, et al., 2007) was used to
build the English-Malay SMT. A Malay text corpus (Tan, et al.,
2009) with about 870 MB was used to build a Malay 4-grams
language model using SRILM (Stolcke, 2002). The NTM has a
bidirectional encoder-decoder LSTM architecture with attention
mechanism (Bérard, et al., 2016). The BLEU score for SMT was
higher compared to NMT in the news domain. The baseline SMT
obtained a BLEU score of 48.35, while the BLEU score for the
baseline NMT is only 39.31. The usage of a language model in SMT
was the reason why SMT obtained a very high BLEU score in the
news domain. The BLEU score for computer science domain are
comparable at 21.13 and 21.21 for SMT and NMT respectively.
Acknowledgement
The work is supported by Fundamental Research Grant (FRGS)
from Ministry of Higher Education Malaysia.
References
Sennrich R, Volk M (2010) MT-based sentence alignment for OCR-
generated parallel texts. Proceedings of AMTA.
Koehn P, et al. (2007) Moses: open source toolkit for statistical
machine translation. Proceedings of ACL.
Tan T.-P, et al. (2009) MASS: A Malay language LVCSR corpus
resource, Proceedings of Oriental Cocosda’09.
Stolcke A., SRILM – An extensible language modeling toolkit.
International Conference on Spoken Language Processing,
Denver, 2002.
Bérard A, Pietquin O, Besacier L, Servan C (2016). Listen and
translate: A proof of concept for end-to-end speech-to-text
translation, Proceedings of NIPS.

52
[BP16] Characterizing Compute-Intensive Tasks as a Factor of Network Congestion
Norfazlin Rashid1,2,* and Umi Kalsom Yusof1
1: School of Computer Sciences, University Science Malaysia, Penang, Malaysia
2: Faculty of Engineering Technology, University Malaysia Perlis, Perlis, Malaysia
* Correspondent author: [email protected]
Keywords: computation congestion, cloud data centre, network congestion, characterization of computation congestion.
Purpose of Study
The purpose of this study is to characterize computation
congestion in a cloud network. The result will answer the question,
“What are the network metrics that can reflect the occurrence of
computation congestion in a cloud data centre?”
Background and Motivation
Congestion in high capacity networks (e.g. cloud data centres) has
long been a matter of interest in research. To manage congestion, we
must know the factors that might contribute towards it. Generally,
researchers assumed that the factors of congestion are mostly caused
by link utilizations, such as insufficient bandwidth or inefficient
routing of packets through its respective paths. However, another
possible factor of congestion is expected in cloud data centres,
namely compute-intensive tasks; too many of these tasks may lead
to computation congestion (Wang, Almeida, Blackburn, &
Crowcroft, 2016).
To simply explain the scenario, we could describe the network
flow as akin to traffic on a highway; the number of lanes is analogous
to bandwidth while tolls are comparable to network nodes.
Congestion is usually thought to be caused by insufficient lanes, and
the solution has been by adding more lanes to occupy larger number
of vehicles (i.e. add more bandwidth for larger amount of data
passage) or by distributing the traffic to less occupied lanes (i.e.
network load balancing or congestion control mechanism). What if
the congestion happens because of the delay in the toll? Adding more
lanes, instead of speeding up the process at the toll, would not help
reduce congestion. It is also possible that the lanes seem available
(due to the large lane capacity), but processes are jam-packed at the
toll. Since current methods of identifying congestion does not
differentiate the cause, it is imperative that we find a way to do so.
Computation Congestion in Cloud Data Centres
As mentioned earlier, in order to manage congestion, the
characteristics of the congestion factor must be known. In the case
of managing computation congestion, we should be able to identify
when it happens or about to happen. Theoretically, computation
congestion might occur when there is a surge of compute-intensive
tasks at a certain point. Hence, it is reasonable to say that we need to
have a performance metric based on those tasks, where we ask “how
many tasks are too many?”
Currently, few research are done to address the issue of
computation congestion, particularly the mechanism of identifying
it. In proposing a proactive congestion control mechanism, Wang et
al. (2016) estimated the probability of computation congestion by
monitoring CPU usage, memory usage, execution rate and request
arrival rate; the estimation was based on assumptions that the tasks
are Poisson processes, and the queue length of task requests are
similar to a simple M/M/1-Processor Sharing queuing system.
Besides using pure assumptions, some researchers have embarked
in analysing the behaviour of real workload to predict congestion
(Beaumont, Eyraud-Dubois, & Lorenzo-Del-Castillo, 2016; Liu et
al., 2017). Real data analysis are now possible with the release of
Google Cluster Trace, a set of production-run cloud computing
workload data consisting of 12 583 machines, with approximately
600 000 jobs and 20 million tasks which was collected for 29 days.
This data trace discloses some of the scheduling complexities that
affect Google’s workload, including the variety of job types,
complex scheduling constraints on some jobs, mixed hardware
types, and inaccurate user estimation of resource consumption
(Reiss, Wilkes, & Hellerstein, 2011). It is believed that the onset of
computation congestion can be detected by characterizing compute-
intensive tasks in the data trace.
Proposed Methodology
Analysis will be done on Google Cluster Trace, taking into
account the task usage of CPU, memory, disk, and network.
According to (Chen & Katz, 2010), only CPU and memory are
constrained resources. Thus, it is highly likely that the metrics to be
chosen are task duration in seconds, CPU usage in cores, and
memory usage in gigabytes. The characterization of the workload
will then be derived using statistical profiling, such as time series
and k-mean of several performance metric. The graph produced
during job launches during the workload is observed and compared
to the graph during job drops. A job launch is defined as the interval
during which we first see a task belonging to the job, while job drops
may be an indicator of congestion on the node.
Conclusion
From the analysis, it is anticipated that a specific pattern would
indicate the occurrence of computation congestion, most possibly
from CPU usage, memory usage and disk allocation. The pattern
would help to identify a threshold value for each field and
subsequently be used as the metric to characterize computation
congestion caused by compute-intensive tasks.
References
Beaumont, O., Eyraud-Dubois, L., & Lorenzo-Del-Castillo, J. A.
(2016). Analyzing real cluster data for formulating allocation
algorithms in cloud platforms. Parallel Computing, 54, 83–
96. https://doi.org/10.1016/j.parco.2015.07.001
Chen, Y., & Katz, R. H. (2010). Analysis and Lessons from a Publicly
Available Google Cluster Trace. Technical Report No.
UCB/EECS-2010-95. Retrieved from
http://www.eecs.berkeley.edu/Pubs/TechRpts/2010/EECS-
2010-95.pdf
Liu, C., Liu, C., Shang, Y., Chen, S., Cheng, B., & Chen, J. (2017).
An adaptive prediction approach based on workload pattern
discrimination in the cloud. Journal of Network and
Computer Applications, 80(June 2016), 35–44.
Reiss, C., Wilkes, J., & Hellerstein, J. J. L. (2011). Google cluster-
usage traces: format+ schema. Google Inc.,
Wang, L., Almeida, M., Blackburn, J., & Crowcroft, J. (2016).
C3PO: Computation Congestion Control (PrOactive). In
Proceedings of the 3rd ACM Conference on Information-
Centric Networking (pp. 231–236). New York, NY, USA:

53
[BP17] A Hyper-heuristic based Artificial Bee Colony Optimization for the Traveling Salesman Problem
S. S. Choong1,*, L. P. Wong1
1: School of Computer Sciences, Universiti Sains Malaysia, Malaysia
* Correspondent author: [email protected]
Keywords: swarm intelligence, bio-inspired metaheuristic, evolutionary algorithm, combinatorial optimization, Choice Function.
Research Background and Objective
Bees’ foraging behaviour has been computational realized as algorithms to solve various optimization problems [1-3]. The Artificial Bee Colony (ABC) algorithm [1] is a well-known bee-inspired algorithm. In the ABC algorithm, a food source represents a solution to the optimization problem in the search space, and the nectar amount of the food source represents the fitness of that solution. ABC defines three types of bees: employed, onlooker, and scout bees. An employed bee looks for new food sources around the neighbourhood of the food source that it previously visited. An onlooker bee observes dances and selects a relatively better food source to visit. A scout bee searches for new food sources randomly. ABC is initially proposed to solve optimization of mathematical test functions with a unique neighbourhood search mechanism [1].
Recently, ABC is modified to solve combinatorial optimization
problems, e.g. the Traveling Salesman Problem (TSP) [4]. However, its neighbourhood search mechanism cannot be directly applied for this set of problems. Instead, the employed and onlooker bees are prescribed with one or more perturbative heuristics to produce new solutions. These heuristics are problem-specific, for instance, the perturbative heuristics for TSP include insertion, swap, inversion, etc. In view of the large availability of heuristics, the question concerning the selection of a particular heuristic has been posed. This leads to the studies on hyper-heuristics.
A hyper-heuristic is a high-level automated methodology for selecting heuristics [5, 6]. The heuristics to be selected in a hyper-heuristic are known as the low-level heuristics (LLHs). In this study, a hyper-heuristic, i.e. Modified Choice Function (MCF) [7], is integrated in the ABC algorithm to select the perturbative
heuristics deployed by the employed and onlooker bees. The proposed model is denoted as MCF-ABC.
The Proposed Model MCF-ABC is an ABC variant with ten LLHs. It consists of four
phases: initialization, employed bee phase, onlooker bee phase, and
scout bee phase. The initialization and scout bee phase of MCF-ABC
is similar with that of the ABC variants in [4]. In the employed and
onlooker bee phases, a bee is aided by MCF to select an appropriate
LLH. MCF evaluates the performance score, F of each LLH using
three measurements, i.e. f1, f2, and f3. f1 represents the recent
performance of each LLH; f2 reflects the dependencies between
consecutive pairs of LLHs; f3 records the elapsed time since the last
execution of an LLH. For each neighbourhood search, an LLH with
the largest F score is selected. After each neighbourhood search, the
generated solution is improved using a local search. Then, a greedy
acceptance method is applied to decide whether to accept the new
solution. After that, the F score of each LLH is updated. More details
of MCF-ABC can be found in [8, 9].
Results and Findings
MCF-ABC is evaluated using 64 TSP instances. The aim of
solving a TSP is to find a route that leads a person to visit each
city once and only once and to return to the starting city with the
minimum total cost. On average, MCF-ABC solves the 64 instances
to 0.055% from the known optimum within approximately 2.7
minutes. To examine the effectiveness of MCF-ABC, it is compared
with a Random-ABC model which uses the same sets of LLHs and
a random selection strategy. The results show that, MCF-ABC
statistically outperforms Random-ABC. Moreover, comparison
studies among the state-of-the-art algorithms ascertain the
competitiveness of MCF-ABC.
Conclusion
The Artificial Bee Colony (ABC) algorithm is a popular bee-
inspired optimization algorithm. When ABC is used to solve
combinatorial optimization problems, single or multiple perturbative
low-level heuristics (LLHs) are adopted as its neighbourhood search
mechanism. When there are multiple LLHs, the selection of these
LLHs has a significant impact on the performance of ABC. In this
study, we propose the use of a hyper-heuristic, i.e. Modified Choice
Function (MCF), to guide the selection of the LLHs in ABC. The
comparisons indicate that MCF-ABC is competitive among the
state-of-the-art algorithms.
Many problems in the Big Data domain, e.g. feature selection,
clustering, and error minimization, can be framed as combinatorial
optimization problems. For future work, MCF-ABC can be adapted
to solve these problems.
References
[1] D. Karaboga (2005) An idea based on honey bee swarm for
numerical optimization. Erciyes University, Engineering
Faculty, Computer Engineering Department, Technical report.
[2] L. P. Wong and S. S. Choong (2015) A bee colony optimization
algorithm with frequent-closed-pattern-based pruning strategy
for traveling salesman problem. In Proceeding of the Conference
on Technologies and Applications of Artificial Intelligence (TAAI
2015), pp 308-314.
[3] S. S. Choong, L. P. Wong, and C. P. Lim (2018) A dynamic
fuzzy-based dance mechanism for the bee colony optimization
algorithm. Computational Intelligence.
https://doi.org/10.1111/coin.12159.
[4] M. S. Kıran, H. İşcan, and M. Gündüz (2013) The analysis of
discrete artificial bee colony algorithm with neighborhood
operator on traveling salesman problem. Neural computing and
applications 23:9-21.
[5] E. K. Burke, M. Gendreau, M. Hyde, G. Kendall, G. Ochoa, E.
Özcan, et al. (2013) Hyper-heuristics: A survey of the state of
the art. Journal of the Operational Research Society 64:1695-
1724.
[6] S. S. Choong, L. P. Wong, and C. P. Lim (2018) Automatic
design of hyper-heuristic based on reinforcement learning.
Information Sciences 436-437:89-107.
[7] J. H. Drake, E. Özcan, and E. K. Burke (2012) An improved
choice function heuristic selection for cross domain heuristic
search. In Proceedings of the International Conference on
Parallel Problem Solving from Nature 2012, pp 307-316.
[8] S. S. Choong, L. P. Wong, and C. P. Lim (2017) An artificial bee
colony algorithm with a modified choice function for the
traveling salesman problem. In Proceedings of the 2017 IEEE
International Conference on System, Man, and Cybernetics
(SMC) 2017, pp 357-362.
[9] S. S. Choong, L. P. Wong, and C. P. Lim (2018) An artificial bee
colony algorithm with a modified choice function for the
traveling salesman problem. Swarm and Evolutionary
Computation. https://doi.org/10.1016/j.swevo.2018.08.004.

54
[BP18] The Application of Machine Learning in Classifying the Vector Borne Disease Awareness
Abrar Noor Akramin Kamarudin1,*, Zurinahni Zainol1, Nur Faeza Abu Kassim2
1: School of Computer Science, Universiti Sains Malaysia, Malaysia
2: School of Biological Science, Universiti Sains Malaysia, Malaysia
* Correspondent author: [email protected]
Keywords: classification, vector borne disease, human behavior
Abstract
This study compares the classification algorithms’ performance on
the awareness of mosquito-borne viral disease outbreak based on the
human factors (awareness, knowledge, attitudes and practices). The
classification will be done by using several machine learning
algorithms (Naïve Bayes, Support Vector Machine, Decision Tree,
Artificial Neural Network and Logistic Regression) to predict the
awareness of dengue risk among the community. The results will be
compared to select the best machine learning algorithm in supporting
the initial design of a personalized educational program.
The Internet is one kind of instrument to hold the lifelong learning
among the communities. This includes the vector-borne disease
(VBD) awareness campaign, especially the dengue fever. Although
such campaigns are always seen on television, the rate of dengue
outbreak is constantly increasing each season (Boonchutima,
Kachentawa, Limpavithayakul, & Prachansri, 2017). This indicates
that the awareness level among the communities are still
questionable. They might not fully aware of their responsibility and
need to increase their knowledge regarding the vital issue. Current
VBD outbreak prediction system did not include human awareness
into accounts (Kesorn et al., 2015). Constructed predictive model
through search queries, environment, and climate factors does not
solve the real issue comprehensively due to the exclusion of human
factors. A new method which involves human behavior and
education to the current prediction system can provide a heuristic
solution in VBD prevention.
An initial online survey was carried out with 171 individuals of
the Malaysian public aged 13 years old and above. The self-
administered structured questionnaire covers all aspects of
demographic profile, self-assessment whether they have the
awareness of dengue or not, and questionnaire regarding mosquitoes
breeding sites, mosquito’s prevention method and mosquitoes biting
time. The machine learning algorithms are tested on 13 features of
human awareness, knowledge, attitudes and practices such as
cleanliness, waste management, clogged drains and stagnant water
management, aerosol spray/mosquito repellent usage, long-sleeved
shirt and long pant bright in color usage, mosquitoes breeding site,
and mosquitoes bite time (Gyawali, Bradbury, & Taylor-Robinson,
2016; Aung et al., 2016). Fivefold cross-validation technique was
utilized in the present investigation for the training and testing. The
algorithms were performed by using WEKA, a data mining
application developed by Waikato Environment for Knowledge
Analysis.
Out of 171 respondents, 86% declare that they are aware of the
mosquitoes from breeding in their area. It is found that the Support
Vector Machine algorithm outperform other machine learning
algorithms for predicting human awareness with 88.3% correct
classification. It is followed by Decision Tree (86.55%), Logistic
Regression and Naïve Bayes algorithm (85.96%), while the
Artificial Neural Network at 85.38%.
An effective prediction model of VBD awareness among citizens
is vital in a personalized e-learning program to highlight the risk of
contracting dengue and increase their knowledge about dengue
prevention and treatment. Hence, this research proposes to use the
SVM algorithm to construct a predictive model for dengue
awareness using human behavior parameters and the newly
discovered variable, the knowledge of mosquito breeding sites and
mosquitoes’ bite time which has never been used in any existing
predictive models.
References
Aung, M. M. T., Hassan, A. B., Kadarman, N. B., Hussin, T. M.
A. B. R., Barman, A., Ismail, S. B., & Hashim, S. E. B. (2016).
Knowledge, attitude, practices related to dengue fever among
rural population in Terengganu, Malaysia. Malaysian Journal of
Public Health Medicine, 16(2), 15-23.
Boonchutima, S., Kachentawa, K., Limpavithayakul, M., &
Prachansri, A. (2017). Longitudinal study of Thai people media
exposure, knowledge, and behavior on dengue fever prevention
and control. Journal of infection and public health, 10(6), 836-
841.
Gyawali, N., Bradbury, R. S., & Taylor-Robinson, A. W.
(2016). Knowledge, attitude and recommendations for practice
regarding dengue among the resident population of
Queensland, Australia. Asian Pacific Journal of Tropical
Biomedicine, 6(4), 360-366.
Kesorn, K., Ongruk, P., Chompoosri, J., Phumee, A., Thavara,
U., Tawatsin, A., & Siriyasatien, P. (2015). Morbidity rate
prediction of dengue hemorrhagic fever (DHF) using the
support vector machine and the Aedes aegypti infection rate in
similar climates and geographical areas. PloS one, 10(5),
e0125049.
Authors Biographies
Abrar Noor Akramin Kamarudin is a PhD student at School of Computer Science, Universiti Sains Malaysia. His
research is focused on vector borne disease prediction,
personalization and e-learning.
Zurinahni Zainol is an Associate Professor at School of
Computer Science, Universiti Sains Malaysia. Her research
specialization are Theory of Database Design and
Management, XML Document Schema Design, Data
Model, and Software Development using Formal Specification.
Nur Faeza Abu Kassim is a Senio r Lecturer at School of Biological Science, Universiti Sains Malaysia. She is an
expert in medical and epidemiological entomology. Her
research specialization are mosquito -borne disease & the role of vectors in transmission disease. Development of the
integrated vector management, mosquito control ,
monitoring/surveillance program, attractant and trapping system.

55
[BP19] Supersymmetry Feature Decomposition for Classification Purpose
Nu’man Badrud’din
Department of Physics, International Islamic University Malaysia (IIUM) Kuantan
Keywords: Machine learning, feature decomposition, classification, supersymmetry, particle physics
Machine learning for classifying data is gaining popularity in
many fields but has yet to be seen as clear in improving particle
detection in particle physics. It provides the ability to classify high
dimensional data such as the supersymmetry (SUSY) event based on
the dataset’s list of features. In an attempt to enhance the analysis, the
features were engineered in this research by using feature
decomposition alongside two methods of machine learning
algorithm: Random Forest and Artificial Neural Network. Feature
decomposition is also a type of data compression as it reduces the
dimensionality of the dataset. Different combination of numbers of
features and feature decomposition types are tested for both of the
algorithms. Therefore, the accuracy and precision of the classification
for both algorithms is compared with and without feature
decomposition to observe its effect on the data classification. For the
artificial neural network algorithm, different activation function and
different training ratio are also being tested to observe the effect of
the feature decomposition on different parameter. The overall result
obtained refuted the initial hypothesis, showing that both accuracy
and precision with feature decomposition are lesser than without.
Conclusively, the compression of supersymmetry data by dimension
reduction is not feasible in classifying the dataset as it decreases its
accuracy and precision.
Purpose
1. To develop neural network classifier model for the supersymmetry
dataset.
2. To develop feature engineering code for the supersymmetry
database and compare the machine learning with and without feature
engineering.
3. To compare the accuracy of the supersymmetry classification with
and without feature engineering.
4. To check for consistency of the classification for artificial neural
network algorithm.
Background
Particle physics simulation in finding new exotic particles
produces enormous amount of data and machine learning techniques
have yet to be seen as clear in improving the simulation. Therefore,
feature decomposition is used to compress the size of the data with
intention it could improve the classification of the dataset.
The research was intended to compare the accuracy and
precision of supersymmetry classification simulation with and
without feature decomposition to give insights into the effect of
feature decomposition to the classification of supersymmetry data.
Method
Computations were performed on a Linux based computer with
an AMD Ryzen 7 octa-core processor, a 16GB NVIDIA GTX1070
graphics processor, and 32GB of RAM. All codes were written using
PyCharm IDE software and Python 3.6.1 programming language with
Anaconda library packages Keras neural network library.
Dataset used was mini supersymmetry dataset from Machine
Learning Repository of University of California, Irvine (UCI)
consisting of 100,000 data and 18 features (dimensions). The dataset
has of about 46% of positive examples and the rest is negative
examples.
The classification of the dataset was being done and
compared by using two types machine learning algorithms –
random forest (RF) classifier and artificial neural network (ANN).
Random forest classifier is one of the learning algorithms, and ANN
is Keras’ neural network for simple deep learning. Both classifier
codes were developed without feature decomposition first and the
result was the base reference for comparison to the result with
feature decomposition. 8 types of feature decomposition were
paired with respective count of 18 numbers of features of
supersymmetry to find the ideal number of features needed to get
the highest accuracy for random forest algorithm. While for ANN,
the 8 types of feature decomposition were paired with 6, 12 and 18
number of features respectively to observe the effect of feature
decomposition on the accuracy of the learning. The accuracy and
precision between both classifiers were compared with and without
feature decomposition.
Results
Both classifier algorithm of random forest (RF) and artificial
neural network (ANN) without feature decomposition (FD) output
higher accuracy than when all types of feature decomposition are
used. The accuracies and precisions dropped when feature
decomposition or higher training data was used. Both classifiers are
consistent throughout repetition of the simulations.
Even without feature decomposition, both algorithms output
a fairly similar accuracy. This could be expected since the dataset
is sufficiently large to be fed for both of the machine learning.
Although ANN outputs higher accuracy, the minor difference of
0.1452% in accuracy between the two algorithms is noticeable but
less significant.
Although some of the result showed that feature
decomposition could increase the accuracy of the classification, it
also showed that it could decrease the accuracy and precision either
slightly or drastically. Nevertheless, the increases were
insignificant, and the precision dropped from when no feature
decomposition is used.
The precision overall is reduced after feature decomposition,
except for some combination of feature decomposition, activation
function and number of features yet their accuracy remains
decreased regardless.
From both of RF and ANN results, it can be observed that
there was no significant increase (by 3% or more) regardless of
feature decomposition used and regardless of number of features
chosen. On the contrary, almost all feature decomposition reduces
the accuracy and precision of the machine learning for both
algorithms. Although there are some that have higher accuracy, it
is considered to be insignificant in comparison with the reference
result of without feature decomposition. The difference in
accuracies in repeated simulations was less than 1% concluded
that the ANN classifier algorithm of this research is consistent.
Conclusion
The overall results from this research showed that feature
engineering by feature decomposition decreases the classification
accuracy for both random forest and artificial neural network
classifier. Early hypothesis that feature engineering will at least
increase the accuracy deemed to be wrong in this case; because of
the dimension reduction by the decomposition. Not only the reduce
in accuracy, but the precision also diminishes as features were being
decomposed. This shows that each feature in the supersymmetry
dataset are important as they are not redundant, or in other words
they are independent and non-derivative of each other. Therefore,
all and each feature should be considered when classifying the
supersymmetry dataset or other feature engineering techniques
have to be devised.

56
PRAGMA 35 POSTER ABSTRACTS

57
[PP01] Mobile-based Augmented Reality for Sundanese Alphabets Education
Muhammad Reza Aditya, Resskytha Permata Sari, Adri Nursimarsiyan and Nova Eka Diana Informatics Department, Faculty of Information Technology, Universitas YARSI, Indonesia
[email protected], rereskytha@gmail, adrysiyan@gmail, [email protected]
Abstract
In 2017, the Indonesian Ministry of Higher Research and Education reported that the smartphone user in Indonesia had achieved about 25% of the total citizen or about 65 million people. This trend is beneficial to utilize smartphone for promoting traditional cultures in Indonesia, especially to the teenagers that are steadily moving forward to modern culture. This research aims to build an Android-based application with an augmented reality feature to enhance the experience of learning traditional Indonesian heritage, especially traditional alphabets. CARIOSAN is a mobile application with the purpose to preserve the Sundanese alphabets and prevent it from extinction. The main features in the application are AR-based Sundanese alphabets recognition, Rarangken information, Sundanese alphabets writing canvas, and quiz feature to assess user understanding of the Sundanese alphabets. We interviewed 35 respondents for measuring the usability, the easiness of use, the information coverage, the interface, and the novelty of the application. The results showed that the developed application was highly useful and interactive in providing the essential information of Sundanese alphabets although with a novelty score only above 50 percent.

58
[PP02] Deep Learning Classification for Liver Disease
Andi Batari Ahmad and Nova Eka Diana Informatics Department, Faculty of Information Technology, Universitas YARSI, Jakarta,
Indonesia [email protected], [email protected]
Abstract
Liver disease is one of the top ten diseases with the highest mortality rate in Indonesia, with the increasing rate of one percent per year. Type of liver disease most attacking Indonesian people is Hepatitis. According to Basic Health Research (Riskesdas) 2013, Hepatitis had a prevalence number of 1.2 percent that was double than the prevalence in 2007. There are some methods to diagnose the liver disease such as enzymes pattern analysis, excretion, metabolism, electrophoresis and serologic test. This research focused on diagnosing the liver disease based on enzymes pattern using Deep Learning approach. We used Indian Liver Patient Dataset (ILPD) from UCI Machine Learning Repository with a total of 583 data (416 positives and 167 negatives) to build the classification model, with the training and testing rate of 0.7 and 0.3, respectively. We conducted a preprocessing step for the training data using Synthetic Minority Over-sampling Technique (SMOTE) with the percentage rate of 0.5 to balance the positive and negative class. Experiment results reveal that the created model can classify liver disease with the accuracy, sensitivity, and specificity rate of 0.89882, 0.84, and 0.9225 percent, respectively.

59
[PP03] Application of Deep Learning and Fingerprint Modeling Methods to Predict Cannabinoid and Cathinone Derivatives
Widya Dwi Aryati, Gerry May Susanto, Muhammad Siddiq Winarko, Heru Suhartanto, Arry Yanuar*
Faculty of Pharmacy, Universitas Indonesia, Depok, West Java 16424, Indonesia Faculty of Computer Sciences, Universitas Indonesia, Depok, West Java 16424, Indonesia
Abstract
In recent years, new psychoactive substances (NPS) have rapidly emerged in market purportedly as “legal” alternatives to internationally controlled drugs, with the potential to pose serious health risks. 21 of 56 NPS were found as cannabinoid derivatives in 2016 in Indonesia. From 2013 to 2018 there was an increasing number of cathinone derivatives, 30 compounds in 2013 and 89 compounds in 2018. Artificial intelligence (AI) has become a tool for data processing and is applied for object recognition such as human pose and image classification. The purpose of this study is to apply and gain the best AI method to classify new cannabinoid and cathinone derivatives by comparing deep learning method and fingerprint modeling method. The pharmacophore modeling was used as the reference method.This study compared deep learning and fingerprint modeling methods. Both methods were compared with pharmacophore modeling as the reference method. Physicochemical property descriptor will be used as learning parameters for the deep learning method. The two models produced by each method will be used to classify new cannabinoid substances. As for the cathinone substances, the structure was transformed into a fingerprint form. This method was also compared with pharmacophore modeling as the reference method. Compared to the pharmacophore modeling method, the deep learning method for cannabinoids classification showed the higher accuracy and Cohen Kappa scores respectively (0,8958 and 0,396) and (0,8622 and 0,68) for pharmacophore modeling. Pharmacophore modeling in the classification of cathinone derivatives showed accuracy (91.11%) and Cohen Kappa scores (0.708). However, fingerprint modeling gave accuracy (71.8%) and Cohen Kappa (0.637). These results conclude that the deep learning method with descriptor is a better instrument to be used for cannabinoid classification compared to pharmacophore modeling, but fingerprint modeling showed lower accuracy than pharmacophore modeling in cathinone classification.

60
[PP04] Building Smart City Datasets with Crowdsourcing for Safe Direction in Bangkok, Thailand
Manassanan Boonnavasin, Suchanat Mangkhangjaroen and Prapaporn Rattanatamrong Thammasat University
[email protected], [email protected], [email protected]
Abstract
There could be many problems when there is population living together in cities. For examples, crime, robbery, attack and snatch. Having a crime map that can mark potential risk places or areas can help you avoid directions that not safe. Unfortunately, there is no such open data to create the crimp map for public in Thailand. This project presents our effort in building a smart city dataset with crowdsourcing to collect information about unsafe or risky to crime places/areas in Bangkok area. We first crawl crime scene information from online news. Using only information from news has limits because we can only get the cases reported to the polices and those that they. Officially announced. So, we need more data from active citizen by crowdsourcing. The newly developed dataset will be used to draw points, lines, and appropriate shapes on the map. After that directions from a source to a destination of user selection can be provided with the avoidance of the risky area (if possible) or some warning information will be provided along with the direction. Our main challenges are (1) how to build a successful crowdsourcing that fits Thai people’s nature and yield quality data collection, (2) once data is collected both from crowdsourcing and news crawling, how can we turn them into correct latitude and longitude, and (3) how to generate route direction to avoid the unsafe areas on the map. We present our preliminary result based on the inputs achieved from a user survey and a prototype mobile application with Google Map API, called Happy Map. We hope this application can help people to have happy and safe travel in Bangkok, Thailand.
61
[PP05] A Network Performance Measurement in a Low-Cost Containerized Cluster System
Thitiwut Chamornmarn, Vasaka Visoottiviseth and Ryousei Takano Faculty of Information and Communication Technology, Mahidol University, Nakhon Prathom,
Thailand Information Technology Research Institute, National Institute of Advanced Industrial Science
and Technology, Tsukuba, Japan
Abstract This poster demonstrates the network performance in a low-cost containerized cluster system which consists of five Raspberry Pi computers. We use Kubernetes for managing cluster resources and executing containers on it. The NodePort service mechanism forwards external traffic to a corresponding container running on a worker node. We have conducted two experiments micro benchmark with iperf and an application benchmark with the Apache benchmark. The reasons of these experiments are measuring the performance of Kubernetes networking topologies and also finding the limitation and durability of network functions in Kubernetes. The first experiment measures TCP goodput with four possible communication patterns: intra-node, inter-node, external with forwarding, and external without forwarding. The second experiment measures HTTP request processing throughput using the Nginx web server and the Apache benchmark with six different container deployment configurations.

62
[PP06] A Prototype of Collaborative Augment Reality Environment for HoloLens
Dawit Chusetthagarn, Vasaka Visoottiviseth and Jason Haga Faculty of Information and Communication Technology, Mahidol University, Nakhon Prathom,
Thailand Information Technology Research Institute, National Institute of Advanced Industrial Science
and Technology, Tsukuba, Japan [email protected], [email protected], [email protected]
Abstract The interest in augmented reality (AR) and virtual reality (VR) for a variety of applications has surged in recent years. Although these technologies provide new ways to interact and understand information, often the experience is limited to a single person. To address this limitation, we implemented the concept of spatial anchors from Microsoft using Holotoolkits to create a collaborative AR environment for a HoloLens application. The collaborative environment can work through the server in Holotoolkits running with the Unity platform. Preliminary results of our collaborative AR environment were demonstrated using a disaster management application that can be shared in the HoloLens as a proof-of-concept application. The concept of our application can be implemented in a variety of use-cases to provide greater collaborative understanding including an indoor navigation system that shares user’s view point in HoloLens. In the future, this environment will be used to visualize, explore, and understand large datasets in data-intensive science research from a variety of disciplines.

63
[PP07] Analysis of Load Balancing Performance on Cluster Computing with Proxmox VE
Andi Rasuna Dharsono and Sri Chusri Haryanti Faculty of Information Technology, Universitas YARSI, Indonesia
[email protected], [email protected]
Abstract This research aims to examine the performance of load balancing for a cluster. Load balancing is a solution for a large access load and minimizes downtime in serving requests from users. Load balancing distributes loads of traffic evenly to the servers with particular algorithms. In this research, the server for load balancing cluster is implemented using LVS topology via direct routing and use round-robin algorithm on Proxmox VE for load balancing. Proxmox VE is in charge of dividing virtual resource servers into four virtual environments, two nodes as load balancing clusters and two nodes as web servers. The results of research conducted with loads of 250, 500 & 1000 users show that load balancing system reduces the maximum response time up to 4165 ms with 0% of packet loss, compared to utilization of single server with the maximum response time up to 7269 ms and 22.48% packet loss. The load balancing system for clusters also manages to failover with an average value of downtime 16.6 seconds.

64
[PP08] Performance Comparison of Load Balancing using Honeybee and Threshold Algorithm
Aditya Efrian, Sri Chusri Haryanti, Sri Puji Utami Atmoko, Ridho Yanevan Pratama Faculty of Information Technology, Universitas YARSI, Indonesia
[email protected], [email protected] , [email protected] ,[email protected]
Abstract Cloud computing is currently developing rapidly. Load balancing technique is very crucial to balance the load in the cloud. Load balancing is needed to distribute dynamic workload across resources in the cloud. CloudAnalyst can be used to simulate load balancing algorithm in cloud. One advantage of CloudAnalyst is it applies a GUI. We implement Honeybee and Threshold algorithms into CloudAnalyst. We examine Honeybee and Threshold algorithms implementation for Indonesian e-Health cloud model. There are 4 data center and 34 users based on the number of regions and provinces in Indonesia. Two data center selection policies are used, i.e. closest data center and optimized response time policy. The average response time is investigated for different user data sizes. The simulation result shows that Threshold algorithm gives average response time that is faster than the Honeybee. Nevertheless, Honeybee algorithm delivers better performance for data size smaller than 80 bytes, and Threshold algorithm tends to give smaller response time for data size 100 bytes.

65
[PP09] Data-centric Modeling of Gainesville Businesses
Michael Elliott, Erik Bredfeldt, Matthew Collins, Renato Figueiredo, Mark Girson, Amardeep Siglani, Lila Stewart and Jose Fortes
ACIS Lab, University of Florida [email protected], [email protected]
Abstract The purpose of this research is to investigate the extent to which data collected by the City of Gainesville can be used to model local business success and to improve our understanding of how the city’s public services can influence that success. The scope of data utilized in this study includes, but is not limited to, business location, age, crime rate, local and national economic growth, utility consumption, and compliance with city regulations. To supplement publicly available data, a survey was conducted of local business owners to assess their own perceived success, which factors drove or inhibited that success or lack thereof, as well as how experiences with the City of Gainesville may have affected their businesses. Extensive analysis is performed with the considered data in order to identify potential correlations with local business success. We explore data trends across previous years and geographically map a snapshot of recent data to subsections of the city. However, meaningful conclusions are at times hindered by both missing information and the lack of any direct means of matching entities across separate datasets. There is a wide range of actions the City of Gainesville can take to facilitate the advancement of its own data infrastructure to make it robust enough to support practical applications and modeling. Measures can be taken to increase the integrity and usability of existing datasets, while future data collection could benefit from enhanced specificity, common identifiers, and more rigorous data verification process. We are looking for collaboration opportunities with researchers who are engaged in similar initiatives in other cities and data scientists interested in modeling business lifecycles.

66
[PP10] Performance Analysis of GTX 980 GPU on Colon Histopathology Images Training Based on Convolutional Neural Network
Toto Haryanto, Aniati Murni, Kusmardi Kusmardi, Li Xue and Suhartanto Heru Universitas Indonesia
[email protected], [email protected], [email protected], [email protected], [email protected]
Abstract Cancer diagnose based on the histopathology images is still become challenges recently. The variation of images, high resolution of images, different pattern of cell on the images have potential tend to miss-classification. Convolutional neural network has widely used in image processing with its ability to extract and classify an object. Applying CNN on high resolution of images cause cost intensive in training process. For that, Graphics Processing Unit (GPU) has important role to increase the speed-up. However, the problem in GPU is the size limitation of memory. This research focus on the way to utilize the GPU memory in the training of CNN architecture. For training CNN architecture, NVIDIA GTX-980 are accelerated by customize CUDA memory allocation from cnmem library. The parameter of cnmem are chosen from 0.6, 0.8, 1, 2 and 4 experimentally and the best value will be used to the next training. To enrich the dataset, augmentation such as rotation, zoom, shear and flip are conducted. Some optimization technique are applied experimentally to determine the best model to classify two classes of cancer, benign or malignant. We use image variation from 32x32, 64x64, 128x128, 180x180 and 200x200 in this research. While training, number of batch-size is selected experimentally from 10, 20, 50, 100 and 150. According to the research, enabling cnmem with parameter 1 is selected as the best value. The 200x200 images show the most significant efficiency of GPU performance when training CNN. Speed-up are measure by comparing training time of GTX-980 with CPU core i7 machine from 16, 8, 4, 2 cores and the single core. The highest speed-up GTX-980 obtained with enabling cnmem are 4.49, 5.00, 7.58, 11,97 and 16.19 compare to 16, 8, 4, 2 and 1 core processor respectively.

67
[PP11] Dengue Hemorrhagic Fever Disease Data Clustering Based on Interactive Map in Special Region Jakarta Capital
Brian Hogantara and Ummi Azizah Rachmawati Department of Informatics, Faculty of Information Technology, Universitas YARSI Jakarta
[email protected]; [email protected]
Abstract
Dengue fever is an infection caused by the dengue virus. The virus spread by Aedes aegypti mosquito. Patients who are infected have symptoms such as fever, accompanied by a headache, pain in muscles and joints, until spontaneous bleeding. This research aims to develop an interactive map that is presenting data with web media to obtain spatial information easily. The interactive map uses clustering to process the data from the Jakarta Health Service Office. Clustering is a method of data analyzing, which aims to group data with similar characteristics to the same 'region' and the data with different characteristics to the 'other area'. This method separates the values of health indicators into a few groups which have significant value difference among groups. The result of this research can be used by the policy maker in Jakarta to reduce the spread of the disease and to decrease the mortality of the patient of dengue fever. The interactive map also can be used for a decision-making system for the government based on data dengue fever in Jakarta. This research can help the government and society to take action related to a characteristic of Jakarta areas that have a lot of cases of dengue hemorrhagic fever.

68
[PP12] Curating Target-Activity Information for Nadi Compounds Based on CHEMBL using Similarity Searching
Muhammad Jaziem Mohamed Javeed, Aini Atirah Rozali, Siti Zuraidah Mohamad Zobir,
Habibah Abdul Wahab and Nurul Hashimah Ahamed Hassain Malim
Universiti Sains Malaysia, Malaysian Institute of Pharmaceuticals and Nutraceuticals (Ipharm)
[email protected], [email protected], [email protected],
Abstract
Natural products are generally considered as a rich source of biologically active substance. In the
period of 20 years (1981-2002), Food and Drug Administration (FDA) has claimed 5% of the
1031 new chemical entities (NCE) approved as drugs are natural products and other 23% are
natural-product-derived molecules. In Malaysia, natural products are collected and stored in a
database known as Natural Product Discovery (NADI). However, the natural compounds in this
database has not been classified in their respective activity classes yet. Curating the target-activity
of NADI database is the focus of this study. It requires few methods and a database for
reference. A publicly available database, CHEMBL, is used in this study as it covers a broad
range of curated and annotated data. Importantly, a curated linkage between indexed 2D
chemical structures and biological targets is provided. However, it is impractical to screen all the
compounds randomly because it will be time-consuming and computationally expensive.
Simplest approach used in virtual screening (VS) known as similarity searching (SS) technique
which is also widely used in drug discovery process is implemented to perform the screening task
of NADI and CHEMBL. The results from the similarity searching method is used to discover
the compounds with highest similarity value in ChEMBL with the query compound in NADI. It
will be then fed as input to pattern matching process in order to determine the target-activity for
NADI. If there is no target-activity information of certain compounds in ChEMBL, the target-
activity in NADI will be defined as undetermined. Compounds with target-activity information
will be a reference for the query NADI compounds. At the end of this study, our aim is to create
a statistic based on NADI target activity information. Out of thousand compounds in NADI,
few should be able to be assigned to the target-activity reported in ChEMBL database that stores
millions of compounds. The finding from this study will be beneficial for those who are
conducting studies in drug discovery field.

69
[PP13] Design AR application using the tiled display walls
Jidapa Kongsakoonwong, Boonsit Yimwadsana , Jason H. Haga Information Technology Research Institute, National Institute of Advanced Industrial Science
andTechnology, Tsukuba, Japan Faculty of Information and Communication Technology, Mahidol University, Bangkok,
Thailand, [email protected], [email protected], [email protected]
Abstract
Data visualisation plays an important role in understanding data through different graphical
representations of the data. However, newer technologies have expanded data visualization
beyond a single computer screen and paper printouts. Often these traditional technologies lack
context and can reduce the efficiency of understanding the data by the user. Hence, it is
necessary to develop visualization approaches that facilitate understanding and exploration of
data in an easy manner by the user. One of technologies that can help us to add context to the
information is augmented reality (AR). This technology has become very popular recently as a
means to add context to data objects and allow users to interact spatially with the information.
This paper uses the new ARKit tool to develop an AR application that creates virtual
information layers that are superimposed over data objects in the physical world. The user can
interact with the layers and manipulate the data to generate better understanding. Our proof-of-
concept AR application will be demonstrated with a tiled display walls. In the future, the concept
of our application can be applied to developing a dynamic AR application for data intensive
science.

70
[PP14] Decision Support System based on Interactive Map of Measles and Rubella Data in Jakarta
Pravin Kumar, Elan Suherlan, Ummi Azizah Rachmawati [email protected]; [email protected]; [email protected]
Deaprtment of Informatics, Faculty of Information Technology, Universitas YARSI Jakarta
Abstract
Indonesia is implementing a program towards the elimination of measles, with efforts to perform case-based measles surveillance (CBMS) that confirmed by a laboratory. In line with the plan of measles elimination, rubella control through the monitoring of rubella also implemented by integrating with measles surveillance. This study aims to develop a decision support system based on an interactive map that can be used to assist the Jakarta Health Department in monitoring and to search for measles and rubella data in Jakarta Special Capital Region. This system is a form of effort that helped the Jakarta Health Department in monitoring patients with measles and rubella and evaluate the spread of measles and rubella located in the Jakarta Special Capital Region. This study uses the software development methodology, comprising the steps of a literature study, data collection, data preparation, system design, system implementation, and testing. The results show that more than 80% of users agree that the system is easy to understand and user-friendly, leading, and unconventional. The system performance is quick, and the features in the system already support the decision correctly. The map is interactive, and 70% stated that the information is complete and informative.

71
[PP15] RNA-seq transcriptome profiling of Desmos chinensis: revealing the molecular basis of petal evolution in the custard apple family Annonaceae
Amy Wing-Sze Leung, Sangtae Kim and Richard Mark Kingsley Saunders School of Biological Sciences, The University of Hong Kong, Hong Kong S.A.R
Department of Biology, Sungshin Women’s University, Republic of Korea [email protected], [email protected]
Abstract
Although petals are not homologous within flowering plants different types of petals might
nevertheless share a deep homology at the molecular level. Sepal and petal differentiation has
evolved independently in the family Annonaceae and some core eudicots, with the development
of “bract-like” and “stamen-like” petals, respectively. Little is known of the molecular control of
floral development in the non-model family Annonaceae. In order to better understand floral
developmental genetics of the family, we profiled the transcriptome of a representative species,
Desmos chinensis, during its floral development using a high throughput RNA-seq technique.
Floral organ and leaf samples at developing and mature stages were obtained for transcriptome
sequencing. Over 200GB of Illumina data was generated using the HiSeq2000 platform. All
downstream bioinformatics work was performed on the High Performance Computing cluster
HPC2015 supported by the Information technology service of The University of Hong Kong. In
total, 22,112 assembled transcripts (c. 80% transcriptome completeness) were recovered using de
novo assembly. The transcriptome was annotated and characterized based on publicly available
databases. Downstream expression level estimation and gene ontology enrichment analysis
suggested that a large proportion of D. chinensis transcripts are responsible for defense, with
some expressed strongly in sepals. Metabolism related transcripts, including those responsible for
glycolysis, were found to be up-regulated in mature petals. 52 complete homeotic MADS-box
gene transcripts were obtained from the floral and leaf transcriptome with the aid of the draft
genome of a closely related species. The orthology of these putative MADS-box transcripts were
validated using phylogenetic analyses, OrthoMCL and UniProt annotation.

72
[PP16] Computational Fluid Dynamics Study of Wind Environment in Urban Areas
Chun-Ho Liu, Wai-Chi Cheng, Wenye Li, Ziwei Mo, Zhangquan Wu, Lillian Y.L Chan, W.K. Kwan and Hing Tuen Yau
Department of Mechanical Engineering, The University of Hong Kong Information Technology Services, The University of Hong Kong
[email protected], [email protected], [email protected], [email protected], [email protected], [email protected], [email protected], [email protected]
Abstract
Economic activities and industrialization unavoidably lead to degrading wind environment and
elevating pollutant concentrations in urban areas. Buildings, skyscrapers and infrastructures in
metropolises collectively form complicated urban morphology in which the dynamics is different
from that in the atmospheric boundary layer (ABL) aloft. Under this circumstance, the
conventional (meso-scale) meteorology models would not be fully applicable to diagnose the
problems in details. Engineering computational fluid dynamics (CFD), such as OpenFOAM, is
commonly used to tackle the problems in refined micro-scale. The protocol of using building
information for OpenFOAM CFD studies in the city ventilation perspective is reported in this
paper. Detailed information of buildings and terrain is collected from the Lands Department,
The Hong Kong Special Administrative Region (HKSAR). The digital maps are
threedimensional (3D) spatial data of the HKSAR territory that include buildings (commercial
and residential), infrastructure (roads and bridges) and natural terrain (mountains and slopes) for
land assessment, engineering visualization and air ventilation analysis, etc. The 3D geometric
models are available in virtual reality modeling language (VRML) format. In this paper, we use
one of the HKSAR downtown areas as an example to demonstrate the solution protocol. The
digital models in the files are divided into tile basis so MeshLab is used to assemble and convert
the VRML files to STL format. The STL files of building information are then merged with the
OpenFOAM mesh generation utility blockMesh and are discretized by snappyHexMesh to 3D
unstructured meshes. The mesh generatorsnappyHexMesh uses the triangulated surface
geometries in the STL files to generate 3D meshes, approximating the solid surfaces. It also
refines the surfaces iteratively to morph the buildings by split-hex meshes to the facades and
ground in high spatial resolution. Additional layers of refined spatial resolution are fabricated as
well to improve the accuracy of near-wall-flow calculation. The STL model of downtown
HKSAR areas, which is reduced in scale approximately 1:300, is discretized into over 5 million
hexahedral cells for subsequent CFD calculation.

73
[PP17] Enhancing MedThaiSAGE: Decision Support System using Rich Visualization on SAGE 2
Jarernsri Mitrpanont, Wudichart Sawangphol, Supakorn Silapadapong, Suthivich Suthinuntasook, Wichayapat Thongrattana1, Jason Haga
Faculty of Information and Communication Technology, Mahidol University, Nakhon Pathom, Thailand, Information Technology Research Institute, National Institute of Advanced Industrial
Science and Technology, Tsukuba, Japan {jarernsri.mit, wudhichart.saw}@mahidol.ac.th,
{supakorn.sil, suthivich.sut, wichayapat.tho}@student.mahidol.ac.th, [email protected]
Abstract
For several years, the Routine to Research (R2R) Organization has gathered medical research project data in Thailand and transformed it into a valuable knowledge resource to improve healthcare services and help healthcare policy makers to construct policies. However, the large amount of historical data creates a challenge to understand this information.To address this problem, MedThaiVis has been proposed to serve as a tool to visualize this complex data. In addition, MedThaiVis has been extended to operate on complex data in Scalable Amplified Group Environment (SAGE2), called MedThaiSAGE. This platform can help users to understand the data, gain insights into the complex data, and provide a better comprehensive view for exploration. SAGE2 is the platform that allows us to execute a visualization on scalable, high-resolution, display walls. Furthermore, MedThaiSAGE has been developed as a Decision Support System based on Association Rules, which is exploited to help healthcare policy makers to see the relevant set of rules and help in developing policy. However, these two applications perform independently. Therefore, we proposed and implemented an approach to integrate these two applications in order to enhance their capability. In order to integrate Extended MedThaiVis and MedThaiSAGE, there are three main issues that were overcome: (1) data integration, (2) communication and cooperative workflow between the two applications, and (3) fully support on SAGE2. In conclusion, our approach can help users to explore overview and insights of R2R data and increase the capability of healthcare policy makers.

74
[PP18] Tuberculosis (TB) Disease Interactive Map in Jakarta Capital Special Region
Nuraisah, Ummi Azizah Rachmawati Faculty of Information Technology, Universitas YARSI Jakarta
[email protected]; [email protected]
Abstract
Tuberculosis (TB) is a disease that is easily contagious and can attack various organs of the body,
especially the lungs. This disease can cause complications to cause death for the sufferer if not
appropriately treated. Currently, Indonesia is in the top six countries with the newest TB cases
and is ranked second with the most cases of TB patients in the world. Prevention can be done,
among others, by conducting regular visits to community homes to ensure that their place of
residence has proper sanitation by established health standards. It is necessary to map problems
in each region to ensure what diseases are now spreading in the area. This study aims to monitor
Tuberculosis in the Special Capital Region of Jakarta, especially East Jakarta, by using interactive
maps to facilitate the DKI Jakarta Health Office in monitoring the control of Tuberculosis for
action and prevention. This research use SDLC methodology, which consisted of the stages of
system analysis, system design, system implementation, and system testing. The data used is from
the Health Service Office of Jakarta Region. This interactive map-based tuberculosis information
system in the particular area of the capital Jakarta is a form of business that can help the
community and is expected to be useful for its users.

75
[PP19] Digital Poster Management Application on a SAGE2 based Multiple Display System
Prakritchai Phanphila, Vasaka Visoottiviseth Jason Haga, Ryousei Takano Faculty of Information and Communication Technology Mahidol University, Bangkok, Thailand
Information Technology Research Institute National Institute of Advanced Industrial Science and Technology,Tsukuba, Japan
[email protected], [email protected] [email protected], [email protected]
Abstract
Digital posters are an impressive presentation media that can replace paper postersused at
technical conferences. An organizer of such events requires effective managementof multiple
digital posters and multiple monitors. This paper proposes a digital postermanagement system
on a multiple display environment. To control multiple monitors we employ SAGE2 technology,
which is middleware for collaborative working in highresolution that allows multiple users to
simultaneously control the display of the samemonitor from browsers. Managing multiple
monitors is designed using the main SAGE2screen to manage and control other SAGE2 screens.
We have implemented a costeffective multiple display system using Raspberry Pi computers. For
digital posters, we have extended a PDF viewer to support automatic page advancing with an
arbitraryinterval. Also, we have developed a SAGE2 multiple monitor application that can be
usedto control the PDF viewer presentation on multiple SAGE2 displays. The
currentimplementation can manage and control what should be shown on each SAGE2
display.Future work includes implementing a PDF uploading function and evaluating the
performance and effectiveness in a real exhibition environment.

76
[PP20] Machine learning for processing image data for disaster management
Parintorn Pooyoi, Worapan Kusakunniran, Jason H. Haga Mahidol University, National Institute of Advanced Industrial Science and Technology
[email protected], [email protected], [email protected]
Abstract
Natural disasters are an important global problem affecting many different countries. In Japan, a
public website was made available to provide a variety of data from different sensors throughout
the country. This data includes information about river water levels, rainfall levels, and snowfall
level. Moreover, this information includes CCTV cameras positioned along the river, which
provide photos of the river conditions in real-time. This provides users with information on the
current status of the river, but does not provide any additional information and the user is left to
process the information and make decisions. The goal of this project is to improve the usability
of this CCTV image data through image processing with machine learning. Convolution Neural
Network is one of the most popular machine learning algorithms. As a first step to provide more
information from the camera images, we implemented this framework to detect snow in the
camera images. using a modified form of the transfer learning VGG19 model. This model was
trained with images that were positive for snow and negative for snow. The results confirmed
that it can detect snow areas on the ground in image. However, in some images had false
positives because it classified a clouds as snow. Because of this, we implemented post-
processing to correct the false positives and improved the accuracy of the classification. Future
work will extend the classification from a binary (i.e. yes or no snow) to a more quantitative
measure of the amount of snow in the images.

77
[PP21] Room Auto Controlling Based on Occupant Body Condition Using Arduino And Raspberry Pi
Ahmad Sabiq, Nova Eka Diana, Debita Febriana, Sri Chusri Haryanti Faculty of Information Technology, Universitas YARSI, Indonesia
[email protected], [email protected], [email protected], [email protected]
Abstract
A cozy room should adjust its environment based on the condition of its occupants since it will
indirectly affect the moods and body conditions of people inside. This study aims to develop a
system for monitoring the human body condition using paired sensors on the Arduino Lilypad.
The system will send the sensors data to the Raspberry Pi 3 via Bluetooth to automatically
control the electronic device inside the room based on the occupant body condition. The
developed system will automatically turn on or turn off the electronic device when the body
temperature or the heart rate is higher than the specified threshold value.

78
[PP22] Criminality Linguistics Detection on Social Networks Through Personality Traits
Saravanan Sagadevan, Nurul Hashimah Ahamed Hassain Malim, Nurul Izzati Ridzuwan and Muhammad Baqir Hakim Mohammad Bashir Universiti Sains Malaysia, Penang, Malaysia
Abstract
As text messaging became a mainstream form of communication among online users, cyber-
criminal activities such as cyber bully and cyber harassing are more often executed through such
platforms. However, linguistic markers in the text messages often act as fingerprints in revealing
the characters of the culprits who hide behind the anonymity provided by internet. Presently,
most of the text-based cybercriminal studies directly dives into linguistic analysis rather than
exploring through the psychology-personality aspects that acts as one of the root causes to the
presence of criminality. Therefore, this study attempts to investigate the criminality contents in
tweets messages through the point of view of personality trait that advocates criminal behaviour
and its representation towards languages measured through sentiment valences. Furthermore,
most of the recent studies in personality detection domain used Big 5 Personality Model and
Automatic personality Recognition (APR) technique to examine the personality of social
networks users. As an alternative, this study intended to incorporate the Three Factor Personality
Model (PEN) traits especially Psychoticism that widely has been applied to evaluate the
personality of criminals and employed an Automatic Personality Perception (APP) method to
guide the identification of sentiment seed terms that associated to PEN model traits. We have
collected English and Malay language messages tweets messages and annotated based on
sentiment valences identified through literature reviews. This study proposed a methodology to
make comparisons among Naïve Bayes (NB), Sequential Minimal Optimization (SMO), K-
Nearest Neighbour (KNN), J48 and ZeroR classifier as a baseline based on the Chi Square
feature selection and 10-fold cross validation. Our Machine Learning comparison showed that
NB classifier outperformed other classifiers while KNN performed worst among them.
79
[PP23] Performance Comparison of Dynamic Load Balancing Algorithm for Indonesian e-Health Cloud
Ridho Yanevan Pratama, Aditya Efrian, Sri Chusri Haryanti, Sri Puji Utami Atmoko Faculty of Information Technology, Universitas YARSI, Indonesia
[email protected], [email protected] , [email protected] , [email protected]
Abstract
The popularity of cloud computing has been growing - including the use of cloud computing in
healthcare, as commonly called e-health cloud. The increasing number of cloud computing users
has driven the selection of an effective load balancing algorithm. This study has examined the
performance of load balancing algorithms for a cloud. The cloud is Indonesian e-health cloud
using Particle Swarm Optimization (PSO) and Ant Colony Optimization (ACO) algorithms for
load balancing. We used CloudAnalyst simulator, a cloud computing simulator that applies a
GUI. Before running the scenario, PSO and ACO algorithms are added on CloudAnalyst. The
simulation is done for a cloud model with the number of users and data centers that adopt the
need of part of e-health cloud in Indonesia. 42 users were taken based on the number of cities,
while for 6 data centers were taken from 6 provinces on the Java Island. The data center
selection use optimized response time policy. The average response time and the average data
center processing time are investigated for different requests per user and data sizes. The results
show that the ACO algorithm provides a lower response time and data center processing time
compared to using the PSO algorithm for load balancing on the cloud.

80
[PP24] Using UAV images for smart agriculture to monitor rice paddy with artificial intelligence
Ming-Der Yang, Hui Ping Tsai, Yu-Chun Hsu, and Cloud Tseng Department of Civil Engineering, National Chung Hsing University, Taichung, Taiwan Innovation and Development Center of Sustainable Agriculture, National Chung Hsing
University, Taichung, Taiwan [email protected], [email protected], [email protected], [email protected]
Abstract Rice is the staple food for over half of the world’s population. Especially in Asia, rice is central
to the food security (FAO 2014). Therefore, a smart rice paddy monitoring system is urgently
needed to ensure a sustainable rice production. With the intention to develop a smart rice paddy
monitoring system, the present project uses a huge amount of environmental data as the basis
for the development of an artificial intelligent (AI) agricultural cultivation support system
integrating unmanned aerial vehicle (UAV) surveillance. Meanwhile, a standard operating
procedure (SOP) of the UAV field monitoring system will be established in order to combine
field monitoring networks and cloud-based image processing techniques. Three major highlights
are 1) establishing a UAV agricultural multi-source image database, 2) implementing a variety of
image analyses combining AI techniques for growth monitoring, yield prediction, crop moisture
content evaluation, damage assessment, and disease monitoring, and 3) establishing a UAV
cloud-based platform to combine functions of UAV image analysis and expert advice support
system. Overall, the present study is expected to provide a valuable basis for smart agriculture
development and to benefit both farmers and management agencies in agriculture cultivation and
management in Taiwan and further southeast Asia countries.

81
[PP25] rEDM Code Acceleration with ABCI Supercomputer
Wassapon Watanakeesuntorn, Kohei Ichikawa, Jason Haga, Gerald Pao, Erik Saberski Nara Institute of Science and Technology
Abstract The rEDM code is the R package which written on C++ and R programming language. The rEDM package is a collection of methods for Empirical Dynamic Modeling (EDM). In this work, we try to optimize and accelerate the code by using CUDA. We aim to run this program on the AI Bridging Cloud Infrastructure (ABCI) in AIST, Japan. We use the dataset of zebrafish neural brain for running with the rEDM code from UCSD, USA. This is collaboration project of NAIST, AIST and UCSD.

82
PRAGMA 35 DEMO ABSTRACTS

83
[PD01] Integrating PRAGMA-ENT and Inter-Cloud Platform using Dynamic L2VLAN Service
Kohei Ichikawa, Atsuko Takefusa, Yoshiyuki Kido, Yasuhiro Watashiba, Susumu Date Nara Institute of Science and Technology, National Institute of Informatics,
Osaka University [email protected], [email protected], {kido, watashiba-y, date}@cmc.osaka-u.ac.jp
Abstract
Effective sharable cyberinfrastructures that allow researchers to freely perform their research experiments on the environment are fundamental for collaborative research in widely distributed environments. This demo will introduce an integration of an international Software-Defined Networking testbed (PRAGMA-ENT) and an Inter-Cloud platform (Virtual Cloud Provider) using a dynamic VLAN service (NSI). Using these services and infrastructures, we can dynamically design and deploy our own research testbed in the Inter-Cloud environment with an on-demand manner. In the talk, we present the overview of these services and introduce some applications on the testbed.

84
[PD02] Extending SDN Networks from Cloud-to-Edge using Virtual Private Networks with Peer-to-Peer Overlay Links
Ken Subratie Renato Figueiredo University of Florida
[email protected] [email protected]
Abstract
While solutions to many challenges posed by IoT lie at the network’s edge, they cannot forego services available in the cloud which has over a decade of research and engineering to be leveraged. To bridge this gap, hybrid approaches in networking that account for characteristics of both edge and cloud systems are necessary. On cloud data centers, significant progress has been made on applying Software Defined Networking (SDN) to address networking challenges such as scalability, addressing, virtualization, and traffic engineering; administrators are now well-versed at managing data center SDN deployments in enterprise systems. However, the applicability of SDN in edge networks has not yet been thoroughly investigated. I will demonstrate a hybrid system that incorporates SDN software switches and overlay networks to build a dynamic layer 2 virtual network connecting hosts across the edge (and in the cloud) with links that are peer-to-peer Internet tunnels. These tunnels are terminated as subordinate devices to SDN switches and seamlessly enable the traditional SDN functionalities such that cloud and edge resources can be aggregated.
85
[PD03] Analysis of Load Balancing Performance on Cluster Computing with PROXMOX VE
Andi Rasuna Darsono, Sri Chusri Haryanti, Faculty of Information Technology, Universitas YARSI, Indonesia
[email protected], [email protected]
Abstract
This research aims to examine the performance of load balancing for a cluster. Load balancing is a solution for a large access load and minimizes downtime in serving requests from users. Load balancing distributes loads of traffic evenly to the servers with particular algorithms. In this research, the server for load balancing cluster is implemented using LVS topology via direct routing and use round-robin algorithm on Proxmox VE for load balancing. Proxmox VE is in charge of dividing virtual resource servers into four virtual environments, two nodes as load balancing clusters and two nodes as web servers. The results of research conducted with loads of 250, 500 & 1000 users show that load balancing system reduces the maximum response time up to 4165 ms with 0% of packet loss, compared to utilization of single server with the maximum response time up to 7269 ms and 22.48% packet loss. The load balancing system for clusters also manages to failover with an average value of downtime 16.6 seconds.

86
[PD04] Performance Comparison of Load Balancing using Honeybee and Threshold Algorithm
Aditya Efrian, Sri Chusri Haryanti, Sri Puji Utami Atmoko, Ridho Yanevan Pratama Faculty of Information Technology, Universitas YARSI, Indonesia
[email protected] , [email protected] , [email protected] ,[email protected]
Abstract
Cloud computing is currently developing rapidly. Load balancing technique is very crucial to balance the load in the cloud. Load balancing is needed to distribute dynamic workload across resources in the cloud. CloudAnalyst can be used to simulate load balancing algorithm in cloud. One advantage of CloudAnalyst is it applies a GUI. We implement Honeybee and Threshold algorithms into CloudAnalyst. We examine Honeybee and Threshold algorithms implementation for Indonesian e-Health cloud model. There are 4 data center and 34 users based on the number of regions and provinces in Indonesia. Two data center selection policies are used, i.e. closest data center and optimized response time policy. The average response time is investigated for different user data sizes. The simulation result shows that Threshold algorithm gives average response time that is faster than the Honeybee. Nevertheless, Honeybee algorithm delivers better performance for data size smaller than 80 bytes, and Threshold algorithm tends to give smaller response time for data size 100 bytes.

87
[PD05] EDISON Data Platform for Computational Science Data
Jaesung Kim, Jeongcheol Lee, Sunil Ahn, Jongsuk Ruth Lee Korea Institute of Science Technology and Information (KISTI), Korea
{jskim0116, jclee, siahn, jsruthlee}@kisti.re.kr
Abstract
This paper demonstrates the EDISON-DATA platform, which provides a way to easily publish, preserve, share, and analyze computational science data. While the data is explosively generated from computational science field, research on a computational science platform that provides a way to utilize and analyze the data is still an early stage. One of the main issues in the computational science data platform is addressing the diversity and heterogeneity of data. Our platform provides customized pre-processing services by data type to extract metadata consistently and provides methods to analyze the metadata. Sharing and reusing computational science data can avoid duplication of calculation time and cost. In addition, it is also possible to obtain new knowledge by analyzing the constructed data through artificial intelligence methods. This platform was developed to support multi-disciplinary data. To test this platform's functionality and applicability, we select the computational science data in the material field as a pilot. We have constructed about 100,000 material simulation data on our platform. Based on this data, we will describe the platform's main functionalities such as data management, data analysis, and data property prediction service based on artificial intelligence.

88
[PD06] Web-based Compute-Data Research Environment for Aircraft Airfoil Aerodynamics
James Junghun Shin, Kumwon Cho, Jongsuk Ruth Lee Korea institute of Science and Technology Information (KISTI)
[email protected], [email protected], [email protected]
Abstract
Manufacturers in the aircraft industry need appropriate and efficient analysis frameworks to develop reliable wings their design and manufacturing stages. Particularly two dimensional airfoils are basic shape design elements in this technical area. In order to tackle the field technicians’ or engineers’ feeling difficulties on high performance computing simulation, then we developed a cyber-infrastructural and web-based research environment. The first notable point of this demo presentation is that a computer simulation environment was embodied in the web based framework. It includes some essential computing elements such as automatic mesh generation, airfoil shape parametrization, and high-fidelity flow solver. This framework enables simulation-runners not to install any software with easy access, and then complications were eliminated to consider computationally not professionally trained users who work in the manufacturing fields. One more remarkable point is that this framework employed machine learning driven tools for the aerodynamic performance inferences by machine learning techniques with training and testing the dataset from the high-fidelity flow simulations. The comparison between flow solver simulations and machine learning inferences showed that some methods ranked higher accuracy and others were not. It was concluded that this virtual airfoil research environment will help engineering designers and researchers conduct quicker decision and analysis.

89
[PD07] Mobile-based Augmented Reality for Sundanese Alphabets Education
Muhammad Reza Aditya, Resskytha Permata Sari, Adri Nursimarsiyan and Nova Eka Diana Informatics Department, Faculty of Information Technology, Universitas YARSI, Indonesia
[email protected], rereskytha@gmail, adrysiyan@gmail, [email protected]
Abstract
In 2017, the Indonesian Ministry of Higher Research and Education reported that the smartphone user in Indonesia had achieved about 25% of the total citizen or about 65 million people. This trend is beneficial to utilize smartphone for promoting traditional cultures in Indonesia, especially to the teenagers that are steadily moving forward to modern culture. This research aims to build an Android-based application with an augmented reality feature to enhance the experience of learning traditional Indonesian heritage, especially traditional alphabets. CARIOSAN is a mobile application with the purpose to preserve the Sundanese alphabets and prevent it from extinction. The main features in the application are AR-based Sundanese alphabets recognition, Rarangken information, Sundanese alphabets writing canvas, and quiz feature to assess user understanding of the Sundanese alphabets. We interviewed 35 respondents for measuring the usability, the easiness of use, the information coverage, the interface, and the novelty of the application. The results showed that the developed application was highly useful and interactive in providing the essential information of Sundanese alphabets although with a novelty score only above 50 percent.

90
[PD08] Tuberculosis (TB) Disease Interactive Map in Jakarta Capital Special Region
Nuraisah, Ummi Azizah Rachmawati Faculty of Information Technology, Universitas YARSI Jakarta
[email protected]; [email protected]
Abstract
Tuberculosis (TB) is a disease that is easily contagious and can attack various organs of the body, especially the lungs. This disease can cause complications to cause death for the sufferer if not appropriately treated. Currently, Indonesia is in the top six countries with the newest TB cases and is ranked second with the most cases of TB patients in the world. Prevention can be done, among others, by conducting regular visits to community homes to ensure that their place of residence has proper sanitation by established health standards. It is necessary to map problems in each region to ensure what diseases are now spreading in the area. This study aims to monitor Tuberculosis in the Special Capital Region of Jakarta, especially East Jakarta, by using interactive maps to facilitate the DKI Jakarta Health Office in monitoring the control of Tuberculosis for action and prevention. This research use SDLC methodology, which consisted of the stages of system analysis,system design, system implementation, and system testing. The data used is from the Health Service Office of Jakarta Region. This interactive map-based tuberculosis information system in the particular area of the capital Jakarta is a form of business that can help the community and is expected to be useful for its users.

91
[PD09] Neuro Data Platform for Neuroscientist
Nurul Hashimah Ahamed Hassain Malim1, Jafri Malin Abdullah2, , Sharifah Aida Sheikh Ibrahim2, Nurfaten Hamzah2, Muhammad Jaziem Mohamad Javeed1, Ariffin Marzuki3, Putra
Sumari1, Ahamad Tajudin Khader1 1School of Computer Sciences, Universiti Sains Malaysia
2Department of Neurosciences, School of Medical Sciences, Universiti Sains Malaysia 3Hospital Universiti Sains Malaysia
[email protected], [email protected]
Abstract
The University hospital (namely Hospital Universiti Sains Malaysia) holds a large collections of Neuroimaging data from various neuroimaging machines. A collaborative effort on compiling and making use of these data work was initiated by a centre called P3Neuro (now is part of Department of Neurosciences, School of Medical Sciences) where the School of Computer Sciences was engaged to develop a platform that is not only aimed at hosting the data but also to develop potential tailored diagnostic tools that could help the medical practitioners in their diagnosis decision makings. Since August 2017, the collaborative project has achieved its first two milestones i.e. data pre-processing pipeline and initial data storage and retrieval mechanism. Whilst, there is still a long way to go, this demo is intended to present the updates on on-going data pre-processing pipeline and also the initial data storage schema. This is followed by the next phase planning on the analytics and visualization of these data.

92
[PD10] Deep Learning Classification for Liver Disease
Andi Batari Ahmad and Nova Eka Diana Informatics Department, Faculty of Information Technology, Universitas YARSI, Jakarta,
Indonesia [email protected], [email protected]
Abstract
Liver disease is one of the top ten diseases with the highest mortality rate in Indonesia, with the increasing rate of one percent per year. Type of liver disease most attacking Indonesian people is Hepatitis. According to Basic Health Research (Riskesdas) 2013, Hepatitis had a prevalence number of 1.2 percent that was double than the prevalence in 2007. There are some methods to diagnose the liver disease such as enzymes pattern analysis, excretion, metabolism, electrophoresis and serologic test. This research focused on diagnosing the liver disease based on enzymes pattern using Deep Learning approach. We used Indian Liver Patient Dataset (ILPD) from UCI Machine Learning Repository with a total of 583 data (416 positives and 167 negatives) to build the classification model, with the training and testing rate of 0.7 and 0.3, respectively. We conducted a preprocessing step for the training data using Synthetic Minority Over-sampling Technique (SMOTE) with the percentage rate of 0.5 to balance the positive and negative class. Experiment results reveal that the created model can classify liver disease with the accuracy, sensitivity, and specificity rate of 0.89882, 0.84, and 0.9225 percent, respectively.

93
PROGRAMME COMMITTEES
Patrons
Prof. Dr. Ahamad Tajudin Khader Dean, School of Computer Sciences, Universiti Sains Malaysia
Prof. Dr. Rosni Abdullah Director, NAV6, Universiti Sains Malaysia
Prof. Dr. Mohd Nazalan Mohd Najimudin Director, Nexus-Sciences, Universiti Sains Malaysia
Prof. Dr. Habibah Abdul Wahab PRAGMA Steering Committee-Malaysia
Dr. Peter Azberger Founding and Former Chair, PRAGMA Steering Committee
Chairs Dr. Nurul Hashimah Ahamed Hassain Malim School of Computer Science, Universiti Sains Malaysia & PRAGMA Member
Shava Smallen PRAGMA Interim co-chair, University of California, San Diego, USA
Co-chairs Dr. Gan Keng Hoon School of Computer Sciences, Universiti Sains Malaysia
Dr. Jongsuk (Ruth) Lee National Supercomputing Division, Korea Institute of Science and Technology Information (KISTI)
Secretary Mdm. Eliza Yasmin Dahlan
Treasurer Mr. Ahmad Anas Ismail Dr. Zarul Fitri Zaaba
PRAGMA 35 Program Committees
Prof. Renato Fuigeredo, University of Florida, USA Prof. Shinji Shimojo, Osaka University, Japan Prof. David Abramson, University of Queensland, Australia Prof. Heru Suhartanto, Universitas Indonesia, Indonesia Assoc. Prof. Kohei Ichikawa, National Institute of Advanced Industrial Science and Technology (AIST), Japan Assoc Prof. Putchong Uthayopas, Kasetsart University, Thailand Nadya Williams, University of California, San Diego, USA Dr. Jason Haga, National Institute of Advanced Industrial Science and Technology (AIST), Japan Dr. Ryousei Takano, National Institute of Advanced Industrial Science and Technology (AIST), Japan Dr. Yoshiyuki Kido, Osaka University, Japan Dr. Fang Pang Lin, National Center for High Performance Computing, Taiwan Dr. Prapaporn Rattanatamrong, Thammasat University, Thailand Hsiu-Mei Chou, National Center for High Performance Computing, Taiwan Aimee Stewart, KU Biodiversity Institute, USA Weicheng Huang, National Applied Research Laboratories, Taiwan Wassapon Watanakeesuntorn, Nara Institute of Science and Technology, Japan

94
Big Data Summit 2 Committees
Assoc. Prof. Dr. Bahari Belaton Assoc. Prof. Dr. Chan Huah Yong Dr. Mohd Heikal Husin Dr. Nur Syibrah Mohd Naim Dr. Mohd Nadhir Ab Wahab Dr. Anusha Achuthan Dr. Mohamed F.R Anbar Dr. Azleena Mohd Kassim Dr. Mohd Halim Mohd Noor Dr. Chew Xin Ying Mr. Mohd Azam Osman Mr. Iznan Husainy Hasbullah Mdm. Zuhaida Ariffin Mr. Mohamed Azahar Mustapha Mr. Muhamad Hadzri Yaakop Mdm. Nor Aida Lob Abu Bakar Mdm. Sheela Muniandy Mdm. Halizah Abdul Razak Mdm. Nurul Nadiah Zambri Mdm. Nur Sadrina Abd Rahim Mdm. Rohana Omar Mdm. Badriyah Che May Mdm. Siti Zainura Abdul Kadir Mr. Shik Abdulla Mohamed Ali Mr. Ruslan Ahmad Mr. Ramlee Yahaya Mr. Mohamad Tarmizi Hat Mr. Jasmi Chek Isa
Technical Reviewers
Dr. Nurul Hashimah Ahamed Hassain Malim, USM Dr. Shankar Karuppayah, USM Dr. Wong Li Pei, USM Dr. Tan Choo Jun, WOU Dr. Sarina Sulaiman, UTM Dr. Jasy Liew Suet Yan, USM Mr. Mohd Azam Osman, USM Dr. Fadratul Hafinaz Hassan, USM Assoc. Prof. Dr. Zalinda Othman, UKM Dr. Chew Xin Ying, USM Dr. Liew Chee Sun, UM Dr. Suraya Alias, UMS Dr. Mohammed F. R. Anbar, USM Prof. Dr. Khong Kok Wei, Nottingham University Dr. Nor Asilah Wati Abdul Hamid, UPM Dr. Umi Kalsom Yusof, USM
Dr Syaheerah Lebai Lutfi, USM Dr. Gan Keng Hoon, USM Dr. Tan Tien Ping, USM Dr. Nur Syibrah Muhamad Naim, USM Dr. Anusha Achuthan, USM Assoc. Prof. Dr. Cheah Yu-N, USM Dr. Nur Hana Samsudin, USM

95
PARTNERS & SPONSORS
Partners
Sponsors
Diamond Gold
Silver
Other sponsors

96
PERSONAL NOTES

97