Embed Size (px)
Citation preview
Institute of Business and Economic Research
Fisher Center for Real Estate and Urban Economics
PROGRAM ON HOUSING AND URBAN POLICY WORKING PAPER SERIES
UNIVERSITY OF CALIFORNIA, BERKELEY
These papers are preliminary in nature: their purpose is to stimulate discussion and comment. Therefore, they are not to be cited or quoted in any publication without the express permission of the author.
WORKING PAPER NO. W04-007
THE CURIOUS INSTITUTION OFMOBILE HOME RENT CONTROL
By
Carl Mason John M. Quigley
December 2006
1
2
3
4
56
78
9
10
11
12
13
14
15
16
17
18
1920
JOURNAL OF
YJHEC 1269 No. of Pages 20, Model 1+
30 May 2007 Disk Used
Journal of Housing Economics xxx (2006) xxx–xxx
www.elsevier.com/locate/jhe
HOUSINGECONOMICS
RO
OFThe curious institution of mobile home
rent control q,qq
Carl Mason a, John M. Quigley b,*
a Department of Demography, University of California, Berkeley, CA, USAb Department of Economics, University of California, Berkeley, CA, USA
Received 14 August 2006
PREC
TEDAbstract
This paper analyzes the implications of rent control as applied to dwellings located in mobilehome parks. This form of regulation differs from apartment rent control in that: it is applied selec-tively to a small portion of the housing stock, and; it regulates the site rents paid to the park owner,not the selling prices or monthly rents on mobile homes. We present a detailed case study of theeffects of this institution in three mobile home parks in different cities and regions in California, doc-umenting the capitalization of regulatory rules into the selling prices of housing, and raising ques-tions about the legality as well as the efficacy of the institution.� 2007 Published by Elsevier Inc.
JEL classification: L51; K2; L85
Keyword: Capitalization
UN
CO
R
1051-1377/$ - see front matter � 2007 Published by Elsevier Inc.
doi:10.1016/j.jhe.2007.04.002
q A previous version of this paper was presented at the WRSA Annual Meetings in Santa Fe, NM, February2006 and at the CCER Conference on Real Estate and the Macroeconomy, Beijing, PRC, July 2006.qq The research on which this paper is based benefited from the comments of Mark Alpert, James Brabant,David Bradford, William Dahlin, Ellen Kelleher, Paul Regan, Lisa Scruggs, Elizabeth Seifel, Benjamin Weinberg,and anonymous reviewers. However, the authors alone are responsible for interpretations and conclusions. Weare grateful for data supplied by Marguerite Nader, John Neet, and Peter Underhill and for the assistance ofSarah Dunn.
* Corresponding author.E-mail addresses: [email protected] (C. Mason), [email protected] (J.M. Quigley).
Please cite this article in press as: Mason, C., Quigley, J.M., The curious institution of mobilehome ..., J. Housing Econ. (2007), doi:10.1016/j.jhe.2007.04.002
21
22
23
24
25
26
27
28
29
30
31
32
33
34
35
36
37
38
39
40
41
42
43
44
45
46
47
48
49
50
51
52
53
54
55
56
57
58
59
2 C. Mason, J.M. Quigley / Journal of Housing Economics xxx (2006) xxx–xxx
YJHEC 1269 No. of Pages 20, Model 1+
30 May 2007 Disk Used
1. Introduction
Although economists disagree on many things, there seems to be a clear consensuswithin the dismal science on the effects of rent control: these regulations lead to reductionsin the quality and quantity of housing available to consumers (Alston et al., 1992). Recentscholarly work (e.g., Turner and Malpezzi, 2003) only reinforces the survey of opinionsreported by Alston et al. a decade earlier. Arbitrarily fixing rents below their market-clear-ing levels throughout a housing market induces three kinds of economic effects:
First, those tenants who manage to locate and occupy rent-controlled dwelling unitsclearly benefit. However, these benefits are typically not distributed to those whom policymakers intend to help. ‘‘Lucky’’ consumers, disproportionately long-term residents andthose with connections within the local real estate market, benefit at the expense of newhouseholds and migrants from other regions (Basu and Emerson, 2000). The capriciousdistribution of benefits means that dwellings are not allocated to those who value themthe most.1
Second, housing suppliers see the economic value of their properties decline, and theyreact by reducing maintenance expenditures. Other potential suppliers of housing investtheir capital elsewhere; the incentive to invest capital to produce new housing is inexorablyreduced. Reduced supply makes housing more difficult to obtain, and it makes alternativehousing more costly. These costs are borne diffusely by consumers at large. When supply isreduced, the individuals who would have resided locally choose other towns or regions.And those who do live locally face higher costs because housing is scarce.
Third, artificially low rents lead to excess demand for housing, to the hoarding of rent-controlled units, and to reduced household mobility. The popular literature is replete withanecdotes describing how rent control leads to housing which is hoarded by the ‘‘wrong’’people.2
We analyze the economics of rent control when these regulations are applied to mobilehomes or manufactured housing located in mobile home parks. These price controls arecommon in several states, notably California (where 95 cities and 10 counties have someform of mobile home rent control). These regulations mandate a base rent which is oftenpermitted to increase over time according to some formula (typically linked to variationsin the consumer price index). California state law mandates that apartment rent controlordinances allow owners to set new rents at the start of a new tenancy. This state mandatehowever, exempts mobile home rent control from the vacancy decontrol provision. Con-sequently, 46% of mobile home rent control ordinances in California do not permit anyrent increase with new tenancies.3 All three mobile home parks in our data set, describedbelow, are in such jurisdictions.
In Section 2 below we outline the salient characteristics of these regulations in compar-ison with rent control imposed on apartment buildings. The principal issue noted in Sec-tion 2 is the potential for the capitalization of any rent reductions mandated by the rent
1 Glaeser and Luttmer (1997, 2003) emphasize that these social costs are quite large.2 See Glaeser (1996). For example, the journalist Auletta (1979) describes the ‘‘Tobacconist to the World’’ Nat
Sherman who rented a six room apartment on Central Park West at the controlled rent of $335 a month. Shermansaid of the apartment, ‘‘it happens to be used so little that I think [the rent] is fair.’’ This choice dwelling wasallocated to someone who valued it so little that it was worth no more to him than its low regulated cost.
3 Telephone conversation with Dave Evans, Western Mobile Home Communities Association, June 1, 2006.
Please cite this article in press as: Mason, C., Quigley, J.M., The curious institution of mobilehome ..., J. Housing Econ. (2007), doi:10.1016/j.jhe.2007.04.002
60
61
62
63
64
65
66
67
68
69
70
71
72
73
74
75
76
77
78
79
80
81
82
83
84
85
86
87
88
89
90
91
92
93
94
95
96
97
98
99
100
C. Mason, J.M. Quigley / Journal of Housing Economics xxx (2006) xxx–xxx 3
YJHEC 1269 No. of Pages 20, Model 1+
30 May 2007 Disk Used
NC
OR
REC
TED
PR
OO
F
control regulations with vacancy control. Section 3 provides a detailed case study evalu-ating rent control regulations in three mobile home parks in three different cities andregions in California. Section 4 is a brief conclusion.
2. Apartment rent control and mobile home rent control
There are two important differences in the institution of rent control when it is selec-tively applied to manufactured housing in mobile home parks rather than apartments.
First, the rent control regulations are imposed on only a small portion of the local housingmarket, namely those dwellings in mobile home parks. Prices in the larger housing marketare set by supply and demand, not by regulation, and units in mobile home parks competewith apartments, condominiums, and owner-occupied dwellings whose prices are unregu-lated. This distinction is crucial in evaluating the economic consequences of the regulations.
Second, the form of the price control differs between apartment regulation and mobilehome regulation, reflecting the divided ownership of mobile home living space. The ownerof a manufactured housing unit or a mobile home typically owns only the dwelling, whileshe rents a site in a mobile home park on which the coach is situated. This separation ofownership ensures that the cost of residing in a mobile home depends, not only upon theeconomic value of the structure, but also upon the site rent charged by the owner of themobile home park. When rent control is applied to a mobile home park, the regulatedprice applies only to the site on which the manufactured home is placed. Under ‘‘vacancycontrol,’’ the right to rent the site at this regulated price is transferred to the incoming res-ident when the mobile home is sold.
These two factors, the divided ownership of land and structure and the imposition ofrent regulation on only a small fraction of the local housing market, have important impli-cations for the economic consequences of rent regulation as applied to manufacturedhomes in mobile home parks.
The fact that mobile homes are usually a small portion of the local housing marketmeans that rent control rules have little or no impact on the level of regional housingprices. As price takers, the owner occupants of mobile homes sell their units at market-determined prices—prices that reflect the operation of supply and demand across a largenumber of substitutable dwellings. If there is an increase in demand for housing in a localmarket, there will be upward pressure: on mobile home prices as well as the prices of con-dominiums; on the prices of owner-occupied housing as well as apartments. The fact ofdivided ownership also implies that the right to occupy a mobile home site at a regulatedrent in a mobile home park may have intrinsic economic value. A dwelling owned by aresident is affixed to land rented under well-defined terms from another entity, the mobilehome park owner. If the site is rented under a ‘‘vacancy control’’ regulatory environmentand if the prices that potential new renters would willingly pay are above the regulatedrent, then the right to occupy the site will certainly be valuable. Analogous variations inthe intrinsic value of rental contracts arise quite routinely in the commercial real estatemarket when assignable leases for fixed terms at below-market rents are transferred amongtenants in return for economic considerations.4
U4 Within the housing market, the capitalization of contractual terms is not uncommon either. For example, ithas been found that the favorable terms of assumable mortgages at below-market interest rates are capitalizedinto the selling prices of single family houses (see, for example, Durning and Quigley, 1985).
Please cite this article in press as: Mason, C., Quigley, J.M., The curious institution of mobilehome ..., J. Housing Econ. (2007), doi:10.1016/j.jhe.2007.04.002
101
102
103
104
105
106
107
108
109
110
111
112
113
114
115
116
117
118
119
120
121
122
123
124
125
126
127
128
129
130
131
132
133
134
135
136
137
138
139
140
141
4 C. Mason, J.M. Quigley / Journal of Housing Economics xxx (2006) xxx–xxx
YJHEC 1269 No. of Pages 20, Model 1+
30 May 2007 Disk Used
In the mobile home market, transfer of the lease for site rental is accomplished onlywhen the dwelling is sold by one resident to another. The tied sale of the coach togetherwith the right to occupy a site is analytically equivalent to the transfer of rental rightstogether with a payment of ‘‘key money’’ in apartment rent control.5 These tied transac-tions are invariably illegal under rent control ordinances adopted for apartments, but tiedtransactions are inevitable under mobile home rent control ordinances.
This perspective on mobile home rent control is very difficult to reconcile with the sta-ted objectives of the rent control ordinances adopted by many local jurisdictions. Indeed,capitalization makes it logically impossible for rent control with vacancy control toincrease ‘‘affordability of housing’’ at the time of enactment or any time in the future.
Other related objectives are sometimes invoked by local jurisdictions enacting mobilehome rent control.6 Consider for example, the broadly related objective of ‘‘increasingthe supply of housing that is affordable’’ to middle income households. With capitaliza-tion, the tied sale of a regulated rent contract and a physical structure completely frus-trates the attempt to achieve this objective through rent control on mobile homes. In acompetitive market, individuals selling manufactured homes are price takers, chargingthe market price for the structure and the rental contract they offer in a tied sale. The smallnumber of mobile home sellers in the large market for housing services will thus obtain thefull benefit of any reduced rents mandated by the regulation. The cost of housing to sub-sequent consumers is completely unaffected by the rent regulation, and housing is no more‘‘affordable’’ afterwards than it was before the ordinance was adopted. In the limit, all thebenefits are enjoyed by the lucky people who were mobile home owners at the time theordinance was enacted.
Consider the objective of remedying a ‘‘shortage of manufactured home park space’’relative to its demand. Sometimes this objective is characterized as remedying a conditionof ‘‘low vacancy rates’’ in mobile home parks. The regulation of rents which can becharged by park owners can hardly further these objectives. Housing suppliers competein the market for housing services, but also in the market for capital. Price regulation dis-courages the investment of capital in supplying mobile home parks. Indeed, it is hard toimagine that the imposition of price controls would have any impact on mobile home parkspace, except to reduce the amount of available space. When price goes down, demandincreases, and supply decreases.
Consider the broader objectives of protecting tenants because of the ‘‘difficulty andexpense of relocating’’ their manufactured homes or of ‘‘facilitating fair bargainingbetween landlords and tenants’’ in mobile home parks. If the owners of mobile homeparks were able to exert market power to extract higher prices from tenants, then the pro-tection of consumers from monopoly power would justify a variety of regulations.
But mobile home park owners compete broadly in the market for housing services, notnarrowly in a market defined as the renting of mobile home spaces to consumers whoalready own mobile homes. Consumers freely choose among types and quantities of hous-ing, and no consumer is compelled to reside in one form of housing or another.
5 In apartment rent control, ‘‘key money’’ is typically paid to the landlord or her agent, while in mobile homerent control the value of the regulated site rent is paid to the vacating tenant. Analytically this makes nodifference.
6 The related objectives discussed below are noted in the preamble to rent control ordinances adopted in anumber of cities in California.
Please cite this article in press as: Mason, C., Quigley, J.M., The curious institution of mobilehome ..., J. Housing Econ. (2007), doi:10.1016/j.jhe.2007.04.002
142
143
144
145
146
147
148
149
150
151
152
153
154
155
156
157
158
159
160
161
162
163
164
165
166
167
168
169
170
171
172
173
174
175
176
177
178
179
180
181
182
183
184
185
C. Mason, J.M. Quigley / Journal of Housing Economics xxx (2006) xxx–xxx 5
YJHEC 1269 No. of Pages 20, Model 1+
30 May 2007 Disk Used
UN
CO
RR
EC
TED
PR
OO
F
Nevertheless, in choosing housing accommodations, transactions and moving costs arecertainly relevant, and these costs are unquestionably higher for those consumers whoalready own mobile homes. It may seem that a mobile home park owner could behaveas a monopolist when bargaining with a tenant once that tenant’s manufactured homehas been placed in the owner’s park. It may seem that the park owner could increase rentssubsequently to extract any equity the coach owner had developed—for example, byowner investments in landscaping, in carports, and accessories. As a monopolist, the parkowner could increase rents above the market level, up to the considerable cost of movingthe dwelling to another site.
But consider the implications of this behavior for the economic health of the parkowner. The consequences of engaging in this activity could be observed quite easily—byother owners of mobile homes in the park, but also by other housing consumers in theregion. The overwhelming majority of these other consumers are not currently ownersof manufactured housing. If these consumers observed this form of rent gouging by thepark owner, they would be far less likely to choose a mobile home as a form of housing.Those who did choose this form of shelter would be far less likely to locate in the parkowned by the rent gouger. Together, these reactions would increase the vacancy rates inthe park, and the forces of competition between owners of the mobile home parks andother suppliers of housing services would make this form of rent gouging behavior unprof-itable. Indeed, if fears of rent gauging were wide-spread, we should expect that the dom-inant type of mobile home contract would be the long-term lease. Although long-termleases are written in the mobile home market, they are not the usual form of contract.
Notwithstanding the issue of price regulation in mobile home parks, rent control is cer-tainly not the only regulatory issue affecting mobile homes, certainly not in California.Wide-spread prohibitions against the development of new mobile home parks arisebecause planners and localities can often exercise great latitude in excluding new housingappropriate to low and moderate income households (see Quigley, 2006, for a detaileddiscussion).
3. Empirical analysis of mobile home rent control
3.1. Preliminaries
There is only limited empirical evidence on the economics of mobile home rent control,but the fragmentary evidence is consistent with the reasoning described above. For exam-ple, there is weak evidence that, ceteris paribus, the average selling prices of mobile homesare higher in jurisdictions which have imposed mobile home rent control (Hirsch, 1998).There is also evidence that the supply of mobile homes declines with the imposition ofmobile home rent control. This evidence is based upon variations in shipments of newmobile homes to California during 1977–1992 as the mobile home regulatory environmentvaried (see Hirsch and Rufolo, 1999).
In this paper, we present new evidence based on a detailed case study analyzing the eco-nomic consequences of mobile home rent control in three mobile home parks in three dif-ferent cities and regions in California. The locations chosen, Marin County, SantaBarbara County, and San Diego County, contain both breathtakingly high priced housingand more modest accommodations. Site rentals in these mobile home parks are regulatedunder a system of ‘‘vacancy control’’ rules imposed by the cities. These rules fixed rents on
Please cite this article in press as: Mason, C., Quigley, J.M., The curious institution of mobilehome ..., J. Housing Econ. (2007), doi:10.1016/j.jhe.2007.04.002
186
187
188
189
190
191
192
193
194
195
196
197
198
199
200
201
202
203
204
205
206
207
208
209
210
211
212
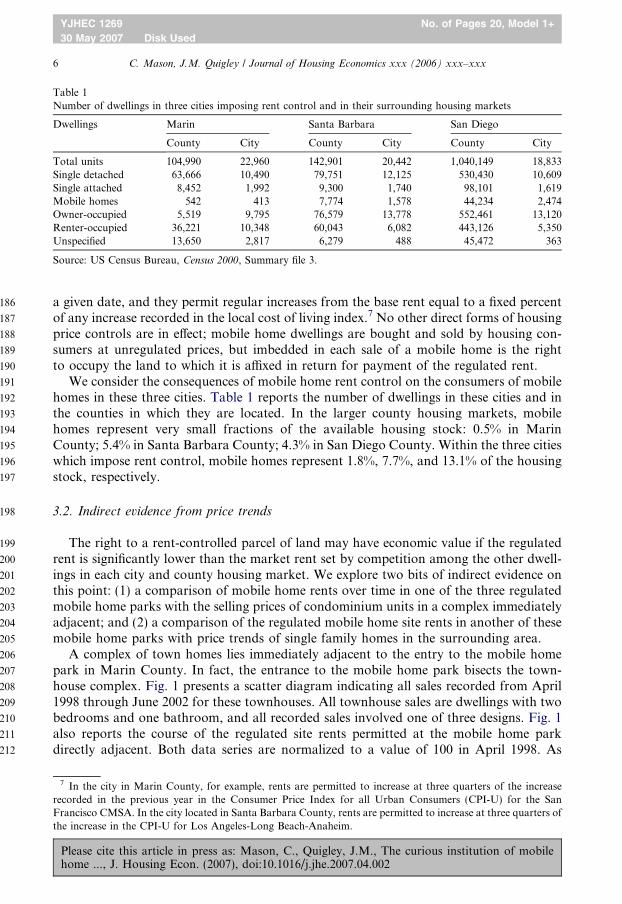
Table 1Number of dwellings in three cities imposing rent control and in their surrounding housing markets
Dwellings Marin Santa Barbara San Diego
County City County City County City
Total units 104,990 22,960 142,901 20,442 1,040,149 18,833Single detached 63,666 10,490 79,751 12,125 530,430 10,609Single attached 8,452 1,992 9,300 1,740 98,101 1,619Mobile homes 542 413 7,774 1,578 44,234 2,474Owner-occupied 5,519 9,795 76,579 13,778 552,461 13,120Renter-occupied 36,221 10,348 60,043 6,082 443,126 5,350Unspecified 13,650 2,817 6,279 488 45,472 363
Source: US Census Bureau, Census 2000, Summary file 3.
6 C. Mason, J.M. Quigley / Journal of Housing Economics xxx (2006) xxx–xxx
YJHEC 1269 No. of Pages 20, Model 1+
30 May 2007 Disk Used
a given date, and they permit regular increases from the base rent equal to a fixed percentof any increase recorded in the local cost of living index.7 No other direct forms of housingprice controls are in effect; mobile home dwellings are bought and sold by housing con-sumers at unregulated prices, but imbedded in each sale of a mobile home is the rightto occupy the land to which it is affixed in return for payment of the regulated rent.
We consider the consequences of mobile home rent control on the consumers of mobilehomes in these three cities. Table 1 reports the number of dwellings in these cities and inthe counties in which they are located. In the larger county housing markets, mobilehomes represent very small fractions of the available housing stock: 0.5% in MarinCounty; 5.4% in Santa Barbara County; 4.3% in San Diego County. Within the three citieswhich impose rent control, mobile homes represent 1.8%, 7.7%, and 13.1% of the housingstock, respectively.
3.2. Indirect evidence from price trends
The right to a rent-controlled parcel of land may have economic value if the regulatedrent is significantly lower than the market rent set by competition among the other dwell-ings in each city and county housing market. We explore two bits of indirect evidence onthis point: (1) a comparison of mobile home rents over time in one of the three regulatedmobile home parks with the selling prices of condominium units in a complex immediatelyadjacent; and (2) a comparison of the regulated mobile home site rents in another of thesemobile home parks with price trends of single family homes in the surrounding area.
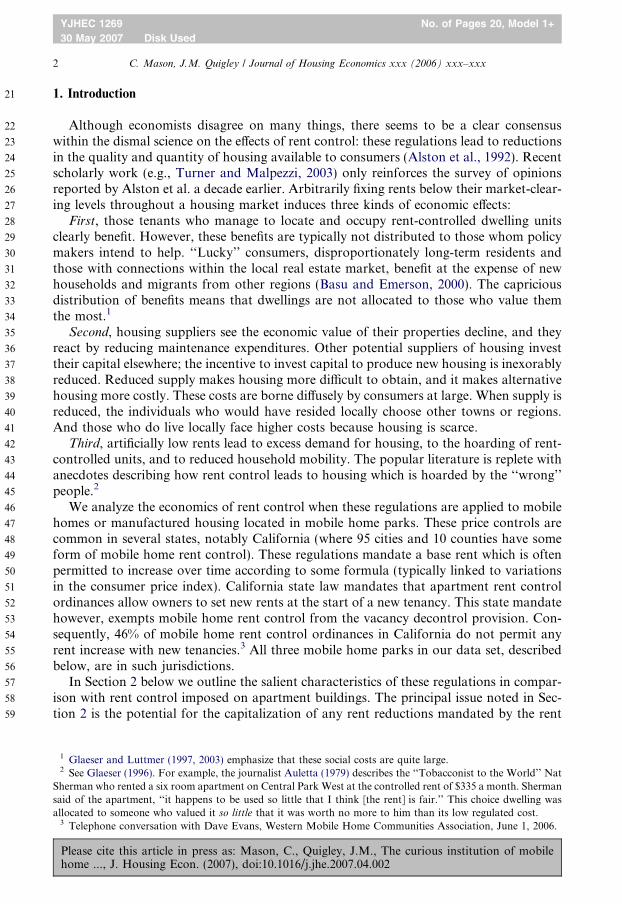
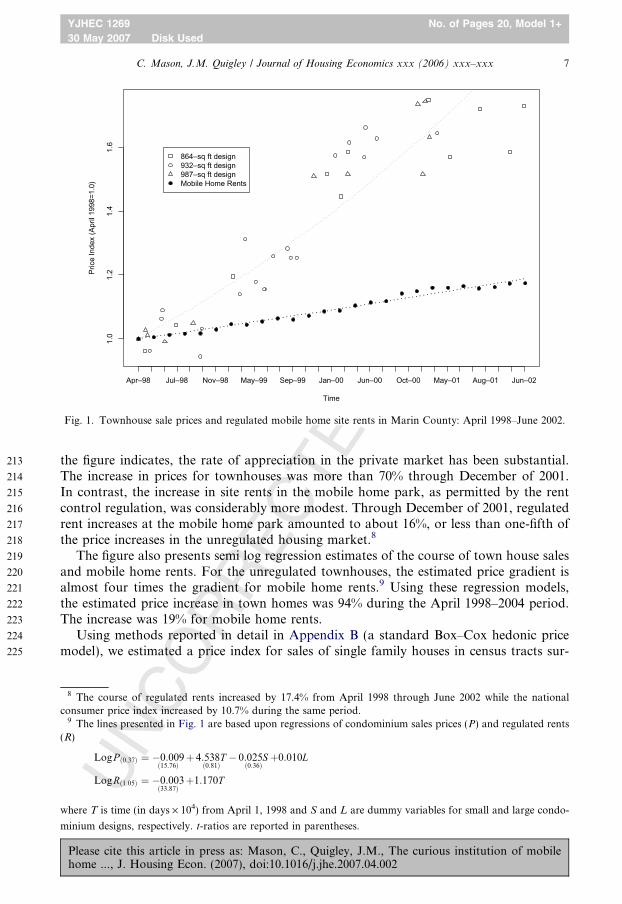
A complex of town homes lies immediately adjacent to the entry to the mobile homepark in Marin County. In fact, the entrance to the mobile home park bisects the town-house complex. Fig. 1 presents a scatter diagram indicating all sales recorded from April1998 through June 2002 for these townhouses. All townhouse sales are dwellings with twobedrooms and one bathroom, and all recorded sales involved one of three designs. Fig. 1also reports the course of the regulated site rents permitted at the mobile home parkdirectly adjacent. Both data series are normalized to a value of 100 in April 1998. As
7 In the city in Marin County, for example, rents are permitted to increase at three quarters of the increaserecorded in the previous year in the Consumer Price Index for all Urban Consumers (CPI-U) for the SanFrancisco CMSA. In the city located in Santa Barbara County, rents are permitted to increase at three quarters ofthe increase in the CPI-U for Los Angeles-Long Beach-Anaheim.
Please cite this article in press as: Mason, C., Quigley, J.M., The curious institution of mobilehome ..., J. Housing Econ. (2007), doi:10.1016/j.jhe.2007.04.002
DPR
OO
F213
214
215
216
217
218
219
220
221
222
223
224
225
1.0
1.2
1.4
1.6
Time
Pric
e In
dex
(Apr
il 19
98=1
.0)
Apr—98 Jul—98 Nov—98 May—99 Sep—99 Jan—00 Jun—00 Oct—00 May—01 Aug—01 Jun—02
864—sq ft design932—sq ft design987—sq ft designMobile Home Rents
Fig. 1. Townhouse sale prices and regulated mobile home site rents in Marin County: April 1998–June 2002.
C. Mason, J.M. Quigley / Journal of Housing Economics xxx (2006) xxx–xxx 7
YJHEC 1269 No. of Pages 20, Model 1+
30 May 2007 Disk Used
RR
EC
TEthe figure indicates, the rate of appreciation in the private market has been substantial.
The increase in prices for townhouses was more than 70% through December of 2001.In contrast, the increase in site rents in the mobile home park, as permitted by the rentcontrol regulation, was considerably more modest. Through December of 2001, regulatedrent increases at the mobile home park amounted to about 16%, or less than one-fifth ofthe price increases in the unregulated housing market.8
The figure also presents semi log regression estimates of the course of town house salesand mobile home rents. For the unregulated townhouses, the estimated price gradient isalmost four times the gradient for mobile home rents.9 Using these regression models,the estimated price increase in town homes was 94% during the April 1998–2004 period.The increase was 19% for mobile home rents.
Using methods reported in detail in Appendix B (a standard Box–Cox hedonic pricemodel), we estimated a price index for sales of single family houses in census tracts sur-
UN
CO
8 The course of regulated rents increased by 17.4% from April 1998 through June 2002 while the nationalconsumer price index increased by 10.7% during the same period.
9 The lines presented in Fig. 1 are based upon regressions of condominium sales prices (P) and regulated rents(R)
LogP ð0:37Þ ¼ �0:009ð15:76Þ
þ 4:538Tð0:81Þ
� 0:025Sð0:36Þ
þ0:010L
LogRð1:05Þ ¼ �0:003ð33:87Þ
þ1:170T
where T is time (in days · 104) from April 1, 1998 and S and L are dummy variables for small and large condo-
minium designs, respectively. t-ratios are reported in parentheses.
Please cite this article in press as: Mason, C., Quigley, J.M., The curious institution of mobilehome ..., J. Housing Econ. (2007), doi:10.1016/j.jhe.2007.04.002
226
227
228
229
230
231
232
233
234
235
236
237
238
1.0
1.5
2.0
2.5
Time
Pric
e In
dex
(Jan
199
5=1.
0)
Estimated land values in neighborhoodRegulated mobile home site rents
Jan—1995 Jun—1996 Jan—1997 Jun—1998 Jan—1999 Jun—2000 Jan—2001 Jun—2002 Jan—2003 Jun—2004
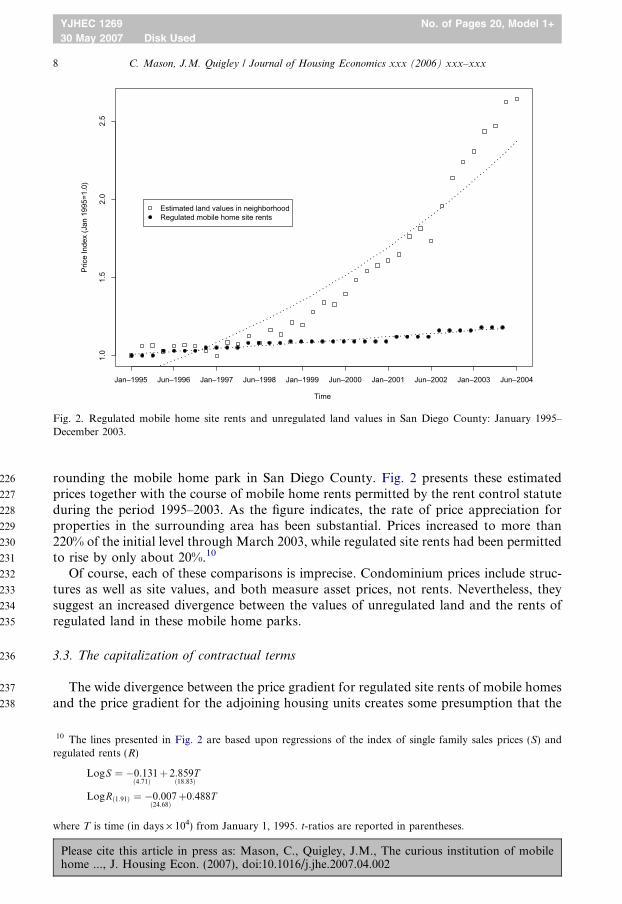
Fig. 2. Regulated mobile home site rents and unregulated land values in San Diego County: January 1995–December 2003.
8 C. Mason, J.M. Quigley / Journal of Housing Economics xxx (2006) xxx–xxx
YJHEC 1269 No. of Pages 20, Model 1+
30 May 2007 Disk Used
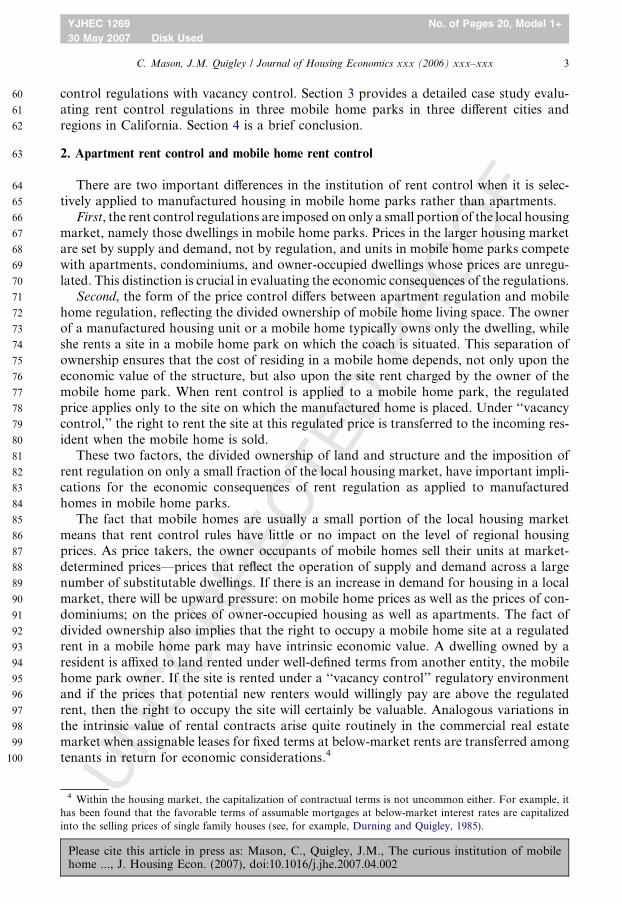
rounding the mobile home park in San Diego County. Fig. 2 presents these estimatedprices together with the course of mobile home rents permitted by the rent control statuteduring the period 1995–2003. As the figure indicates, the rate of price appreciation forproperties in the surrounding area has been substantial. Prices increased to more than220% of the initial level through March 2003, while regulated site rents had been permittedto rise by only about 20%.10
Of course, each of these comparisons is imprecise. Condominium prices include struc-tures as well as site values, and both measure asset prices, not rents. Nevertheless, theysuggest an increased divergence between the values of unregulated land and the rents ofregulated land in these mobile home parks.
3.3. The capitalization of contractual terms
The wide divergence between the price gradient for regulated site rents of mobile homesand the price gradient for the adjoining housing units creates some presumption that the
10 The lines presented in Fig. 2 are based upon regressions of the index of single family sales prices (S) andregulated rents (R)
LogS ¼ �0:131ð4:71Þ
þ 2:859Tð18:83Þ
LogRð1:91Þ ¼ �0:007ð24:68Þ
þ0:488T
where T is time (in days · 104) from January 1, 1995. t-ratios are reported in parentheses.
Please cite this article in press as: Mason, C., Quigley, J.M., The curious institution of mobilehome ..., J. Housing Econ. (2007), doi:10.1016/j.jhe.2007.04.002
239
240
241
242
243
244245
247247
248
249
250251253253
254
255
256
257
258
260260
261
262
264264
265
266
267
268
269
270
271
272
273274276276
277
278
279
280
281
282
283
285285
286287289289
C. Mason, J.M. Quigley / Journal of Housing Economics xxx (2006) xxx–xxx 9
YJHEC 1269 No. of Pages 20, Model 1+
30 May 2007 Disk Used
UN
CO
RR
EC
TED
PR
OO
F
favorable terms enjoyed by current mobile home owners will be capitalized, in some part,into the selling prices of mobile homes. The comparison of sale prices for single familyhomes not subject to rent control reinforces this presumption.
To analyze the capitalization of contractual terms, we need only to note the linkbetween the flow of the benefits of occupancy and the value of the stock. Recall thatthe value, V, of property yielding an annual return, R, in perpetuity is
V ¼ Rð1þ iÞ þ
R
ð1þ iÞ2þ � � � þ R
ð1þ iÞ1 ¼ ð1=iÞR; ð1Þ
where i is the interest rate.Suppose that rents are expected to remain constant; then from (1), the annual rent on
property value at V is
R ¼ iV : ð2ÞThis formulation emphasizes i as the ‘‘user cost of capital,’’ the annual cost of using onedollar’s worth of real property.
The sale of a single family home at the price of Vs, implies the transfer of a structurewith a value of Ss and the right to use, and to dispose of, a plot land with market valueof L.
V s ¼ Ss þ L: ð3ÞFrom Eq. (2) the annual cost of occupancy of a property valued at Vs, the implicit rent,
Rs, consists of two parts,
Rs ¼ iV s ¼ iSs þ iL; ð4Þthe user cost of the structure, iSs, and the market rental rate of the lot on which the struc-ture is built, iL. In contrast, when we observe the sale of a mobile home under rent controlat a price of Vm, it consists of the transfer of a coach with the value of Sm and the right touse a plot under specified conditions. Under vacancy control price regulation, the pur-chaser receives the right to rent the site upon which the mobile home is placed in returnfor some regulated annual rent of Q. The purchaser also enjoys the opportunity to transferthat right by selling the mobile home to a subsequent purchaser. In general, the annualbenefit of holding this right is the difference between the market rent for the lot (iL)and the regulated rent, Q, paid to the park owner,
rZ ¼ iL� Q: ð5ÞEquation (5) relates the annual benefit of controlled rent to the annual cost, rZ, of that
right. In Eq. (5), r represents the interest rate at which the mobile home buyer can financeher purchase, and Z represents the cost of acquiring the right to occupy the mobile homesite at the regulated rent. The left-hand side of Eq. (5) is thus the ‘‘user cost’’ of the right tothe consumer, and the right-hand side is the annual benefit to the consumer of enjoyingthis right, iL � Q. If the rent is regulated in perpetuity at the level of Q and if market landrents are constant, then from Eq. (1), the market value of the benefit, Z, is
Z ¼ ð1=rÞ½iL� Q�: ð6ÞIf interest rates for land rent and mobile home finance are equal, r = i, then
Z ¼ ð1=iÞ½iL� Q�: ð7Þ
Please cite this article in press as: Mason, C., Quigley, J.M., The curious institution of mobilehome ..., J. Housing Econ. (2007), doi:10.1016/j.jhe.2007.04.002
290
291
292
293
294
295296298298
299
300
301
302
304304
305
306
307
308
309311312
313
314315
316317
318
319
320
321
322
323
324
325
326
327
328
329
330
331
332
10 C. Mason, J.M. Quigley / Journal of Housing Economics xxx (2006) xxx–xxx
YJHEC 1269 No. of Pages 20, Model 1+
30 May 2007 Disk Used
If the currently regulated rent is assumed to remain in force forever and if r = i, then theannual benefit from the rent regulation will be ‘‘fully capitalized’’ into the market value ofthe right of, Z.
More generally, if there is some uncertainty about the duration of regulation, or if inter-est rates for mobile home finance r and land rent i are not identical, the annual benefit maybe capitalized at some fraction k
Z ¼ kði=rÞð1=iÞ½iL� Q� ¼ kði=rÞ½iL� Q=i�: ð8ÞNote that if i = r and k = 1, the expression is again identical to Eq. (7).
In any event, when we observe the sale of a mobile home at a price of Vm, the transac-tion includes the transfer of a coach whose value is Sm, and also the transfer of the right touse the site, which has a market value of Z,
V m ¼ Sm þ Z: ð9ÞIf Z and L were observed, then we could infer the rate of capitalization, k, directly fromEq. (8).
3.4. Data assembly
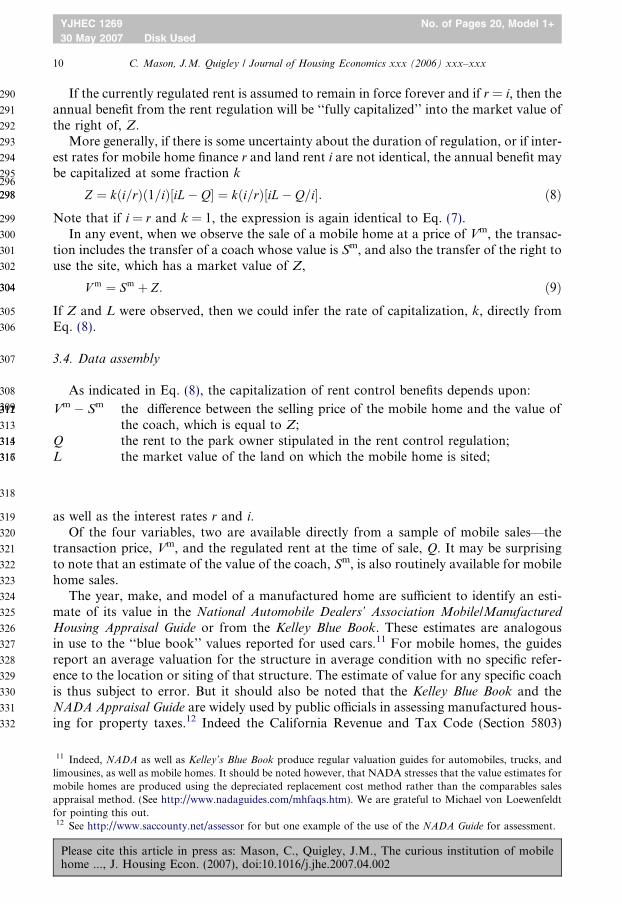
As indicated in Eq. (8), the capitalization of rent control benefits depends upon:
Vm � Sm the difference between the selling price of the mobile home and the value of
11 Indeed, NA
limousines, asmobile homesappraisal methfor pointing th12 See http://w
Please citehome ..., J.
the coach, which is equal to Z;
Q the rent to the park owner stipulated in the rent control regulation; L the market value of the land on which the mobile home is sited;as well as the interest rates r and i.Of the four variables, two are available directly from a sample of mobile sales—the
transaction price, Vm, and the regulated rent at the time of sale, Q. It may be surprisingto note that an estimate of the value of the coach, Sm, is also routinely available for mobilehome sales.
The year, make, and model of a manufactured home are sufficient to identify an esti-mate of its value in the National Automobile Dealers’ Association Mobile/Manufactured
Housing Appraisal Guide or from the Kelley Blue Book. These estimates are analogousin use to the ‘‘blue book’’ values reported for used cars.11 For mobile homes, the guidesreport an average valuation for the structure in average condition with no specific refer-ence to the location or siting of that structure. The estimate of value for any specific coachis thus subject to error. But it should also be noted that the Kelley Blue Book and theNADA Appraisal Guide are widely used by public officials in assessing manufactured hous-ing for property taxes.12 Indeed the California Revenue and Tax Code (Section 5803)
DA as well as Kelley’s Blue Book produce regular valuation guides for automobiles, trucks, andwell as mobile homes. It should be noted however, that NADA stresses that the value estimates forare produced using the depreciated replacement cost method rather than the comparables salesod. (See http://www.nadaguides.com/mhfaqs.htm). We are grateful to Michael von Loewenfeldtis out.ww.saccounty.net/assessor for but one example of the use of the NADA Guide for assessment.
this article in press as: Mason, C., Quigley, J.M., The curious institution of mobileHousing Econ. (2007), doi:10.1016/j.jhe.2007.04.002
CTED
PR
OO
F333
334
335
336
337
338
339
340
341
342
343
344
345
346
347
348
349
350
Table 2Estimated value of the right to occupy mobile home sites at regulated rents at three mobile home parks in differentCalifornia counties, 1999–2004
Estimated value of contractual right (Z) Marin Santa Barbara San Diego
At the time of saleMean $60,677 $105,054 $24,014Median 55,295 100,363 23,605Standard deviation 28,112 35,411 14,722
As percent of selling priceMean 67% 88% 48%Median 73% 88% 57%Standard deviation 12% 4% 47%
Estimated value per square foot (Z/sqft)Mean $14.06 $40.90 $6.52Median 14.10 38.96 6.19Standard deviation 6.09 15.64 4.08
As percent of coach value (Vm/Sm)Mean 340% 919% 256%Median 366% 842% 231%Standard deviation 107% 352% 135%
Notes: For the mobile home park located in Marin County, the estimates are based upon 40 sales of mobilehomes during the period 1992–2002. The value of the coach was estimated using the NADA Guide for the time ofsale to generate an ‘‘Appraiser Manufactured Housing Value Report’’ for each property.For the mobile home park located in Santa Barbara County, the estimates are based upon 64 sales of mobile
homes during the period 1999–2004. The value of the coach was estimated using the Kelley Blue Book estimate forthe time of sale.For the mobile home park located in San Diego County, the estimates are based on 141 sales of mobile homes
during the period 2000–2004. The value of the coach was estimated using the NADA Guide for the time of the saleto generate a ‘‘Manufactured Housing Value Report’’ for each property.
C. Mason, J.M. Quigley / Journal of Housing Economics xxx (2006) xxx–xxx 11
YJHEC 1269 No. of Pages 20, Model 1+
30 May 2007 Disk Used
UN
CO
RR
Edirects assessors to consider the NADA Appraisal Guide and/or the Kelley Blue Book val-uations when assessing mobile homes for local property taxes.
The methodology underlying these appraisal guides is, understandably, proprietary.Thus, there is no published evidence on the properties of either guide as an estimator ofthe market prices for mobile homes. In Appendix A, we present independent evidence thatthe NADA prices are unbiased. We gathered data on all sales of mobile homes in threeparks subject to vacancy control rent regulations, one in a city located in each county dur-ing time intervals spanning 1999–2004. Sale prices of these mobile homes, together withAppraisal Guide and Blue Book estimates of the value of coaches, permit us to estimatethe economic value of rent regulations.
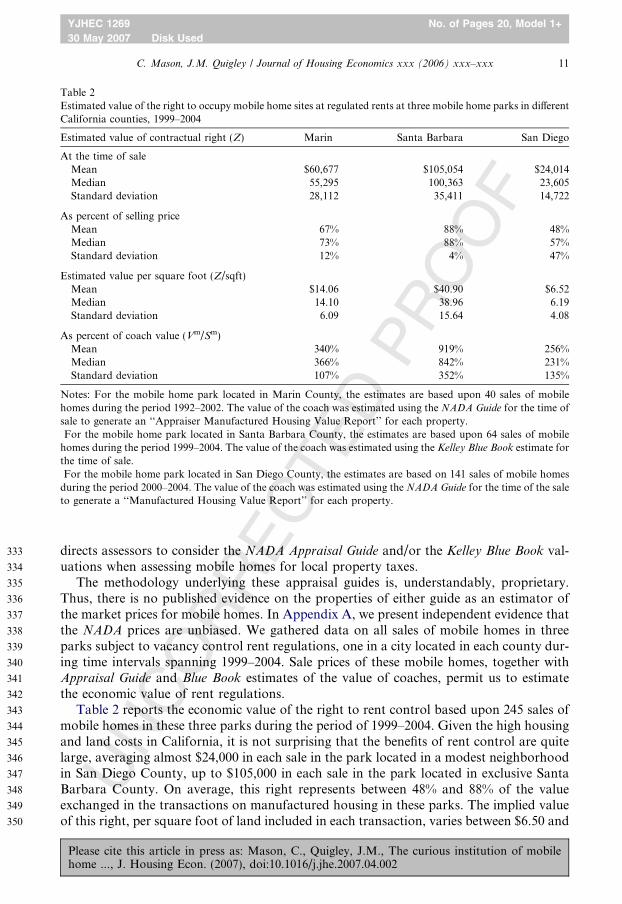
Table 2 reports the economic value of the right to rent control based upon 245 sales ofmobile homes in these three parks during the period of 1999–2004. Given the high housingand land costs in California, it is not surprising that the benefits of rent control are quitelarge, averaging almost $24,000 in each sale in the park located in a modest neighborhoodin San Diego County, up to $105,000 in each sale in the park located in exclusive SantaBarbara County. On average, this right represents between 48% and 88% of the valueexchanged in the transactions on manufactured housing in these parks. The implied valueof this right, per square foot of land included in each transaction, varies between $6.50 and
Please cite this article in press as: Mason, C., Quigley, J.M., The curious institution of mobilehome ..., J. Housing Econ. (2007), doi:10.1016/j.jhe.2007.04.002
351
352
353
354
355
356
357
358
359
360
361
362
363
364
365
366
367
368
369
370
371
12 C. Mason, J.M. Quigley / Journal of Housing Economics xxx (2006) xxx–xxx
YJHEC 1269 No. of Pages 20, Model 1+
30 May 2007 Disk Used
$41.00 on average. The markups over the appraisal guide values of the coaches in thesetransactions average between 250% and 900%.
These averages conceal a wide dispersion of individual estimates. As the table indicates,the estimated value of the premium paid to enjoy the right to regulated rents has a largevariance. Of course, many factors other than the value of the structures and the right toregulated rents affect the sale price of individual dwellings.
In Eq. (8), the benefits enjoyed under rent control depend upon the difference betweenthe market value of the land associated with the mobile home and the controlled rentwhich is actually paid each year. Unfortunately, direct evidence on the value of land is dif-ficult to obtain in heavily developed areas. Data on sales of unencumbered land or build-ing lots in the built-up neighborhoods surrounding the mobile home parks wereunavailable.
Of course, residential land in the local area is traded daily—but as a component of thetransactions in single family housing. We investigated the value of land in the housingmarket surrounding these mobile home parks using hedonic methods applied to all salesof single family housing in the area surrounding the mobile home park. This analysis,using Box–Cox hedonic models to estimate local land values, is reported in Appendix B.
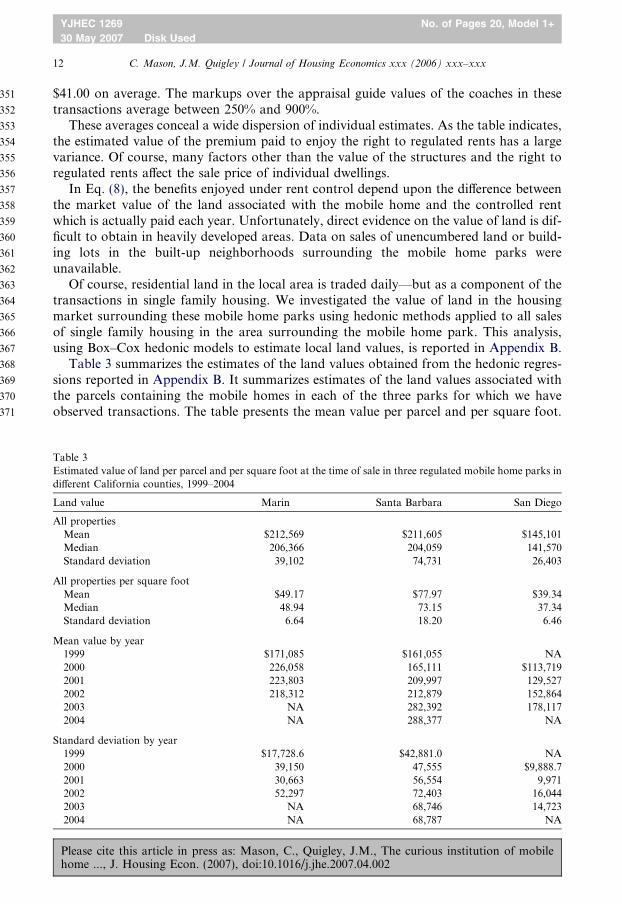
Table 3 summarizes the estimates of the land values obtained from the hedonic regres-sions reported in Appendix B. It summarizes estimates of the land values associated withthe parcels containing the mobile homes in each of the three parks for which we haveobserved transactions. The table presents the mean value per parcel and per square foot.
Table 3Estimated value of land per parcel and per square foot at the time of sale in three regulated mobile home parks indifferent California counties, 1999–2004
Land value Marin Santa Barbara San Diego
All propertiesMean $212,569 $211,605 $145,101Median 206,366 204,059 141,570Standard deviation 39,102 74,731 26,403
All properties per square footMean $49.17 $77.97 $39.34Median 48.94 73.15 37.34Standard deviation 6.64 18.20 6.46
Mean value by year1999 $171,085 $161,055 NA2000 226,058 165,111 $113,7192001 223,803 209,997 129,5272002 218,312 212,879 152,8642003 NA 282,392 178,1172004 NA 288,377 NA
Standard deviation by year1999 $17,728.6 $42,881.0 NA2000 39,150 47,555 $9,888.72001 30,663 56,554 9,9712002 52,297 72,403 16,0442003 NA 68,746 14,7232004 NA 68,787 NA
Please cite this article in press as: Mason, C., Quigley, J.M., The curious institution of mobilehome ..., J. Housing Econ. (2007), doi:10.1016/j.jhe.2007.04.002
OF
372
373
374
375
376
377
378
379
380
381
382
383
384
385
386
387
388
389
390
391
392
393
394
395
396
397
Table 4Estimates of reduction in annual site rents arising from rent control at three regulated mobile home parks indifferent California counties, 1999–2004
Rent reduction Marin Santa Barbara San Diego
(iL � Q)Mean $8,144 $11,128 $2,253Median 7,437 11,668 2,079Standard deviation 3,337 3,972 908
(iL � Q) per sqftMean $1.81 $4.03 $0.60Median 1.94 4.15 0.57Standard deviation 0.47 0.68 0.18
C. Mason, J.M. Quigley / Journal of Housing Economics xxx (2006) xxx–xxx 13
YJHEC 1269 No. of Pages 20, Model 1+
30 May 2007 Disk Used
TED
PR
OAlso presented are the standard deviations and the range of the estimates. The table alsosummarizes the estimates of the land values of mobile homes sold at different time periods.
As estimated by the hedonic model, the average market value of mobile home land par-cels in the neighborhoods surrounding the mobile home parks was quite large—$145,000in the park located in San Diego County, and more than $200,000 in Santa Barbara andMarin Counties.
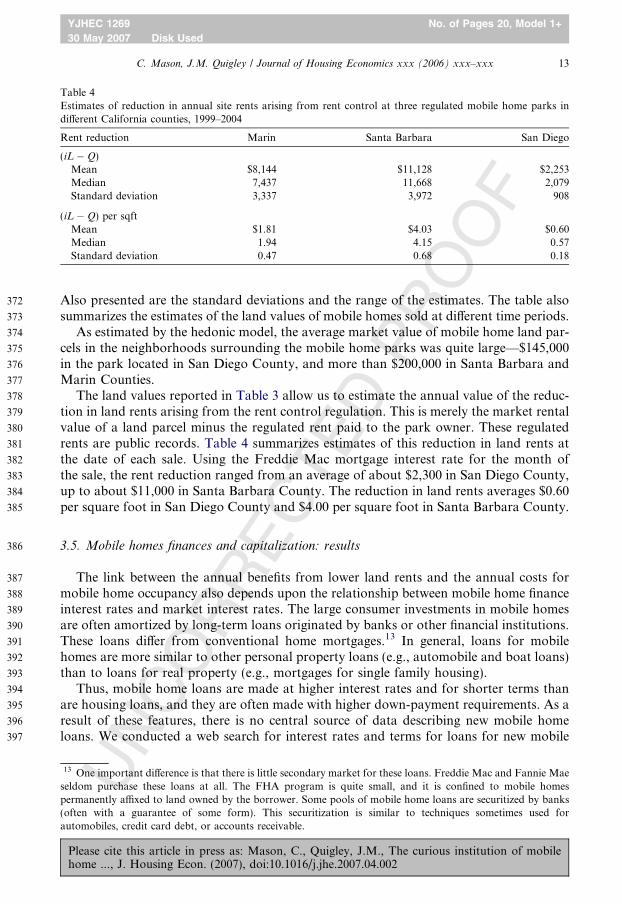
The land values reported in Table 3 allow us to estimate the annual value of the reduc-tion in land rents arising from the rent control regulation. This is merely the market rentalvalue of a land parcel minus the regulated rent paid to the park owner. These regulatedrents are public records. Table 4 summarizes estimates of this reduction in land rents atthe date of each sale. Using the Freddie Mac mortgage interest rate for the month ofthe sale, the rent reduction ranged from an average of about $2,300 in San Diego County,up to about $11,000 in Santa Barbara County. The reduction in land rents averages $0.60per square foot in San Diego County and $4.00 per square foot in Santa Barbara County.
CCO
RR
E3.5. Mobile homes finances and capitalization: results
The link between the annual benefits from lower land rents and the annual costs formobile home occupancy also depends upon the relationship between mobile home financeinterest rates and market interest rates. The large consumer investments in mobile homesare often amortized by long-term loans originated by banks or other financial institutions.These loans differ from conventional home mortgages.13 In general, loans for mobilehomes are more similar to other personal property loans (e.g., automobile and boat loans)than to loans for real property (e.g., mortgages for single family housing).
Thus, mobile home loans are made at higher interest rates and for shorter terms thanare housing loans, and they are often made with higher down-payment requirements. As aresult of these features, there is no central source of data describing new mobile homeloans. We conducted a web search for interest rates and terms for loans for new mobile
UN
13 One important difference is that there is little secondary market for these loans. Freddie Mac and Fannie Maeseldom purchase these loans at all. The FHA program is quite small, and it is confined to mobile homespermanently affixed to land owned by the borrower. Some pools of mobile home loans are securitized by banks(often with a guarantee of some form). This securitization is similar to techniques sometimes used forautomobiles, credit card debt, or accounts receivable.
Please cite this article in press as: Mason, C., Quigley, J.M., The curious institution of mobilehome ..., J. Housing Econ. (2007), doi:10.1016/j.jhe.2007.04.002
398
399
400
401
402
403
404
405
406
407
408
409
410
411
412
413
414
415
416
417
418
419
420
421
422
423
424
425
426
427
428
429
430
431
432
433
434
435
436
437
438
439
440
441
442
14 C. Mason, J.M. Quigley / Journal of Housing Economics xxx (2006) xxx–xxx
YJHEC 1269 No. of Pages 20, Model 1+
30 May 2007 Disk Used
homes at two points in time. In August 2002 home mortgage interest rates reported byFreddie Mac were 6.75% for 360 months for 80% loan-to-value (LTV) mortgages. At thistime mobile homes loans were advertised at 48 months to 120 months, with interest ratesquoted at 9–17.5%, and LTV ratios varying between 70% and 85%. The advertised ratesaveraged 1.81 times the mortgage interest rates at the time.
In an identical web survey in March 2004 (when home mortgage rates were 5.50% forthe same terms), it appeared that fewer institutions advertised mobile home loans, andfewer listed their terms on their websites. The rates advertised averaged 1.80 times themortgage interest rate in March 2004. This evidence is hardly systematic, but it does sug-gest that the interest rates for used mobile home finance are at least 1.5 times the ratescharged for home mortgages. Since LTVs are higher and terms are shorter for mobilehome loans, this suggests that the ratio of adjusted interest rates is higher still.
The observations on sales of mobile homes, ‘‘blue book’’ appraised values, land values,and some assumptions about the relationship between mortgage interest rates and mobilehome interest rates permits the capitalization rate to be estimated from Eq. (8).
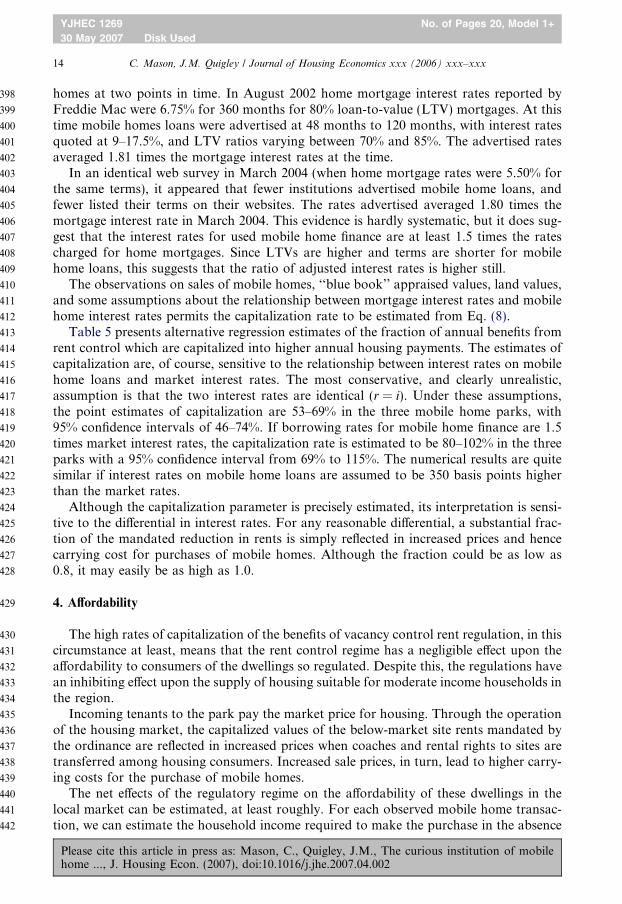
Table 5 presents alternative regression estimates of the fraction of annual benefits fromrent control which are capitalized into higher annual housing payments. The estimates ofcapitalization are, of course, sensitive to the relationship between interest rates on mobilehome loans and market interest rates. The most conservative, and clearly unrealistic,assumption is that the two interest rates are identical (r = i). Under these assumptions,the point estimates of capitalization are 53–69% in the three mobile home parks, with95% confidence intervals of 46–74%. If borrowing rates for mobile home finance are 1.5times market interest rates, the capitalization rate is estimated to be 80–102% in the threeparks with a 95% confidence interval from 69% to 115%. The numerical results are quitesimilar if interest rates on mobile home loans are assumed to be 350 basis points higherthan the market rates.
Although the capitalization parameter is precisely estimated, its interpretation is sensi-tive to the differential in interest rates. For any reasonable differential, a substantial frac-tion of the mandated reduction in rents is simply reflected in increased prices and hencecarrying cost for purchases of mobile homes. Although the fraction could be as low as0.8, it may easily be as high as 1.0.
4. Affordability
The high rates of capitalization of the benefits of vacancy control rent regulation, in thiscircumstance at least, means that the rent control regime has a negligible effect upon theaffordability to consumers of the dwellings so regulated. Despite this, the regulations havean inhibiting effect upon the supply of housing suitable for moderate income households inthe region.
Incoming tenants to the park pay the market price for housing. Through the operationof the housing market, the capitalized values of the below-market site rents mandated bythe ordinance are reflected in increased prices when coaches and rental rights to sites aretransferred among housing consumers. Increased sale prices, in turn, lead to higher carry-ing costs for the purchase of mobile homes.
The net effects of the regulatory regime on the affordability of these dwellings in thelocal market can be estimated, at least roughly. For each observed mobile home transac-tion, we can estimate the household income required to make the purchase in the absence
Please cite this article in press as: Mason, C., Quigley, J.M., The curious institution of mobilehome ..., J. Housing Econ. (2007), doi:10.1016/j.jhe.2007.04.002
CTED
PR
OO
F443
444
445
446
447
448
449
450
451
452
453
454
455
Table 5Regression estimates of the fraction (k) of annual benefits capitalized into higher annual housing payments inregulated mobile home parks in different California counties
Estimate of k 95% Confidence interval R2
Lower Upper
Assuming: r = 1.5 · i
Marin 0.80 0.69 0.91 0.84San Diego 0.94 0.83 1.05 0.67Santa Barbara 0.90 0.83 0.97 0.92
Assuming: r = 1.5 · i (normalized by lot size)Marin 0.86 0.74 0.97 0.86San Diego 1.00 0.88 1.11 0.68Santa Barbara 1.03 0.95 1.11 0.91
Assuming: r = i + 0.035Marin 0.78 0.67 0.88 0.84San Diego 0.96 0.85 1.07 0.67Santa Barbara 0.92 0.85 0.99 0.91
Assuming: r = i + 0.035 (normalized by lot size)Marin 0.84 0.73 0.95 0.85San Diego 1.02 0.90 1.14 0.68Santa Barbara 1.05 0.97 1.13 0.91
Assuming: r = i
Marin 0.53 0.46 0.60 0.84San Diego 0.63 0.55 0.70 0.67Santa Barbara 0.60 0.55 0.65 0.92
Assuming: r = i (normalized by lot size)Marin 0.57 0.50 0.65 0.86San Diego 0.67 0.59 0.74 0.68Santa Barbara 0.69 0.63 0.74 0.91
C. Mason, J.M. Quigley / Journal of Housing Economics xxx (2006) xxx–xxx 15
YJHEC 1269 No. of Pages 20, Model 1+
30 May 2007 Disk Used
Eof rent control. This estimate of required household income can then be compared to therequired household income at the observed sale price.
CO
RR
4.1. Housing affordability under rent control
To calculate the household income required for mobile home purchase under rent con-trol for an 80% LTV mortgage, we compute the monthly mortgage payment using theinterest rate at the time of sale to amortize a loan 80% of the observed sale price of eachmobile home. We add to this payment the mandated monthly rent. According to federalguidelines, housing is considered ‘‘affordable’’ if monthly housing payments are less than30% of monthly income. So the required household income is 3.33 times the level of hous-ing payment.
NU4.2. Housing affordability in the absence of rent control
If rent control were not in effect, the purchase price of mobile homes would fall, reflect-ing elimination of the capitalized benefit of below-market site rents, while the monthly
Please cite this article in press as: Mason, C., Quigley, J.M., The curious institution of mobilehome ..., J. Housing Econ. (2007), doi:10.1016/j.jhe.2007.04.002
456
457
458
459
460
461
462
463
464
465
466
467
16 C. Mason, J.M. Quigley / Journal of Housing Economics xxx (2006) xxx–xxx
YJHEC 1269 No. of Pages 20, Model 1+
30 May 2007 Disk Used
rents would rise to the market level. The monthly mortgage payment would therefore belower, but this would be offset, at least in part, by a higher rent. Using the same assump-tions as above, but with a purchase price equal to that reported in the appraisal guide asthe valuation in the absence of rent control, and with a rent equal to the estimated marketrent for each parcel at the time of sale, we can compute the housing cost and hence therequired income in the absence of rent control to purchase each mobile home.
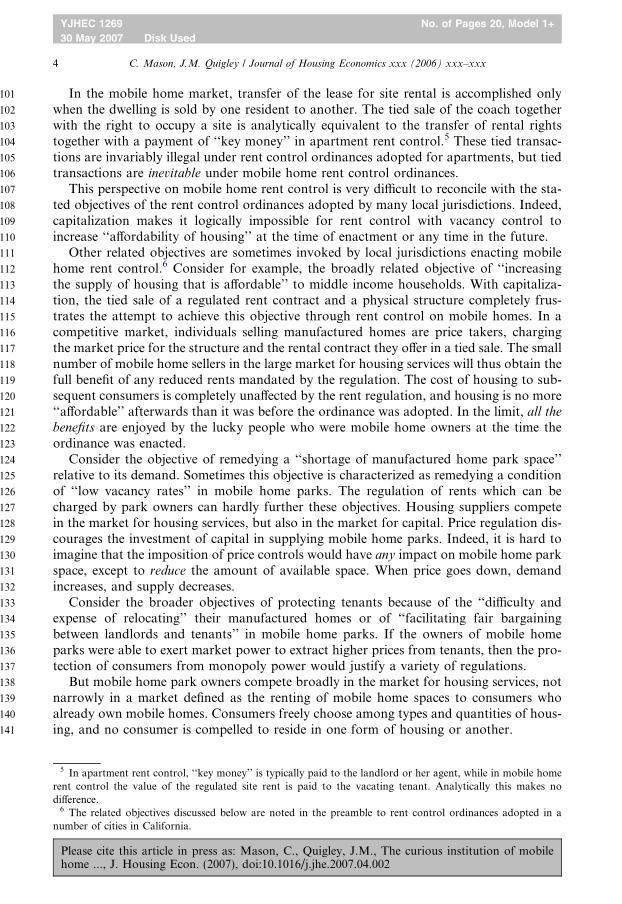
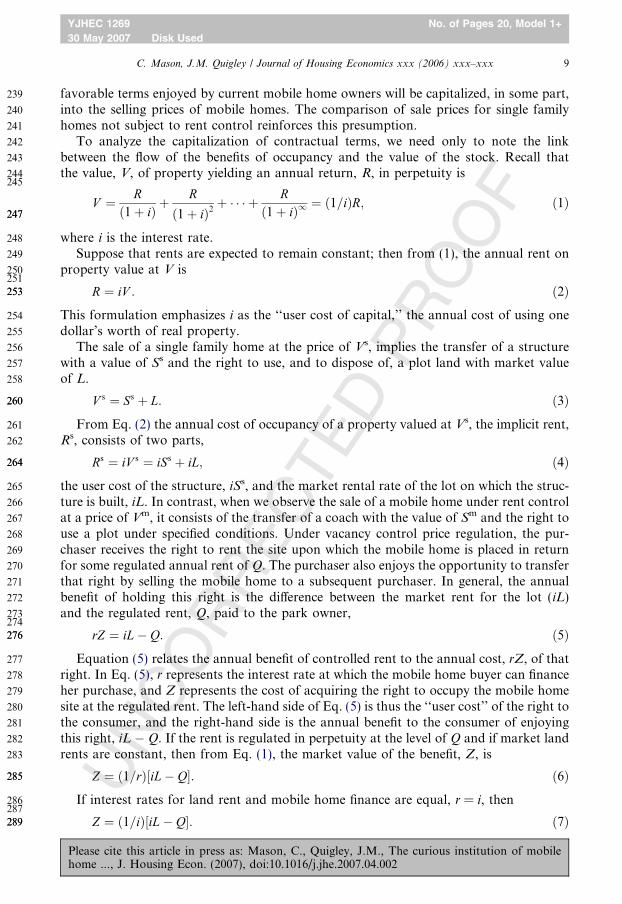
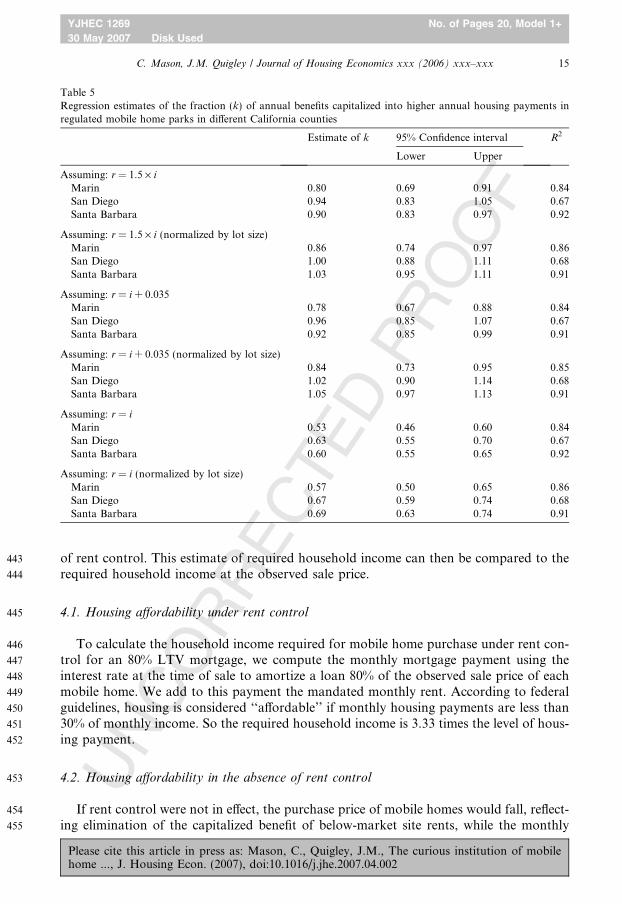
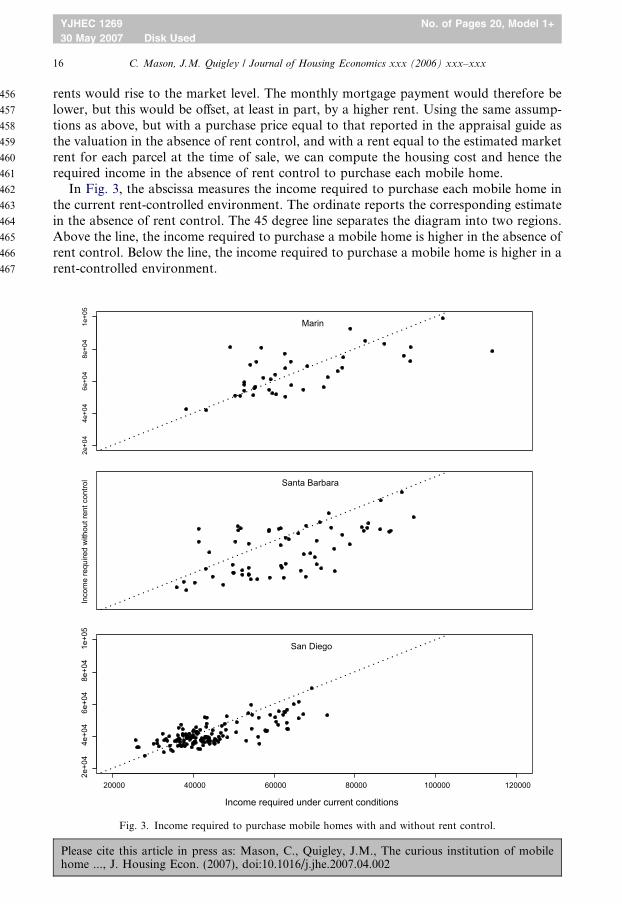
In Fig. 3, the abscissa measures the income required to purchase each mobile home inthe current rent-controlled environment. The ordinate reports the corresponding estimatein the absence of rent control. The 45 degree line separates the diagram into two regions.Above the line, the income required to purchase a mobile home is higher in the absence ofrent control. Below the line, the income required to purchase a mobile home is higher in arent-controlled environment.
2e+0
44e
+04
6e+0
48e
+04
1e+0
5
Marin
Inco
me
requ
ired
with
out r
ent c
ontro
l Santa Barbara
20000 40000 60000 80000 100000 120000
2e+0
44e
+04
6e+0
48e
+04
1e+0
5
San Diego
Income required under current conditions
Fig. 3. Income required to purchase mobile homes with and without rent control.
Please cite this article in press as: Mason, C., Quigley, J.M., The curious institution of mobilehome ..., J. Housing Econ. (2007), doi:10.1016/j.jhe.2007.04.002
468
469
470
471
472
473
474
475
476
477
478
479
480
481
482
483
484
485
486
487
488
489
490
491
492
493
494
495
496
497
498
499
500
501
502
503
504
505
506
507
508
509
510
511
C. Mason, J.M. Quigley / Journal of Housing Economics xxx (2006) xxx–xxx 17
YJHEC 1269 No. of Pages 20, Model 1+
30 May 2007 Disk Used
UN
CO
RR
EC
TED
PR
OO
F
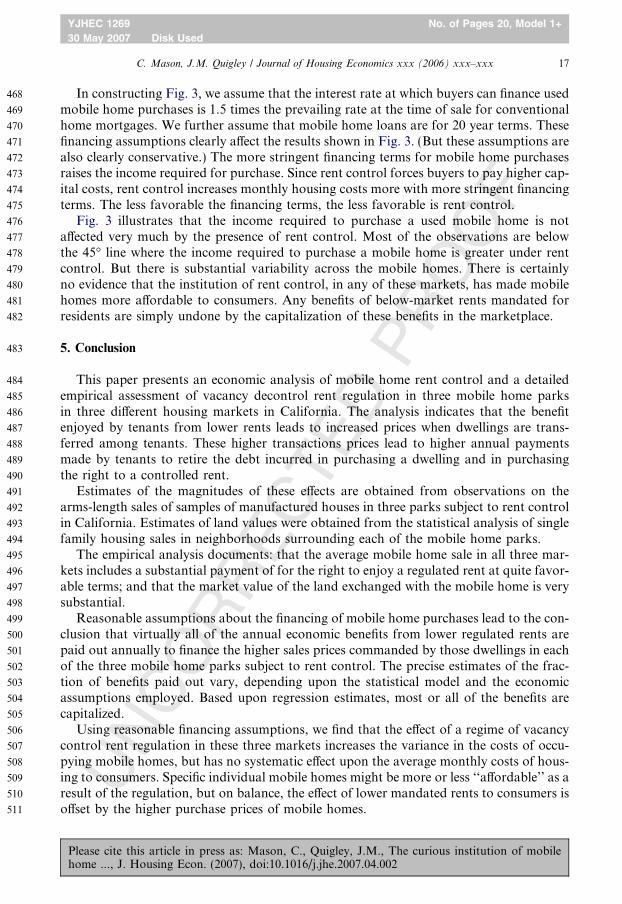
In constructing Fig. 3, we assume that the interest rate at which buyers can finance usedmobile home purchases is 1.5 times the prevailing rate at the time of sale for conventionalhome mortgages. We further assume that mobile home loans are for 20 year terms. Thesefinancing assumptions clearly affect the results shown in Fig. 3. (But these assumptions arealso clearly conservative.) The more stringent financing terms for mobile home purchasesraises the income required for purchase. Since rent control forces buyers to pay higher cap-ital costs, rent control increases monthly housing costs more with more stringent financingterms. The less favorable the financing terms, the less favorable is rent control.
Fig. 3 illustrates that the income required to purchase a used mobile home is notaffected very much by the presence of rent control. Most of the observations are belowthe 45� line where the income required to purchase a mobile home is greater under rentcontrol. But there is substantial variability across the mobile homes. There is certainlyno evidence that the institution of rent control, in any of these markets, has made mobilehomes more affordable to consumers. Any benefits of below-market rents mandated forresidents are simply undone by the capitalization of these benefits in the marketplace.
5. Conclusion
This paper presents an economic analysis of mobile home rent control and a detailedempirical assessment of vacancy decontrol rent regulation in three mobile home parksin three different housing markets in California. The analysis indicates that the benefitenjoyed by tenants from lower rents leads to increased prices when dwellings are trans-ferred among tenants. These higher transactions prices lead to higher annual paymentsmade by tenants to retire the debt incurred in purchasing a dwelling and in purchasingthe right to a controlled rent.
Estimates of the magnitudes of these effects are obtained from observations on thearms-length sales of samples of manufactured houses in three parks subject to rent controlin California. Estimates of land values were obtained from the statistical analysis of singlefamily housing sales in neighborhoods surrounding each of the mobile home parks.
The empirical analysis documents: that the average mobile home sale in all three mar-kets includes a substantial payment of for the right to enjoy a regulated rent at quite favor-able terms; and that the market value of the land exchanged with the mobile home is verysubstantial.
Reasonable assumptions about the financing of mobile home purchases lead to the con-clusion that virtually all of the annual economic benefits from lower regulated rents arepaid out annually to finance the higher sales prices commanded by those dwellings in eachof the three mobile home parks subject to rent control. The precise estimates of the frac-tion of benefits paid out vary, depending upon the statistical model and the economicassumptions employed. Based upon regression estimates, most or all of the benefits arecapitalized.
Using reasonable financing assumptions, we find that the effect of a regime of vacancycontrol rent regulation in these three markets increases the variance in the costs of occu-pying mobile homes, but has no systematic effect upon the average monthly costs of hous-ing to consumers. Specific individual mobile homes might be more or less ‘‘affordable’’ as aresult of the regulation, but on balance, the effect of lower mandated rents to consumers isoffset by the higher purchase prices of mobile homes.
Please cite this article in press as: Mason, C., Quigley, J.M., The curious institution of mobilehome ..., J. Housing Econ. (2007), doi:10.1016/j.jhe.2007.04.002
512
513
514
515
516
517
518
519
520
521
522
523
524
525
526
527
528
529
530
531
532
18 C. Mason, J.M. Quigley / Journal of Housing Economics xxx (2006) xxx–xxx
YJHEC 1269 No. of Pages 20, Model 1+
30 May 2007 Disk Used
Appendix A.
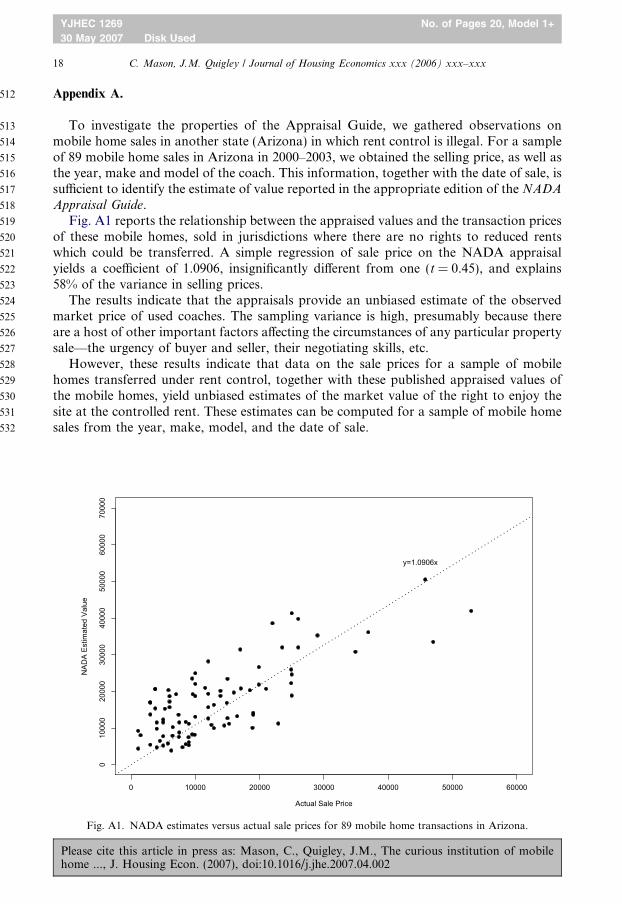
To investigate the properties of the Appraisal Guide, we gathered observations onmobile home sales in another state (Arizona) in which rent control is illegal. For a sampleof 89 mobile home sales in Arizona in 2000–2003, we obtained the selling price, as well asthe year, make and model of the coach. This information, together with the date of sale, issufficient to identify the estimate of value reported in the appropriate edition of the NADA
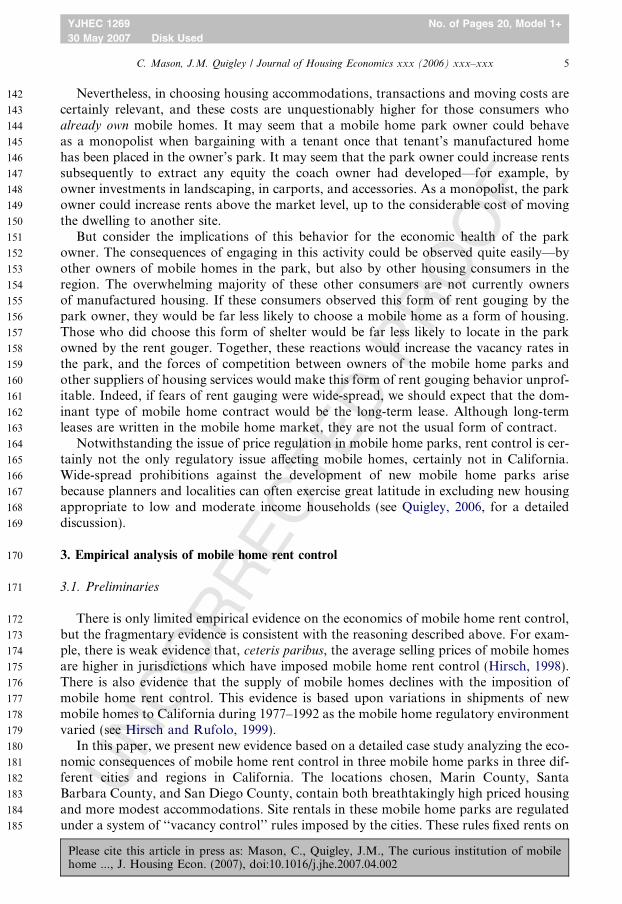
Appraisal Guide.Fig. A1 reports the relationship between the appraised values and the transaction prices
of these mobile homes, sold in jurisdictions where there are no rights to reduced rentswhich could be transferred. A simple regression of sale price on the NADA appraisalyields a coefficient of 1.0906, insignificantly different from one (t = 0.45), and explains58% of the variance in selling prices.
The results indicate that the appraisals provide an unbiased estimate of the observedmarket price of used coaches. The sampling variance is high, presumably because thereare a host of other important factors affecting the circumstances of any particular propertysale—the urgency of buyer and seller, their negotiating skills, etc.
However, these results indicate that data on the sale prices for a sample of mobilehomes transferred under rent control, together with these published appraised values ofthe mobile homes, yield unbiased estimates of the market value of the right to enjoy thesite at the controlled rent. These estimates can be computed for a sample of mobile homesales from the year, make, model, and the date of sale.
0 10000 20000 30000 40000 50000 60000
010
000
2000
030
000
4000
050
000
6000
070
000
Actual Sale Price
NAD
A Es
timat
ed V
alue
y=1.0906x
Fig. A1. NADA estimates versus actual sale prices for 89 mobile home transactions in Arizona.
Please cite this article in press as: Mason, C., Quigley, J.M., The curious institution of mobilehome ..., J. Housing Econ. (2007), doi:10.1016/j.jhe.2007.04.002
533
534
535
536
537
538
539
540
541
542
543
544
545
546
547
548
549
550
551
C. Mason, J.M. Quigley / Journal of Housing Economics xxx (2006) xxx–xxx 19
YJHEC 1269 No. of Pages 20, Model 1+
30 May 2007 Disk Used
PR
OO
F
Appendix B.
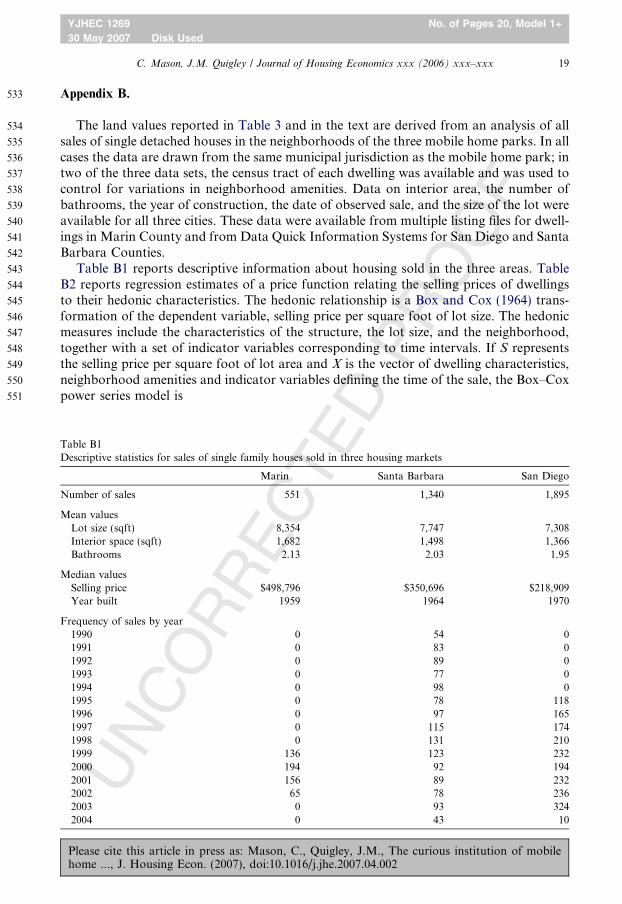
The land values reported in Table 3 and in the text are derived from an analysis of allsales of single detached houses in the neighborhoods of the three mobile home parks. In allcases the data are drawn from the same municipal jurisdiction as the mobile home park; intwo of the three data sets, the census tract of each dwelling was available and was used tocontrol for variations in neighborhood amenities. Data on interior area, the number ofbathrooms, the year of construction, the date of observed sale, and the size of the lot wereavailable for all three cities. These data were available from multiple listing files for dwell-ings in Marin County and from Data Quick Information Systems for San Diego and SantaBarbara Counties.
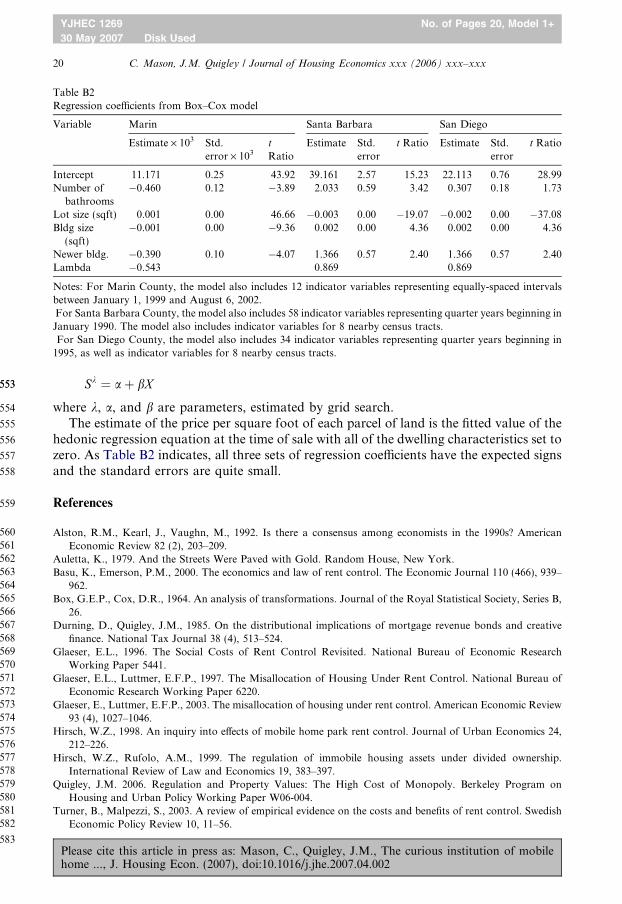
Table B1 reports descriptive information about housing sold in the three areas. TableB2 reports regression estimates of a price function relating the selling prices of dwellingsto their hedonic characteristics. The hedonic relationship is a Box and Cox (1964) trans-formation of the dependent variable, selling price per square foot of lot size. The hedonicmeasures include the characteristics of the structure, the lot size, and the neighborhood,together with a set of indicator variables corresponding to time intervals. If S representsthe selling price per square foot of lot area and X is the vector of dwelling characteristics,neighborhood amenities and indicator variables defining the time of the sale, the Box–Coxpower series model is
UN
CO
RR
EC
TED
Table B1Descriptive statistics for sales of single family houses sold in three housing markets
Marin Santa Barbara San Diego
Number of sales 551 1,340 1,895
Mean valuesLot size (sqft) 8,354 7,747 7,308Interior space (sqft) 1,682 1,498 1,366Bathrooms 2.13 2.03 1.95
Median valuesSelling price $498,796 $350,696 $218,909Year built 1959 1964 1970
Frequency of sales by year1990 0 54 01991 0 83 01992 0 89 01993 0 77 01994 0 98 01995 0 78 1181996 0 97 1651997 0 115 1741998 0 131 2101999 136 123 2322000 194 92 1942001 156 89 2322002 65 78 2362003 0 93 3242004 0 43 10
Please cite this article in press as: Mason, C., Quigley, J.M., The curious institution of mobilehome ..., J. Housing Econ. (2007), doi:10.1016/j.jhe.2007.04.002
553553
554
555
556
557
558
559
560561562563564565566567568569570571572573574575576577578579580581582
583
Table B2Regression coefficients from Box–Cox model
Variable Marin Santa Barbara San Diego
Estimate · 103 Std.error · 103
t
RatioEstimate Std.
errort Ratio Estimate Std.
errort Ratio
Intercept 11.171 0.25 43.92 39.161 2.57 15.23 22.113 0.76 28.99Number of
bathrooms�0.460 0.12 �3.89 2.033 0.59 3.42 0.307 0.18 1.73
Lot size (sqft) 0.001 0.00 46.66 �0.003 0.00 �19.07 �0.002 0.00 �37.08Bldg size
(sqft)�0.001 0.00 �9.36 0.002 0.00 4.36 0.002 0.00 4.36
Newer bldg. �0.390 0.10 �4.07 1.366 0.57 2.40 1.366 0.57 2.40Lambda �0.543 0.869 0.869
Notes: For Marin County, the model also includes 12 indicator variables representing equally-spaced intervalsbetween January 1, 1999 and August 6, 2002.For Santa Barbara County, the model also includes 58 indicator variables representing quarter years beginning inJanuary 1990. The model also includes indicator variables for 8 nearby census tracts.For San Diego County, the model also includes 34 indicator variables representing quarter years beginning in
1995, as well as indicator variables for 8 nearby census tracts.
20 C. Mason, J.M. Quigley / Journal of Housing Economics xxx (2006) xxx–xxx
YJHEC 1269 No. of Pages 20, Model 1+
30 May 2007 Disk Used
Sk ¼ aþ bX
where k, a, and b are parameters, estimated by grid search.The estimate of the price per square foot of each parcel of land is the fitted value of the
hedonic regression equation at the time of sale with all of the dwelling characteristics set tozero. As Table B2 indicates, all three sets of regression coefficients have the expected signsand the standard errors are quite small.
References
Alston, R.M., Kearl, J., Vaughn, M., 1992. Is there a consensus among economists in the 1990s? AmericanEconomic Review 82 (2), 203–209.
Auletta, K., 1979. And the Streets Were Paved with Gold. Random House, New York.Basu, K., Emerson, P.M., 2000. The economics and law of rent control. The Economic Journal 110 (466), 939–
962.Box, G.E.P., Cox, D.R., 1964. An analysis of transformations. Journal of the Royal Statistical Society, Series B,
26.Durning, D., Quigley, J.M., 1985. On the distributional implications of mortgage revenue bonds and creative
finance. National Tax Journal 38 (4), 513–524.Glaeser, E.L., 1996. The Social Costs of Rent Control Revisited. National Bureau of Economic Research
Working Paper 5441.Glaeser, E.L., Luttmer, E.F.P., 1997. The Misallocation of Housing Under Rent Control. National Bureau of
Economic Research Working Paper 6220.Glaeser, E., Luttmer, E.F.P., 2003. The misallocation of housing under rent control. American Economic Review
93 (4), 1027–1046.Hirsch, W.Z., 1998. An inquiry into effects of mobile home park rent control. Journal of Urban Economics 24,
212–226.Hirsch, W.Z., Rufolo, A.M., 1999. The regulation of immobile housing assets under divided ownership.
International Review of Law and Economics 19, 383–397.Quigley, J.M. 2006. Regulation and Property Values: The High Cost of Monopoly. Berkeley Program on
Housing and Urban Policy Working Paper W06-004.Turner, B., Malpezzi, S., 2003. A review of empirical evidence on the costs and benefits of rent control. Swedish
Economic Policy Review 10, 11–56.
Please cite this article in press as: Mason, C., Quigley, J.M., The curious institution of mobilehome ..., J. Housing Econ. (2007), doi:10.1016/j.jhe.2007.04.002