Embed Size (px)
Citation preview
Program Overview
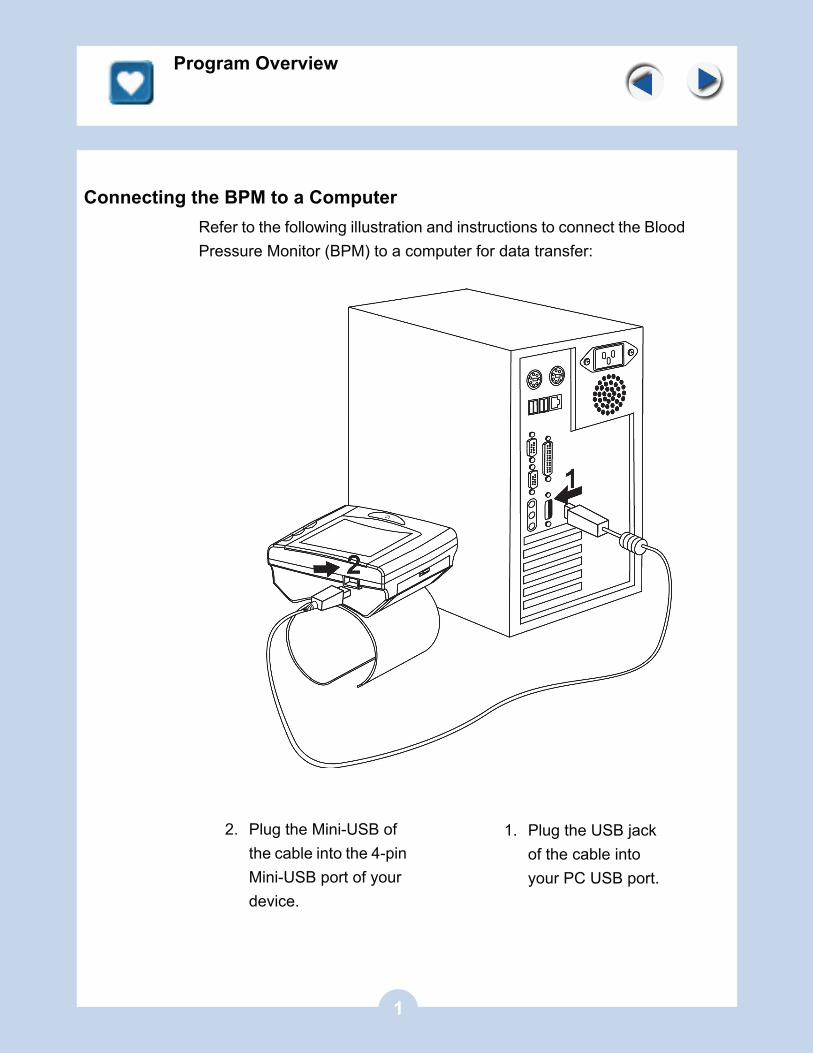
Connecting the BPM to a ComputerRefer to the following illustration and instructions to connect the Blood Pressure Monitor (BPM) to a computer for data transfer:
1. Plug the USB jack of the cable into your PC USB port.
2. Plug the Mini-USB of the cable into the 4-pin Mini-USB port of your device.
1
Program Overview
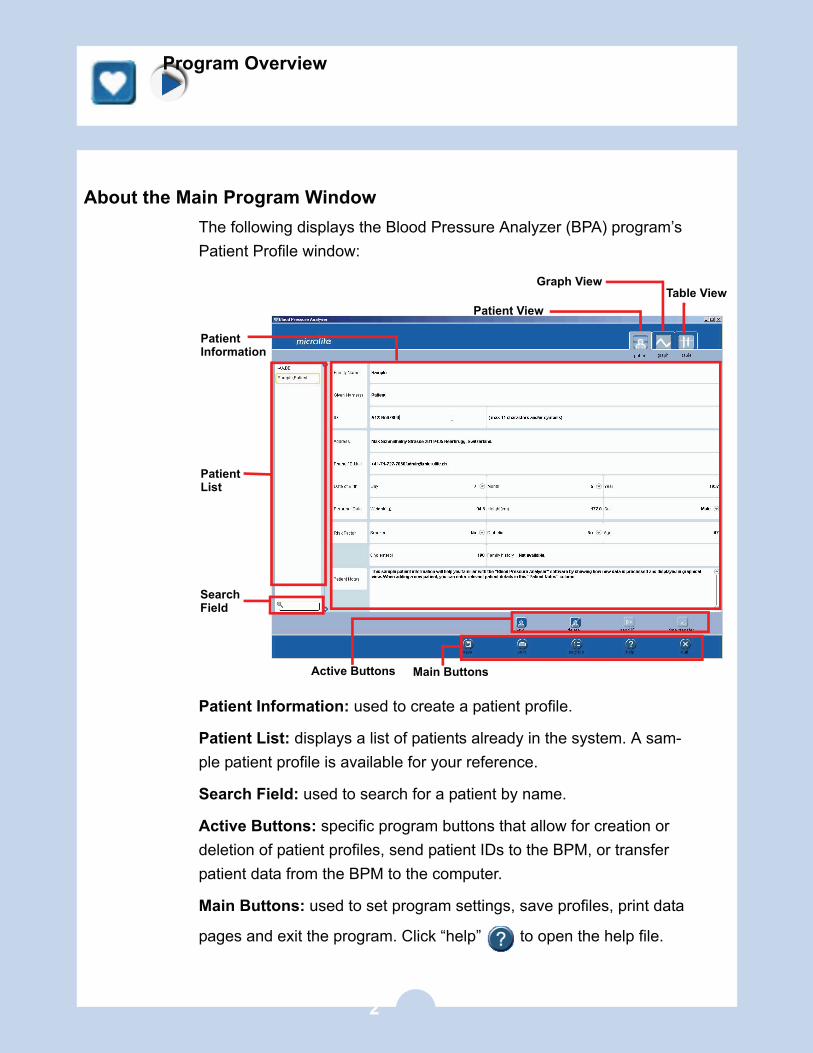
About the Main Program WindowThe following displays the Blood Pressure Analyzer (BPA) program’s Patient Profile window:
Patient Information: used to create a patient profile.
Patient List: displays a list of patients already in the system. A sam-ple patient profile is available for your reference.
Search Field: used to search for a patient by name.
Active Buttons: specific program buttons that allow for creation or deletion of patient profiles, send patient IDs to the BPM, or transfer patient data from the BPM to the computer.
Main Buttons: used to set program settings, save profiles, print data
pages and exit the program. Click “help” to open the help file.
Patient View
Graph View
PatientInformation
PatientList
Main ButtonsActive Buttons
SearchField
Table View
2
Getting Started
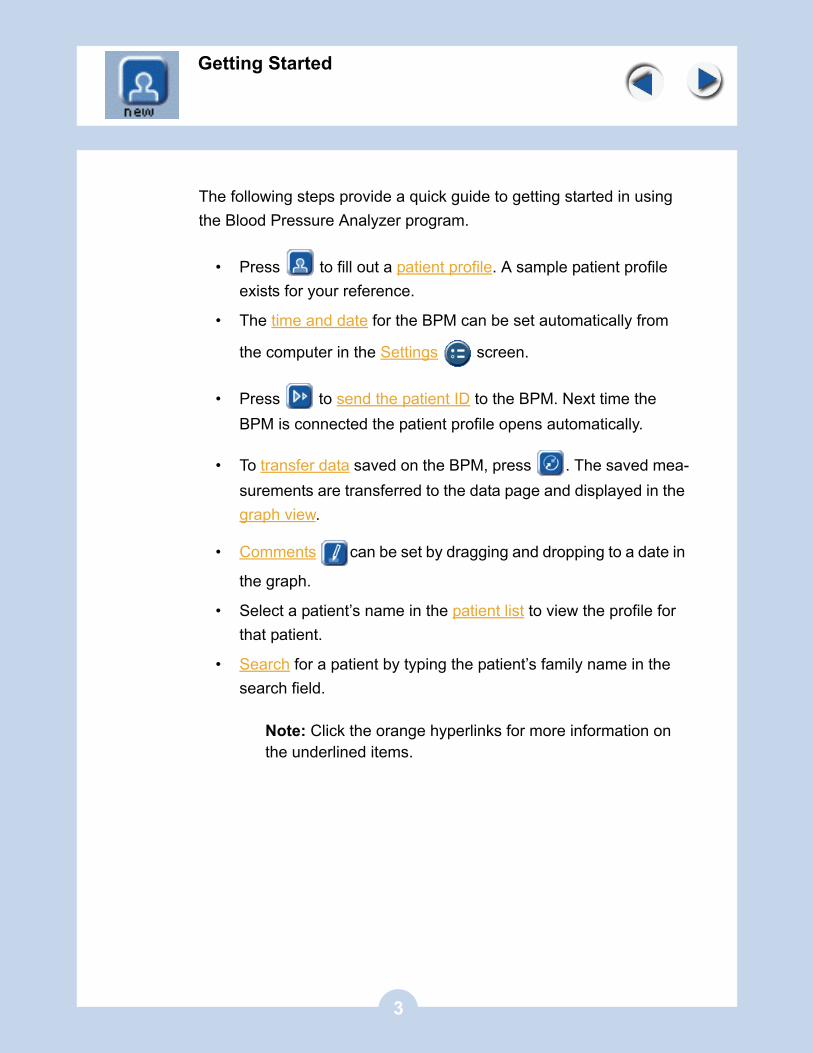
The following steps provide a quick guide to getting started in using the Blood Pressure Analyzer program.
• Press to fill out a patient profile. A sample patient profile exists for your reference.
• The time and date for the BPM can be set automatically from
the computer in the Settings screen.
• Press to send the patient ID to the BPM. Next time the BPM is connected the patient profile opens automatically.
• To transfer data saved on the BPM, press . The saved mea-surements are transferred to the data page and displayed in the graph view.
• Comments can be set by dragging and dropping to a date in
the graph.
• Select a patient’s name in the patient list to view the profile for that patient.
• Search for a patient by typing the patient’s family name in the search field.
Note: Click the orange hyperlinks for more information on the underlined items.
3
Program Buttons
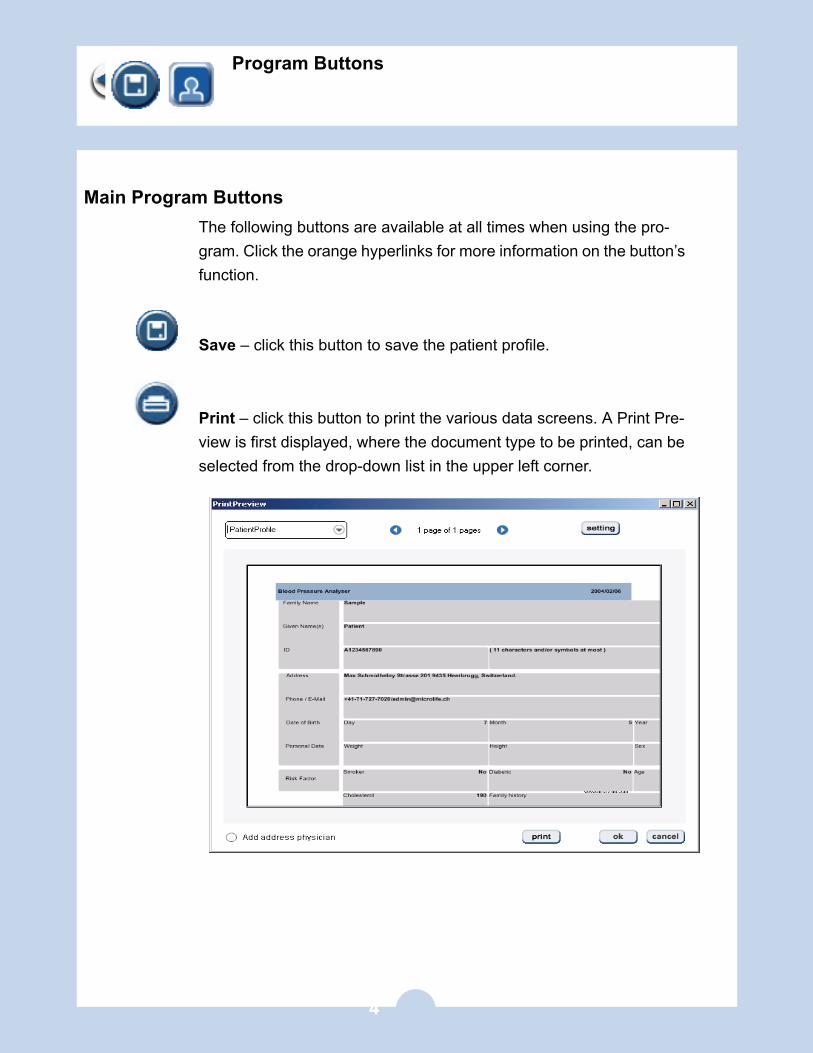
Main Program ButtonsThe following buttons are available at all times when using the pro-gram. Click the orange hyperlinks for more information on the button’s function.
Save – click this button to save the patient profile.
Print – click this button to print the various data screens. A Print Pre-view is first displayed, where the document type to be printed, can be selected from the drop-down list in the upper left corner.
4
Program Buttons
Settings – click to set preferences for time and date, select pulse pressure or Mean Arterial Pressure (MAP) view, set the systolic and diastolic pressure standards, set the BPM clock, and export/import patient profiles to and from the program’s database.
Help – click this button to access the BPA program’s online help.
Quit – click to quit the BPA program.
5
Program Buttons
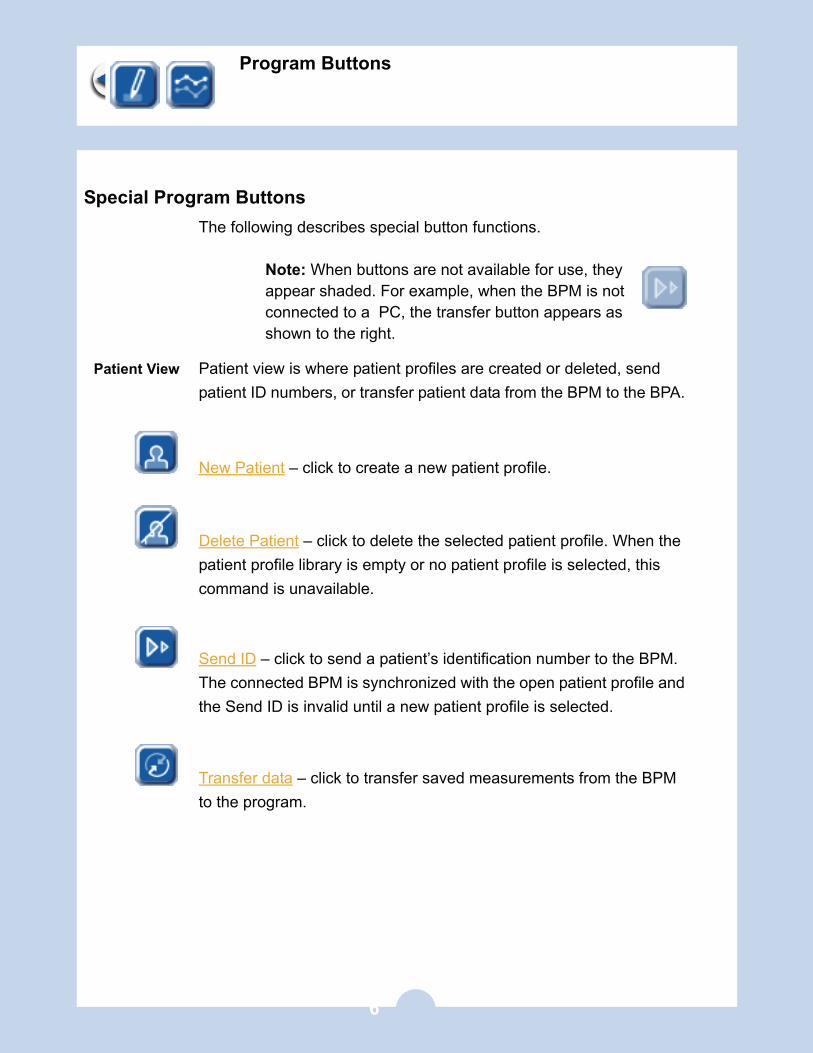
Special Program ButtonsThe following describes special button functions.
Note: When buttons are not available for use, they appear shaded. For example, when the BPM is not connected to a PC, the transfer button appears as shown to the right.
Patient View Patient view is where patient profiles are created or deleted, send patient ID numbers, or transfer patient data from the BPM to the BPA.
New Patient – click to create a new patient profile.
Delete Patient – click to delete the selected patient profile. When the patient profile library is empty or no patient profile is selected, this command is unavailable.
Send ID – click to send a patient’s identification number to the BPM. The connected BPM is synchronized with the open patient profile and the Send ID is invalid until a new patient profile is selected.
Transfer data – click to transfer saved measurements from the BPM to the program.
6
Managing Patient Profiles
Graph View
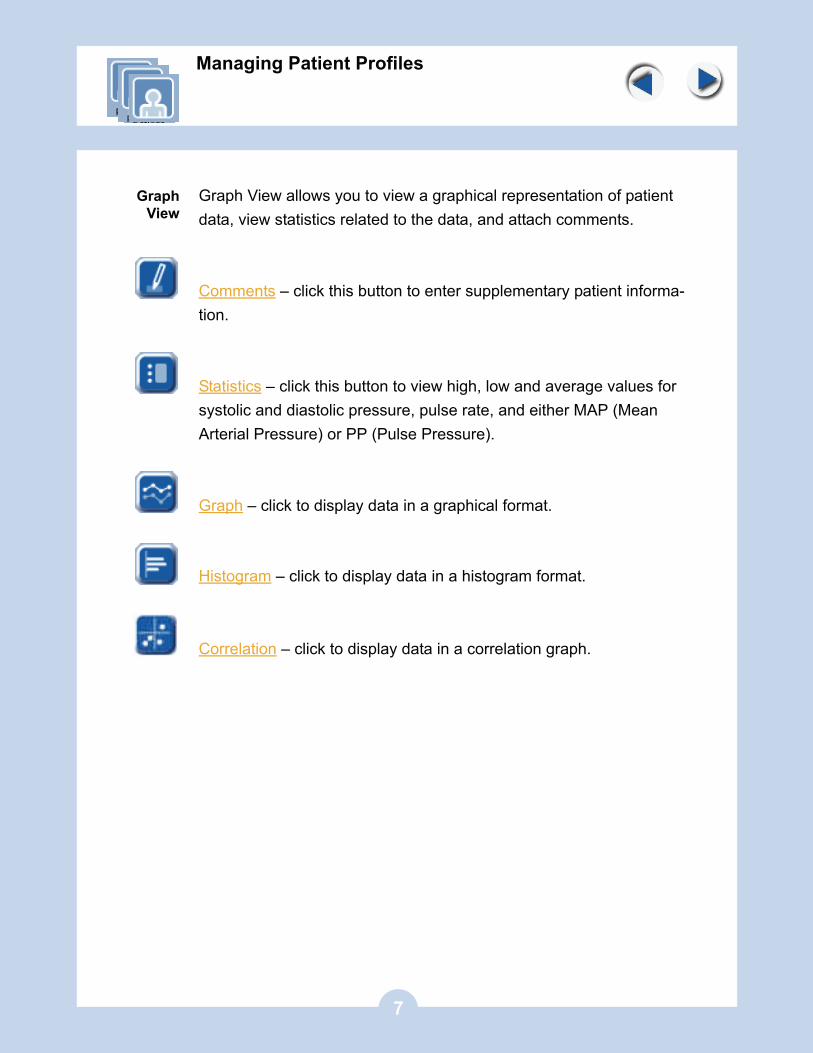
Graph View allows you to view a graphical representation of patient data, view statistics related to the data, and attach comments.
Comments – click this button to enter supplementary patient informa-tion.
Statistics – click this button to view high, low and average values for systolic and diastolic pressure, pulse rate, and either MAP (Mean Arterial Pressure) or PP (Pulse Pressure).
Graph – click to display data in a graphical format.
Histogram – click to display data in a histogram format.
Correlation – click to display data in a correlation graph.
7
Managing Patient Profiles
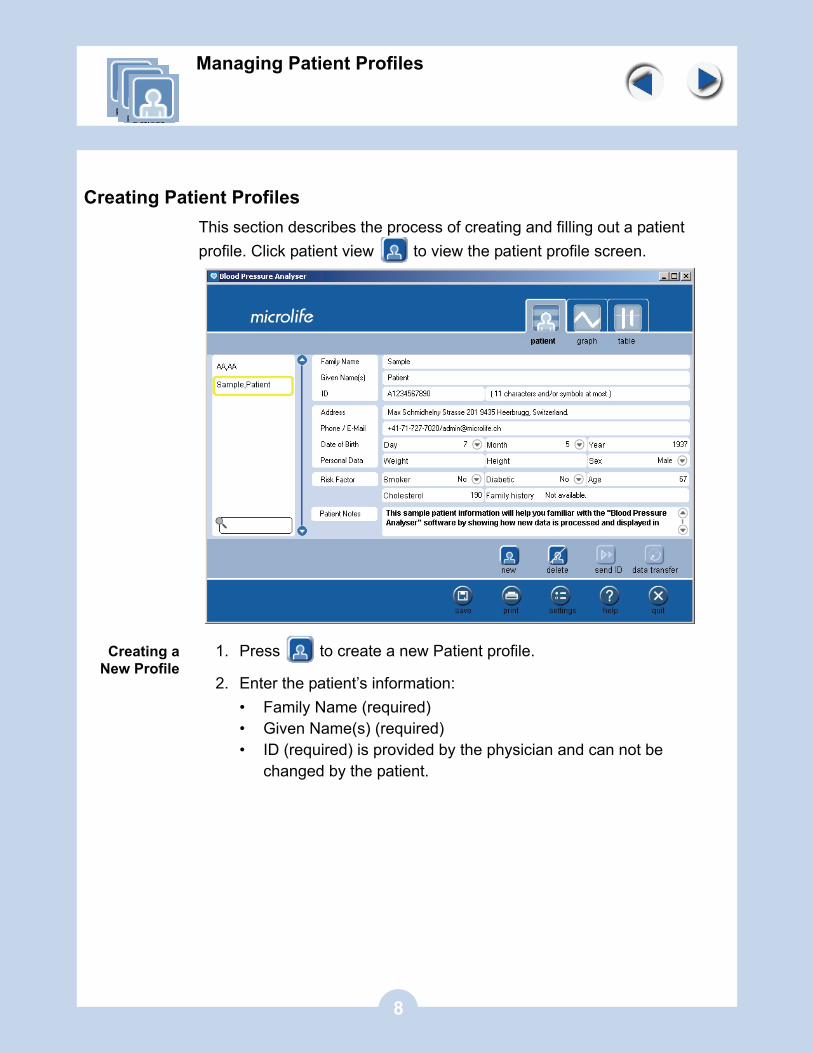
Creating Patient ProfilesThis section describes the process of creating and filling out a patient profile. Click patient view to view the patient profile screen.
Creating aNew Profile
1. Press to create a new Patient profile.
2. Enter the patient’s information:• Family Name (required)• Given Name(s) (required)• ID (required) is provided by the physician and can not be
changed by the patient.
8
Managing Patient Profiles
3. Enter the patient’s contact information and birth data.• Address/Phone/Email address• Date of Birth – press to select the patient’s month, day,
and year of birth from the drop-down list4. Enter the patient’s personal data information.
• Weight – type the patient’s weight (kilograms or pounds)• Height – type the patient’s height (centimeters or inches)• Sex – press to select the patient’s gender from the drop-
down list5. Enter information pertaining to the patient’s health and risk fac-
tors.
• Smoker – press to select yes or no for whether the patient smokes
• Diabetic – press to select yes or no for whether the patient has diabetes
• Age – age is automatically calculated from the birth date entry
• Cholesterol – type the patient’s cholesterol levels• Family History – type family related information pertaining to
the patient’s medical condition• Patient Notes – type miscellaneous information related to
the patient
Deleting aPatientProfile
Select a profile from the patient profile list and click to delete the patient’s record from the BPA program.
Searching fora Patient
Patient profiles can be searched by entering the patient’s name in the Search field.
Type the patient’s name in the Search field. The program lists all patients with names that have the same first let-ter.
Smith
9
Managing Patient Profiles
ManagingPatient IDs
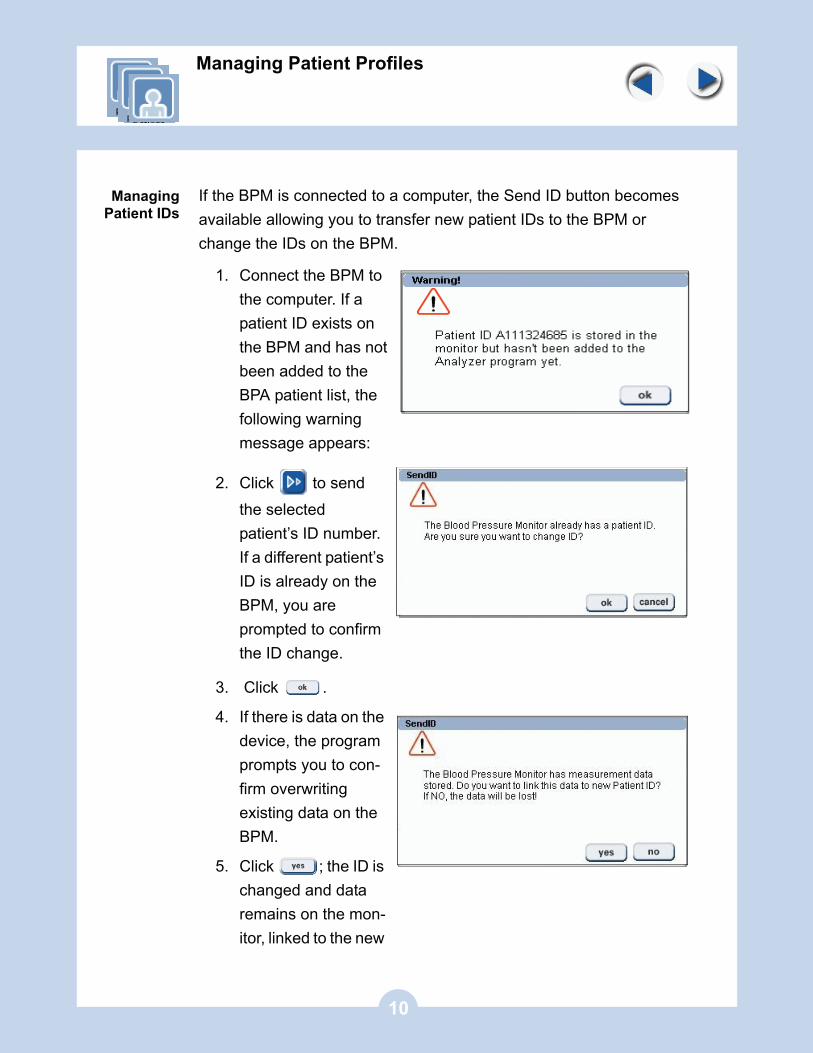
If the BPM is connected to a computer, the Send ID button becomes available allowing you to transfer new patient IDs to the BPM or change the IDs on the BPM.
1. Connect the BPM to the computer. If a patient ID exists on the BPM and has not been added to the BPA patient list, the following warning message appears:
2. Click to send the selected patient’s ID number. If a different patient’s ID is already on the BPM, you are prompted to confirm the ID change.
3. Click .
4. If there is data on the device, the program prompts you to con-firm overwriting existing data on the BPM.
5. Click ; the ID is changed and data remains on the mon-itor, linked to the new
10
Analyzing Patient Profile Data
patient ID. Click to change the ID and delete the data on the monitor.
Once a patient ID is sent to the BPM, the patient’s profile automati-cally opens every time you connect to the BPM as long as the ID remains unchanged.
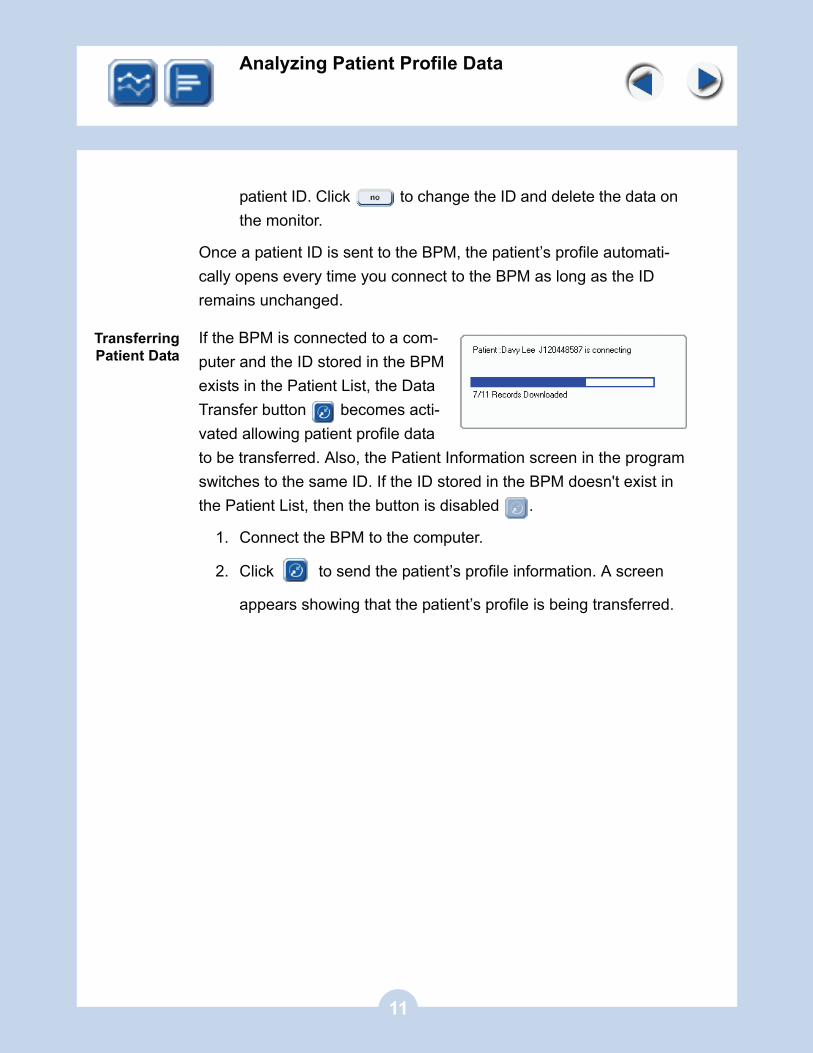
TransferringPatient Data
If the BPM is connected to a com-puter and the ID stored in the BPM exists in the Patient List, the Data Transfer button becomes acti-vated allowing patient profile data to be transferred. Also, the Patient Information screen in the program switches to the same ID. If the ID stored in the BPM doesn't exist in the Patient List, then the button is disabled .
1. Connect the BPM to the computer.
2. Click to send the patient’s profile information. A screen
appears showing that the patient’s profile is being transferred.
11
Analyzing Patient Profile Data
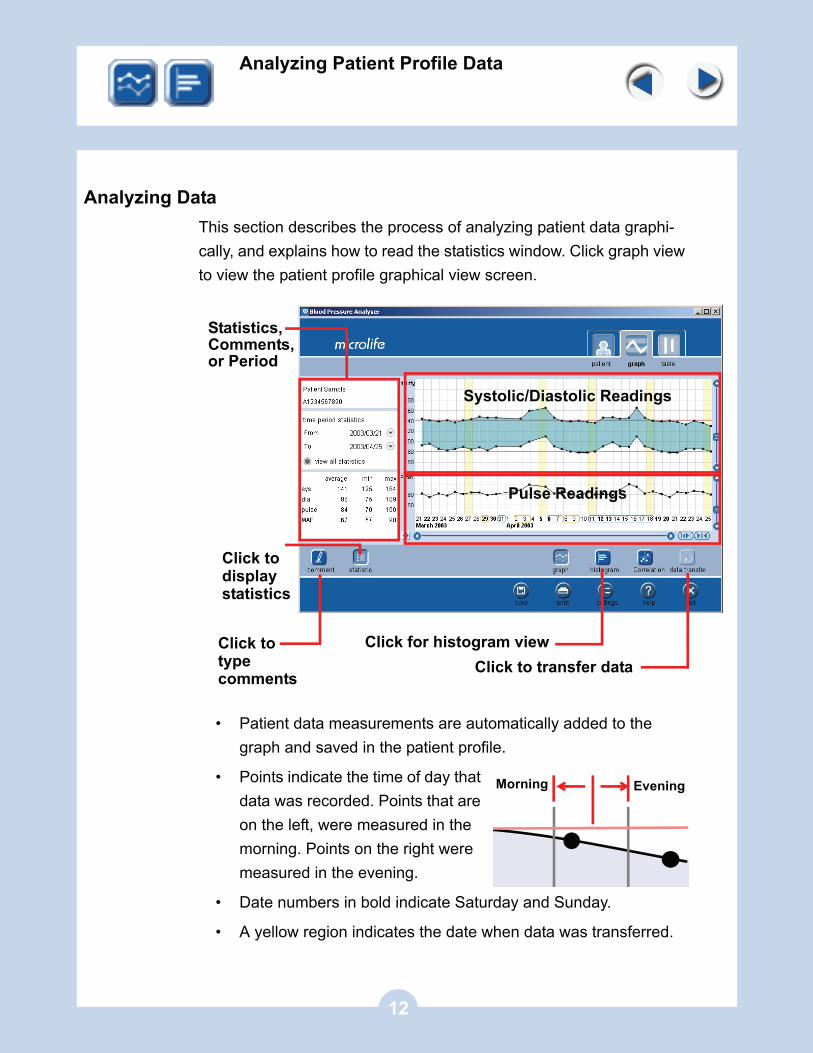
Analyzing DataThis section describes the process of analyzing patient data graphi-cally, and explains how to read the statistics window. Click graph view to view the patient profile graphical view screen.
• Patient data measurements are automatically added to the graph and saved in the patient profile.
• Points indicate the time of day that data was recorded. Points that are on the left, were measured in the morning. Points on the right were measured in the evening.
• Date numbers in bold indicate Saturday and Sunday.
• A yellow region indicates the date when data was transferred.
Systolic/Diastolic Readings
Click for histogram view
Click todisplaystatistics
Click totypecomments
Pulse Readings
Click to transfer data
Statistics,Comments,or Period
EveningMorning
12
Analyzing Patient Profile Data
Navigatingthe Graph
Window
Click and to scroll the view up and down. Click and to
scroll the view left and right. Alternatively, you can click and drag to change the view.
Click to condense the view. Click to expand the view.
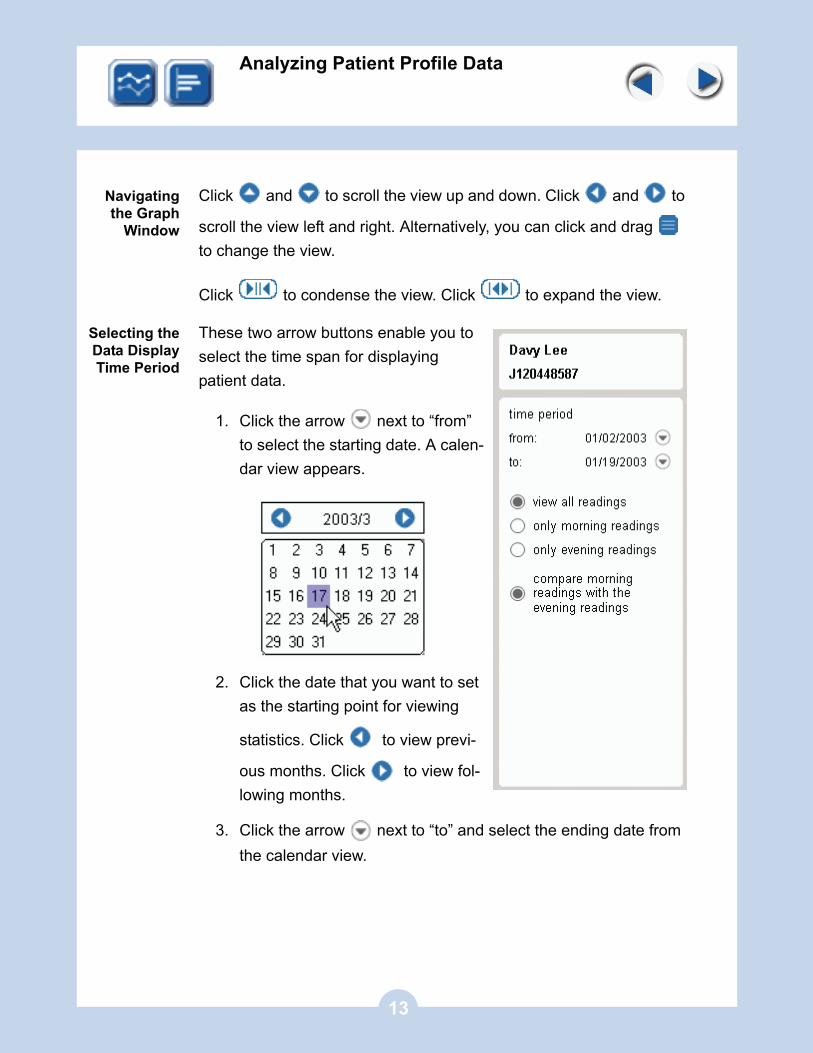
Selecting theData DisplayTime Period
These two arrow buttons enable you to select the time span for displaying patient data.
1. Click the arrow next to “from” to select the starting date. A calen-dar view appears.
2. Click the date that you want to set as the starting point for viewing
statistics. Click to view previ-
ous months. Click to view fol-lowing months.
3. Click the arrow next to “to” and select the ending date from the calendar view.
13
Analyzing Patient Profile Data
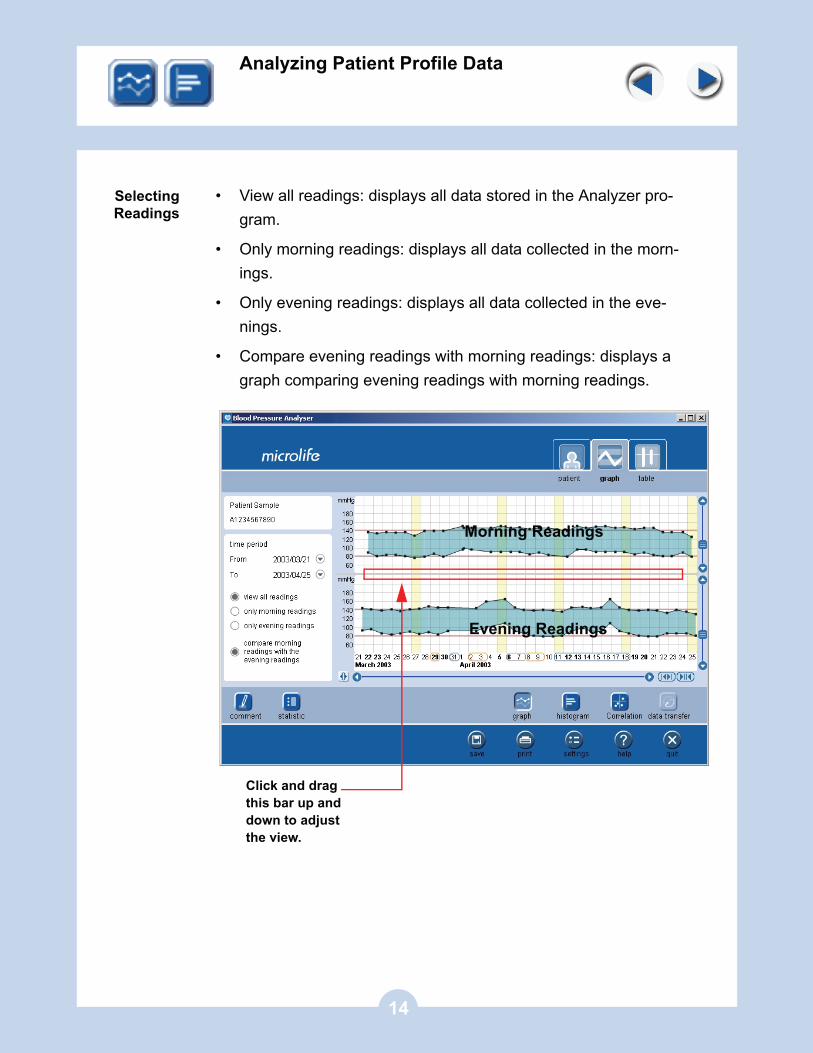
SelectingReadings
• View all readings: displays all data stored in the Analyzer pro-gram.
• Only morning readings: displays all data collected in the morn-ings.
• Only evening readings: displays all data collected in the eve-nings.
• Compare evening readings with morning readings: displays a graph comparing evening readings with morning readings.
Evening Readings
Morning Readings
Click and drag this bar up and down to adjust the view.
14
Analyzing Patient Profile Data
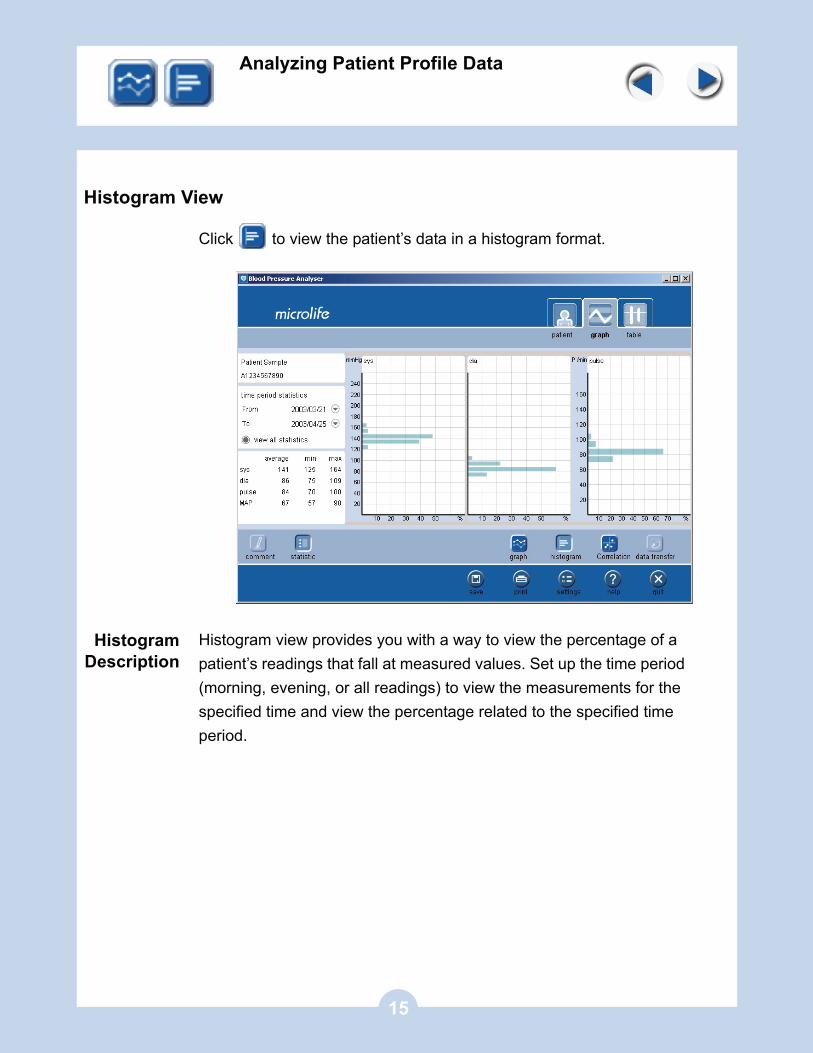
Histogram View
Click to view the patient’s data in a histogram format.
HistogramDescription
Histogram view provides you with a way to view the percentage of a patient’s readings that fall at measured values. Set up the time period (morning, evening, or all readings) to view the measurements for the specified time and view the percentage related to the specified time period.
15
Analyzing Patient Profile Data
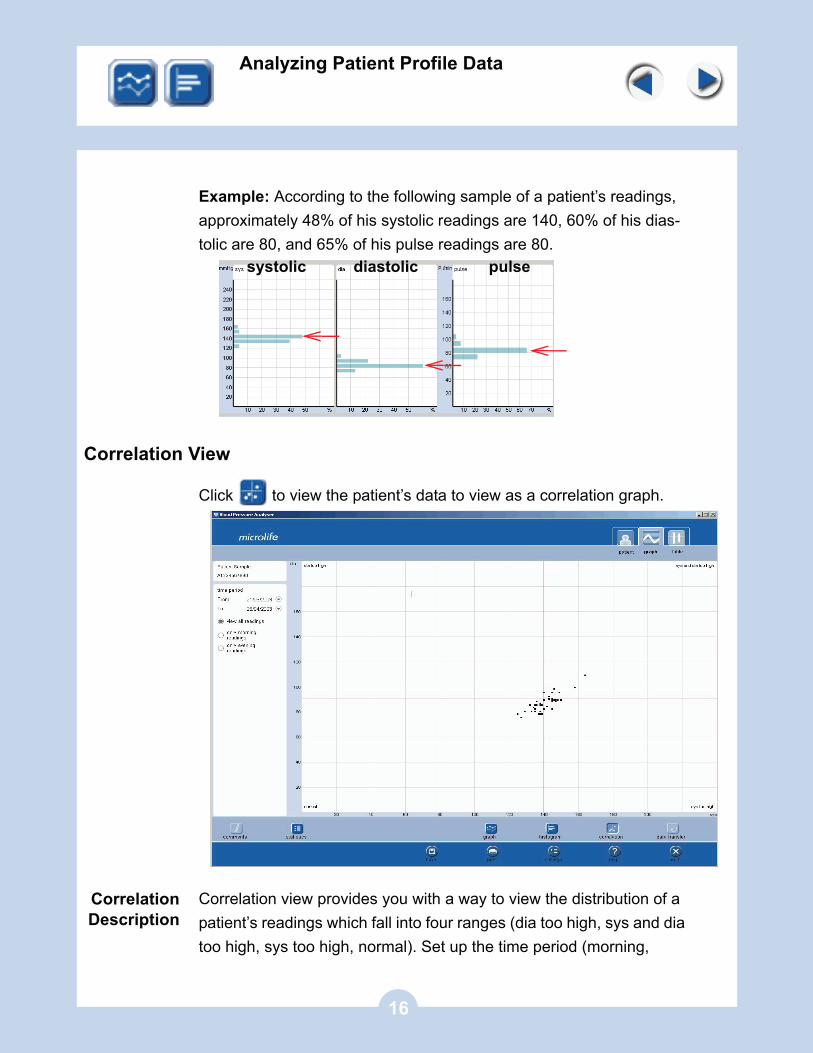
Example: According to the following sample of a patient’s readings, approximately 48% of his systolic readings are 140, 60% of his dias-tolic are 80, and 65% of his pulse readings are 80.
Correlation View
Click to view the patient’s data to view as a correlation graph.
CorrelationDescription
Correlation view provides you with a way to view the distribution of a patient’s readings which fall into four ranges (dia too high, sys and dia too high, sys too high, normal). Set up the time period (morning,
systolic diastolic pulse
16
Analyzing Patient Profile Data
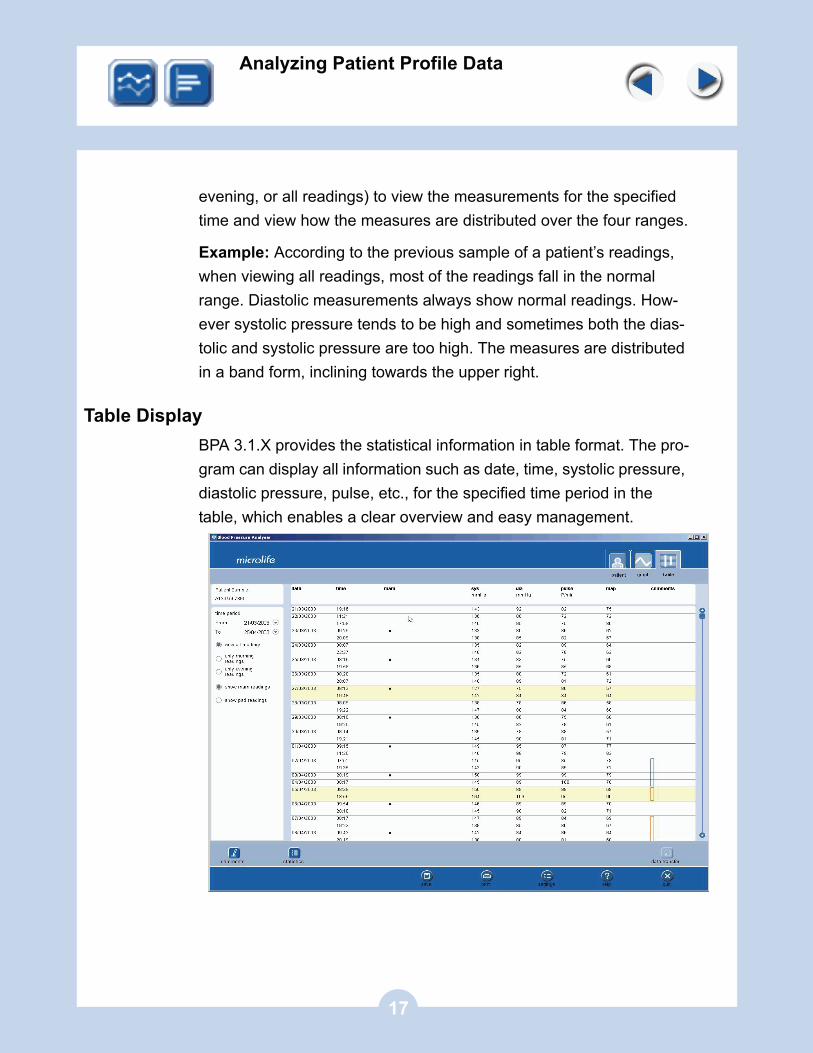
evening, or all readings) to view the measurements for the specified time and view how the measures are distributed over the four ranges.
Example: According to the previous sample of a patient’s readings, when viewing all readings, most of the readings fall in the normal range. Diastolic measurements always show normal readings. How-ever systolic pressure tends to be high and sometimes both the dias-tolic and systolic pressure are too high. The measures are distributed in a band form, inclining towards the upper right.
Table DisplayBPA 3.1.X provides the statistical information in table format. The pro-gram can display all information such as date, time, systolic pressure, diastolic pressure, pulse, etc., for the specified time period in the table, which enables a clear overview and easy management.
17
Analyzing Patient Profile Data
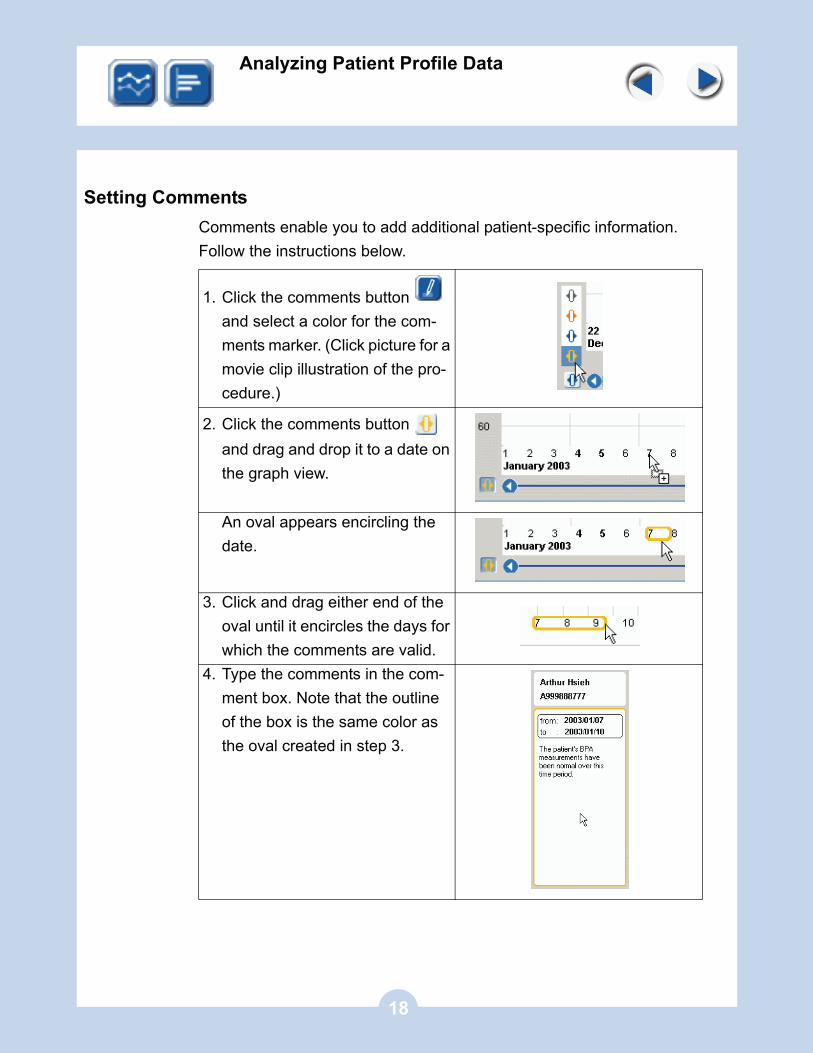
Setting CommentsComments enable you to add additional patient-specific information. Follow the instructions below.
1. Click the comments button and select a color for the com-ments marker. (Click picture for a movie clip illustration of the pro-cedure.)
2. Click the comments button and drag and drop it to a date on the graph view.
An oval appears encircling the date.
3. Click and drag either end of the oval until it encircles the days for which the comments are valid.
4. Type the comments in the com-ment box. Note that the outline of the box is the same color as the oval created in step 3.
18
Changing Program Settings
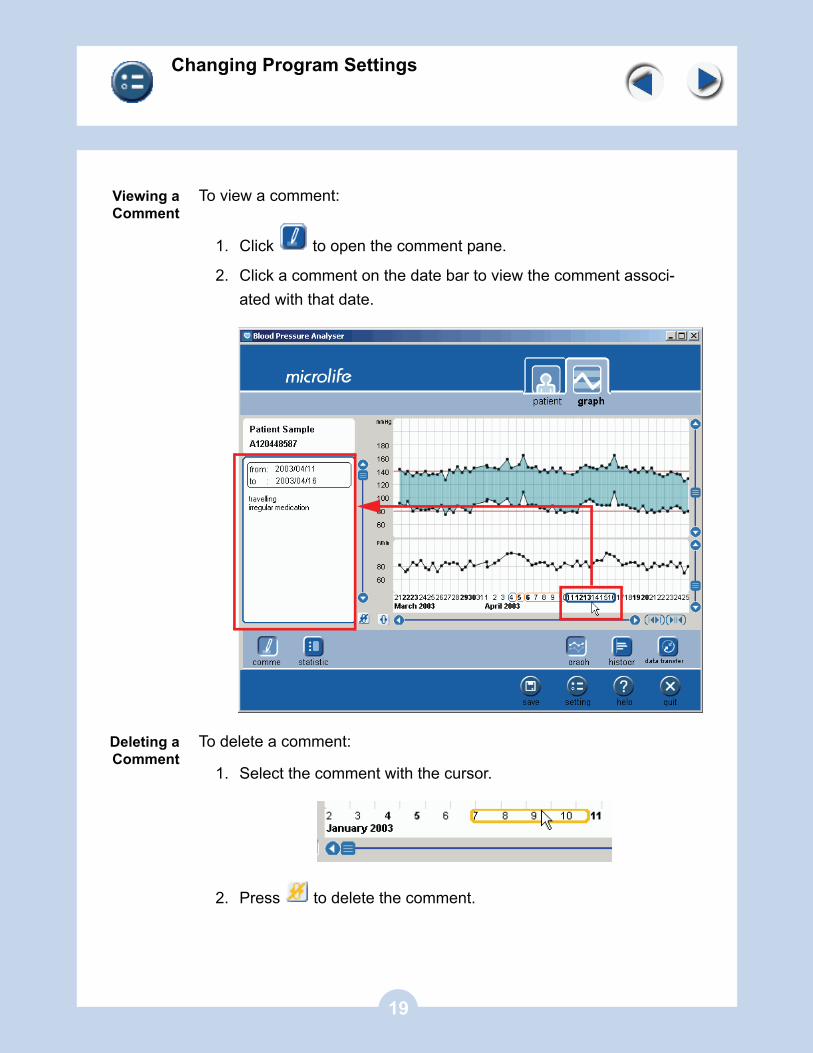
Viewing aComment
To view a comment:
1. Click to open the comment pane.
2. Click a comment on the date bar to view the comment associ-ated with that date.
Deleting aComment
To delete a comment:
1. Select the comment with the cursor.
2. Press to delete the comment.
19
Changing Program Settings
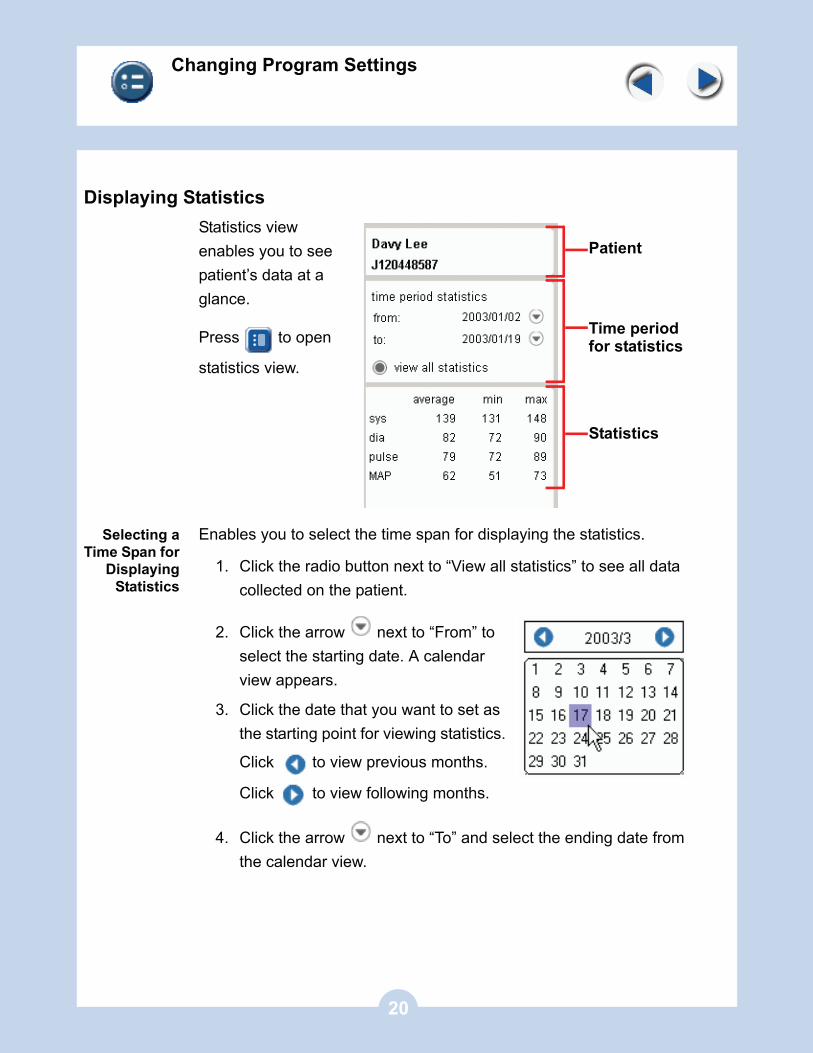
Displaying StatisticsStatistics view enables you to see patient’s data at a glance.
Press to open
statistics view.
Selecting aTime Span for
DisplayingStatistics
Enables you to select the time span for displaying the statistics.
1. Click the radio button next to “View all statistics” to see all data collected on the patient.
2. Click the arrow next to “From” to select the starting date. A calendar view appears.
3. Click the date that you want to set as the starting point for viewing statistics.
Click to view previous months.
Click to view following months.
4. Click the arrow next to “To” and select the ending date from the calendar view.
Time periodfor statistics
Statistics
Patient
20
Changing Program Settings
ViewingStatistics
Data
The statistics view displays the following information:
• Systolic – displays the average systolic pressure measured for the chosen time period, and displays the maximum and mini-mum values.
• Diastolic – displays the average diastolic pressure measured for the chosen time period, and displays the maximum and min-imum values.
• Pulse – displays the average pulse rate measured for the cho-sen time period, and displays the maximum and minimum val-ues.
• MAP – displays the average Mean Arterial Pressure (MAP) for the chosen time period, and displays the maximum and mini-mum values.
• PP – displays the average pulse pressure measured for the chosen time period, and displays the maximum and minimum values.
Note: MAP and PP are not displayed at the same time. Choose the one to be displayed in Settings.
21
Changing Program Settings
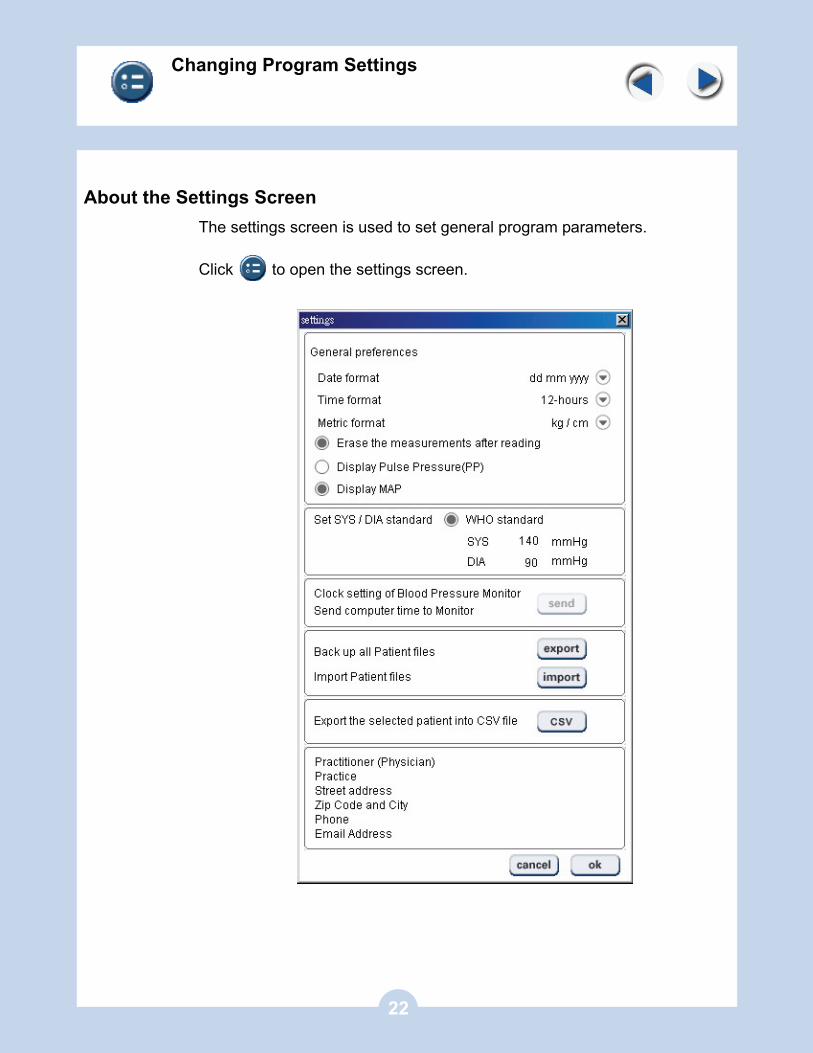
About the Settings ScreenThe settings screen is used to set general program parameters.
Click to open the settings screen.
22
Changing Program Settings
The following describes each item which can be set.
GeneralPreferences
• Date format – enables you to select the format in which the date is displayed: DD.MM.YYYY, MM.DD.YYYY, or YYYY.MM.DD.
• Time format – enables you to select the format in which the time is displayed: 12-hour or 24-hour.
• Metric format – enables you to select the measurement to use: kilograms per centimeter (kg/cm) or pound per inch (lb./in).
• Erase the measurements after reading – click this radio but-ton to enable the program to erase the measurements on the BPM after reading them.
• Display Pulse Pressure – click this radio button if you prefer to display pulse pressure (PP) in the statistics view.
• Display MAP – click this radio button if you prefer to mean arte-rial pressure (MAP) in the statistics view.
Note: The Blood Pressure Analyzer provides two ways to view information about arterial pressure:
Pulse Pressure (PP) and Mean Arterial Pressure (MAP). Some doctors prefer to work with PP and others with MAP. PP is the difference between SYS and DIA ( SYS-DIA=PP for example: 150 - 80=70mmHg ).MAP is not equal to the average of systolic and diastolic. It is calculated by the formula: Pdia + 1/3Ppulse, where Ppulse=Psys – Pdia.For example, with a Psys= 130, Pdia=80:MAP = 80 + 1/3(130-80) = 96.7
23
Changing Program Settings
Setting theSYS/DIA
Standard
Enables you to set the standard by which systolic and diastolic pres-sure is gauged.
• WHO Standard (140/90) – click the radio button to use the stan-dard set by the World Health Organization — 140 (systolic) and 90 (diastolic)
• SYS/DIA – type in a defined stan-dard into the systolic and diastolic fields:
Setting theBPM Clock
Time and date can be transferred from the computer to the BPM.The program will inform when there's a time difference between the BPM and the computer.
Click to set the BPM time to that of the connected computer.
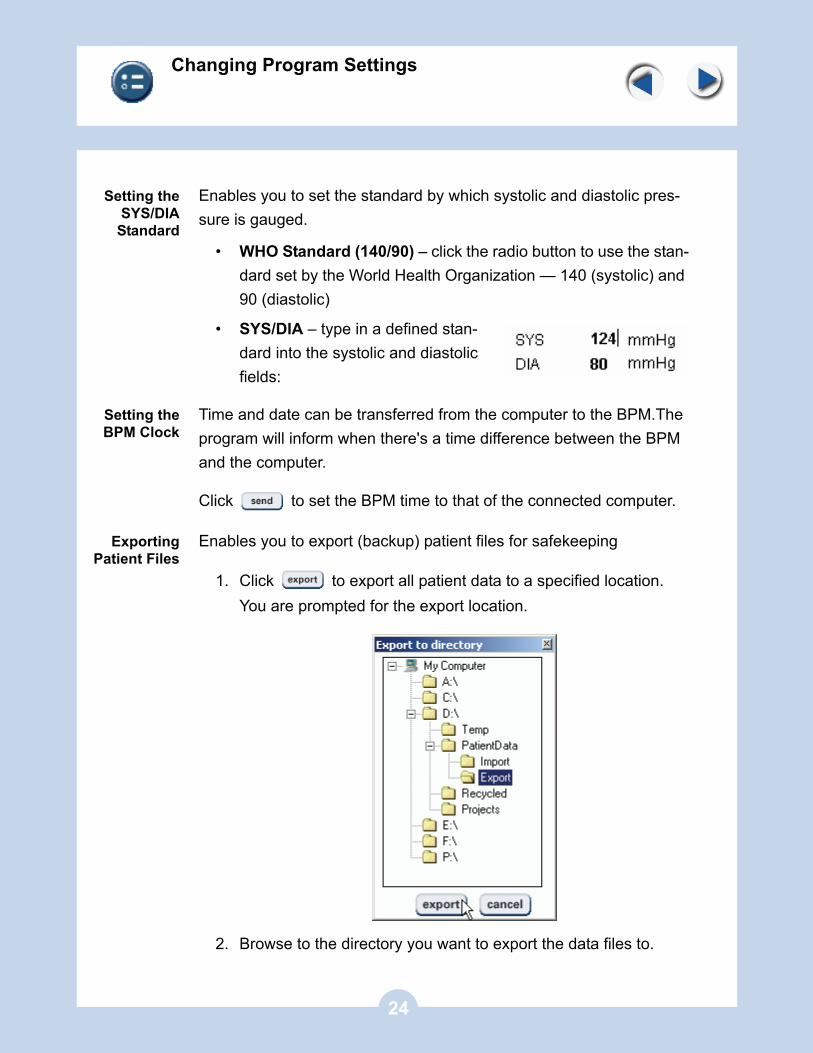
ExportingPatient Files
Enables you to export (backup) patient files for safekeeping
1. Click to export all patient data to a specified location. You are prompted for the export location.
2. Browse to the directory you want to export the data files to.
24
Changing Program Settings
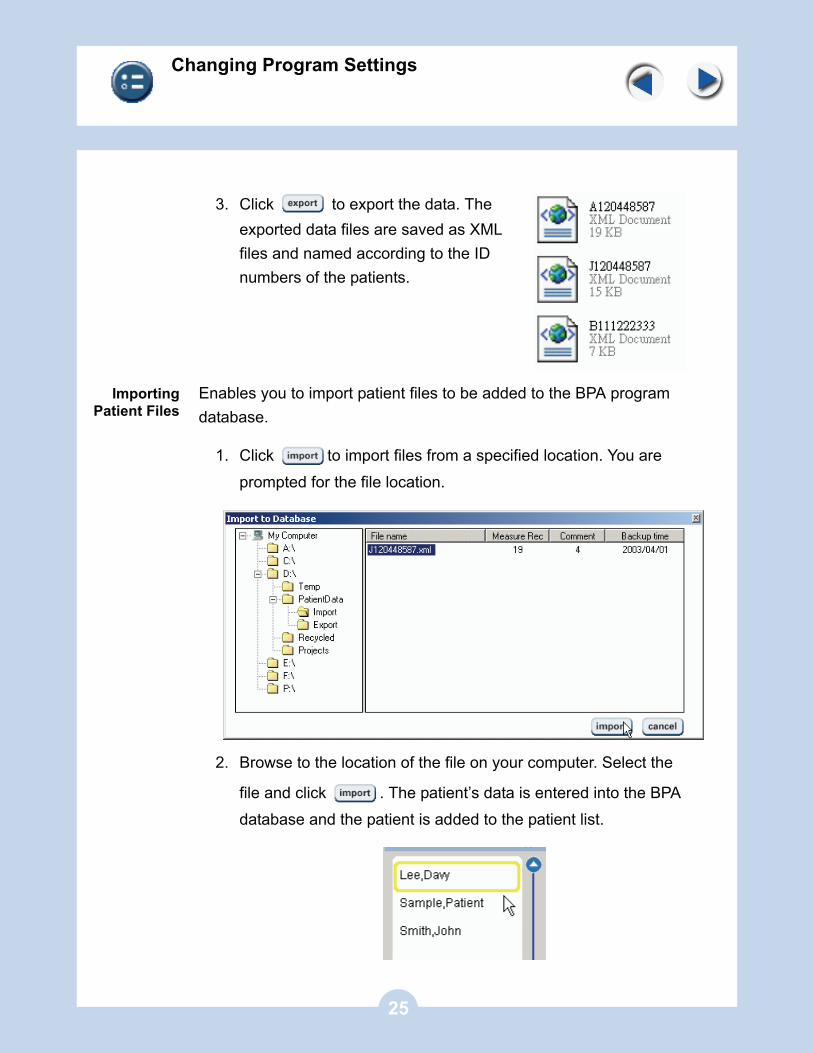
3. Click to export the data. The exported data files are saved as XML files and named according to the ID numbers of the patients.
ImportingPatient Files
Enables you to import patient files to be added to the BPA program database.
1. Click to import files from a specified location. You are prompted for the file location.
2. Browse to the location of the file on your computer. Select the
file and click . The patient’s data is entered into the BPA database and the patient is added to the patient list.
25
Changing Program Settings
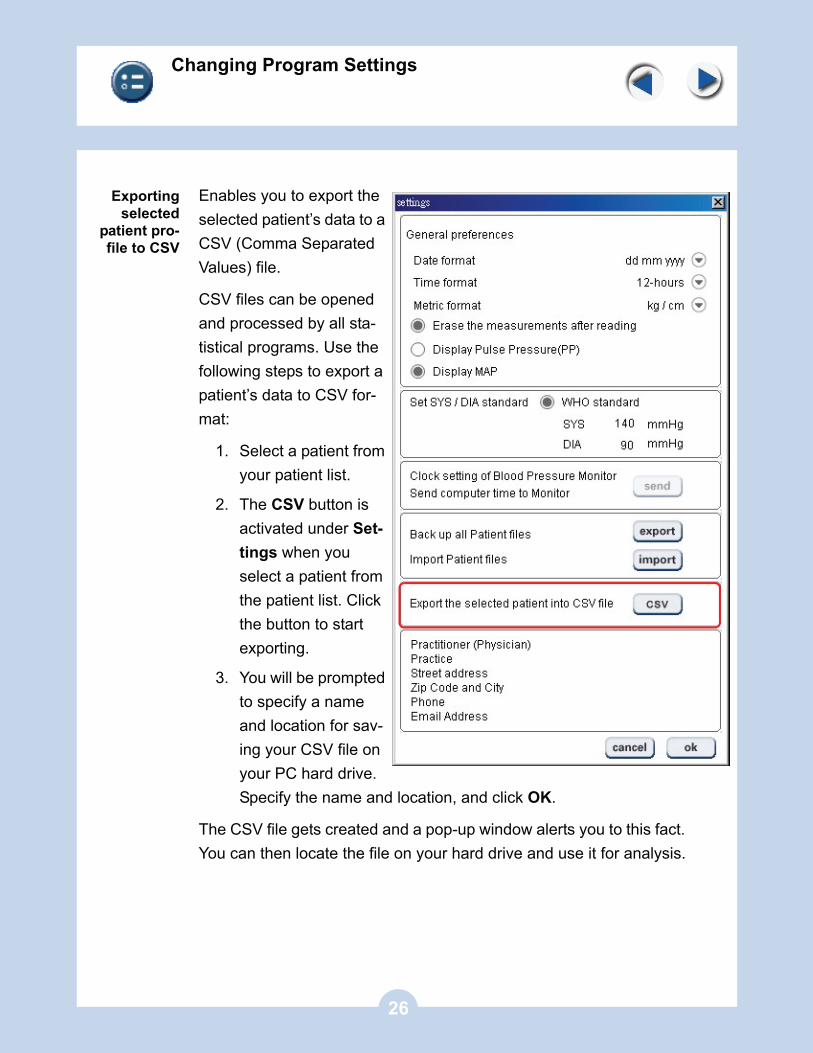
Exportingselected
patient pro-file to CSV
Enables you to export the selected patient’s data to a CSV (Comma Separated Values) file.
CSV files can be opened and processed by all sta-tistical programs. Use the following steps to export a patient’s data to CSV for-mat:
1. Select a patient from your patient list.
2. The CSV button is activated under Set-tings when you select a patient from the patient list. Click the button to start exporting.
3. You will be prompted to specify a name and location for sav-ing your CSV file on your PC hard drive. Specify the name and location, and click OK.
The CSV file gets created and a pop-up window alerts you to this fact. You can then locate the file on your hard drive and use it for analysis.
26
Frequently Asked Questions / BPA Software
Frequently Asked Questions
Part A Installation, Drivers, and Downloading
Q1 Why won't my unit download despite the fact I have properly created a profile in the software?
• Make sure the unit was connected to the computer by the USB cable before installing the drivers. If not, uninstall the software and repeat the process correctly.
• You may need to reboot your computer before the changes take effect.
• Verify the unit is connected and try plugging the cable into another USB port.
• Make sure the blood pressure monitor has batteries installed properly or is connected to an AC adapter and plugged in.
Q2 Can I connect my BP unit to a USB hub?
We recommend only the use of Active USB Hubs. Connection may fail with passive USB hubs because of unstable power sup-ply.
Q3 Will other devices interfere with my ability to download my BP unit?
Sometimes, other devices will occupy the virtual-com port used by our device. Our device will not recognize the used virtual-com port and will not communicate. Please DO NOT connect other devices while connecting your blood pressure monitor to the computer.
Q4 I have downloaded my unit once before and now it will not download.
Try to manually reinstall the drivers. Run the HidComInst.exe file under the software USB Driver folder. Make sure that you select the correct patient before attempting to download your measurements.
27
Frequently Asked Questions / BPA Software
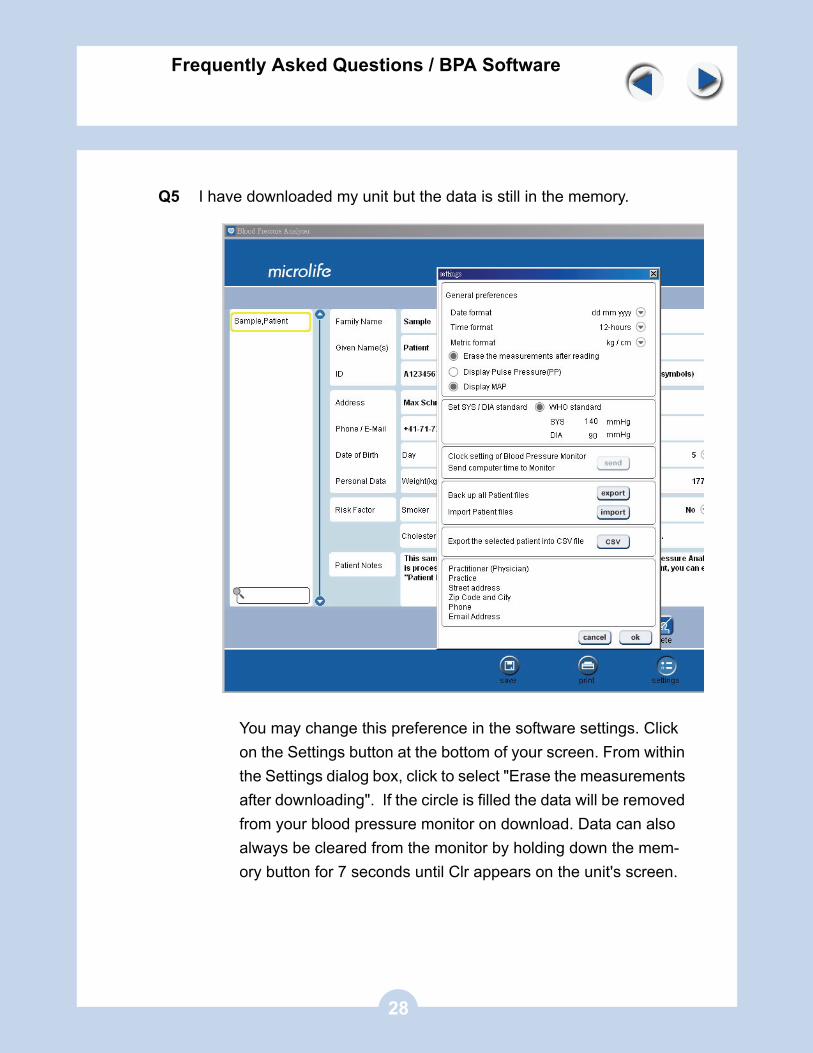
Q5 I have downloaded my unit but the data is still in the memory.
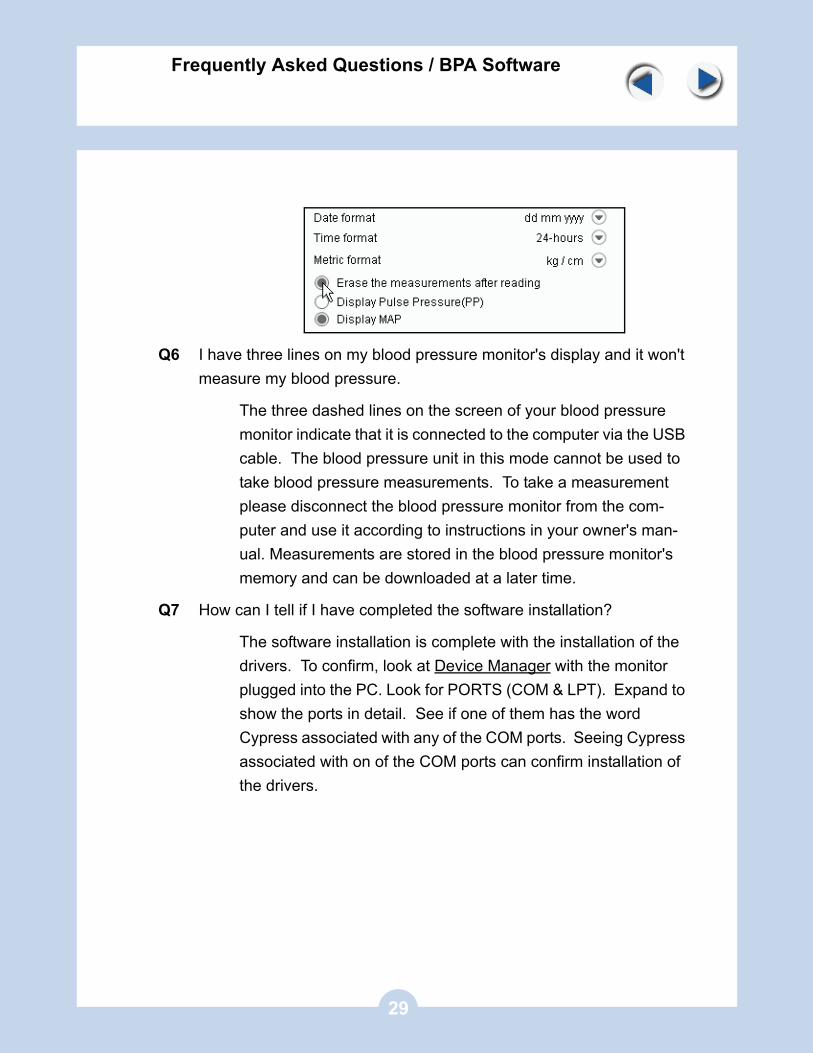
You may change this preference in the software settings. Click on the Settings button at the bottom of your screen. From within the Settings dialog box, click to select "Erase the measurements after downloading". If the circle is filled the data will be removed from your blood pressure monitor on download. Data can also always be cleared from the monitor by holding down the mem-ory button for 7 seconds until Clr appears on the unit's screen.
28
Frequently Asked Questions / BPA Software
Q6 I have three lines on my blood pressure monitor's display and it won't measure my blood pressure.
The three dashed lines on the screen of your blood pressure monitor indicate that it is connected to the computer via the USB cable. The blood pressure unit in this mode cannot be used to take blood pressure measurements. To take a measurement please disconnect the blood pressure monitor from the com-puter and use it according to instructions in your owner's man-ual. Measurements are stored in the blood pressure monitor's memory and can be downloaded at a later time.
Q7 How can I tell if I have completed the software installation?
The software installation is complete with the installation of the drivers. To confirm, look at Device Manager with the monitor plugged into the PC. Look for PORTS (COM & LPT). Expand to show the ports in detail. See if one of them has the word Cypress associated with any of the COM ports. Seeing Cypress associated with on of the COM ports can confirm installation of the drivers.
29
Frequently Asked Questions / BPA Software
Part B Software Operation
Q1 Can I print all my memories from software with a printer?
Yes. Click the Print button on the bottom of your screen. From the drop down menu, select the type of page to print, then click the print button.
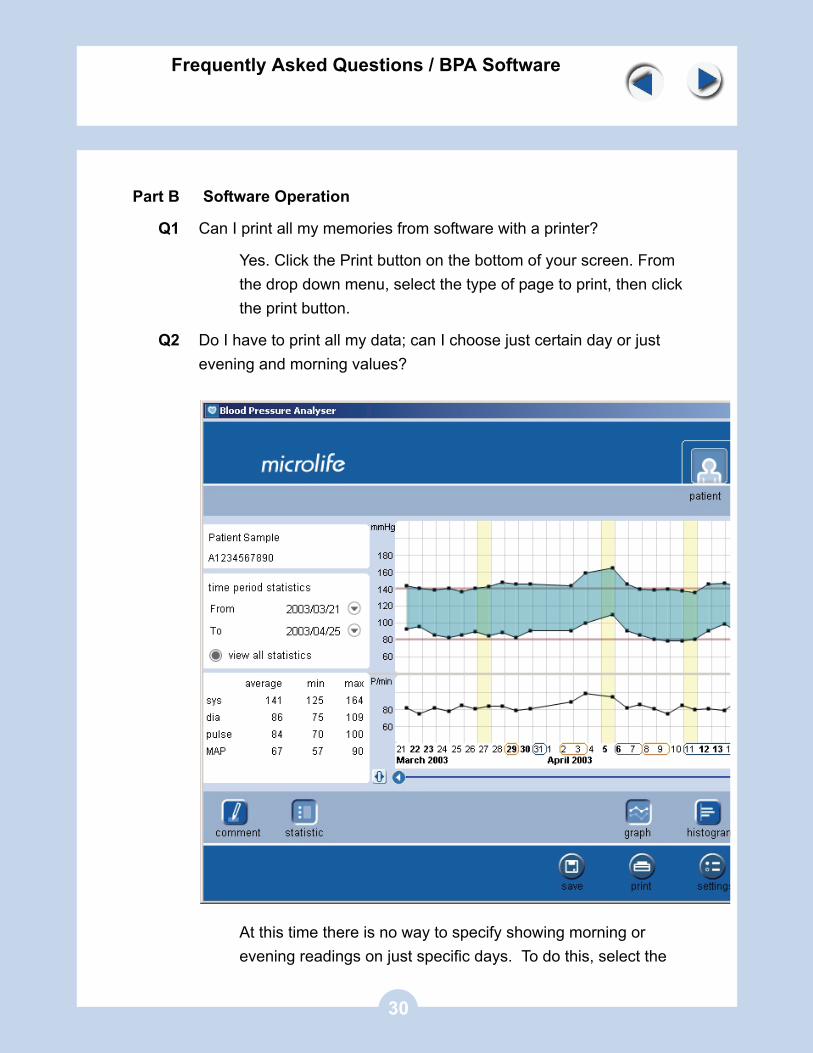
Q2 Do I have to print all my data; can I choose just certain day or just evening and morning values?
At this time there is no way to specify showing morning or evening readings on just specific days. To do this, select the
30
Frequently Asked Questions / BPA Software
Graph tab on the top right corner of your screen, adjust the From and To date ranges. Then go back to the Print screen to proceed.
Q3 How many patients can I put in?
There is no limit to the number of patient profiles that you can create in the software. As normally happens in computers, a large database may slow down your PC system.
Q4 Why are there yellow lines on my graphs and in my tables and why are some of them darker than others?
Every time you download the software indicates the date by col-oring the date a light yellow. Downloading every day the soft-ware colors the days dark yellow on alternating days to separate the different days from on another. In printing out the data the darker yellow highlights may make it difficult to read the data underneath. This can be avoided by not downloading every day. Your blood pressure monitor has enough memory that you only need to download once or twice a week.
Q5 Are any specific files required to run this software?
Our software does require the Microsoft.NET Framework to function. The Software will not run without MSCOREE.DLL installed.
Q6 Is there any specific hardware required by the BPA software?
There is no special hardware required, just a USB port.
Q7 How do I back up my data?
Using the Export and Import functions in the Settings section. You can export all the patient profiles to one of your drives. Each patient will have a XML file. In the event of the problem the files can be imported back into the BPA software.
31
Frequently Asked Questions / BPA Software
Q8 I accidentally download my data to the wrong profile, is there anything I can do to fix it?
Always make sure before downloading data that you select the correct patient. If the "Erase measurements after downloading" preference was selected, data in the blood pressure monitor will be erased. If it was not selected, data is still in the monitor's memory and can be downloaded again, to the correct patient.
Q9 I am seeing two data points super imposed on top of one another in my graph.
Downloading the same data twice causes this. Please go into Setting and select the "erase measurements after download" option. Or manually clear the data in your blood pressure moni-tor after every download by pressing and holding the memory button until Clr appears on the screen.
Q10 How I can reinstall the software without losing the data already trans-ferred in?
You may export all of your data first as XML files. Then, after reinstallation, you can import these XML files back into the soft-ware.
Q11 How does my Microsoft.NET security level affect the BPA software? How do the different Service Packs (1 and 2) influence it?
The default security level in computers is "Full Trusted". If changed to a lower trust level, it may prevent the functioning of the BPA software on XP environment.
32