Embed Size (px)
Citation preview
Programmable transport of micro- and nanoparticles by Paramecium1
caudatum2
Richard Maynea,∗, Jack Morganb, Neil Phillipsa, James Whitinga, Andy Adamatzkya3
aUnconventional Computing Laboratory, UWE, Bristol, BS16 1QY, United Kingdom4
bFaculty of Health and Applied Sciences, UWE, Bristol, BS16 1QY, United Kingdom5
Abstract6
We exploit chemo- and galvanotactic behaviour of Paramecium caudatum to design a hybrid device thatallows for controlled uptake, transport and deposition of environmental micro- and nanoparticulates in anaqueous medium. Manipulation of these objects is specific, programmable and parallel. We demonstrate howdevice operation and output interpretation may be automated via a DIY low-cost fluorescence spectrometer,driven by a microprocessor board. The applications of the device presented range from collection anddetoxification of environmental contaminants (e.g. nanoparticles), to micromixing, to natural expressions ofcomputer logic.
Keywords: Ciliate, Parallel manipulation, Biocomputing, Bio-inspired, Unconventional Computing,7
Nanoparticle8
The class of protistic freshwater organisms known as the ‘ciliates’ achieve locomotion, feeding and en-9
vironmental sensing via the functions of cell-surface organelles known as ‘motile cilia’ (hereafter ‘cilia’).10
Certain varieties of metazoan epithelia, such as the columnar epithelium found in the upper respiratory11
tract or fallopian tubes of humans, also possess cilia. A ciliated cell may possess thousands of these hair-like12
organelles which achieve their purposes via a rhythmic whip-like beating motion, which creates fluid cur-13
rents in surrounding fluid media. The emergent properties exhibited by collective ciliary motion, which are14
thought to be coordinated solely by local interactions [1, 2, 3, 4, 5, 6, 7, 8, 9, 10], have long-since been the15
focus of research for harnessing, mimicking and emulating for a range of biomedical and engineering uses16
[11, 12, 13, 14, 15, 16, 17, 18, 19, 20, 21, 22].17
Artificial cilia arrays have been considered in the context of self-cleaning or anti-fouling surfaces; following18
these lines of thought we developed a concept of programmable intake and transport of micro-objects by19
cilia arrays inspired by the ciliate Paramecium caudatum. Such arrays were capable of orientation and20
transportation of various geometrical shapes [23, 24] or objects [25]. Computer models on this concept have21
been partially confirmed in laboratory experiments [26]. Although manipulating single micro-particles on22
the surface of a live ciliate is an experimentally challenging task, we anticipate value in the prospect of large23
scale transfer of volumes of micro-particles via controlled intake of the particle by ciliates, movement of the24
ciliates with particle, and programmable release of the particles.25
Previously we proposed and studied in experimental laboratory conditions transfer of substances with26
slime mould [27], where the slime mould was stimulated to intake food colouring and propagate along the27
route determined by spatial configurations of sources of attractants and repellents. We a adopt similar28
strategy in our experiments with P. caudatum with the following objectives:29
1. Collection of micro-scale objects from specific locations by the organisms via internalisation and in-30
tracellular carriage, ideally with some form of discrimination between objects.31
∗Corresponding authorEmail addresses: [email protected] (Richard Mayne), [email protected] (Jack Morgan),
[email protected] (Neil Phillips), [email protected] (James Whiting), [email protected] (AndyAdamatzky)
Preprint submitted to NATURE COMMUNICATIONS December 7, 2017
All rights reserved. No reuse allowed without permission. (which was not peer-reviewed) is the author/funder, who has granted bioRxiv a license to display the preprint in perpetuity.
The copyright holder for this preprint. http://dx.doi.org/10.1101/231092doi: bioRxiv preprint first posted online Dec. 8, 2017;
2. Object transport to specific areas.32
3. Flexible transport (dynamic reprogrammability of specific operations).33
4. Controlled retention and deposition of ingested material.34
5. Parallelism and multitasking (manipulation of multiple varieties of object and ability to perform a35
range of operations).36
6. Modular construction and scalability.37
Although the capabilities of P. caudatum regarding their interactions with various particulates was38
covered thoroughly in historical literature [28, 29, 30], it was not until recently that these organisms have39
been characterised as doing useful ‘work’ in terms more amenable to quantitative descriptions. in our40
previous work, we have described P. caudatum interactions with environmentally-dispersed particulates as41
sorting (differential manipulation based on sensorial input) operations [26] and orchestrated (by humans)42
transport of environmental contaminants [31], as per criterion 1 in the above list.43
1. Methods44
1.1. P. caudatum culture45
P. caudatum were cultivated in a modified Chalkley’s medium enriched with 10 g of dried alfalfa and46
40 grains of wheat per litre at room temperature in non-sterile conditions. Cultures were exposed to a day47
and night cycle but were kept out of direct sunlight. Organisms were harvested in log growth phase by48
centrifugation at 400×G prior to being rinsed and resuspended in dechlorinated tap water (DTW).49
1.2. Experimental environment50
The standard experimental environment (EE) (Fig. 1) used consisted of two polyethylene cuvettes51
measuring 12 × 12 × 44 mm, affixed to the base of a glass microscope slide with epoxy resin (Araldite,52
Huntsman, USA). The tubes were linked at a point 1.5 mm above their base by flexible PTFE tubing, OD53
3.0 mm ID 1.0 mm length 5 mm, which were affixed to the cuvettes with epoxy. The length of the connecting54
tube was chosen to be short enough to reduce operation time and make the rate of diffusion proportional to55
the length of each experiment (see Appendix A.2). Prior to each experiment, both chambers (A, B) were56
filled with 2.0 ml of fresh culture medium. Care was taken to ensure that fluid levels were equal in both57
cuvettes and that the linking tube did not become air-locked. Whenever quantities of fluid containing cells58
or particles were added to a chamber, an equal quantity of fluid (DTW unless otherwise stated) was added59
to the other chamber simultaneously in order to prevent fluid transfer resulting from pressure changes.60
Initial control experiments designed to determine the rate of transfer of both inanimate microparticulates61
and P. caudatum cells between each chamber were designed as follows. For P. caudatum experiments,62
approximately 25 cells were transferred to chamber A in 100 µl of DTW. The EEs were placed on the stage63
of a stereomicroscope which was focused on chamber B. The sample was kept static for the duration of the64
experiment and was observed regularly every 4–6 hours. The microscope’s halogen lamp was switched off in65
between observations and the entire setup was exposed to a day/night cycle whilst being kept out of direct66
sunlight.67
Experiments examining particulate diffusion were conducted as above but the EEs had a concentrated68
amount of exogenous particles added to chamber A rather than cells. Two varieties of particulate were69
added:70
• 2.0 µm diameter carboxylate-modified latex microspheres labelled with fluorescein (Sigma Aldrich,71
Germany) (hereafter, FLPs, ‘fluorescent latex particles’). 100 µl of stock solution (2.5% solids, approx.72
7.2×10⁹ particles per ml) was added to give a total concentration for chamber A of 0.125% solids w/v73
(approx. 7.20×10⁸ particles).74
• 200 nm diameter multi-core magnetite (iron II/III oxide) nanoparticles, prepared with a hydrody-75
namic starch coating (Chemicell, Germany) (hereafter, MNPs, ‘magnetite nanoparticles’). 100 µl of76
stock solution (25 mg/ml) was added to give a total concentration for chamber A of 1.25 mg/ml77
(approximately 2.75×10¹¹ particles).78
2
All rights reserved. No reuse allowed without permission. (which was not peer-reviewed) is the author/funder, who has granted bioRxiv a license to display the preprint in perpetuity.
The copyright holder for this preprint. http://dx.doi.org/10.1101/231092doi: bioRxiv preprint first posted online Dec. 8, 2017;
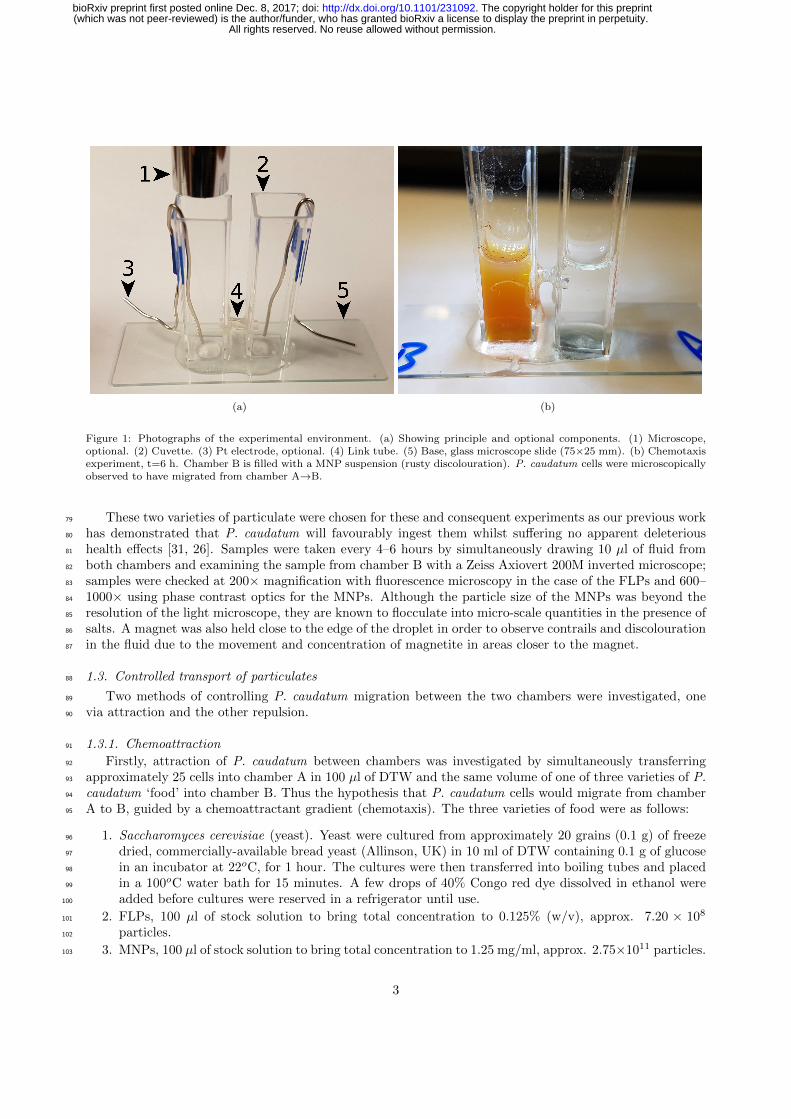
(a) (b)
Figure 1: Photographs of the experimental environment. (a) Showing principle and optional components. (1) Microscope,optional. (2) Cuvette. (3) Pt electrode, optional. (4) Link tube. (5) Base, glass microscope slide (75×25 mm). (b) Chemotaxisexperiment, t=6 h. Chamber B is filled with a MNP suspension (rusty discolouration). P. caudatum cells were microscopicallyobserved to have migrated from chamber A→B.
These two varieties of particulate were chosen for these and consequent experiments as our previous work79
has demonstrated that P. caudatum will favourably ingest them whilst suffering no apparent deleterious80
health effects [31, 26]. Samples were taken every 4–6 hours by simultaneously drawing 10 µl of fluid from81
both chambers and examining the sample from chamber B with a Zeiss Axiovert 200M inverted microscope;82
samples were checked at 200× magnification with fluorescence microscopy in the case of the FLPs and 600–83
1000× using phase contrast optics for the MNPs. Although the particle size of the MNPs was beyond the84
resolution of the light microscope, they are known to flocculate into micro-scale quantities in the presence of85
salts. A magnet was also held close to the edge of the droplet in order to observe contrails and discolouration86
in the fluid due to the movement and concentration of magnetite in areas closer to the magnet.87
1.3. Controlled transport of particulates88
Two methods of controlling P. caudatum migration between the two chambers were investigated, one89
via attraction and the other repulsion.90
1.3.1. Chemoattraction91
Firstly, attraction of P. caudatum between chambers was investigated by simultaneously transferring92
approximately 25 cells into chamber A in 100 µl of DTW and the same volume of one of three varieties of P.93
caudatum ‘food’ into chamber B. Thus the hypothesis that P. caudatum cells would migrate from chamber94
A to B, guided by a chemoattractant gradient (chemotaxis). The three varieties of food were as follows:95
1. Saccharomyces cerevisiae (yeast). Yeast were cultured from approximately 20 grains (0.1 g) of freeze96
dried, commercially-available bread yeast (Allinson, UK) in 10 ml of DTW containing 0.1 g of glucose97
in an incubator at 22oC, for 1 hour. The cultures were then transferred into boiling tubes and placed98
in a 100oC water bath for 15 minutes. A few drops of 40% Congo red dye dissolved in ethanol were99
added before cultures were reserved in a refrigerator until use.100
2. FLPs, 100 µl of stock solution to bring total concentration to 0.125% (w/v), approx. 7.20 × 108101
particles.102
3. MNPs, 100 µl of stock solution to bring total concentration to 1.25 mg/ml, approx. 2.75×10¹¹ particles.103
3
All rights reserved. No reuse allowed without permission. (which was not peer-reviewed) is the author/funder, who has granted bioRxiv a license to display the preprint in perpetuity.
The copyright holder for this preprint. http://dx.doi.org/10.1101/231092doi: bioRxiv preprint first posted online Dec. 8, 2017;
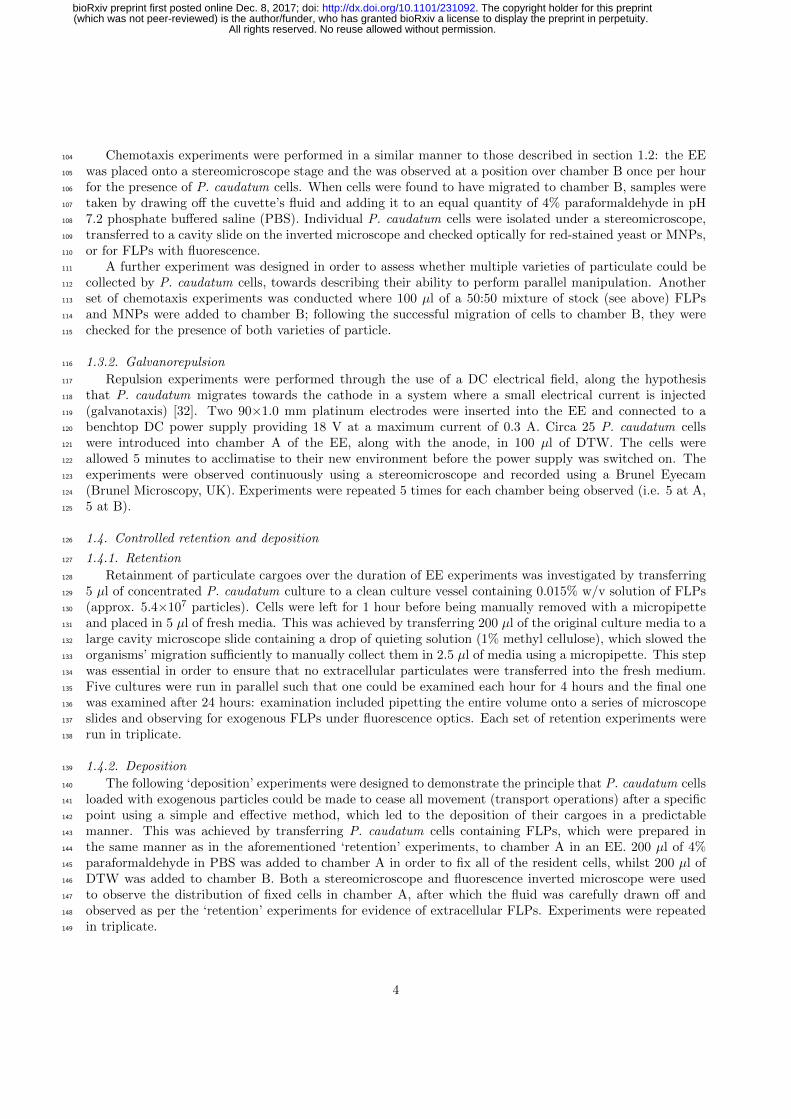
Chemotaxis experiments were performed in a similar manner to those described in section 1.2: the EE104
was placed onto a stereomicroscope stage and the was observed at a position over chamber B once per hour105
for the presence of P. caudatum cells. When cells were found to have migrated to chamber B, samples were106
taken by drawing off the cuvette’s fluid and adding it to an equal quantity of 4% paraformaldehyde in pH107
7.2 phosphate buffered saline (PBS). Individual P. caudatum cells were isolated under a stereomicroscope,108
transferred to a cavity slide on the inverted microscope and checked optically for red-stained yeast or MNPs,109
or for FLPs with fluorescence.110
A further experiment was designed in order to assess whether multiple varieties of particulate could be111
collected by P. caudatum cells, towards describing their ability to perform parallel manipulation. Another112
set of chemotaxis experiments was conducted where 100 µl of a 50:50 mixture of stock (see above) FLPs113
and MNPs were added to chamber B; following the successful migration of cells to chamber B, they were114
checked for the presence of both varieties of particle.115
1.3.2. Galvanorepulsion116
Repulsion experiments were performed through the use of a DC electrical field, along the hypothesis117
that P. caudatum migrates towards the cathode in a system where a small electrical current is injected118
(galvanotaxis) [32]. Two 90×1.0 mm platinum electrodes were inserted into the EE and connected to a119
benchtop DC power supply providing 18 V at a maximum current of 0.3 A. Circa 25 P. caudatum cells120
were introduced into chamber A of the EE, along with the anode, in 100 µl of DTW. The cells were121
allowed 5 minutes to acclimatise to their new environment before the power supply was switched on. The122
experiments were observed continuously using a stereomicroscope and recorded using a Brunel Eyecam123
(Brunel Microscopy, UK). Experiments were repeated 5 times for each chamber being observed (i.e. 5 at A,124
5 at B).125
1.4. Controlled retention and deposition126
1.4.1. Retention127
Retainment of particulate cargoes over the duration of EE experiments was investigated by transferring128
5 µl of concentrated P. caudatum culture to a clean culture vessel containing 0.015% w/v solution of FLPs129
(approx. 5.4×10⁷ particles). Cells were left for 1 hour before being manually removed with a micropipette130
and placed in 5 µl of fresh media. This was achieved by transferring 200 µl of the original culture media to a131
large cavity microscope slide containing a drop of quieting solution (1% methyl cellulose), which slowed the132
organisms’ migration sufficiently to manually collect them in 2.5 µl of media using a micropipette. This step133
was essential in order to ensure that no extracellular particulates were transferred into the fresh medium.134
Five cultures were run in parallel such that one could be examined each hour for 4 hours and the final one135
was examined after 24 hours: examination included pipetting the entire volume onto a series of microscope136
slides and observing for exogenous FLPs under fluorescence optics. Each set of retention experiments were137
run in triplicate.138
1.4.2. Deposition139
The following ‘deposition’ experiments were designed to demonstrate the principle that P. caudatum cells140
loaded with exogenous particles could be made to cease all movement (transport operations) after a specific141
point using a simple and effective method, which led to the deposition of their cargoes in a predictable142
manner. This was achieved by transferring P. caudatum cells containing FLPs, which were prepared in143
the same manner as in the aforementioned ‘retention’ experiments, to chamber A in an EE. 200 µl of 4%144
paraformaldehyde in PBS was added to chamber A in order to fix all of the resident cells, whilst 200 µl of145
DTW was added to chamber B. Both a stereomicroscope and fluorescence inverted microscope were used146
to observe the distribution of fixed cells in chamber A, after which the fluid was carefully drawn off and147
observed as per the ‘retention’ experiments for evidence of extracellular FLPs. Experiments were repeated148
in triplicate.149
4
All rights reserved. No reuse allowed without permission. (which was not peer-reviewed) is the author/funder, who has granted bioRxiv a license to display the preprint in perpetuity.
The copyright holder for this preprint. http://dx.doi.org/10.1101/231092doi: bioRxiv preprint first posted online Dec. 8, 2017;
1.5. Programmability150
‘Programming’ of EEs with multiple input types was investigated via a chemoattraction operation fol-151
lowed by galvanorepulsion. Approximately 650 P. caudatum cells in 200 µl of DTW were placed into152
chamber A and a corresponding volume of a particulate solution (100 µl of both MNPs and FLPs at stock153
concentration) was delivered into chamber B simultaneously: the experiment was run as per the chemotaxis154
experiments in section 1.3.1, with the exception that a platinum cathode was placed in chamber A and an155
anode in chamber B, as per section 1.3.2. After 6 hours had elapsed and cells had been positively iden-156
tified as being present in chamber B with a stereomicroscope, the electrodes’ power supply was switched157
on. Videomicrography was started at the point in the experiments where the electrodes were turned on.158
Experiments were repeated 10 times.159
1.6. Automation160
The principle of detection of FLPs via fluorescence spectroscopy was chosen to be the simplest and lowest161
cost method for detecting the completion of a transport operation. A fluorescence spectrometer designed162
to articulate onto a single EE chamber was designed as follows (see Supplementary Information 3 for parts163
list).164
The light source used was a single surface mount 485nm light emitting diode (LED) that produced165
479 Lux. The LED was mounted to a custom board with a large aluminium heat-spreader, onto which a 15o166
collimator lens was affixed in order to focus the light produced. The LED was driven by a benchtop power167
supply at 3.1 V and 250 mA, switched via a relay controlled by an Arduino Uno microprocessor board based168
on the ATmega328 platform (Arduino, Italy) (microprocessor code is included in Supplementary Information169
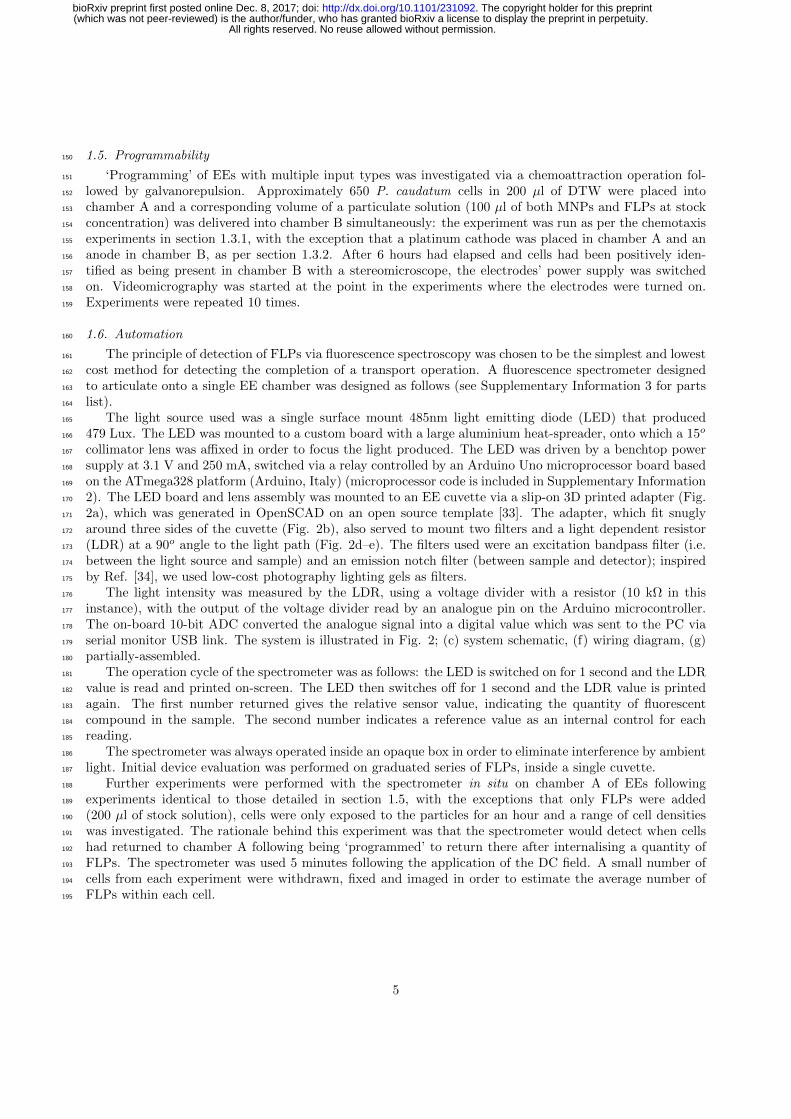
2). The LED board and lens assembly was mounted to an EE cuvette via a slip-on 3D printed adapter (Fig.170
2a), which was generated in OpenSCAD on an open source template [33]. The adapter, which fit snugly171
around three sides of the cuvette (Fig. 2b), also served to mount two filters and a light dependent resistor172
(LDR) at a 90o angle to the light path (Fig. 2d–e). The filters used were an excitation bandpass filter (i.e.173
between the light source and sample) and an emission notch filter (between sample and detector); inspired174
by Ref. [34], we used low-cost photography lighting gels as filters.175
The light intensity was measured by the LDR, using a voltage divider with a resistor (10 kΩ in this176
instance), with the output of the voltage divider read by an analogue pin on the Arduino microcontroller.177
The on-board 10-bit ADC converted the analogue signal into a digital value which was sent to the PC via178
serial monitor USB link. The system is illustrated in Fig. 2; (c) system schematic, (f) wiring diagram, (g)179
partially-assembled.180
The operation cycle of the spectrometer was as follows: the LED is switched on for 1 second and the LDR181
value is read and printed on-screen. The LED then switches off for 1 second and the LDR value is printed182
again. The first number returned gives the relative sensor value, indicating the quantity of fluorescent183
compound in the sample. The second number indicates a reference value as an internal control for each184
reading.185
The spectrometer was always operated inside an opaque box in order to eliminate interference by ambient186
light. Initial device evaluation was performed on graduated series of FLPs, inside a single cuvette.187
Further experiments were performed with the spectrometer in situ on chamber A of EEs following188
experiments identical to those detailed in section 1.5, with the exceptions that only FLPs were added189
(200 µl of stock solution), cells were only exposed to the particles for an hour and a range of cell densities190
was investigated. The rationale behind this experiment was that the spectrometer would detect when cells191
had returned to chamber A following being ‘programmed’ to return there after internalising a quantity of192
FLPs. The spectrometer was used 5 minutes following the application of the DC field. A small number of193
cells from each experiment were withdrawn, fixed and imaged in order to estimate the average number of194
FLPs within each cell.195
5
All rights reserved. No reuse allowed without permission. (which was not peer-reviewed) is the author/funder, who has granted bioRxiv a license to display the preprint in perpetuity.
The copyright holder for this preprint. http://dx.doi.org/10.1101/231092doi: bioRxiv preprint first posted online Dec. 8, 2017;
(a) (b) (c)
(d) (e) (f)
(g)
Figure 2: EE fluorescence spectrometer. (a) 3D printed cuvette adaptor. (b) Photograph of cuvette adapter with filters andcuvette in situ. (c) System diagram. (d–e) Photographs of assembled LED with heatsink, LDR (rear), collimator, adapterand cuvette, with and without LED illumination. (f) Wiring diagram. (g) Partially assembled spectrometer system, where (1)relay, (2) Arduino, (3) LDR, (4) LED, (5) cuvette, filters and adapter, (6) USB connection.
6
All rights reserved. No reuse allowed without permission. (which was not peer-reviewed) is the author/funder, who has granted bioRxiv a license to display the preprint in perpetuity.
The copyright holder for this preprint. http://dx.doi.org/10.1101/231092doi: bioRxiv preprint first posted online Dec. 8, 2017;
(a) (b)
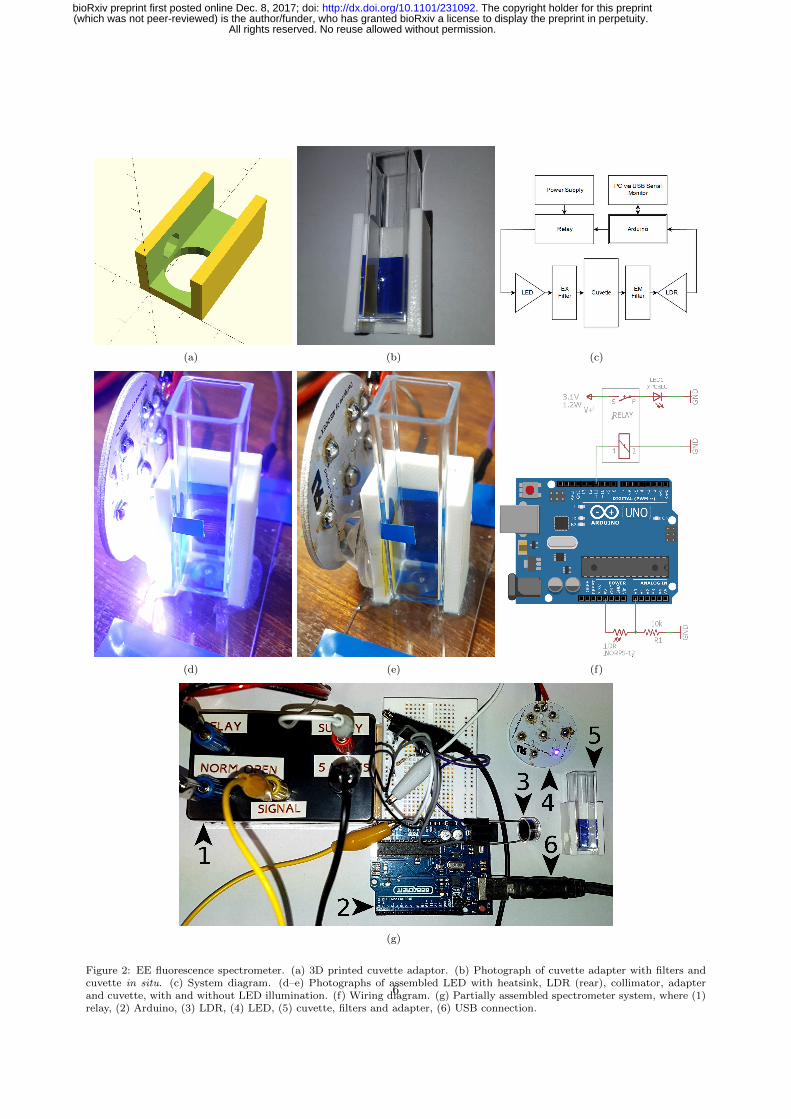
Figure 3: Photomicrographs to show fixed P. caudatum cells following exposure to a 50:50 mixture of FLPs and MNPs. (a)Brightfield. Rust-coloured intracellular inclusions indicative of magnetite clusters are present (arrowed). (b) Fluorescence.Fluorescent intracellular objects consistent with the FLPs are also present.
2. Results196
2.1. Suitability of experimental environment197
In initial control experiments, it was found that the organisms did not migrate to chamber B within, at198
minimum, the first 24 hours of observation. Even so, only a few of the 25 initial P. caudatum cells were199
observed in chamber B after 48 hours in all experiments (maximum 4).200
No FLPs or MNPs were observed to have diffused to chamber B over the 48 hour experiments, presumably201
due to both varieties of particle not diffusing as a product of their size and/or density. Data from these202
experiments are shown in Supplementary Information, section Appendix A.3.203
2.2. Controlled transport204
2.2.1. Chemoattraction205
P. caudatum cells were observed to migrate from chamber A→B in shorter time scales than control206
experiments when guided by all three attractants. The average time for the organisms to migrate to the207
supplied attractants were: yeast 1.6 h, FLPs 5.4 h, MNPs 1.8 h (Fig. 1b), FLPs and MNPs 1.8 h (see208
Appendix A.4 for dataset). On microscopic examination of fixed cells recovered from chamber B after209
24 hours of exposure to each attractant source, all three varieties of particle could be distinguished in the210
cells’ cytoplasm. Results therefore suggest that all varieties of particulate are effective chemoattractants.211
Furthermore, cells that were exposed to FLPs and MNPs simultaneously were observed to have ingested212
quantities of both (Fig. 3), indicating the P. caudatum may be loaded with multiple particle types for213
parallel operations214
2.2.2. Galvanorepulsion215
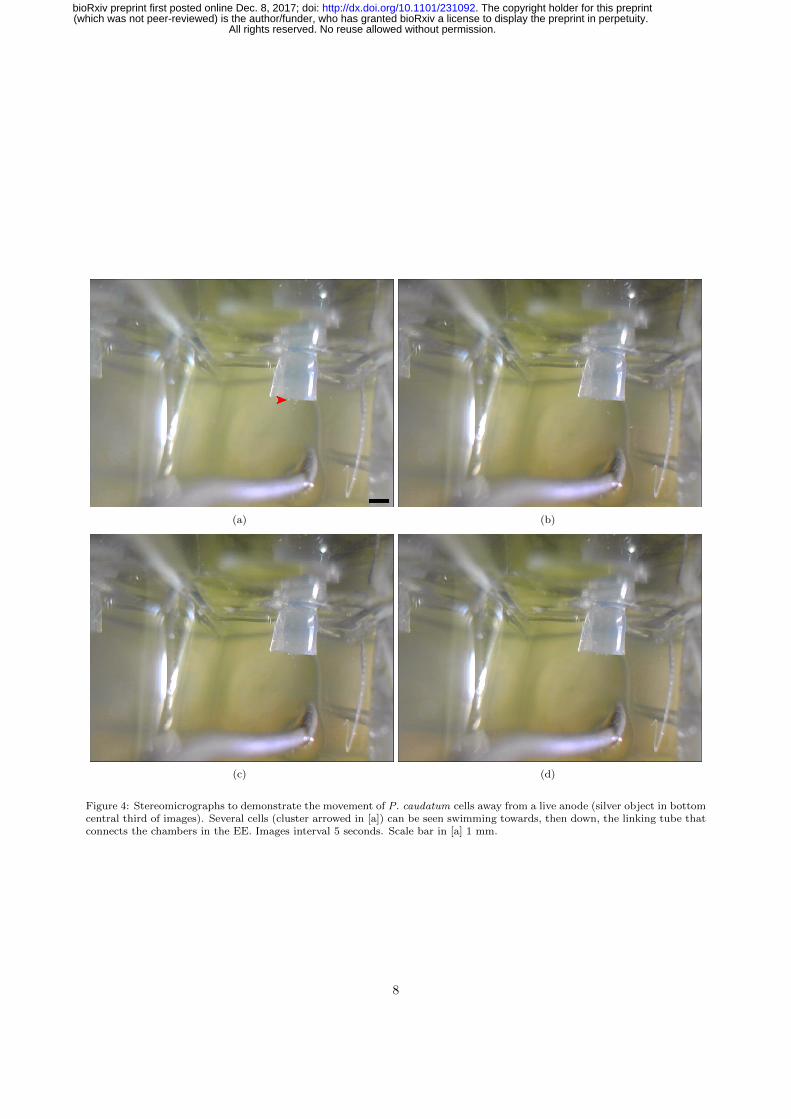
P. caudatum cells were observed to respond to the application of a DC field by immediately altering their216
swimming direction towards the cathode in chamber B (Fig. 4, Supplementary Information File: SI Movie217
1). Despite their rapid response, the cells required up to 5 minutes of constant stimulation to evacuate their218
chamber due to their slow speed relative to the dimensions of the EE and their directional migration being219
vague, i.e. cells would frequently collide with the walls of the cuvette and the sides of the connecting tube220
several times before finding the correct path. There was frequently a small number (range 0–4) of cells that221
did not move towards the cathode within the 5 minutes time frame and occasionally a few cells would stay222
in the connecting tube rather than emerge into chamber B.223
7
All rights reserved. No reuse allowed without permission. (which was not peer-reviewed) is the author/funder, who has granted bioRxiv a license to display the preprint in perpetuity.
The copyright holder for this preprint. http://dx.doi.org/10.1101/231092doi: bioRxiv preprint first posted online Dec. 8, 2017;
(a) (b)
(c) (d)
Figure 4: Stereomicrographs to demonstrate the movement of P. caudatum cells away from a live anode (silver object in bottomcentral third of images). Several cells (cluster arrowed in [a]) can be seen swimming towards, then down, the linking tube thatconnects the chambers in the EE. Images interval 5 seconds. Scale bar in [a] 1 mm.
8
All rights reserved. No reuse allowed without permission. (which was not peer-reviewed) is the author/funder, who has granted bioRxiv a license to display the preprint in perpetuity.
The copyright holder for this preprint. http://dx.doi.org/10.1101/231092doi: bioRxiv preprint first posted online Dec. 8, 2017;
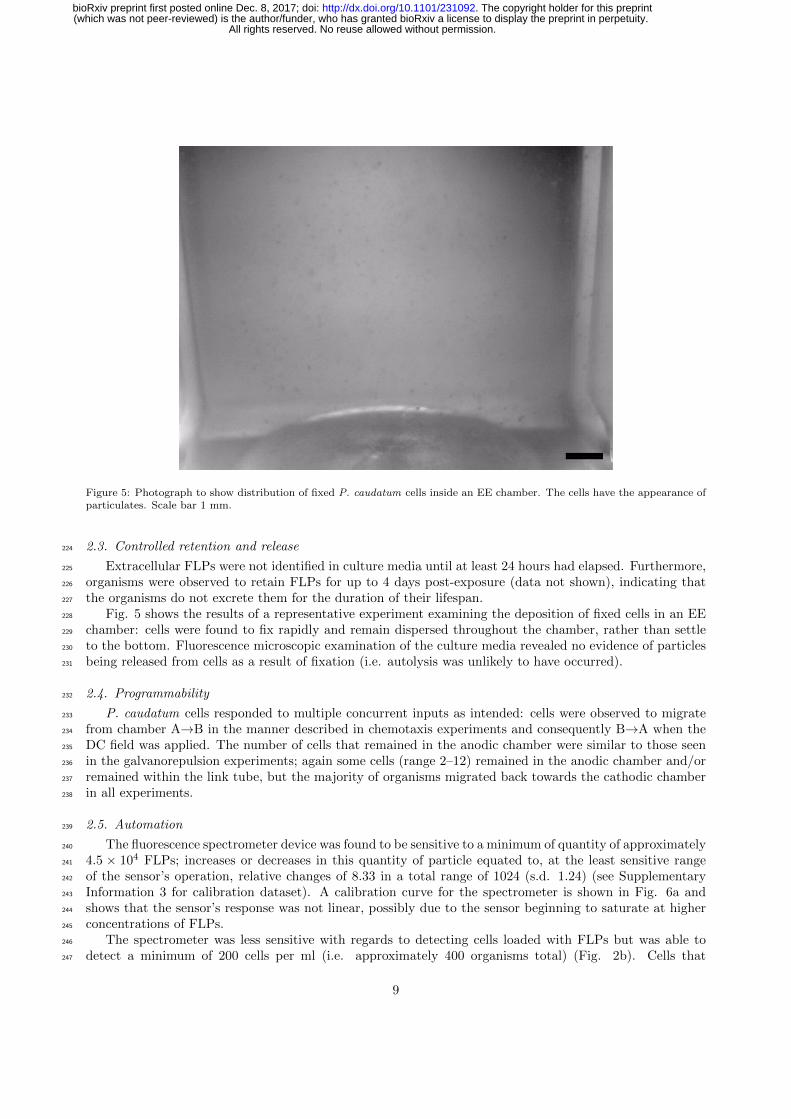
Figure 5: Photograph to show distribution of fixed P. caudatum cells inside an EE chamber. The cells have the appearance ofparticulates. Scale bar 1 mm.
2.3. Controlled retention and release224
Extracellular FLPs were not identified in culture media until at least 24 hours had elapsed. Furthermore,225
organisms were observed to retain FLPs for up to 4 days post-exposure (data not shown), indicating that226
the organisms do not excrete them for the duration of their lifespan.227
Fig. 5 shows the results of a representative experiment examining the deposition of fixed cells in an EE228
chamber: cells were found to fix rapidly and remain dispersed throughout the chamber, rather than settle229
to the bottom. Fluorescence microscopic examination of the culture media revealed no evidence of particles230
being released from cells as a result of fixation (i.e. autolysis was unlikely to have occurred).231
2.4. Programmability232
P. caudatum cells responded to multiple concurrent inputs as intended: cells were observed to migrate233
from chamber A→B in the manner described in chemotaxis experiments and consequently B→A when the234
DC field was applied. The number of cells that remained in the anodic chamber were similar to those seen235
in the galvanorepulsion experiments; again some cells (range 2–12) remained in the anodic chamber and/or236
remained within the link tube, but the majority of organisms migrated back towards the cathodic chamber237
in all experiments.238
2.5. Automation239
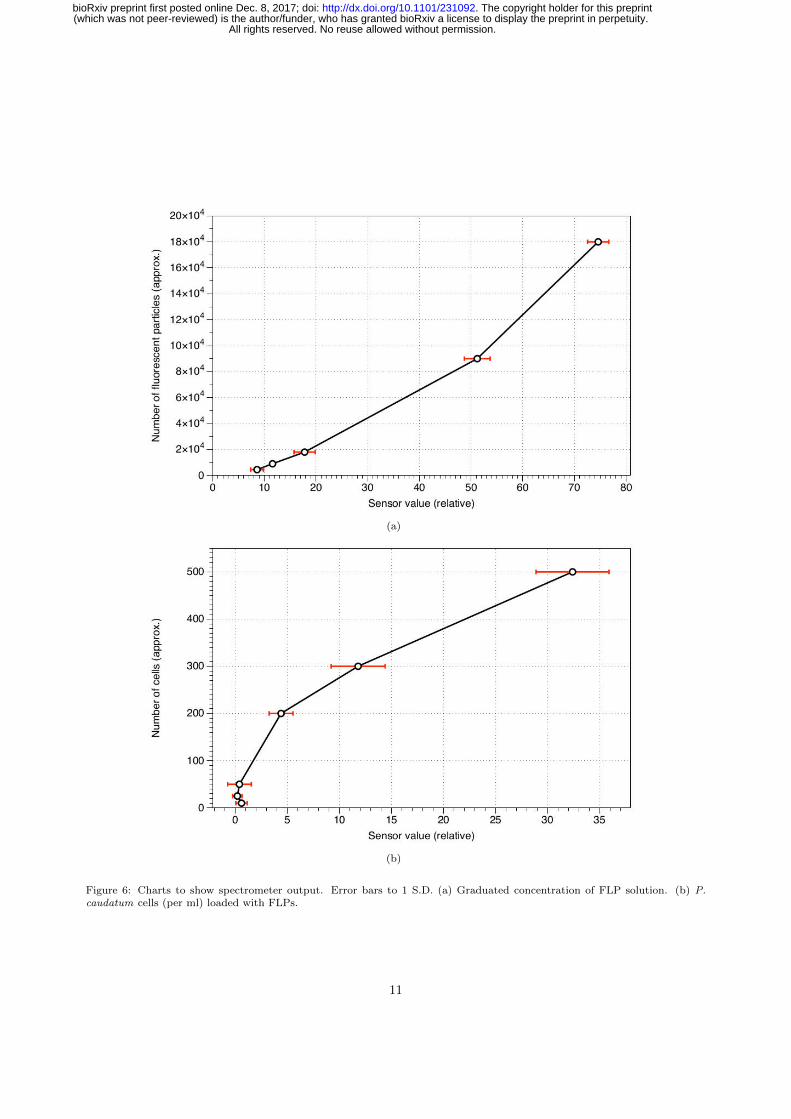
The fluorescence spectrometer device was found to be sensitive to a minimum of quantity of approximately240
4.5 × 10⁴ FLPs; increases or decreases in this quantity of particle equated to, at the least sensitive range241
of the sensor’s operation, relative changes of 8.33 in a total range of 1024 (s.d. 1.24) (see Supplementary242
Information 3 for calibration dataset). A calibration curve for the spectrometer is shown in Fig. 6a and243
shows that the sensor’s response was not linear, possibly due to the sensor beginning to saturate at higher244
concentrations of FLPs.245
The spectrometer was less sensitive with regards to detecting cells loaded with FLPs but was able to246
detect a minimum of 200 cells per ml (i.e. approximately 400 organisms total) (Fig. 2b). Cells that247
9
All rights reserved. No reuse allowed without permission. (which was not peer-reviewed) is the author/funder, who has granted bioRxiv a license to display the preprint in perpetuity.
The copyright holder for this preprint. http://dx.doi.org/10.1101/231092doi: bioRxiv preprint first posted online Dec. 8, 2017;
were examined post experiment revealed that the number of particles contained within each cell was highly248
variable, but was on average 161 (standard deviation 86, range 48–345) per cell (Fig. 7) (see Supplementary249
Information 3 for dataset).250
3. Discussion251
3.1. Evaluation of devices252
The basic EE was reasoned to be suitable for use as P. caudatum cells did not migrate freely between253
chambers within the time frame of device operation (<36 hours) without additional stimuli. Factors such254
as nutrient abundance in their original chamber and the confined geometry of the environment causing255
spontaneous alternation behaviour likely contributed to the organisms’ propensity for not rapidly exploring256
their entire environment.257
Observations on the amount of time P. caudatum took to migrate between chambers indicated that the258
presence of ‘food’ (yeast, MNP starch coatings) may dramatically increase the rate of the organisms’ migra-259
tion between chambers; FLPs did not attract as strongly, despite their being eaten en masse. Particulate260
coating is therefore an attractive route towards increasing the rate of transport operations.261
Galvanorepulsion was found to be a quick and effective method for controlling P. caudatum migration,262
but it suffered drawbacks stemming from the issues associated with passing a current through highly resistive263
fluid media. Significant ‘fine tuning’ was required in order to increase the power output to a level that would264
be effective across the length of the device without causing cells to rupture spontaneously in proximity to265
the electrodes. This phenomenon need not be a detriment in future iterations of such devices, however, as266
it could be used as a method of inducing particulate decellularisation and deposition, i.e. the cells are killed267
once they have completed migration.268
P. caudatum retains ingested particulates long enough (> 24 hours) for transport operations to complete.269
Some progress was made towards controlled deposition, although the method used (chemical fixation) leaves270
cells suspended randomly in solution, does not release particulates from their cells and contaminates the EE.271
Furthermore, fixation precludes the use of fluroescence spectrometry after the deposition stage due aldehyde272
exposure inducing autofluorescence in biological tissues.273
Regarding device programmability, whilst we demonstrated that the use of multimodal input is sufficient274
to complete several operations in one device, there is little room for continuous reprogramming or cascading275
of operations due to several processes (chemoattraction, deposition via killing the cells) being undynamic.276
Future work focusing on more dynamic stimuli, such as light, may therefore be productive.277
The spectrometer was found to detect FLPs in minimum concentrations of approximately 50,000 and278
exceeding 180,000 in 2 ml of fluid. In comparison with the sensor readings for P. caudatum cells loaded279
with the FLPs, the minimum number of cells detected was 200 per ml (400 total): the mean relative sensor280
values for 200, 300 and 500 cells per ml were 4.4, 11.8 and 32.4 respectively, which equates to approximately281
100, 160 and 500 particles per cell, according to the calibration curve for free particles. Microscopic obser-282
vations of cells treated with FLPs, revealed that they ingest and retain highly variable quantities, indicating283
that calibration of the spectrometer against microscopically-determined values is essential for quantitative284
measurements. Factors such as uneven distribution of cells in their chambers, cell division:death ratios,285
cell density-mediated feeding rates and various fluorescence artefacts (autofluorescence, quenching etc.) all286
likely contribute to the discrepancy between calibration and experimental results.287
Based on microscopic observations, we estimated the average mass transfer of FLPs by a P. caudatum288
cell to be about 14 mg/hour (0.68 g in 6 hours by 1000 cells in 4 ml total fluid volume) over a 5 mm distance,289
although this value is subject to significant error due to the variation in particle quantities ingested between290
organisms. Our other results indicate that this rate may be significantly increased if the particulates are291
made more ‘palatable’ for the cells.292
3.2. Device development and applications293
Excluding hardware, optional components and the platinum wires (which could likely be replaced by294
cheaper alternatives), the unit cost for a single EE/spectrometer was approximately 65 GBP. This price295
10
All rights reserved. No reuse allowed without permission. (which was not peer-reviewed) is the author/funder, who has granted bioRxiv a license to display the preprint in perpetuity.
The copyright holder for this preprint. http://dx.doi.org/10.1101/231092doi: bioRxiv preprint first posted online Dec. 8, 2017;
(a)
(b)
Figure 6: Charts to show spectrometer output. Error bars to 1 S.D. (a) Graduated concentration of FLP solution. (b) P.caudatum cells (per ml) loaded with FLPs.
11
All rights reserved. No reuse allowed without permission. (which was not peer-reviewed) is the author/funder, who has granted bioRxiv a license to display the preprint in perpetuity.
The copyright holder for this preprint. http://dx.doi.org/10.1101/231092doi: bioRxiv preprint first posted online Dec. 8, 2017;
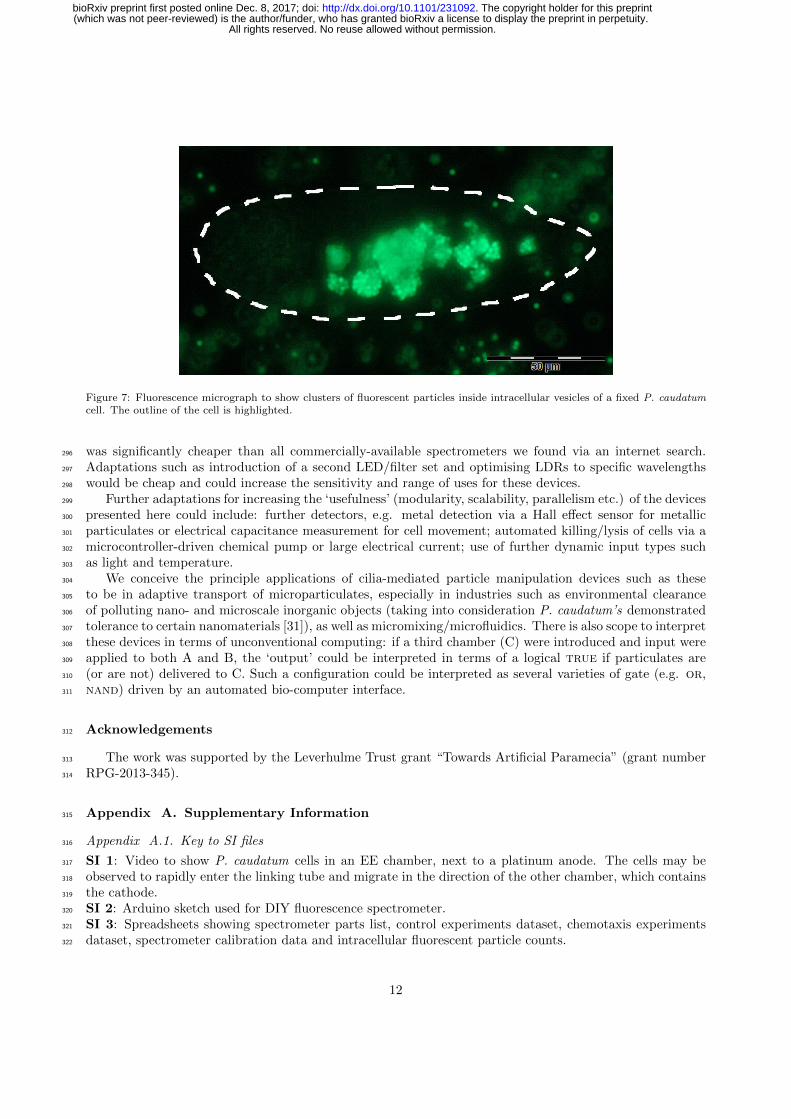
Figure 7: Fluorescence micrograph to show clusters of fluorescent particles inside intracellular vesicles of a fixed P. caudatumcell. The outline of the cell is highlighted.
was significantly cheaper than all commercially-available spectrometers we found via an internet search.296
Adaptations such as introduction of a second LED/filter set and optimising LDRs to specific wavelengths297
would be cheap and could increase the sensitivity and range of uses for these devices.298
Further adaptations for increasing the ‘usefulness’ (modularity, scalability, parallelism etc.) of the devices299
presented here could include: further detectors, e.g. metal detection via a Hall effect sensor for metallic300
particulates or electrical capacitance measurement for cell movement; automated killing/lysis of cells via a301
microcontroller-driven chemical pump or large electrical current; use of further dynamic input types such302
as light and temperature.303
We conceive the principle applications of cilia-mediated particle manipulation devices such as these304
to be in adaptive transport of microparticulates, especially in industries such as environmental clearance305
of polluting nano- and microscale inorganic objects (taking into consideration P. caudatum’s demonstrated306
tolerance to certain nanomaterials [31]), as well as micromixing/microfluidics. There is also scope to interpret307
these devices in terms of unconventional computing: if a third chamber (C) were introduced and input were308
applied to both A and B, the ‘output’ could be interpreted in terms of a logical true if particulates are309
(or are not) delivered to C. Such a configuration could be interpreted as several varieties of gate (e.g. or,310
nand) driven by an automated bio-computer interface.311
Acknowledgements312
The work was supported by the Leverhulme Trust grant “Towards Artificial Paramecia” (grant number313
RPG-2013-345).314
Appendix A. Supplementary Information315
Appendix A.1. Key to SI files316
SI 1: Video to show P. caudatum cells in an EE chamber, next to a platinum anode. The cells may be317
observed to rapidly enter the linking tube and migrate in the direction of the other chamber, which contains318
the cathode.319
SI 2: Arduino sketch used for DIY fluorescence spectrometer.320
SI 3: Spreadsheets showing spectrometer parts list, control experiments dataset, chemotaxis experiments321
dataset, spectrometer calibration data and intracellular fluorescent particle counts.322
12
All rights reserved. No reuse allowed without permission. (which was not peer-reviewed) is the author/funder, who has granted bioRxiv a license to display the preprint in perpetuity.
The copyright holder for this preprint. http://dx.doi.org/10.1101/231092doi: bioRxiv preprint first posted online Dec. 8, 2017;
Appendix A.2. Estimation of diffusion rate between EE chambers323
Simple diffusion between both chambers was estimated to take a minimum time of approximately 3 hours324
30 minutes: by Equation A.1325
L2 = 2DT (A.1)
Where L is length, D is the coefficient of diffusion (estimated at maximal rate of 10−9 in liquids) and T326
is time, thus the time to diffuse 5 mm would be 12,500 seconds (208 minutes).327
Appendix A.3. Results of Control Experiments328
Results from initial experiments described in section 2.1 measuring the rate of diffusion of (a) P. caudatum329
cells between the two chambers in an absence of stimuli and (b) particulates between the two chambers are330
shown in Supplementary Information 3.331
Appendix A.4. Results of Chemotaxis Experiments332
Dataset in Supplementary Information 3 shows results referenced in section 2.2.1, indicating the time333
taken for P. caudatum cells to traverse the linking tube between chambers in their EE to begin feeding on334
the supplied particulate ‘foods’.335
Appendix A.5. Estimation of transferred particulate mass336
The approximate mass of a single latex particle was calculated by the mean volume of a 2 µm latex337
sphere multiplied by the manufacturer-specified density, is shown in equation A.2.338
4× 10−6 × 1.045 = 4.18× 10⁻⁶ g (A.2)
Multiplied by the average number of particles per cell as reported in section 2.5, 163 (range 48–345), we339
estimate the mass transfer of FLPs by P. caudatum cells to be 6.81× 10⁻⁴ g (2.00× 10⁻⁴–1.44× 10⁻³g) per340
operation, over 6 hours (as per the experiment detailed in section 1.5). This equates to an estimated total341
mass transfer of 0.68 g (0.20–1.44 g) for the maximum cell densities that were tested (1000 in 2 ml).342
References343
[1] M. Sleigh, Coordination of the rhythm of beat in some ciliary systems, International review of cytology 25 (1969) 31–54.344
[2] H. Machemer, Ciliary activity and the origin of metachrony in paramecium: effects of increased viscosity, Journal of345
Experimental Biology 57 (1) (1972) 239–259.346
[3] H. Machemer, Interactions of membrane potential and cations in regulation of ciliary activity in paramecium, Journal of347
Experimental Biology 65 (2) (1976) 427–448.348
[4] M. Jorissen, B. der Schueren Van, J. Tyberghein, H. der Berghe Van, J.-J. Cassiman, Ciliogenesis and coordinated ciliary349
beating in human nasal epithelial cells cultured in vitro., Acta oto-rhino-laryngologica Belgica 43 (1) (1989) 67–73.350
[5] K.-I. Okamoto, Y. Nakaoka, Reconstitution of metachronal waves in ciliated cortical sheets of paramecium-asymmetry of351
the ciliary movements, Journal of experimental biology 192 (1) (1994) 73–81.352
[6] S. M. Mitran, Metachronal wave formation in a model of pulmonary cilia, Computers & structures 85 (11) (2007) 763–774.353
[7] J. Hussong, W.-P. Breugem, J. Westerweel, A continuum model for flow induced by metachronal coordination between354
beating cilia, Journal of Fluid Mechanics 684 (2011) 137–162.355
[8] J. Elgeti, G. Gompper, Emergence of metachronal waves in cilia arrays, Proceedings of the National Academy of Sciences356
110 (12) (2013) 4470–4475.357
[9] A. N. Sarvestani, A. Shamloo, M. T. Ahmadian, Simulation of paramecium, Cell biochemistry and biophysics 74 (2) (2016)358
241–252.359
[10] B. Nasouri, G. J. Elfring, Hydrodynamic interactions of cilia on a spherical body, Physical Review E 93 (3) (2016) 033111.360
[11] C. L. Van Oosten, C. W. Bastiaansen, D. J. Broer, Printed artificial cilia from liquid-crystal network actuators modularly361
driven by light, Nature materials 8 (8) (2009) 677–682.362
[12] J. den Toonder, F. Bos, D. Broer, L. Filippini, M. Gillies, J. de Goede, T. Mol, M. Reijme, W. Talen, H. Wilderbeek,363
et al., Artificial cilia for active micro-fluidic mixing, Lab on a Chip 8 (4) (2008) 533–541.364
[13] M. Vilfan, A. Potocnik, B. Kavcic, N. Osterman, I. Poberaj, A. Vilfan, D. Babic, Self-assembled artificial cilia, Proceedings365
of the National Academy of Sciences 107 (5) (2010) 1844–1847.366
[14] F. Fahrni, M. W. Prins, L. J. van IJzendoorn, Micro-fluidic actuation using magnetic artificial cilia, Lab on a Chip 9 (23)367
(2009) 3413–3421.368
13
All rights reserved. No reuse allowed without permission. (which was not peer-reviewed) is the author/funder, who has granted bioRxiv a license to display the preprint in perpetuity.
The copyright holder for this preprint. http://dx.doi.org/10.1101/231092doi: bioRxiv preprint first posted online Dec. 8, 2017;
[15] S. Khaderi, C. Craus, J. Hussong, N. Schorr, J. Belardi, J. Westerweel, O. Prucker, J. Ruhe, J. Den Toonder, P. Onck,369
Magnetically-actuated artificial cilia for microfluidic propulsion, Lab on a Chip 11 (12) (2011) 2002–2010.370
[16] J. Hussong, N. Schorr, J. Belardi, O. Prucker, J. Ruhe, J. Westerweel, Experimental investigation of the flow induced by371
artificial cilia, Lab on a Chip 11 (12) (2011) 2017–2022.372
[17] S. Sareh, J. Rossiter, A. Conn, K. Drescher, R. E. Goldstein, Swimming like algae: biomimetic soft artificial cilia, Journal373
of the Royal Society Interface (2012) rsif20120666.374
[18] C.-Y. Chen, C.-Y. Chen, C.-Y. Lin, Y.-T. Hu, Magnetically actuated artificial cilia for optimum mixing performance in375
microfluidics, Lab on a Chip 13 (14) (2013) 2834–2839.376
[19] C.-Y. Chen, T.-C. C. Chien, K. Mani, H.-Y. Tsai, Axial orientation control of zebrafish larvae using artificial cilia,377
Microfluidics and nanofluidics 20 (1) (2016) 12.378
[20] S. Zhang, Y. Wang, J. den Toonder, Micro-moulded magnetic artificial cilia for anti-fouling surfaces.379
[21] T. Masuda, A. M. Akimoto, K. Nagase, T. Okano, R. Yoshida, Artificial cilia as autonomous nanoactuators: Design of a380
gradient self-oscillating polymer brush with controlled unidirectional motion, Science advances 2 (8) (2016) e1600902.381
[22] S. Hanasoge, M. Ballard, P. J. Hesketh, A. Alexeev, Asymmetric motion of magnetically actuated artificial cilia, Lab on382
a Chip 17 (18) (2017) 3138–3145.383
[23] S. Skachek, A. Adamatzky, C. Melhuish, Manipulating objects by discrete excitable media coupled with contact-less384
actuator array: Open-loop case, Chaos, Solitons & Fractals 26 (5) (2005) 1377–1389.385
[24] I. Georgilas, A. Adamatzky, D. Barr, P. Dudek, C. Melhuish, Metachronal waves in cellular automata: Cilia-like manipu-386
lation in actuator arrays, in: Nature Inspired Cooperative Strategies for Optimization (NICSO 2013), Springer, 2014, pp.387
261–271.388
[25] J. G. Whiting, R. Mayne, C. Melhuish, A. Adamatzky, A cilia-inspired closed-loop sensor-actuator array, Bionic Engi-389
neering in press.390
[26] R. Mayne, J. G. Whiting, G. Wheway, C. Melhuish, A. Adamatzky, Particle Sorting by Paramecium Cilia Arrays, Biosys-391
tems 156-157 (2017) 46–52. doi:10.1016/j.biosystems.2017.04.001.392
[27] A. Adamatzky, Manipulating substances with physarum polycephalum, Materials Science and Engineering: C 30 (8)393
(2010) 1211–1220.394
[28] T. Fenchel, Suspension Feeding in, Ciliated Protozoa: Structure and Function of Feeding Organelles, Archiv fur Protis-395
tenkunde 123 (3) (1980) 239–260. doi:10.1016/S0003-9365(80)80009-1.396
[29] T. Fenchel, Suspension Feeding in Ciliated Protozoa : Functional Response and Particle Size Selection, Microbial Ecology397
6 (1980) 1–11.398
[30] T. Fenchel, Relation between particle size selection and clearance in suspension feeding ciliates, Limnology & Oceanography399
25 (4) (1980) 733–738.400
[31] R. Mayne, J. Whiting, A. Adamatzky, Toxicity and applications of internalised magnetite nanoparticles within live Parame-401
cium caudatum cells, BioNanoSciencedoi:10.1007/s12668-017-0425-z.402
[32] R. Witcherman, The biology of Paramecium, Plenum, 1986, Ch. 3.403
[33] Thingiverse Website, Cuvette holder, Available at https://www.thingiverse.com/thing:1515039, uploaded by user404
‘bobthechemist’.405
[34] A. Maia Chagas, L. Prieto Godino, A. B. Arrenberg, T. Baden, The 100 Euro Lab: A 3-D Printable Open Source406
Platform For Fluorescence Microscopy, Optogenetics And Accurate Temperature Control During Behaviour Of Zebrafish,407
Drosophila And C. elegans, PLoS ONE 15 (7). doi:10.1371/journal.pbio.2002702.408
14
All rights reserved. No reuse allowed without permission. (which was not peer-reviewed) is the author/funder, who has granted bioRxiv a license to display the preprint in perpetuity.
The copyright holder for this preprint. http://dx.doi.org/10.1101/231092doi: bioRxiv preprint first posted online Dec. 8, 2017;