Embed Size (px)
Citation preview
PROGRAMME FOR GOVERNMENT Q1 REPORTING 2017
KEY PERFORMANCE INDICATORS
Key Performance Indicators
The Programme for Government ‘Our Island - a special place to live and work’ was approved by Tynwald in January 2017 and in
April 2017 a performance framework, ‘Delivering a Programme for Government’, was also approved. The ‘Programme for
Government 2016-21’ is a strategic plan that outlines measurable goals for Government. The Council of Ministers have committed
to providing a public update against the performance framework on a quarterly basis. This report provides an update on
performance through Key Performance Indicators.
The first quarter for 2017/18 ran April, May, June and reporting for this period has been undertaken during the past 4
weeks. Information has been provided from across Government Departments, Boards and Offices, and the Cabinet Office have
collated these to provide this report on Key Performance Indicators.
The Programme for Government has a series of Policy Statements that represent the Council of Ministers commitments to
delivering each outcome. These policy statements and in turn outcomes are being measured at a Departmental level by Key
Performance Indicators (KPIs). Each KPI has a target and performance will be reported upon quarterly. KPIs are outlined in
the departmental delivery plans and are available on line.
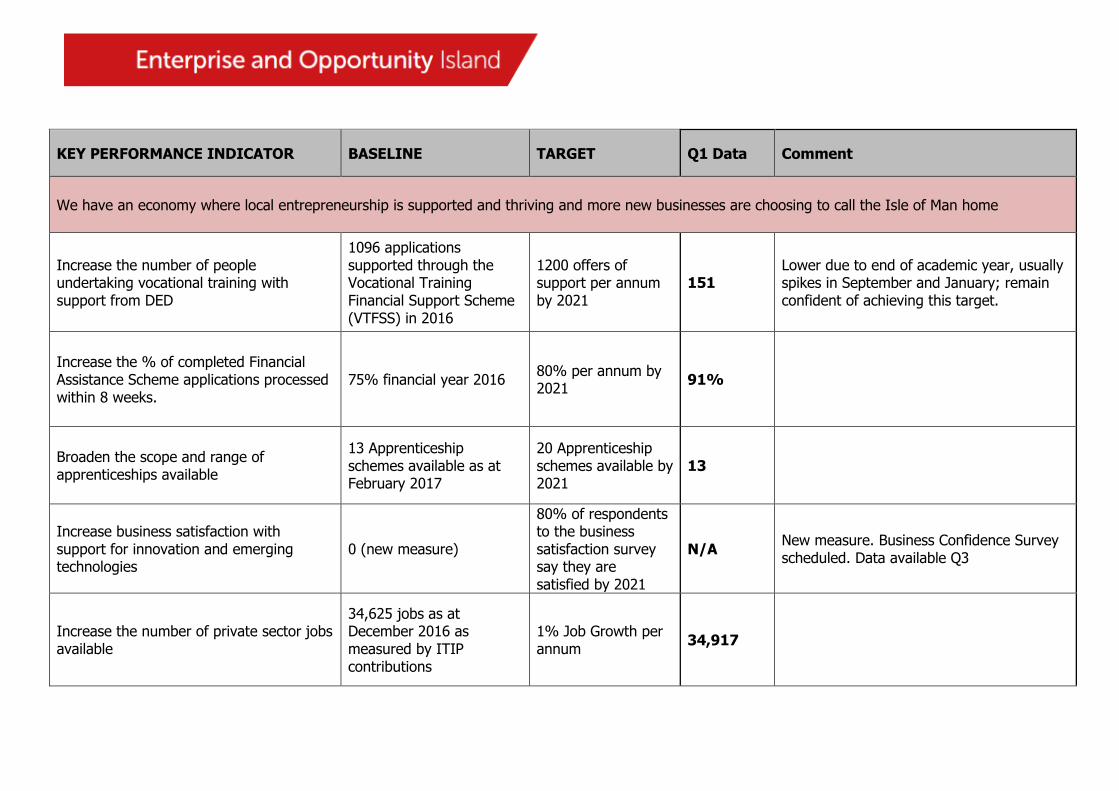
KEY PERFORMANCE INDICATOR BASELINE TARGET Q1 Data Comment
We have an economy where local entrepreneurship is supported and thriving and more new businesses are choosing to call the Isle of Man home
Increase the number of people undertaking vocational training with support from DED
1096 applications supported through the Vocational Training Financial Support Scheme (VTFSS) in 2016
1200 offers of support per annum by 2021
151 Lower due to end of academic year, usually spikes in September and January; remain confident of achieving this target.
Increase the % of completed Financial Assistance Scheme applications processed within 8 weeks.
75% financial year 2016 80% per annum by 2021
91%
Broaden the scope and range of apprenticeships available
13 Apprenticeship schemes available as at February 2017
20 Apprenticeship schemes available by 2021
13
Increase business satisfaction with support for innovation and emerging technologies
0 (new measure)
80% of respondents to the business satisfaction survey say they are satisfied by 2021
N/A New measure. Business Confidence Survey scheduled. Data available Q3
Increase the number of private sector jobs available
34,625 jobs as at December 2016 as measured by ITIP contributions
1% Job Growth per annum
34,917
N/A = Not available
KEY PERFORMANCE INDICATOR BASELINE TARGET Q1 Data Comment
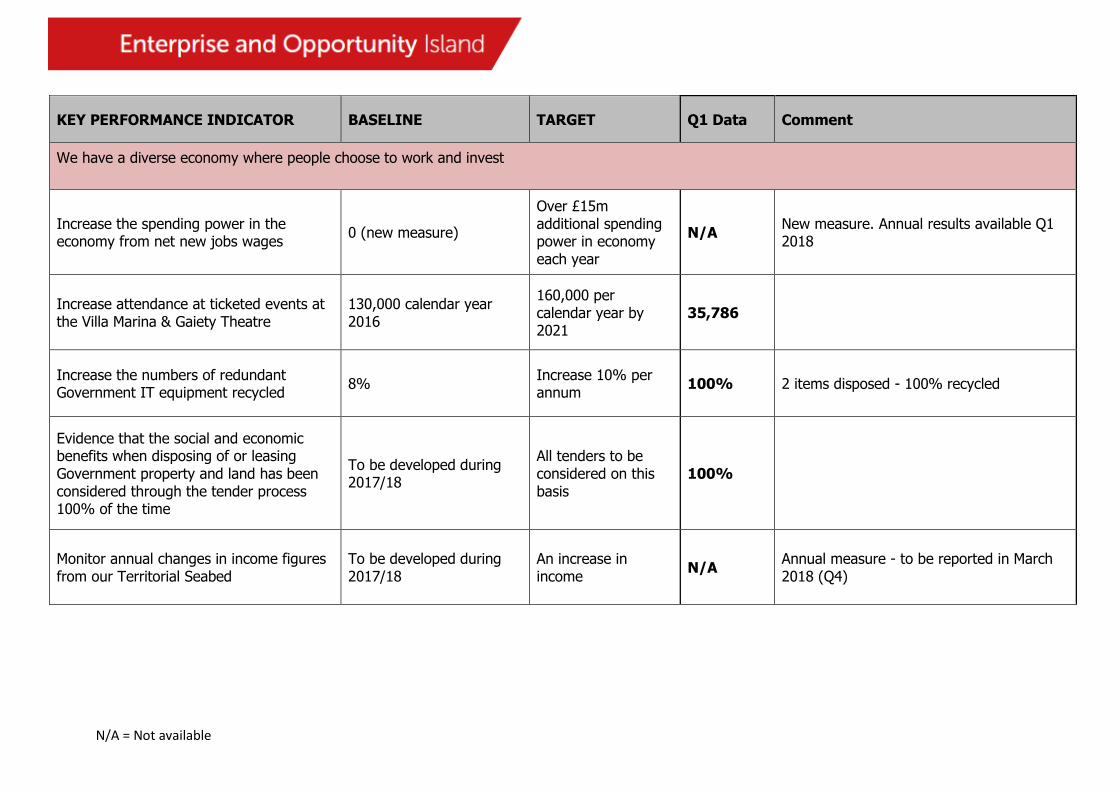
We have a diverse economy where people choose to work and invest
Increase the spending power in the economy from net new jobs wages
0 (new measure)
Over £15m additional spending power in economy each year
N/A New measure. Annual results available Q1 2018
Increase attendance at ticketed events at the Villa Marina & Gaiety Theatre
130,000 calendar year 2016
160,000 per calendar year by 2021
35,786
Increase the numbers of redundant Government IT equipment recycled
8% Increase 10% per annum
100% 2 items disposed - 100% recycled
Evidence that the social and economic benefits when disposing of or leasing Government property and land has been considered through the tender process 100% of the time
To be developed during 2017/18
All tenders to be considered on this basis
100%
Monitor annual changes in income figures from our Territorial Seabed
To be developed during 2017/18
An increase in income
N/A Annual measure - to be reported in March 2018 (Q4)
N/A = Not available
KEY PERFORMANCE INDICATOR BASELINE TARGET Q1 Data Comment
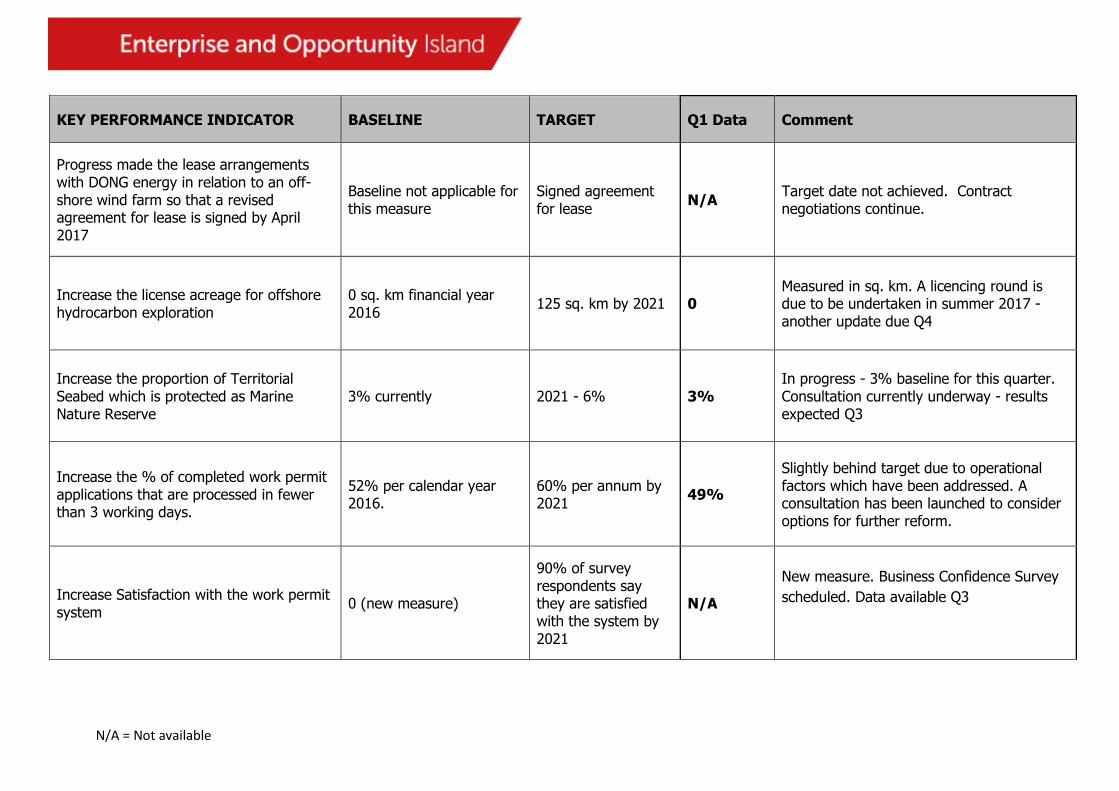
Progress made the lease arrangements with DONG energy in relation to an off-shore wind farm so that a revised agreement for lease is signed by April 2017
Baseline not applicable for this measure
Signed agreement for lease
N/A Target date not achieved. Contract negotiations continue.
Increase the license acreage for offshore hydrocarbon exploration
0 sq. km financial year 2016
125 sq. km by 2021 0 Measured in sq. km. A licencing round is due to be undertaken in summer 2017 - another update due Q4
Increase the proportion of Territorial Seabed which is protected as Marine Nature Reserve
3% currently 2021 - 6% 3% In progress - 3% baseline for this quarter. Consultation currently underway - results expected Q3
Increase the % of completed work permit applications that are processed in fewer than 3 working days.
52% per calendar year 2016.
60% per annum by 2021
49%
Slightly behind target due to operational factors which have been addressed. A consultation has been launched to consider options for further reform.
Increase Satisfaction with the work permit system
0 (new measure)
90% of survey respondents say they are satisfied with the system by 2021
N/A
New measure. Business Confidence Survey
scheduled. Data available Q3
N/A = Not available
KEY PERFORMANCE INDICATOR BASELINE TARGET Q1 Data Comment
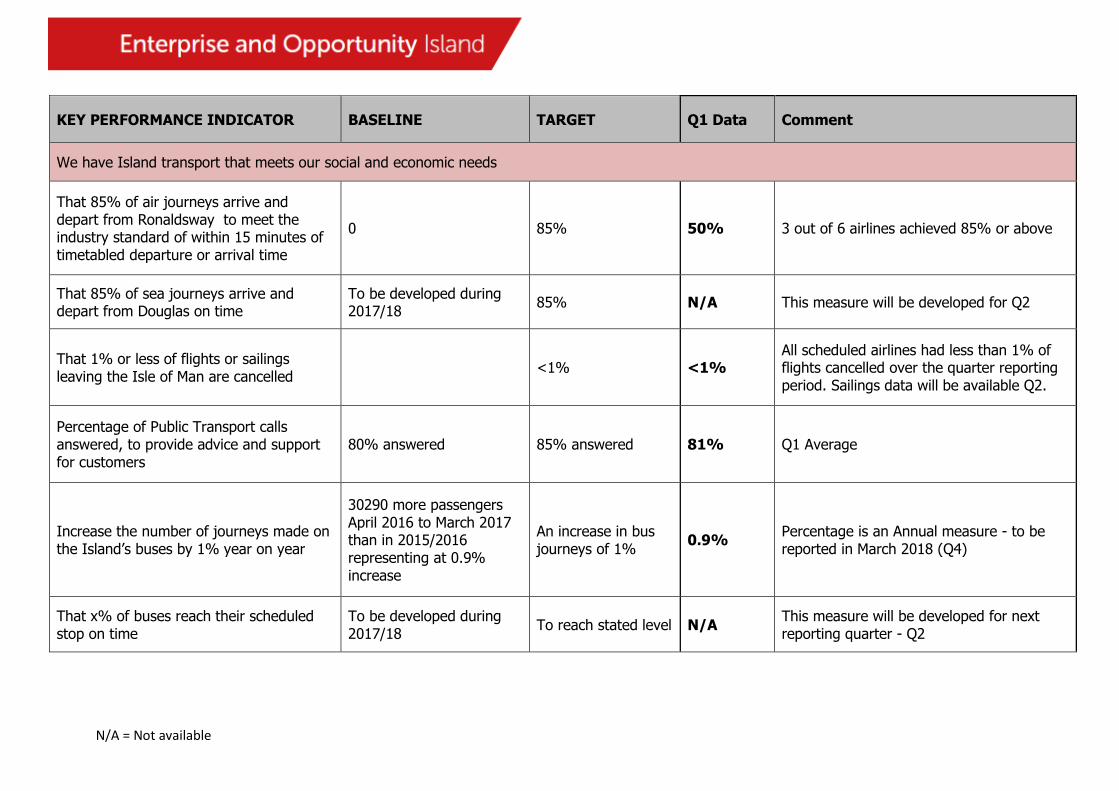
We have Island transport that meets our social and economic needs
That 85% of air journeys arrive and depart from Ronaldsway to meet the industry standard of within 15 minutes of timetabled departure or arrival time
0 85% 50% 3 out of 6 airlines achieved 85% or above
That 85% of sea journeys arrive and depart from Douglas on time
To be developed during 2017/18
85% N/A This measure will be developed for Q2
That 1% or less of flights or sailings leaving the Isle of Man are cancelled
<1% <1% All scheduled airlines had less than 1% of flights cancelled over the quarter reporting period. Sailings data will be available Q2.
Percentage of Public Transport calls answered, to provide advice and support for customers
80% answered 85% answered 81% Q1 Average
Increase the number of journeys made on the Island’s buses by 1% year on year
30290 more passengers April 2016 to March 2017 than in 2015/2016 representing at 0.9% increase
An increase in bus journeys of 1%
0.9% Percentage is an Annual measure - to be reported in March 2018 (Q4)
That x% of buses reach their scheduled stop on time
To be developed during 2017/18
To reach stated level N/A This measure will be developed for next reporting quarter - Q2
N/A = Not available
KEY PERFORMANCE INDICATOR BASELINE TARGET Q1 Data Comment
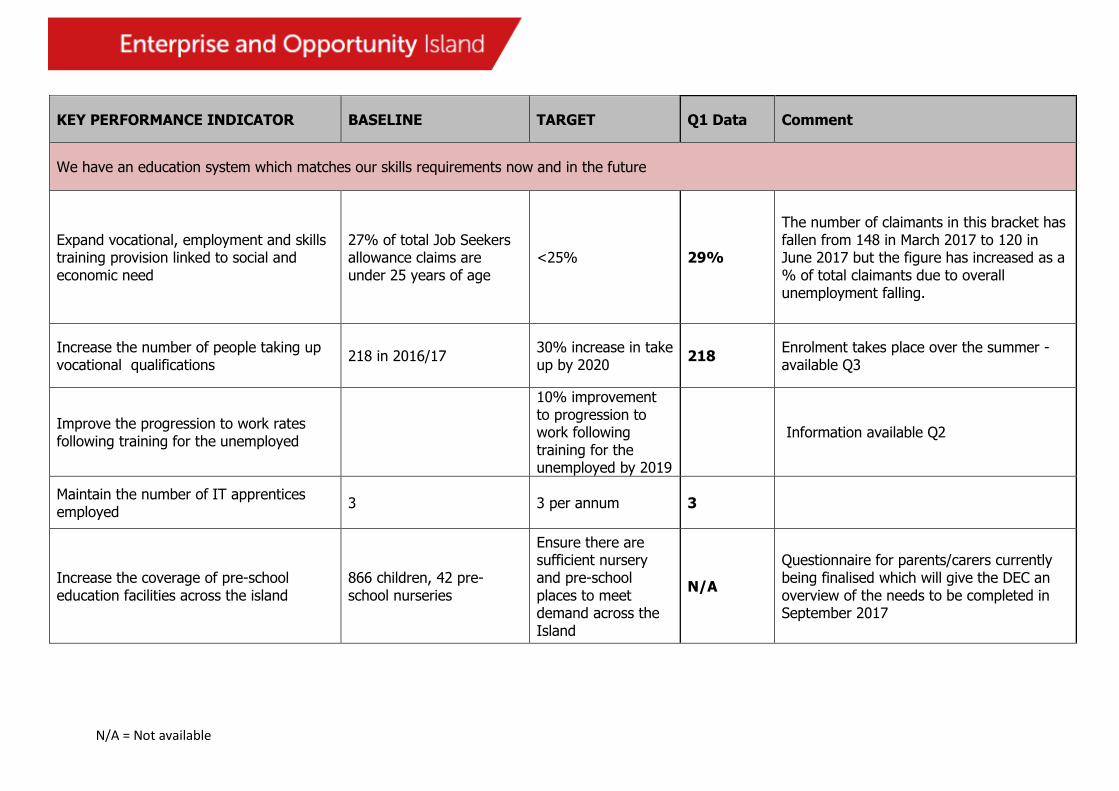
We have an education system which matches our skills requirements now and in the future
Expand vocational, employment and skills training provision linked to social and economic need
27% of total Job Seekers allowance claims are under 25 years of age
<25% 29%
The number of claimants in this bracket has fallen from 148 in March 2017 to 120 in June 2017 but the figure has increased as a % of total claimants due to overall unemployment falling.
Increase the number of people taking up vocational qualifications
218 in 2016/17 30% increase in take up by 2020
218 Enrolment takes place over the summer - available Q3
Improve the progression to work rates following training for the unemployed
10% improvement to progression to work following training for the unemployed by 2019
Information available Q2
Maintain the number of IT apprentices employed
3 3 per annum 3
Increase the coverage of pre-school education facilities across the island
866 children, 42 pre-school nurseries
Ensure there are sufficient nursery and pre-school places to meet demand across the Island
N/A
Questionnaire for parents/carers currently being finalised which will give the DEC an overview of the needs to be completed in September 2017
N/A = Not available
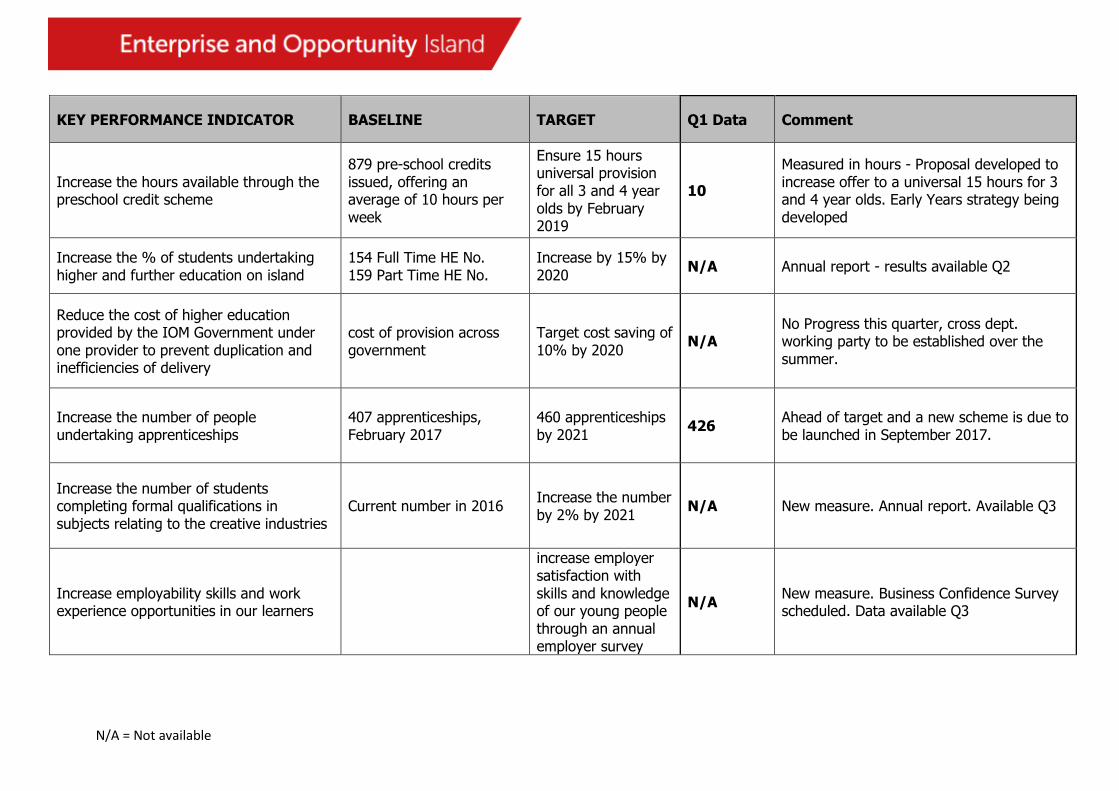
KEY PERFORMANCE INDICATOR BASELINE TARGET Q1 Data Comment
Increase the hours available through the preschool credit scheme
879 pre-school credits issued, offering an average of 10 hours per week
Ensure 15 hours universal provision for all 3 and 4 year olds by February 2019
10
Measured in hours - Proposal developed to increase offer to a universal 15 hours for 3 and 4 year olds. Early Years strategy being developed
Increase the % of students undertaking higher and further education on island
154 Full Time HE No. 159 Part Time HE No.
Increase by 15% by 2020
N/A Annual report - results available Q2
Reduce the cost of higher education provided by the IOM Government under one provider to prevent duplication and inefficiencies of delivery
cost of provision across government
Target cost saving of 10% by 2020
N/A No Progress this quarter, cross dept. working party to be established over the summer.
Increase the number of people undertaking apprenticeships
407 apprenticeships, February 2017
460 apprenticeships by 2021
426 Ahead of target and a new scheme is due to be launched in September 2017.
Increase the number of students completing formal qualifications in subjects relating to the creative industries
Current number in 2016 Increase the number by 2% by 2021
N/A New measure. Annual report. Available Q3
Increase employability skills and work experience opportunities in our learners
increase employer satisfaction with skills and knowledge of our young people through an annual employer survey
N/A New measure. Business Confidence Survey scheduled. Data available Q3
N/A = Not available
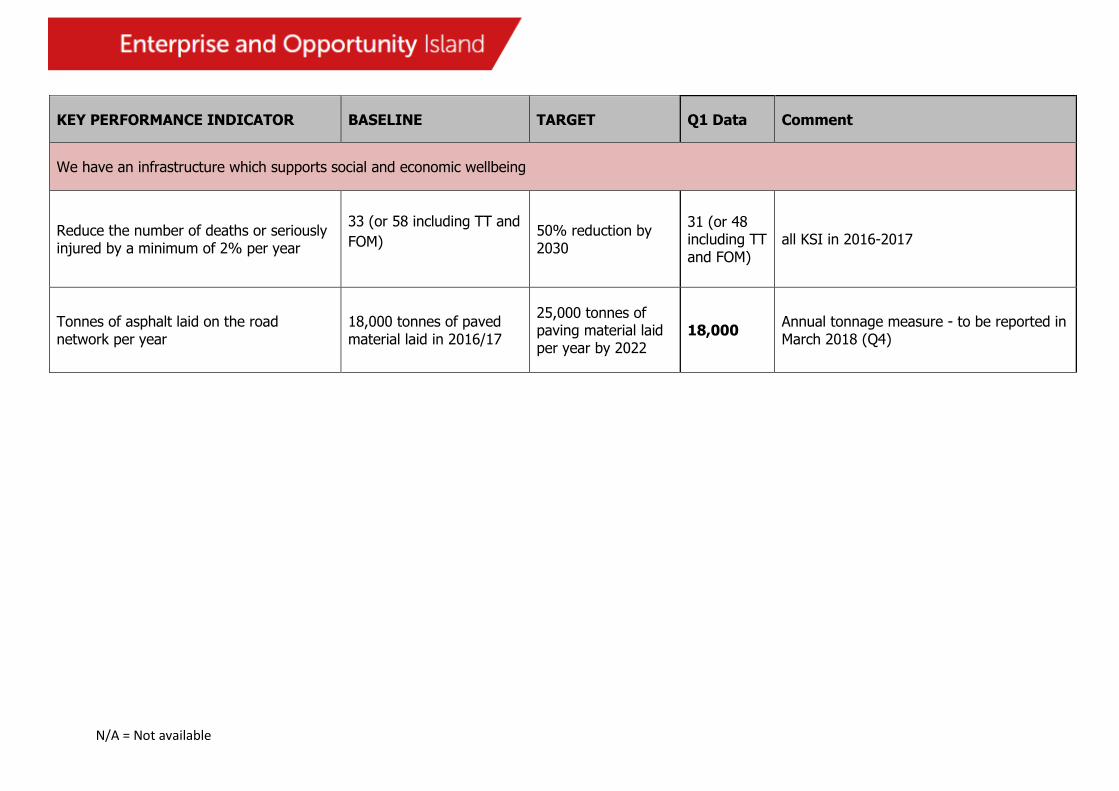
KEY PERFORMANCE INDICATOR BASELINE TARGET Q1 Data Comment
We have an infrastructure which supports social and economic wellbeing
Reduce the number of deaths or seriously injured by a minimum of 2% per year
33 (or 58 including TT and
FOM) 50% reduction by 2030
31 (or 48 including TT and FOM)
all KSI in 2016-2017
Tonnes of asphalt laid on the road network per year
18,000 tonnes of paved material laid in 2016/17
25,000 tonnes of paving material laid per year by 2022
18,000 Annual tonnage measure - to be reported in March 2018 (Q4)

N/A = Not available
KEY PERFORMANCE INDICATOR BASELINE TARGET Q1 Data Comment
We have utilities that support our Island, communities and business
Adherence to MUA Long Term Plan (annual reporting)
MUA performance in line with the LTP
MUA performance in line with the LTP
N/A This is a new annual measure determined through the MUA’s Annual Accounts. Data available Q3 2017/18
Contain the increase in Greenhouse Gas Emissions
2014 - 793,410 tonnes contain 0.779m Annual audit figure in millions of tonnes
Contain the % of average household income used for domestic energy purchase
2013 - 5.54% contain 5.54% Percentage is assessed Annually.
N/A = Not available
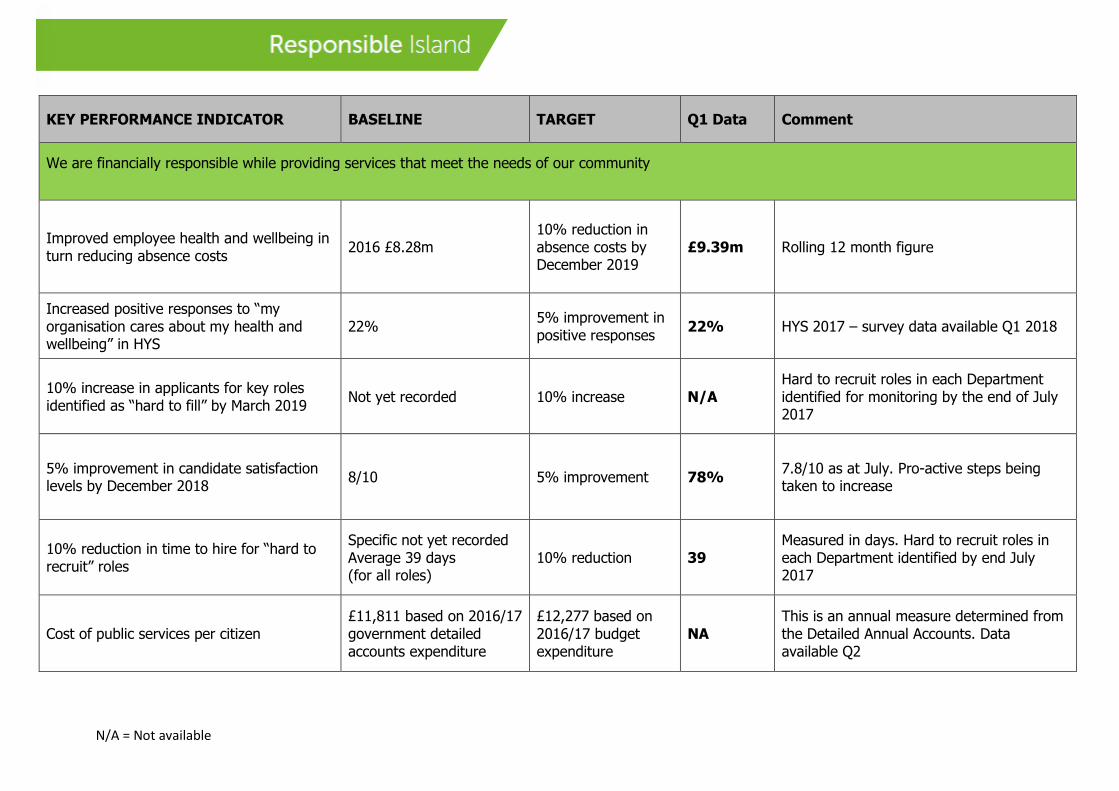
KEY PERFORMANCE INDICATOR BASELINE TARGET Q1 Data Comment
We are financially responsible while providing services that meet the needs of our community
Improved employee health and wellbeing in turn reducing absence costs
2016 £8.28m 10% reduction in absence costs by December 2019
£9.39m Rolling 12 month figure
Increased positive responses to “my organisation cares about my health and wellbeing” in HYS
22% 5% improvement in positive responses
22% HYS 2017 – survey data available Q1 2018
10% increase in applicants for key roles identified as “hard to fill” by March 2019
Not yet recorded 10% increase N/A Hard to recruit roles in each Department identified for monitoring by the end of July 2017
5% improvement in candidate satisfaction levels by December 2018
8/10 5% improvement 78% 7.8/10 as at July. Pro-active steps being taken to increase
10% reduction in time to hire for “hard to recruit” roles
Specific not yet recorded Average 39 days (for all roles)
10% reduction 39 Measured in days. Hard to recruit roles in each Department identified by end July 2017
Cost of public services per citizen £11,811 based on 2016/17 government detailed accounts expenditure
£12,277 based on 2016/17 budget expenditure
NA This is an annual measure determined from the Detailed Annual Accounts. Data available Q2
N/A = Not available
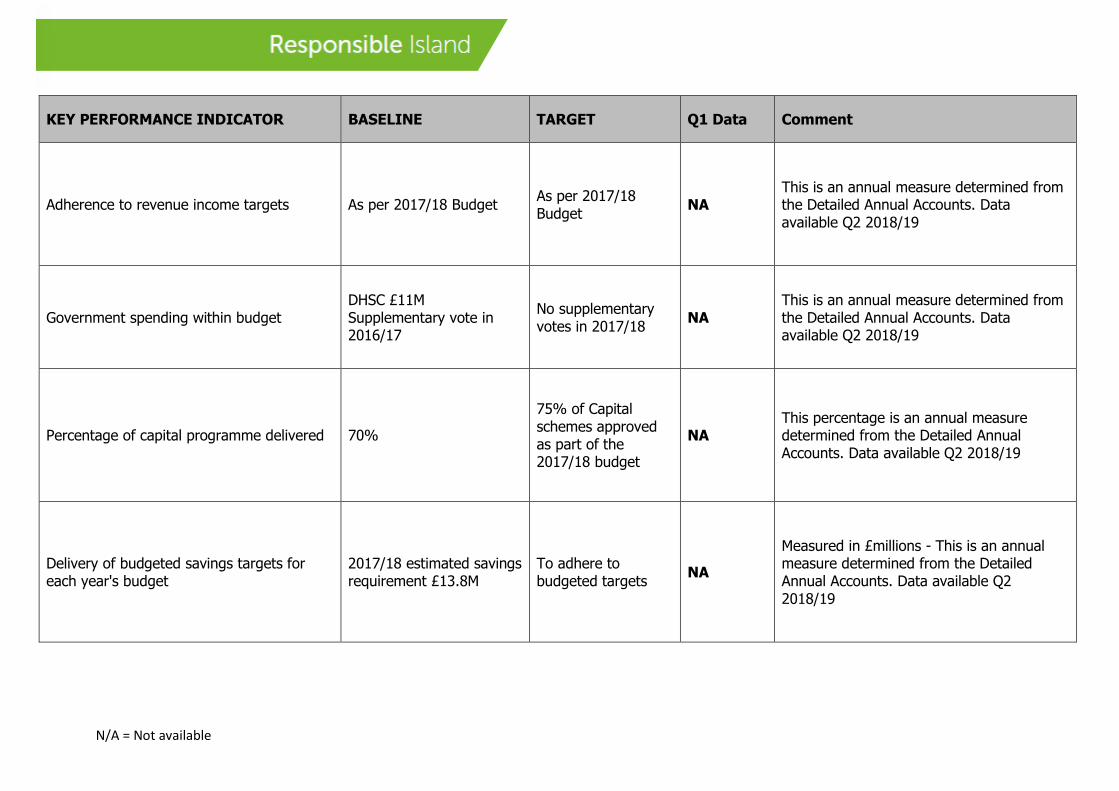
KEY PERFORMANCE INDICATOR BASELINE TARGET Q1 Data Comment
Adherence to revenue income targets As per 2017/18 Budget As per 2017/18 Budget
NA This is an annual measure determined from the Detailed Annual Accounts. Data available Q2 2018/19
Government spending within budget DHSC £11M Supplementary vote in 2016/17
No supplementary votes in 2017/18
NA This is an annual measure determined from the Detailed Annual Accounts. Data available Q2 2018/19
Percentage of capital programme delivered 70%
75% of Capital schemes approved as part of the 2017/18 budget
NA This percentage is an annual measure determined from the Detailed Annual Accounts. Data available Q2 2018/19
Delivery of budgeted savings targets for each year's budget
2017/18 estimated savings requirement £13.8M
To adhere to budgeted targets
NA
Measured in £millions - This is an annual measure determined from the Detailed Annual Accounts. Data available Q2 2018/19
N/A = Not available
KEY PERFORMANCE INDICATOR BASELINE TARGET Q1 Data Comment
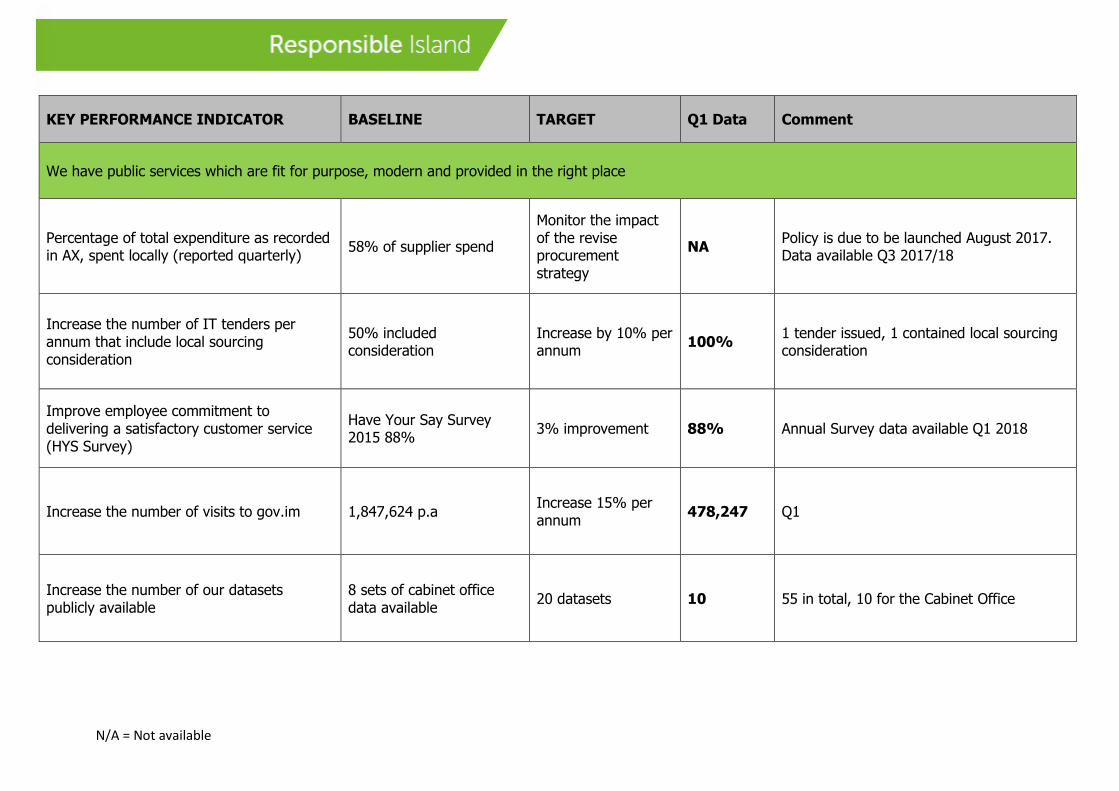
We have public services which are fit for purpose, modern and provided in the right place
Percentage of total expenditure as recorded in AX, spent locally (reported quarterly)
58% of supplier spend
Monitor the impact of the revise procurement strategy
NA Policy is due to be launched August 2017. Data available Q3 2017/18
Increase the number of IT tenders per annum that include local sourcing consideration
50% included consideration
Increase by 10% per annum
100% 1 tender issued, 1 contained local sourcing consideration
Improve employee commitment to delivering a satisfactory customer service (HYS Survey)
Have Your Say Survey 2015 88%
3% improvement 88% Annual Survey data available Q1 2018
Increase the number of visits to gov.im 1,847,624 p.a Increase 15% per annum
478,247 Q1
Increase the number of our datasets publicly available
8 sets of cabinet office data available
20 datasets 10 55 in total, 10 for the Cabinet Office
N/A = Not available
KEY PERFORMANCE INDICATOR BASELINE TARGET Q1 Data Comment
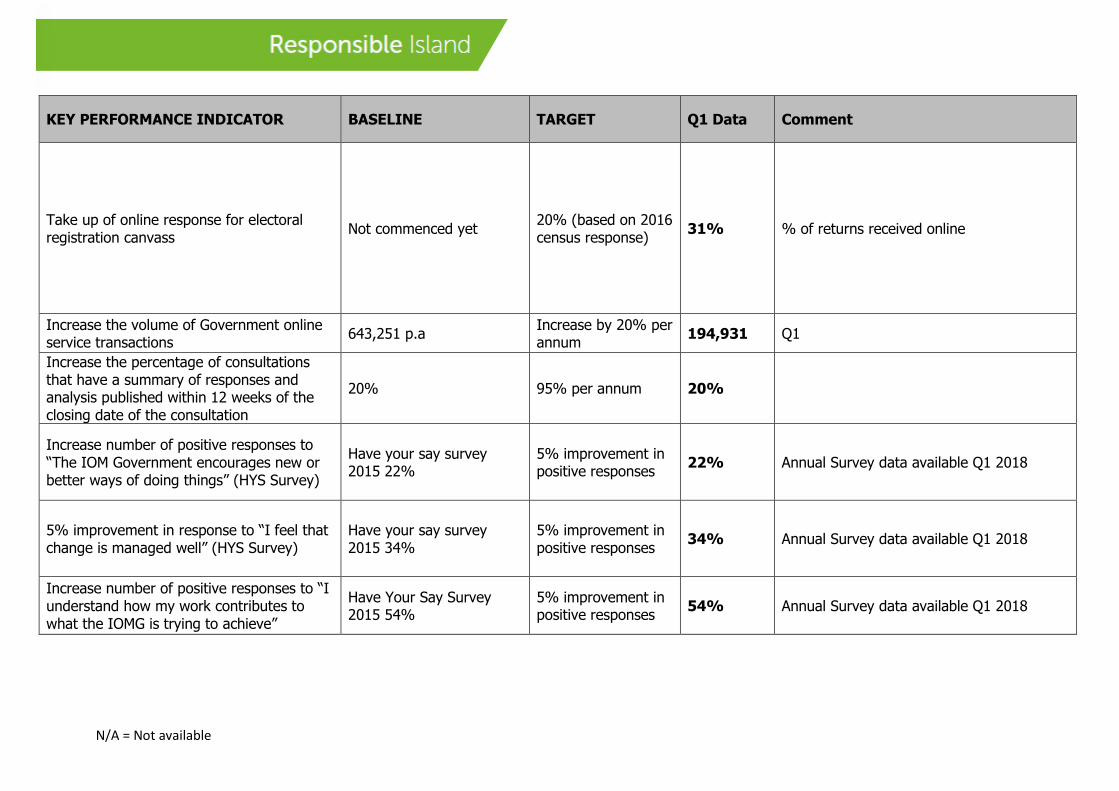
Take up of online response for electoral registration canvass
Not commenced yet 20% (based on 2016 census response)
31% % of returns received online
Increase the volume of Government online service transactions
643,251 p.a Increase by 20% per annum
194,931 Q1
Increase the percentage of consultations that have a summary of responses and analysis published within 12 weeks of the closing date of the consultation
20% 95% per annum 20%
Increase number of positive responses to “The IOM Government encourages new or better ways of doing things” (HYS Survey)
Have your say survey 2015 22%
5% improvement in positive responses
22% Annual Survey data available Q1 2018
5% improvement in response to “I feel that change is managed well” (HYS Survey)
Have your say survey 2015 34%
5% improvement in positive responses
34% Annual Survey data available Q1 2018
Increase number of positive responses to “I understand how my work contributes to what the IOMG is trying to achieve”
Have Your Say Survey 2015 54%
5% improvement in positive responses
54% Annual Survey data available Q1 2018
N/A = Not available
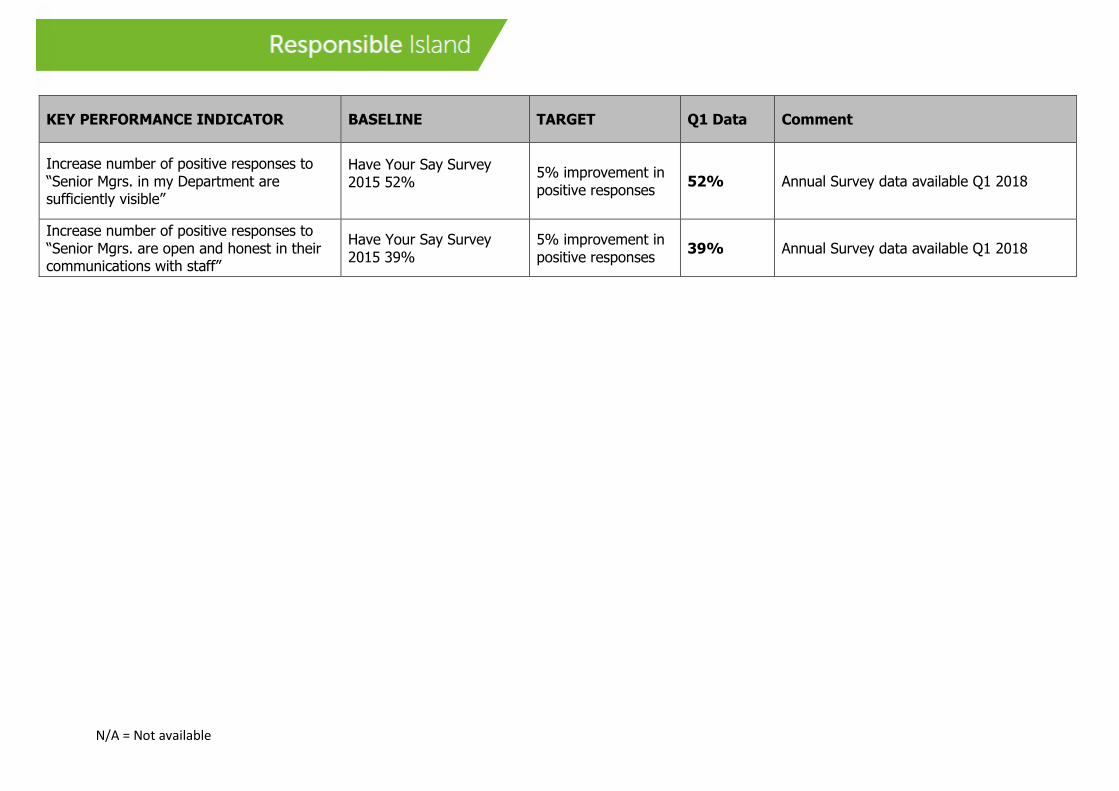
KEY PERFORMANCE INDICATOR BASELINE TARGET Q1 Data Comment
Increase number of positive responses to “Senior Mgrs. in my Department are sufficiently visible”
Have Your Say Survey 2015 52%
5% improvement in positive responses
52% Annual Survey data available Q1 2018
Increase number of positive responses to “Senior Mgrs. are open and honest in their communications with staff”
Have Your Say Survey 2015 39%
5% improvement in positive responses
39% Annual Survey data available Q1 2018
N/A = Not available
KEY PERFORMANCE INDICATOR BASELINE TARGET Q1 Data Comment
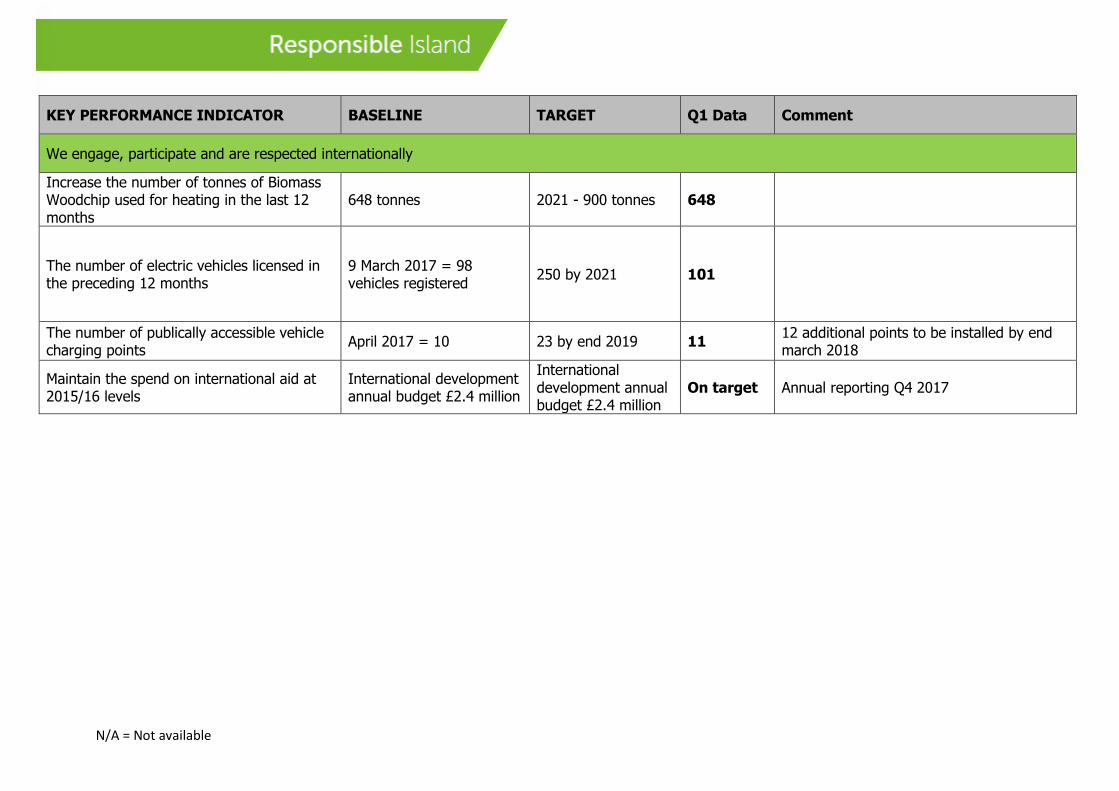
We engage, participate and are respected internationally
Increase the number of tonnes of Biomass Woodchip used for heating in the last 12 months
648 tonnes 2021 - 900 tonnes 648
The number of electric vehicles licensed in the preceding 12 months
9 March 2017 = 98 vehicles registered
250 by 2021 101
The number of publically accessible vehicle charging points
April 2017 = 10 23 by end 2019 11 12 additional points to be installed by end march 2018
Maintain the spend on international aid at 2015/16 levels
International development annual budget £2.4 million
International development annual budget £2.4 million
On target Annual reporting Q4 2017
N/A = Not available
KEY PERFORMANCE INDICATOR BASELINE TARGET Q1 Data Comment
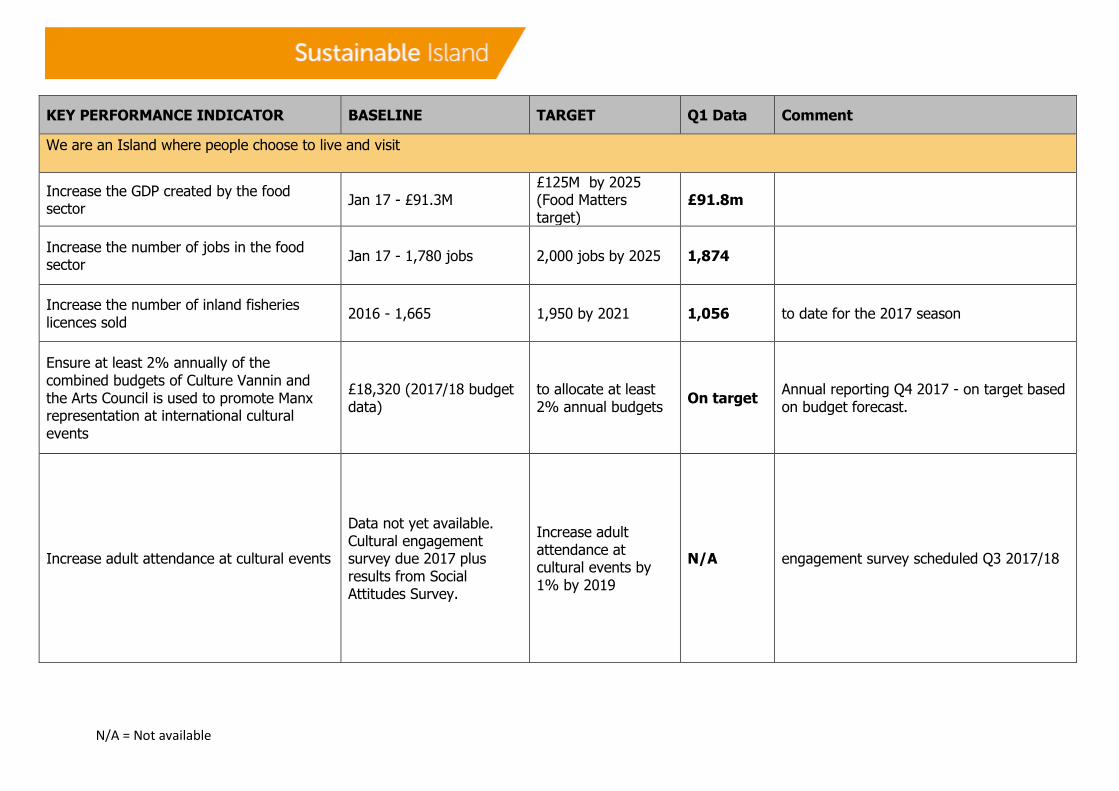
We are an Island where people choose to live and visit
Increase the GDP created by the food sector
Jan 17 - £91.3M £125M by 2025 (Food Matters target)
£91.8m
Increase the number of jobs in the food sector
Jan 17 - 1,780 jobs 2,000 jobs by 2025 1,874
Increase the number of inland fisheries licences sold
2016 - 1,665 1,950 by 2021 1,056 to date for the 2017 season
Ensure at least 2% annually of the combined budgets of Culture Vannin and the Arts Council is used to promote Manx representation at international cultural events
£18,320 (2017/18 budget data)
to allocate at least 2% annual budgets
On target Annual reporting Q4 2017 - on target based on budget forecast.
Increase adult attendance at cultural events
Data not yet available. Cultural engagement survey due 2017 plus results from Social Attitudes Survey.
Increase adult attendance at cultural events by 1% by 2019
N/A engagement survey scheduled Q3 2017/18
N/A = Not available
KEY PERFORMANCE INDICATOR BASELINE TARGET Q1 Data Comment
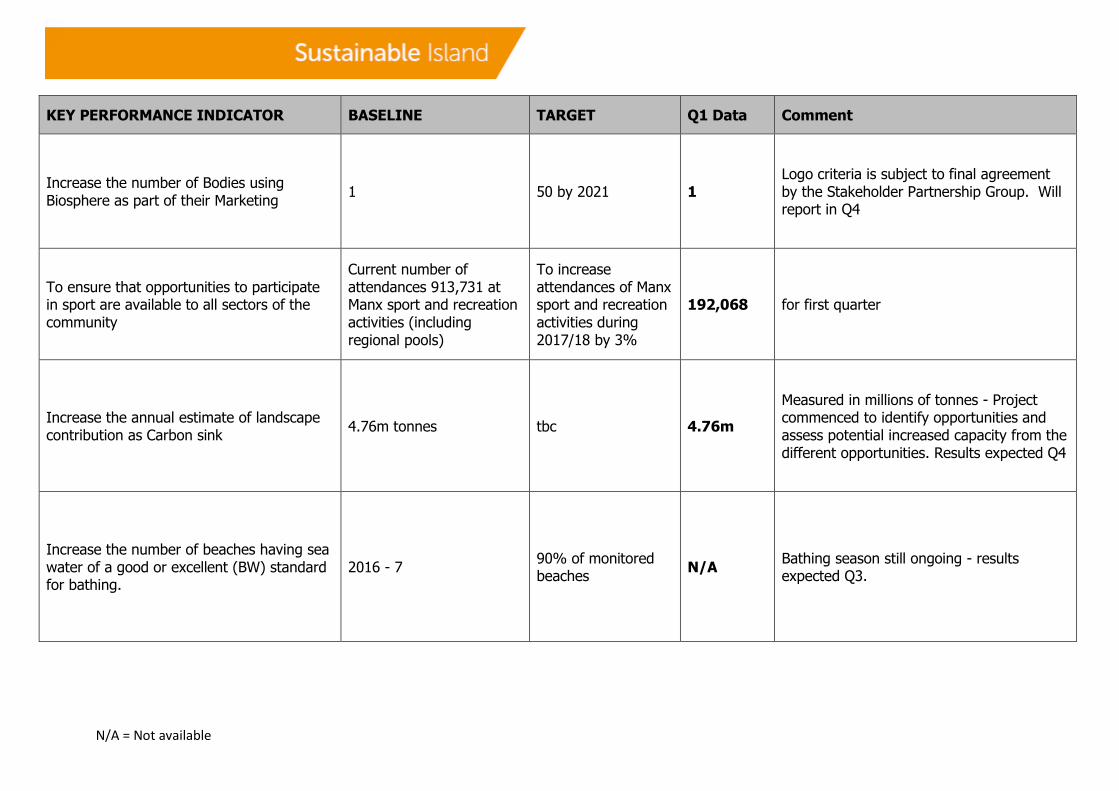
Increase the number of Bodies using Biosphere as part of their Marketing
1 50 by 2021 1 Logo criteria is subject to final agreement by the Stakeholder Partnership Group. Will report in Q4
To ensure that opportunities to participate in sport are available to all sectors of the community
Current number of attendances 913,731 at Manx sport and recreation activities (including regional pools)
To increase attendances of Manx sport and recreation activities during 2017/18 by 3%
192,068 for first quarter
Increase the annual estimate of landscape contribution as Carbon sink
4.76m tonnes tbc 4.76m
Measured in millions of tonnes - Project commenced to identify opportunities and assess potential increased capacity from the different opportunities. Results expected Q4
Increase the number of beaches having sea water of a good or excellent (BW) standard for bathing.
2016 - 7 90% of monitored beaches
N/A Bathing season still ongoing - results expected Q3.
N/A = Not available
KEY PERFORMANCE INDICATOR BASELINE TARGET Q1 Data Comment
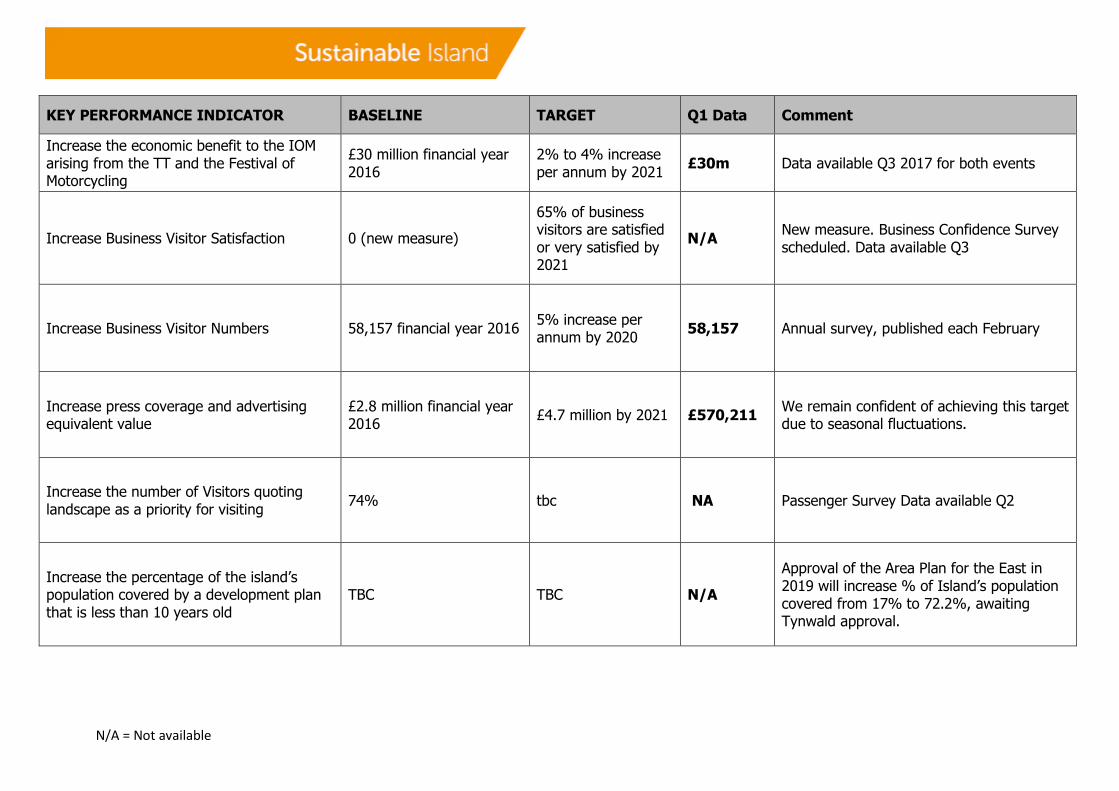
Increase the economic benefit to the IOM arising from the TT and the Festival of Motorcycling
£30 million financial year 2016
2% to 4% increase per annum by 2021
£30m Data available Q3 2017 for both events
Increase Business Visitor Satisfaction 0 (new measure)
65% of business visitors are satisfied or very satisfied by 2021
N/A New measure. Business Confidence Survey scheduled. Data available Q3
Increase Business Visitor Numbers 58,157 financial year 2016 5% increase per annum by 2020
58,157 Annual survey, published each February
Increase press coverage and advertising equivalent value
£2.8 million financial year 2016
£4.7 million by 2021 £570,211 We remain confident of achieving this target due to seasonal fluctuations.
Increase the number of Visitors quoting landscape as a priority for visiting
74% tbc NA Passenger Survey Data available Q2
Increase the percentage of the island’s population covered by a development plan that is less than 10 years old
TBC TBC N/A
Approval of the Area Plan for the East in 2019 will increase % of Island’s population covered from 17% to 72.2%, awaiting Tynwald approval.
N/A = Not available
KEY PERFORMANCE INDICATOR BASELINE TARGET Q1 Data Comment
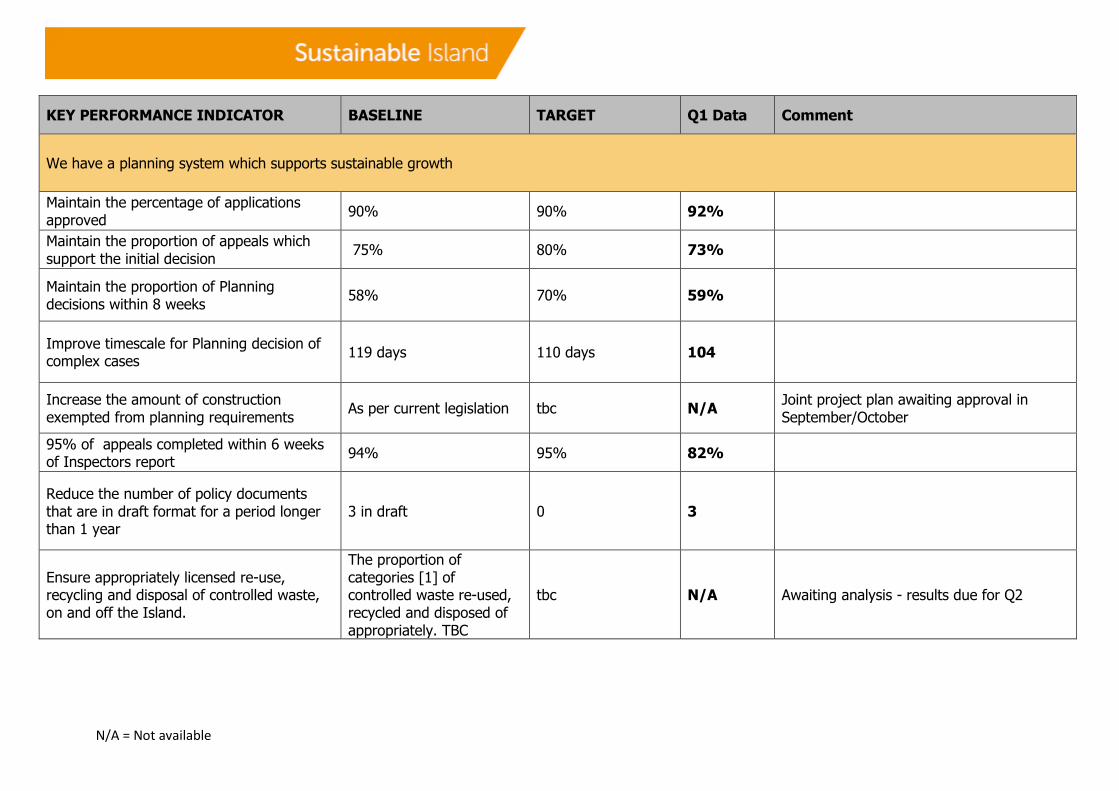
We have a planning system which supports sustainable growth
Maintain the percentage of applications approved
90% 90% 92%
Maintain the proportion of appeals which support the initial decision
75% 80% 73%
Maintain the proportion of Planning decisions within 8 weeks
58% 70% 59%
Improve timescale for Planning decision of complex cases
119 days 110 days 104
Increase the amount of construction exempted from planning requirements
As per current legislation tbc N/A Joint project plan awaiting approval in September/October
95% of appeals completed within 6 weeks of Inspectors report
94% 95% 82%
Reduce the number of policy documents that are in draft format for a period longer than 1 year
3 in draft 0 3
Ensure appropriately licensed re-use, recycling and disposal of controlled waste, on and off the Island.
The proportion of categories [1] of controlled waste re-used, recycled and disposed of appropriately. TBC
tbc N/A Awaiting analysis - results due for Q2
N/A = Not available
KEY PERFORMANCE INDICATOR BASELINE TARGET Q1 Data Comment
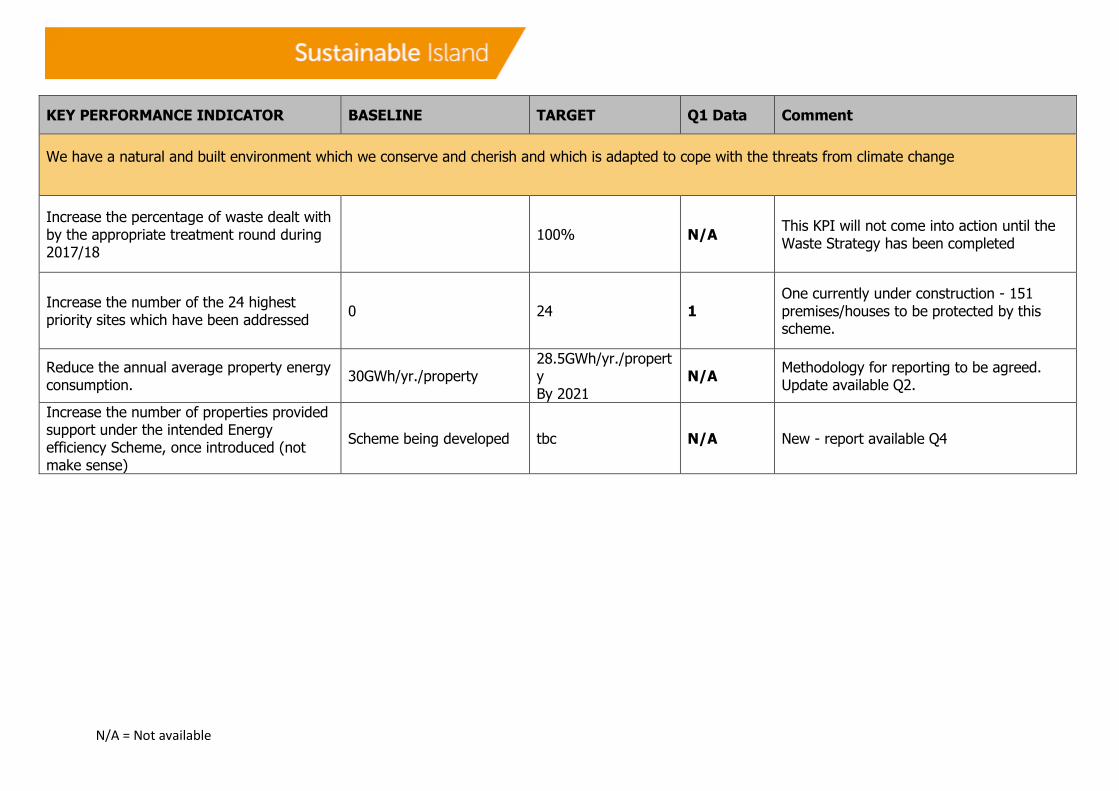
We have a natural and built environment which we conserve and cherish and which is adapted to cope with the threats from climate change
Increase the percentage of waste dealt with by the appropriate treatment round during 2017/18
100% N/A This KPI will not come into action until the Waste Strategy has been completed
Increase the number of the 24 highest priority sites which have been addressed
0 24 1 One currently under construction - 151 premises/houses to be protected by this scheme.
Reduce the annual average property energy consumption.
30GWh/yr./property 28.5GWh/yr./property By 2021
N/A Methodology for reporting to be agreed. Update available Q2.
Increase the number of properties provided support under the intended Energy efficiency Scheme, once introduced (not make sense)
Scheme being developed tbc N/A New - report available Q4
N/A = Not available
KEY PERFORMANCE INDICATOR BASELINE TARGET Q1 Data Comment
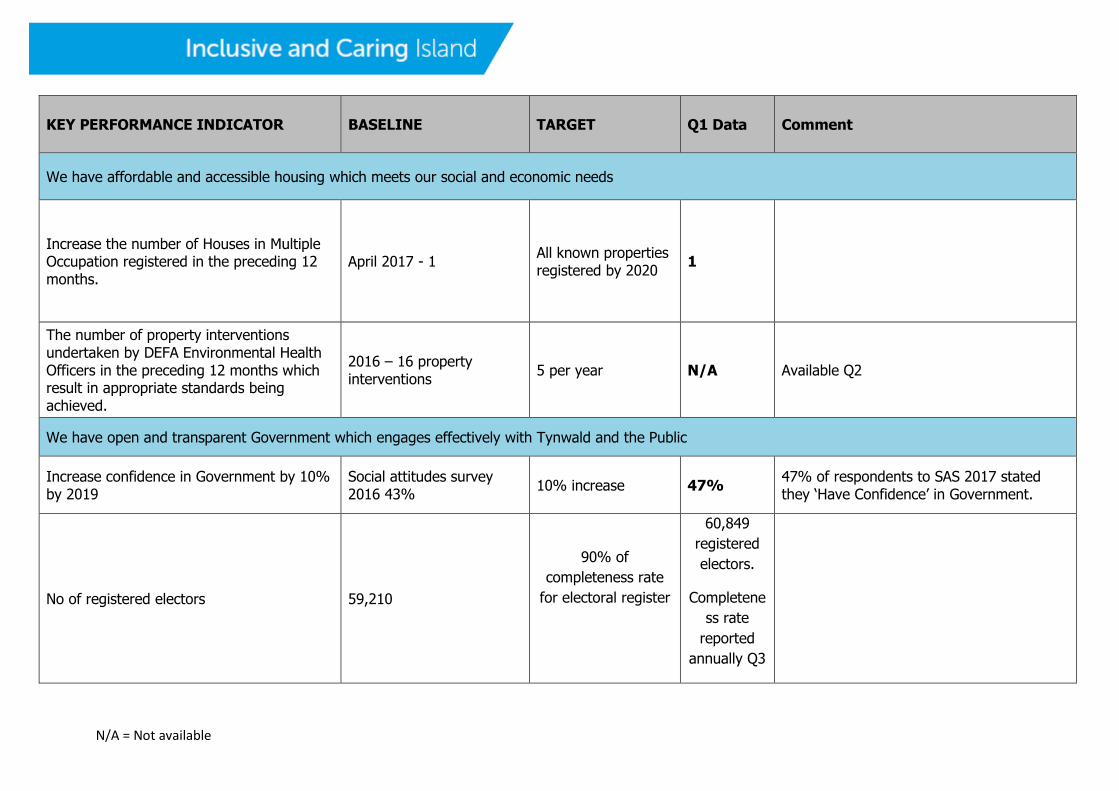
We have affordable and accessible housing which meets our social and economic needs
Increase the number of Houses in Multiple Occupation registered in the preceding 12 months.
April 2017 - 1 All known properties registered by 2020
1
The number of property interventions undertaken by DEFA Environmental Health Officers in the preceding 12 months which result in appropriate standards being achieved.
2016 – 16 property interventions
5 per year N/A Available Q2
We have open and transparent Government which engages effectively with Tynwald and the Public
Increase confidence in Government by 10% by 2019
Social attitudes survey 2016 43%
10% increase 47% 47% of respondents to SAS 2017 stated they ‘Have Confidence’ in Government.
No of registered electors 59,210
90% of
completeness rate
for electoral register
60,849
registered
electors.
Completene
ss rate
reported
annually Q3
N/A = Not available
KEY PERFORMANCE INDICATOR BASELINE TARGET Q1 Data Comment
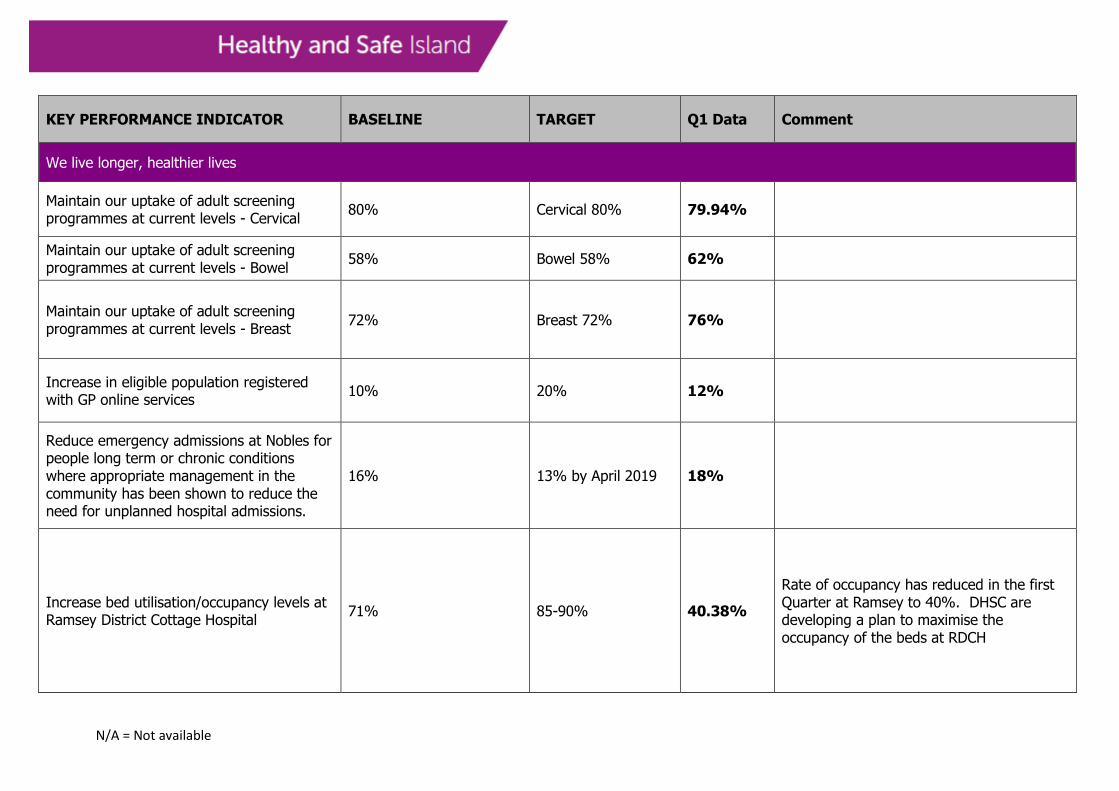
We live longer, healthier lives
Maintain our uptake of adult screening programmes at current levels - Cervical
80% Cervical 80% 79.94%
Maintain our uptake of adult screening programmes at current levels - Bowel
58% Bowel 58% 62%
Maintain our uptake of adult screening programmes at current levels - Breast
72% Breast 72% 76%
Increase in eligible population registered with GP online services
10% 20% 12%
Reduce emergency admissions at Nobles for people long term or chronic conditions where appropriate management in the community has been shown to reduce the need for unplanned hospital admissions.
16% 13% by April 2019 18%
Increase bed utilisation/occupancy levels at Ramsey District Cottage Hospital
71% 85-90% 40.38%
Rate of occupancy has reduced in the first Quarter at Ramsey to 40%. DHSC are developing a plan to maximise the occupancy of the beds at RDCH

N/A = Not available
KEY PERFORMANCE INDICATOR BASELINE TARGET Q1 Data Comment
Reduce adult acute mental health bed occupancy
96% 85% 77%
Increase in 5 day discharge follow up rate by Mental Health Services
36% 100% 84%
The hospital will achieve 85% aggregate performance for 2 week cancer waiting times by the end of march 2018, 93% by the end of March 2019
74% 85% 2018, 93% 2019
89.8%
No patient will wait >52 weeks for elective inpatient surgery by the end of march 2018
14% 0% 13%
Maintain spend against budget through delivery of the cost improvement plan
105% 100% 102%
N/A = Not available
KEY PERFORMANCE INDICATOR BASELINE TARGET Q1 Data Comment
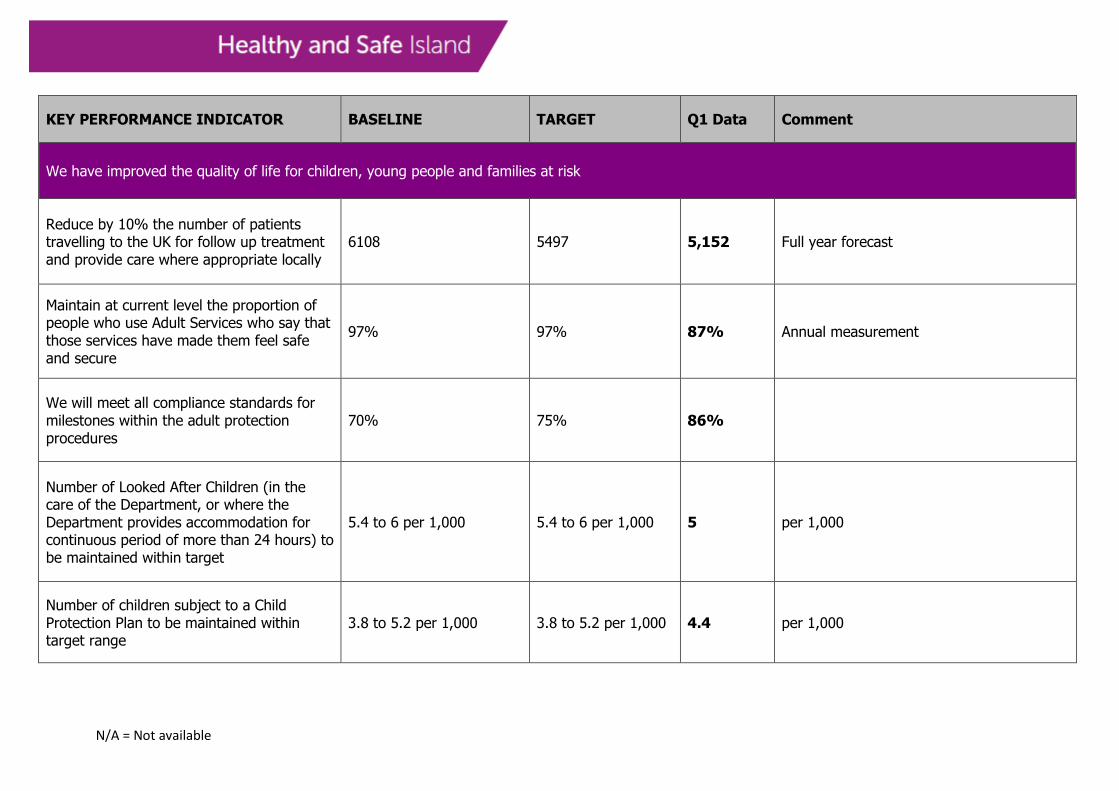
We have improved the quality of life for children, young people and families at risk
Reduce by 10% the number of patients travelling to the UK for follow up treatment and provide care where appropriate locally
6108 5497 5,152 Full year forecast
Maintain at current level the proportion of people who use Adult Services who say that those services have made them feel safe and secure
97% 97% 87% Annual measurement
We will meet all compliance standards for milestones within the adult protection procedures
70% 75% 86%
Number of Looked After Children (in the care of the Department, or where the Department provides accommodation for continuous period of more than 24 hours) to be maintained within target
5.4 to 6 per 1,000 5.4 to 6 per 1,000 5 per 1,000
Number of children subject to a Child Protection Plan to be maintained within target range
3.8 to 5.2 per 1,000 3.8 to 5.2 per 1,000 4.4 per 1,000
N/A = Not available
KEY PERFORMANCE INDICATOR BASELINE TARGET Q1 Data Comment
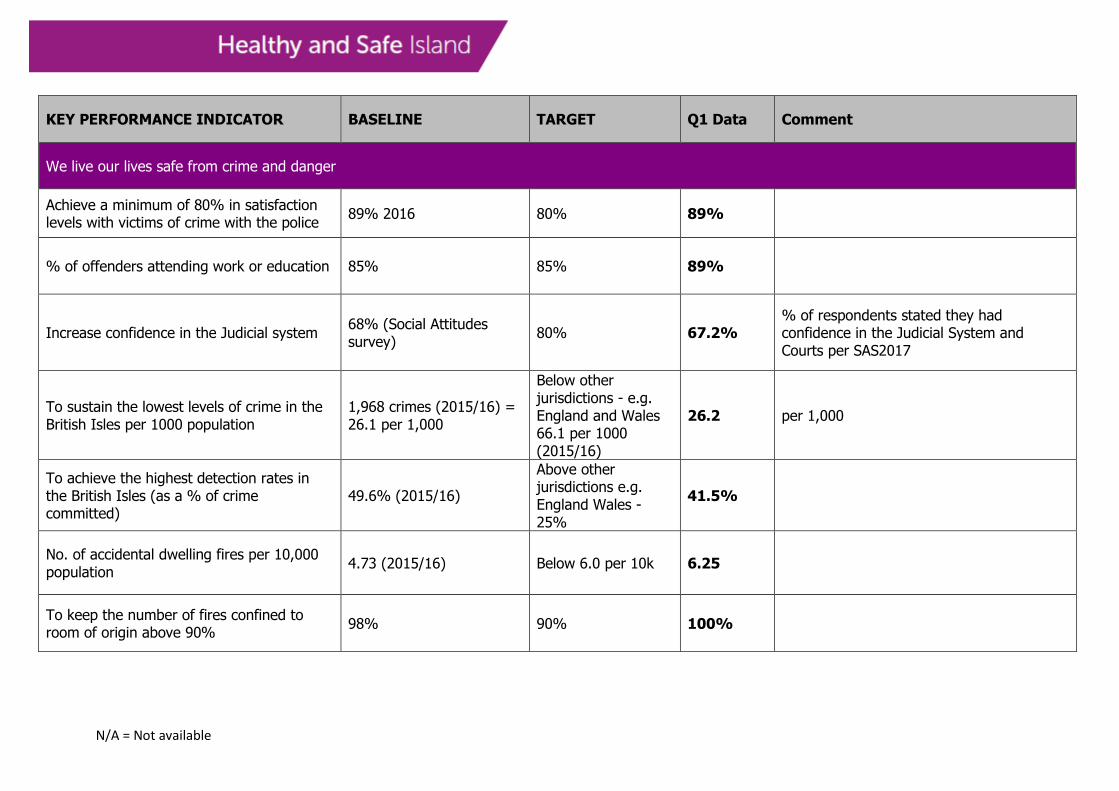
We live our lives safe from crime and danger
Achieve a minimum of 80% in satisfaction levels with victims of crime with the police
89% 2016 80% 89%
% of offenders attending work or education 85% 85% 89%
Increase confidence in the Judicial system 68% (Social Attitudes survey)
80% 67.2% % of respondents stated they had confidence in the Judicial System and Courts per SAS2017
To sustain the lowest levels of crime in the British Isles per 1000 population
1,968 crimes (2015/16) = 26.1 per 1,000
Below other jurisdictions - e.g. England and Wales 66.1 per 1000 (2015/16)
26.2 per 1,000
To achieve the highest detection rates in the British Isles (as a % of crime committed)
49.6% (2015/16)
Above other jurisdictions e.g. England Wales - 25%
41.5%
No. of accidental dwelling fires per 10,000 population
4.73 (2015/16) Below 6.0 per 10k 6.25
To keep the number of fires confined to room of origin above 90%
98% 90% 100%
N/A = Not available
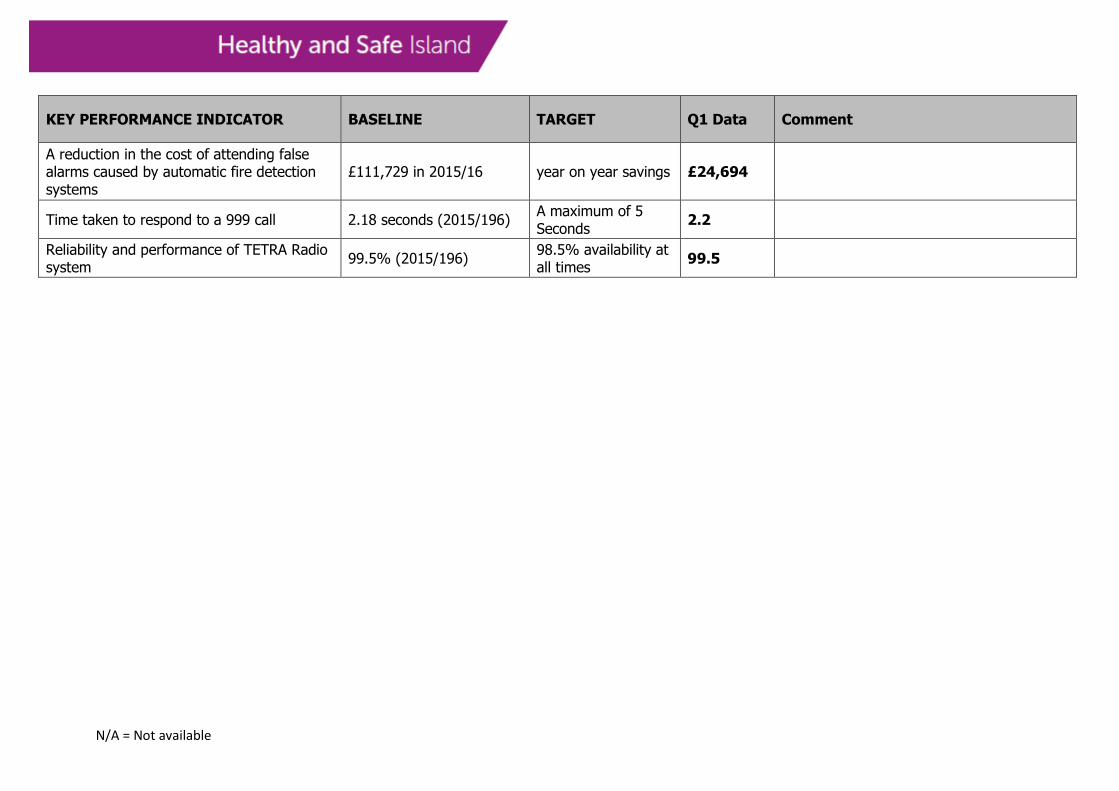
KEY PERFORMANCE INDICATOR BASELINE TARGET Q1 Data Comment
A reduction in the cost of attending false alarms caused by automatic fire detection systems
£111,729 in 2015/16 year on year savings £24,694
Time taken to respond to a 999 call 2.18 seconds (2015/196) A maximum of 5 Seconds
2.2
Reliability and performance of TETRA Radio system
99.5% (2015/196) 98.5% availability at all times
99.5