Embed Size (px)
Citation preview
PROGRAMMING, ALGORITHMS AND FLOWCHARTS
What is Programming?
Series of instructions to a computer to accomplish a task
Instructions must be written in a way the computer can understand
Programming languages are used to write programs
ALGORITHMS AND FLOWCHARTS
A typical programming task can be divided into two phases:
Problem solving phase produce an ordered sequence of steps that describe
solution of problem this sequence of steps is called an algorithm
Implementation phase implement the program in some programming
language
Devise an algorithm for cooking a sausage on a barbecue
Steps in Problem Solving
First produce a general algorithm. Refine the algorithm successively to get step by
step detailed algorithm that is very close to a computer language.
Pseudocode is an artificial and informal language that helps programmers develop algorithms. Pseudocode is very similar to everyday English.
Pseudocode & Algorithm
Example 1: Write an algorithm to determine a student’s final grade and indicate whether it is passing or failing. The final grade is calculated as the average of four marks.
Start with a general algorithm.
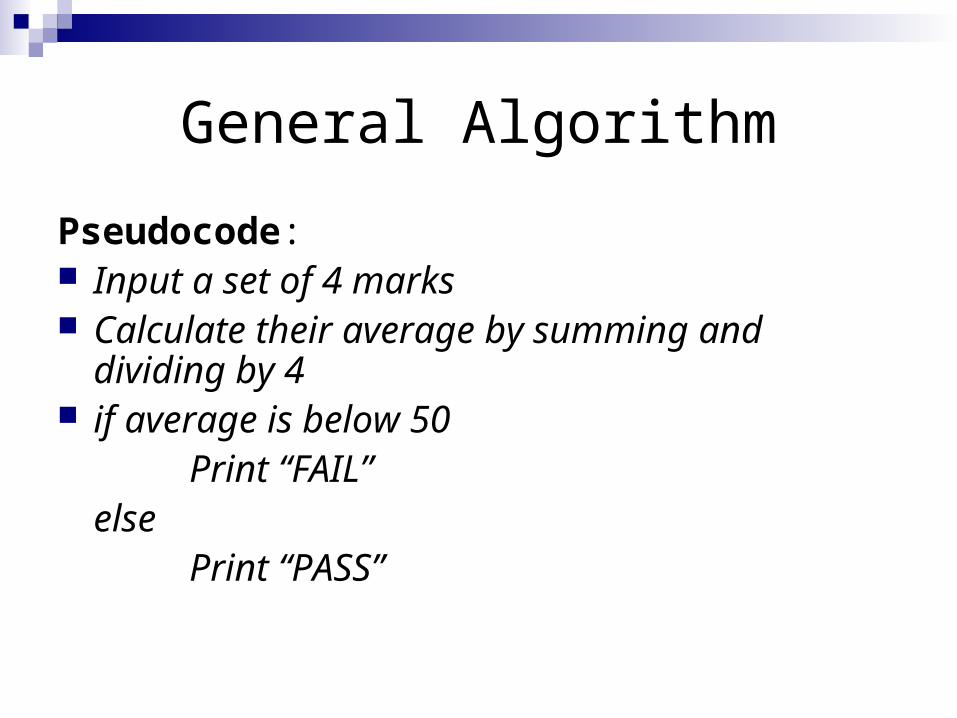
General Algorithm
Pseudocode: Input a set of 4 marks Calculate their average by summing and dividing
by 4 if average is below 50
Print “FAIL”else
Print “PASS”
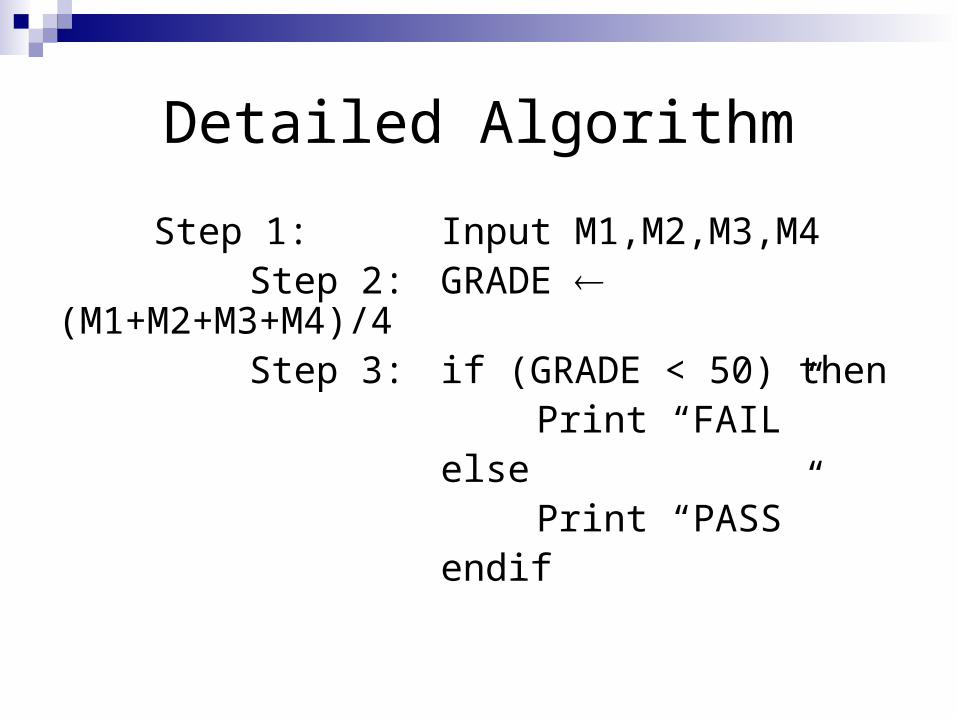
Detailed Algorithm
Step 1: Input M1,M2,M3,M4Step 2: GRADE
(M1+M2+M3+M4)/4 Step 3: if (GRADE < 50) then
Print “FAIL” else
Print “PASS”endif
Task: add two numbers
Pseudocode:Start
Get two numbers
Add them
Print the answer
End
Next Step - The Flowchart
A graphical representation of the sequence of operations in an information system or program. Information system flowcharts show how data flows from source documents through the computer to final distribution to users. Program flowcharts show the sequence of instructions in a single program or subroutine. Different symbols are used to draw each type of flowchart.
The sequence of the flowchart and the algorithm MUST match.
The Flowchart
A Flowchartshows logic of an algorithmemphasizes individual steps and their
interconnectionse.g. control flow from one action to the next
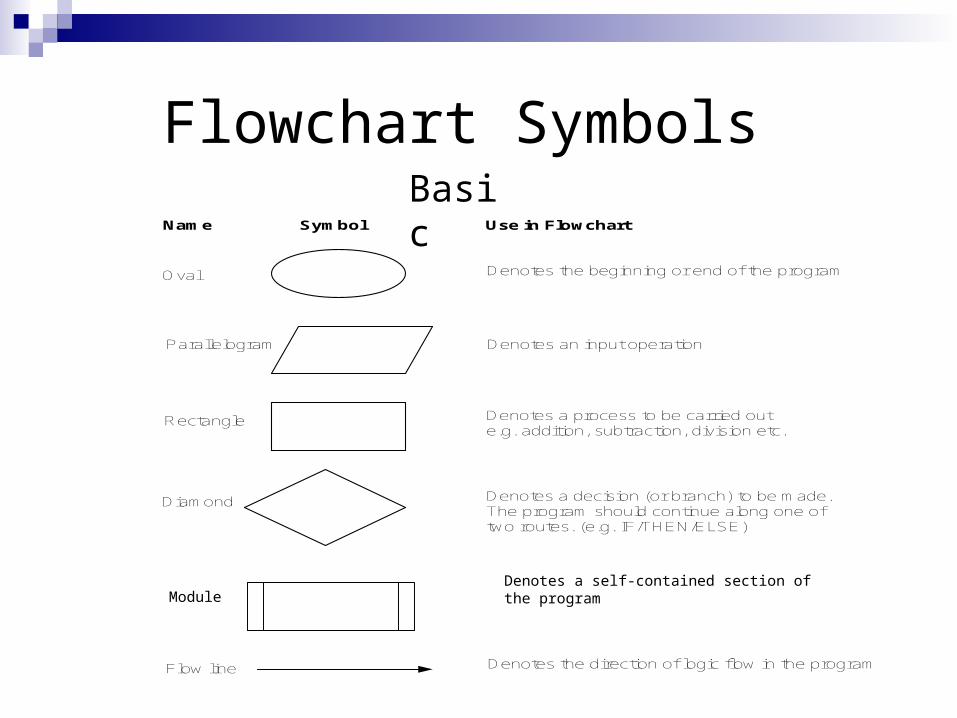
Flowchart Symbols Basic
Oval
Parallelogram
Rectangle
Diamond
Hybrid
Name Symbol Use in Flowchart
Denotes the beginning or end of the program
Denotes an input operation
Denotes an output operation
Denotes a decision (or branch) to be made. The program should continue along one of two routes. (e.g. IF/THEN/ELSE)
Denotes a process to be carried oute.g. addition, subtraction, division etc.
Flow line Denotes the direction of logic flow in the program
Module
Denotes a self-contained section of the program
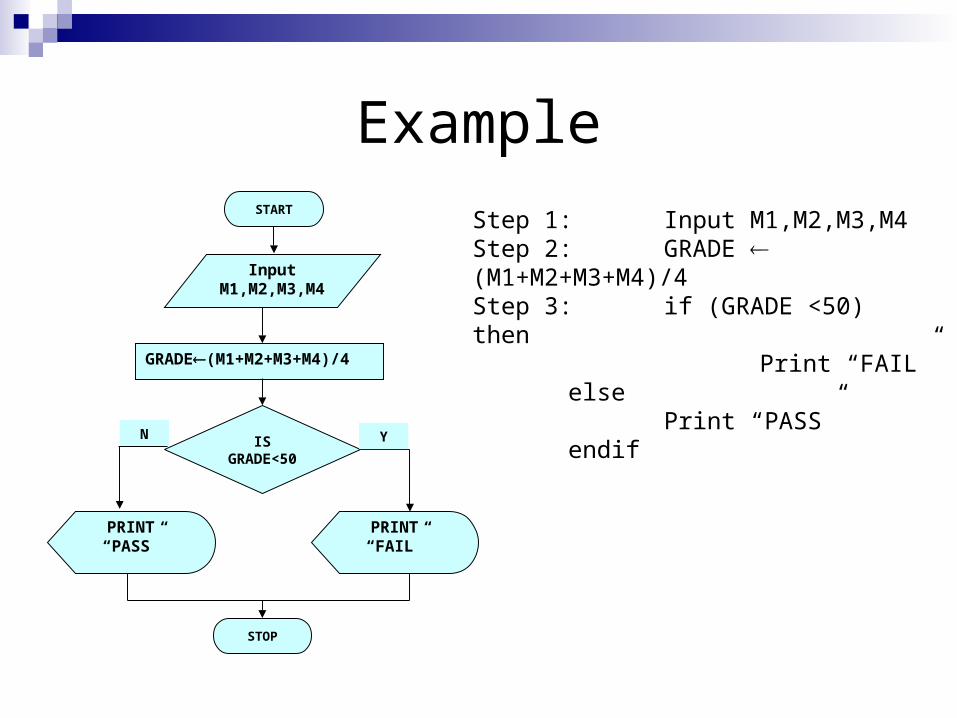
Example
PRINT“PASS”
Step 1: Input M1,M2,M3,M4Step 2: GRADE (M1+M2+M3+M4)/4 Step 3: if (GRADE <50) then
Print “FAIL” else
Print “PASS” endif
START
InputM1,M2,M3,M4
GRADE(M1+M2+M3+M4)/4
ISGRADE<50
PRINT“FAIL”
STOP
YN
Control Structures
Represent the flow of logic through the programme.
There are four main control structures:•Sequence•Decision – incorporating if-then-else•Repetition•Case
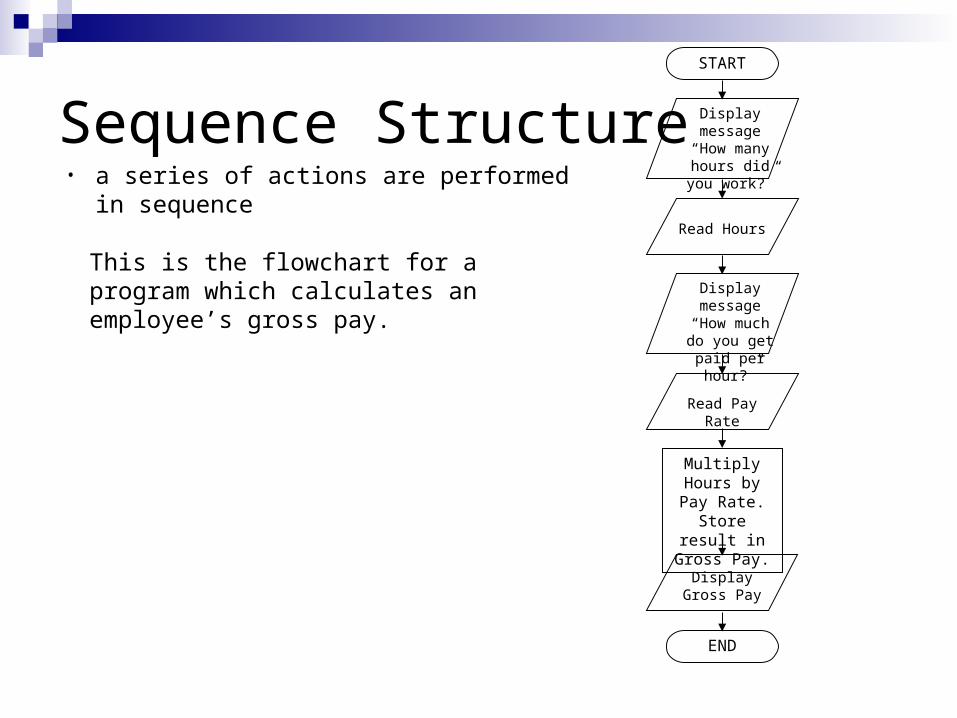
Sequence Structure• a series of actions are performed in sequence
START
Display message “How many
hours did you work?”
Read Hours
Display message “How much do you get paid per
hour?”
Read Pay Rate
Multiply Hours by Pay Rate.
Store result in Gross Pay.
Display Gross Pay
END
This is the flowchart for a program which calculates an employee’s gross pay.
Example 1
Write an algorithm and draw a flowchart to convert the length in feet to centimetres.
Pseudocode: Input the length in feet (Lft) Calculate the length in cm (Lcm) by
multiplying LFT with 30 Print length in cm (LCM)
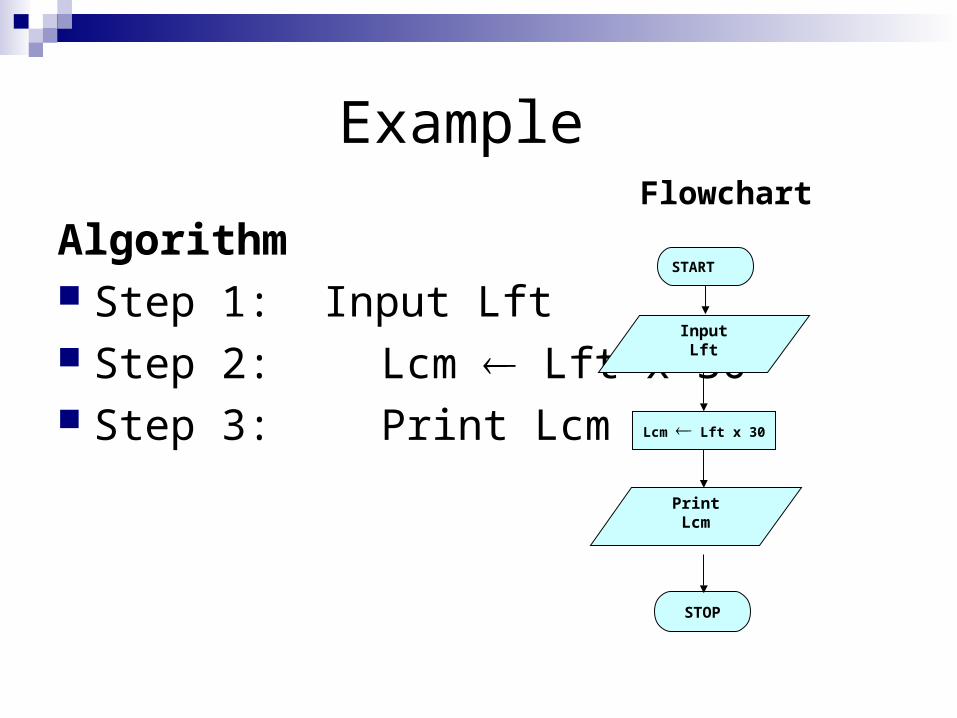
Example
Algorithm Step 1: Input Lft Step 2: Lcm Lft x 30 Step 3: Print Lcm
START
InputLft
Lcm Lft x 30
STOP
Flowchart
PrintLcm
Example 2
Write an algorithm and draw a flowchart that will read the two sides of a rectangle and calculate its area.
Pseudocode Input the width (W) and Length (L) of a rectangle Calculate the area (A) by multiplying L with W Print A
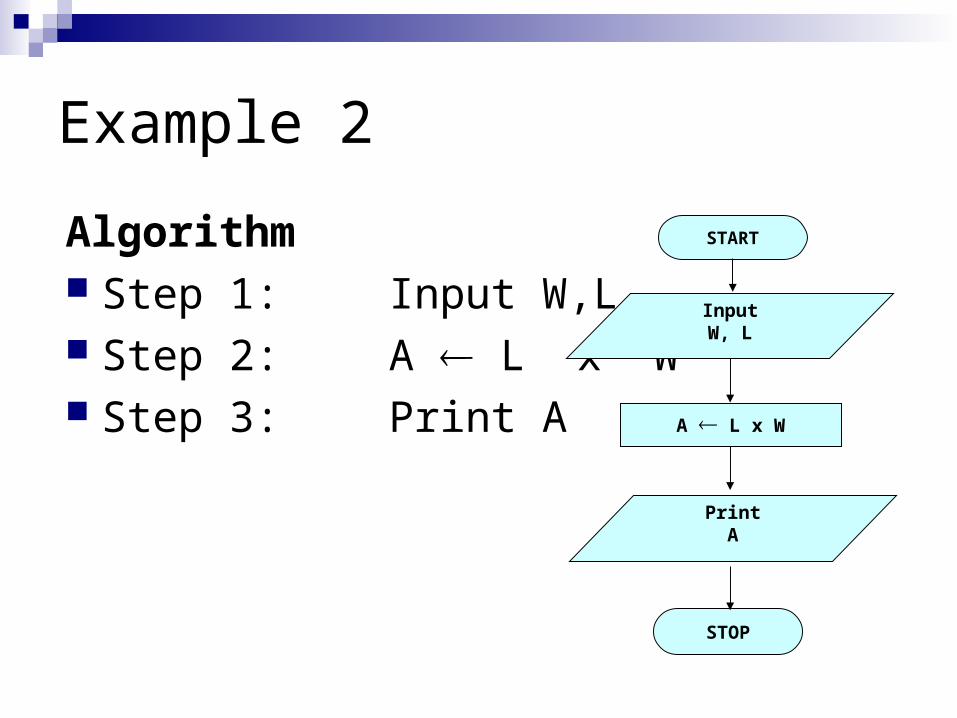
Example 2
Algorithm Step 1: Input W,L Step 2: A L x W Step 3: Print A
START
InputW, L
A L x W
STOP
PrintA
DECISION STRUCTURES
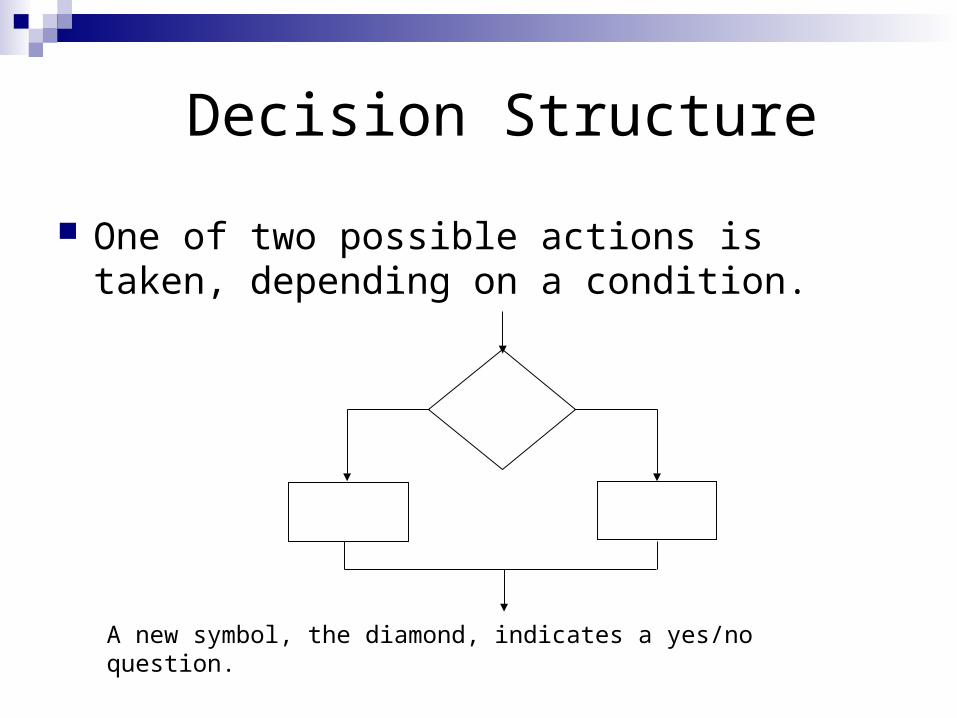
One of two possible actions is taken, depending on a condition.
Decision Structure
A new symbol, the diamond, indicates a yes/no question.
Decision Structures
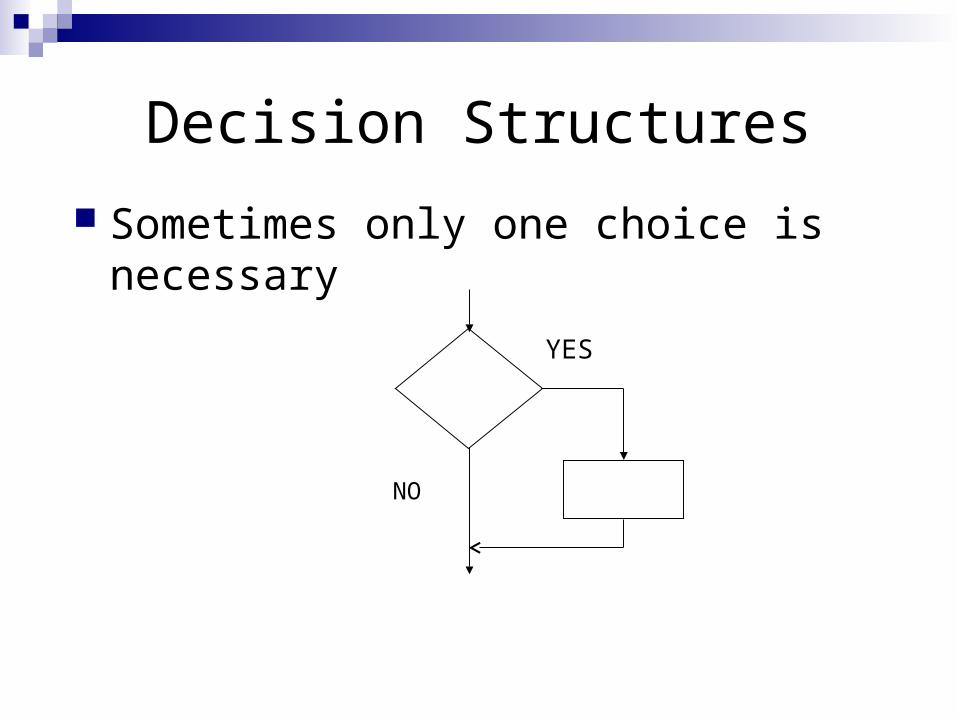
Sometimes only one choice is necessary
YES
NO
Example 1
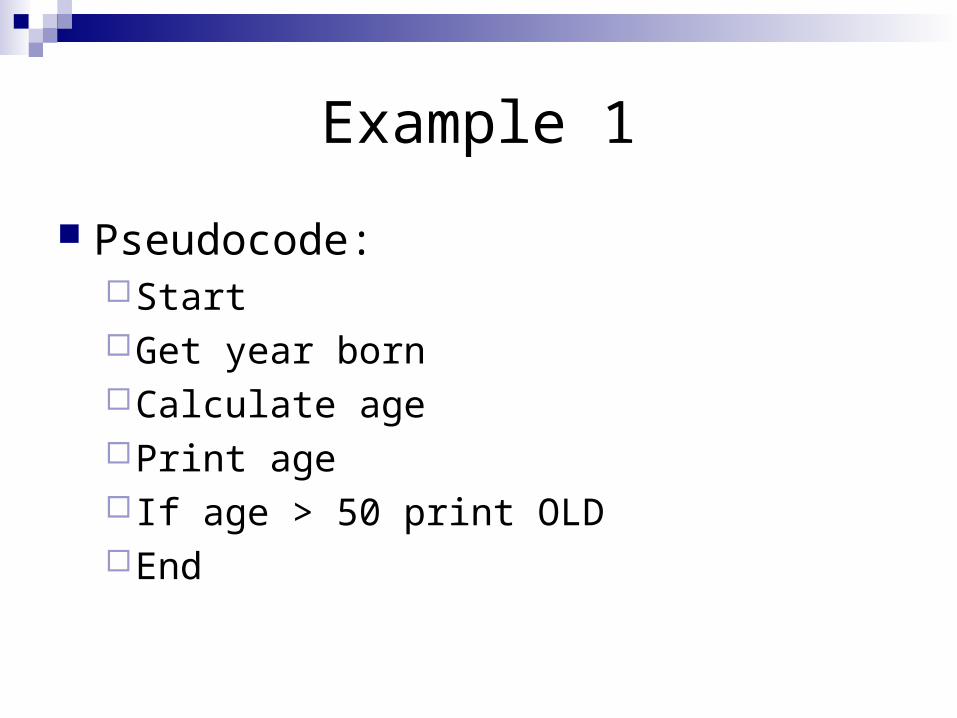
Pseudocode:Start Get year bornCalculate agePrint age If age > 50 print OLDEnd
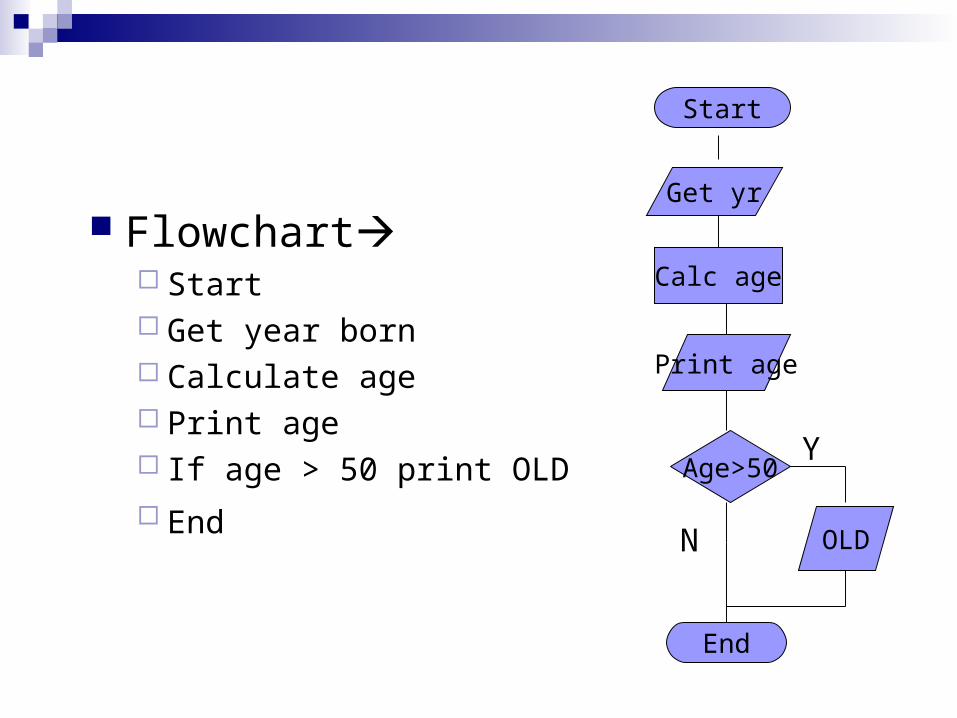
Flowchart Start Get year born Calculate age Print age If age > 50 print OLD End
Get yr
Calc age
Print age
Age>50
OLD
Y
N
Start
End
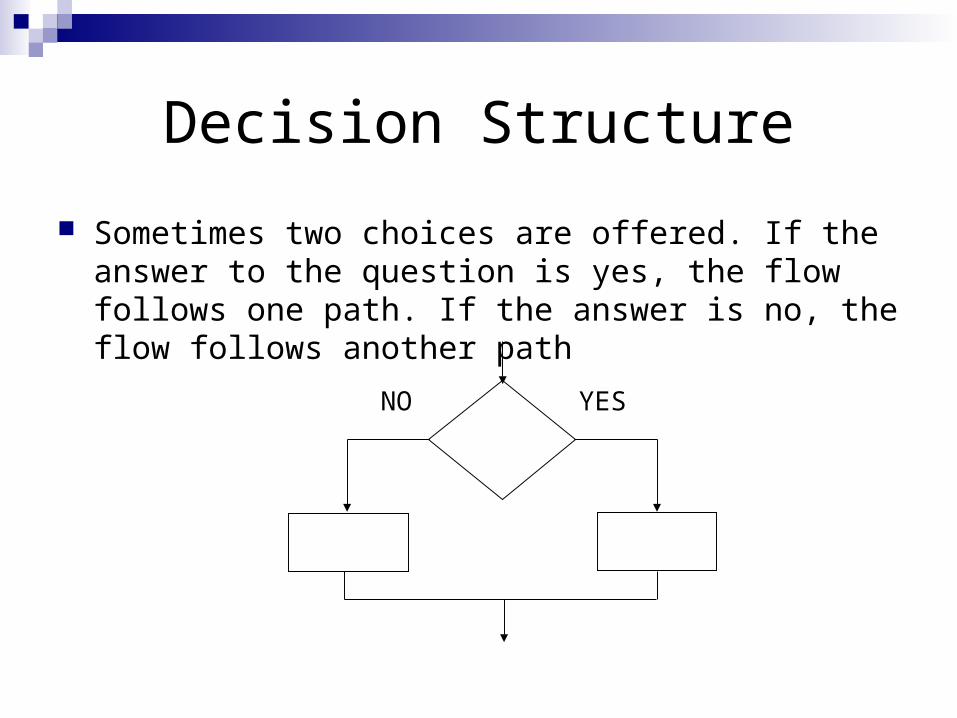
Decision Structure
Sometimes two choices are offered. If the answer to the question is yes, the flow follows one path. If the answer is no, the flow follows another path
YESNO
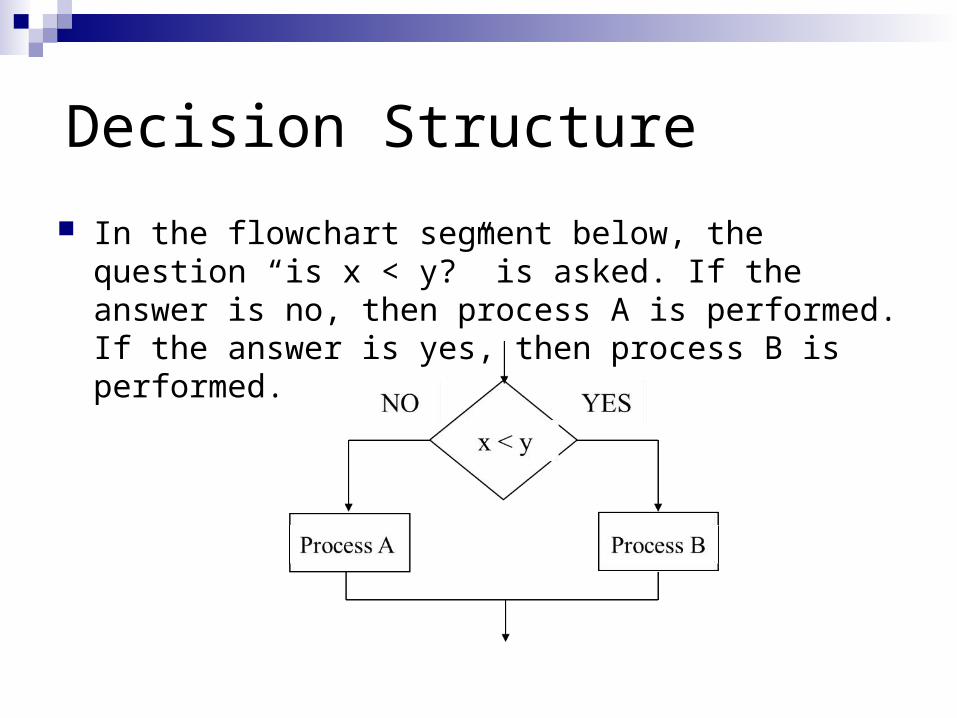
Decision Structure
In the flowchart segment below, the question “is x < y?” is asked. If the answer is no, then process A is performed. If the answer is yes, then process B is performed.
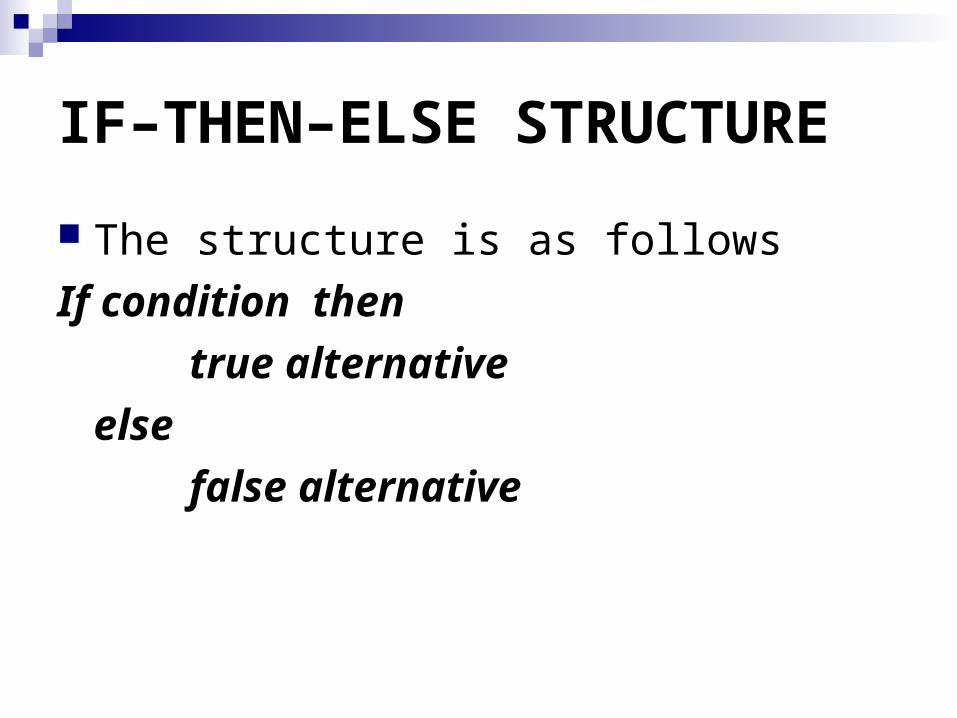
IF–THEN–ELSE STRUCTURE
The structure is as follows
If condition then
true alternative
else
false alternative
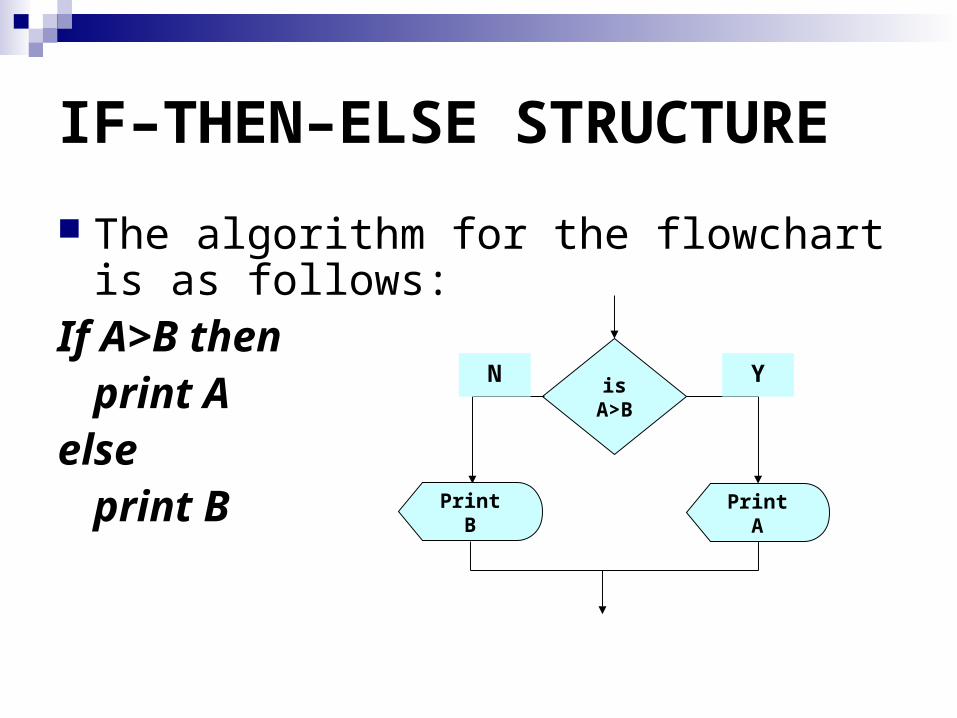
IF–THEN–ELSE STRUCTURE
The algorithm for the flowchart is as follows:
If A>B then print A
else print B
isA>B
Print APrint B
N Y
Example 1
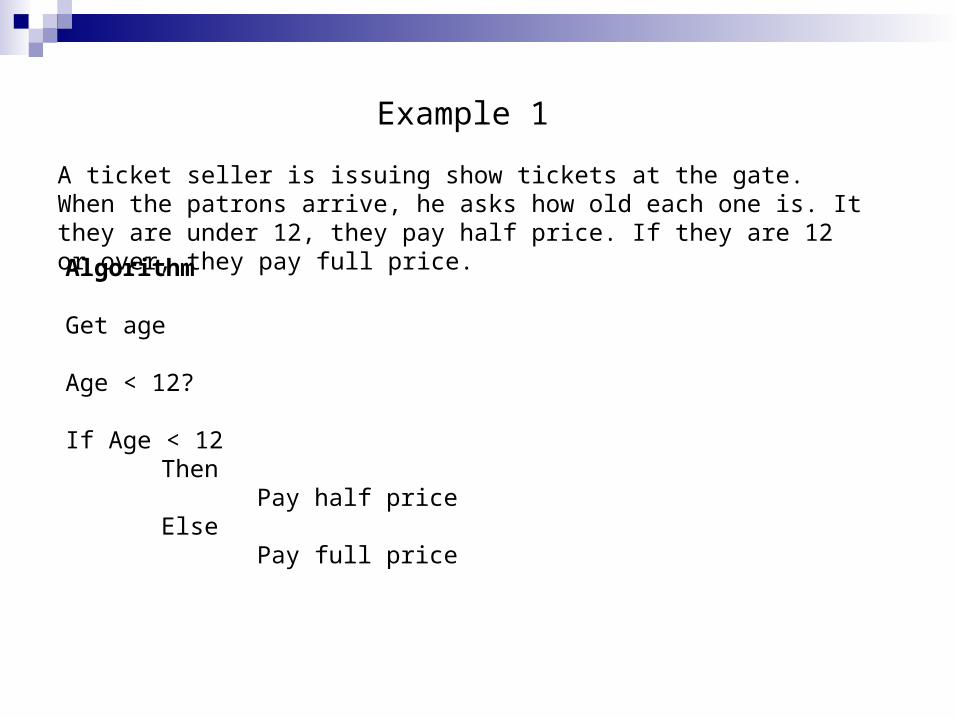
A ticket seller is issuing show tickets at the gate. When the patrons arrive, he asks how old each one is. It they are under 12, they pay half price. If they are 12 or over, they pay full price.
Algorithm
Get age
Age < 12?
If Age < 12Then
Pay half priceElse
Pay full price
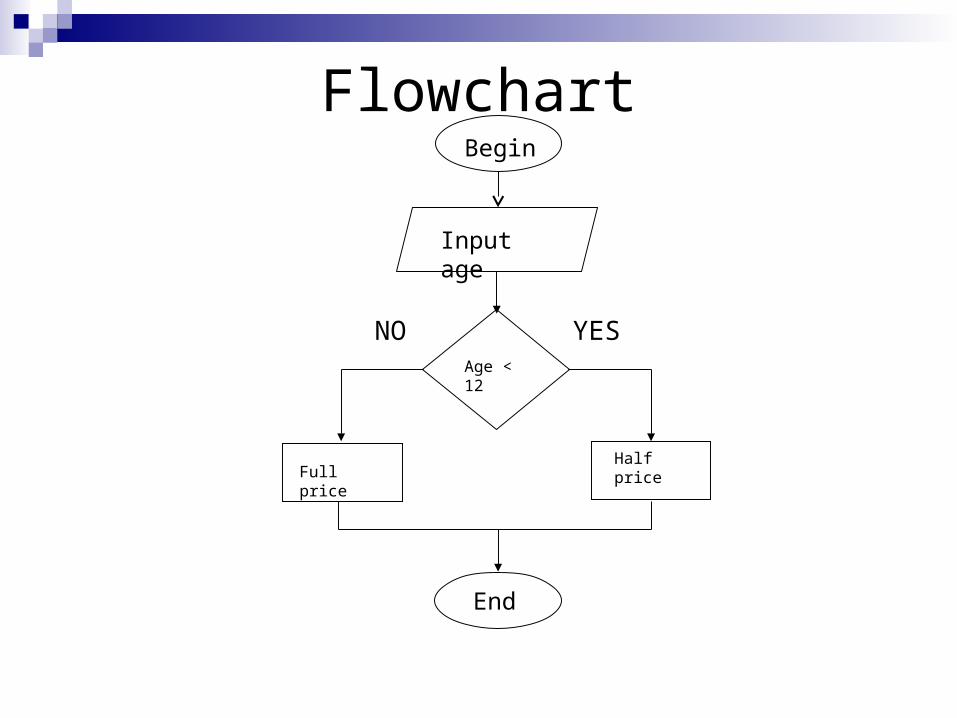
Flowchart
YESNO
Begin
Input age
Age < 12
Half priceFull price
End
Example 2
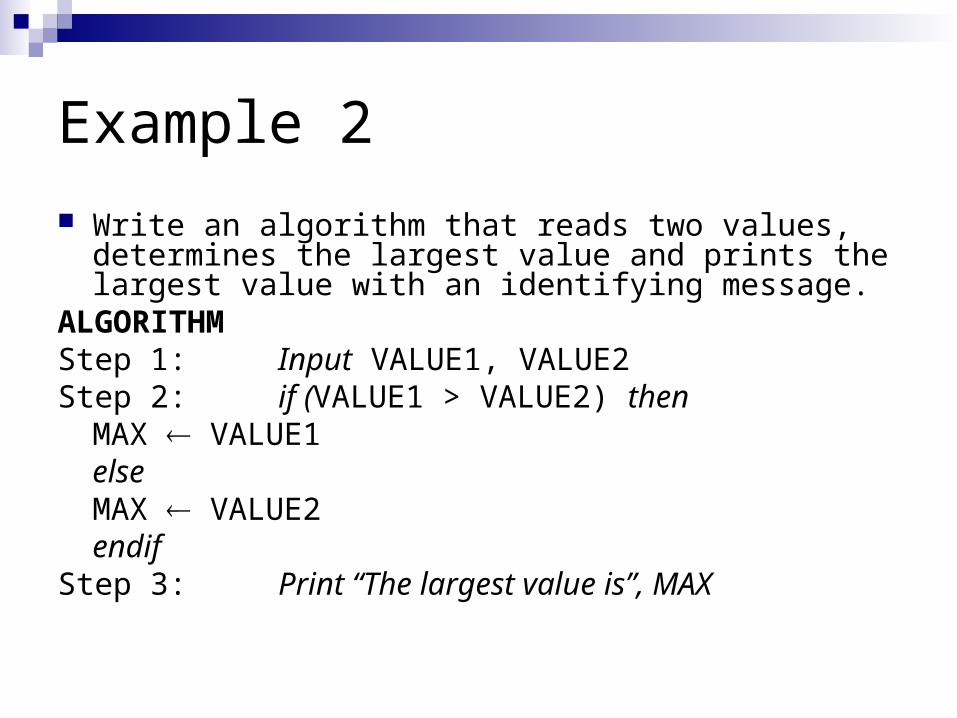
Write an algorithm that reads two values, determines the largest value and prints the largest value with an identifying message.
ALGORITHMStep 1: Input VALUE1, VALUE2Step 2: if (VALUE1 > VALUE2) then
MAX VALUE1else
MAX VALUE2endif
Step 3: Print “The largest value is”, MAX
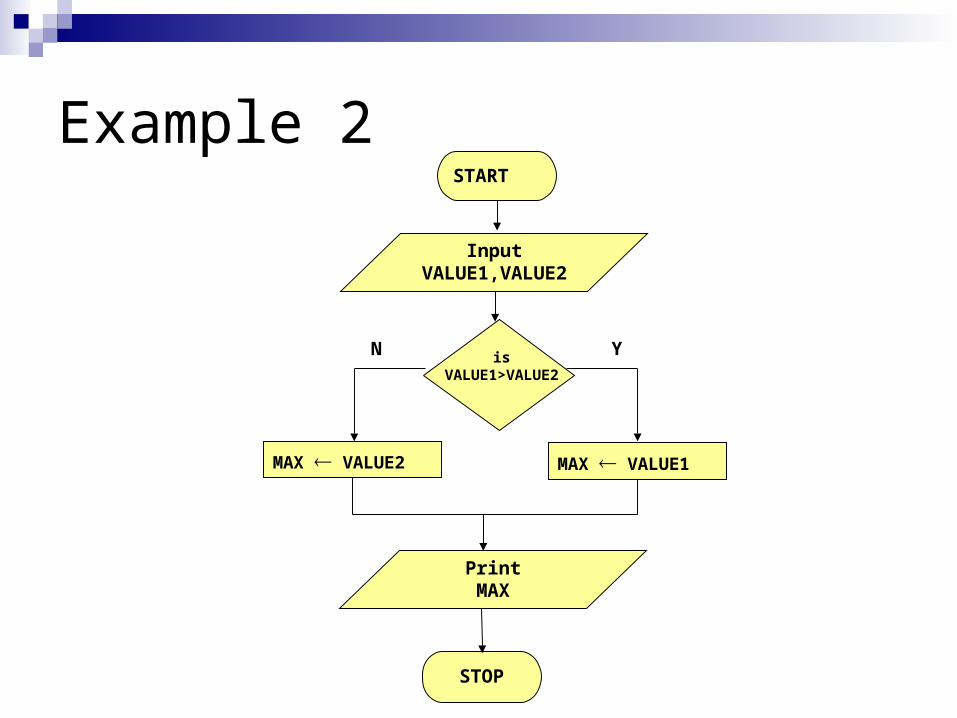
Example 2
MAX VALUE2
STOP
N Y
START
InputVALUE1,VALUE2
MAX VALUE1
isVALUE1>VALUE2
PrintMAX
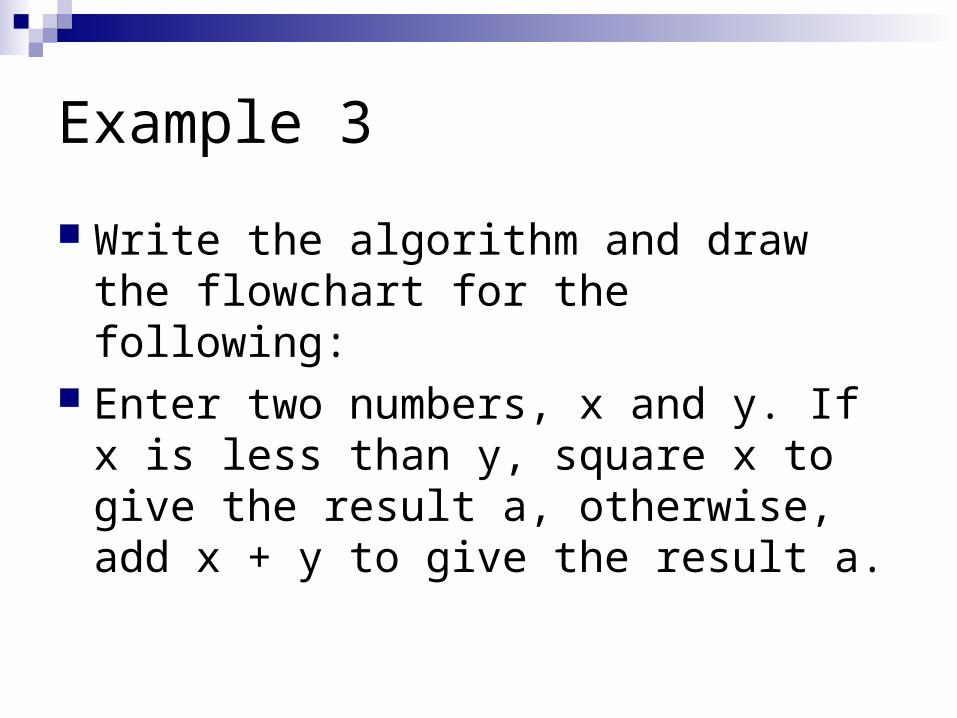
Example 3
Write the algorithm and draw the flowchart for the following:
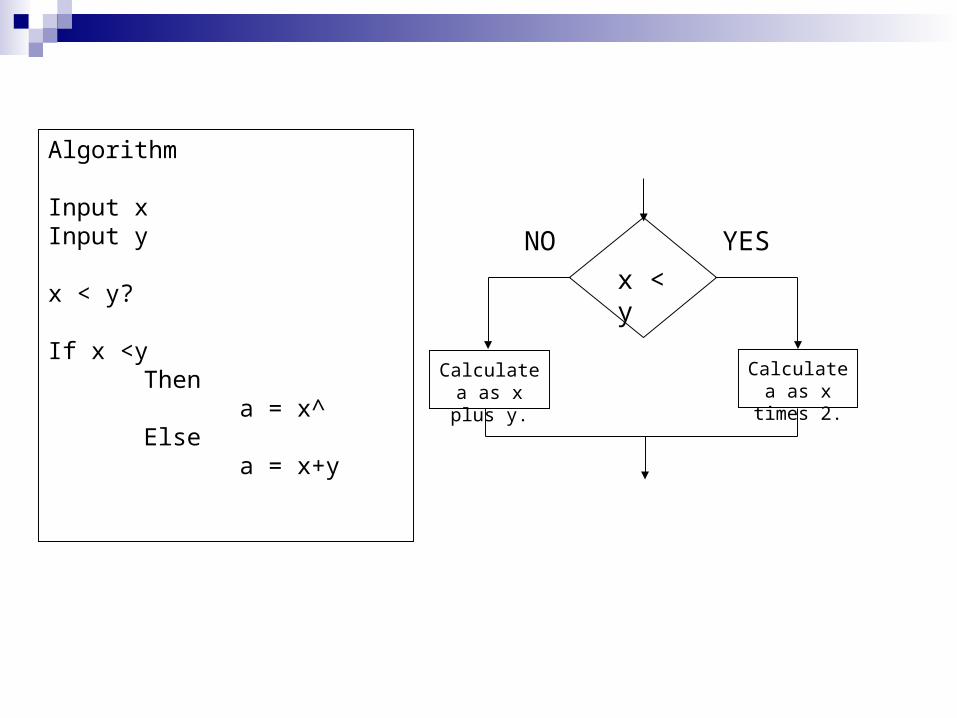
Enter two numbers, x and y. If x is less than y, square x to give the result a, otherwise, add x + y to give the result a.
YESNO
x < y
Calculate a as x times 2.
Calculate a as x plus y.
Algorithm
Input xInput y
x < y?
If x <yThen
a = x^Else
a = x+y
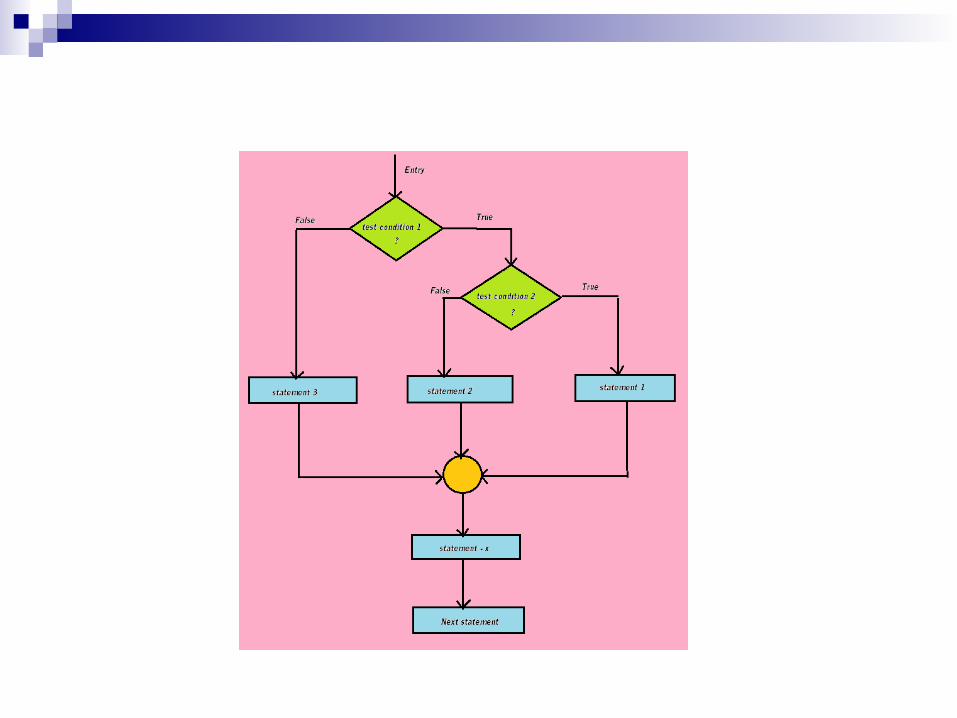
NESTED IFS
One of the alternatives within an IF–THEN–ELSE statementmay involve further IF–THEN–ELSE
statement
Repetition StructureRepetition (Iteration) Structure
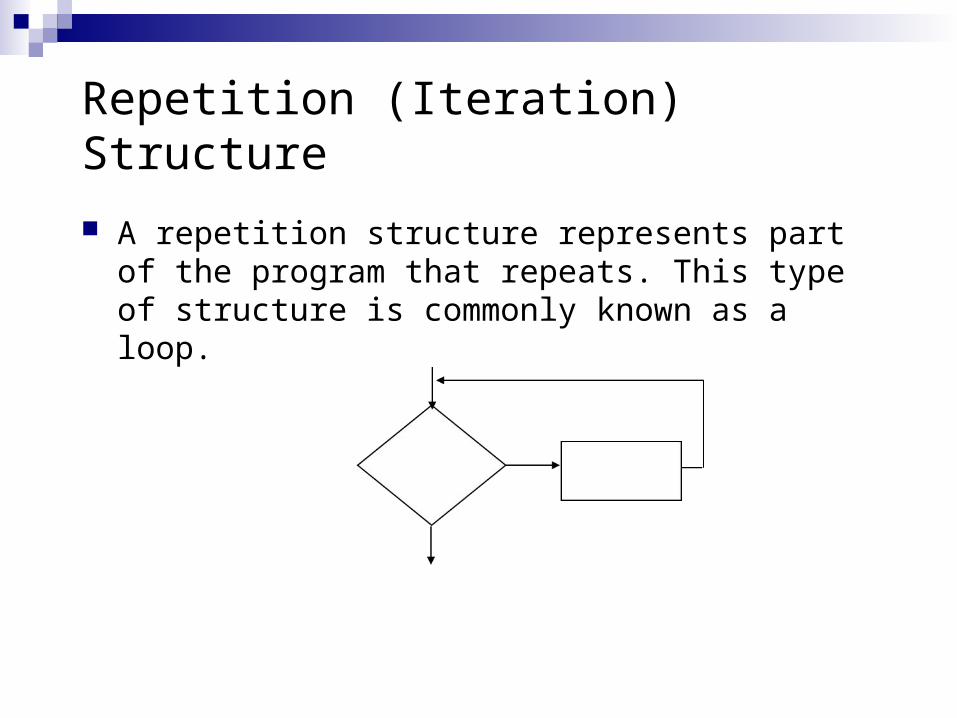
A repetition structure represents part of the program that repeats. This type of structure is commonly known as a loop.
Repetition Structure
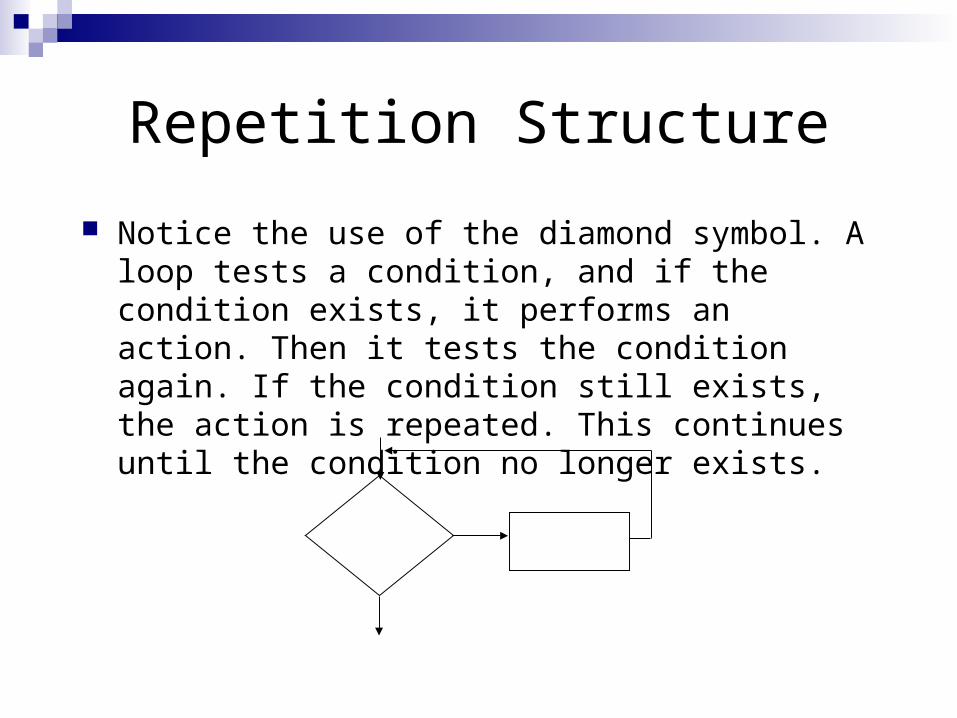
Notice the use of the diamond symbol. A loop tests a condition, and if the condition exists, it performs an action. Then it tests the condition again. If the condition still exists, the action is repeated. This continues until the condition no longer exists.
Repetition Structure
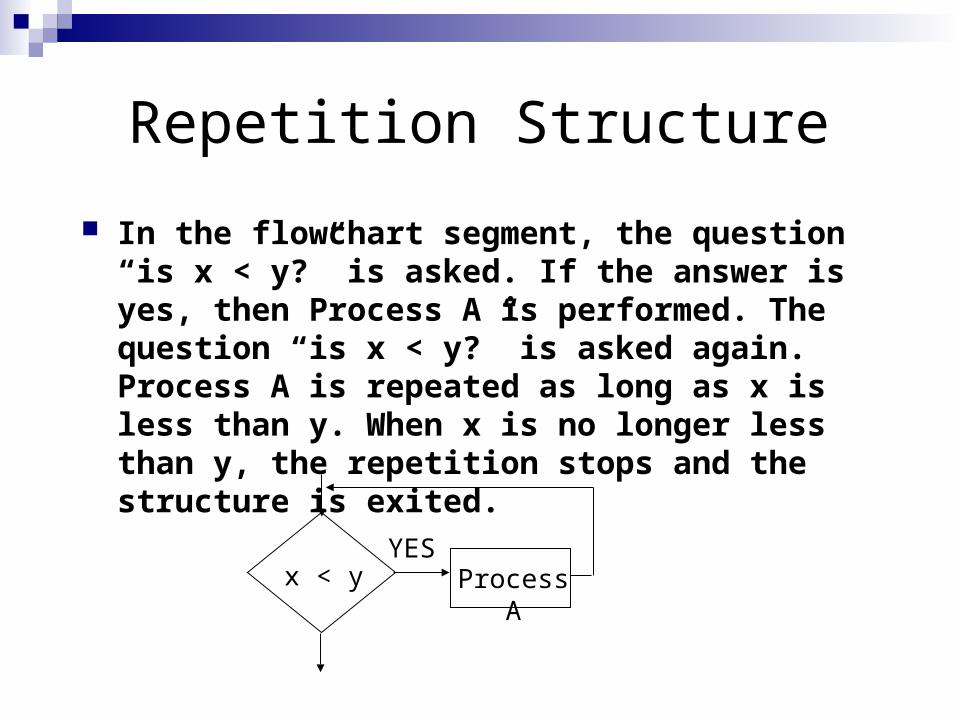
In the flowchart segment, the question “is x < y?” is asked. If the answer is yes, then Process A is performed. The question “is x < y?” is asked again. Process A is repeated as long as x is less than y. When x is no longer less than y, the repetition stops and the structure is exited.
x < y Process A
YES
x < y Add 1 to x
YES
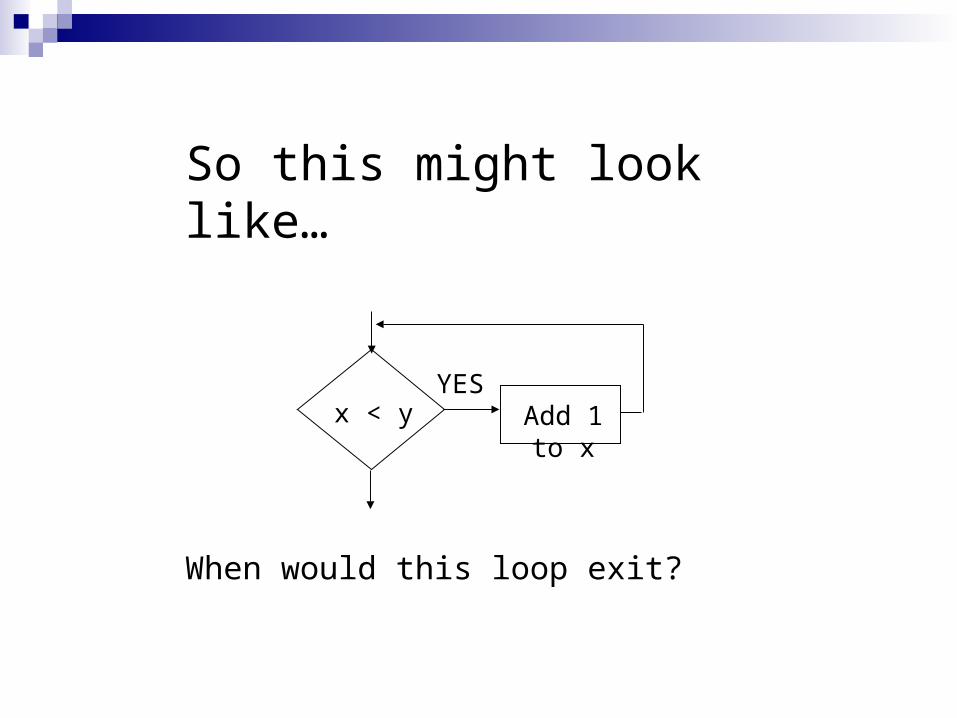
So this might look like…
When would this loop exit?
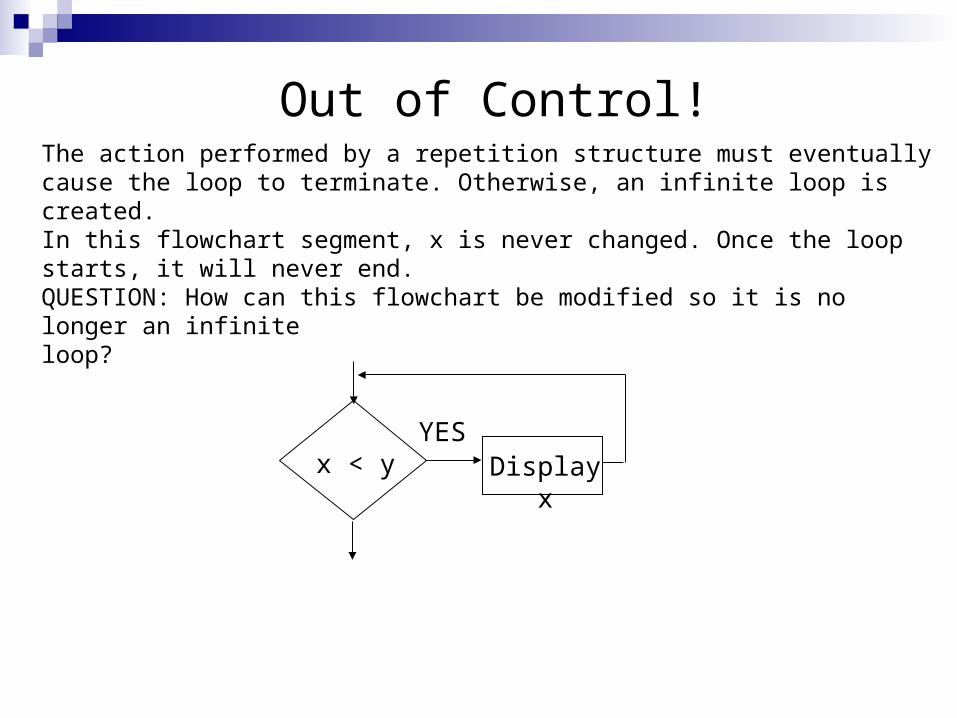
The action performed by a repetition structure must eventually cause the loop to terminate. Otherwise, an infinite loop is created.In this flowchart segment, x is never changed. Once the loop starts, it will never end.QUESTION: How can this flowchart be modified so it is no longer an infiniteloop?
Out of Control!
x < y Display x
YES
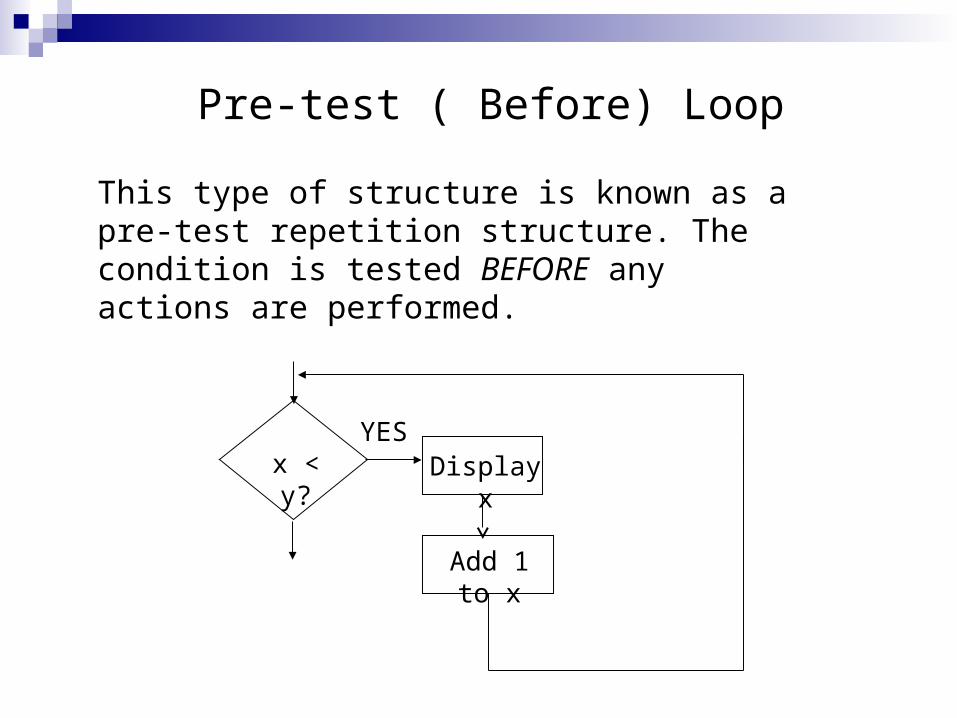
This type of structure is known as a pre-test repetition structure. The condition is tested BEFORE any actions are performed.
Pre-test ( Before) Loop
x < y? Display x
Add 1 to x
YES
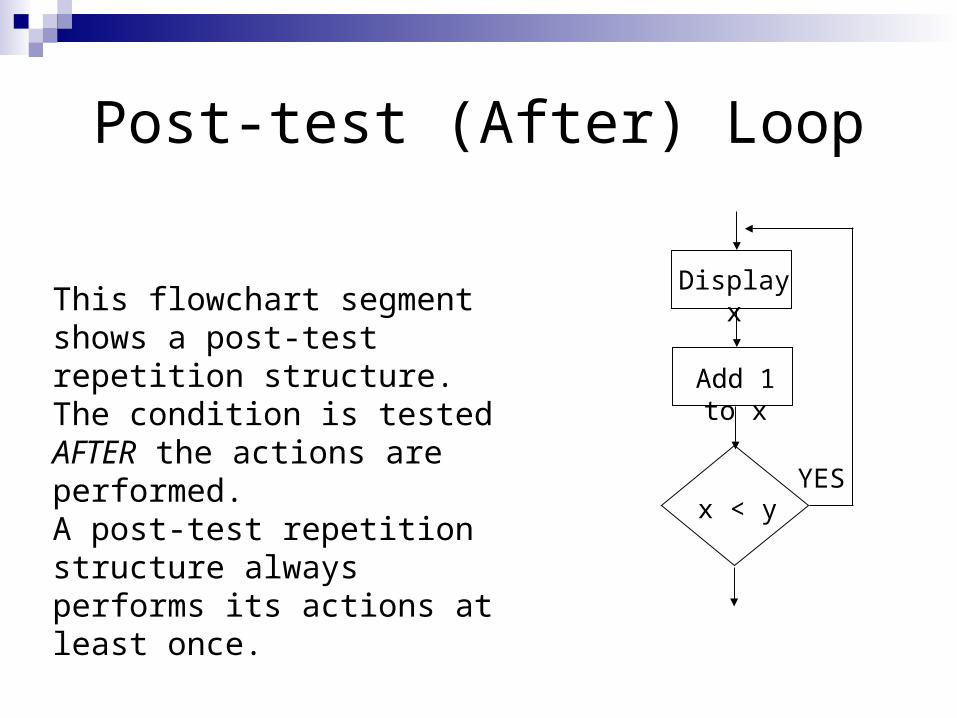
Post-test (After) Loop
This flowchart segment shows a post-test repetition structure.The condition is tested AFTER the actions are performed.A post-test repetition structure always performs its actions at least once.
Display x
Add 1 to x
YESx < y
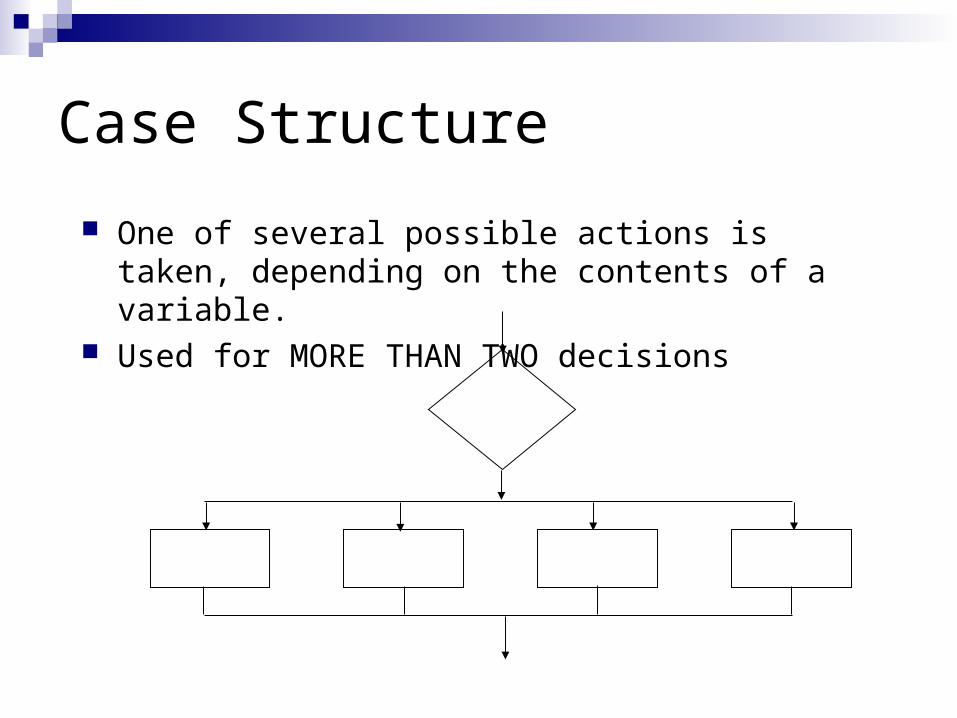
Case Structure
One of several possible actions is taken, depending on the contents of a variable.
Used for MORE THAN TWO decisions
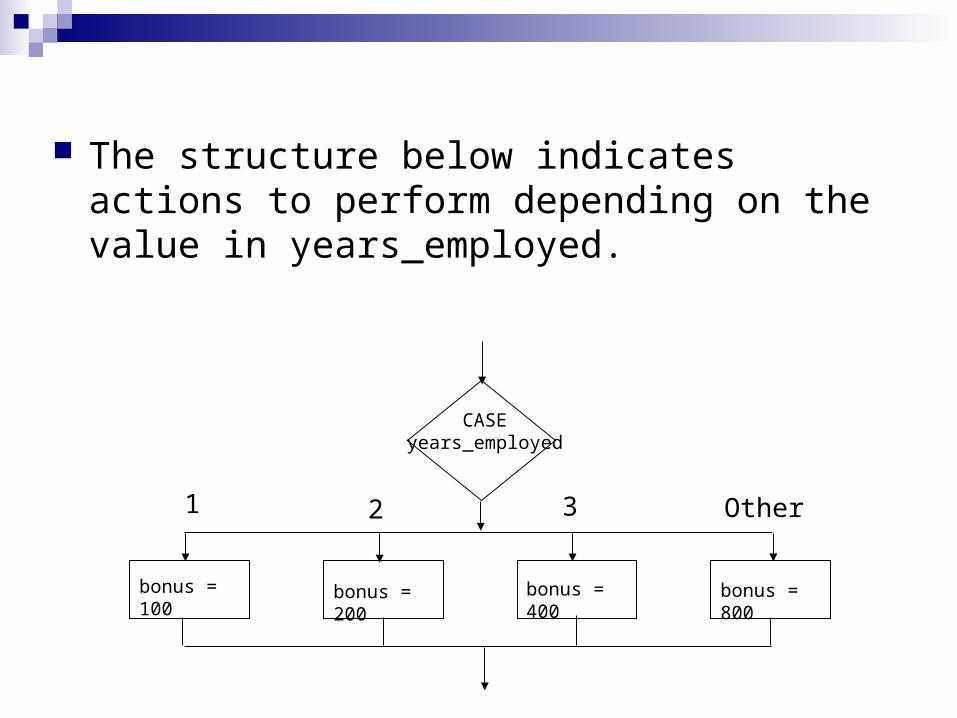
The structure below indicates actions to perform depending on the value in years_employed.
CASEyears_employed
1 2 3 Other
bonus = 100 bonus = 200 bonus = 400 bonus = 800
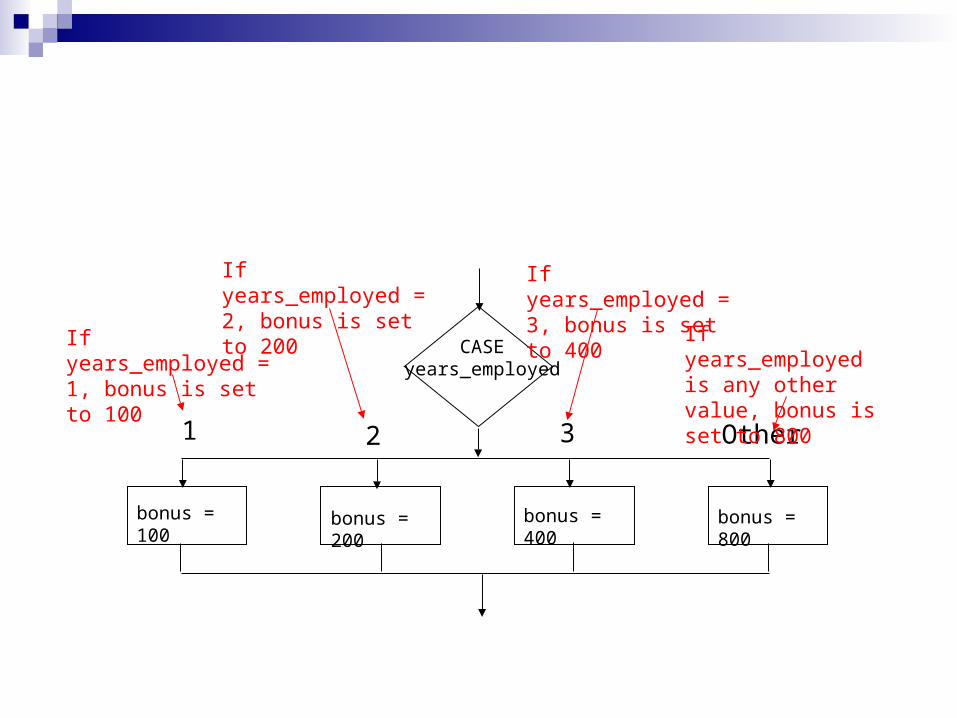
CASEyears_employed
1 2 3 Other
bonus = 100 bonus = 200 bonus = 400 bonus = 800
If years_employed = 1, bonus is set to 100
If years_employed = 2, bonus is set to 200
If years_employed = 3, bonus is set to 400
If years_employed is any other value, bonus is set to 800
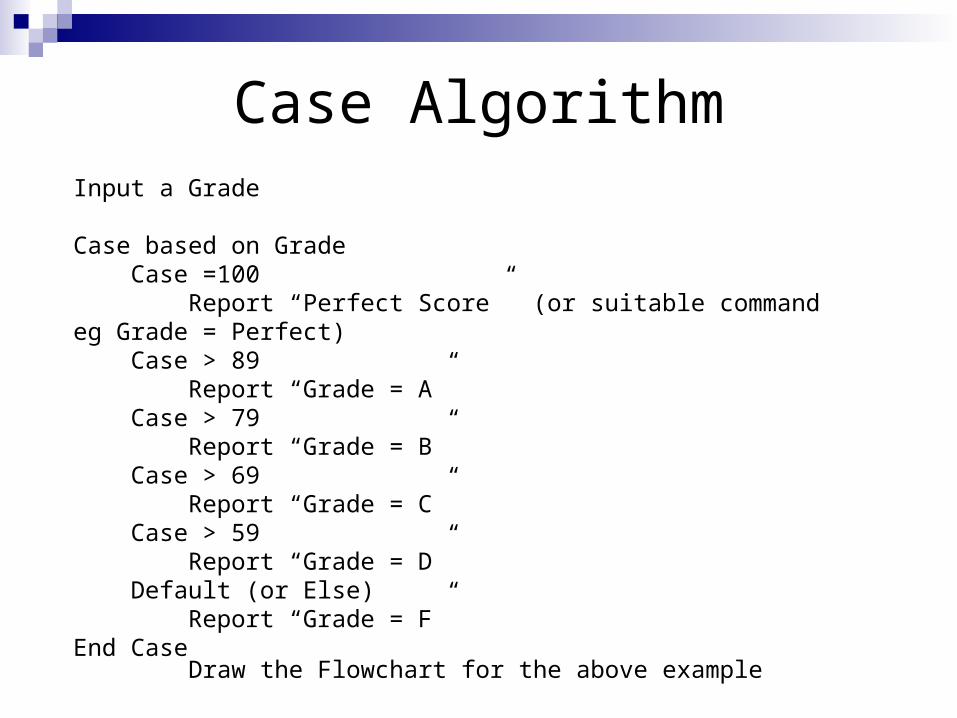
Case AlgorithmInput a Grade
Case based on Grade Case =100 Report “Perfect Score” (or suitable command eg Grade = Perfect) Case > 89 Report “Grade = A” Case > 79 Report “Grade = B” Case > 69 Report “Grade = C” Case > 59 Report “Grade = D” Default (or Else) Report “Grade = F”End Case
Draw the Flowchart for the above example
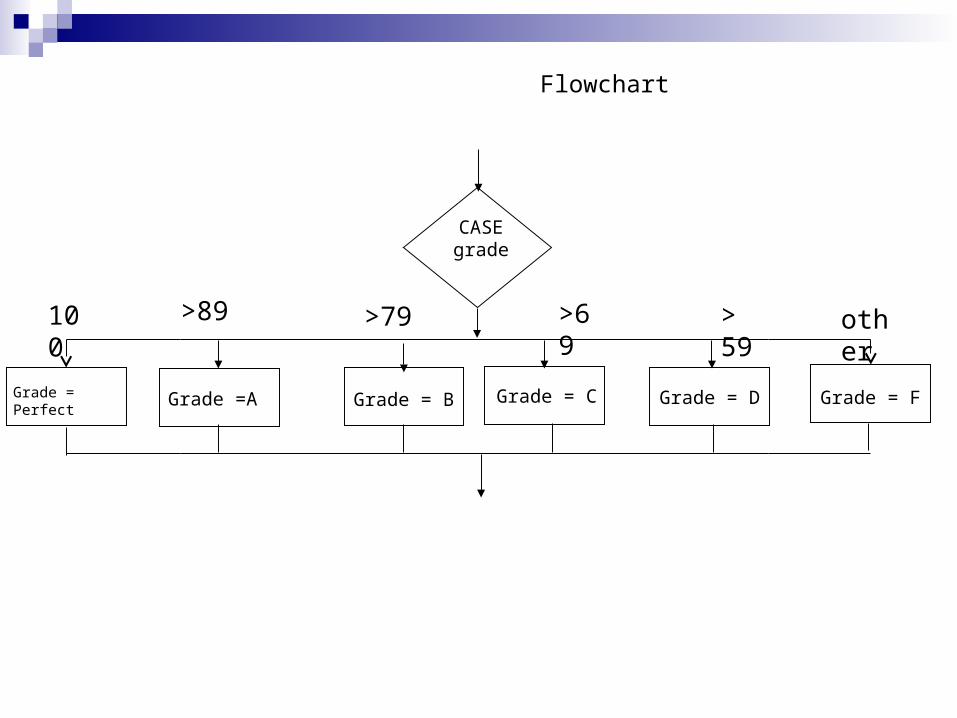
CASEgrade
>89 >79 >69 > 59
Grade =A Grade = B Grade = C Grade = D
Flowchart
Grade = Perfect Grade = F
100 other
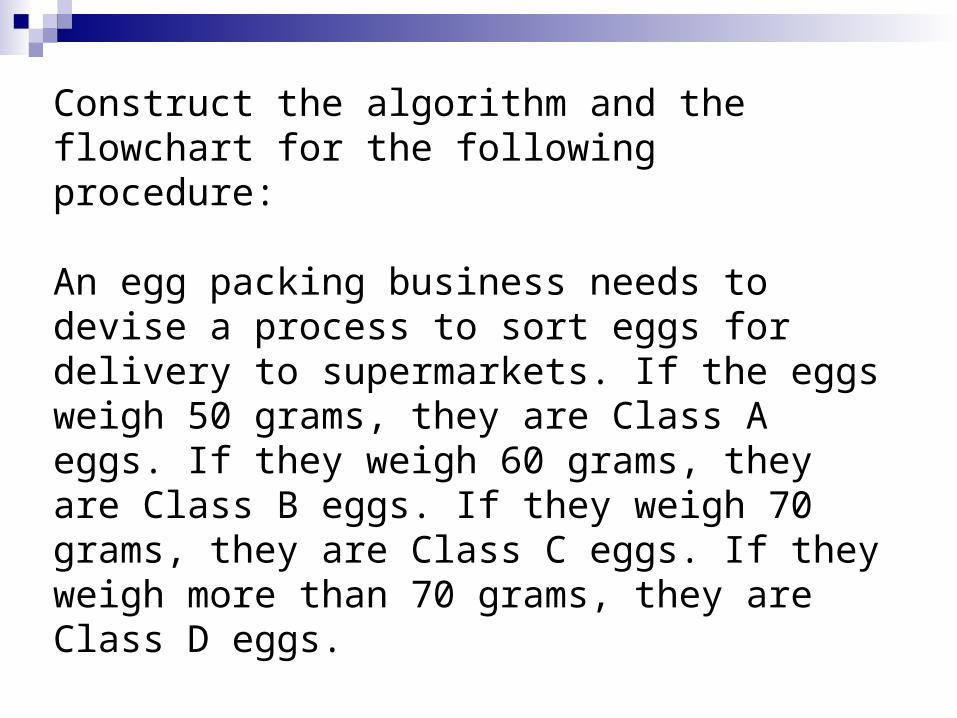
Construct the algorithm and the flowchart for the following procedure:
An egg packing business needs to devise a process to sort eggs for delivery to supermarkets. If the eggs weigh 50 grams, they are Class A eggs. If they weigh 60 grams, they are Class B eggs. If they weigh 70 grams, they are Class C eggs. If they weigh more than 70 grams, they are Class D eggs.
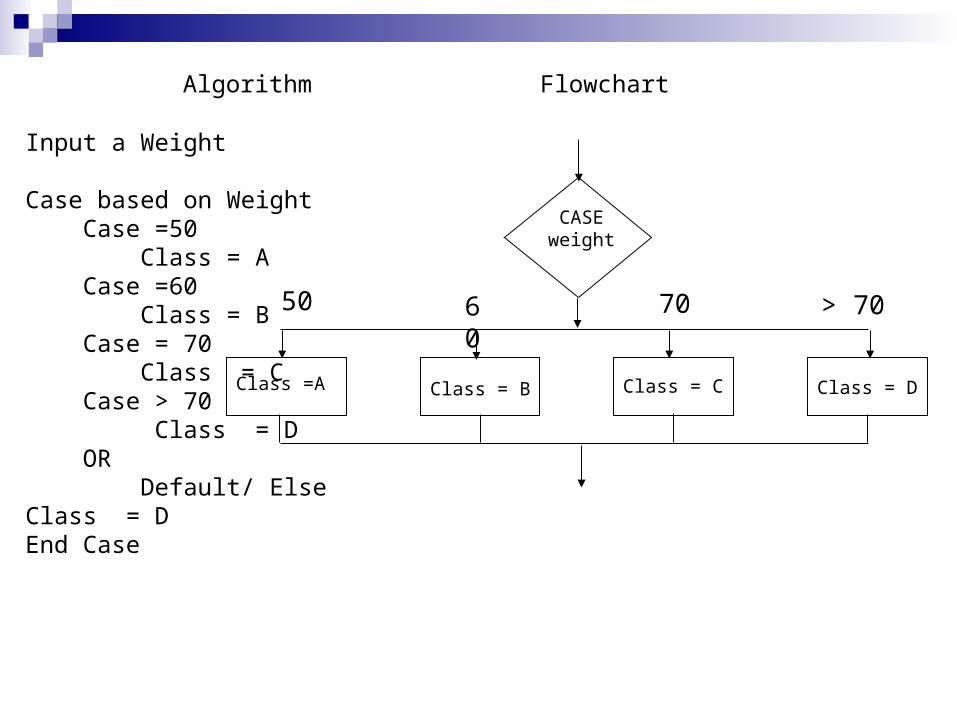
Input a Weight
Case based on Weight Case =50 Class = A Case =60 Class = B Case = 70 Class = C Case > 70 Class = D OR Default/ Else Class = D End Case
Algorithm
CASEweight
50 60 70 > 70
Class =A Class = B Class = C Class = D
Flowchart
Modules (stepwise refinement)A program module is a part of a program that makes sense on its own, just like a paragraph in an essay should make sense on its own. In large programs, such as those used in industry, programs are developed as separate modules and then put together.The process of representing modules in flowcharts is known as stepwise refinement. You will look at this more closely when you start programming.
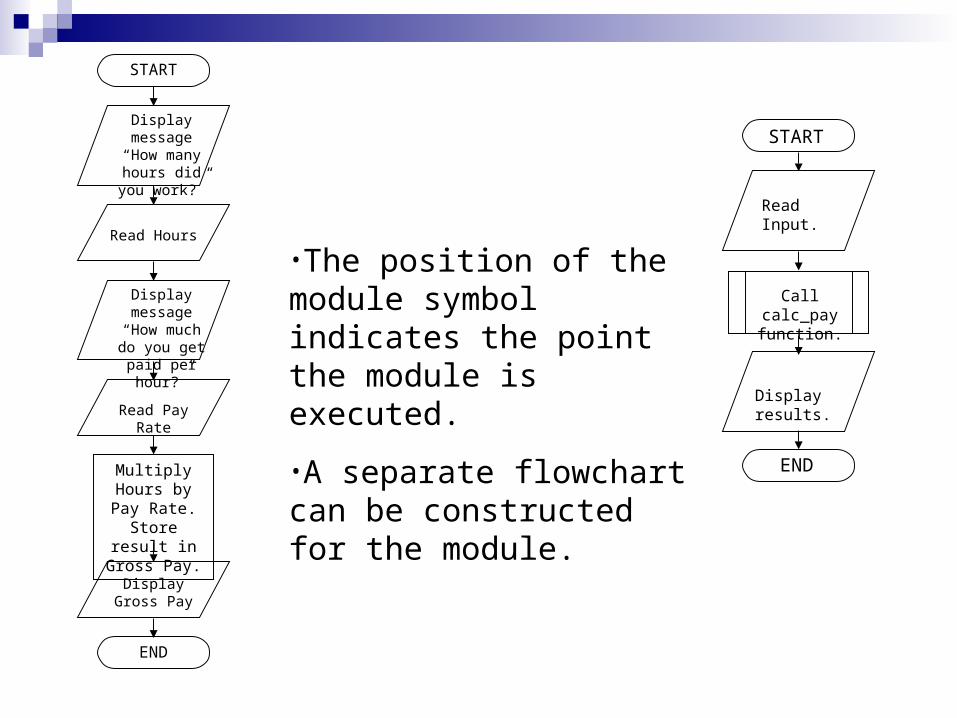
•The position of the module symbol indicates the point the module is executed.
•A separate flowchart can be constructed for the module.
START
END
Read Input.
Call calc_pay function.
Display results.
START
Display message “How many
hours did you work?”
Read Hours
Display message “How much do you get paid per
hour?”
Read Pay Rate
Multiply Hours by Pay Rate.
Store result in Gross Pay.
Display Gross Pay
END
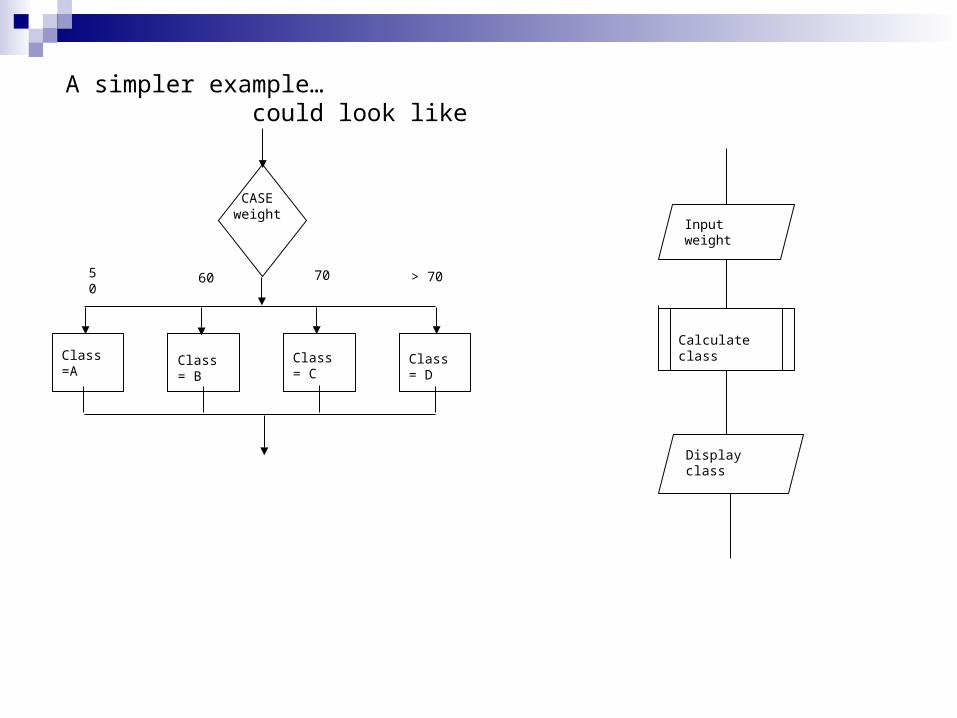
A simpler example… could look like
CASEweight
50 60 70 > 70
Class =A Class = B Class = C Class = D
Input weight
Calculate class
Display class
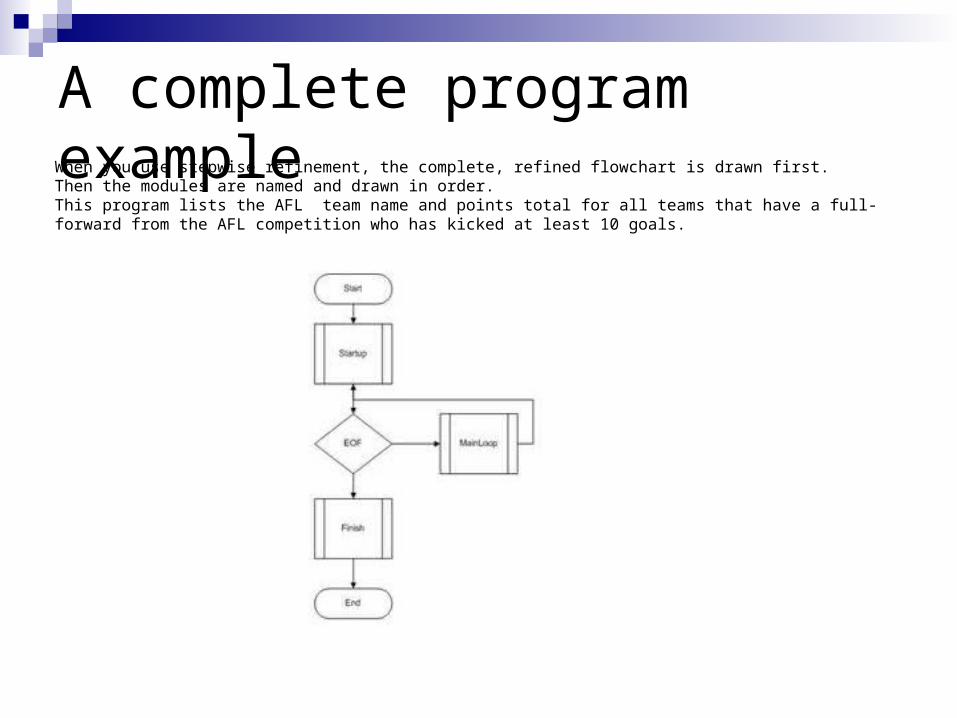
A complete program example When you use stepwise refinement, the complete, refined flowchart is drawn first. Then the modules are named and drawn in order.This program lists the AFL team name and points total for all teams that have a full-forward from the AFL competition who has kicked at least 10 goals.
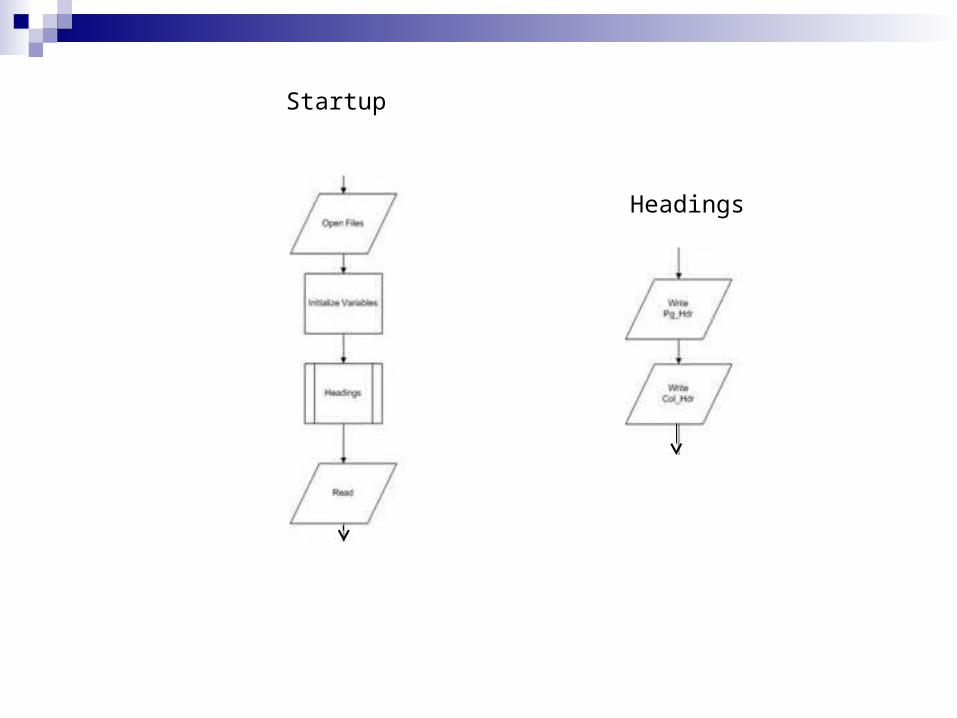
Startup
Headings
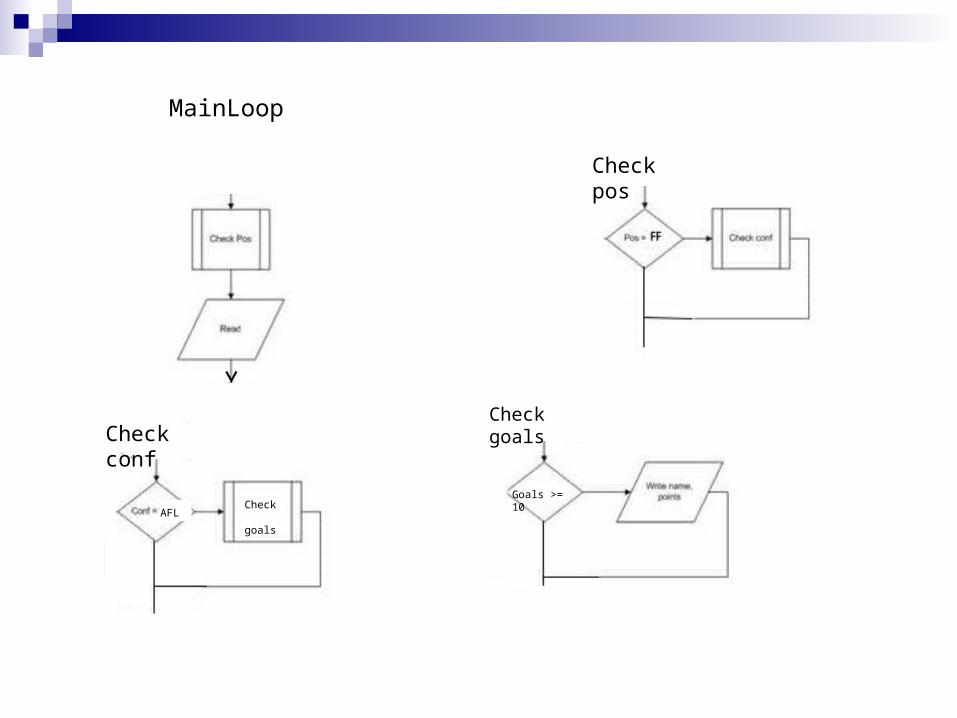
MainLoop
AFL
Goals >= 10Check goals
Check pos
Check goalsCheck conf
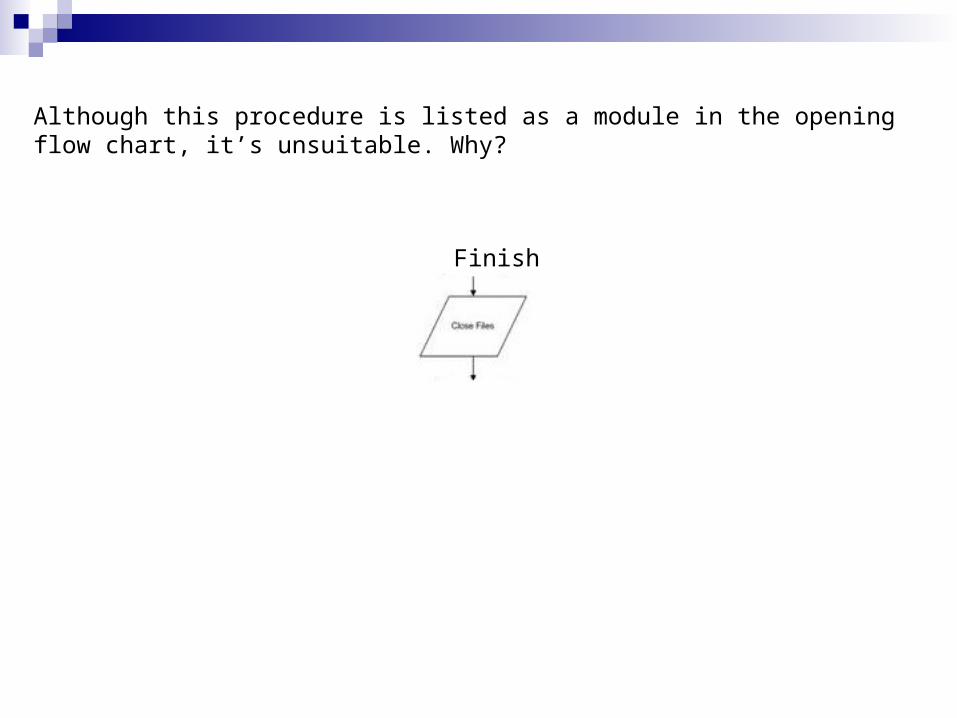
Finish
Although this procedure is listed as a module in the opening flow chart, it’s unsuitable. Why?