Embed Size (px)
Citation preview
1
Research Institute of Petroleum Exploration & Development, CNPC
March, 2016
Progress and Achievements of Shale Gas Development in CNPC
Ailin Jia
2
In recent 5 years, shale gas exploration and development inChina has make great progress, especially in reservoir evaluation,productivity estimation and stimulation technologies. Both provedreserves and production rate has been growing rapidly, makinglarger-scale development possible.
CNPC has actively promoted the commercial developmentfor shale gas. The breakthrough of Well (Wei201) in 2010initiated shale gas exploration and development in China. In early2012, we began pilot study in Changning-Weiyuan and Zhaotongplays. After years of field experiment and practice, CNPC hasinnovated technique series for the development of shale gasreservoirs buried less than 3,500m.
Introduction
3
Outlines
1. Current state of shale gas development
in CNPC
2. Shale gas development technologies
3. Suggestions
4
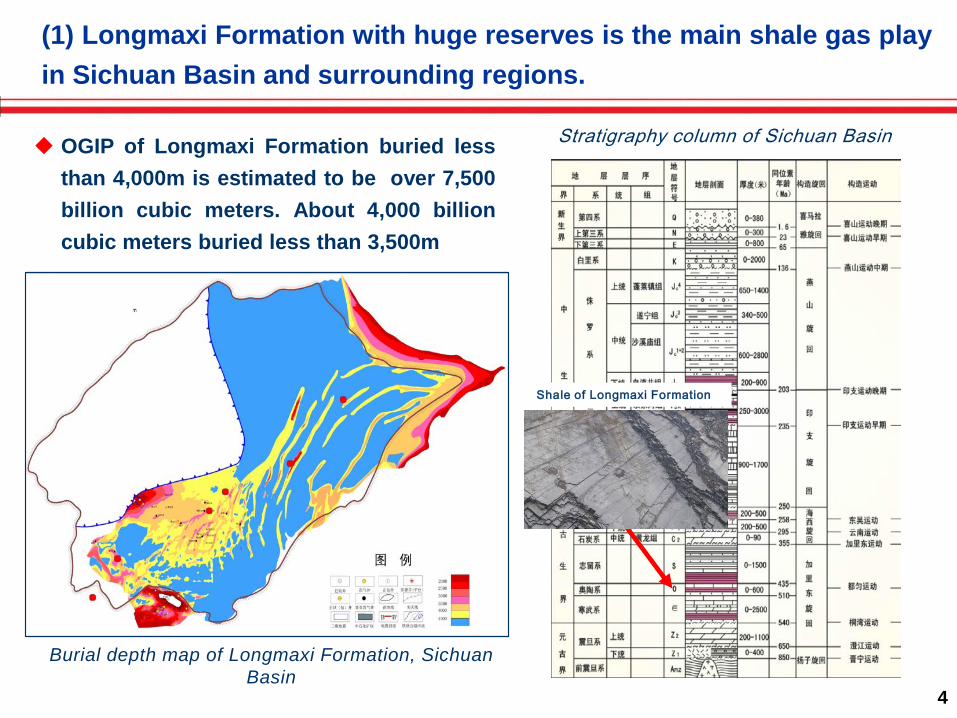
Shale of Longmaxi Formation
Burial depth map of Longmaxi Formation, Sichuan Basin
OGIP of Longmaxi Formation buried lessthan 4,000m is estimated to be over 7,500billion cubic meters. About 4,000 billioncubic meters buried less than 3,500m
Stratigraphy column of Sichuan Basin
(1) Longmaxi Formation with huge reserves is the main shale gas playin Sichuan Basin and surrounding regions.
5
Weiyuan
Fushun-Yongchuan
Changning
Zhaotong
Favorable blocks of Longmaxi shale gas, Southern Sichuan Basin
Developing blocks of Longmaxi shale gas, Southern Sichuan Basin
4 favorable blocks: Changning, Weiyuan, Fushun-Yongchuan, Zhaotong,
with areas of 10,000 km2 and OGIP of 4,500 billion cubic meters.
3 developing blocks: part of Changning, Weiyuan, Zhaotong, with areas of
2,400 km2 and OGIP of 1,200 billion cubic meters.
(2) CNPC: Current favorable blocks
Weiyuan
Changning
Zhaotong
W204W202
N201YS108
6
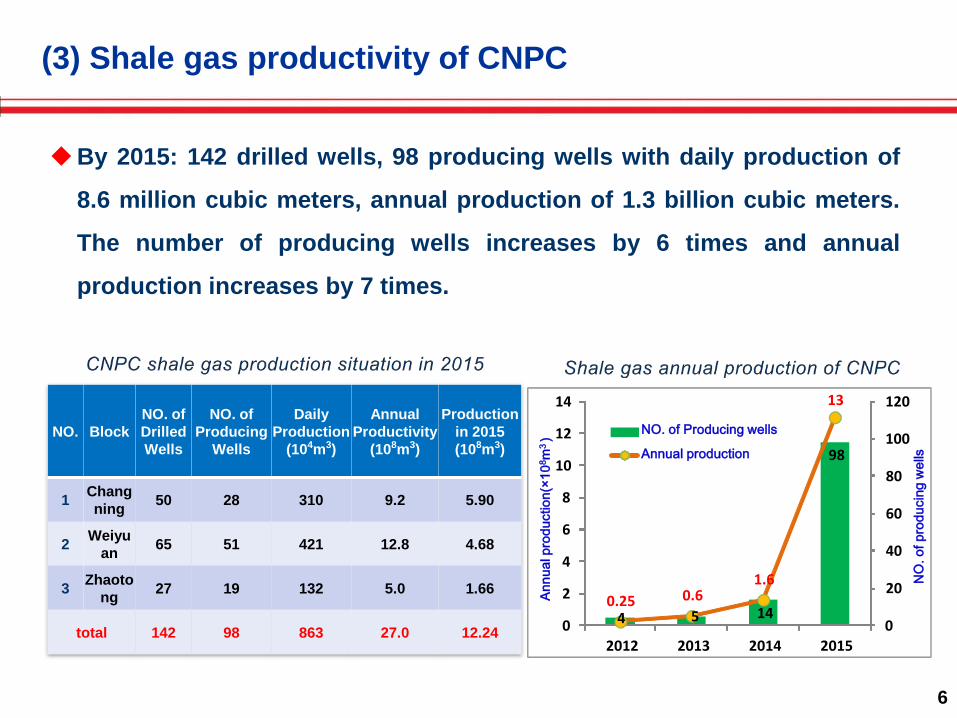
NO. BlockNO. of DrilledWells
NO. of Producing
Wells
DailyProduction
(104m3)
Annual Productivity
(108m3)
Productionin 2015(108m3)
1 Changning 50 28 310 9.2 5.90
2 Weiyuan 65 51 421 12.8 4.68
3 Zhaotong 27 19 132 5.0 1.66
total 142 98 863 27.0 12.24
By 2015: 142 drilled wells, 98 producing wells with daily production of
8.6 million cubic meters, annual production of 1.3 billion cubic meters.
The number of producing wells increases by 6 times and annual
production increases by 7 times.
(3) Shale gas productivity of CNPC
4 5 14
98
0.25 0.61.6
13
0
20
40
60
80
100
120
0
2
4
6
8
10
12
14
2012 2013 2014 2015
Annu
al p
rodu
ctio
n(×1
08m
3 ) NO. of Producing wells
Annual production
NO
. of p
rodu
cing
wel
ls
7
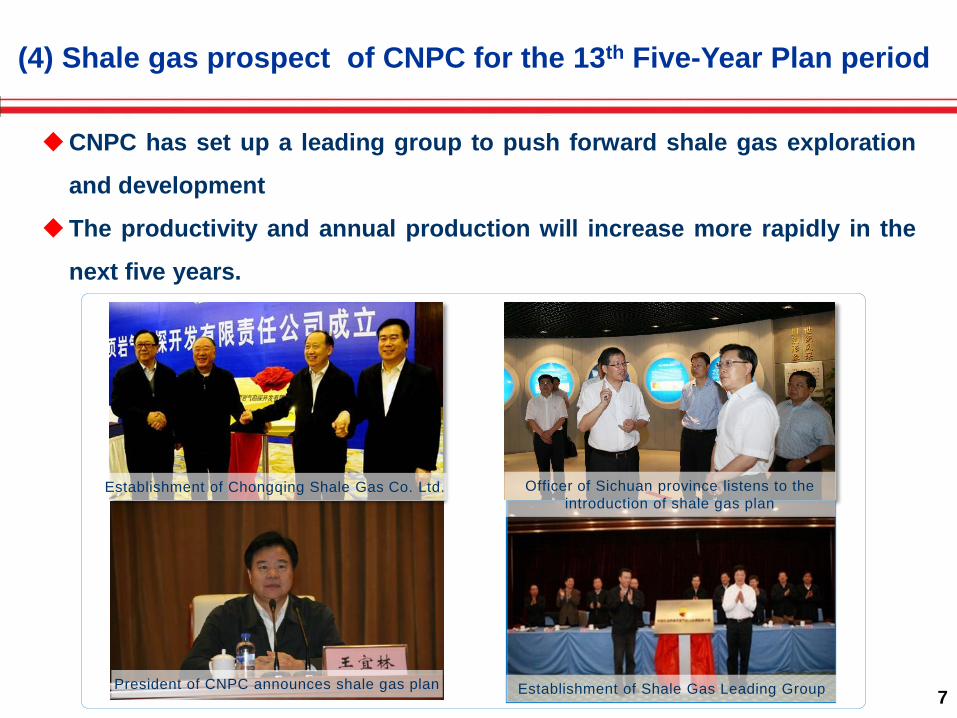
CNPC has set up a leading group to push forward shale gas exploration
and development
The productivity and annual production will increase more rapidly in the
next five years.
President of CNPC announces shale gas plan Establishment of Shale Gas Leading Group
Establishment of Chongqing Shale Gas Co. Ltd. Officer of Sichuan province listens to the introduction of shale gas plan
(4) Shale gas prospect of CNPC for the 13th Five-Year Plan period
8
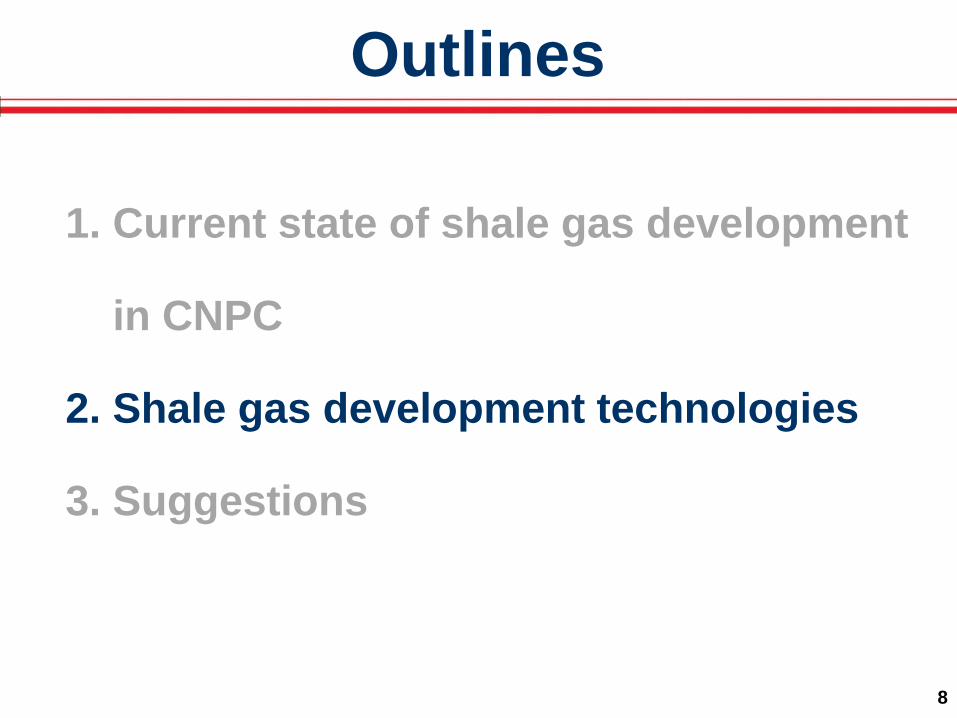
Outlines
1. Current state of shale gas development
in CNPC
2. Shale gas development technologies
3. Suggestions
9
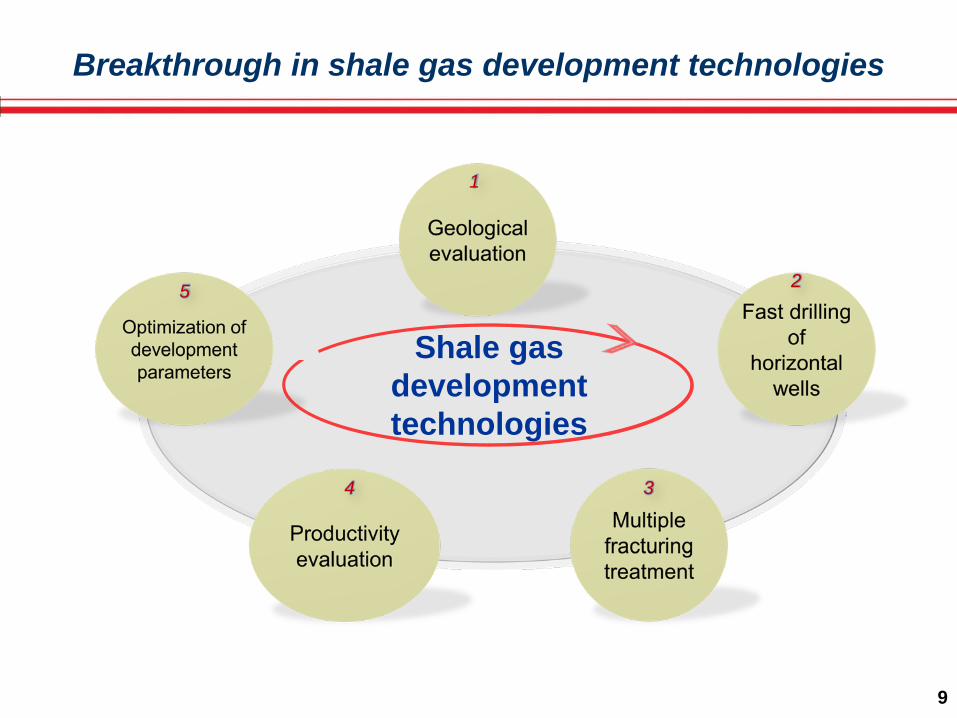
Breakthrough in shale gas development technologies
1
5 2
34
Shale gas development technologies
10
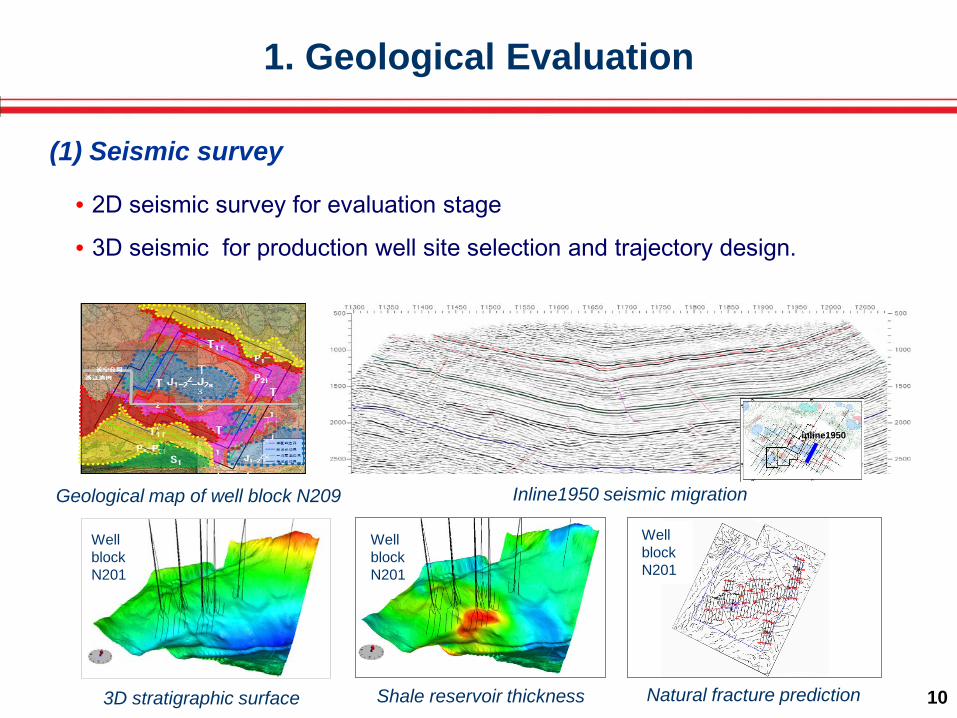
inline1950
Geological map of well block N209 Inline1950 seismic migration
3D stratigraphic surface Shale reservoir thickness Natural fracture prediction
1. Geological Evaluation
(1) Seismic survey
Well block N201
Well block N201
Well block N201
• 2D seismic survey for evaluation stage
• 3D seismic for production well site selection and trajectory design.
11
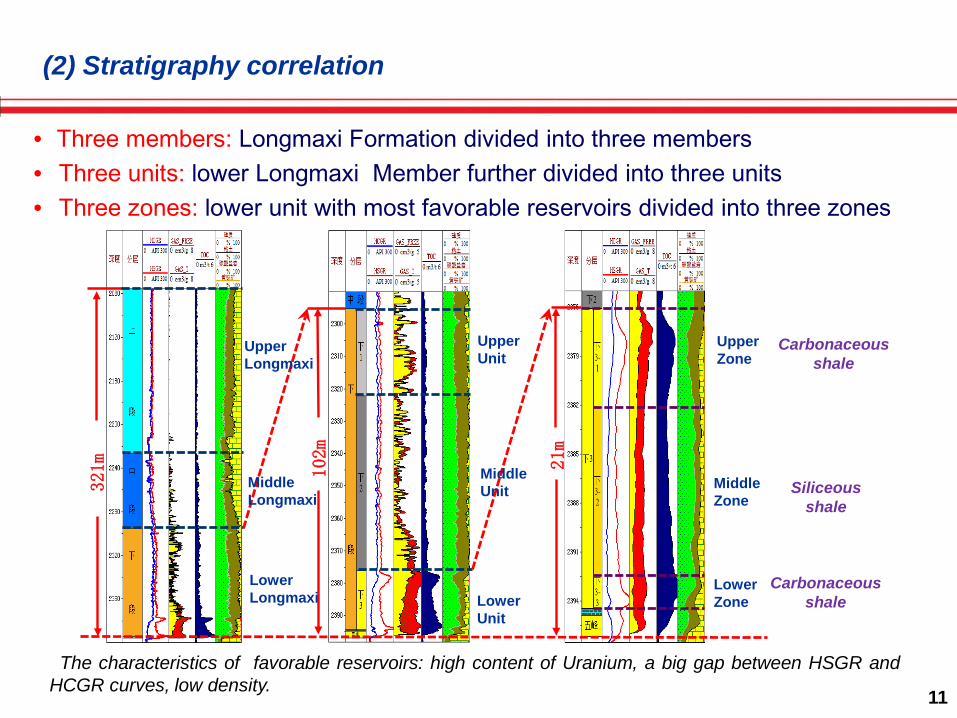
321m
Carbonaceousshale
102m
21m
UpperLongmaxi
MiddleLongmaxi
LowerLongmaxi
UpperUnit
MiddleUnit
LowerUnit
UpperZone
MiddleZone
LowerZone
Siliceousshale
Carbonaceousshale
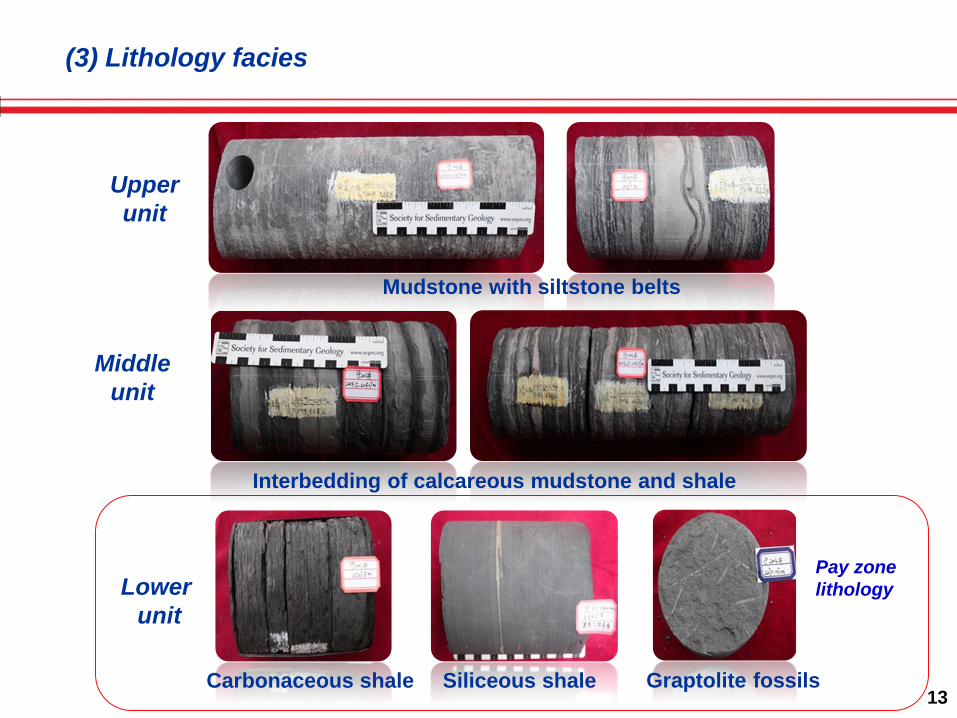
The characteristics of favorable reservoirs: high content of Uranium, a big gap between HSGR andHCGR curves, low density.
• Three members: Longmaxi Formation divided into three members• Three units: lower Longmaxi Member further divided into three units• Three zones: lower unit with most favorable reservoirs divided into three zones
(2) Stratigraphy correlation
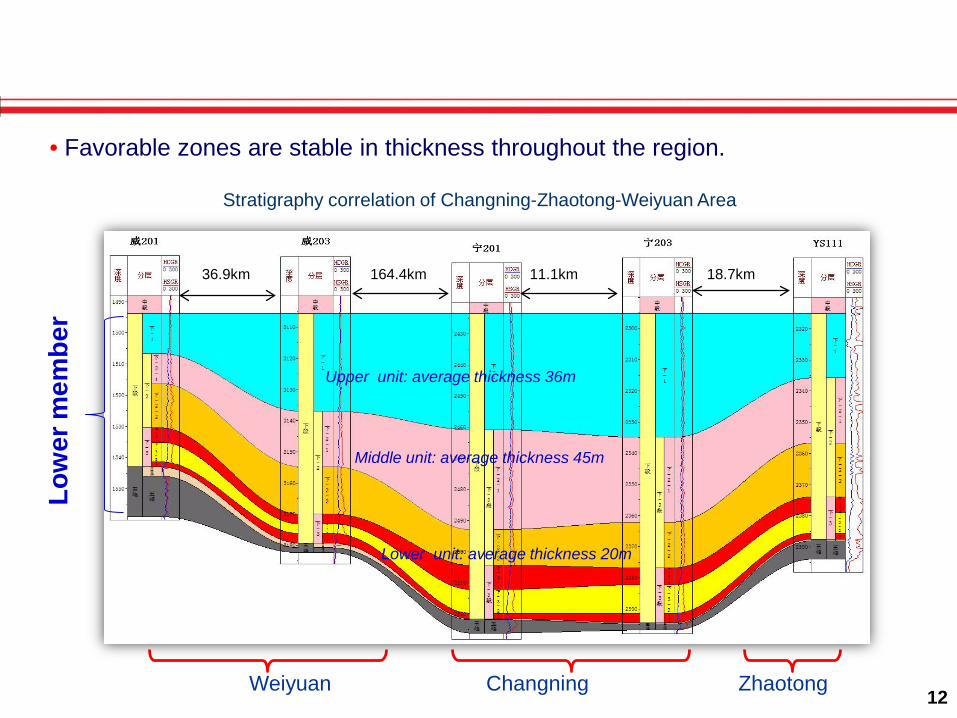
12
Stratigraphy correlation of Changning-Zhaotong-Weiyuan Area
• Favorable zones are stable in thickness throughout the region.
Weiyuan Changning Zhaotong
Upper unit: average thickness 36m
Middle unit: average thickness 45m
Lower unit: average thickness 20m
36.9km 164.4km 11.1km 18.7km
Low
er m
embe
r
13
Mudstone with siltstone belts
Siliceous shale
Upper unit
Interbedding of calcareous mudstone and shale
Lower unit
Middleunit
Carbonaceous shale Graptolite fossils
(3) Lithology facies
Pay zone lithology
14
UpperLongmaxi
Middle Longmaxi
Favorable reservoirs
11.7km 7.7km16.1km
Lower Longmaxi
21.3m 19.7m 20.6m21.8m 20.8m
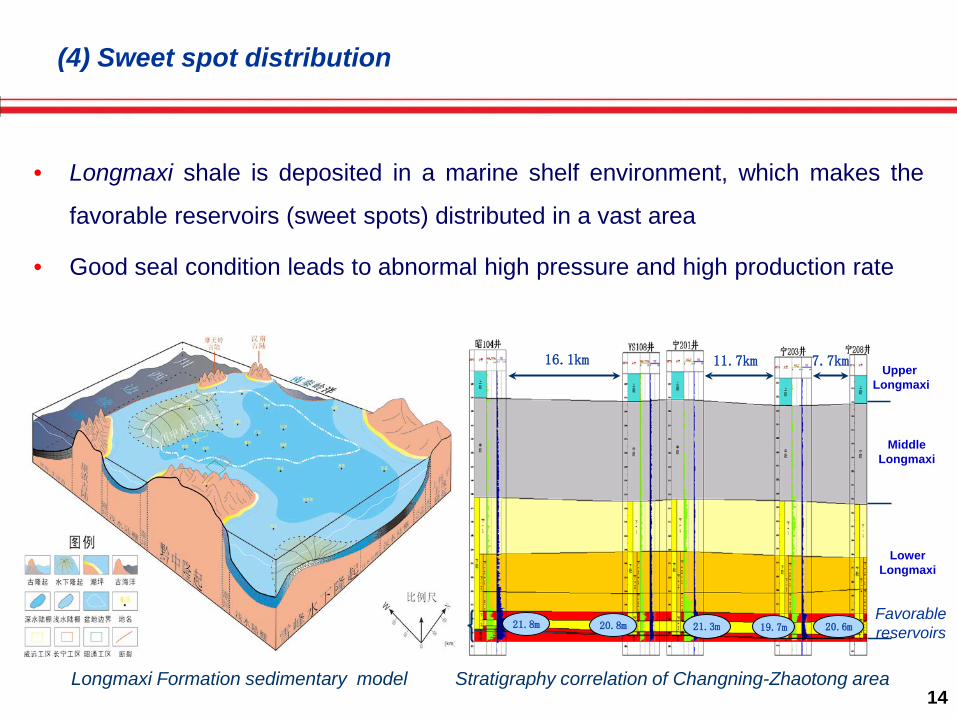
(4) Sweet spot distribution
• Longmaxi shale is deposited in a marine shelf environment, which makes the
favorable reservoirs (sweet spots) distributed in a vast area
• Good seal condition leads to abnormal high pressure and high production rate
Stratigraphy correlation of Changning-Zhaotong areaLongmaxi Formation sedimentary model
15
Sweet spots prediction based on 3D seismic interpretation
Criterion for geological sweet spots
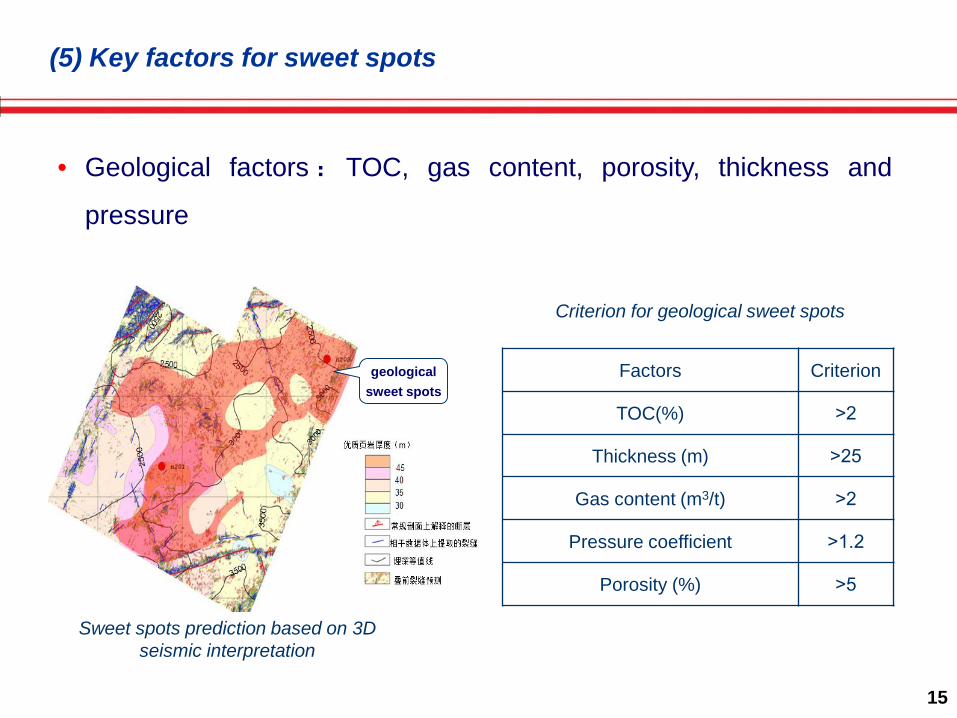
(5) Key factors for sweet spots
• Geological factors: TOC, gas content, porosity, thickness and
pressure
Factors Criterion
TOC(%) >2
Thickness (m) >25
Gas content (m3/t) >2
Pressure coefficient >1.2
Porosity (%) >5
geological sweet spots
16
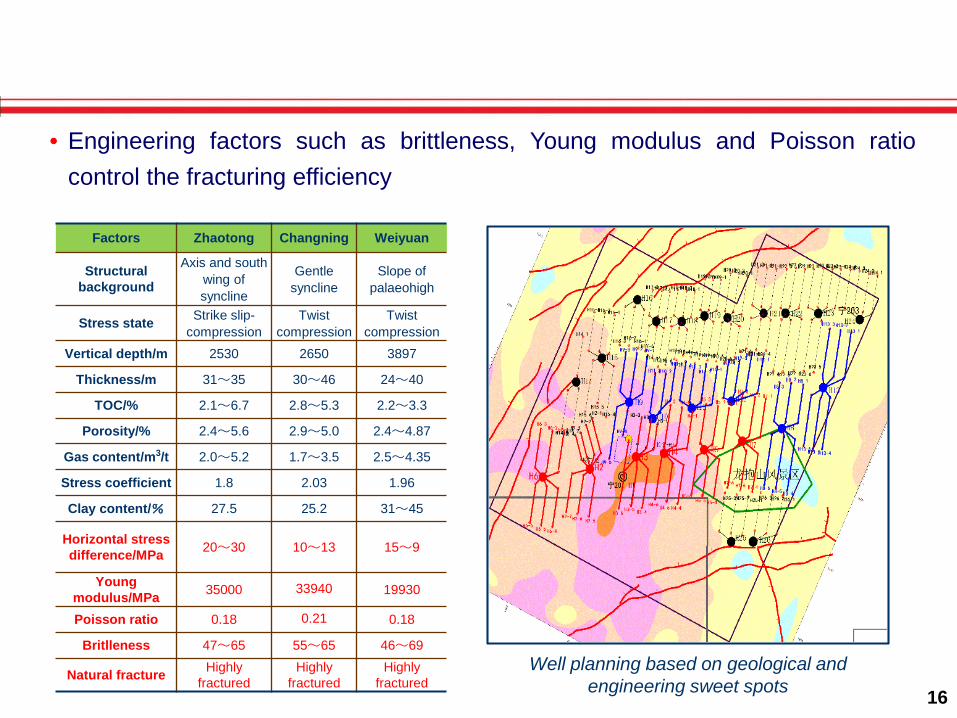
Factors Zhaotong Changning Weiyuan
Structuralbackground
Axis and south wing of syncline
Gentle syncline
Slope of palaeohigh
Stress state Strike slip-compression
Twist compression
Twist compression
Vertical depth/m 2530 2650 3897
Thickness/m 31~35 30~46 24~40
TOC/% 2.1~6.7 2.8~5.3 2.2~3.3
Porosity/% 2.4~5.6 2.9~5.0 2.4~4.87
Gas content/m3/t 2.0~5.2 1.7~3.5 2.5~4.35
Stress coefficient 1.8 2.03 1.96
Clay content/% 27.5 25.2 31~45
Horizontal stress difference/MPa 20~30 10~13 15~9
Young modulus/MPa 35000 33940 19930
Poisson ratio 0.18 0.21 0.18
Britlleness 47~65 55~65 46~69
Natural fracture Highly fractured
Highly fractured
Highly fractured
Well planning based on geological and engineering sweet spots
• Engineering factors such as brittleness, Young modulus and Poisson ratiocontrol the fracturing efficiency
17
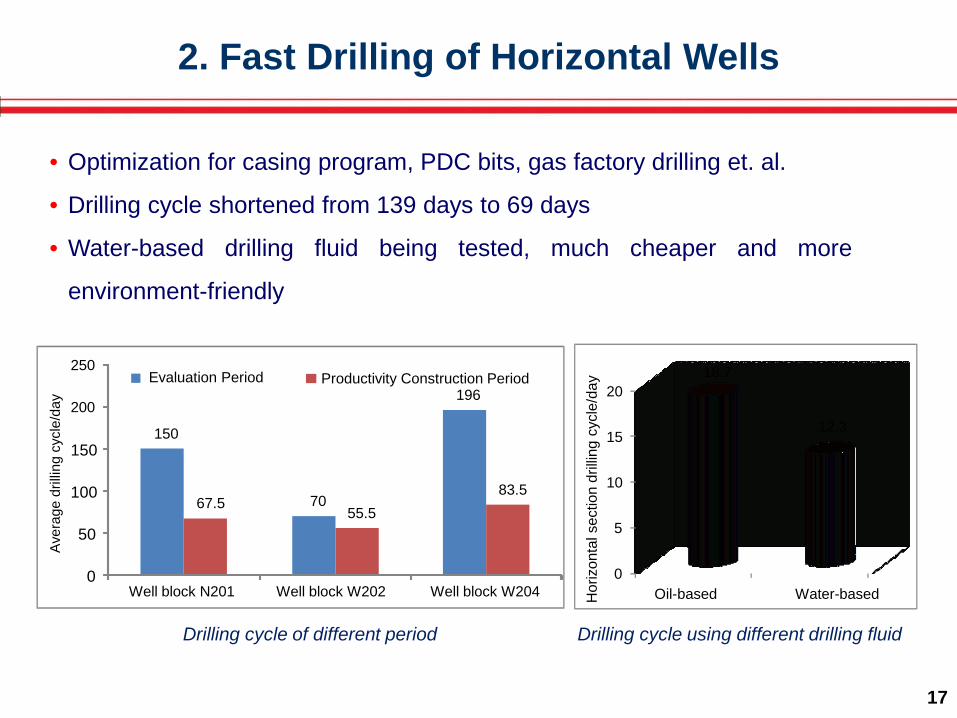
• Optimization for casing program, PDC bits, gas factory drilling et. al.
• Drilling cycle shortened from 139 days to 69 days
• Water-based drilling fluid being tested, much cheaper and more
environment-friendly
Drilling cycle of different period Drilling cycle using different drilling fluid
2. Fast Drilling of Horizontal Wells
150
70
196
67.5 55.583.5
0
50
100
150
200
250
Well block N201
Aver
age
drilli
ngcy
cle/
day
Evaluation Period Productivity Construction Period
Well block W202 Well block W2040
5
10
15
20
Oil-based Water-based
18.7
12.3
Hor
izon
tal s
ectio
n dr
illing
cyc
le/d
ay
18
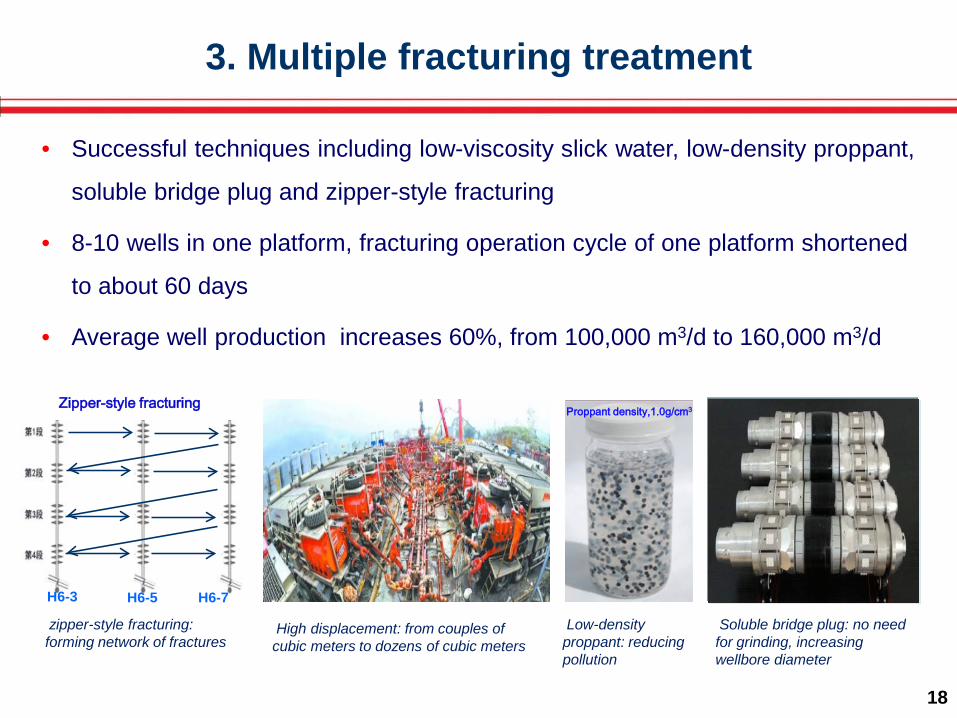
Proppant density,1.0g/cm3
H6-3 H6-5 H6-7
Zipper-style fracturing
zipper-style fracturing: forming network of fractures
3. Multiple fracturing treatment
• Successful techniques including low-viscosity slick water, low-density proppant,
soluble bridge plug and zipper-style fracturing
• 8-10 wells in one platform, fracturing operation cycle of one platform shortened
to about 60 days
• Average well production increases 60%, from 100,000 m3/d to 160,000 m3/d
High displacement: from couples of cubic meters to dozens of cubic meters
Low-density proppant: reducing pollution
Soluble bridge plug: no need for grinding, increasing wellbore diameter
19
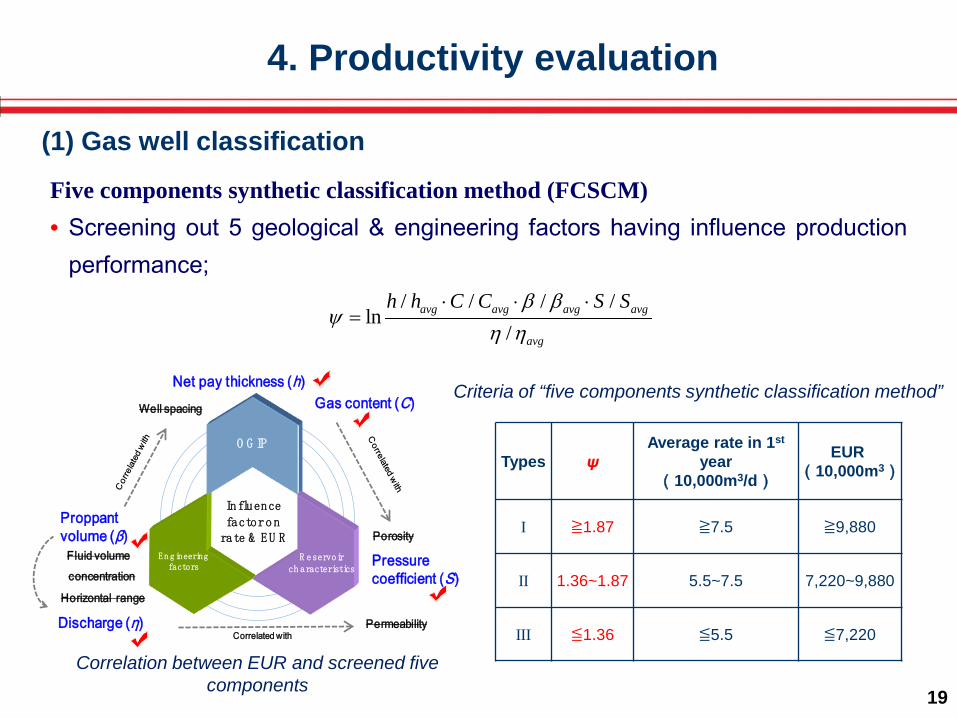
(1) Gas well classification
Correlation between EUR and screened five components
Types ψAverage rate in 1st
year(10,000m3/d)
EUR(10,000m3)
I ≧1.87 ≧7.5 ≧9,880
II 1.36~1.87 5.5~7.5 7,220~9,880
III ≦1.36 ≦5.5 ≦7,220
Criteria of “five components synthetic classification method”
Five components synthetic classification method (FCSCM)• Screening out 5 geological & engineering factors having influence production
performance;
4. Productivity evaluation
/ / / /ln
/avg avg avg avg
avg
h h C C S Sβ βψ
η η⋅ ⋅ ⋅
=
In fluence factor o n rate & E U R
O G IP
E n g ineering factors
R eservoir ch aracteristics
Permeability
Pressure coefficient (S)
Well spacing
Net pay thickness (h)Gas content (C)
Discharge (η)
Proppantvolume (β)
Horizontal range
Correlated with
PorosityFluid volumeconcentration
20
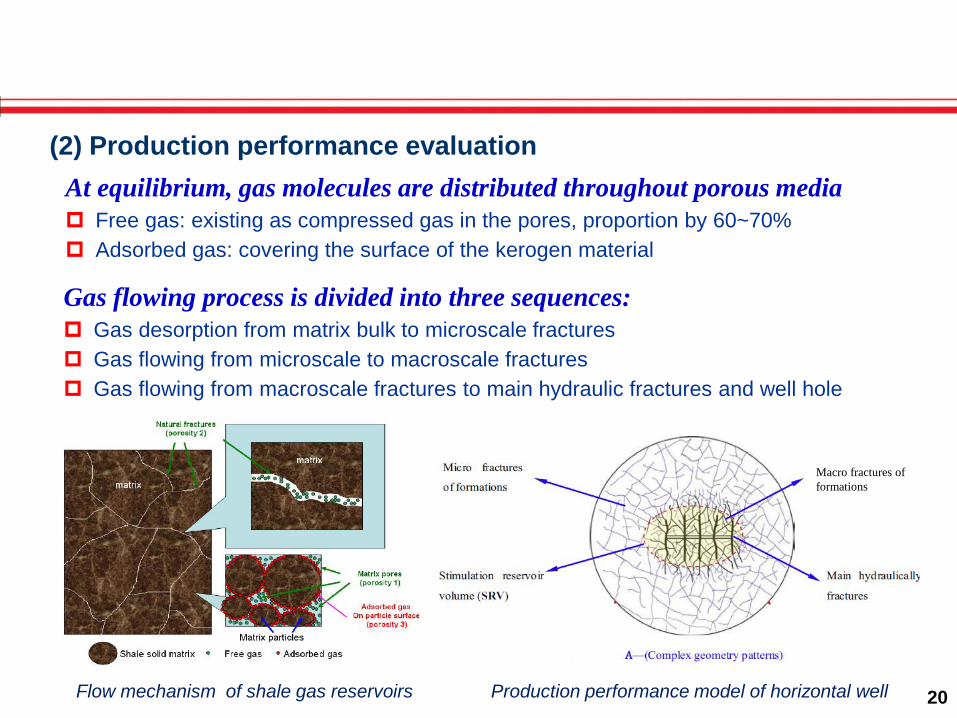
(2) Production performance evaluation
Flow mechanism of shale gas reservoirs
At equilibrium, gas molecules are distributed throughout porous media Free gas: existing as compressed gas in the pores, proportion by 60~70% Adsorbed gas: covering the surface of the kerogen material
Gas flowing process is divided into three sequences: Gas desorption from matrix bulk to microscale fractures Gas flowing from microscale to macroscale fractures Gas flowing from macroscale fractures to main hydraulic fractures and well hole
Macro fractures of formations
Production performance model of horizontal well
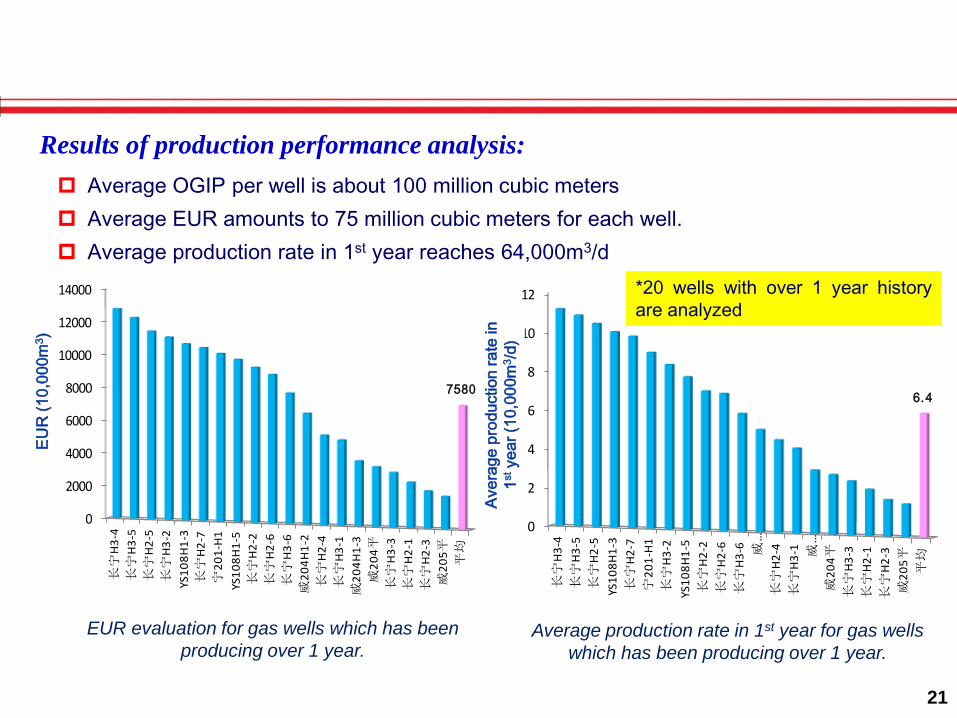
21
Average OGIP per well is about 100 million cubic meters Average EUR amounts to 75 million cubic meters for each well. Average production rate in 1st year reaches 64,000m3/d
EUR evaluation for gas wells which has been producing over 1 year.
0
2000
4000
6000
8000
10000
12000
14000
长宁
H3-
4长宁
H3-
5长宁
H2-
5长宁
H3-
2YS
108H
1-3
长宁
H2-
7宁
201-
H1
YS10
8H1-
5长宁
H2-
2长宁
H2-
6长宁
H3-
6威
204H
1-2
长宁
H2-
4长宁
H3-
1威
204H
1-3
威20
4平长宁
H3-
3长宁
H2-
1长宁
H2-
3威
205平
平均
7580
预测
单井最终累积产量(万方)
EUR
(10,
000m
3 )
0
2
4
6
8
10
12
长宁
H3-
4长
宁H
3-5
长宁
H2-
5YS
108H
1-3
长宁
H2-
7宁
201-
H1
长宁
H3-
2YS
108H
1-5
长宁
H2-
2长
宁H
2-6
长宁
H3 -
6威
…长
宁H
2-4
长宁
H3 -
1威
…威
204平
长宁
H3-
3长
宁H
2-1
长宁
H2-
3威
205平
平均
6.4
第一
年平均产量(万方)
Aver
age
prod
uctio
n ra
te in
1s
t yea
r (10
,000
m3 /d
)
Average production rate in 1st year for gas wells which has been producing over 1 year.
Results of production performance analysis:
*20 wells with over 1 year historyare analyzed
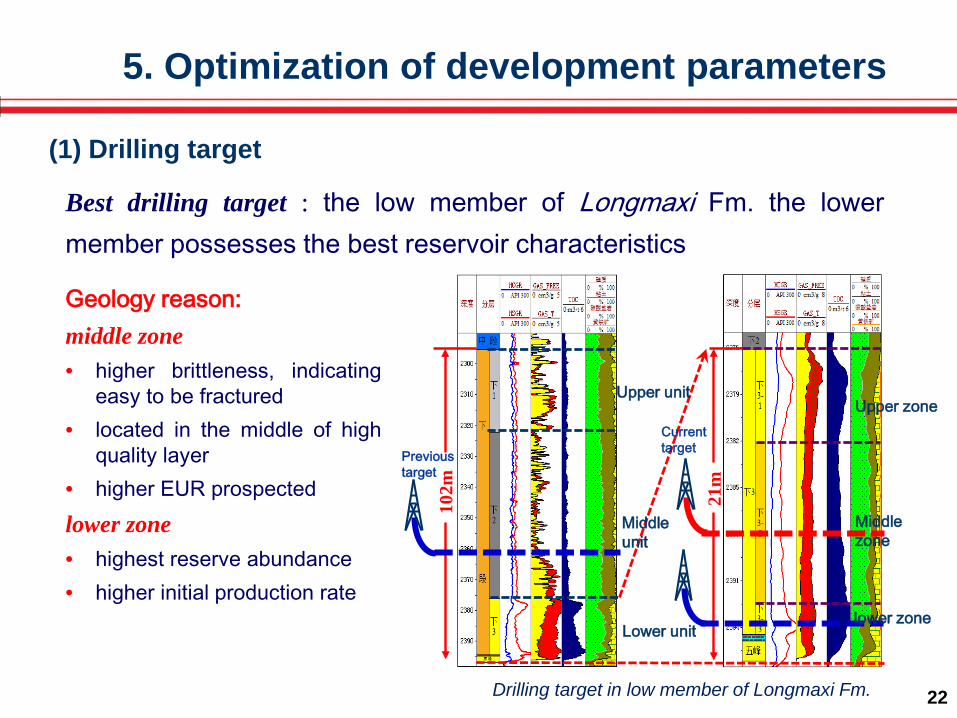
22Drilling target in low member of Longmaxi Fm.
Geology reason:middle zone• higher brittleness, indicating
easy to be fractured• located in the middle of high
quality layer• higher EUR prospectedlower zone• highest reserve abundance• higher initial production rate
5. Optimization of development parameters
(1) Drilling target
102m 21m
Upper unit
Lower unit
Previous target
Currenttarget
Middle unit
Upper zone
Middle zone
lower zone
Best drilling target : the low member of Longmaxi Fm. the lowermember possesses the best reservoir characteristics
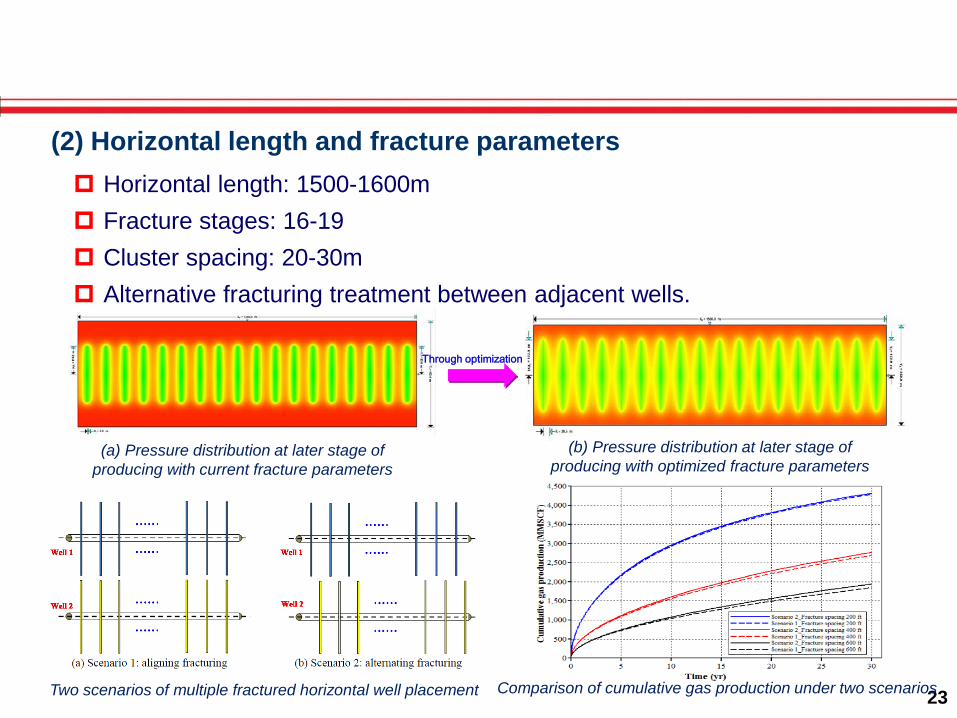
23
Horizontal length: 1500-1600m Fracture stages: 16-19 Cluster spacing: 20-30m Alternative fracturing treatment between adjacent wells.
(b) Pressure distribution at later stage of producing with optimized fracture parameters
Through optimization
(2) Horizontal length and fracture parameters
(a) Pressure distribution at later stage of producing with current fracture parameters
Two scenarios of multiple fractured horizontal well placement Comparison of cumulative gas production under two scenarios
24
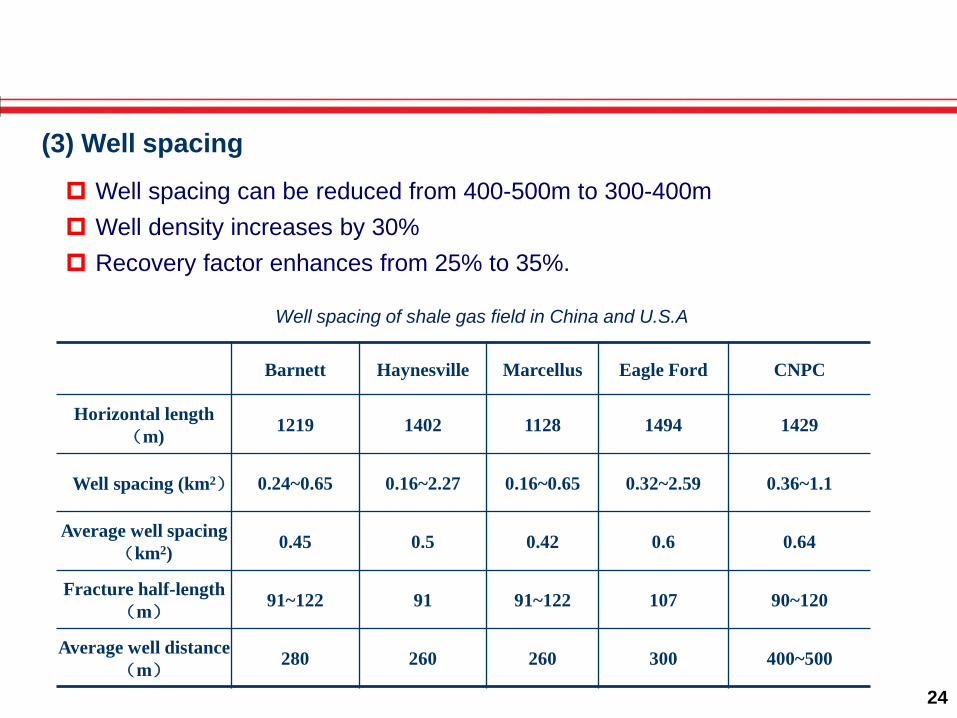
Well spacing can be reduced from 400-500m to 300-400m Well density increases by 30% Recovery factor enhances from 25% to 35%.
Barnett Haynesville Marcellus Eagle Ford CNPC
Horizontal length(m) 1219 1402 1128 1494 1429
Well spacing (km2) 0.24~0.65 0.16~2.27 0.16~0.65 0.32~2.59 0.36~1.1
Average well spacing(km2) 0.45 0.5 0.42 0.6 0.64
Fracture half-length(m)
91~122 91 91~122 107 90~120
Average well distance(m)
280 260 260 300 400~500
Well spacing of shale gas field in China and U.S.A
(3) Well spacing
25
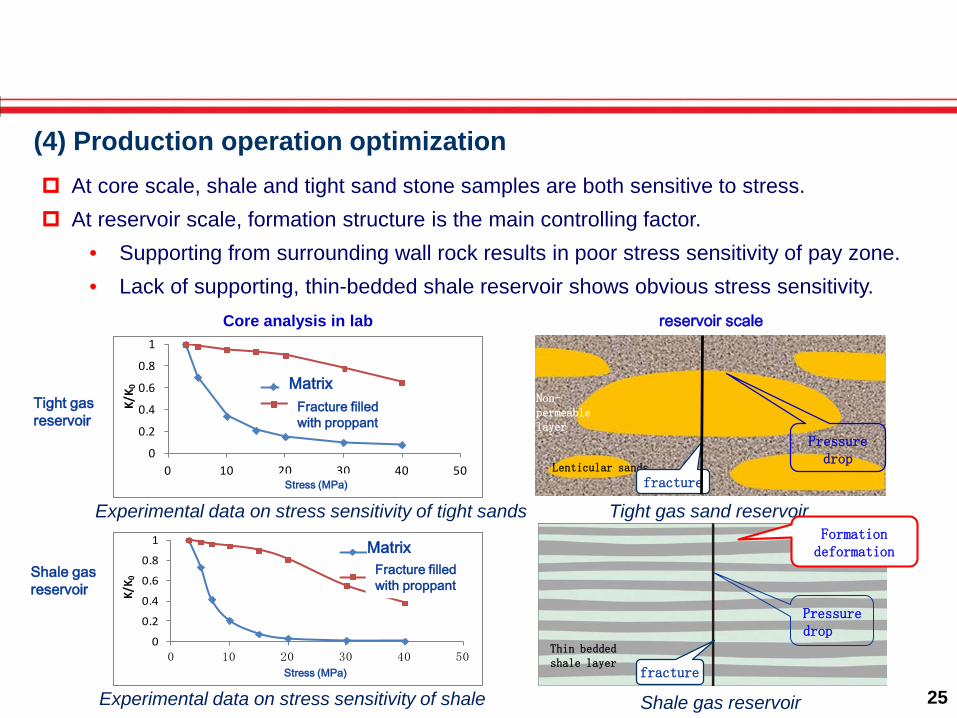
Experimental data on stress sensitivity of tight sands
Core analysis in lab reservoir scale
Tight gas reservoir
Shale gas reservoir
Tight gas sand reservoir
Shale gas reservoir
Thin bedded shale layer
fracture
Formation deformation
Pressure drop
0
0.2
0.4
0.6
0.8
1
0 10 20 30 40 50
K/K 0
有效应力(MPa)
基质
人工支撑裂缝
0
0.2
0.4
0.6
0.8
1
0 10 20 30 40 50
K/K 0
有效压力(MPa)
基质(含微裂缝)
人工支撑裂缝
Non-permeable layer
Lenticular sands
fracture
Pressure drop
(4) Production operation optimization
Experimental data on stress sensitivity of shale
MatrixFracture filled with proppant
MatrixFracture filled with proppant
Stress (MPa)
Stress (MPa)
At core scale, shale and tight sand stone samples are both sensitive to stress. At reservoir scale, formation structure is the main controlling factor.
• Supporting from surrounding wall rock results in poor stress sensitivity of pay zone.• Lack of supporting, thin-bedded shale reservoir shows obvious stress sensitivity.
26
0
10
20
30
40
0
4
8
12
16
20
2/13/2015 3/25/2015 5/4/2015 6/13/2015 7/23/2015 9/1/2015 10/11/2015 11/20/2015
Cas
ing
pres
sure
(MPa
)
Prod
uctio
n ra
te(
10 th
ousa
nd
m3/
day)
日产气 套压
To avoid steep decline of production rate at early stage
EUR of single well has potential to increase by 30%
Well name Vertical depth(m) Target formation Horizontal length(m) Stages EUR(106m3)
Well 1 2430 Middle zone, S1l3 1045 10 103
Well 2 2605 Middle zone, S1l3 1350 14 81
0
8
16
24
32
40
0
4
8
12
16
20
7/18/2012 2/3/2013 8/22/2013 3/10/2014 9/26/2014 4/14/2015 10/31/2015
Tubi
ng p
ress
ure
(M
Pa)
Prod
uctio
n ra
te(
10 th
ousa
nd
m3/
day)
日产气 油压 Well 1
4.5 million m3/MPa
Well 2
1.3 million m3/MPa
1.2 million m3/MPa
Daily production rates
Daily production rates Tubing pressure
Casing pressure
27
Outlines
1. Current state of shale gas development
in CNPC
2. Shale gas development technologies
3. Suggestions
28
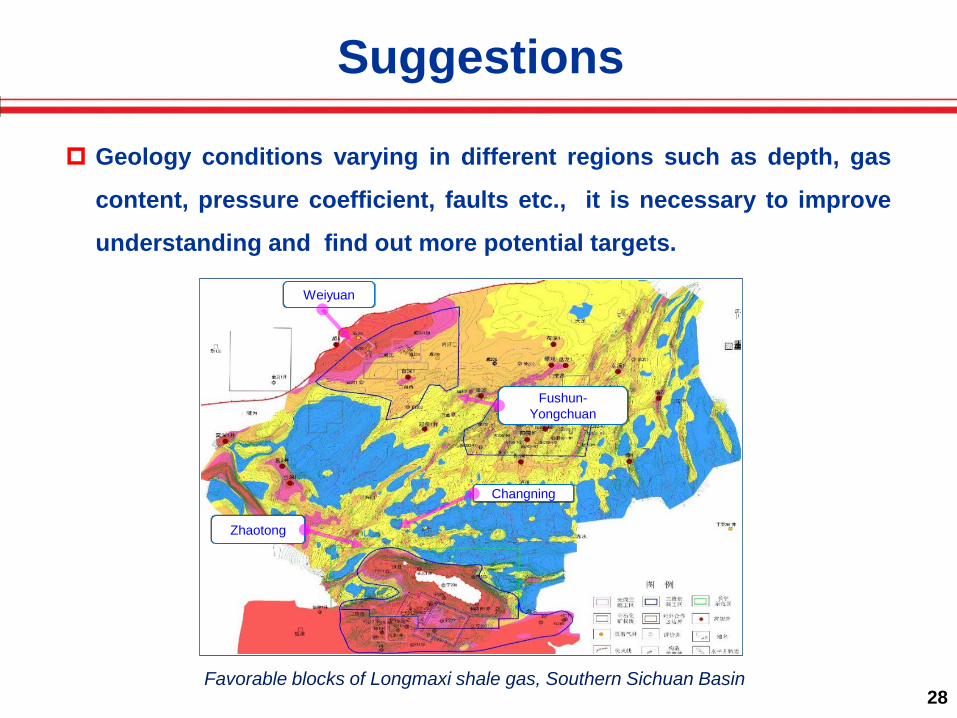
Suggestions
Geology conditions varying in different regions such as depth, gas
content, pressure coefficient, faults etc., it is necessary to improve
understanding and find out more potential targets.
Weiyuan
Fushun-Yongchuan
Changning
Zhaotong
Favorable blocks of Longmaxi shale gas, Southern Sichuan Basin
29
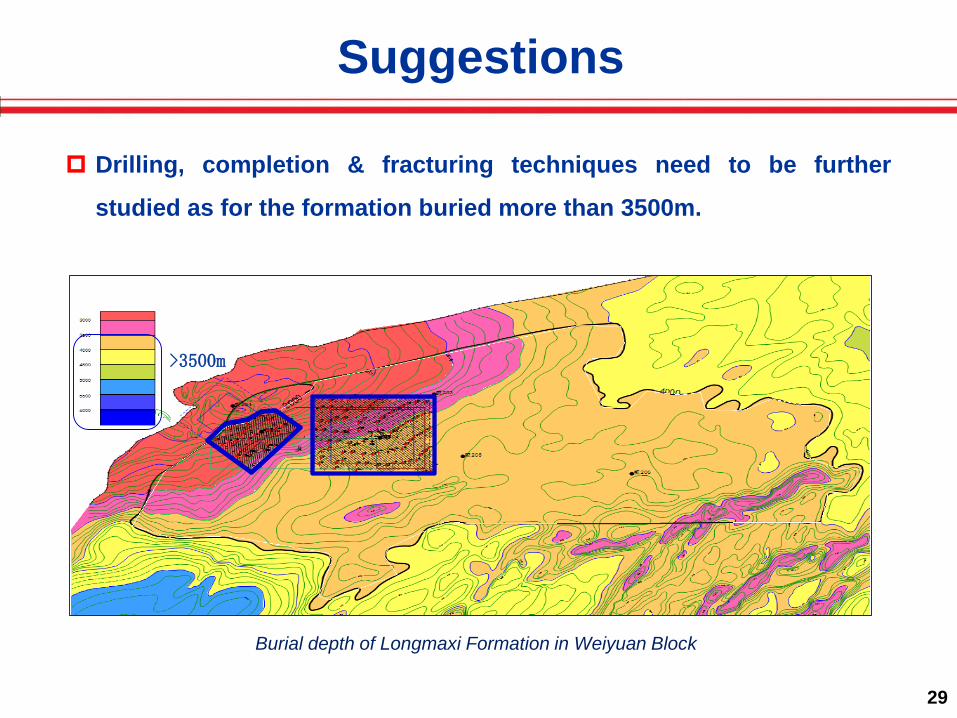
Suggestions
Drilling, completion & fracturing techniques need to be further
studied as for the formation buried more than 3500m.
Burial depth of Longmaxi Formation in Weiyuan Block
>3500m
30
Suggestions
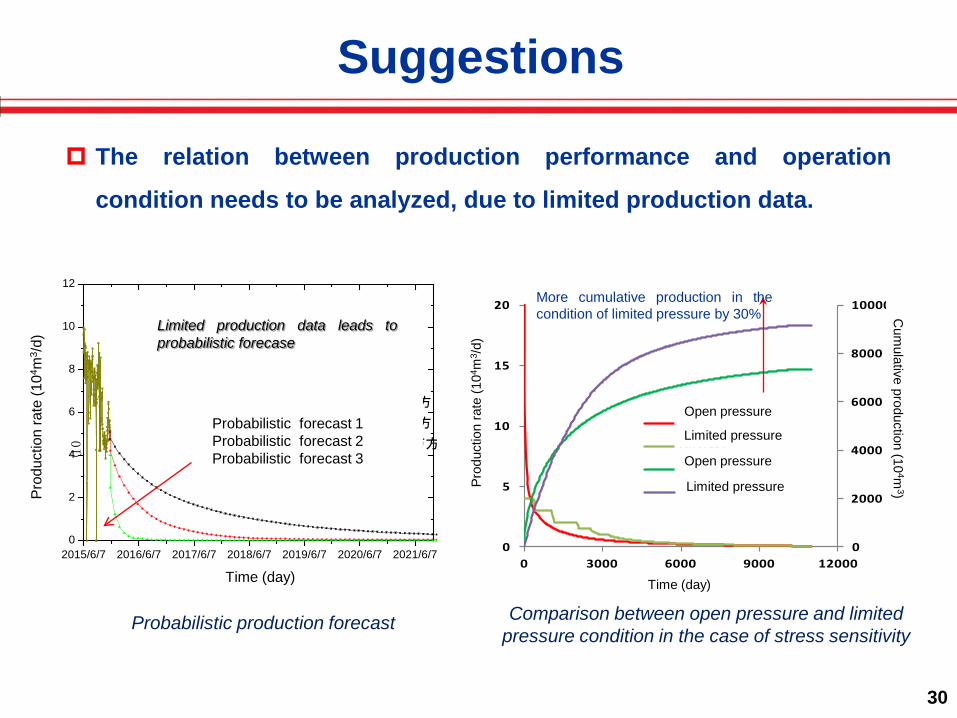
The relation between production performance and operation
condition needs to be analyzed, due to limited production data.
Comparison between open pressure and limited pressure condition in the case of stress sensitivity
Probabilistic production forecast
2015/6/7 2016/6/7 2017/6/7 2018/6/7 2019/6/7 2020/6/7 2021/6/70
2
4
6
8
10
12
产气
量
(10
4 m3 /d
)
生产日期 (day)
日产气实测值 P10 预测 P50 预测 P90 预测
EURP10=8234 万方
EURP50=9745 万方
EURP90=10084 万方
Prod
uctio
n ra
te (1
04 m3 /d
)
Time (day)
Probabilistic forecast 1Probabilistic forecast 2Probabilistic forecast 3
0
2000
4000
6000
8000
10000
0
5
10
15
20
0 3000 6000 9000 12000生产时间 天
放压日产
控压日产
放压累产
控压累产
More cumulative production in thecondition of limited pressure by 30%
Open pressure
Limited pressure
Open pressure
Limited pressure
Cum
ulative production (104m
3)
Time (day)
Prod
uctio
n ra
te (1
04m
3 /d)
Limited production data leads toprobabilistic forecase
31
Suggestions
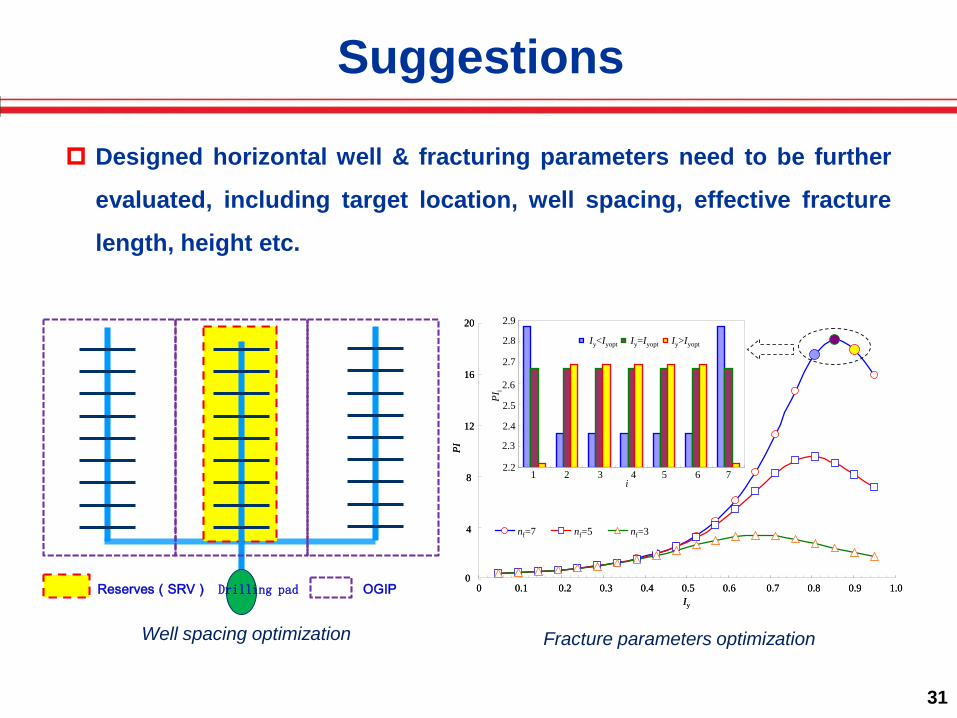
Designed horizontal well & fracturing parameters need to be further
evaluated, including target location, well spacing, effective fracture
length, height etc.
nf=7 nf=5 nf=3
系列1 系列2 系列3Iy<Iyopt Iy=Iyopt Iy>Iyopt
1 2 3 4 5 6 7i
nf=7 nf=5 nf=3
0 0.1 0.2 0.3 0.4 0.5 0.6 0.7 0.8 0.9 1.0Iy
0
4
8
12
16
20
PI
2.9
2.8
2.7
2.6
2.5
2.4
2.3
2.2
PIi
nf=7 nf=5 nf=3
系列1 系列2 系列3Iy<Iyopt Iy=Iyopt Iy>Iyopt
1 2 3 4 5 6 7i
nf=7 nf=5 nf=3
0 0.1 0.2 0.3 0.4 0.5 0.6 0.7 0.8 0.9 1.0Iy
0
4
8
12
16
20
PI
2.9
2.8
2.7
2.6
2.5
2.4
2.3
2.2
PIi
Drilling pad OGIPReserves(SRV)
Well spacing optimization Fracture parameters optimization

32
Thanks for your attention!