Embed Size (px)
Citation preview
This report shall not be reproduced, except in full, without the written approval of Southwest Research Institute®.
Results and discussion given in this report relate only to the test items described in this report.
SwRI 03.19533
Progress Rail PR30 Locomotive
SJVR3003 3000-Hour Emissions Test Report
Prepared by
Dustin T. Osborne
FINAL REPORT
Public Release
Prepared For
Progress Rail Services Corporation
March 2016
S O U T H W E S T R E S E A R C H I N S T I T U T E SAN ANTONIO, TX ● ANN ARBOR, MI ● WASHINGTON, DC
SOUTHWEST RESEARCH INSTITUTE P.O. Drawer 28510 ∙ 6220 Culebra Road
San Antonio, Texas 78228-0510
Progress Rail PR30 Locomotive
SJVR3003 3000-Hour Emissions Test Report
Prepared by
Dustin T. Osborne
FINAL REPORT
Public Release
Prepared For
Progress Rail Services Corporation
March 2016
Prepared by:
Dustin T. Osborne
Sr. Research Engineer
Reviewed by: Approved by:
Steven G. Fritz Marc Megel
Manager, Medium Speed Diesel Engines Director, Design & Development Department
DESIGN & DEVELOPMENT DEPARTMENT
ENGINE, EMISSIONS, AND VEHICLE RESEARCH DIVISION
SwRI Final Report 03.19533 Public Release ii
ACKNOWLEDGMENTS
The work reported in this document was performed for Progress Rail Services
Corporation, as outlined in SwRI proposal No. 03-68997, dated July 3, 2013. This project was
performed by the Design and Development Department within the Engine, Emissions, and
Vehicle Research Division under the supervision of Marc Megel. The Project Manager for SwRI
was Steven G. Fritz, manager of Medium Speed Diesel Engines in the Design and Development
Department. The Caterpillar technical contact for this project was Douglas Biagini.
SwRI Final Report 03.19533 Public Release iii
TABLE OF CONTENTS
Page
ACKNOWLEDGMENTS .............................................................................................................. ii LIST OF FIGURES ....................................................................................................................... iv LIST OF TABLES .......................................................................................................................... v LIST OF ABBREVIATIONS ........................................................................................................ vi EXECUTIVE SUMMARY .......................................................................................................... vii
1.0 INTRODUCTION .............................................................................................................. 1 2.0 TECHNICAL APPROACH................................................................................................ 2
2.1 Test Locomotive ............................................................................................................. 2 2.2 Description of Exhaust Aftertreatment ........................................................................... 3
2.3 Fuel Properties ................................................................................................................ 4 2.4 Fuel Consumption Measurements................................................................................... 5
2.5 Diesel Exhaust Fluid ....................................................................................................... 6 2.6 Power Measurements ...................................................................................................... 7
2.7 Gaseous Emissions Measurements ................................................................................. 8 2.8 Particulate Matter (PM) Emissions Measurements ......................................................... 9 2.9 Smoke Opacity Measurements ....................................................................................... 9
2.10 Locomotive Test Cycle ................................................................................................. 10 3.0 SJVR3003 0-HOUR AND 3000-HOUR TEST RESULTS ............................................. 12
SwRI Final Report 03.19533 Public Release iv
LIST OF FIGURES
Figure Page
Figure 1. SJVR3003 Test Locomotive............................................................................................ 2 Figure 2. Location of Aftertreatment System Components ............................................................ 4 Figure 3. Aftertreatment Converter Diagram.................................................................................. 4 Figure 4. Schematic of SwRI Fuel Flow Measurement System ..................................................... 6 Figure 5. SJVR3003 setup for emissions testing ............................................................................ 8
Figure 6. Average Duty Cycle Composite Emissions at 0-hour and 3,000-hour Test Intervals.
Error bars show one standard deviation of data set. .................................................. 13 Figure 7. Average engine power through the notches at 0-hour and 3,000-hour test intervals .... 15
SwRI Final Report 03.19533 Public Release v
LIST OF TABLES
Page
Table ES-1. Summary of SJVR3003 Emission Test Results ........................................................ ix Table 1. Locomotive and Engine Specifications ............................................................................ 3 Table 2. Test Fuel Properties .......................................................................................................... 5 Table 3. ISO 22241 Specifications for Diesel Exhaust Fluid ........................................................ 7 Table 4. Discrete-Mode Steady-State Locomotive Test Cycle ..................................................... 11
Table 5. Standard Duty Cycle Weighting Factors ........................................................................ 11 Table 6. SJVR3003 Locomotive Duty Cycle Composite Emissions at 0-hour and 3,000-hour
Test Intervals ............................................................................................................. 12 Table 7. Smoke Test Summary at 0-hour and 3,000 Test Intervals ............................................. 14
SwRI Final Report 03.19533 Public Release vi
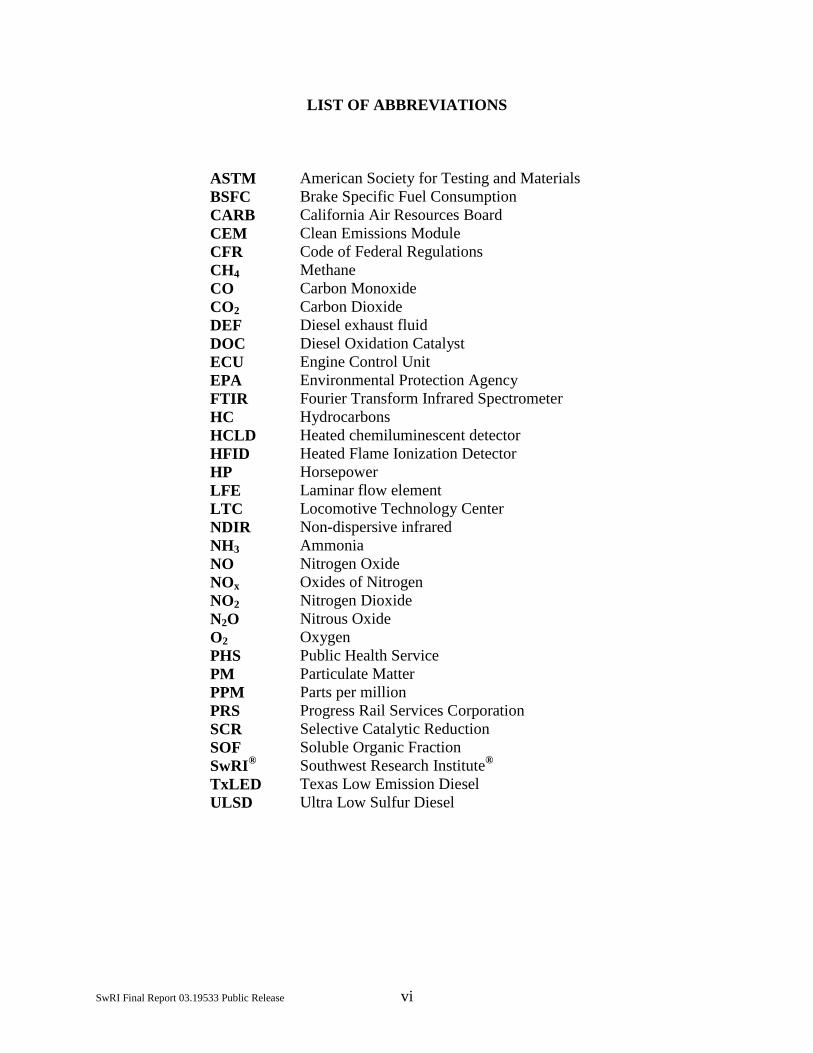
LIST OF ABBREVIATIONS
ASTM
BSFC
CARB
CEM
CFR
CH4
CO
CO2
DEF
DOC
ECU
EPA
FTIR
HC
HCLD
HFID
HP
LFE
LTC
NDIR
NH3
NO
NOx
NO2
N2O
O2
PHS
PM
PPM
PRS
SCR
SOF
SwRI®
TxLED
ULSD
American Society for Testing and Materials
Brake Specific Fuel Consumption
California Air Resources Board
Clean Emissions Module
Code of Federal Regulations
Methane
Carbon Monoxide
Carbon Dioxide
Diesel exhaust fluid
Diesel Oxidation Catalyst
Engine Control Unit
Environmental Protection Agency
Fourier Transform Infrared Spectrometer
Hydrocarbons
Heated chemiluminescent detector
Heated Flame Ionization Detector
Horsepower
Laminar flow element
Locomotive Technology Center
Non-dispersive infrared
Ammonia
Nitrogen Oxide
Oxides of Nitrogen
Nitrogen Dioxide
Nitrous Oxide
Oxygen
Public Health Service
Particulate Matter
Parts per million
Progress Rail Services Corporation
Selective Catalytic Reduction
Soluble Organic Fraction
Southwest Research Institute®
Texas Low Emission Diesel
Ultra Low Sulfur Diesel
SwRI Final Report 03.19533 Public Release vii
EXECUTIVE SUMMARY
The PR30 is a Progress Rail manufactured road locomotive equipped with a Caterpillar
3516C-HD engine and a Clean Emissions Module (CEM) – a Caterpillar developed advanced
exhaust aftertreatment system that includes urea based selective catalytic reduction (SCR) and
diesel oxidation catalyst (DOC) technology. In 2009 and 2010, California Air Resources Board
(CARB) partially funded emissions testing and field trial of a PR30C locomotive equipped with
the first generation CEM.1 More recently, a 2011-2012 program funded by a U.S. EPA Emerging
Technology Grant included emissions testing and field demonstration of a PR30C locomotive
equipped with the second generation CEM.2 That effort resulted in CARB issuance of
locomotive verification with the condition that the verification process be completed once more.
To this end, Progress Rail selected locomotive SJVR3003 to complete verification, and
Southwest Research Institute® (SwRI
®) was contracted by Progress Rail to complete triplicate
locomotive emission tests before and after the 3,000-hour field trial. This report documents
testing of SJVR3003 before the start of the field trial, i.e. 0-hour testing, and after the field trial,
i.e. 3,000-hour testing.
SJVR3003 arrived at SwRI for 0-hour testing in November 2013. Locomotive exhaust
emission tests were performed in December using the discrete-mode steady-state emission test of
locomotives and locomotive engines, as detailed in Subpart F of 40CFR1033, and 40CFR1065.
The SJVR3003 0-hour emission test results presented in Table ES-1 show that emissions were
below U.S. EPA Tier 4 Line-Haul locomotive standards for HC, CO and NOx, and PM was
below the Tier 3 standard. Average line-haul cycle composite results were as follows: 0.01 g/hp-
hr HC, 0.1 g/hp-hr CO, 1.0 g/hp-hr NOX, and 0.04 g/hp-hr PM. Average switch cycle composite
results were as follows: 0.01 g/hp-hr HC, 0.1 g/hp-hr CO, 2.6 g/hp-hr NOX, and 0.05 g/hp-hr
PM. Average results for the three smoke tests were: 5 percent opacity maximum steady-state, 7
percent opacity maximum 30 second average, and 21 percent opacity maximum three second
average.
SJVR3003 was released from SwRI in January 2014 after 0-hour testing to complete the
3,000 hour field trial while operating within the San Joaquin Valley Railroad in California. The
locomotive returned to SwRI November 2015 for post field-trial emissions testing. According to
ECU engine-hours, the locomotive accumulated a total of 4,015 hours of engine operation during
the field trial. Although this is notably greater than the 3,000 hour field trial target, the test
condition is still referred to in this report as the 3,000-hour test interval in reference to the
verification milestone. SJVR3003 3,000-hour testing was completed at SwRI in January 2016,
and emission test results are summarized in Table ES-1. In general, each of the three 3,000-hour
runs yielded results below Tier 4 Line-Haul limits for all applicable emissions. Compared to 0-
hour emissions, Line-haul PM was 24 percent lower, and Line-haul NOx was 30 percent higher.
Idle and N8 modes were the largest contributors to the increase in Line-haul NOx. Line-haul
1 Osborne, D.T. and S.G. Fritz, “Progress Rail PR30C-LoNOx Locomotive with DOC and Urea based SCR: 12-
Month Field Demonstration and Emissions Testing at 0, 1500 and 3000 Hours of Operation,” SwRI Project
03.14368 Final Report (May 2011).
2 Osborne, D.T. and S.G. Fritz, “Progress Rail PR30-LE Locomotive with Second Generation CEM,” SwRI Project
03.16701 Final Report (December 2012).
SwRI Final Report 03.19533 Public Release viii
composite results at 3,000-hour testing were as follows: 0.01 g/hp-hr HC, 0.1 g/hp-hr CO, 1.3
g/hp-hr NOX, and 0.03 g/hp-hr PM. Average switch cycle composite results were as follows:
0.01 g/hp-hr HC, 0.2 g/hp-hr CO, 3.1 g/hp-hr NOX, and 0.05 g/hp-hr PM. Average results for
the three smoke tests were: 3 percent opacity maximum steady-state, 5 percent opacity
maximum 30 second average, and 18 percent opacity maximum three second average.
SwRI Final Report 03.19533 Public Release ix
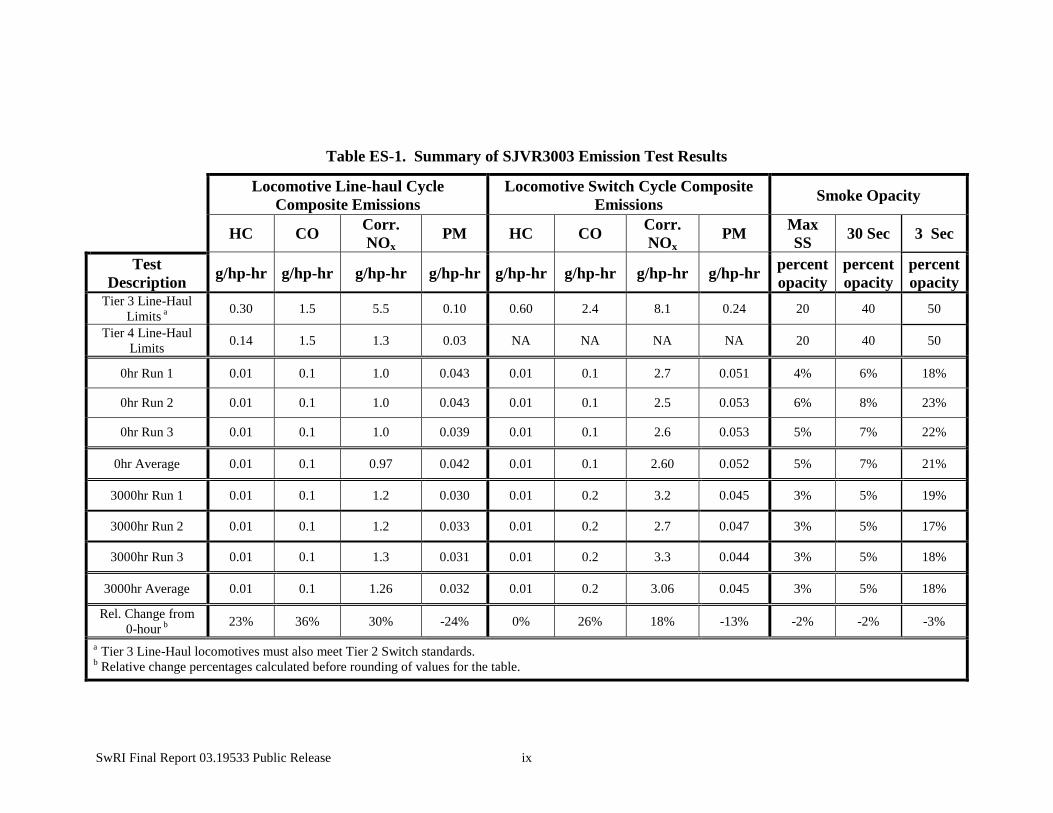
Table ES-1. Summary of SJVR3003 Emission Test Results
Locomotive Line-haul Cycle
Composite Emissions
Locomotive Switch Cycle Composite
Emissions Smoke Opacity
HC CO Corr.
NOx PM HC CO
Corr.
NOx PM
Max
SS 30 Sec 3 Sec
Test
Description g/hp-hr g/hp-hr g/hp-hr g/hp-hr g/hp-hr g/hp-hr g/hp-hr g/hp-hr
percent
opacity
percent
opacity
percent
opacity Tier 3 Line-Haul
Limits a
0.30 1.5 5.5 0.10 0.60 2.4 8.1 0.24 20 40 50
Tier 4 Line-Haul
Limits 0.14 1.5 1.3 0.03 NA NA NA NA 20 40 50
0hr Run 1 0.01 0.1 1.0 0.043 0.01 0.1 2.7 0.051 4% 6% 18%
0hr Run 2 0.01 0.1 1.0 0.043 0.01 0.1 2.5 0.053 6% 8% 23%
0hr Run 3 0.01 0.1 1.0 0.039 0.01 0.1 2.6 0.053 5% 7% 22%
0hr Average 0.01 0.1 0.97 0.042 0.01 0.1 2.60 0.052 5% 7% 21%
3000hr Run 1 0.01 0.1 1.2 0.030 0.01 0.2 3.2 0.045 3% 5% 19%
3000hr Run 2 0.01 0.1 1.2 0.033 0.01 0.2 2.7 0.047 3% 5% 17%
3000hr Run 3 0.01 0.1 1.3 0.031 0.01 0.2 3.3 0.044 3% 5% 18%
3000hr Average 0.01 0.1 1.26 0.032 0.01 0.2 3.06 0.045 3% 5% 18%
Rel. Change from
0-hour b
23% 36% 30% -24% 0% 26% 18% -13% -2% -2% -3%
a Tier 3 Line-Haul locomotives must also meet Tier 2 Switch standards. b Relative change percentages calculated before rounding of values for the table.
SwRI Final Report 03.19533 Public Release 1
1.0 INTRODUCTION
Progress Rail Services, a Caterpillar subsidiary, is the manufacturer of the PR30
locomotive. The PR30 is a four axle (PR30B) or six axle (PR30C) locomotive designed to
achieve EPA Tier 4 Line-haul locomotive NOX levels required for new line-haul locomotives in
the United States since 2015. The locomotive is built off of GP-38/40 and SD40-2 locomotive
chassis, repowered with a Caterpillar 3516C-HD Tier 2 or Tier 1+ certified diesel engine, and
equipped with a Caterpillar Clean Emissions Module (CEM) aftertreatment system. The
Caterpillar developed advanced exhaust aftertreatment includes urea based selective catalytic
reduction (SCR) and diesel oxidation catalyst (DOC) technology.
Previous PR30 test programs involved a 3,005 horsepower, six axle, PR30C locomotive
equipped with first and second generation CEM aftertreatment systems.1,2
Testing described in
this report was completed for a 2,995 horsepower, four axle, PR30B locomotive, with road
number SJVR3003. Southwest Research Institute® (SwRI
®) was contracted by Progress Rail
Services (PRS) to complete triplicate locomotive emission tests before and after a 3,000-hour
revenue service field trial. Included in this report is a description of the test locomotive, the
exhaust emission test procedures, and exhaust emission test results before and after the field trial.
1 Osborne, D.T. and S.G. Fritz, “Progress Rail PR30C-LoNOx Locomotive with DOC and Urea based SCR: 12-
Month Field Demonstration and Emissions Testing at 0, 1500 and 3000 Hours of Operation,” SwRI Project
03.14368 Final Report (May 2011).
2 Osborne, D.T. and S.G. Fritz, “Progress Rail PR30-LE Locomotive with Second Generation CEM,” SwRI Project
03.16701 Final Report (December 2012).
SwRI Final Report 03.19533 Public Release 2
2.0 TECHNICAL APPROACH
Locomotive exhaust emissions were measured by SwRI using the discrete-mode steady-
state emission test of locomotives and locomotive engines, as detailed in Subpart F of
40CFR1033, and 40CFR1065. Triplicate tests were completed for SJVR3003 in December 2013
at SwRI for the 0-hour test interval, which was prior to the start of the 3,000 hour verification
field trial in California. The field trial concluded in late 2015 and triplicate tests were again
completed at SwRI for the 3,000-hour test interval in January 2016. Details of the test
locomotive, the test setup and procedures are given below.
2.1 Test Locomotive
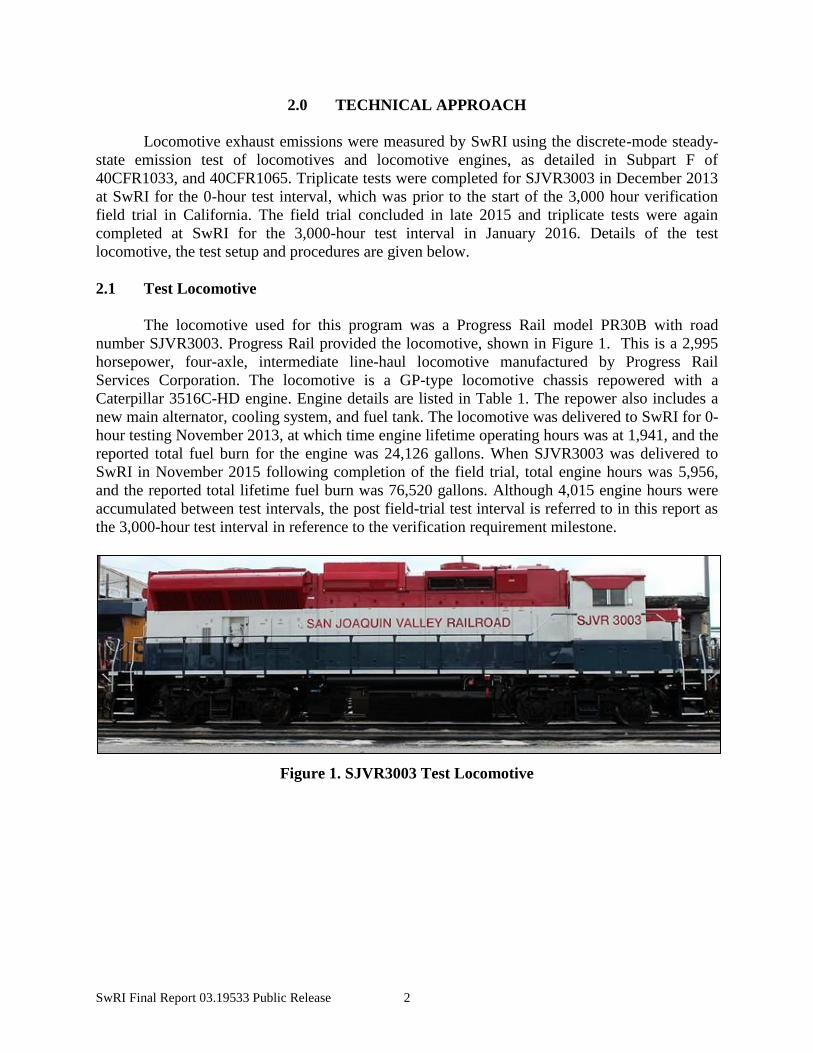
The locomotive used for this program was a Progress Rail model PR30B with road
number SJVR3003. Progress Rail provided the locomotive, shown in Figure 1. This is a 2,995
horsepower, four-axle, intermediate line-haul locomotive manufactured by Progress Rail
Services Corporation. The locomotive is a GP-type locomotive chassis repowered with a
Caterpillar 3516C-HD engine. Engine details are listed in Table 1. The repower also includes a
new main alternator, cooling system, and fuel tank. The locomotive was delivered to SwRI for 0-
hour testing November 2013, at which time engine lifetime operating hours was at 1,941, and the
reported total fuel burn for the engine was 24,126 gallons. When SJVR3003 was delivered to
SwRI in November 2015 following completion of the field trial, total engine hours was 5,956,
and the reported total lifetime fuel burn was 76,520 gallons. Although 4,015 engine hours were
accumulated between test intervals, the post field-trial test interval is referred to in this report as
the 3,000-hour test interval in reference to the verification requirement milestone.
Figure 1. SJVR3003 Test Locomotive
SwRI Final Report 03.19533 Public Release 3
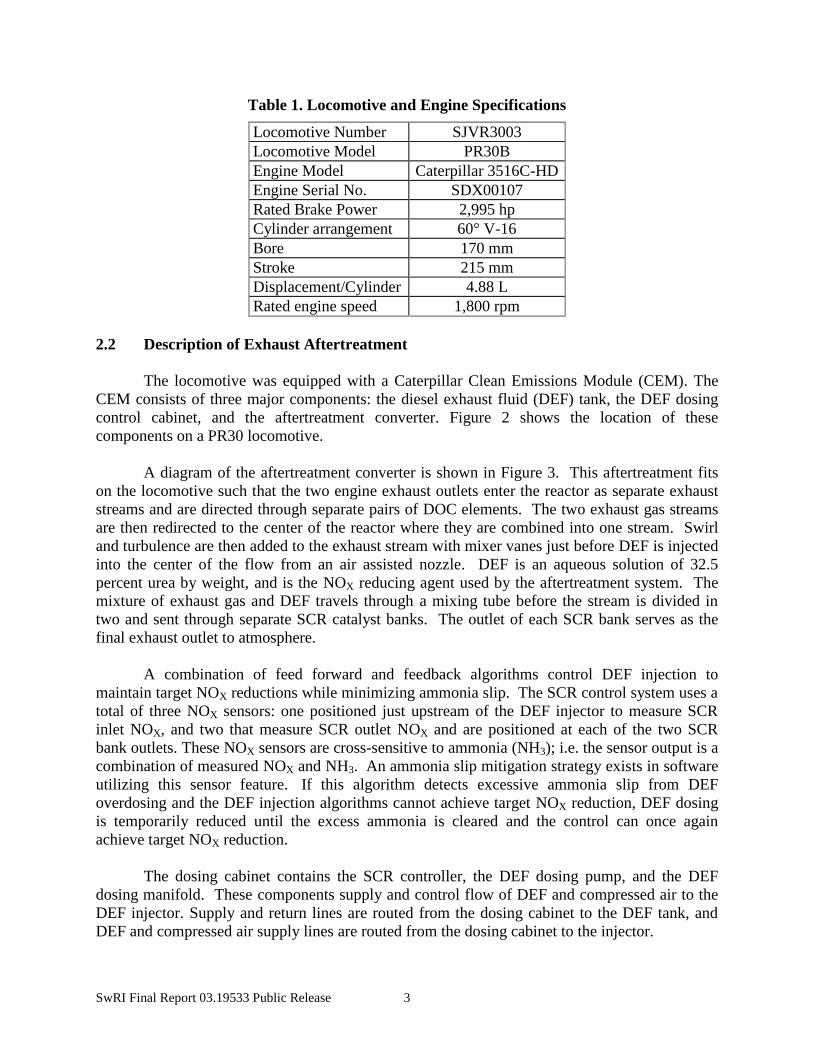
Table 1. Locomotive and Engine Specifications
Locomotive Number SJVR3003
Locomotive Model PR30B
Engine Model Caterpillar 3516C-HD
Engine Serial No. SDX00107
Rated Brake Power 2,995 hp
Cylinder arrangement 60° V-16
Bore 170 mm
Stroke 215 mm
Displacement/Cylinder 4.88 L
Rated engine speed 1,800 rpm
2.2 Description of Exhaust Aftertreatment
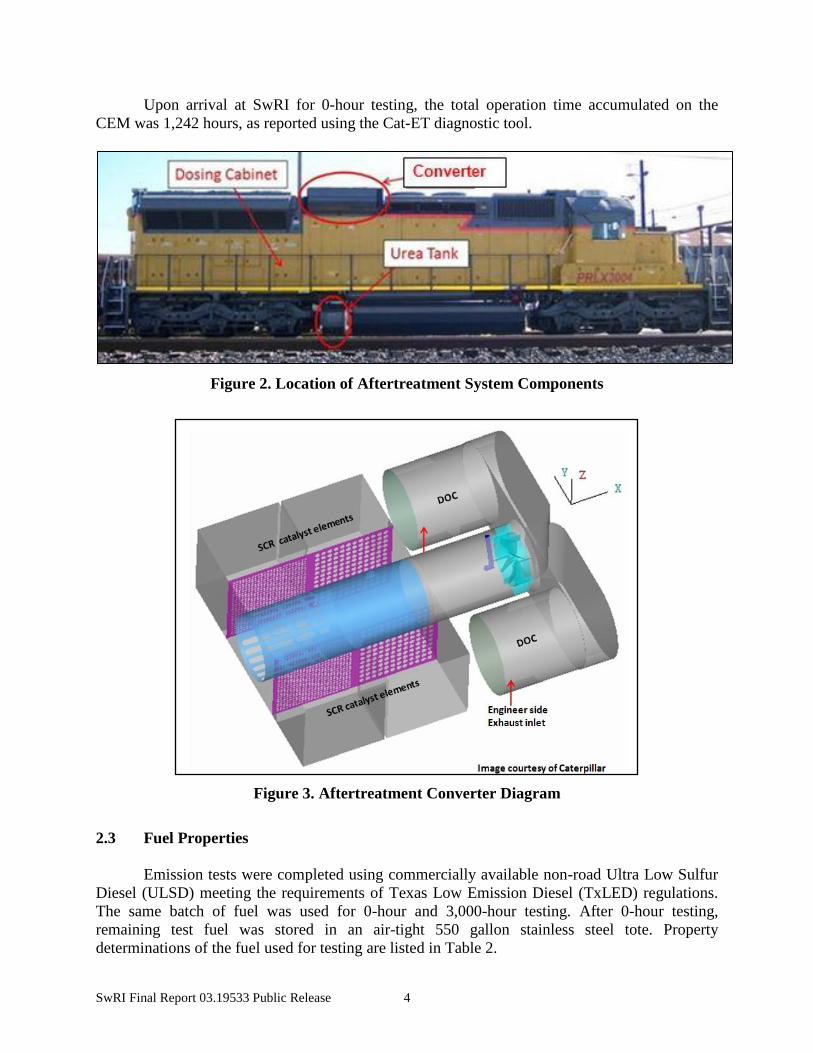
The locomotive was equipped with a Caterpillar Clean Emissions Module (CEM). The
CEM consists of three major components: the diesel exhaust fluid (DEF) tank, the DEF dosing
control cabinet, and the aftertreatment converter. Figure 2 shows the location of these
components on a PR30 locomotive.
A diagram of the aftertreatment converter is shown in Figure 3. This aftertreatment fits
on the locomotive such that the two engine exhaust outlets enter the reactor as separate exhaust
streams and are directed through separate pairs of DOC elements. The two exhaust gas streams
are then redirected to the center of the reactor where they are combined into one stream. Swirl
and turbulence are then added to the exhaust stream with mixer vanes just before DEF is injected
into the center of the flow from an air assisted nozzle. DEF is an aqueous solution of 32.5
percent urea by weight, and is the NOX reducing agent used by the aftertreatment system. The
mixture of exhaust gas and DEF travels through a mixing tube before the stream is divided in
two and sent through separate SCR catalyst banks. The outlet of each SCR bank serves as the
final exhaust outlet to atmosphere.
A combination of feed forward and feedback algorithms control DEF injection to
maintain target NOX reductions while minimizing ammonia slip. The SCR control system uses a
total of three NOX sensors: one positioned just upstream of the DEF injector to measure SCR
inlet NOX, and two that measure SCR outlet NOX and are positioned at each of the two SCR
bank outlets. These NOX sensors are cross-sensitive to ammonia (NH3); i.e. the sensor output is a
combination of measured NOX and NH3. An ammonia slip mitigation strategy exists in software
utilizing this sensor feature. If this algorithm detects excessive ammonia slip from DEF
overdosing and the DEF injection algorithms cannot achieve target NOX reduction, DEF dosing
is temporarily reduced until the excess ammonia is cleared and the control can once again
achieve target NOX reduction.
The dosing cabinet contains the SCR controller, the DEF dosing pump, and the DEF
dosing manifold. These components supply and control flow of DEF and compressed air to the
DEF injector. Supply and return lines are routed from the dosing cabinet to the DEF tank, and
DEF and compressed air supply lines are routed from the dosing cabinet to the injector.
SwRI Final Report 03.19533 Public Release 4
Upon arrival at SwRI for 0-hour testing, the total operation time accumulated on the
CEM was 1,242 hours, as reported using the Cat-ET diagnostic tool.
Figure 2. Location of Aftertreatment System Components
Figure 3. Aftertreatment Converter Diagram
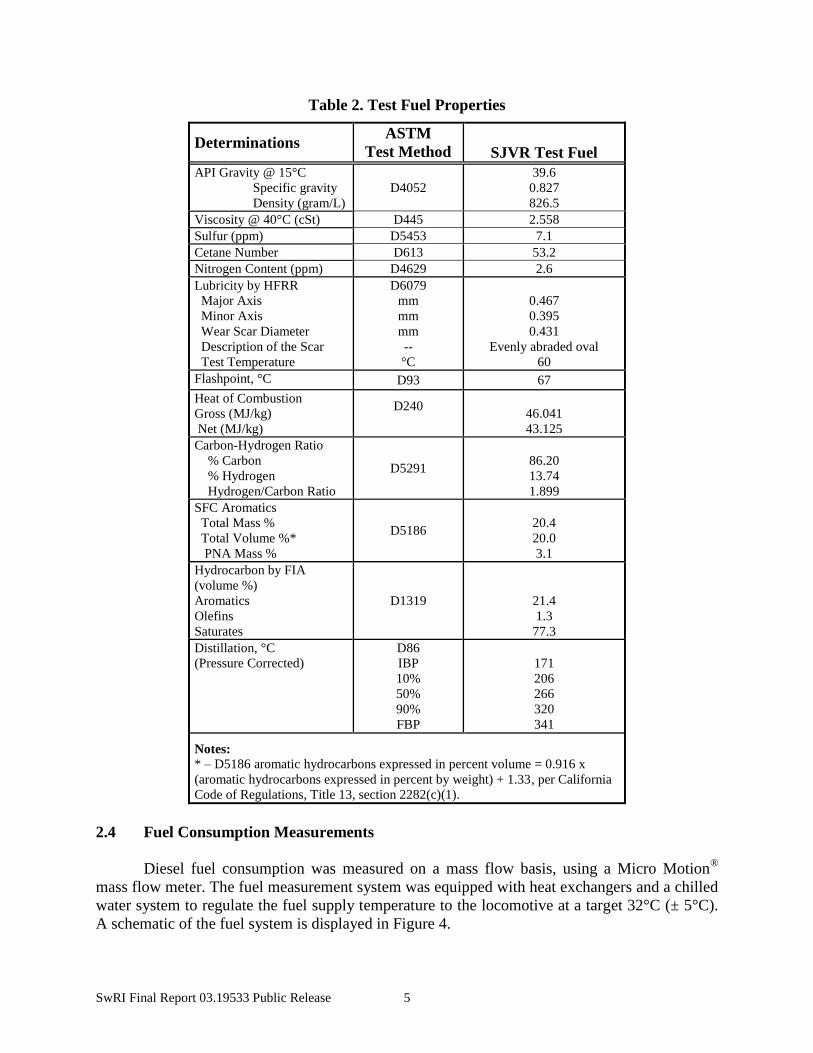
2.3 Fuel Properties
Emission tests were completed using commercially available non-road Ultra Low Sulfur
Diesel (ULSD) meeting the requirements of Texas Low Emission Diesel (TxLED) regulations.
The same batch of fuel was used for 0-hour and 3,000-hour testing. After 0-hour testing,
remaining test fuel was stored in an air-tight 550 gallon stainless steel tote. Property
determinations of the fuel used for testing are listed in Table 2.
SwRI Final Report 03.19533 Public Release 5
Table 2. Test Fuel Properties
Determinations ASTM
Test Method SJVR Test Fuel
API Gravity @ 15°C
Specific gravity
Density (gram/L)
D4052
39.6
0.827
826.5
Viscosity @ 40°C (cSt) D445 2.558
Sulfur (ppm) D5453 7.1
Cetane Number D613 53.2
Nitrogen Content (ppm) D4629 2.6
Lubricity by HFRR
Major Axis
Minor Axis
Wear Scar Diameter
Description of the Scar
Test Temperature
D6079
mm
mm
mm
--
°C
0.467
0.395
0.431
Evenly abraded oval
60
Flashpoint, °C D93 67
Heat of Combustion
Gross (MJ/kg)
Net (MJ/kg)
D240
46.041
43.125
Carbon-Hydrogen Ratio
% Carbon
% Hydrogen
Hydrogen/Carbon Ratio
D5291
86.20
13.74
1.899
SFC Aromatics
Total Mass %
Total Volume %*
PNA Mass %
D5186
20.4
20.0
3.1
Hydrocarbon by FIA
(volume %)
Aromatics
Olefins
Saturates
D1319
21.4
1.3
77.3
Distillation, °C
(Pressure Corrected)
D86
IBP
10%
50%
90%
FBP
171
206
266
320
341
Notes: * – D5186 aromatic hydrocarbons expressed in percent volume = 0.916 x
(aromatic hydrocarbons expressed in percent by weight) + 1.33, per California
Code of Regulations, Title 13, section 2282(c)(1).
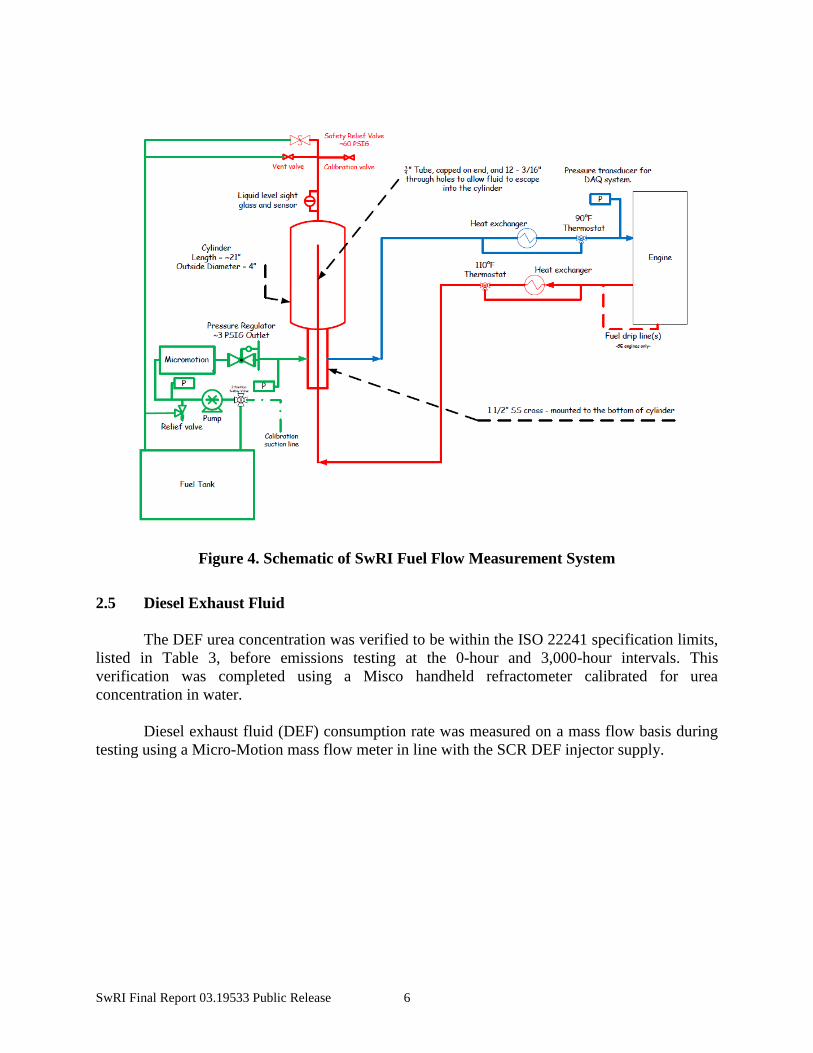
2.4 Fuel Consumption Measurements
Diesel fuel consumption was measured on a mass flow basis, using a Micro Motion®
mass flow meter. The fuel measurement system was equipped with heat exchangers and a chilled
water system to regulate the fuel supply temperature to the locomotive at a target 32°C (± 5°C).
A schematic of the fuel system is displayed in Figure 4.
SwRI Final Report 03.19533 Public Release 6
Figure 4. Schematic of SwRI Fuel Flow Measurement System
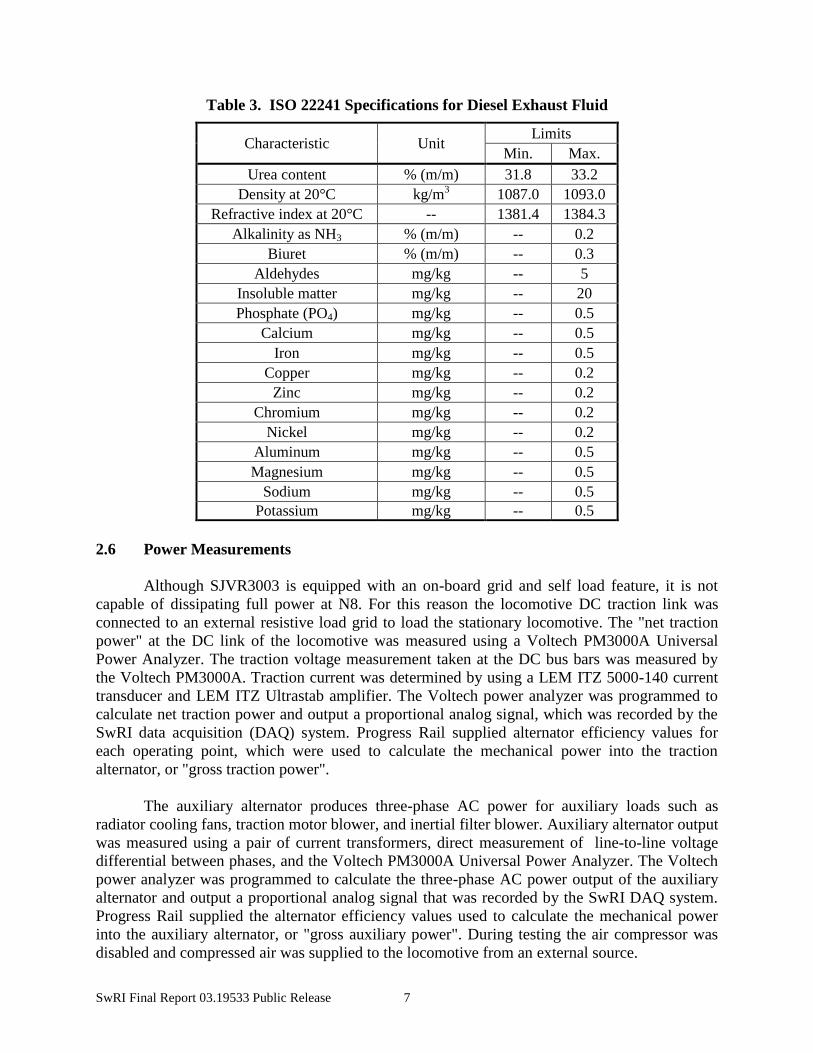
2.5 Diesel Exhaust Fluid
The DEF urea concentration was verified to be within the ISO 22241 specification limits,
listed in Table 3, before emissions testing at the 0-hour and 3,000-hour intervals. This
verification was completed using a Misco handheld refractometer calibrated for urea
concentration in water.
Diesel exhaust fluid (DEF) consumption rate was measured on a mass flow basis during
testing using a Micro-Motion mass flow meter in line with the SCR DEF injector supply.
SwRI Final Report 03.19533 Public Release 7
Table 3. ISO 22241 Specifications for Diesel Exhaust Fluid
Characteristic Unit Limits
Min. Max.
Urea content % (m/m) 31.8 33.2
Density at 20°C kg/m3 1087.0 1093.0
Refractive index at 20°C -- 1381.4 1384.3
Alkalinity as NH3 % (m/m) -- 0.2
Biuret % (m/m) -- 0.3
Aldehydes mg/kg -- 5
Insoluble matter mg/kg -- 20
Phosphate (PO4) mg/kg -- 0.5
Calcium mg/kg -- 0.5
Iron mg/kg -- 0.5
Copper mg/kg -- 0.2
Zinc mg/kg -- 0.2
Chromium mg/kg -- 0.2
Nickel mg/kg -- 0.2
Aluminum mg/kg -- 0.5
Magnesium mg/kg -- 0.5
Sodium mg/kg -- 0.5
Potassium mg/kg -- 0.5
2.6 Power Measurements
Although SJVR3003 is equipped with an on-board grid and self load feature, it is not
capable of dissipating full power at N8. For this reason the locomotive DC traction link was
connected to an external resistive load grid to load the stationary locomotive. The "net traction
power" at the DC link of the locomotive was measured using a Voltech PM3000A Universal
Power Analyzer. The traction voltage measurement taken at the DC bus bars was measured by
the Voltech PM3000A. Traction current was determined by using a LEM ITZ 5000-140 current
transducer and LEM ITZ Ultrastab amplifier. The Voltech power analyzer was programmed to
calculate net traction power and output a proportional analog signal, which was recorded by the
SwRI data acquisition (DAQ) system. Progress Rail supplied alternator efficiency values for
each operating point, which were used to calculate the mechanical power into the traction
alternator, or "gross traction power".
The auxiliary alternator produces three-phase AC power for auxiliary loads such as
radiator cooling fans, traction motor blower, and inertial filter blower. Auxiliary alternator output
was measured using a pair of current transformers, direct measurement of line-to-line voltage
differential between phases, and the Voltech PM3000A Universal Power Analyzer. The Voltech
power analyzer was programmed to calculate the three-phase AC power output of the auxiliary
alternator and output a proportional analog signal that was recorded by the SwRI DAQ system.
Progress Rail supplied the alternator efficiency values used to calculate the mechanical power
into the auxiliary alternator, or "gross auxiliary power". During testing the air compressor was
disabled and compressed air was supplied to the locomotive from an external source.
SwRI Final Report 03.19533 Public Release 8
Within this report the terms "engine power", "brake horsepower" (bhp) and "gross
power" all refer to the observed (i.e. uncorrected) power at the flywheel. Engine power was
calculated by summing the gross traction power and gross auxiliary power.
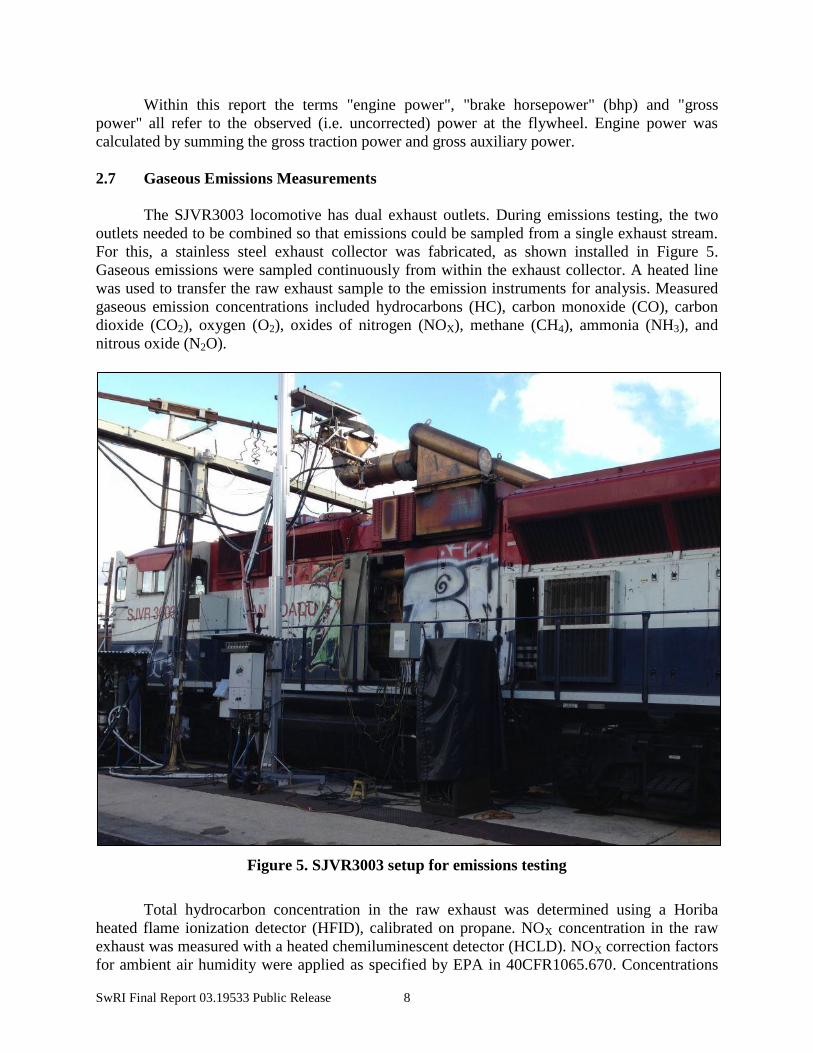
2.7 Gaseous Emissions Measurements
The SJVR3003 locomotive has dual exhaust outlets. During emissions testing, the two
outlets needed to be combined so that emissions could be sampled from a single exhaust stream.
For this, a stainless steel exhaust collector was fabricated, as shown installed in Figure 5.
Gaseous emissions were sampled continuously from within the exhaust collector. A heated line
was used to transfer the raw exhaust sample to the emission instruments for analysis. Measured
gaseous emission concentrations included hydrocarbons (HC), carbon monoxide (CO), carbon
dioxide (CO2), oxygen (O2), oxides of nitrogen (NOX), methane (CH4), ammonia (NH3), and
nitrous oxide (N2O).
Figure 5. SJVR3003 setup for emissions testing
Total hydrocarbon concentration in the raw exhaust was determined using a Horiba
heated flame ionization detector (HFID), calibrated on propane. NOX concentration in the raw
exhaust was measured with a heated chemiluminescent detector (HCLD). NOX correction factors
for ambient air humidity were applied as specified by EPA in 40CFR1065.670. Concentrations
SwRI Final Report 03.19533 Public Release 9
of CO and CO2 in the raw exhaust were determined by non-dispersive infrared (NDIR)
instruments, and O2 concentrations were measured using a magneto-pneumatic analyzer. Raw
exhaust CH4 concentration was measured using a non-methane cutter (NMC) and a dedicated
heated flame ionization detector (NMC-HFID) as outlined in 40CFR1065.365(d).
Post-SCR ammonia (NH3) and nitrous oxide (N2O) concentration in the raw exhaust were
measured using Fourier Transform Infrared (FTIR) spectroscopy. Exhaust was sampled from a
multi-hole gaseous emissions probe and drawn through a heated sample line to a Thermo Fisher
Nicolet 6700 FTIR at a target flow rate of 10 liters per minute.
Gaseous mass emission rates were computed via chemical balance of fuel, intake air, and
exhaust gas using the procedures specified in 40CFR1065.655.
2.8 Particulate Matter (PM) Emissions Measurements
Particulate matter (PM) emissions were measured with a Sierra Instruments BG-3
Particulate Partial-Flow Sampling System. This device employs a partial flow dilution technique
that can be characterized as the “split then dilute” technique, in which a portion of the raw
locomotive exhaust is “split” from the total flow and mixed with filtered air in a dilution tunnel.
The Sierra BG-3 sampling system used a single ended probe facing upstream in the
locomotive exhaust stack extension to extract a fraction of the raw exhaust. Approximately 7.5
cm after the probe termination, the raw exhaust sample was diluted with metered and filtered air
in a Sierra radial inflow dilution tunnel. The temperature of the dilution air entering the dilution
tunnel was controlled to 25 ± 5 °C. The total diluted exhaust sample was then transferred from
the locomotive exhaust stack proximity to near ground level through a 12.7 mm diameter,
stainless steel transfer tube heated to 47°C. The diluted exhaust was then transported through a
heated stainless steel cyclonic separator and a one liter residence-time chamber before being
routed through a single 47 mm diameter TX40 sample filter. The BG-3 measured the dilution air
flow using a laminar flow element (LFE), and the total dilute sample was measured by a positive
displacement roots meter. The difference between the two measurements is defined as the raw
exhaust sample volume, which was used along with the filter mass increase and the calculated
engine exhaust flow rate to determine the PM mass emission rate of the locomotive.
For this testing a separate PM filter was used at each test mode. Each PM sample was
collected onto the filter using a constant dilution ratio set point. To maintain proportional
sampling as required by 40CFR1033 and 40CFR1065, the PM dilution ratio set point was
changed between each test mode according to predicted exhaust flows.
The soluble organic fraction (SOF) of PM was determined for one of the three tests at
both 0-hour and 3,000-hour intervals. The soluble portion of the particulate-laden filters was
extracted using a toluene/ethanol solvent in a soxhlet apparatus. Resulting SOF levels were
determined using a filter weight loss method.
2.9 Smoke Opacity Measurements
Smoke opacity was measured using a modified Public Health Service (PHS) full-flow
opacity meter (smokemeter) mounted above the locomotive exhaust stack. This smokemeter
SwRI Final Report 03.19533 Public Release 10
uses standard PHS smokemeter optics and electronics, but was modified to a one meter diameter
to accommodate larger exhaust plume diameters. The construction, calibration, and operation of
the smokemeter adhere to 40CFR1033.525 and 40CFR92.111.
The smokemeter through-exhaust path length was approximately one meter (as
determined by the dimensions of the exhaust stack extension). The center of the light beam was
positioned 125±25 mm away from the outlet of the exhaust collector. Smokemeter response was
continuously recorded in percent opacity over the entire test cycle, and the following results were
computed using data analysis procedures specified in 40CFR92.131:
1. "3-sec" – Maximum three-second average smoke opacity reading
2. "30-sec" – Maximum 30-second average smoke opacity reading
3. "Max SS" – Maximum steady-state smoke opacity: note that steady-state smoke opacity
is defined by 40CFR92.131 as the average smoke opacity reading between 120 seconds
and 180 seconds after the notch change.
2.10 Locomotive Test Cycle
The test cycle used for this work was the locomotive discrete-mode steady-state emission
test cycle, as described in 40CFR1033.515. This test cycle is given in Table 4. For locomotives
with a single idle speed there are ten test modes within this cycle. For each mode, the engine is
controlled to a manufacturer specified target engine speed and power. The test modes consist of
idle, a simulated dynamic brake condition, and eight throttle notch power settings that range
from low to rated power. During emissions testing, notch setting was selected by the test
operator via the locomotive multiple-unit train control (MU) cable.
Prior to the start of the test cycle, the locomotive was warmed up at Notch 8 for ten
minutes. After the warm-up, the engine was allowed to stabilize at the lowest idle setting for 10
minutes before the official start of test. Testing then progressed through each test mode in the
order shown in Table 4.
The locomotive discrete-mode steady-state emission test cycle is considered to be steady-
state with respect to operator notch demand, rather than engine speed and load. Therefore it
should be noted that test results for a given test mode do not necessarily reflect steady-state
engine operation at that mode. Instead, the transition from the previous test mode is included in
the average emissions, power, and fuel consumption for a given test mode. The only exception is
for the Low Idle test mode because it is preceded by a pre-test stabilization period. The time
interval over which gaseous emission mass rates are integrated – and PM is sampled – begins
when the operator notch selection is changed to start a test mode, and ends after 300 seconds,
except for Notch 8 which ends after 600 seconds.
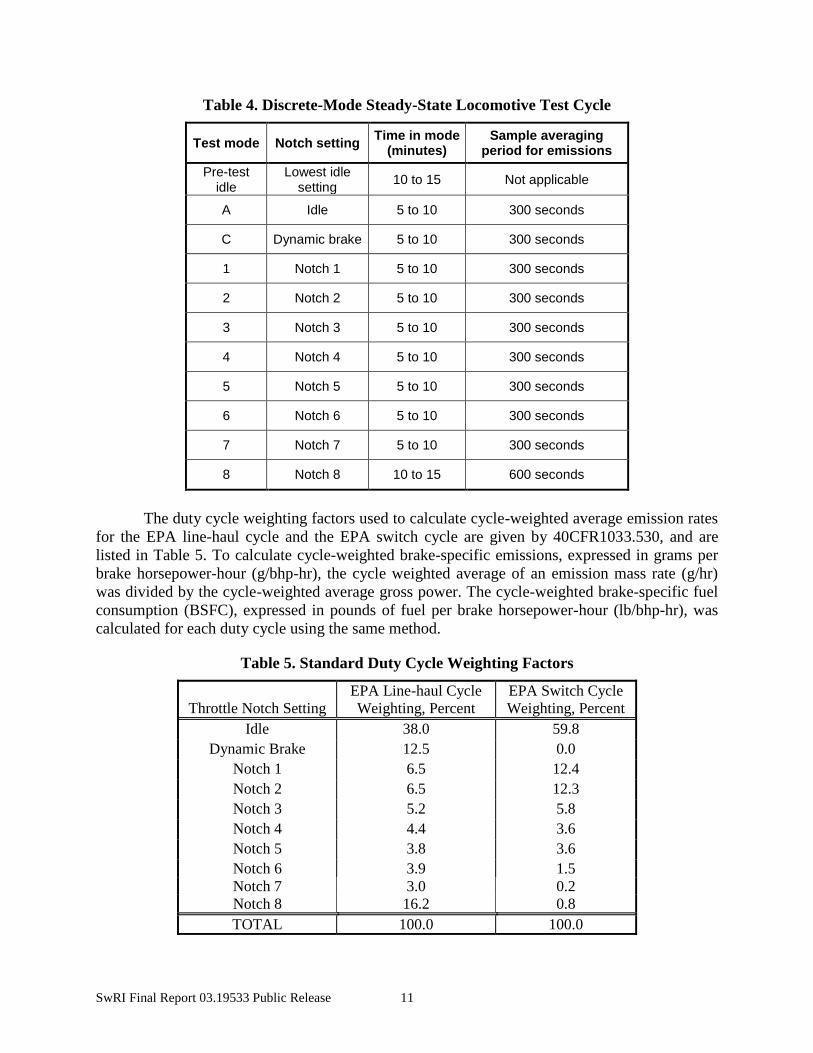
SwRI Final Report 03.19533 Public Release 11
Table 4. Discrete-Mode Steady-State Locomotive Test Cycle
Test mode Notch setting Time in mode
(minutes) Sample averaging
period for emissions
Pre-test idle
Lowest idle setting
10 to 15 Not applicable
A Idle 5 to 10 300 seconds
C Dynamic brake 5 to 10 300 seconds
1 Notch 1 5 to 10 300 seconds
2 Notch 2 5 to 10 300 seconds
3 Notch 3 5 to 10 300 seconds
4 Notch 4 5 to 10 300 seconds
5 Notch 5 5 to 10 300 seconds
6 Notch 6 5 to 10 300 seconds
7 Notch 7 5 to 10 300 seconds
8 Notch 8 10 to 15 600 seconds
The duty cycle weighting factors used to calculate cycle-weighted average emission rates
for the EPA line-haul cycle and the EPA switch cycle are given by 40CFR1033.530, and are
listed in Table 5. To calculate cycle-weighted brake-specific emissions, expressed in grams per
brake horsepower-hour (g/bhp-hr), the cycle weighted average of an emission mass rate (g/hr)
was divided by the cycle-weighted average gross power. The cycle-weighted brake-specific fuel
consumption (BSFC), expressed in pounds of fuel per brake horsepower-hour (lb/bhp-hr), was
calculated for each duty cycle using the same method.
Table 5. Standard Duty Cycle Weighting Factors
Throttle Notch Setting
EPA Line-haul Cycle
Weighting, Percent
EPA Switch Cycle
Weighting, Percent
Idle 38.0 59.8
Dynamic Brake 12.5 0.0
Notch 1 6.5 12.4
Notch 2 6.5 12.3
Notch 3 5.2 5.8
Notch 4 4.4 3.6
Notch 5 3.8 3.6
Notch 6 3.9 1.5
Notch 7 3.0 0.2
Notch 8 16.2 0.8
TOTAL 100.0 100.0
SwRI Final Report 03.19533 Public Release 12
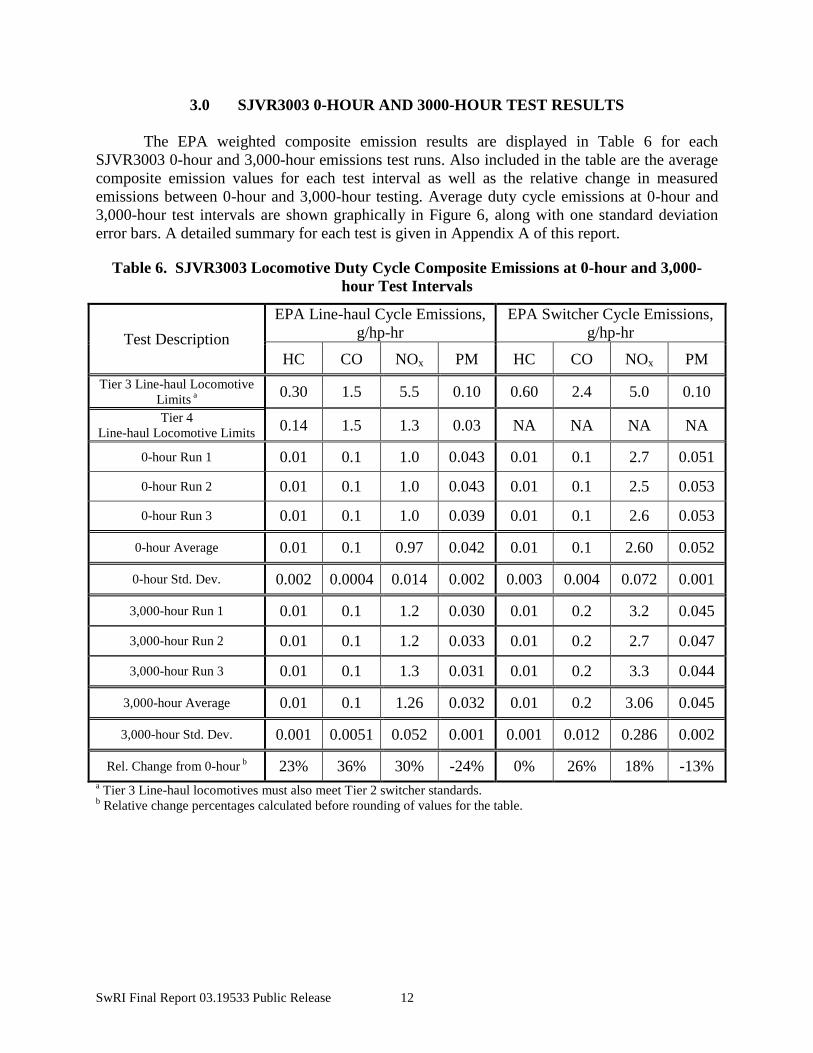
3.0 SJVR3003 0-HOUR AND 3000-HOUR TEST RESULTS
The EPA weighted composite emission results are displayed in Table 6 for each
SJVR3003 0-hour and 3,000-hour emissions test runs. Also included in the table are the average
composite emission values for each test interval as well as the relative change in measured
emissions between 0-hour and 3,000-hour testing. Average duty cycle emissions at 0-hour and
3,000-hour test intervals are shown graphically in Figure 6, along with one standard deviation
error bars. A detailed summary for each test is given in Appendix A of this report.
Table 6. SJVR3003 Locomotive Duty Cycle Composite Emissions at 0-hour and 3,000-
hour Test Intervals
Test Description
EPA Line-haul Cycle Emissions,
g/hp-hr
EPA Switcher Cycle Emissions,
g/hp-hr
HC CO NOx PM HC CO NOx PM
Tier 3 Line-haul Locomotive
Limits a
0.30 1.5 5.5 0.10 0.60 2.4 5.0 0.10
Tier 4
Line-haul Locomotive Limits 0.14 1.5 1.3 0.03 NA NA NA NA
0-hour Run 1 0.01 0.1 1.0 0.043 0.01 0.1 2.7 0.051
0-hour Run 2 0.01 0.1 1.0 0.043 0.01 0.1 2.5 0.053
0-hour Run 3 0.01 0.1 1.0 0.039 0.01 0.1 2.6 0.053
0-hour Average 0.01 0.1 0.97 0.042 0.01 0.1 2.60 0.052
0-hour Std. Dev. 0.002 0.0004 0.014 0.002 0.003 0.004 0.072 0.001
3,000-hour Run 1 0.01 0.1 1.2 0.030 0.01 0.2 3.2 0.045
3,000-hour Run 2 0.01 0.1 1.2 0.033 0.01 0.2 2.7 0.047
3,000-hour Run 3 0.01 0.1 1.3 0.031 0.01 0.2 3.3 0.044
3,000-hour Average 0.01 0.1 1.26 0.032 0.01 0.2 3.06 0.045
3,000-hour Std. Dev. 0.001 0.0051 0.052 0.001 0.001 0.012 0.286 0.002
Rel. Change from 0-hour b 23% 36% 30% -24% 0% 26% 18% -13%
a Tier 3 Line-haul locomotives must also meet Tier 2 switcher standards.
b Relative change percentages calculated before rounding of values for the table.
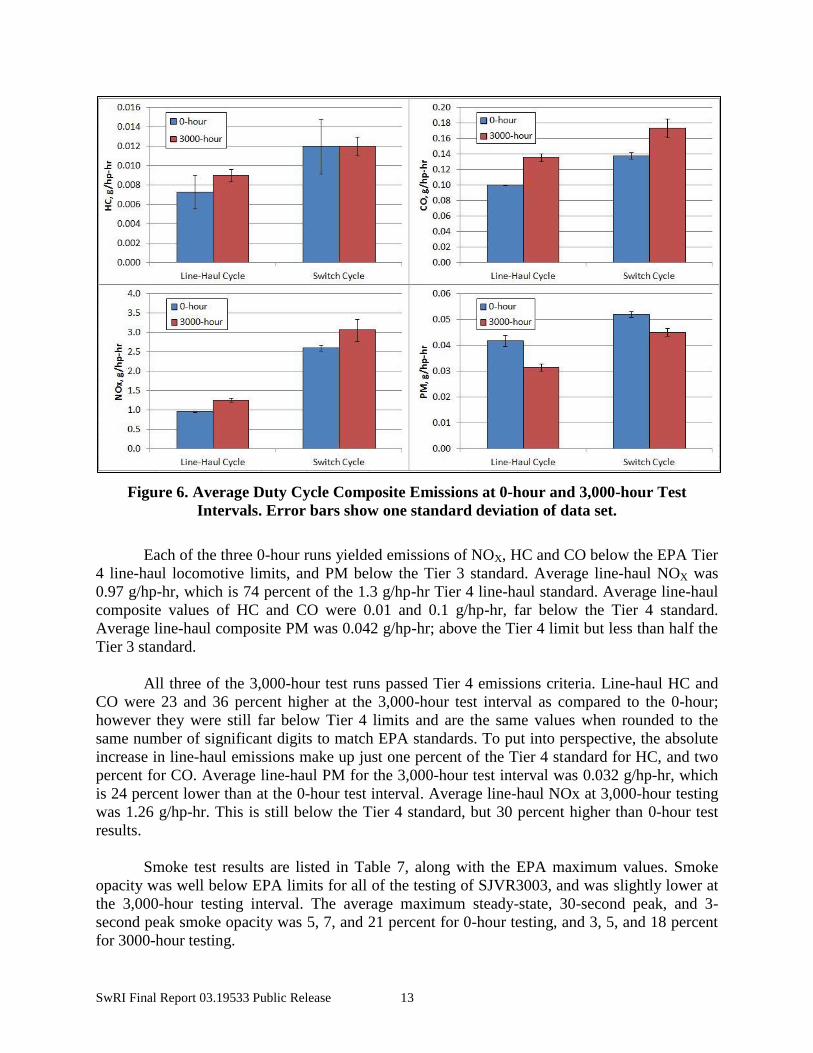
SwRI Final Report 03.19533 Public Release 13
Figure 6. Average Duty Cycle Composite Emissions at 0-hour and 3,000-hour Test
Intervals. Error bars show one standard deviation of data set.
Each of the three 0-hour runs yielded emissions of NOX, HC and CO below the EPA Tier
4 line-haul locomotive limits, and PM below the Tier 3 standard. Average line-haul NOX was
0.97 g/hp-hr, which is 74 percent of the 1.3 g/hp-hr Tier 4 line-haul standard. Average line-haul
composite values of HC and CO were 0.01 and 0.1 g/hp-hr, far below the Tier 4 standard.
Average line-haul composite PM was 0.042 g/hp-hr; above the Tier 4 limit but less than half the
Tier 3 standard.
All three of the 3,000-hour test runs passed Tier 4 emissions criteria. Line-haul HC and
CO were 23 and 36 percent higher at the 3,000-hour test interval as compared to the 0-hour;
however they were still far below Tier 4 limits and are the same values when rounded to the
same number of significant digits to match EPA standards. To put into perspective, the absolute
increase in line-haul emissions make up just one percent of the Tier 4 standard for HC, and two
percent for CO. Average line-haul PM for the 3,000-hour test interval was 0.032 g/hp-hr, which
is 24 percent lower than at the 0-hour test interval. Average line-haul NOx at 3,000-hour testing
was 1.26 g/hp-hr. This is still below the Tier 4 standard, but 30 percent higher than 0-hour test
results.
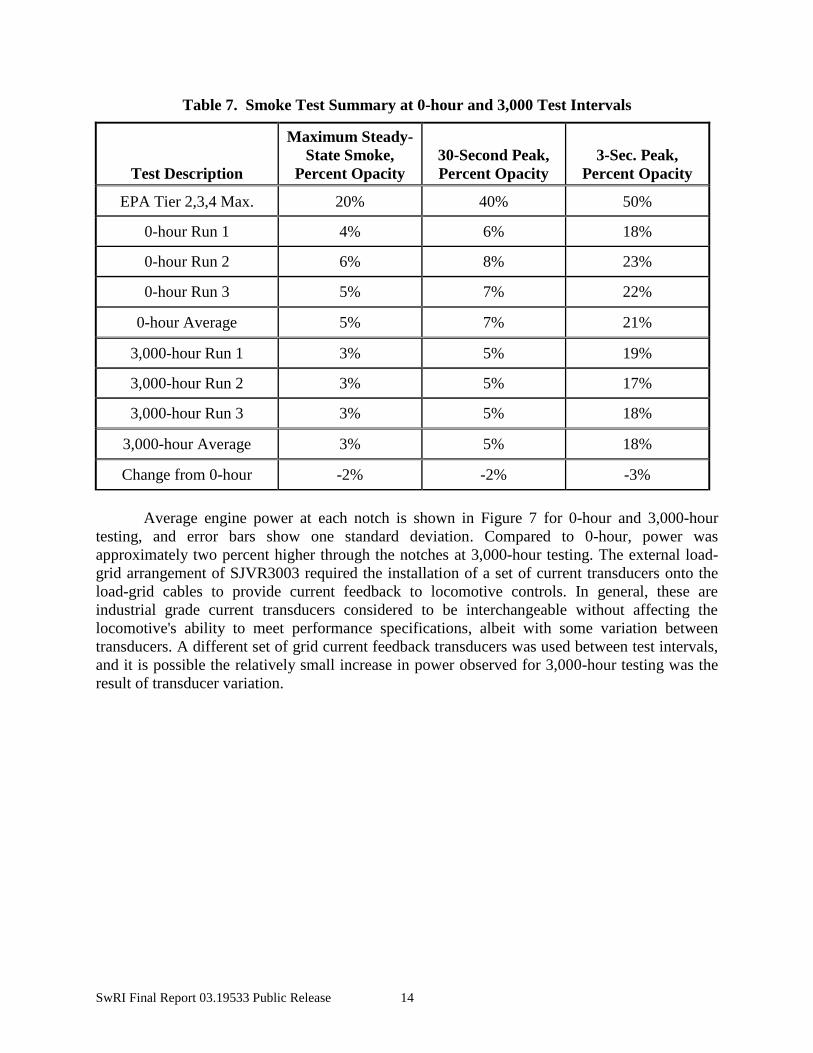
Smoke test results are listed in Table 7, along with the EPA maximum values. Smoke
opacity was well below EPA limits for all of the testing of SJVR3003, and was slightly lower at
the 3,000-hour testing interval. The average maximum steady-state, 30-second peak, and 3-
second peak smoke opacity was 5, 7, and 21 percent for 0-hour testing, and 3, 5, and 18 percent
for 3000-hour testing.
SwRI Final Report 03.19533 Public Release 14
Table 7. Smoke Test Summary at 0-hour and 3,000 Test Intervals
Test Description
Maximum Steady-
State Smoke,
Percent Opacity
30-Second Peak,
Percent Opacity
3-Sec. Peak,
Percent Opacity
EPA Tier 2,3,4 Max. 20% 40% 50%
0-hour Run 1 4% 6% 18%
0-hour Run 2 6% 8% 23%
0-hour Run 3 5% 7% 22%
0-hour Average 5% 7% 21%
3,000-hour Run 1 3% 5% 19%
3,000-hour Run 2 3% 5% 17%
3,000-hour Run 3 3% 5% 18%
3,000-hour Average 3% 5% 18%
Change from 0-hour -2% -2% -3%
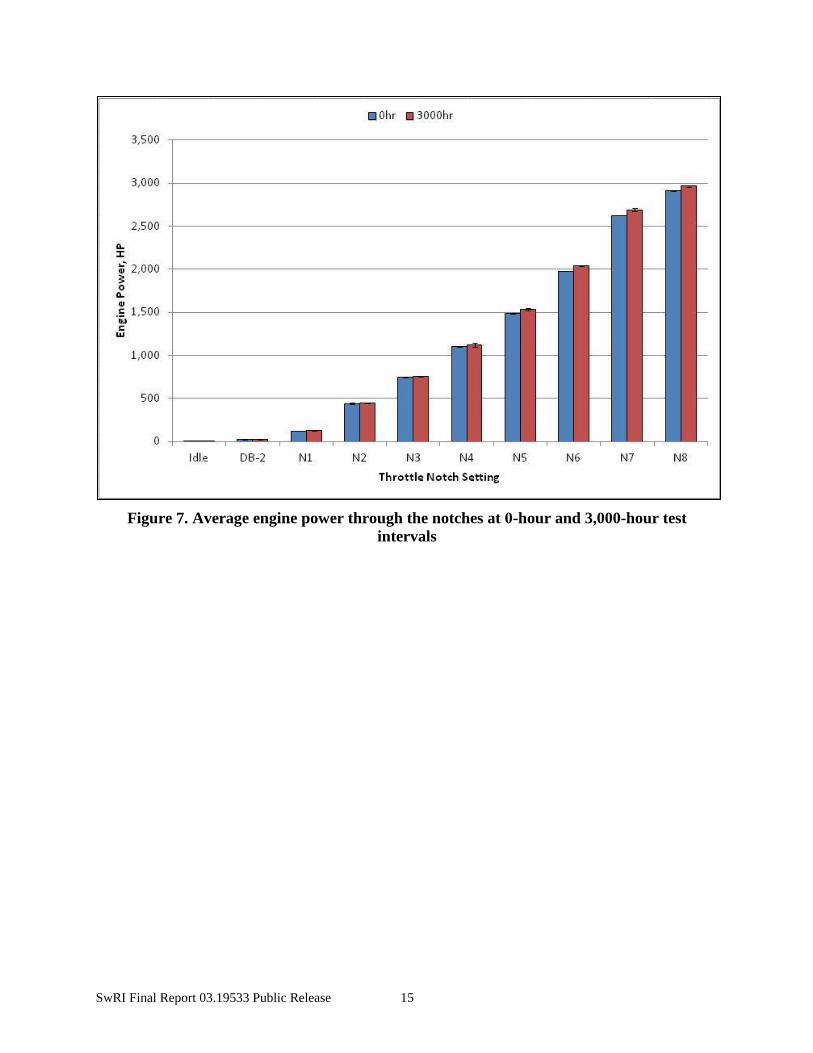
Average engine power at each notch is shown in Figure 7 for 0-hour and 3,000-hour
testing, and error bars show one standard deviation. Compared to 0-hour, power was
approximately two percent higher through the notches at 3,000-hour testing. The external load-
grid arrangement of SJVR3003 required the installation of a set of current transducers onto the
load-grid cables to provide current feedback to locomotive controls. In general, these are
industrial grade current transducers considered to be interchangeable without affecting the
locomotive's ability to meet performance specifications, albeit with some variation between
transducers. A different set of grid current feedback transducers was used between test intervals,
and it is possible the relatively small increase in power observed for 3,000-hour testing was the
result of transducer variation.
SwRI Final Report 03.19533 Public Release 15
Figure 7. Average engine power through the notches at 0-hour and 3,000-hour test
intervals