Embed Size (px)
Citation preview
Progress Report (FYP)
Assessment of Malaysian Ambient Air Quality Guidelines
By
Nur Atira Ab Halim
(15036)
January 2015
TABLE CONTENT
Contents
ABSTRACT .............................................................................................................................................................. 3
CHAPTER 1: INTRODUCTION ............................................................................................................................. 4
1.1 Project Background ................................................................................................................................... 4
1.2 Problem Statements ................................................................................................................................... 9
1.3 Objectives............................................................................................................................................... 10
1.4 Scope of Study ........................................................................................................................................ 11
CHAPTER 2: LITERATURE REVIEW ................................................................................................................ 11
2.2 Major Source Pollutants in Malaysia ...................................................................................................... 13
2.3 Health impact due to Air Pollution ......................................................................................................... 20
2.3 Malaysian Ambient Air Quality Guidelines ........................................................................................... 23
CHAPTER 3: METHODOLOGY .......................................................................................................................... 28
3.1 Introduction ............................................................................................................................................. 28
3.2 Study Area............................................................................................................................................... 28
3.3 Period of Study........................................................................................................................................ 28
3.4 Study sample ........................................................................................................................................... 28
3.5 Measurement Method for All Pollutants ................................................................................................. 29
3.6 Data Analysis .......................................................................................................................................... 29
3.7 Time Series Analysis .............................................................................................................................. 30
CHAPTER 4: RESULTS AND DISCUSSIONS .................................................................................................... 31
4.1 Introduction ............................................................................................................................................. 31
4.2 The Comparison of Ambient Air Pollutants and Malaysian Ambient Air Quality Guidelines ............... 31
4.2.1 Concentration of PM10 ................................................................................................................... 32
4.2.2 Concentration of NO2 ..................................................................................................................... 36
4.2.3 Concentration of O3 ........................................................................................................................ 39
4.2.3 Concentration of SO2 ...................................................................................................................... 42
4.3 The Proposal of New Concentration Limit in MAAQG ......................................................................... 45
CHAPTER 7: CONCLUSION AND RECOMMENDATION ............................................................................... 48
CHAPTER 8 : REFERENCES ............................................................................................................................... 49
APPENDIXES ........................................................................................................................................................ 51
ABSTRACT
Air Pollution is one the environmental risk that gives high impact to human health. Due to that concern,
in 1989 Malaysia has formulated a guideline namely Malaysian Ambient Air Quality Guidelines
(MAAQG) which contain a concentration limit for major pollutants such as ozone, carbon monoxide,
nitrogen dioxide, sulphuric dioxide, particulate matter, total suspended solid and lead at their average
time. These guidelines have been set to maintain the air quality and protect the public health. However,
there is no revision has been made so far on this guidelines since 1989 until now.This research is
intended to revisit the concentrations limit in MAAQG correspond to ozone, nitrogen dioxide,
particular matter (PM10) and sulphur dioxide to determine whether is it important or require to have a
new guidelines and validity of existing concentration limit. These selected pollutants are chosen as
they have been review by WHO which reflects the availability of new evidence on the health effects of these
pollutants and their relative importance with regard to current and future health effects of air pollution in each
WHO region (WHO,2005). This research used the secondary data from DOE that focusing in Petaling
Jaya. Petaling Jaya was selected because this place is considered as the most polluted city in Klang
Valley. The set of data which contain the concentrations of pollutants where it is collected on hourly
basis has been tabulated and analysed to assess the air pollution trend in Petaling Jaya from 2007-2011
and it is compared with the concentration limit stated in MAAQG. All the selected pollutants were
above the MAAQG at certain period of time based on hourly basis. In this study, NO2 was highly
concentrated followed by PM10, O3 and SO2. A new concentration limit for these selected pollutants has
been proposed based on the behaviour of the pollutant and WHO Air Quality Guidelines. Future
research will be undertaken to cover widened study area and implement more advance method to
reassess the MAAQG.
CHAPTER 1: INTRODUCTION
1.1 Project Background
Air comprises the composition of gases and water vapour which are nitrogen, oxygen, and other gases
that all needed to sustain living things. Nitrogen is the major gas which occupies the air by 78 %,
followed by 20.95 % oxygen, 0.93 % argon, 0.039 % carbon dioxide and small amount of other gases.
All these gases are classified as dry air composition where water vapour is excluded due to the fact that
the composition of water vapour may vary depends on locations, temperature, time, humidity and
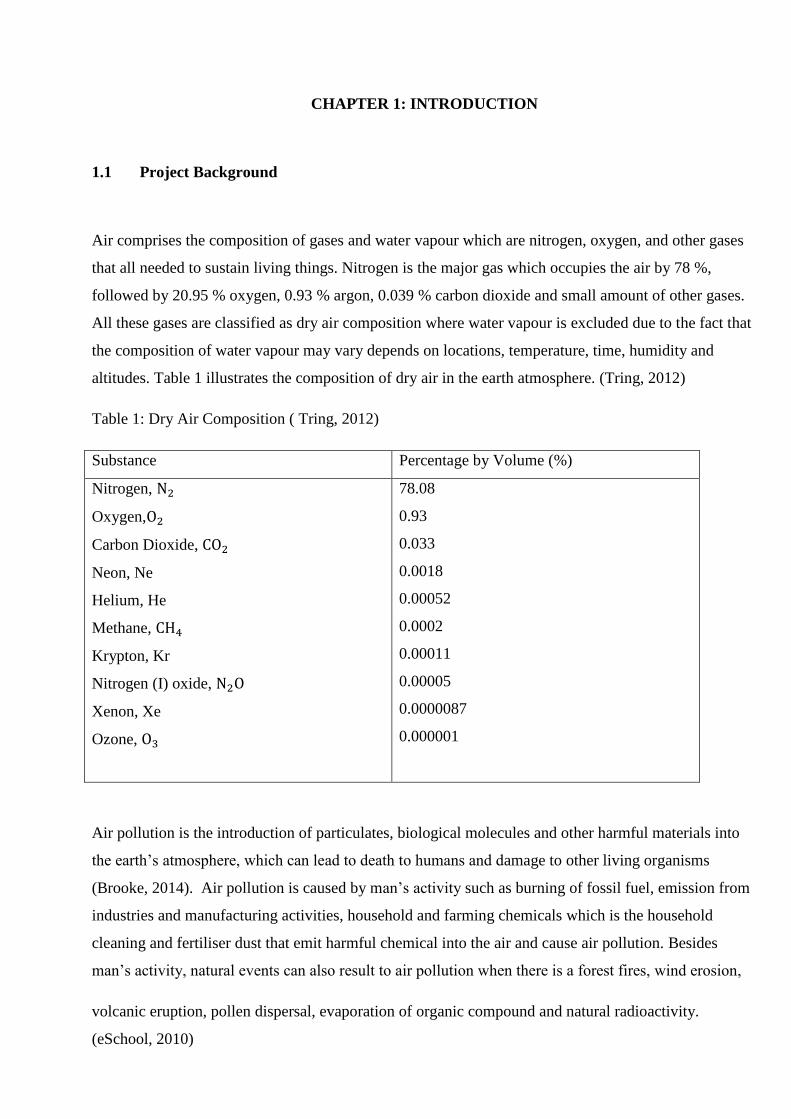
altitudes. Table 1 illustrates the composition of dry air in the earth atmosphere. (Tring, 2012)
Table 1: Dry Air Composition ( Tring, 2012)
Substance Percentage by Volume (%)
Nitrogen,
Oxygen,
Carbon Dioxide,
Neon, Ne
Helium, He
Methane,
Krypton, Kr
Nitrogen (I) oxide,
Xenon, Xe
Ozone,
78.08
0.93
0.033
0.0018
0.00052
0.0002
0.00011
0.00005
0.0000087
0.000001
Air pollution is the introduction of particulates, biological molecules and other harmful materials into
the earth‟s atmosphere, which can lead to death to humans and damage to other living organisms
(Brooke, 2014). Air pollution is caused by man‟s activity such as burning of fossil fuel, emission from
industries and manufacturing activities, household and farming chemicals which is the household
cleaning and fertiliser dust that emit harmful chemical into the air and cause air pollution. Besides
man‟s activity, natural events can also result to air pollution when there is a forest fires, wind erosion,
volcanic eruption, pollen dispersal, evaporation of organic compound and natural radioactivity.
(eSchool, 2010)
Generally, air pollutants can be divided into two categories; primary and secondary pollutants. Primary
pollutants are pollutants that are released directly into the air such as carbon monoxide (CO), oxides of
nitrogen ( ), Sulphur Oxide ( ), volatile organic compound ( ), and particulate matter.
Secondary pollutants are react with primary pollutants or emitted chemical to form in the air. Examples
of secondary pollutants are ozone, formaldehyde, peroxy acetyl nitrate, acid mist and etc. Specifically
for Malaysia, the common primary pollutants are CO, , meanwhile for the secondary pollutants are
and (DOE,2014).
Based on the major air pollutants which are exist in Malaysia such as ozone, carbon monoxide, nitrogen
dioxide, sulphur dioxide, particulate matter, total suspended particulate and lead; the Department
Environment (DOE) has set the guidelines known as Malaysian Ambient Air Quality Guidelines
(MAAQG) that defines the concentration limits of each pollutants to monitor the air quality status.
Those selected air pollutants are classified as pollutants, which might adversely affect the health and
welfare of the public health The average time listed in the guideline is varies from 1 hour to 24 hour for
different type of air pollutants which represents the period of time over which measurement is
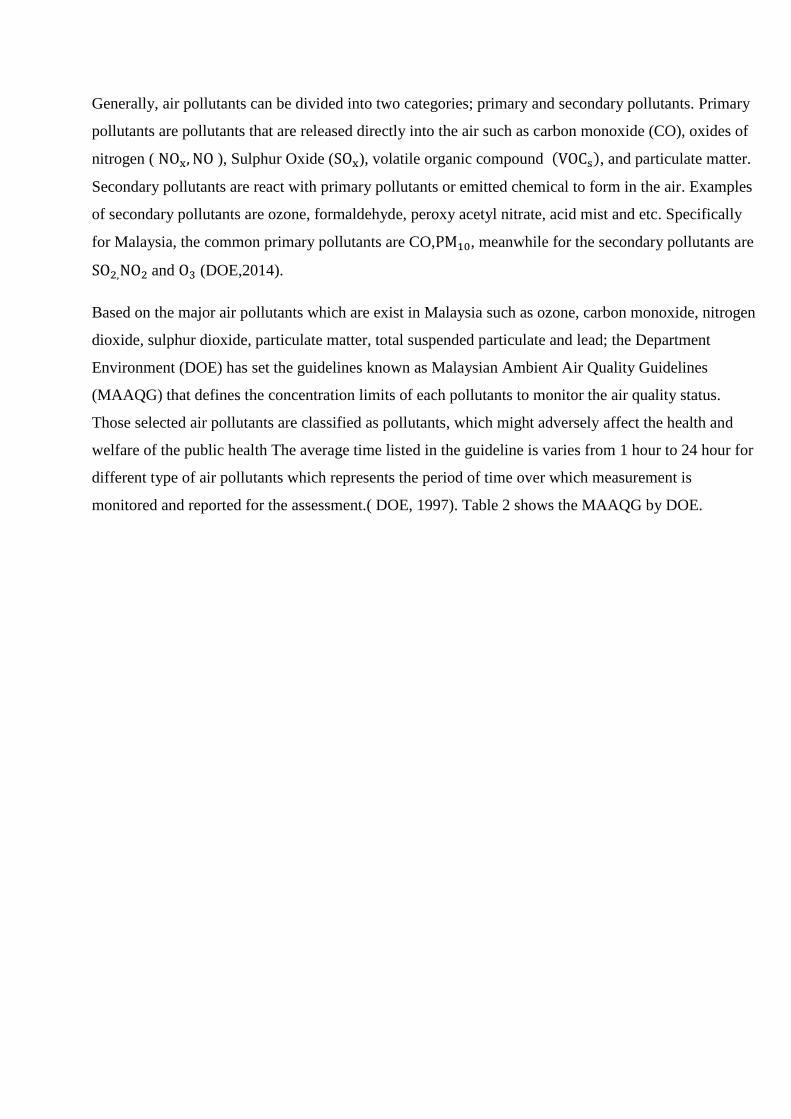
monitored and reported for the assessment.( DOE, 1997). Table 2 shows the MAAQG by DOE.
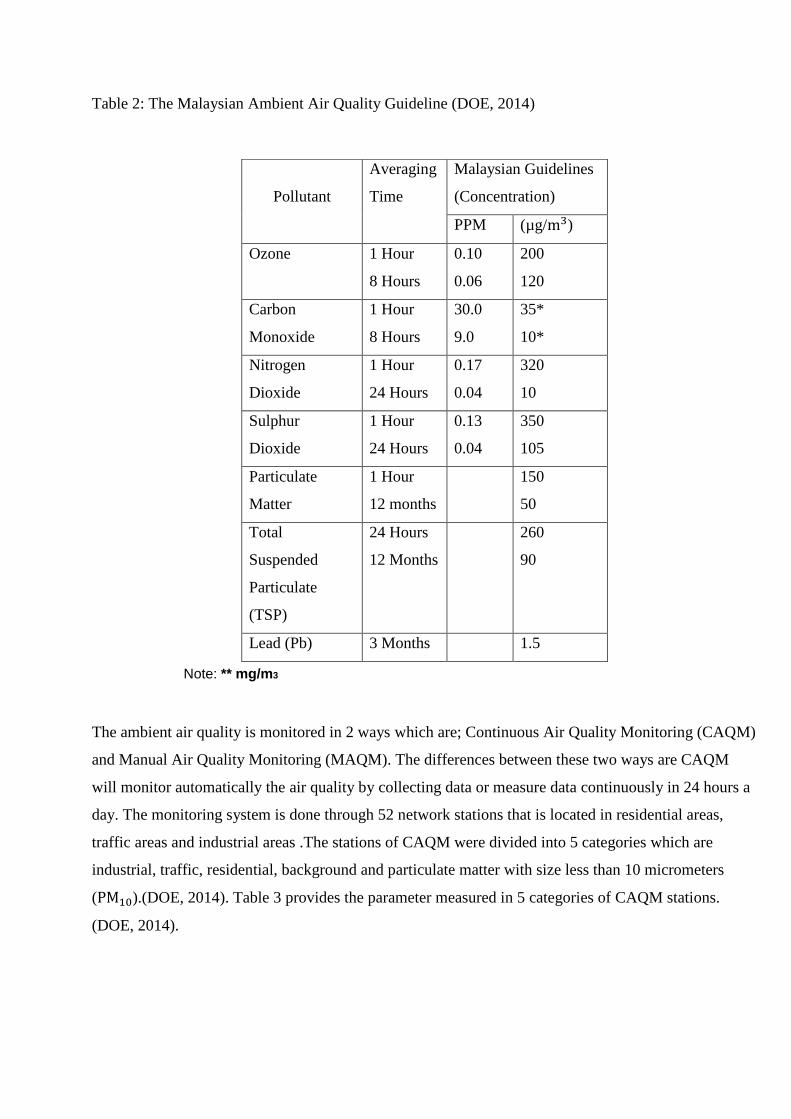
Table 2: The Malaysian Ambient Air Quality Guideline (DOE, 2014)
Note: ** mg/m3
The ambient air quality is monitored in 2 ways which are; Continuous Air Quality Monitoring (CAQM)
and Manual Air Quality Monitoring (MAQM). The differences between these two ways are CAQM
will monitor automatically the air quality by collecting data or measure data continuously in 24 hours a
day. The monitoring system is done through 52 network stations that is located in residential areas,
traffic areas and industrial areas .The stations of CAQM were divided into 5 categories which are
industrial, traffic, residential, background and particulate matter with size less than 10 micrometers
( ).(DOE, 2014). Table 3 provides the parameter measured in 5 categories of CAQM stations.
(DOE, 2014).
Pollutant
Averaging
Time
Malaysian Guidelines
(Concentration)
PPM (µg/ )
Ozone 1 Hour
8 Hours
0.10
0.06
200
120
Carbon
Monoxide
1 Hour
8 Hours
30.0
9.0
35*
10*
Nitrogen
Dioxide
1 Hour
24 Hours
0.17
0.04
320
10
Sulphur
Dioxide
1 Hour
24 Hours
0.13
0.04
350
105
Particulate
Matter
1 Hour
12 months
150
50
Total
Suspended
Particulate
(TSP)
24 Hours
12 Months
260
90
Lead (Pb) 3 Months 1.5
Table 3: Parameter measured in 5 categories ( DOE, 2014)
Meanwhile, MAQM measurement is manually collected and is delivered to the laboratory for analysis.
The High Volume Sampler located at 19 sites are used to collect pollutants such as , TSP and
heavy metals such as lead, mercury, iron, sodium and copper. For every 6 days, the samples will be
measured at once. (DOE, 2014).
In Malaysia, the status of air quality is determined by the Air Pollution Index (API). (DOE, 2014). The
air pollution index system is easily to be understood in the form of ranges of numbers compared to use
the actual air pollutant concentration. The ranges of index values are categorised to good, moderate,
unhealthy, very unhealthy, hazardous, and emergency. If the API value exceeds the value of 500, the air
is identified as hazardous and high risk to people and public health. Table 4 describes the air pollutant
index with its health effect.(DOE, 2014)
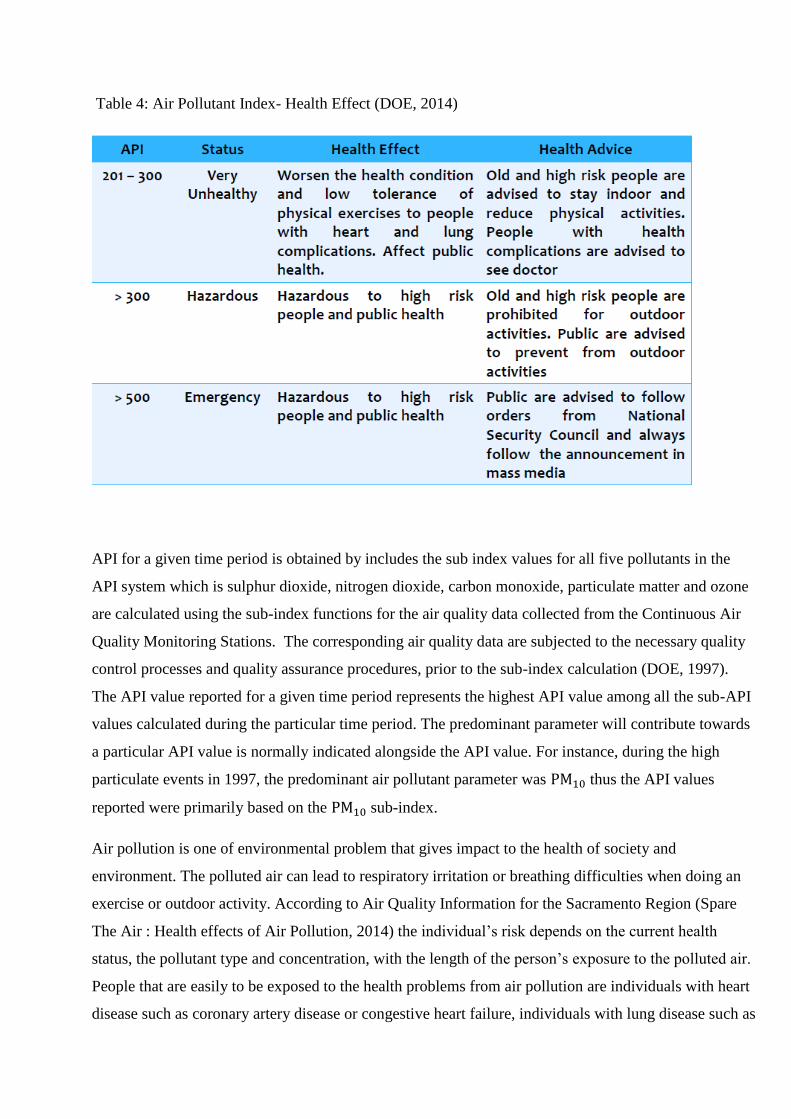
Table 4: Air Pollutant Index- Health Effect (DOE, 2014)
API for a given time period is obtained by includes the sub index values for all five pollutants in the
API system which is sulphur dioxide, nitrogen dioxide, carbon monoxide, particulate matter and ozone
are calculated using the sub-index functions for the air quality data collected from the Continuous Air
Quality Monitoring Stations. The corresponding air quality data are subjected to the necessary quality
control processes and quality assurance procedures, prior to the sub-index calculation (DOE, 1997).
The API value reported for a given time period represents the highest API value among all the sub-API
values calculated during the particular time period. The predominant parameter will contribute towards
a particular API value is normally indicated alongside the API value. For instance, during the high
particulate events in 1997, the predominant air pollutant parameter was thus the API values
reported were primarily based on the sub-index.
Air pollution is one of environmental problem that gives impact to the health of society and
environment. The polluted air can lead to respiratory irritation or breathing difficulties when doing an
exercise or outdoor activity. According to Air Quality Information for the Sacramento Region (Spare
The Air : Health effects of Air Pollution, 2014) the individual‟s risk depends on the current health
status, the pollutant type and concentration, with the length of the person‟s exposure to the polluted air.
People that are easily to be exposed to the health problems from air pollution are individuals with heart
disease such as coronary artery disease or congestive heart failure, individuals with lung disease such as
asthma, pregnant woman, outdoors workers, and children under age of 14 whose lungs are still
developing and athlete who exercise vigorously outdoors.
When air pollution reached to the high levels, it can causes immediate health problems such as health
problems which are aggravated cardiovascular and respiratory illness, damaged cells in the respiratory
system, and could added stress to lung and heart because these organs work harder to supply the body
with oxygen. At the worst cases, long term exposure to polluted air can cause permanent health effects
which accelerated aging of the lungs, loss of lung capacity, decreased lung function, development of
diseases such as asthma, bronchitis, emphysema and possibly lead to cancer (Spare The Air : Health
effects of Air Pollution, 2014) . Leh, et al. (2011) examined the rate of acute respiratory infection
(ARI) and asthma among residents in Kuala Lumpur shows that the rate of ARI and asthmatic cases
was higher in the more urbanised areas (areas that close to city centre, high density, high trip and less
green area) compared to less urbanised area. The reason of this matter is due to urbanised areas have
higher population and industrial activities which emit higher concentration of pollutants to the
atmosphere thus affecting the human‟s health.
In terms of environmental aspect, air pollution results in acidification where the chemical reactions
involving air pollutants can create acidic compound that may cause harm to buildings and vegetation.
The sulphuric acid emitted to the air may combines with the water droplets from clouds, then forming
acid rain. Acid rain that falls over an area would kill trees and harm animals. Moreover the plants also
can be destroyed as the acid rain infiltrates into the soil, thus changing the chemistry of the soil making
it unsuitable for living things that rely on soil as habitat or for nutrition. (eSchooltoday, 2010).
Meanwhile damage due to air pollution on buildings is really a serious concern since the service life of
buildings is reduced. Air pollutants deteriorate by various ways such as deposition, removal, abrasion
and direct chemical attack, indirect chemical attack and corrosion .The effect of air pollution on
materials can be seen in terms of discoloration, structural failing and soiling and material loss. Hence,
air pollution can also causes economic losses due to the damages caused since frequent operation and
maintenance is required to overcome the negative effects. ( Rao, et al, 2014)
1.2 Problem Statements
Every country has the ambient air quality standards or guideline to monitor the air quality. The
significance of having the standards or guideline is to provide a basis for protecting public health from
adverse effects of environmental pollutants, and for eliminating or reducing to a minimum,
contaminants that are known or likely to be hazardous to human health and well-being. (Schwela,
1998).
As a developing country, Malaysia has an ambient air quality guideline to protect the public health and
improving the quality of nation‟s air. Nevertheless, the guidelines for certain pollutants standards are
adopted from World Health Organization as a basis, thus it is not reflect the reality of Malaysia. This is
because Malaysia has different environmental conditions and climate as it has tropical rainforest
climate which is hot and humid throughout the year that is differ from Europe countries. Thus, certain
parameters have to be considered in developing the guidelines such as prevailing exposure levels,
environmental conditions, social, economic and cultural condition.
Malaysia has started used the guideline since 1989 and since then Malaysia has not making any revision
or review for the betterment of the guidelines. Because of that, the air pollution in Malaysia still not
achieved the desired performance especially during high particulate events. The concentration limit of
each pollutants used in the guideline was only suit at the previous years back then, and Malaysia has
undergoes rapid development in terms of social economy, population and etc. Concession, the
concentration limit stated in the guideline is not fit with the current condition.
According to Japan Time (2013), hundreds of schools in Muar have been closed due to the serious haze
which is caused by the forest fire in Indonesia. The air quality status at that time was unhealthy. History
recorded that the highest API reading was 860 during 1997-1998. The reason of the increasing air
pollution from time to time in this country might because of the guidelines is not periodically reviewed
and no serious penalties are enforced if the guidelines are not met. .Therefore it is very crucial for the
Malaysia to propose a new guideline as it can improve and enhance the air quality. This study perhaps
can assist the Malaysia authority to develop the new guidelines or even set the standards based on local
research and findings for the pollutants.
1.3 Objectives
1) To revisit the Malaysian Ambient Air Quality Guidelines respected to SO2, NO2,PM10, and O3.
2) To propose new air quality guidelines for Malaysia respected SO2, NO2, , and .
1.4 Scope of Study
This study will revisit the MAAQG and focus on four pollutants which are SO2, , , and .
The reasons of choosing these selected pollutants are due to the fact that of the affects caused on human
.Besides that these major pollutants have been examined by WHO(2005) regarding its effect on health
The study area will be focused on city centre which is mainly located at Petaling Jaya. In addition to
that, the concentrations of four pollutants from DOE for 4 years have been analysed to obtain the
overall pattern for each pollutants and compared with the ambient air quality guidelines provided by
Malaysia.
CHAPTER 2: LITERATURE REVIEW
2.1 Urbanization and Population
According to Qinsong et al. (2011) development of human civilization is greatly influenced by
urbanization process and has become significant in human progress. Moreover, negative effects could
be produced due to rapid growth of urbanization gives especially on environment pollution, and natural
resource destruction such as air pollution.
In China, there was a study conducted to assess the impact of urbanization on air environment with
urban environmental entropy model based on case study. This study conducted to investigate the effect
of urbanization on air environment based on new concept of urban environmental entropy. From this
research, the entropy concept was used to determine the relationship of the urbanization process and its
impact on the air environment.
According to Fang and Huang (2003) and Feng (2007), there are four stages in accordance to entropy
values to investigate the characteristics of the interaction relationship between urbanization and urban
ecological environment. The first stage of low entropy indicates the agriculture civilization is the
primary industry and during this stage the entropy value is above zero. The urbanization and the
development are slow. The second stage of high entropy shows it is a period of developing industrial
civilization.
The entropy value is larger than zero and increases gradually. In this stage the economy develops
extensively and urbanization lags behind the industrialization. Thus the quality of environment has a
rapid deterioration. The third stage means negative entropy as at this late stage of industrialization, the
tertiary industry (service sector) rises rapidly.
The entropy value is negative but the absolute value of entropy increases. Since the urbanization
exceeds the industrialization, the quality of environment improves gradually with urbanization
development level. The last stage indicates moderate entropy. In this stage the development direction of
future urbanization. The tertiary industry has developed dramatically and the primary industry
( agriculture, forestry, fishing and mining ) and the secondary industry ( manufacturing) continue to
decline. The entropy value is negative but the environmental quality continues to improve.
The result shown in a case study of the 17 cities in Shadong was conducted according to the urban
environmental entropy model established by the generalized thermodynamic entropy. There were 16
cities that have negative environment entropy which means there is positive correlation between the
development of urbanization and air environment. However, there was numbers of city in China that
have the fastest developing speed of urbanization, the improvement of air quality are lesser than cities
whose urbanization level is relatively lower.
Another research conducted by Barbera, et. al. (2009) to study type of environmental problem for an
urban air space where the pollutants increase due to rise in industrialization and urbanization and are
transported by the wind. This research propose hydraulic model to study effects of industrialization and
urbanization on air pollution propagation is proposed. The study is divided into 5 sections; in the first
section the lines of modelling of extended thermodynamics theory there is derived the hyperbolic model
describing the effects of industrialization and urbanization on air pollution propagation.
The second section performs a linear stability analysis around the steady state solutions, whereby in the
third section the investigation of the behaviour of the traveling wave solution admitted by the governing
system in point. In the next section, the discontinuous travelling wave solutions obtained from the
combination of the behaviour within a phase plane with the Rankine- Hugoniot shock conditions.
Finally in the last section, both continuous and discontinuous traveling solutions are stable for the PDE
model by looking at the numerical solutions of the full system. At the end of this research, the
researchers remark that the hyperbolic model they have proposed allows for analytical solutions. The
investigation of further features of the ecological problem such as the degradation of resource biomass
and the conversation of this resource by a suitable afforestation programs have been conducted by the
researches.
There are many research conducted globally to investigate the impact of urbanization on the air quality.
It shows that urbanization is one of the main factors which contributed to the deterioration of the air
quality. Same goes to Malaysia, as a development country, there will be rapid urbanization process
happened.When a country reached high population, there will be huge amount of human activities such
as emission of gas pollutant from vehicles, industries, power generation and open burning. Due to rapid
urbanize process; the air pollution of Malaysia is worsening.
The population of Malaysia during 2006 is about 26,748,000 and had the average population growth
rate of 2.6 % since 1999 (EPU,2006 ). Meanwhile, during 2004 the urban population was about 62.8%.
Meanwhile the urban population has reached 62.8 % in 2004. In 2009, the total population of Malaysia
is estimated at 27.9 million (“Malaysian Population- Demographics,” 2014). The latest Malaysian
population reported in The Star Online (2014) is roughly at 30 million. It is expected that the number of
residents in Malaysia is growing and this can lead to bigger deterioration of the air quality if the serious
mitigation measure is not taken.
2.2 Major Source Pollutants in Malaysia
Air pollution come from several sources which are from localized and transboundary. Sources come
from localized such as stationary and mobile. Afroz et al.( 2003) and Hashim et al. (2004) claimed the
major source of pollutant in Malaysia was the emission from the mobile sources such as vehicles,
airplanes and engine equipment which contributing to at least 70 %-75 % of the total air pollution.
Others second largest group belongs to the sources from stationary; those that came from cement plants,
power plants, industrial waste incinerators, iron and steel mills from suburban areas and industrial,
emission of dusts from urban construction and quarries, burning of old oil palm trees in plantations and
open burning at some solid waste dumpsites.
This type of sources contributed about 20 %-25 %. Transboundary pollutants are open biomass burning
from Indonesia which produces smoke haze has become annual phenomenon and lead to deterioration
in the local air quality in Malaysia ( Mahmud, 2013). The transported air pollution from forest fire not
only happened in this country but also in other countries in the region as well such as Brunei and
Singapore. (Hashim, 2004)
Basically there are five (5) air pollutants which consist of particulate matter ( ) ozone ( ),sulphur
oxide ( ), nitrogen dioxide ( )and carbon monoxide (CO) in which they were monitored
continuously at 52 locations(DOE, 2014) .
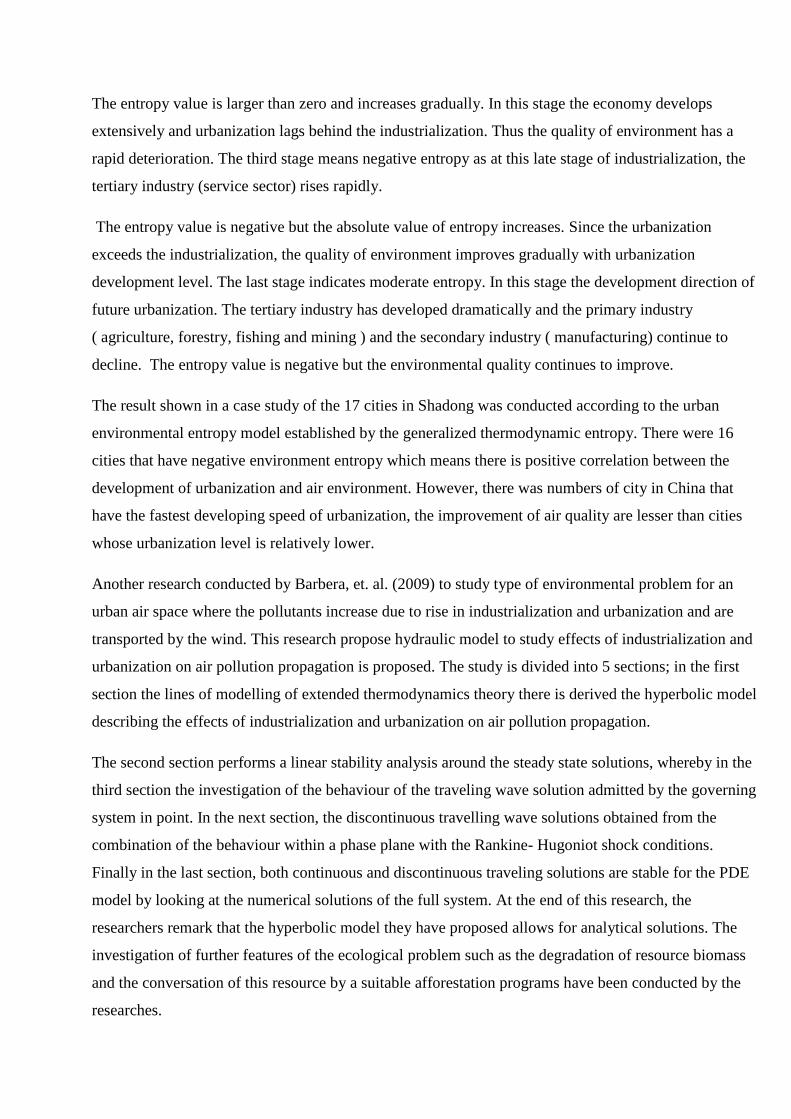
According to DOE (2014), the largest pollution source in Malaysia is still from motor vehicles back
from 1999 to 2013. This category of sources emitted carbon monoxide, CO gas approximately at 95 %
in the year of 2013. There was a slight increase of 0.4 % CO level in 2013, compared to 2012. Despite
of the large amount of emission accounted, the levels recorded were still compliance to the Malaysian
Ambient Air Quality Guidelines (DOE, 2014). Based on this findings, it is proven that the trend of CO
concentration remain constant since the year back in 1999 to 2013.
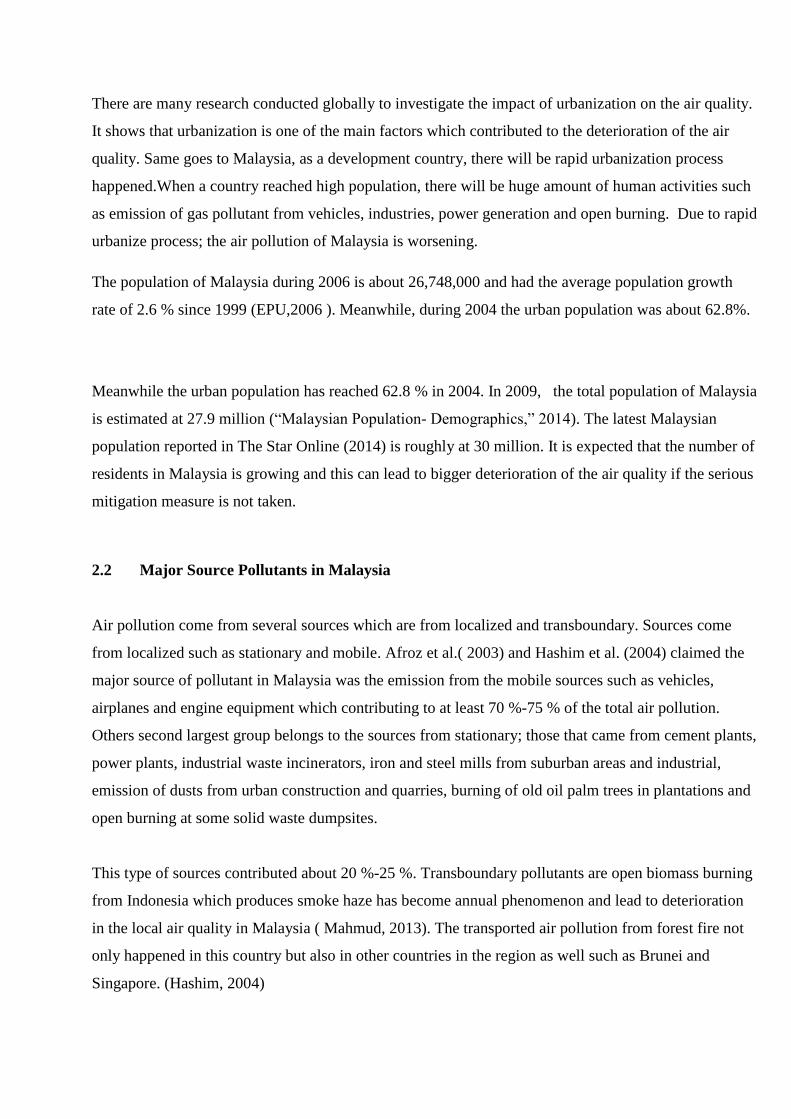
Meanwhile, the nitrogen dioxide, , concentration remains high in urban and industrial areas
because of the significant increase in the number of motor vehicles and combustion processes. The
power plants was contributed about 62 % , followed by 26 % from motor vehicles, 6 % from industries
and 7 % from other sources. The annual average concentration of in the ambient air from 1999 to
2013 remains almost constant and well below the Malaysia Ambient Air Quality guidelines
(DOE,2014). Thus, there is no significant improvement has been shown in terms of the concentration
for these type of pollutants and no any effective mitigation measures that has been taken to overcome
this problem. Figure 1 and 2 illustrates CO and concentrations from year 1999 to 2013.
Figure 1: The concentrations of CO from year 1999 to 2013 (DOE,2014)
Figure 2: The concentrations of NO2 from year 1999 to 2013 ( DOE, 2014)
Figure 2 : Concentrations of from the year 1999 to 2013 (DOE,2014)
Whereas the emission of , DOE reported in 2014, the annual average concentration indicates a
declining trend between 1999 and 2013 and it is below the limit of 0.04 ppm as formulated in the
Malaysian Ambient Air Quality Guidelines. The reasons for this good changes are because the use of
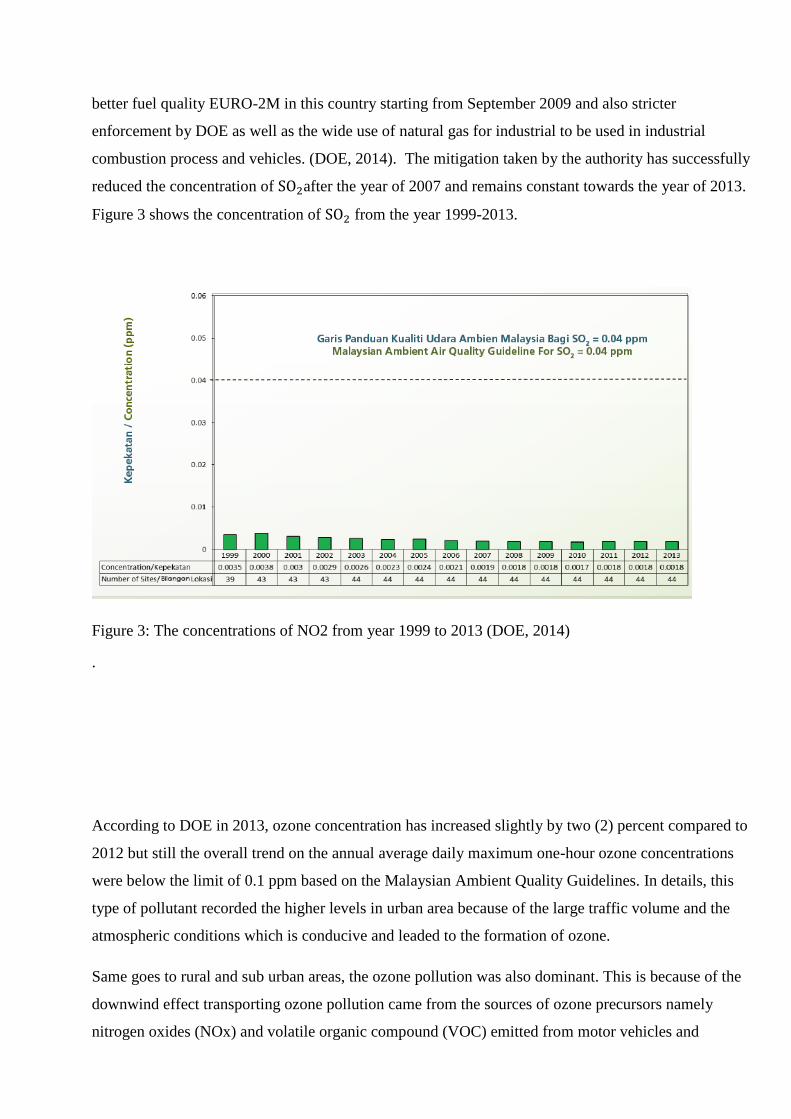
better fuel quality EURO-2M in this country starting from September 2009 and also stricter
enforcement by DOE as well as the wide use of natural gas for industrial to be used in industrial
combustion process and vehicles. (DOE, 2014). The mitigation taken by the authority has successfully
reduced the concentration of after the year of 2007 and remains constant towards the year of 2013.
Figure 3 shows the concentration of from the year 1999-2013.
Figure 3: The concentrations of NO2 from year 1999 to 2013 (DOE, 2014)
.
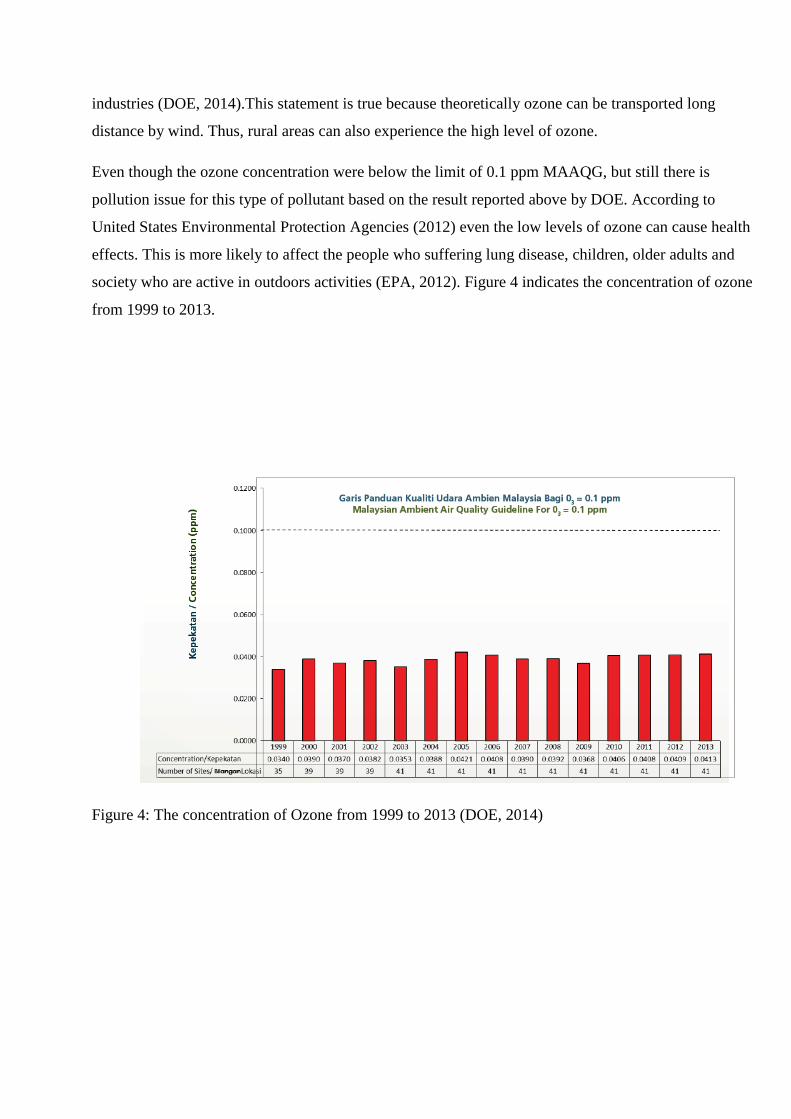
According to DOE in 2013, ozone concentration has increased slightly by two (2) percent compared to
2012 but still the overall trend on the annual average daily maximum one-hour ozone concentrations
were below the limit of 0.1 ppm based on the Malaysian Ambient Quality Guidelines. In details, this
type of pollutant recorded the higher levels in urban area because of the large traffic volume and the
atmospheric conditions which is conducive and leaded to the formation of ozone.
Same goes to rural and sub urban areas, the ozone pollution was also dominant. This is because of the
downwind effect transporting ozone pollution came from the sources of ozone precursors namely
nitrogen oxides (NOx) and volatile organic compound (VOC) emitted from motor vehicles and
industries (DOE, 2014).This statement is true because theoretically ozone can be transported long
distance by wind. Thus, rural areas can also experience the high level of ozone.
Even though the ozone concentration were below the limit of 0.1 ppm MAAQG, but still there is
pollution issue for this type of pollutant based on the result reported above by DOE. According to
United States Environmental Protection Agencies (2012) even the low levels of ozone can cause health
effects. This is more likely to affect the people who suffering lung disease, children, older adults and
society who are active in outdoors activities (EPA, 2012). Figure 4 indicates the concentration of ozone
from 1999 to 2013.
Figure 4: The concentration of Ozone from 1999 to 2013 (DOE, 2014)
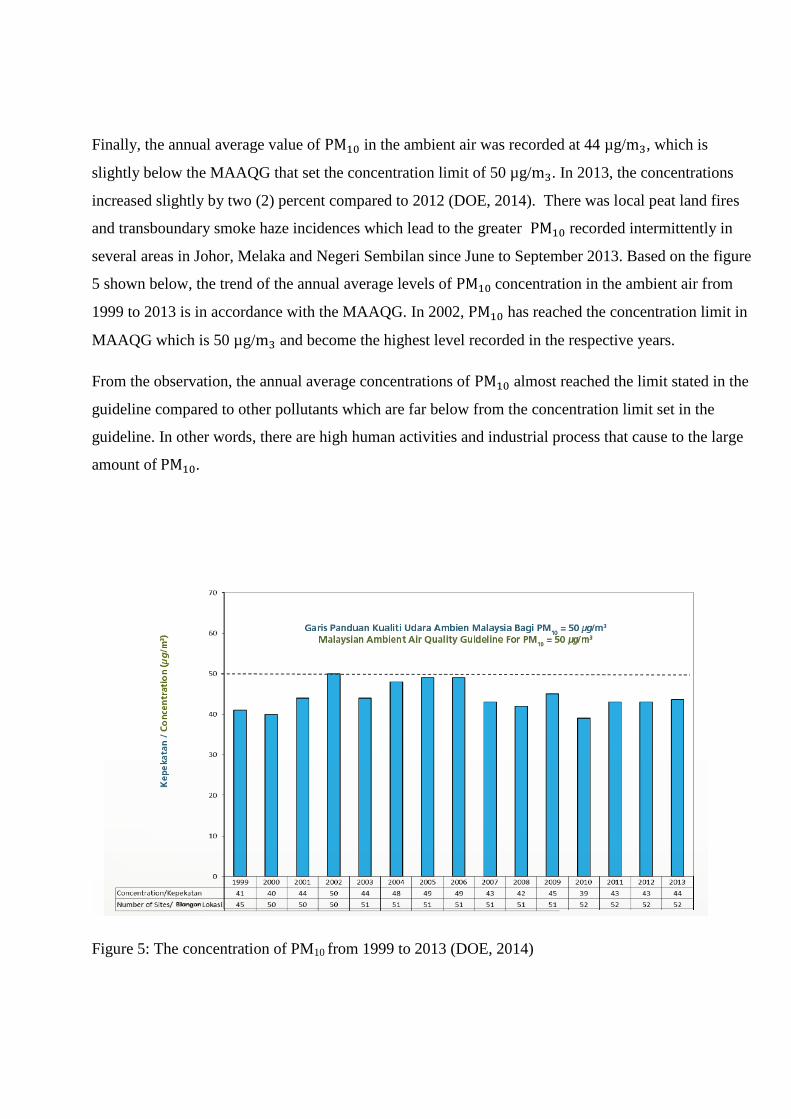
Finally, the annual average value of in the ambient air was recorded at 44 µg/ , which is
slightly below the MAAQG that set the concentration limit of 50 µg/ . In 2013, the concentrations
increased slightly by two (2) percent compared to 2012 (DOE, 2014). There was local peat land fires
and transboundary smoke haze incidences which lead to the greater recorded intermittently in
several areas in Johor, Melaka and Negeri Sembilan since June to September 2013. Based on the figure
5 shown below, the trend of the annual average levels of concentration in the ambient air from
1999 to 2013 is in accordance with the MAAQG. In 2002, has reached the concentration limit in
MAAQG which is 50 µg/ and become the highest level recorded in the respective years.
From the observation, the annual average concentrations of almost reached the limit stated in the
guideline compared to other pollutants which are far below from the concentration limit set in the
guideline. In other words, there are high human activities and industrial process that cause to the large
amount of .
Figure 5: The concentration of PM10 from 1999 to 2013 (DOE, 2014)
According D. Dominick et al. (2012) in his research: Spatial assessment of air quality patterns in
Malaysia using multivariate analysis, was the higher contributor of the air pollution in the
respective study areas. This is true because the result from the DOE also shows that almost hit
the concentration limit regulated in the MAAQG compared to other pollutants. The study conducted
aims to study the possible sources of air pollutants and the spatial patterns within the eight selected
Malaysian air monitoring stations in two year database (2008-2009). The analysis named multivariate
analysis was applied on the database. It incorporated Hierarchical Agglomerative Cluster Analysis
(HACA) to ingress the spatial patterns, whilst Principal Component Analysis (PCA) to identify the
main sources of the air pollution and Multiple Linear Regression (MLR) to determine the percentage
contribution of each air pollutant.
From this research, the result of HAZA grouped the eight monitoring stations into three different
clusters according to the characteristics of the air pollutants and meteorological parameters. Meanwhile
the PCA analysis showed that the main sources of air pollution were emissions from motor vehicles,
areas of high population density, industry and aircraft. The MLR analysis shows that the main pollutant
which contributed to variability in the API at all stations was rather than any other pollutants
(O3,NO2 ,CO and SO2). On top of that, further MLR analysis illustrates the main air pollutant which
influenced the high concentration of was carbon monoxide (CO).
The reasons for this because of the combustion processes particularly cause by motor vehicles. D.
Dominick et al. ( 2012 ) recommended that the blue print should be implement as it can reduce motor
vehicle exhaust emission as well as in gas emission from industry, factories and other anthropogenic
sources. The authorities related and agencies could collaborate to produce the blue print which is if it is
effectively implemented it can lead to a cleaner and healthier environment in the long run.
2.3 Health impact due to Air Pollution
Based on findings from section 2.2, it can be concluded that all the pollutants never been exceed the
concentration limit stated in the guidelines. However it would be different if the concentration of
pollutants is focused on Klang Valley. There was a study showed that during non-haze episodes, total
suspended particulate matter was the main pollutant and its concentration at a few sites in the Klang
Valley often exceeded the MAAQG (1989). (Afroz, R et al., 2003). Furthermore, even though the
pollutants were below the MAAQG, it was found that high impacts of the pollutants on cardiovascular
and respiratory morbidity at levels below the guidelines stated in MAAQG. (Hisham, 2004)
This section will discuss in what extent the air pollution in Malaysia has affected the public health. Air
pollution is a major environmental risk to health (WHO, 2014). If the air pollution levels could be
reduced, some burden disease such as heart disease, stroke, lung cancer and both chronic and acute
respiratory diseases including asthma can be decreased. Additionally, it can also lead to death. WHO
(2014) reported ambient air in both cities and rural areas was estimated to cause 3.7 million premature
deaths worldwide in 2012. Some 88 % of those premature deaths occurred in low and middle income
countries, and the greatest number in the WHO Western Pacific and South East Asia regions.
According Malaysian Health Fact 2014 (table 6), the data showed disease of respiratory system leading
as ten principal causes of hospitalisation in private hospitals which located at the second highest causes
of death in MoH hospitals in 2013. Table 6 and 7 below illustrates the ten principal causes of
hospitalisation in MoH & private hospital, 2013 and admissions and outpatient attendances, 2013
respectively.
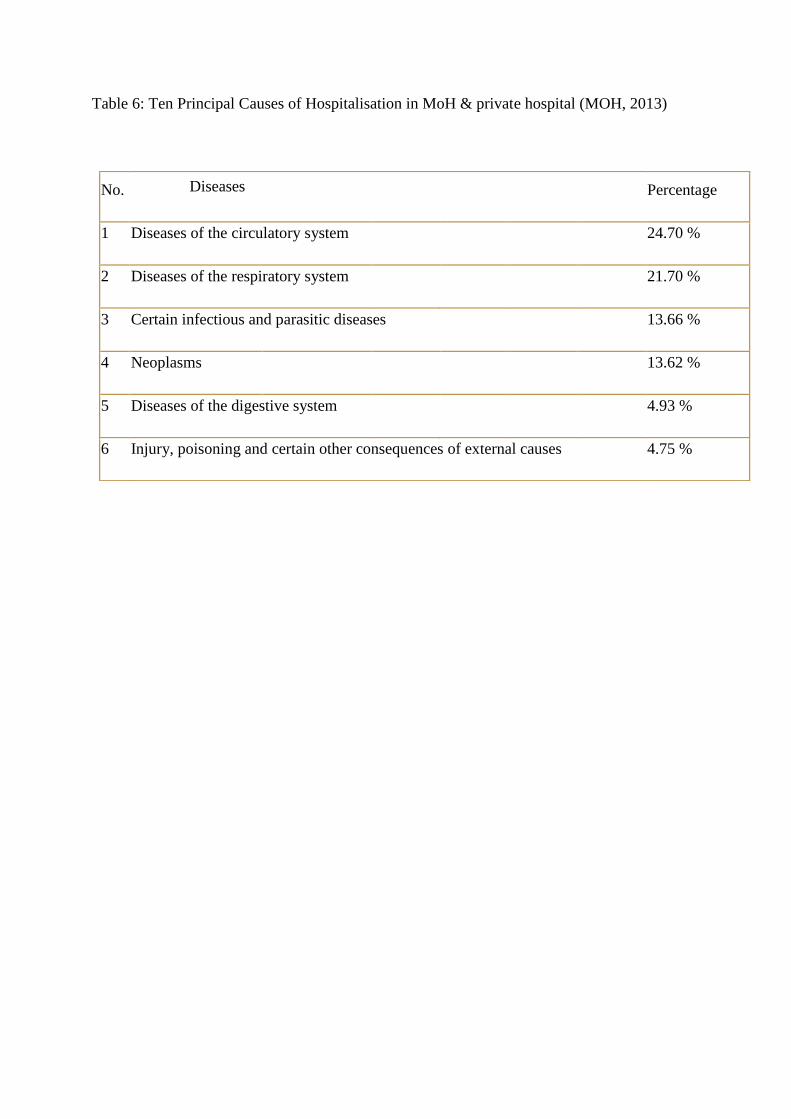
Table 6: Ten Principal Causes of Hospitalisation in MoH & private hospital (MOH, 2013)
No. Diseases Percentage
1 Diseases of the circulatory system 24.70 %
2 Diseases of the respiratory system 21.70 %
3 Certain infectious and parasitic diseases 13.66 %
4 Neoplasms 13.62 %
5 Diseases of the digestive system 4.93 %
6 Injury, poisoning and certain other consequences of external causes 4.75 %
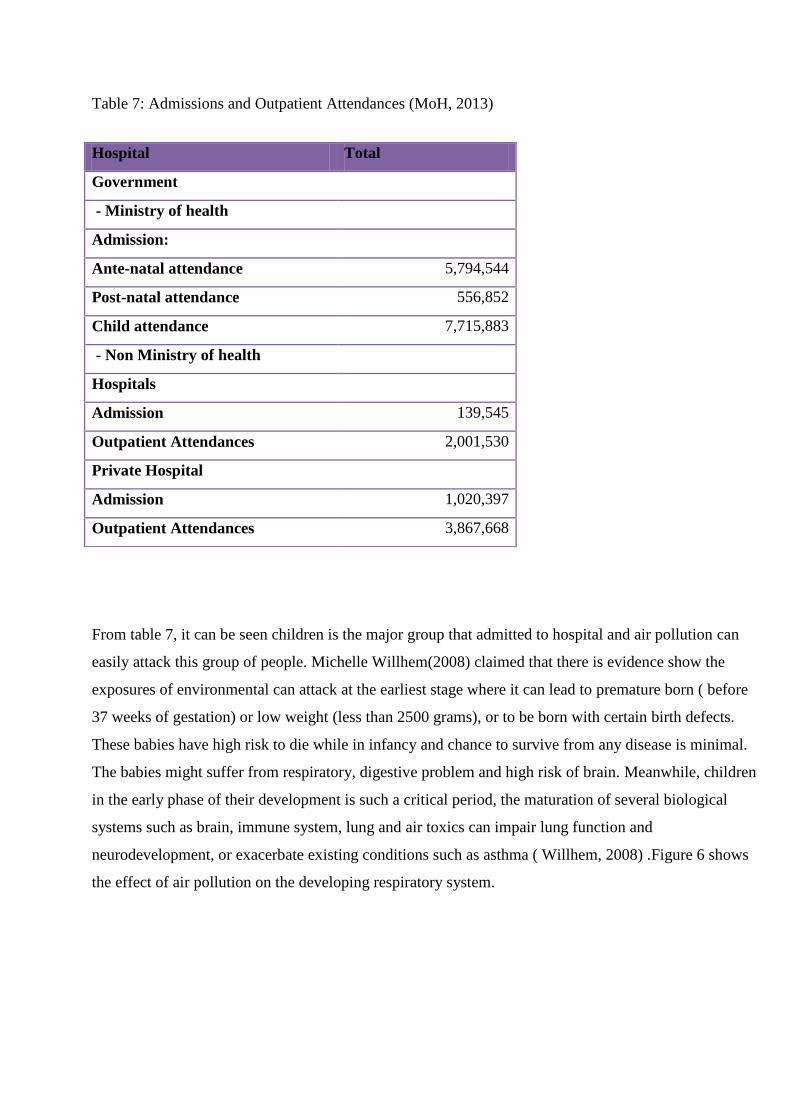
Table 7: Admissions and Outpatient Attendances (MoH, 2013)
From table 7, it can be seen children is the major group that admitted to hospital and air pollution can
easily attack this group of people. Michelle Willhem(2008) claimed that there is evidence show the
exposures of environmental can attack at the earliest stage where it can lead to premature born ( before
37 weeks of gestation) or low weight (less than 2500 grams), or to be born with certain birth defects.
These babies have high risk to die while in infancy and chance to survive from any disease is minimal.
The babies might suffer from respiratory, digestive problem and high risk of brain. Meanwhile, children
in the early phase of their development is such a critical period, the maturation of several biological
systems such as brain, immune system, lung and air toxics can impair lung function and
neurodevelopment, or exacerbate existing conditions such as asthma ( Willhem, 2008) .Figure 6 shows
the effect of air pollution on the developing respiratory system.
Hospital Total
Government
- Ministry of health
Admission:
Ante-natal attendance 5,794,544
Post-natal attendance 556,852
Child attendance 7,715,883
- Non Ministry of health
Hospitals
Admission 139,545
Outpatient Attendances 2,001,530
Private Hospital
Admission 1,020,397
Outpatient Attendances 3,867,668
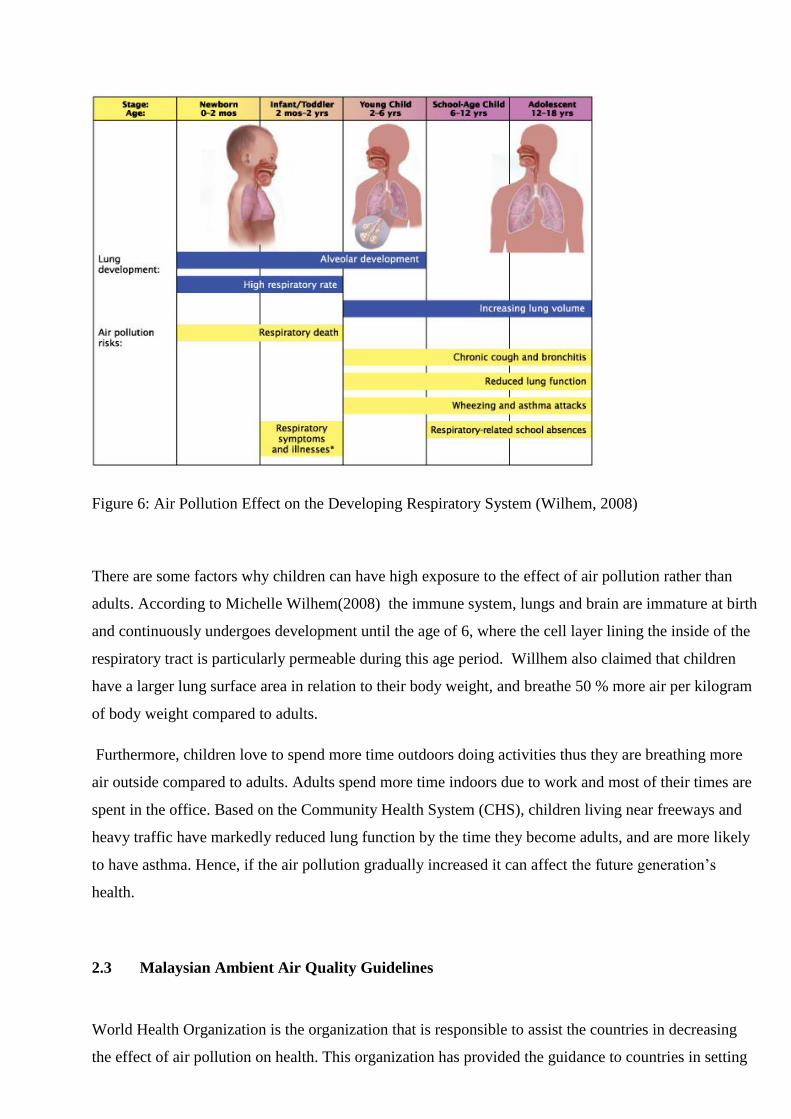
Figure 6: Air Pollution Effect on the Developing Respiratory System (Wilhem, 2008)
There are some factors why children can have high exposure to the effect of air pollution rather than
adults. According to Michelle Wilhem(2008) the immune system, lungs and brain are immature at birth
and continuously undergoes development until the age of 6, where the cell layer lining the inside of the
respiratory tract is particularly permeable during this age period. Willhem also claimed that children
have a larger lung surface area in relation to their body weight, and breathe 50 % more air per kilogram
of body weight compared to adults.
Furthermore, children love to spend more time outdoors doing activities thus they are breathing more
air outside compared to adults. Adults spend more time indoors due to work and most of their times are
spent in the office. Based on the Community Health System (CHS), children living near freeways and
heavy traffic have markedly reduced lung function by the time they become adults, and are more likely
to have asthma. Hence, if the air pollution gradually increased it can affect the future generation‟s
health.
2.3 Malaysian Ambient Air Quality Guidelines
World Health Organization is the organization that is responsible to assist the countries in decreasing
the effect of air pollution on health. This organization has provided the guidance to countries in setting
their national ambient air quality standards through the WHO Ambient Air Quality Guidelines (TWG,
2009). Malaysia is one of the developed countries that adopted the WHO Ambient Air Quality
Guidelines in providing its own guidelines. Malaysia has formulated the guidelines since 1989 with
several major of air pollutants and its concentration limit but since then, there is none revision has been
made so far based on the guidelines formulated in 1989 with current guidelines used.
Ambient air quality standards identify individual pollutants and the concentrations at which they
become harmful to the public health and the environment. The standards are typically set without
regard to economic feasibility for attainment. Instead, they focus on public health, including the health
of „„sensitive‟‟ populations
such as asthmatics, children and the elderly and public welfare, including protection against decreased
visibility and damage to animals, crops, vegetation, and aquatic
resources, and buildings. (Afroz, R et.al, 2003) .
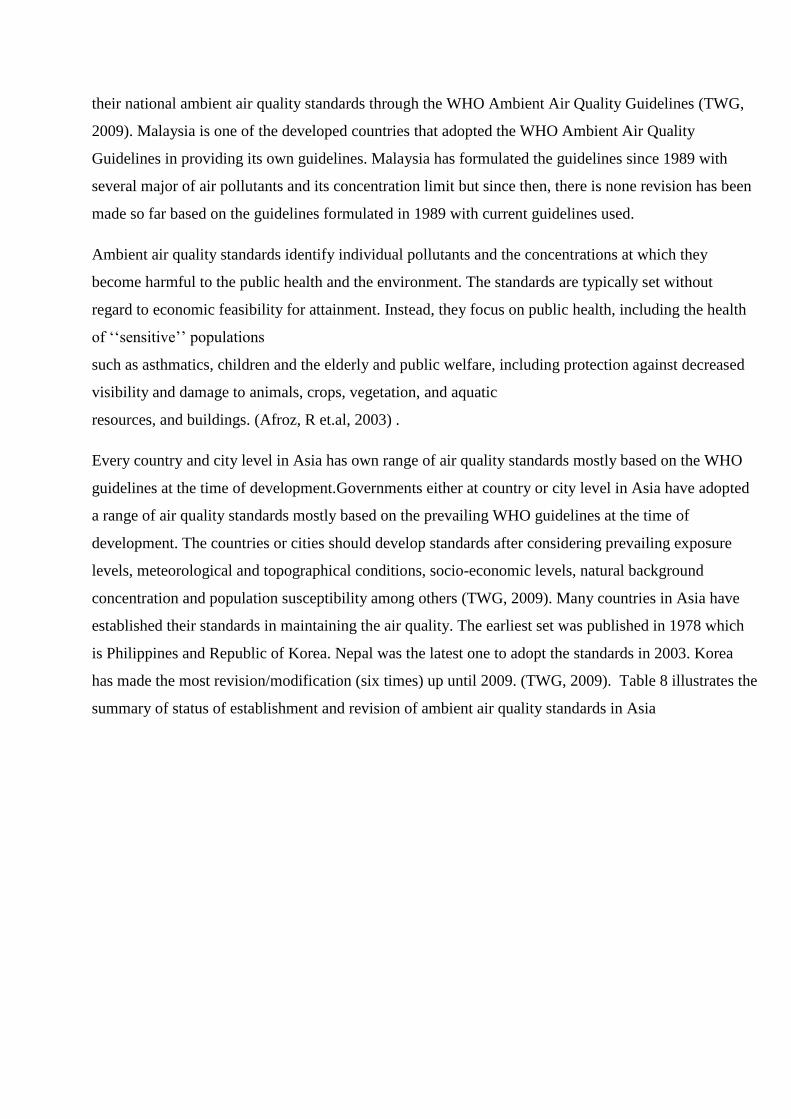
Every country and city level in Asia has own range of air quality standards mostly based on the WHO
guidelines at the time of development.Governments either at country or city level in Asia have adopted
a range of air quality standards mostly based on the prevailing WHO guidelines at the time of
development. The countries or cities should develop standards after considering prevailing exposure
levels, meteorological and topographical conditions, socio-economic levels, natural background
concentration and population susceptibility among others (TWG, 2009). Many countries in Asia have
established their standards in maintaining the air quality. The earliest set was published in 1978 which
is Philippines and Republic of Korea. Nepal was the latest one to adopt the standards in 2003. Korea
has made the most revision/modification (six times) up until 2009. (TWG, 2009). Table 8 illustrates the
summary of status of establishment and revision of ambient air quality standards in Asia
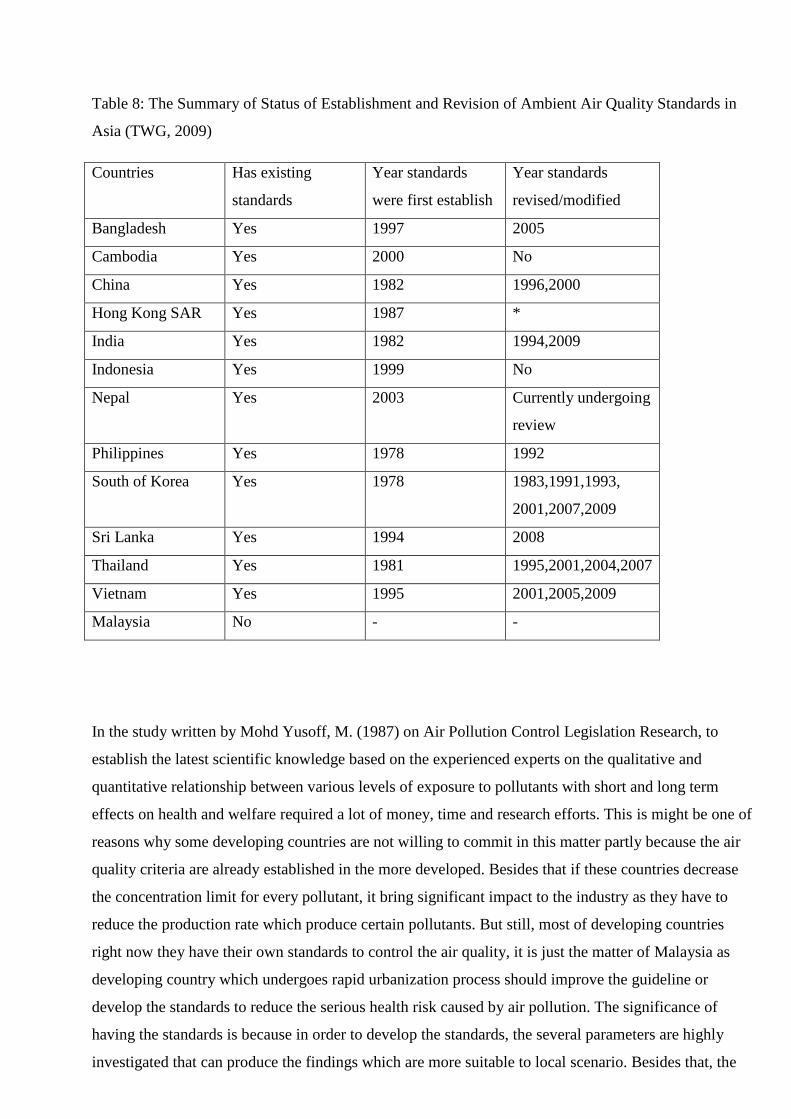
Table 8: The Summary of Status of Establishment and Revision of Ambient Air Quality Standards in
Asia (TWG, 2009)
Countries Has existing
standards
Year standards
were first establish
Year standards
revised/modified
Bangladesh Yes 1997 2005
Cambodia Yes 2000 No
China Yes 1982 1996,2000
Hong Kong SAR Yes 1987 *
India Yes 1982 1994,2009
Indonesia Yes 1999 No
Nepal Yes 2003 Currently undergoing
review
Philippines Yes 1978 1992
South of Korea Yes 1978 1983,1991,1993,
2001,2007,2009
Sri Lanka Yes 1994 2008
Thailand Yes 1981 1995,2001,2004,2007
Vietnam Yes 1995 2001,2005,2009
Malaysia No - -
In the study written by Mohd Yusoff, M. (1987) on Air Pollution Control Legislation Research, to
establish the latest scientific knowledge based on the experienced experts on the qualitative and
quantitative relationship between various levels of exposure to pollutants with short and long term
effects on health and welfare required a lot of money, time and research efforts. This is might be one of
reasons why some developing countries are not willing to commit in this matter partly because the air
quality criteria are already established in the more developed. Besides that if these countries decrease
the concentration limit for every pollutant, it bring significant impact to the industry as they have to
reduce the production rate which produce certain pollutants. But still, most of developing countries
right now they have their own standards to control the air quality, it is just the matter of Malaysia as
developing country which undergoes rapid urbanization process should improve the guideline or
develop the standards to reduce the serious health risk caused by air pollution. The significance of
having the standards is because in order to develop the standards, the several parameters are highly
investigated that can produce the findings which are more suitable to local scenario. Besides that, the
stringent penalties are going to be enforced if there the concentration exceeds the limit stated in the
standards because it is legally bind. Table 6 display the summary of ambient air quality standards in
certain Asian countries including Malaysia.
Table 9: Ambient Air Quality Standards in certain Asian countries (µg/ ) (WHO, 2014)
Countries CO(„000) Pb
24-h
r
Annual
24-h
r
Annual
24-h
r
Annual
24-h
r
Annual
1-h
r
8-h
r
1-h
r
8-h
r
Annual
Bangladesh 65 50 150 50 365 80 - 100 235 157 40 10 0.5
Cambodia - - - - 300 100 100 - 200 - 40 10 0.5
China
Grade I
- - 50 40 50 20 80 40 160 - 10 - 1
Chine
Grade II
- - 150 100 150 60 120 80 200 - 10 - 1
China
Grade III
- - 250 150 250 100 120 80 200 - 20 - 1
Hong Kong
SAR
- - 180 55 350 80 150 80 240 - 30 10 -
Sri Lanka 50 25 100 50 80 - 100 - 200 - 30 10 -
Thailand - - 120 50 300 100 - - 200 140 34.2 10.3 -
India1 60 40 100 60 80 50 80 40 180 100 4 2 0.5
PM2.5 PM10 SO2 NO2 O3 CO(„000) Pb
24 H
our
Annual
24 H
our
Annual
24 H
our
Annual
24 H
our
Annual
1 H
our
8 H
our
1 H
our
8 H
our
Annual
India2 60 40 100 60 80 20 80 30 180 100 4 2 0.5
Indonesia* - - 150 - 365 60 150 100 235 - 30 - 1
Philippines - - 150 60 180 80 150 - 140 60 35 10 1
Nepal* - - 120 - 70 50 80 40 - - - 10 0.5
Republic of
Korea
- - 100 50 131 52 113 56 196 118 28.6 10.3 0.5
Vietnam - - 150 50 125 50 - 40 - 120 30 10 0.5
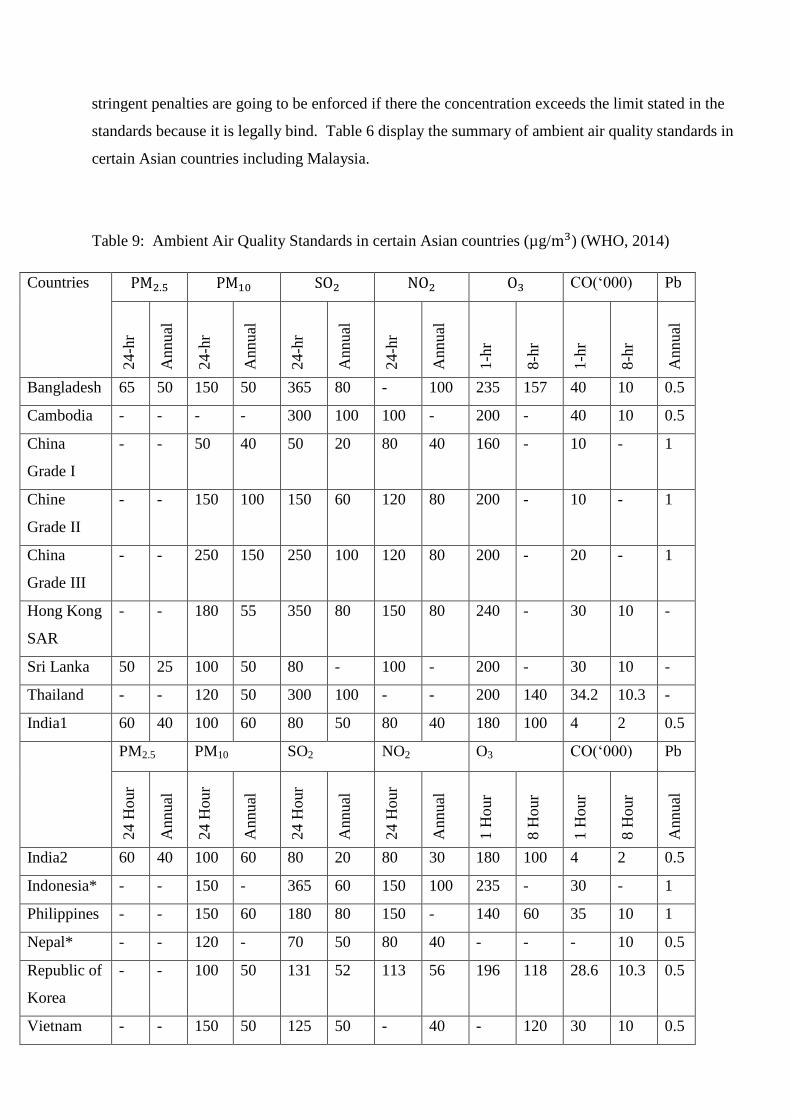
Malaysia - - 150 50 105 350* 10 320* 200 120 35 - 1.5
Notes: *Based on 1 hr. averaging time; India 1: Residential, industrial, rural and other area; India 2:
Ecological sensitive area; China: Grade I is for Natural Protection Area and Other areas which need
special protection; China Grade II is for Residential, Commercial, Industrial and Rural Area
Based on table 9, the concentration limit of ambient air guidelines for Malaysia is quite lenient
compared to other countries. For instance the concentration limit of for Malaysia is lenient
compared to Thailand. Thailand is also one of the developed countries and has total population
approximately about 30 million and undergoes rapid urbanization which is greater than Malaysia.
CHAPTER 3: METHODOLOGY
3.1 Introduction
The ambient guidelines for major air pollutants have been formulated in the MAAQG as listed in table
2. In this study, there are four selected pollutants to be examined for assessment namely sulphur
dioxide, particulate matter (PM10), ozone and nitrogen dioxide. These four pollutants are selected
because they lead to biggest impact on public health especially on cardiovascular and respiratory
system. This study intended to revisit the Malaysian Ambient Air Quality Guidelines respected to SO2,
No2, 3 and PM10 and their dose-response relationship on human health effects. This can help to
determine whether it is important to develop new guidelines and to check the validity of the guidelines
itself. At the end of this research, a new concentration limit of the selected pollutants is formulated.
3.2 Study Area
Petaling Jaya is chosen as selected study area. The main reason for this selection is because Petaling
Jaya has experienced the worst air pollution in the Klang Valley, the largest and highest populated
urban area in Malaysia. The air monitoring station in Petaling Jaya is situated at Sri Petaling Primary
School, Petaling Jaya; Selangor. This area is surrounded by commercial areas, industries, residential
and having high volume of traffic road.
3.3 Period of Study
The study period required in this research will be for four years starting from 2007 to 2010 from
January to December. That particular study period was in 4 years due to limited and time constraint for
the research that only carried out for seven months.
3.4 Study sample
In this research, the secondary data is obtained from Department of Environment (DOE). The study
sample is all concentrations data of the selected pollutant ( , SO2, , PM10) taken from 6
continuous air quality monitoring (CAQM) stations located throughout the Klang Valley.
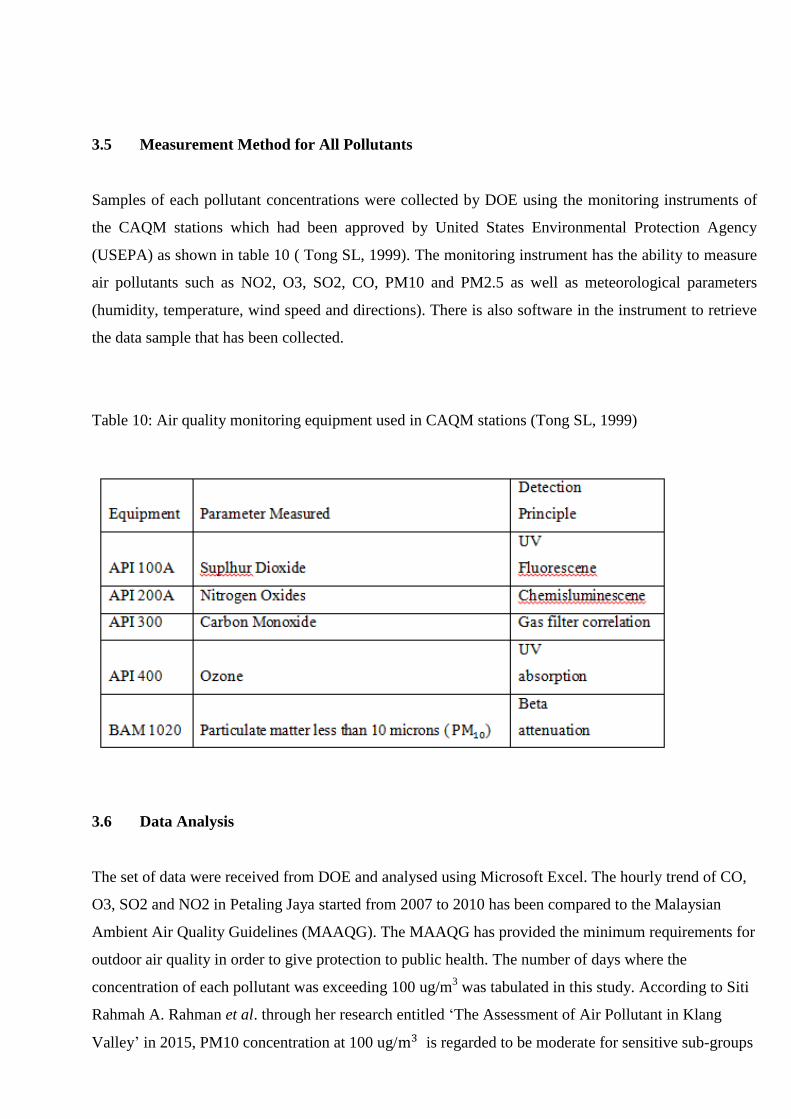
3.5 Measurement Method for All Pollutants
Samples of each pollutant concentrations were collected by DOE using the monitoring instruments of
the CAQM stations which had been approved by United States Environmental Protection Agency
(USEPA) as shown in table 10 ( Tong SL, 1999). The monitoring instrument has the ability to measure
air pollutants such as NO2, O3, SO2, CO, PM10 and PM2.5 as well as meteorological parameters
(humidity, temperature, wind speed and directions). There is also software in the instrument to retrieve
the data sample that has been collected.
Table 10: Air quality monitoring equipment used in CAQM stations (Tong SL, 1999)
3.6 Data Analysis
The set of data were received from DOE and analysed using Microsoft Excel. The hourly trend of CO,
O3, SO2 and NO2 in Petaling Jaya started from 2007 to 2010 has been compared to the Malaysian
Ambient Air Quality Guidelines (MAAQG). The MAAQG has provided the minimum requirements for
outdoor air quality in order to give protection to public health. The number of days where the
concentration of each pollutant was exceeding 100 ug/m3 was tabulated in this study. According to Siti
Rahmah A. Rahman et al. through her research entitled „The Assessment of Air Pollutant in Klang
Valley‟ in 2015, PM10 concentration at 100 ug/ is regarded to be moderate for sensitive sub-groups
that consist of elderly, pregnant women and children, meanwhile the exposure level that exceeds 150
ug/ is not healthy for public, and this may lead to serious health problem for the sensitive group.
3.7 Time Series Analysis
Time series analysis is a process to analyse time series data to obtain the extraction of meaningful
statistics and other items of the data. In this study, time series analysis would be used to describe the
movement or pattern of pollutants in time. The maximum concentration for each pollutant against time
will be plotted to understand the cause and effect relationship of the study. All the selected pollutants
dispersion is monitored in hourly basis per day.
CHAPTER 4: RESULTS AND DISCUSSIONS
4.1 Introduction
All the selected pollutants have been analysed for four years (2007-2010) from January until December.
The data were taken from the monitoring station located in Petaling Jaya. This area is one of the most
polluted areas in Klang Valley. The concentration of NO2, PM10, SO2 and O3 was taken based on an
hourly basis daily. These data were tabulated using Microsoft Excel and studied by using descriptive
statistical analysis to discern the pattern of the pollutant concentration. The result from the analysis will
be used to propose a new guideline for selected pollutants.
4.2 The Comparison of Ambient Air Pollutants and Malaysian Ambient Air Quality
Guidelines
All the selected pollutants have been analysed and studied throughout the year 2007 to 2010 from
January to December. The graph for average hourly concentration of pollutants against time has been
plotted to observe the overall pattern of the pollutant. The average hour concentration throughout the
years for the pollutants was below the MAAQG. Nevertheless the concentration of NO2 and O3 were
recorded as the highest in Petaling Jaya as this area is surrounded of residential, industries and
commercial areas.
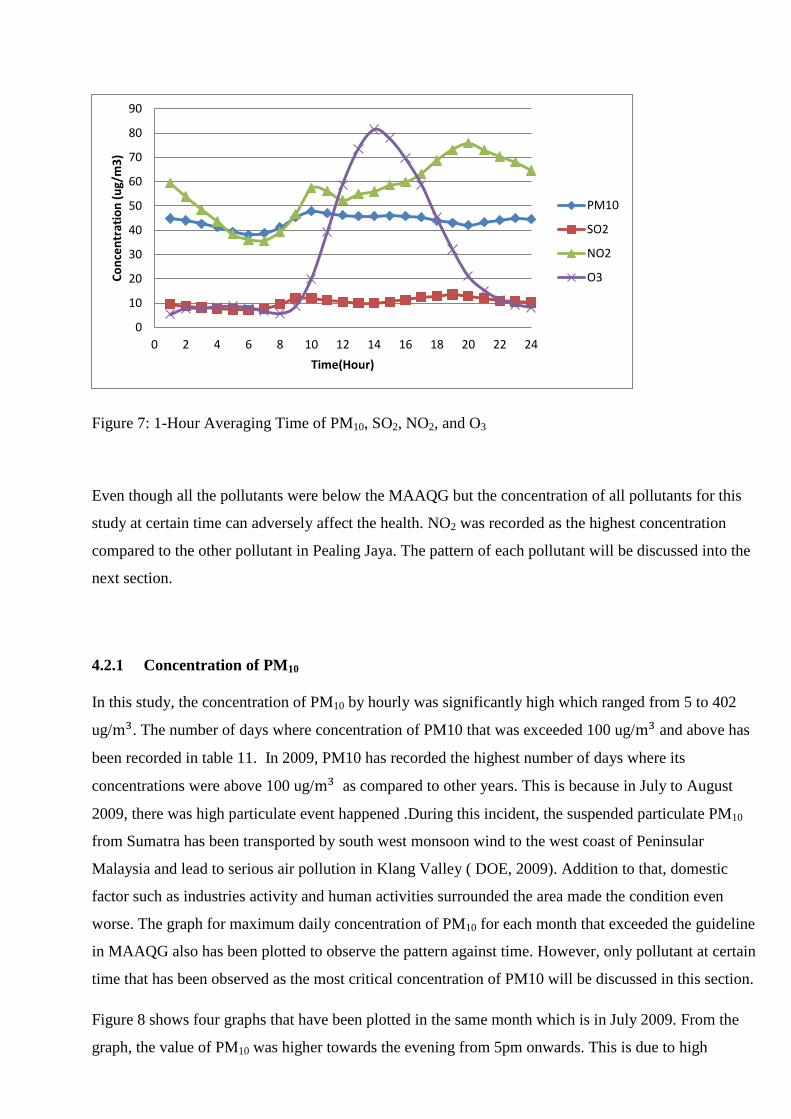
Figure 7: 1-Hour Averaging Time of PM10, SO2, NO2, and O3
Even though all the pollutants were below the MAAQG but the concentration of all pollutants for this
study at certain time can adversely affect the health. NO2 was recorded as the highest concentration
compared to the other pollutant in Pealing Jaya. The pattern of each pollutant will be discussed into the
next section.
4.2.1 Concentration of PM10
In this study, the concentration of PM10 by hourly was significantly high which ranged from 5 to 402
ug/ . The number of days where concentration of PM10 that was exceeded 100 ug/ and above has
been recorded in table 11. In 2009, PM10 has recorded the highest number of days where its
concentrations were above 100 ug/ as compared to other years. This is because in July to August
2009, there was high particulate event happened .During this incident, the suspended particulate PM10
from Sumatra has been transported by south west monsoon wind to the west coast of Peninsular
Malaysia and lead to serious air pollution in Klang Valley ( DOE, 2009). Addition to that, domestic
factor such as industries activity and human activities surrounded the area made the condition even
worse. The graph for maximum daily concentration of PM10 for each month that exceeded the guideline
in MAAQG also has been plotted to observe the pattern against time. However, only pollutant at certain
time that has been observed as the most critical concentration of PM10 will be discussed in this section.
Figure 8 shows four graphs that have been plotted in the same month which is in July 2009. From the
graph, the value of PM10 was higher towards the evening from 5pm onwards. This is due to high
0
10
20
30
40
50
60
70
80
90
0 2 4 6 8 10 12 14 16 18 20 22 24
Co
nce
ntr
atio
n (
ug/
m3
)
Time(Hour)
PM10
SO2
NO2
O3
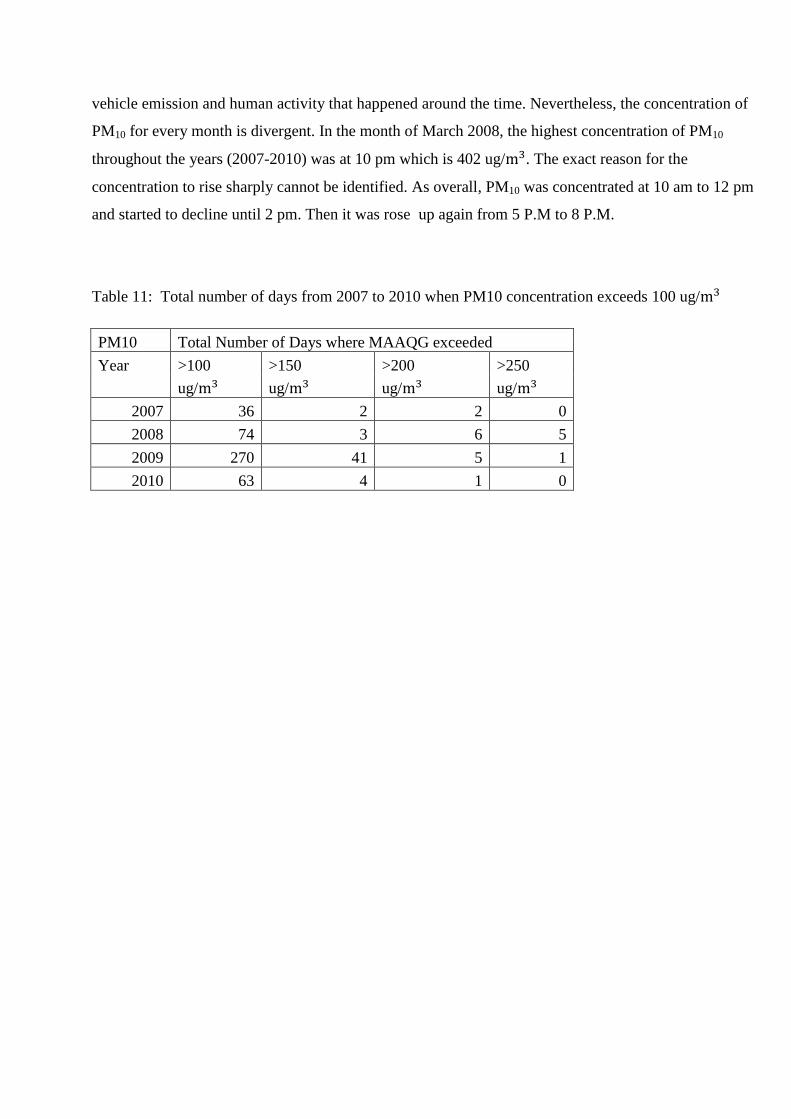
vehicle emission and human activity that happened around the time. Nevertheless, the concentration of
PM10 for every month is divergent. In the month of March 2008, the highest concentration of PM10
throughout the years (2007-2010) was at 10 pm which is 402 ug/ . The exact reason for the
concentration to rise sharply cannot be identified. As overall, PM10 was concentrated at 10 am to 12 pm
and started to decline until 2 pm. Then it was rose up again from 5 P.M to 8 P.M.
Table 11: Total number of days from 2007 to 2010 when PM10 concentration exceeds 100 ug/
PM10 Total Number of Days where MAAQG exceeded
Year >100 >150 >200 >250
ug/ ug/ ug/ ug/
2007 36 2 2 0
2008 74 3 6 5
2009 270 41 5 1
2010 63 4 1 0
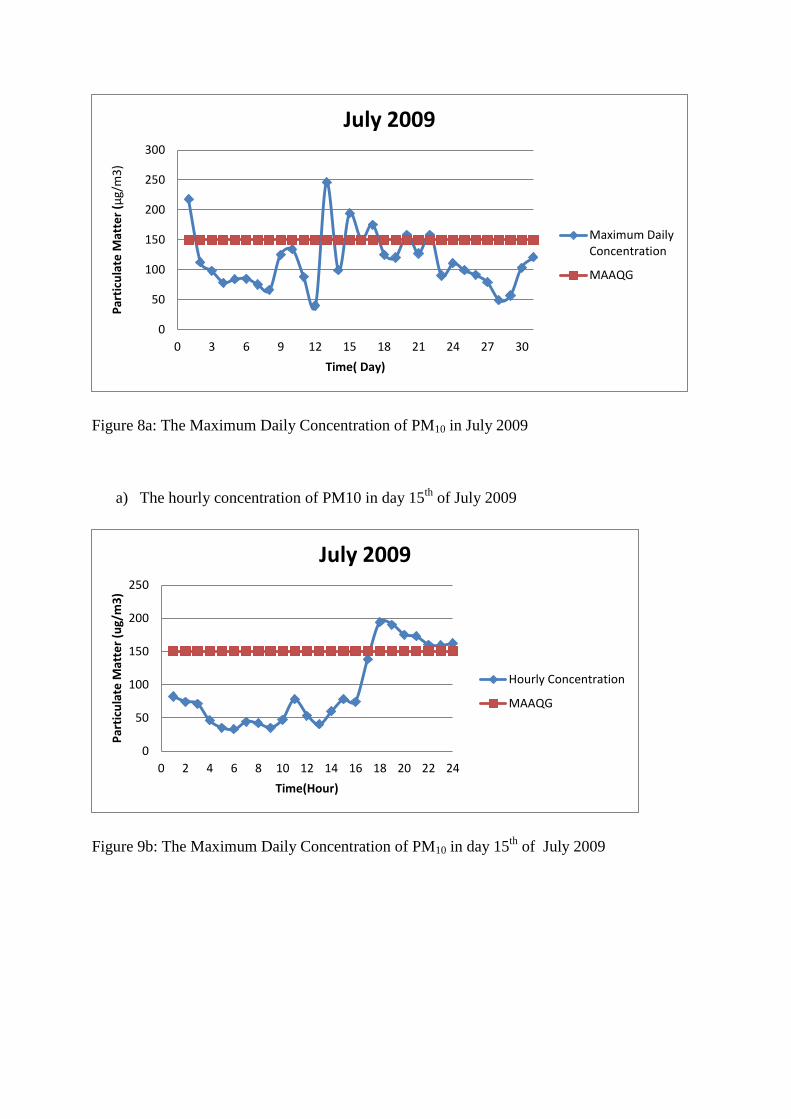
Figure 8a: The Maximum Daily Concentration of PM10 in July 2009
a) The hourly concentration of PM10 in day 15th
of July 2009
Figure 9b: The Maximum Daily Concentration of PM10 in day 15th
of July 2009
0
50
100
150
200
250
300
0 3 6 9 12 15 18 21 24 27 30
Par
ticu
late
Mat
ter
(µg/
m3
)
Time( Day)
July 2009
Maximum DailyConcentration
MAAQG
0
50
100
150
200
250
0 2 4 6 8 10 12 14 16 18 20 22 24
Par
ticu
late
Mat
ter
(ug/
m3
)
Time(Hour)
July 2009
Hourly Concentration
MAAQG
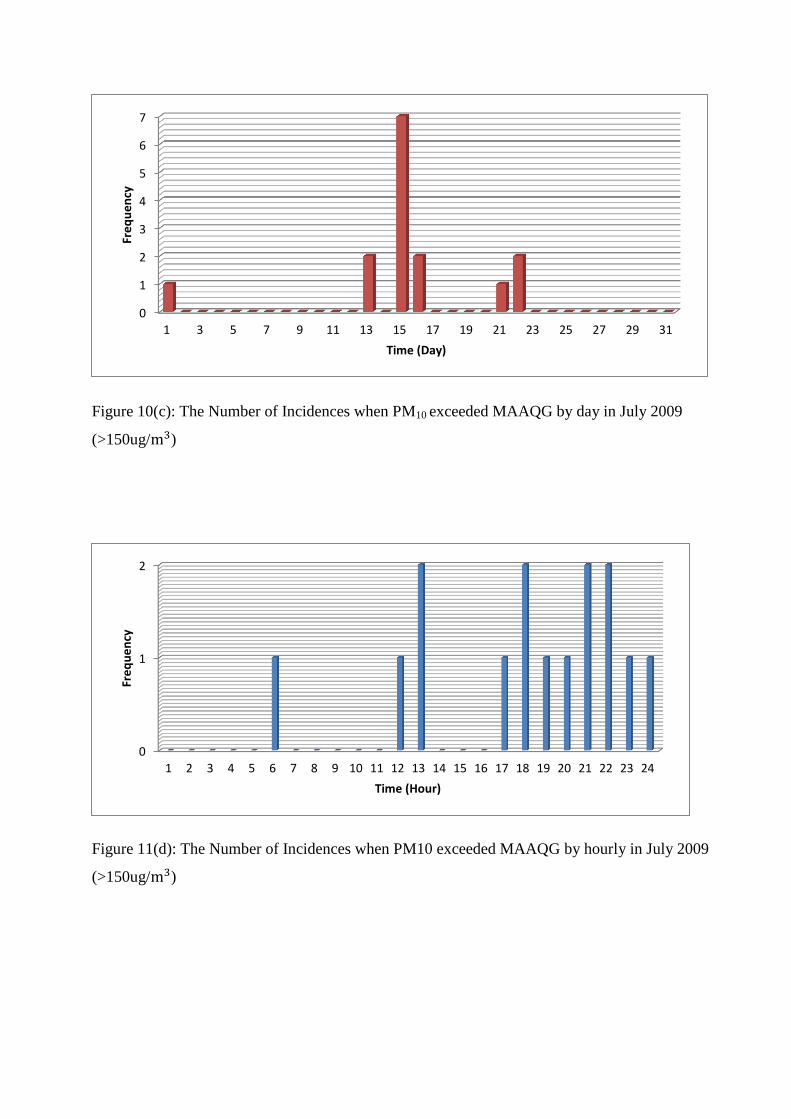
Figure 10(c): The Number of Incidences when PM10 exceeded MAAQG by day in July 2009
(>150ug/ )
Figure 11(d): The Number of Incidences when PM10 exceeded MAAQG by hourly in July 2009
(>150ug/ )
0
1
2
3
4
5
6
7
1 3 5 7 9 11 13 15 17 19 21 23 25 27 29 31
Fre
qu
en
cy
Time (Day)
0
1
2
1 2 3 4 5 6 7 8 9 10 11 12 13 14 15 16 17 18 19 20 21 22 23 24
Fre
qu
en
cy
Time (Hour)
According to WHO (2005) the concentration of PM10 at lowest as 75 ug/ would be expected to
increase about 1.2% of short-term mortality over the AQG value and the increment for each 10 ug/
would produce around 0.5% mortality. WHO claimed that these findings applied to city in developed
and developing countries including Malaysia. In this study, it has been found that almost every month
at certain period that hourly concentration for PM10 has exceeded the lowest limit in WHO that
promotes the increment of daily mortality.
4.2.2 Concentration of NO2
The hourly concentration of nitrogen dioxide ranged from 0 up to 216 ug/ in the years from 2007 to
2010 and the concentration values are below the 1 hour averaging time in MAAQG(320 ug/ ). The
highest concentration was recorded in October 2009 at 2 P.M .The sources of NO2 in Petaling Jaya are
likely come from the emission of motor vehicles as was mentioned by Abdullah et al. (2012).
There is also another factors contribute to the concentration of this pollutant such as fuel combustion.
The high temperature and pressure will oxidizes the nitrogen in the fuel to produce NO2 with sufficient
oxygen. Besides, the main contributor of NO2 also comes from industrial activity, domestic fuel
sources, and the long-range transport of air pollutants.( Rajab, J. M et al, 2011). For example, there was
open burning happened in 2002 related to agricultural activity which involved 500 hectares and
promoted to unhealthy level. (Mahmud, 2005)
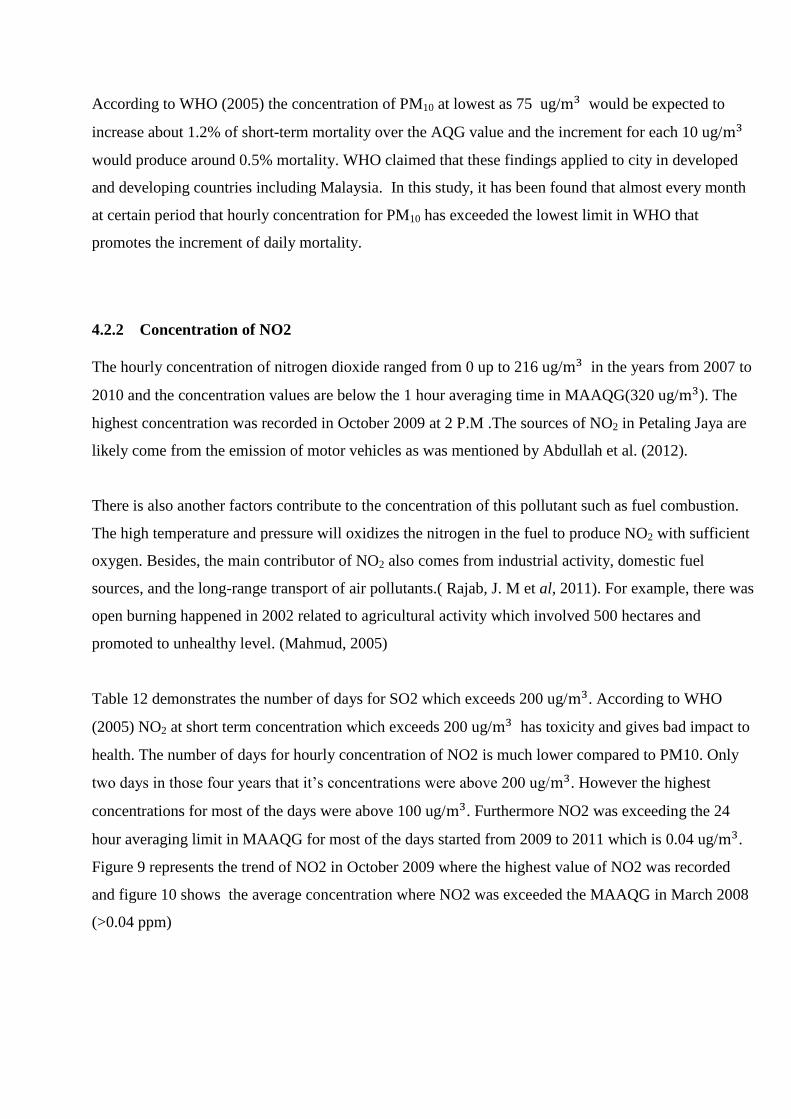
Table 12 demonstrates the number of days for SO2 which exceeds 200 ug/ . According to WHO
(2005) NO2 at short term concentration which exceeds 200 ug/ has toxicity and gives bad impact to
health. The number of days for hourly concentration of NO2 is much lower compared to PM10. Only
two days in those four years that it‟s concentrations were above 200 ug/ . However the highest
concentrations for most of the days were above 100 ug/ . Furthermore NO2 was exceeding the 24
hour averaging limit in MAAQG for most of the days started from 2009 to 2011 which is 0.04 ug/ .
Figure 9 represents the trend of NO2 in October 2009 where the highest value of NO2 was recorded
and figure 10 shows the average concentration where NO2 was exceeded the MAAQG in March 2008
(>0.04 ppm)
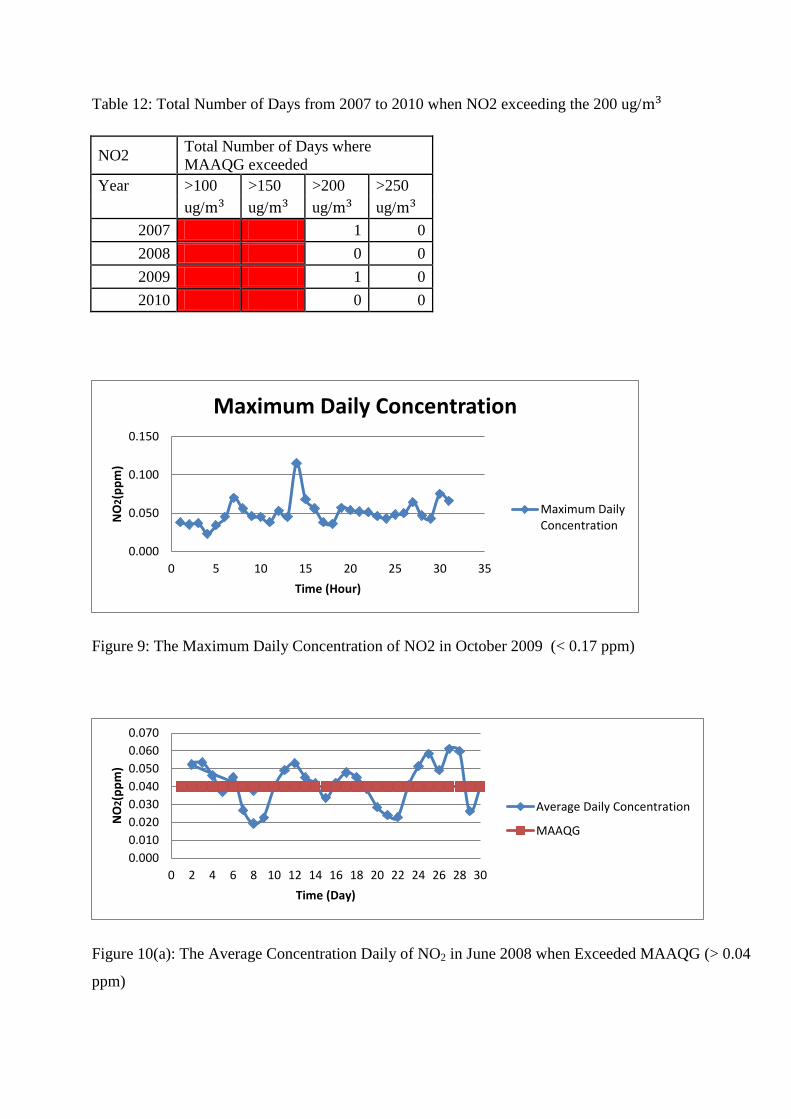
Table 12: Total Number of Days from 2007 to 2010 when NO2 exceeding the 200 ug/
NO2 Total Number of Days where
MAAQG exceeded
Year >100 >150 >200 >250
ug/ ug/ ug/ ug/
2007 1 0
2008 0 0
2009 1 0
2010 0 0
Figure 9: The Maximum Daily Concentration of NO2 in October 2009 (< 0.17 ppm)
Figure 10(a): The Average Concentration Daily of NO2 in June 2008 when Exceeded MAAQG (> 0.04
ppm)
0.000
0.050
0.100
0.150
0 5 10 15 20 25 30 35
NO
2(p
pm
)
Time (Hour)
Maximum Daily Concentration
Maximum DailyConcentration
0.000
0.010
0.020
0.030
0.040
0.050
0.060
0.070
0 2 4 6 8 10 12 14 16 18 20 22 24 26 28 30
NO
2(p
pm
)
Time (Day)
Average Daily Concentration
MAAQG
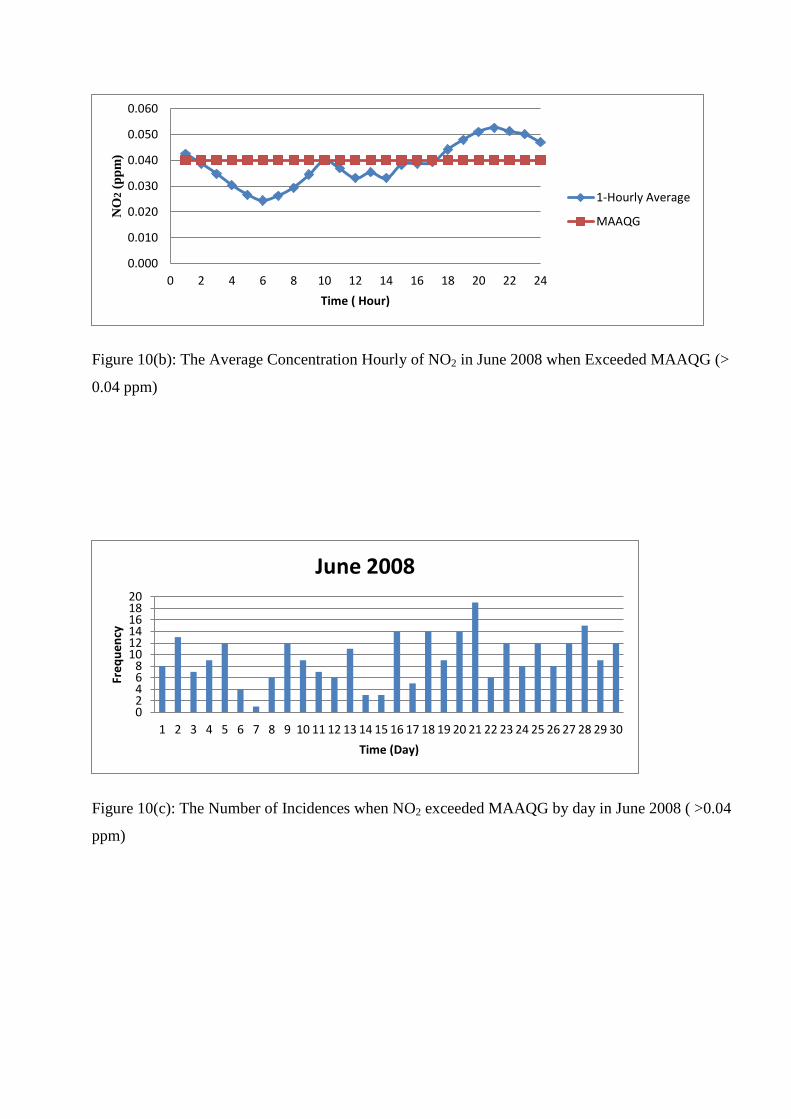
Figure 10(b): The Average Concentration Hourly of NO2 in June 2008 when Exceeded MAAQG (>
0.04 ppm)
Figure 10(c): The Number of Incidences when NO2 exceeded MAAQG by day in June 2008 ( >0.04
ppm)
0.000
0.010
0.020
0.030
0.040
0.050
0.060
0 2 4 6 8 10 12 14 16 18 20 22 24
NO
2 (
pp
m)
Time ( Hour)
1-Hourly Average
MAAQG
02468
101214161820
1 2 3 4 5 6 7 8 9 10 11 12 13 14 15 16 17 18 19 20 21 22 23 24 25 26 27 28 29 30
Fre
qu
en
cy
Time (Day)
June 2008
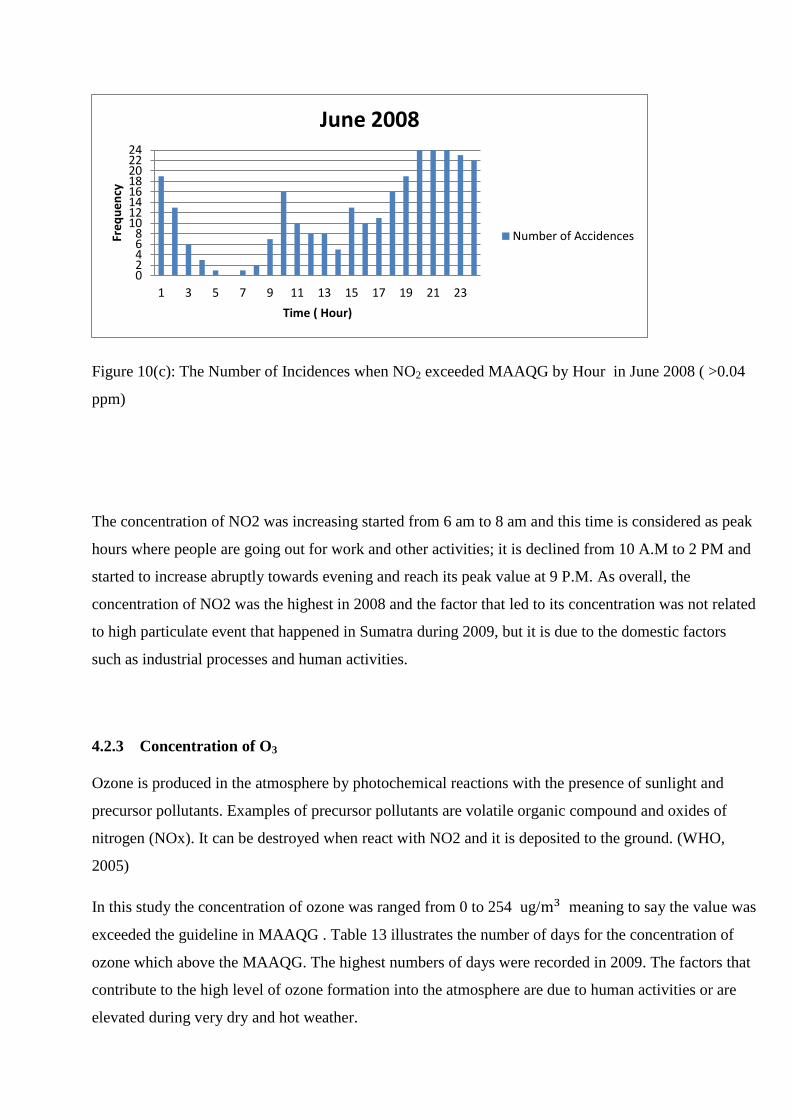
Figure 10(c): The Number of Incidences when NO2 exceeded MAAQG by Hour in June 2008 ( >0.04
ppm)
The concentration of NO2 was increasing started from 6 am to 8 am and this time is considered as peak
hours where people are going out for work and other activities; it is declined from 10 A.M to 2 PM and
started to increase abruptly towards evening and reach its peak value at 9 P.M. As overall, the
concentration of NO2 was the highest in 2008 and the factor that led to its concentration was not related
to high particulate event that happened in Sumatra during 2009, but it is due to the domestic factors
such as industrial processes and human activities.
4.2.3 Concentration of O3
Ozone is produced in the atmosphere by photochemical reactions with the presence of sunlight and
precursor pollutants. Examples of precursor pollutants are volatile organic compound and oxides of
nitrogen (NOx). It can be destroyed when react with NO2 and it is deposited to the ground. (WHO,
2005)
In this study the concentration of ozone was ranged from 0 to 254 ug/ meaning to say the value was
exceeded the guideline in MAAQG . Table 13 illustrates the number of days for the concentration of
ozone which above the MAAQG. The highest numbers of days were recorded in 2009. The factors that
contribute to the high level of ozone formation into the atmosphere are due to human activities or are
elevated during very dry and hot weather.
02468
1012141618202224
1 3 5 7 9 11 13 15 17 19 21 23
Fre
qu
en
cy
Time ( Hour)
June 2008
Number of Accidences
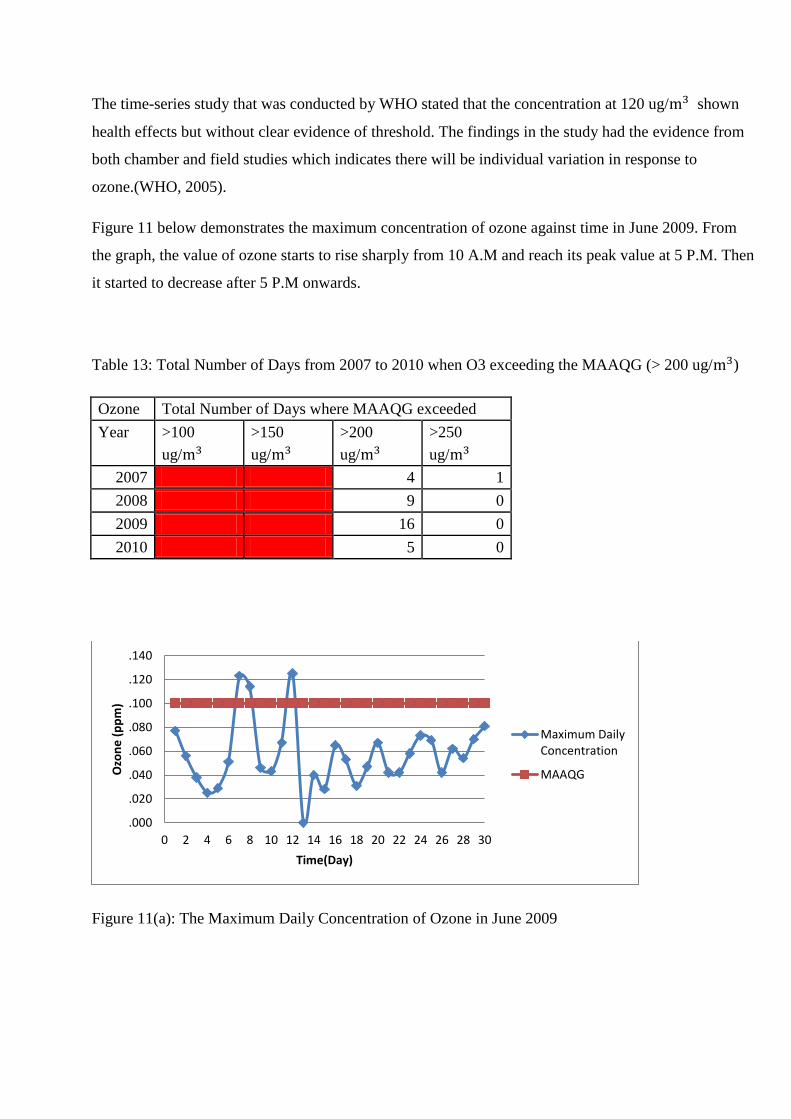
The time-series study that was conducted by WHO stated that the concentration at 120 ug/ shown
health effects but without clear evidence of threshold. The findings in the study had the evidence from
both chamber and field studies which indicates there will be individual variation in response to
ozone.(WHO, 2005).
Figure 11 below demonstrates the maximum concentration of ozone against time in June 2009. From
the graph, the value of ozone starts to rise sharply from 10 A.M and reach its peak value at 5 P.M. Then
it started to decrease after 5 P.M onwards.
Table 13: Total Number of Days from 2007 to 2010 when O3 exceeding the MAAQG (> 200 ug/ )
Ozone Total Number of Days where MAAQG exceeded
Year >100 >150 >200 >250
ug/ ug/ ug/ ug/
2007 4 1
2008 9 0
2009 16 0
2010 5 0
Figure 11(a): The Maximum Daily Concentration of Ozone in June 2009
.000
.020
.040
.060
.080
.100
.120
.140
0 2 4 6 8 10 12 14 16 18 20 22 24 26 28 30
Ozo
ne
(p
pm
)
Time(Day)
Maximum DailyConcentration
MAAQG
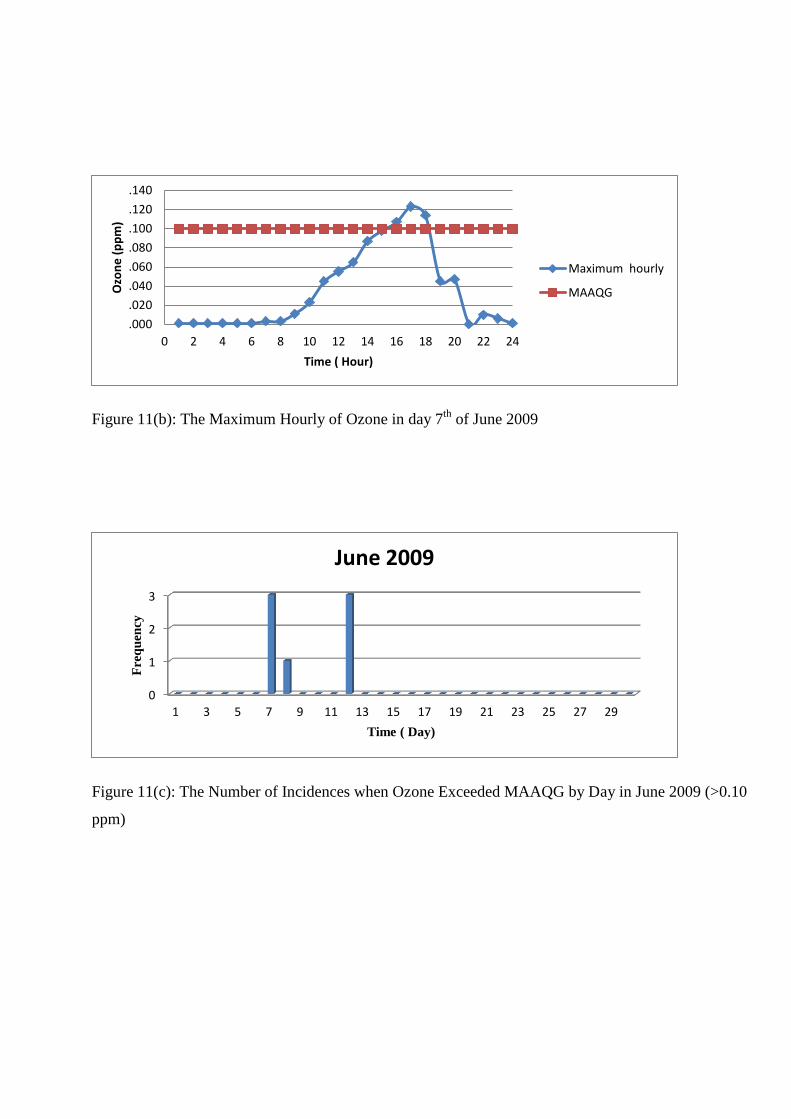
Figure 11(b): The Maximum Hourly of Ozone in day 7th
of June 2009
Figure 11(c): The Number of Incidences when Ozone Exceeded MAAQG by Day in June 2009 (>0.10
ppm)
.000
.020
.040
.060
.080
.100
.120
.140
0 2 4 6 8 10 12 14 16 18 20 22 24
Ozo
ne
(p
pm
)
Time ( Hour)
Maximum hourly
MAAQG
0
1
2
3
1 3 5 7 9 11 13 15 17 19 21 23 25 27 29
Fre
qu
ency
Time ( Day)
June 2009
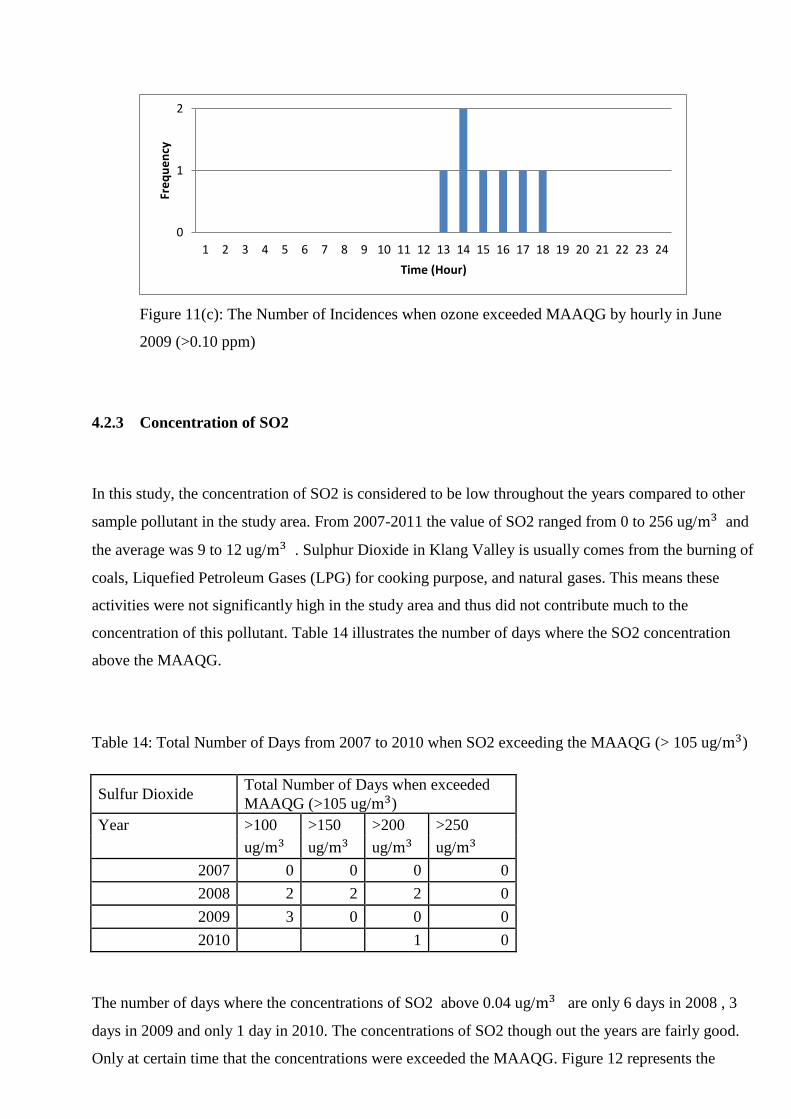
Figure 11(c): The Number of Incidences when ozone exceeded MAAQG by hourly in June
2009 (>0.10 ppm)
4.2.3 Concentration of SO2
In this study, the concentration of SO2 is considered to be low throughout the years compared to other
sample pollutant in the study area. From 2007-2011 the value of SO2 ranged from 0 to 256 ug/ and
the average was 9 to 12 ug/ . Sulphur Dioxide in Klang Valley is usually comes from the burning of
coals, Liquefied Petroleum Gases (LPG) for cooking purpose, and natural gases. This means these
activities were not significantly high in the study area and thus did not contribute much to the
concentration of this pollutant. Table 14 illustrates the number of days where the SO2 concentration
above the MAAQG.
Table 14: Total Number of Days from 2007 to 2010 when SO2 exceeding the MAAQG (> 105 ug/ )
Sulfur Dioxide Total Number of Days when exceeded
MAAQG (>105 ug/ )
Year >100 >150 >200 >250
ug/ ug/ ug/ ug/
2007 0 0 0 0
2008 2 2 2 0
2009 3 0 0 0
2010 1 0
The number of days where the concentrations of SO2 above 0.04 ug/ are only 6 days in 2008 , 3
days in 2009 and only 1 day in 2010. The concentrations of SO2 though out the years are fairly good.
Only at certain time that the concentrations were exceeded the MAAQG. Figure 12 represents the
0
1
2
1 2 3 4 5 6 7 8 9 10 11 12 13 14 15 16 17 18 19 20 21 22 23 24
Fre
qu
en
cy
Time (Hour)
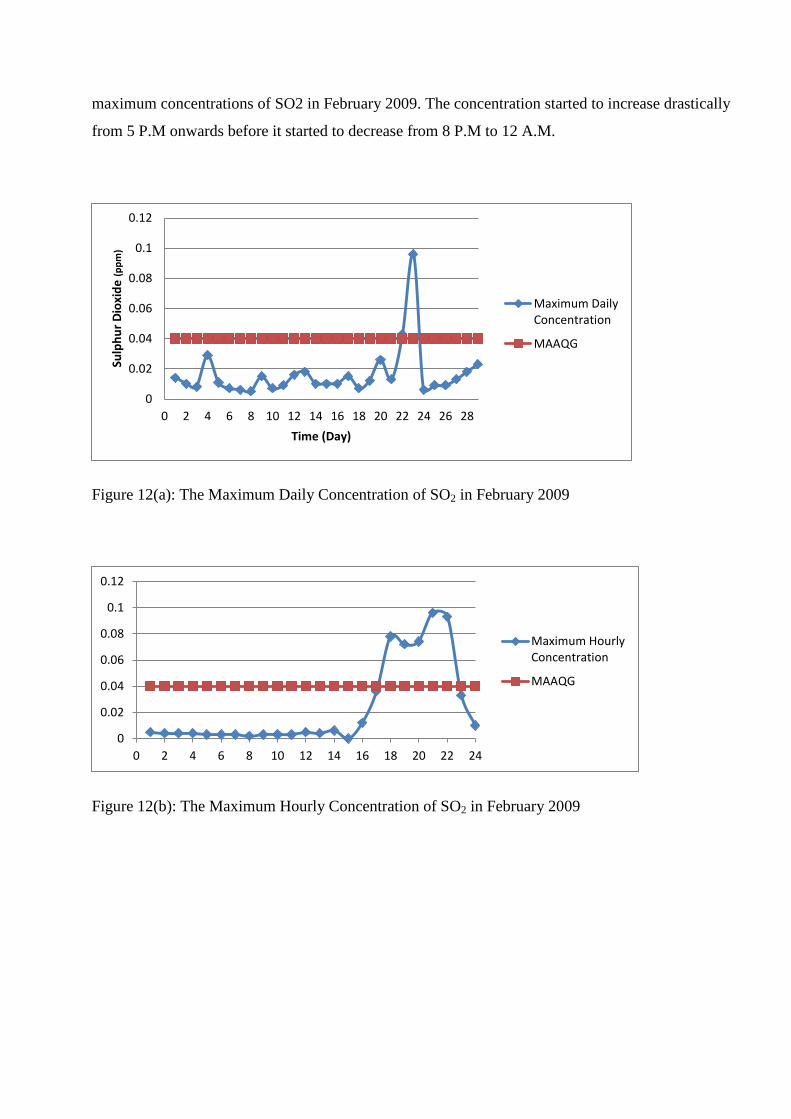
maximum concentrations of SO2 in February 2009. The concentration started to increase drastically
from 5 P.M onwards before it started to decrease from 8 P.M to 12 A.M.
Figure 12(a): The Maximum Daily Concentration of SO2 in February 2009
Figure 12(b): The Maximum Hourly Concentration of SO2 in February 2009
0
0.02
0.04
0.06
0.08
0.1
0.12
0 2 4 6 8 10 12 14 16 18 20 22 24 26 28
Sulp
hu
r D
ioxi
de
(pp
m)
Time (Day)
Maximum DailyConcentration
MAAQG
0
0.02
0.04
0.06
0.08
0.1
0.12
0 2 4 6 8 10 12 14 16 18 20 22 24
Maximum HourlyConcentration
MAAQG
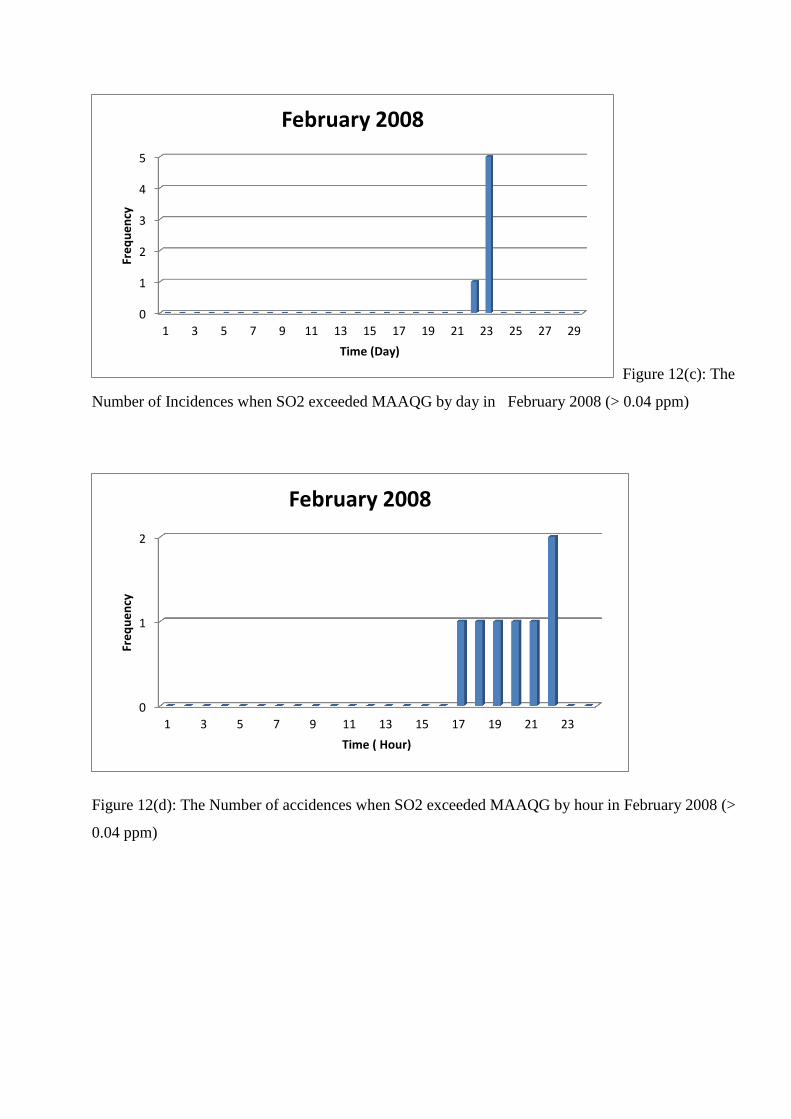
Figure 12(c): The
Number of Incidences when SO2 exceeded MAAQG by day in February 2008 (> 0.04 ppm)
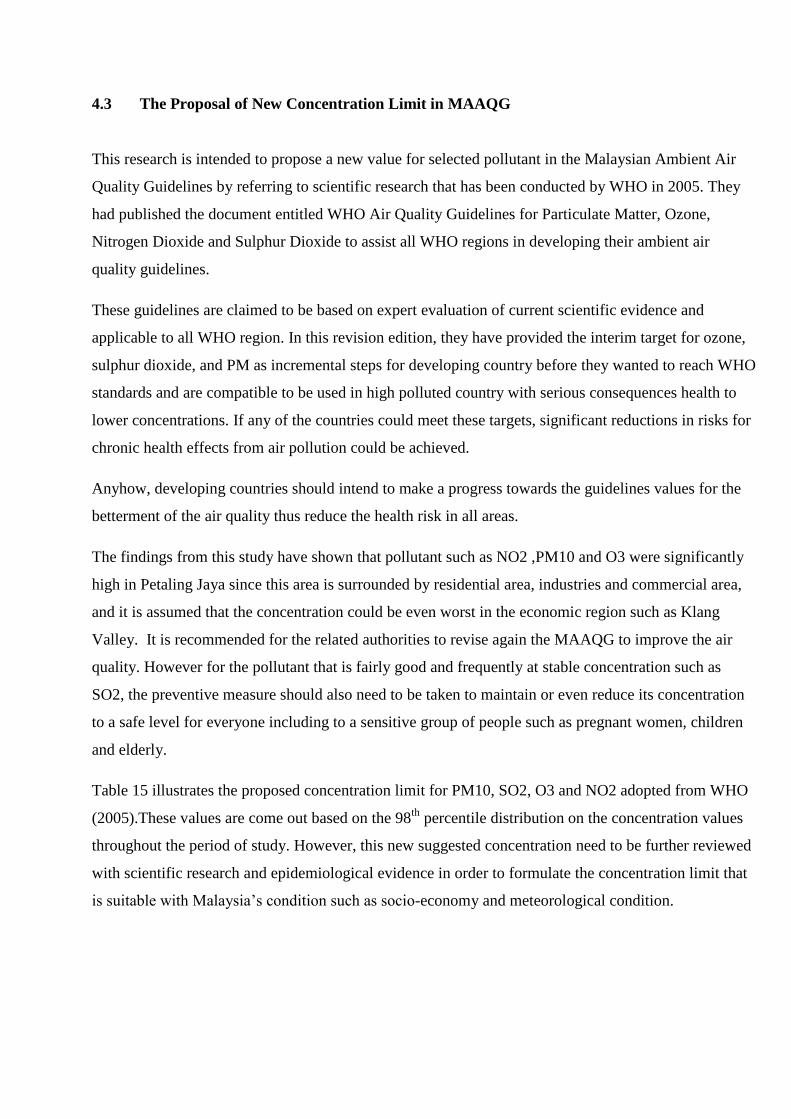
Figure 12(d): The Number of accidences when SO2 exceeded MAAQG by hour in February 2008 (>
0.04 ppm)
0
1
2
3
4
5
1 3 5 7 9 11 13 15 17 19 21 23 25 27 29
Fre
qu
en
cy
Time (Day)
February 2008
0
1
2
1 3 5 7 9 11 13 15 17 19 21 23
Fre
qu
en
cy
Time ( Hour)
February 2008
4.3 The Proposal of New Concentration Limit in MAAQG
This research is intended to propose a new value for selected pollutant in the Malaysian Ambient Air
Quality Guidelines by referring to scientific research that has been conducted by WHO in 2005. They
had published the document entitled WHO Air Quality Guidelines for Particulate Matter, Ozone,
Nitrogen Dioxide and Sulphur Dioxide to assist all WHO regions in developing their ambient air
quality guidelines.
These guidelines are claimed to be based on expert evaluation of current scientific evidence and
applicable to all WHO region. In this revision edition, they have provided the interim target for ozone,
sulphur dioxide, and PM as incremental steps for developing country before they wanted to reach WHO
standards and are compatible to be used in high polluted country with serious consequences health to
lower concentrations. If any of the countries could meet these targets, significant reductions in risks for
chronic health effects from air pollution could be achieved.
Anyhow, developing countries should intend to make a progress towards the guidelines values for the
betterment of the air quality thus reduce the health risk in all areas.
The findings from this study have shown that pollutant such as NO2 ,PM10 and O3 were significantly
high in Petaling Jaya since this area is surrounded by residential area, industries and commercial area,
and it is assumed that the concentration could be even worst in the economic region such as Klang
Valley. It is recommended for the related authorities to revise again the MAAQG to improve the air
quality. However for the pollutant that is fairly good and frequently at stable concentration such as
SO2, the preventive measure should also need to be taken to maintain or even reduce its concentration
to a safe level for everyone including to a sensitive group of people such as pregnant women, children
and elderly.
Table 15 illustrates the proposed concentration limit for PM10, SO2, O3 and NO2 adopted from WHO
(2005).These values are come out based on the 98th
percentile distribution on the concentration values
throughout the period of study. However, this new suggested concentration need to be further reviewed
with scientific research and epidemiological evidence in order to formulate the concentration limit that
is suitable with Malaysia‟s condition such as socio-economy and meteorological condition.
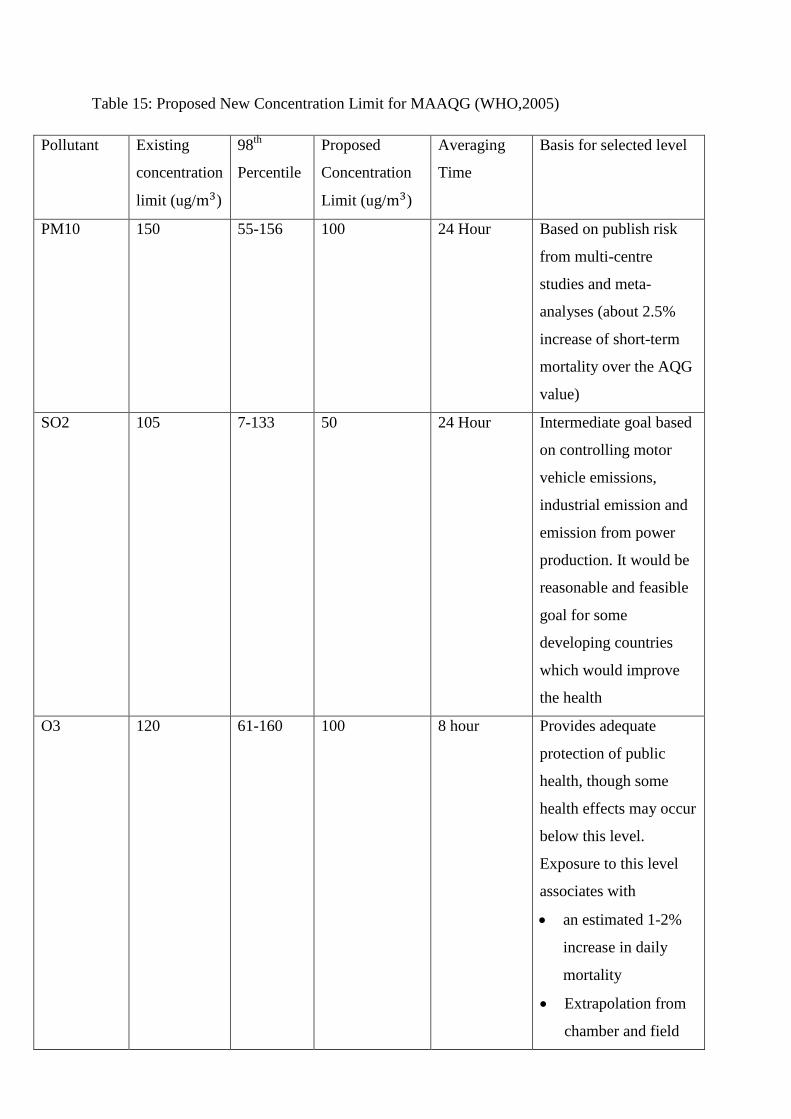
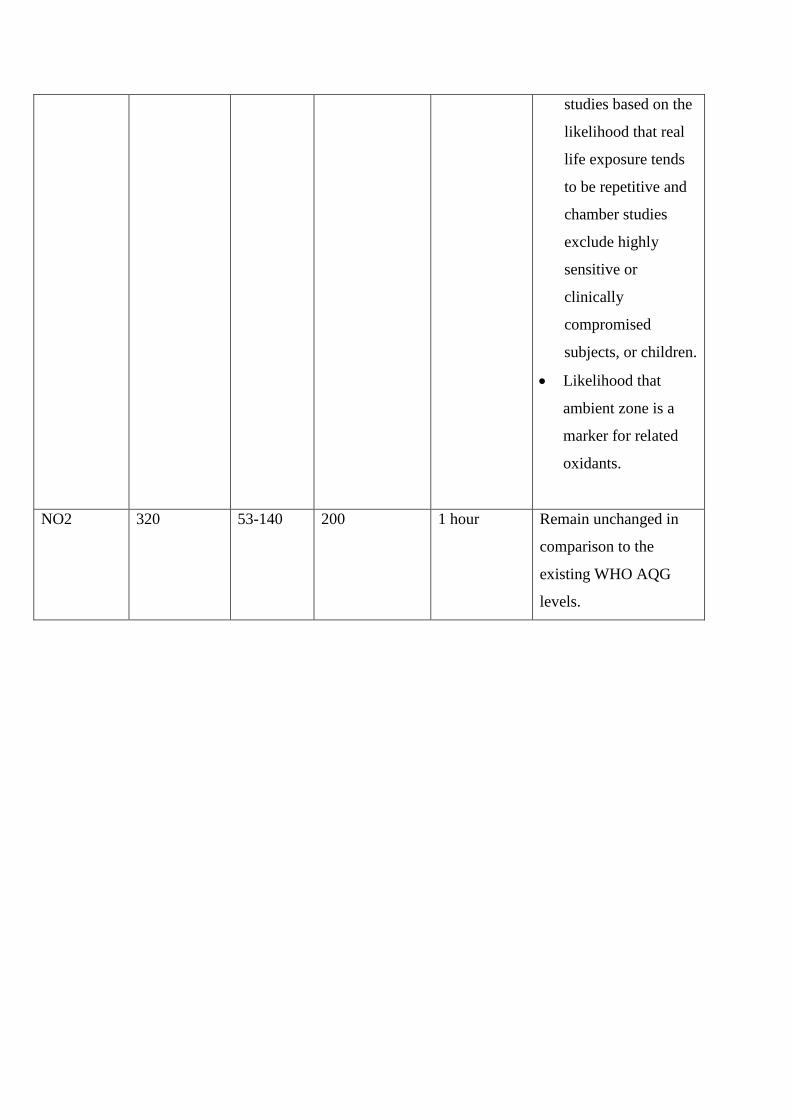
Table 15: Proposed New Concentration Limit for MAAQG (WHO,2005)
Pollutant Existing
concentration
limit (ug/ )
98th
Percentile
Proposed
Concentration
Limit (ug/ )
Averaging
Time
Basis for selected level
PM10 150 55-156 100 24 Hour Based on publish risk
from multi-centre
studies and meta-
analyses (about 2.5%
increase of short-term
mortality over the AQG
value)
SO2 105 7-133 50 24 Hour Intermediate goal based
on controlling motor
vehicle emissions,
industrial emission and
emission from power
production. It would be
reasonable and feasible
goal for some
developing countries
which would improve
the health
O3 120 61-160 100 8 hour Provides adequate
protection of public
health, though some
health effects may occur
below this level.
Exposure to this level
associates with
an estimated 1-2%
increase in daily
mortality
Extrapolation from
chamber and field
studies based on the
likelihood that real
life exposure tends
to be repetitive and
chamber studies
exclude highly
sensitive or
clinically
compromised
subjects, or children.
Likelihood that
ambient zone is a
marker for related
oxidants.
NO2 320 53-140 200 1 hour Remain unchanged in
comparison to the
existing WHO AQG
levels.
CHAPTER 7: CONCLUSION AND RECOMMENDATION
7.1 Conclusion
In conclusion, Petaling Jaya recorded a fluctuation level of air pollution started from 2007 until 2010.
All pollutants were above the guidelines at certain period of time because of several factors that
contributes to the increment of the concentrations. Nitrogen dioxide was the major contributor to the air
pollution in Petaling Jaya followed by particulate matter and ozone.
Based on the findings, the guidelines that have been design to protect the public health need to be
revised and transform it to standards to provide the adequate protection to the public since the
percentage of people admit to hospital because of air pollution are significantly high.
Most countries or cities in this world would have their Ambient Air Quality Standards to protect the
public health and environment. Some of them even have lower income compared to Malaysia but they
had revised their standards; some of the countries also formulated the guidelines later than Malaysia.
This country need to invest some time and money to improve the guidelines that would benefit the
citizens and environment.
7.2 Recommendations
For future research, it is recommended to conduct the study in any other polluted area; not only
focusing in Petaling Jaya to get more reliable results as this guidelines will be implemented to the
whole Malaysia.
Besides that, it would be necessary to determine the percentage of pollution for each source in the
Petaling Jaya to get an overview which source is the main contributor in the study area.
CHAPTER 8 : REFERENCES
1) Afroz, R., Hassan, M. N., & Ibrahim, N. A. (2003). Review of air pollution and health impacts
in Malaysia. Environmental Research. doi:10.1016/S0013-9351(02)00059-2
2) Amanollahi, J., Abdullah, A. M., Pirasteh, S., Ramli, & M. F., Rashidi, P., 2011, PM10
monitoring using MODIS AOT and GIS, Kuala Lumpur, Malaysia, Research Journal of
Chemistry and Environment, 15, 1-5.
3) Barbera, E., Currò, C., & Valenti, G. (2010). A hyperbolic model for the effects of urbanization
on air pollution. Applied Mathematical Modelling. doi:10.1016/j.apm.2009.10.030
4) Basic Information | Ground-level Ozone | US EPA. (n.d.). Retrieved from
http://www.epa.gov/groundlevelozone/basic.html
5) Brooke, E. (2014, July 1). To Breathe, Or Not To Breathe – Who Decides? - NEW
SUSTAINABILITY INC. Retrieved from
http://www.newsustainabilityinc.com/2014/07/01/breathe-breathe-gets-answer-question/
6) Clean Air Initiatives. (2009). Ambient Air Quality Standards in Asia Survey Report.
7) Department of Environment (DOE), 2009, Malaysia Environmental Quality Report 2009,
Malaysia: Department of Environment.
8) DOE. (1997). A Guide to Air Pollutant Index in Malaysia.
9) DOE. (2006). Country Synthesis Report on Urban Air Quality Management.
10) DOE. (2014). Air Quality Malaysia Environmental Quality Report.
11) Effects of Air Pollution on humans, plants and animals. (2010). Retrieved from
http://eschooltoday.com/pollution/air-pollution/effects-of-air-pollution.html
12) Feng WB (2007) Study on the Inter-relationship between Urbanization
and Eco-environment.
13) Gas Molecules and Gas Flow. (n.d.). Retrieved from http://vacaero.com/information-
resources/vacuum-pump-practice-with-howard-tring/1340-gas-molecules-and-gas-flow.html
14) General Info Air Pollutant Index, 1-10 ,(n.d.).
15) Huang JC, Fang CL (2003) Analysis of coupling mechanism and rules
between urbanization and eco-environment.
16) Lin Hoon Leh, O., Ahmad, S., Ayyub, K., Mohd Jani, Y., & Kien Hwa, T. (2011). Urban
Environmental Health: Respiratory Illness and Urban Factors in Kuala Lumpur.
17) Malaysia chokes as air pollution hits 16-year high | The Japan Times. (2013). Retrieved from
http://www.japantimes.co.jp/life/2013/06/24/environment/malaysia-chokes-as-air-pollution-
hits-16-year-high/#.VI2dCyuUe7g
18) Mohamed, S. (2014, February 13). Klang Valley's future. Retrieved from
www.freemalaysiatoday.com/category/opinion/2014/02/13/klang-valleys-future/
19) National Ambient Air Quality Standards (NAAQSs) in Thailand. (n.d.).
20) Rahman, S. A., .Ismail, S. S., .Ramli, E. F., Latif, M. T., Abidin, E. Z., & Praveena, S. M.
(2015). The Assessment of Ambient Air Pollution Trend in Klang Valley, Malaysia, 5(1), 1-11.
21) Rajab, J. M., Tan, K. C., & Jafri, M. Z., 2011, Investigation on the Carbon Monoxide Pollution
over Peninsular Malaysia Caused by Indonesia Forest Fires from AIRS Daily Measurement, In
F. Nejadkoorki, Advanced Air Pollution (pp. 115-136). InTech.
22) Schwela, D. (1998). Objectives for ambient air quality - A global perspective.
23) UKM Pakarunding Sdn. Bhd. (2004). A Research Project Report. A Study of Health Impact and
Risk Assessment of Urban Air Pollution in the Klang Valley, Malaysia.
24) Wang, Q., Yuan, X., Ma, C., Zhang, Z., & Zuo, J. (0). Research on the impact assessment of
urbanization on air environment with urban environmental entropy model: a case
study. Stochastic Environmental Research and Risk Assessment. doi:10.1007/s00477-011-
0493-5
25) World Health Organization. (2006). Air quality guidelines: Global update 2005 : particulate
matter, ozone, nitrogen dioxide, and sulfur dioxide. Copenhagen, Denmark: Author.
26) Yusoff, M. (1987). Air Pollution Control Legislation-Research Needs.
APPENDIXES
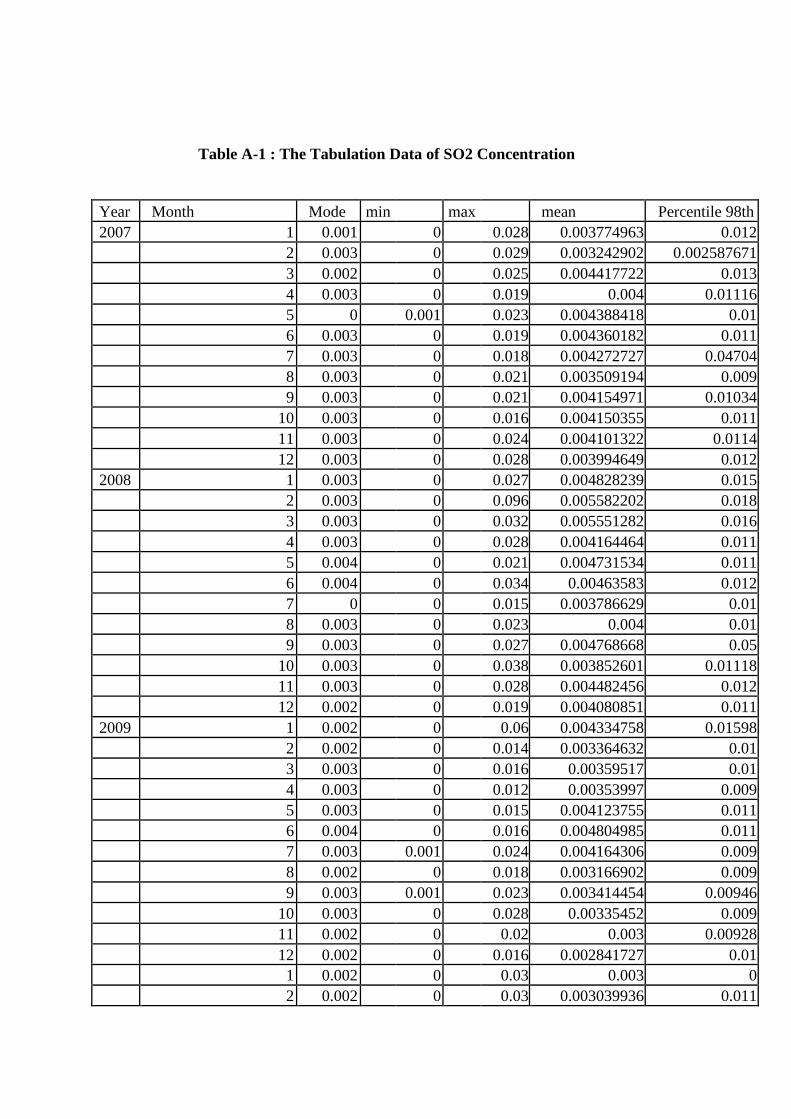
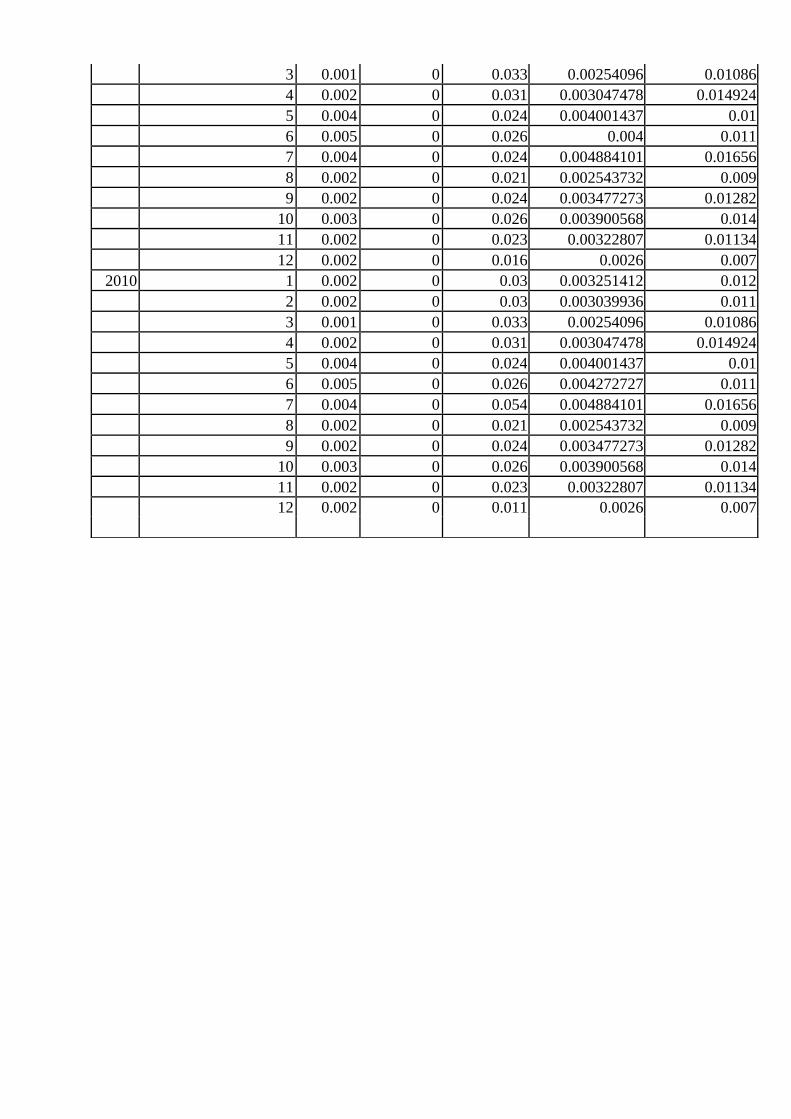
Table A-1 : The Tabulation Data of SO2 Concentration
Year Month Mode min max mean Percentile 98th
2007 1 0.001 0 0.028 0.003774963 0.012
2 0.003 0 0.029 0.003242902 0.002587671
3 0.002 0 0.025 0.004417722 0.013
4 0.003 0 0.019 0.004 0.01116
5 0 0.001 0.023 0.004388418 0.01
6 0.003 0 0.019 0.004360182 0.011
7 0.003 0 0.018 0.004272727 0.04704
8 0.003 0 0.021 0.003509194 0.009
9 0.003 0 0.021 0.004154971 0.01034
10 0.003 0 0.016 0.004150355 0.011
11 0.003 0 0.024 0.004101322 0.0114
12 0.003 0 0.028 0.003994649 0.012
2008 1 0.003 0 0.027 0.004828239 0.015
2 0.003 0 0.096 0.005582202 0.018
3 0.003 0 0.032 0.005551282 0.016
4 0.003 0 0.028 0.004164464 0.011
5 0.004 0 0.021 0.004731534 0.011
6 0.004 0 0.034 0.00463583 0.012
7 0 0 0.015 0.003786629 0.01
8 0.003 0 0.023 0.004 0.01
9 0.003 0 0.027 0.004768668 0.05
10 0.003 0 0.038 0.003852601 0.01118
11 0.003 0 0.028 0.004482456 0.012
12 0.002 0 0.019 0.004080851 0.011
2009 1 0.002 0 0.06 0.004334758 0.01598
2 0.002 0 0.014 0.003364632 0.01
3 0.003 0 0.016 0.00359517 0.01
4 0.003 0 0.012 0.00353997 0.009
5 0.003 0 0.015 0.004123755 0.011
6 0.004 0 0.016 0.004804985 0.011
7 0.003 0.001 0.024 0.004164306 0.009
8 0.002 0 0.018 0.003166902 0.009
9 0.003 0.001 0.023 0.003414454 0.00946
10 0.003 0 0.028 0.00335452 0.009
11 0.002 0 0.02 0.003 0.00928
12 0.002 0 0.016 0.002841727 0.01
1 0.002 0 0.03 0.003 0
2 0.002 0 0.03 0.003039936 0.011
3 0.001 0 0.033 0.00254096 0.01086
4 0.002 0 0.031 0.003047478 0.014924
5 0.004 0 0.024 0.004001437 0.01
6 0.005 0 0.026 0.004 0.011
7 0.004 0 0.024 0.004884101 0.01656
8 0.002 0 0.021 0.002543732 0.009
9 0.002 0 0.024 0.003477273 0.01282
10 0.003 0 0.026 0.003900568 0.014
11 0.002 0 0.023 0.00322807 0.01134
12 0.002 0 0.016 0.0026 0.007
2010 1 0.002 0 0.03 0.003251412 0.012
2 0.002 0 0.03 0.003039936 0.011
3 0.001 0 0.033 0.00254096 0.01086
4 0.002 0 0.031 0.003047478 0.014924
5 0.004 0 0.024 0.004001437 0.01
6 0.005 0 0.026 0.004272727 0.011
7 0.004 0 0.054 0.004884101 0.01656
8 0.002 0 0.021 0.002543732 0.009
9 0.002 0 0.024 0.003477273 0.01282
10 0.003 0 0.026 0.003900568 0.014
11 0.002 0 0.023 0.00322807 0.01134
12 0.002 0 0.011 0.0026 0.007
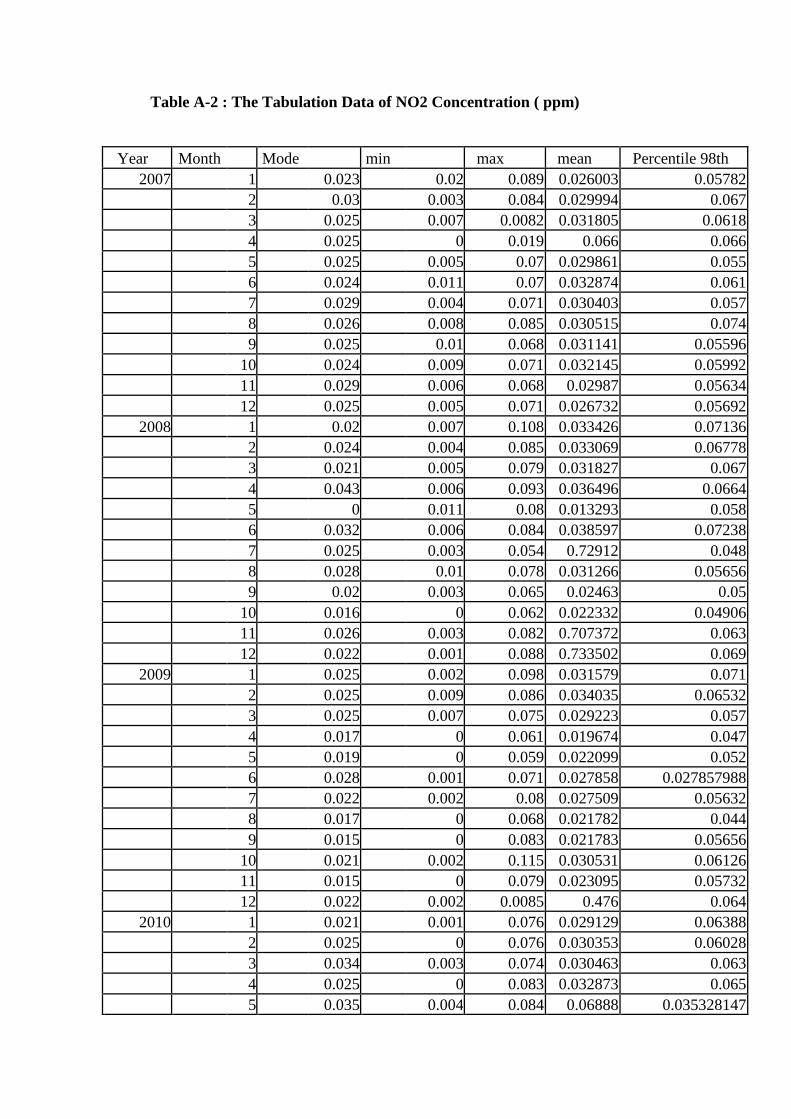
Table A-2 : The Tabulation Data of NO2 Concentration ( ppm)
Year Month Mode min max mean Percentile 98th
2007 1 0.023 0.02 0.089 0.026003 0.05782
2 0.03 0.003 0.084 0.029994 0.067
3 0.025 0.007 0.0082 0.031805 0.0618
4 0.025 0 0.019 0.066 0.066
5 0.025 0.005 0.07 0.029861 0.055
6 0.024 0.011 0.07 0.032874 0.061
7 0.029 0.004 0.071 0.030403 0.057
8 0.026 0.008 0.085 0.030515 0.074
9 0.025 0.01 0.068 0.031141 0.05596
10 0.024 0.009 0.071 0.032145 0.05992
11 0.029 0.006 0.068 0.02987 0.05634
12 0.025 0.005 0.071 0.026732 0.05692
2008 1 0.02 0.007 0.108 0.033426 0.07136
2 0.024 0.004 0.085 0.033069 0.06778
3 0.021 0.005 0.079 0.031827 0.067
4 0.043 0.006 0.093 0.036496 0.0664
5 0 0.011 0.08 0.013293 0.058
6 0.032 0.006 0.084 0.038597 0.07238
7 0.025 0.003 0.054 0.72912 0.048
8 0.028 0.01 0.078 0.031266 0.05656
9 0.02 0.003 0.065 0.02463 0.05
10 0.016 0 0.062 0.022332 0.04906
11 0.026 0.003 0.082 0.707372 0.063
12 0.022 0.001 0.088 0.733502 0.069
2009 1 0.025 0.002 0.098 0.031579 0.071
2 0.025 0.009 0.086 0.034035 0.06532
3 0.025 0.007 0.075 0.029223 0.057
4 0.017 0 0.061 0.019674 0.047
5 0.019 0 0.059 0.022099 0.052
6 0.028 0.001 0.071 0.027858 0.027857988
7 0.022 0.002 0.08 0.027509 0.05632
8 0.017 0 0.068 0.021782 0.044
9 0.015 0 0.083 0.021783 0.05656
10 0.021 0.002 0.115 0.030531 0.06126
11 0.015 0 0.079 0.023095 0.05732
12 0.022 0.002 0.0085 0.476 0.064
2010 1 0.021 0.001 0.076 0.029129 0.06388
2 0.025 0 0.076 0.030353 0.06028
3 0.034 0.003 0.074 0.030463 0.063
4 0.025 0 0.083 0.032873 0.065
5 0.035 0.004 0.084 0.06888 0.035328147
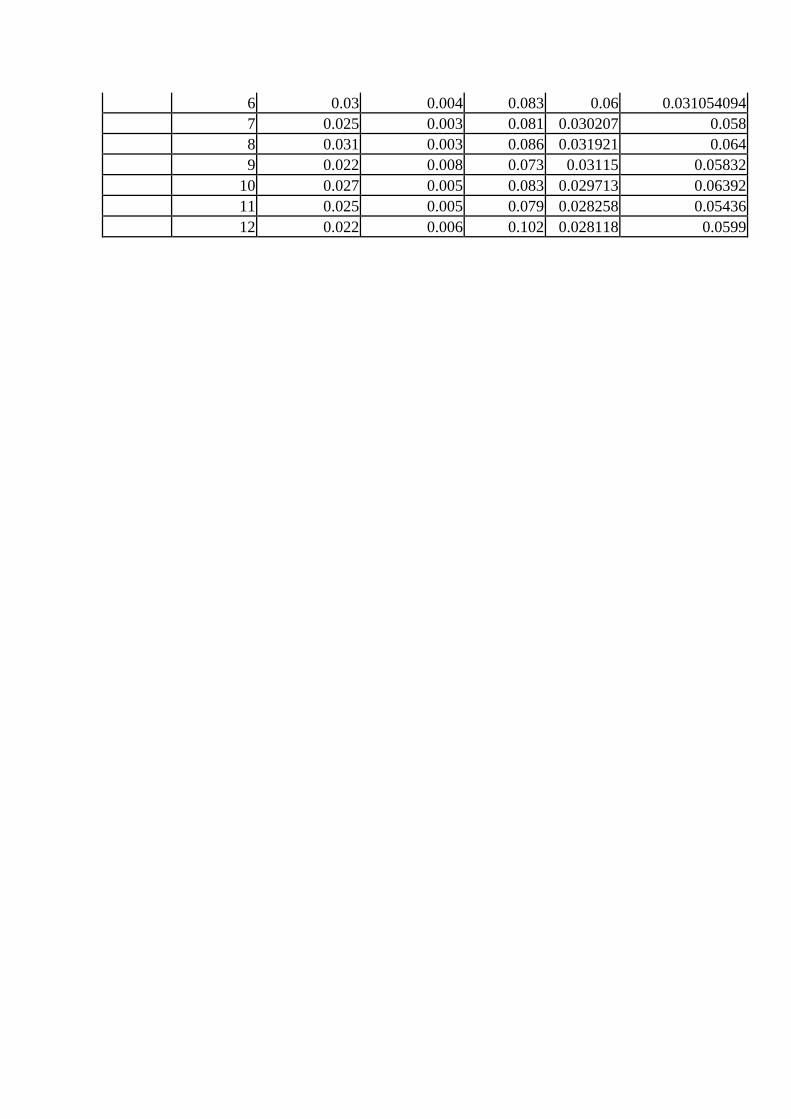
6 0.03 0.004 0.083 0.06 0.031054094
7 0.025 0.003 0.081 0.030207 0.058
8 0.031 0.003 0.086 0.031921 0.064
9 0.022 0.008 0.073 0.03115 0.05832
10 0.027 0.005 0.083 0.029713 0.06392
11 0.025 0.005 0.079 0.028258 0.05436
12 0.022 0.006 0.102 0.028118 0.0599
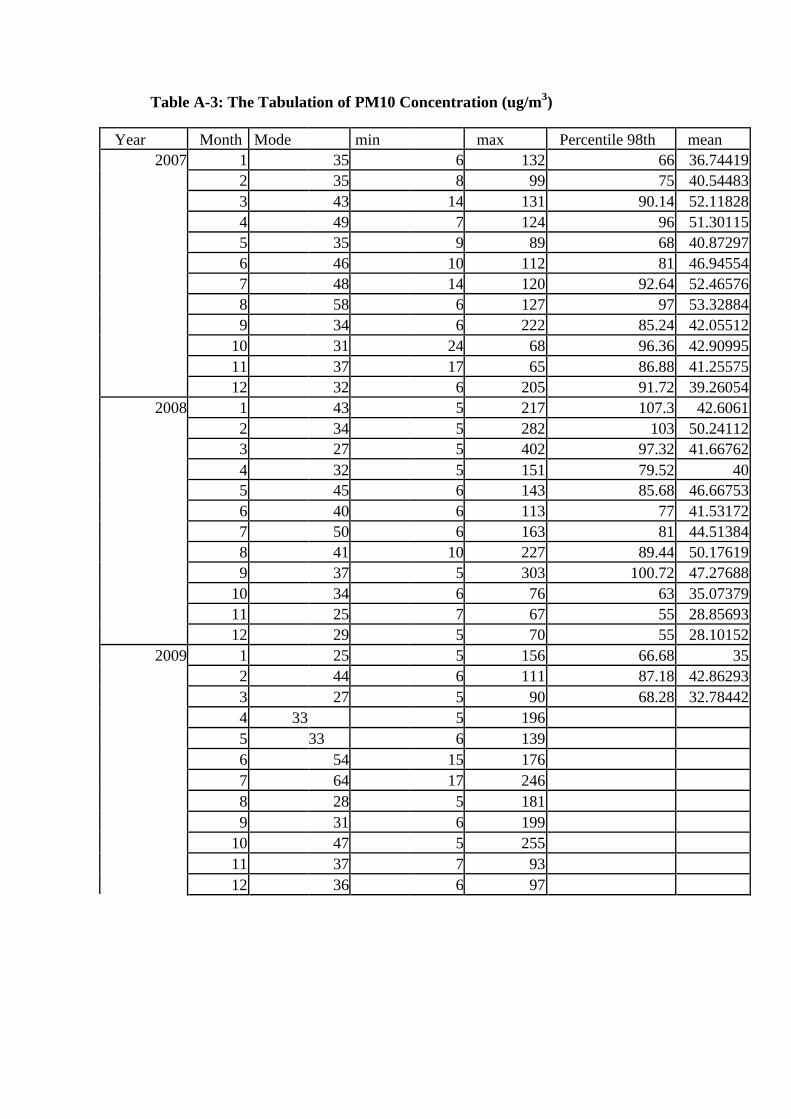
Table A-3: The Tabulation of PM10 Concentration (ug/m3)
Year Month Mode min max Percentile 98th mean
2007 1 35 6 132 66 36.74419
2 35 8 99 75 40.54483
3 43 14 131 90.14 52.11828
4 49 7 124 96 51.30115
5 35 9 89 68 40.87297
6 46 10 112 81 46.94554
7 48 14 120 92.64 52.46576
8 58 6 127 97 53.32884
9 34 6 222 85.24 42.05512
10 31 24 68 96.36 42.90995
11 37 17 65 86.88 41.25575
12 32 6 205 91.72 39.26054
2008 1 43 5 217 107.3 42.6061
2 34 5 282 103 50.24112
3 27 5 402 97.32 41.66762
4 32 5 151 79.52 40
5 45 6 143 85.68 46.66753
6 40 6 113 77 41.53172
7 50 6 163 81 44.51384
8 41 10 227 89.44 50.17619
9 37 5 303 100.72 47.27688
10 34 6 76 63 35.07379
11 25 7 67 55 28.85693
12 29 5 70 55 28.10152
2009 1 25 5 156 66.68 35
2 44 6 111 87.18 42.86293
3 27 5 90 68.28 32.78442
4 33 5 196
5 33 6 139
6 54 15 176
7 64 17 246
8 28 5 181
9 31 6 199
10 47 5 255
11 37 7 93
12 36 6 97
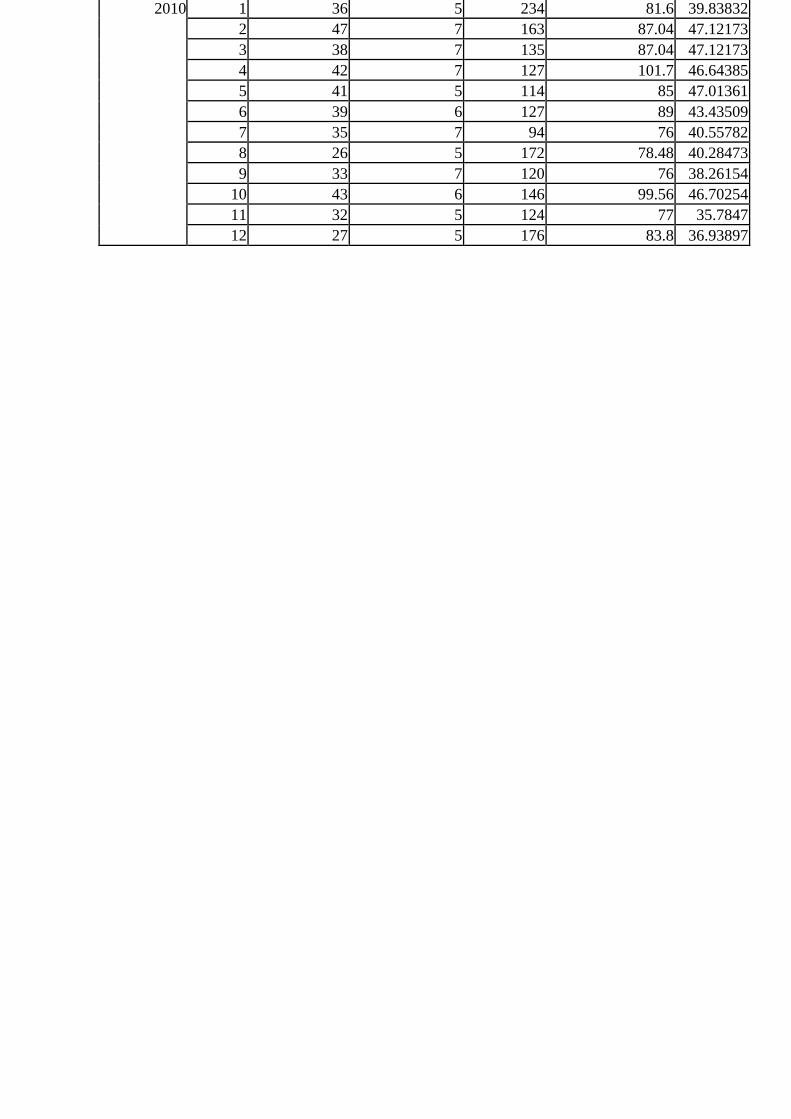
2010 1 36 5 234 81.6 39.83832
2 47 7 163 87.04 47.12173
3 38 7 135 87.04 47.12173
4 42 7 127 101.7 46.64385
5 41 5 114 85 47.01361
6 39 6 127 89 43.43509
7 35 7 94 76 40.55782
8 26 5 172 78.48 40.28473
9 33 7 120 76 38.26154
10 43 6 146 99.56 46.70254
11 32 5 124 77 35.7847
12 27 5 176 83.8 36.93897
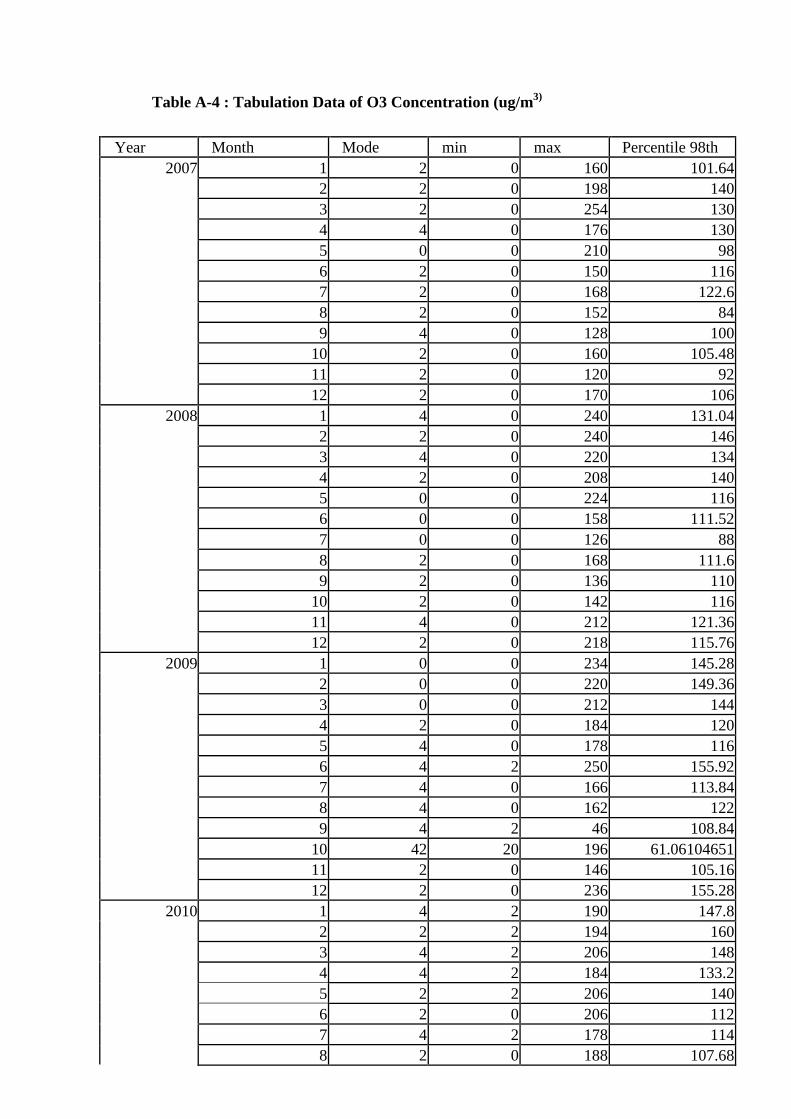
Table A-4 : Tabulation Data of O3 Concentration (ug/ m3)
Year Month Mode min max Percentile 98th
2007 1 2 0 160 101.64
2 2 0 198 140
3 2 0 254 130
4 4 0 176 130
5 0 0 210 98
6 2 0 150 116
7 2 0 168 122.6
8 2 0 152 84
9 4 0 128 100
10 2 0 160 105.48
11 2 0 120 92
12 2 0 170 106
2008 1 4 0 240 131.04
2 2 0 240 146
3 4 0 220 134
4 2 0 208 140
5 0 0 224 116
6 0 0 158 111.52
7 0 0 126 88
8 2 0 168 111.6
9 2 0 136 110
10 2 0 142 116
11 4 0 212 121.36
12 2 0 218 115.76
2009 1 0 0 234 145.28
2 0 0 220 149.36
3 0 0 212 144
4 2 0 184 120
5 4 0 178 116
6 4 2 250 155.92
7 4 0 166 113.84
8 4 0 162 122
9 4 2 46 108.84
10 42 20 196 61.06104651
11 2 0 146 105.16
12 2 0 236 155.28
2010 1 4 2 190 147.8
2 2 2 194 160
3 4 2 206 148
4 4 2 184 133.2
5 2 2 206 140
6 2 0 206 112
7 4 2 178 114
8 2 0 188 107.68
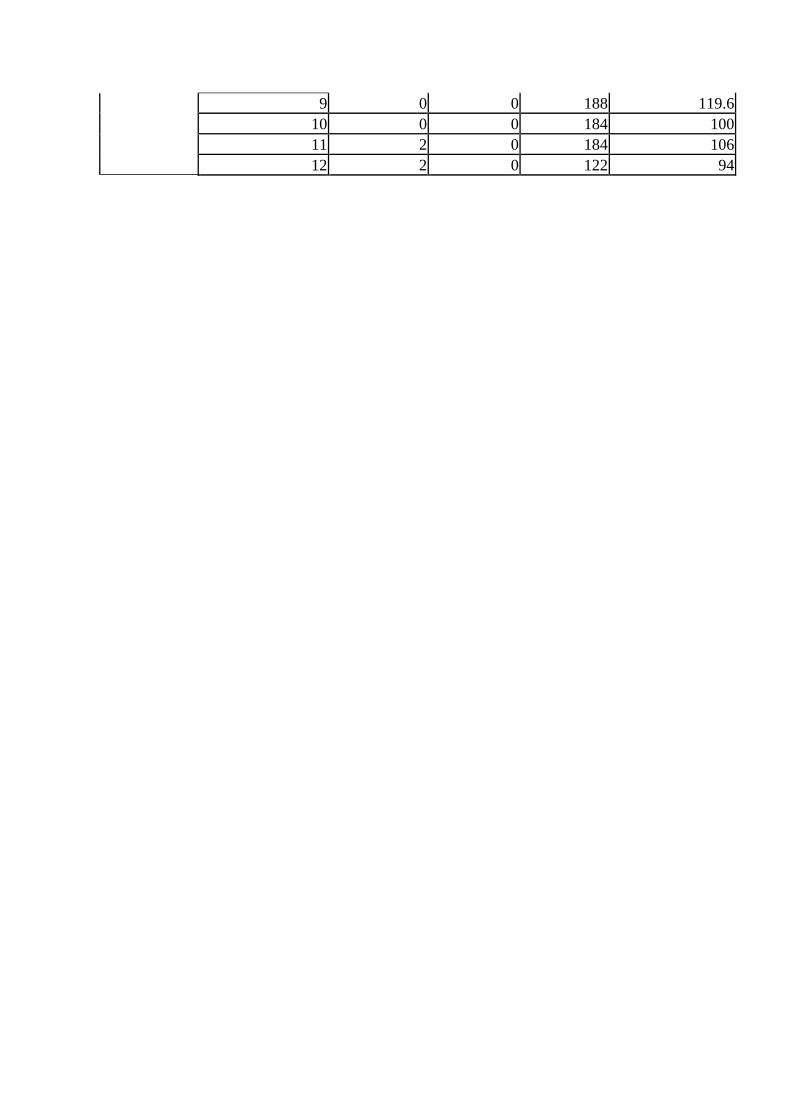
9 0 0 188 119.6
10 0 0 184 100
11 2 0 184 106
12 2 0 122 94
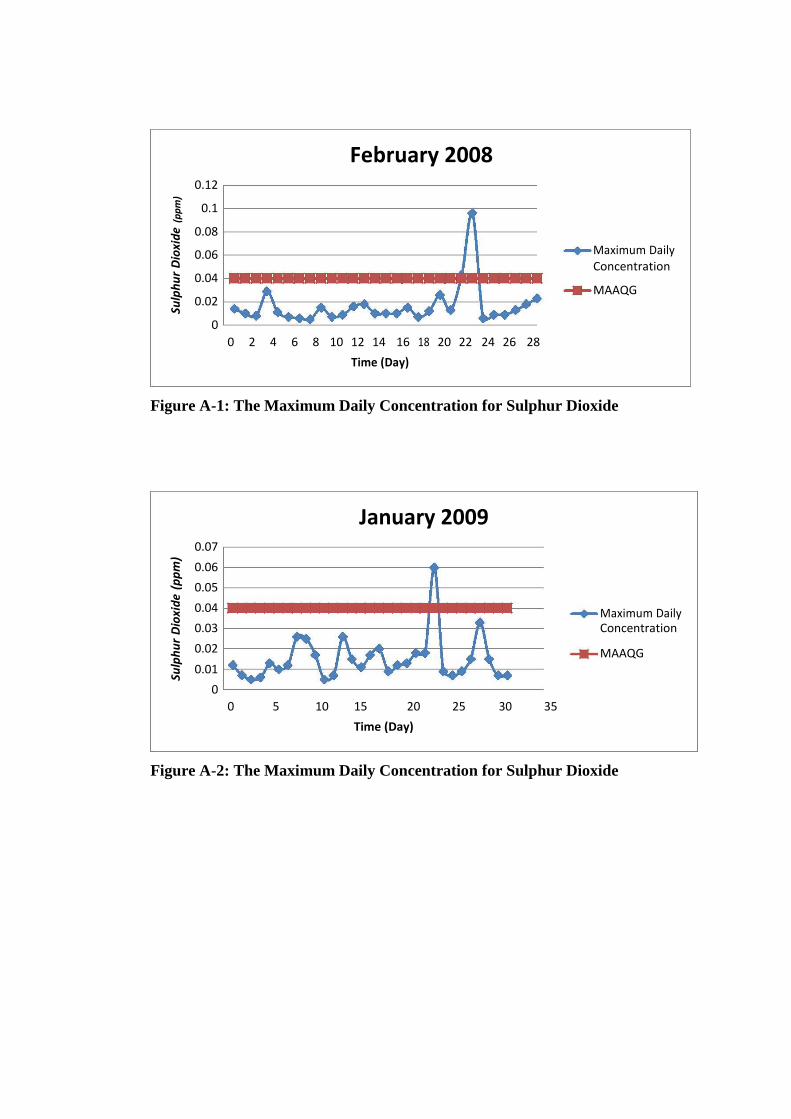
February 2008
0.12
(ppm)
0.1
Dioxide 0.08
0.06 Maximum Daily
Concentration
Sulphur 0.04
MAAQG
0.02
0
0 2 4 6 8 10 12 14 16 18 20 22 24 26 28
Time (Day)
Figure A-1: The Maximum Daily Concentration for Sulphur Dioxide
January 2009
(ppm)
0.07
0.06
0.05
Dioxide
0.04 Maximum Daily
0.03 Concentration
Sulphur
0.02 MAAQG
0.01
0
0 5 10 15 20 25 30 35
Time (Day)
Figure A-2: The Maximum Daily Concentration for Sulphur Dioxide
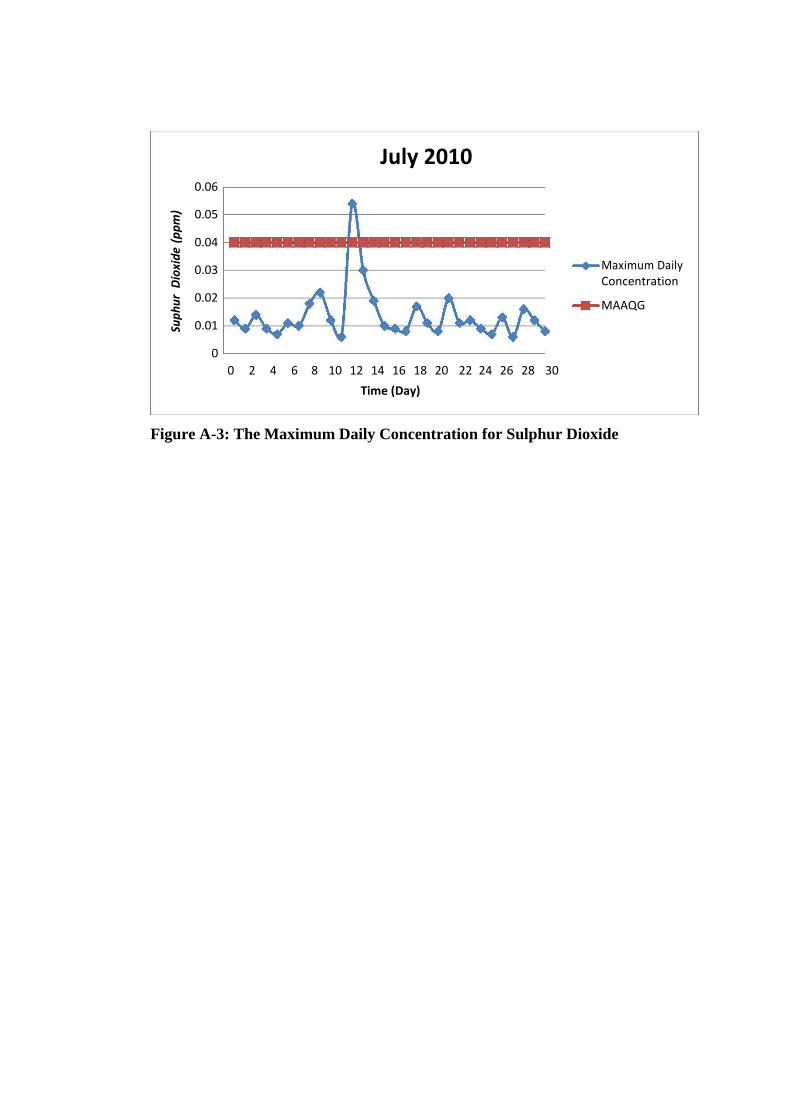
July 2010
0.06
(ppm) 0.05
0.04
Dioxide
0.03 Maximum Daily
Concentration
Suphur 0.02
MAAQG
0.01
0
0 2 4 6 8 10 12 14 16 18 20 22 24 26 28 30
Time (Day)
Figure A-3: The Maximum Daily Concentration for Sulphur Dioxide
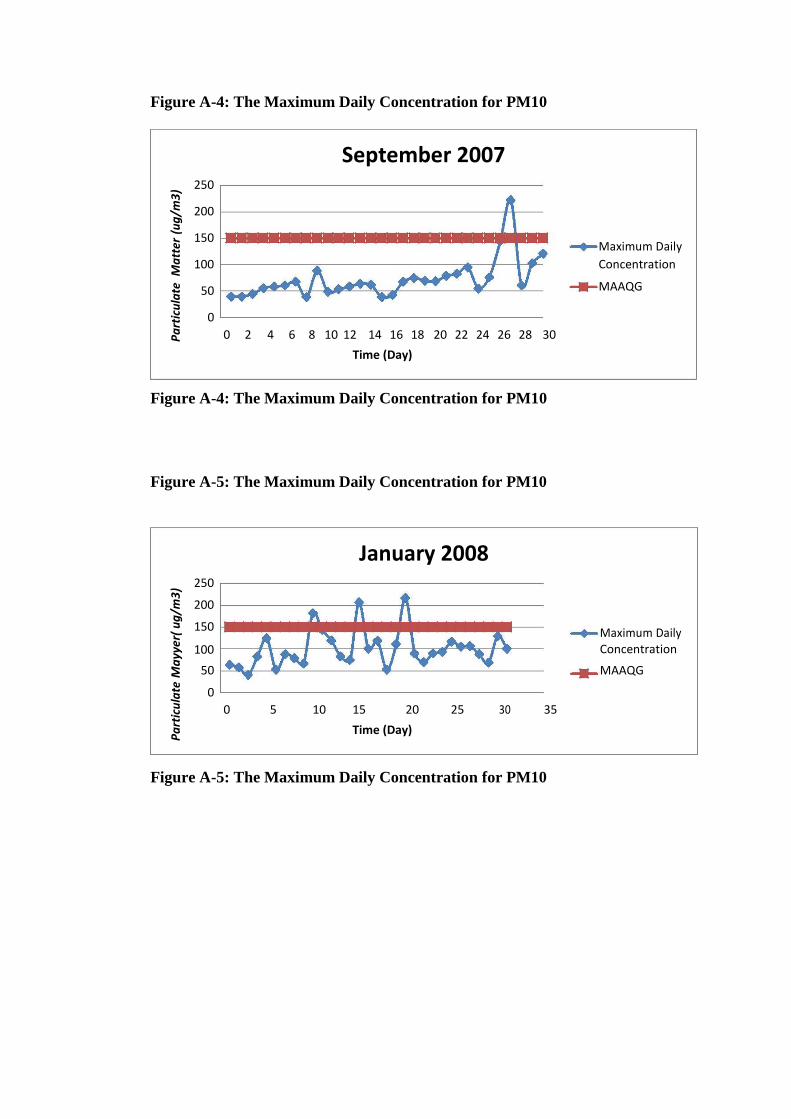
Figure A-4: The Maximum Daily Concentration for PM10
September 2007
(ug/m
3) 250
200
150
Matter
Maximum Daily
100 Concentration
Particulate
50 MAAQG
0
0 2 4 6 8 10 12 14 16 18 20 22 24 26 28 30
Time (Day)
Figure A-4: The Maximum Daily Concentration for PM10
Figure A-5: The Maximum Daily Concentration for PM10
January 2008
ug/m
3) 250
200
150 Maximum Daily
Mayyer(
100 Concentration
50 MAAQG
Particulate
0
0 5 10 15 20 25 30 35
Time (Day)
Figure A-5: The Maximum Daily Concentration for PM10
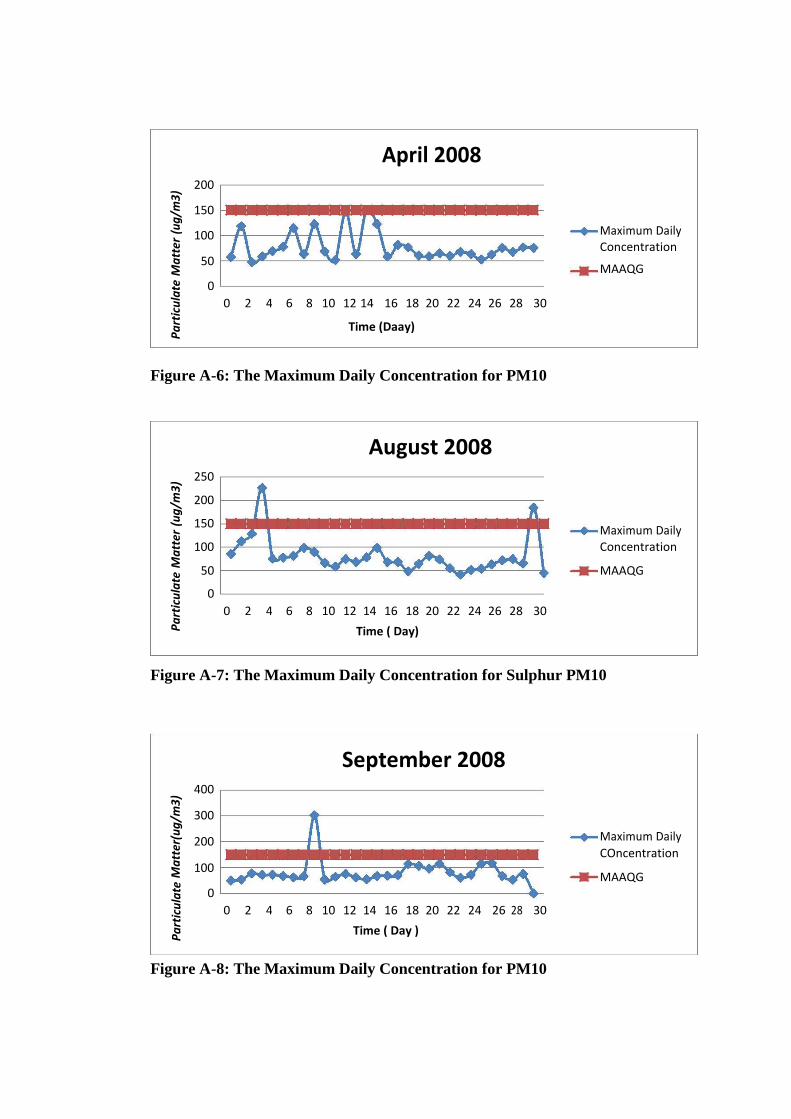
April 2008
(ug/m
3) 200
150
100 Maximum Daily
Matter
Concentration
50 MAAQG
Particulate
0
0 2 4 6 8 10 12 14 16 18 20 22 24 26 28 30
Time (Daay)
Figure A-6: The Maximum Daily Concentration for PM10
August 2008
(ug/m
3) 250
200
150 Maximum Daily
Matter
100 Concentration
50
MAAQG
Particulate
0
0 2 4 6 8 10 12 14 16 18 20 22 24 26 28 30
Time ( Day)
Figure A-7: The Maximum Daily Concentration for Sulphur PM10
September 2008
Matter(ug/m
3) 400
300
200 Maximum Daily
COncentration
100 MAAQG
Particulate
0
0 2 4 6 8 10 12 14 16 18 20 22 24 26 28 30
Time ( Day )
Figure A-8: The Maximum Daily Concentration for PM10
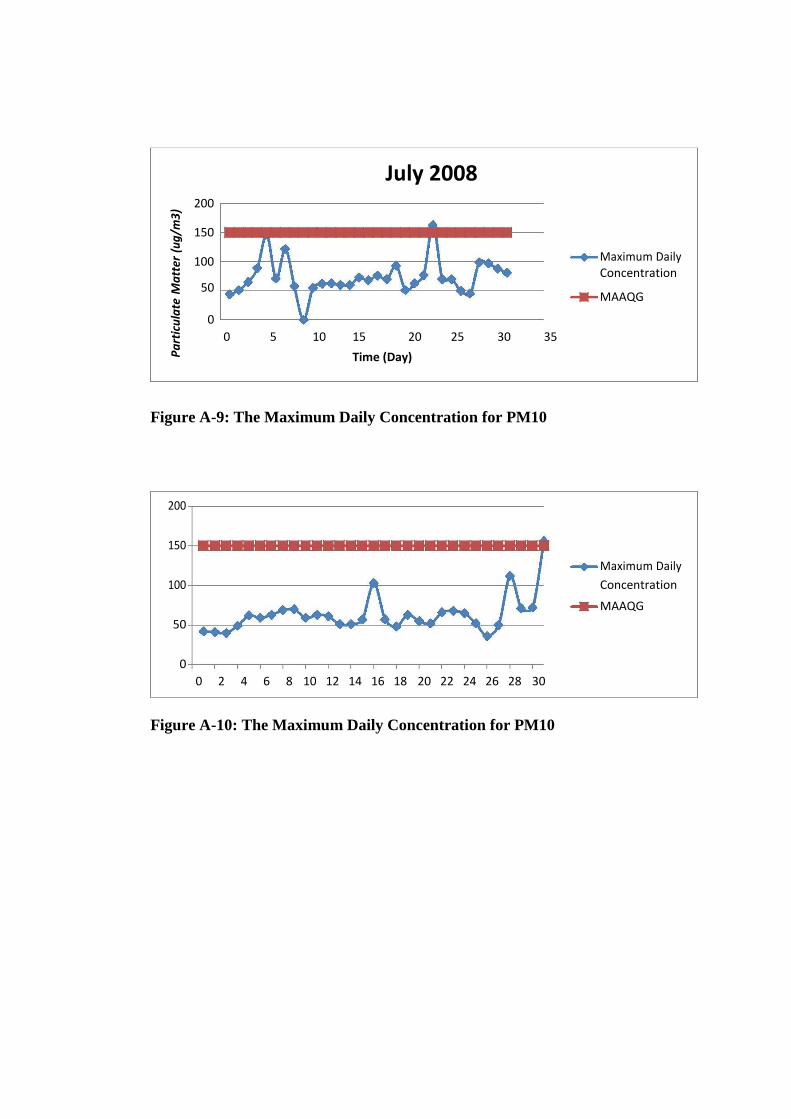
July 2008
(ug/m
3) 200
150
Maximum Daily
Matter
100
Concentration
50 MAAQG
Particulate
0
0 5 10 15 20 25 30 35
Time (Day)
Figure A-9: The Maximum Daily Concentration for PM10
200
150
Maximum Daily
100 Concentration
MAAQG
50
0 0 2 4 6 8 10 12 14 16 18 20 22 24 26 28 30
Figure A-10: The Maximum Daily Concentration for PM10
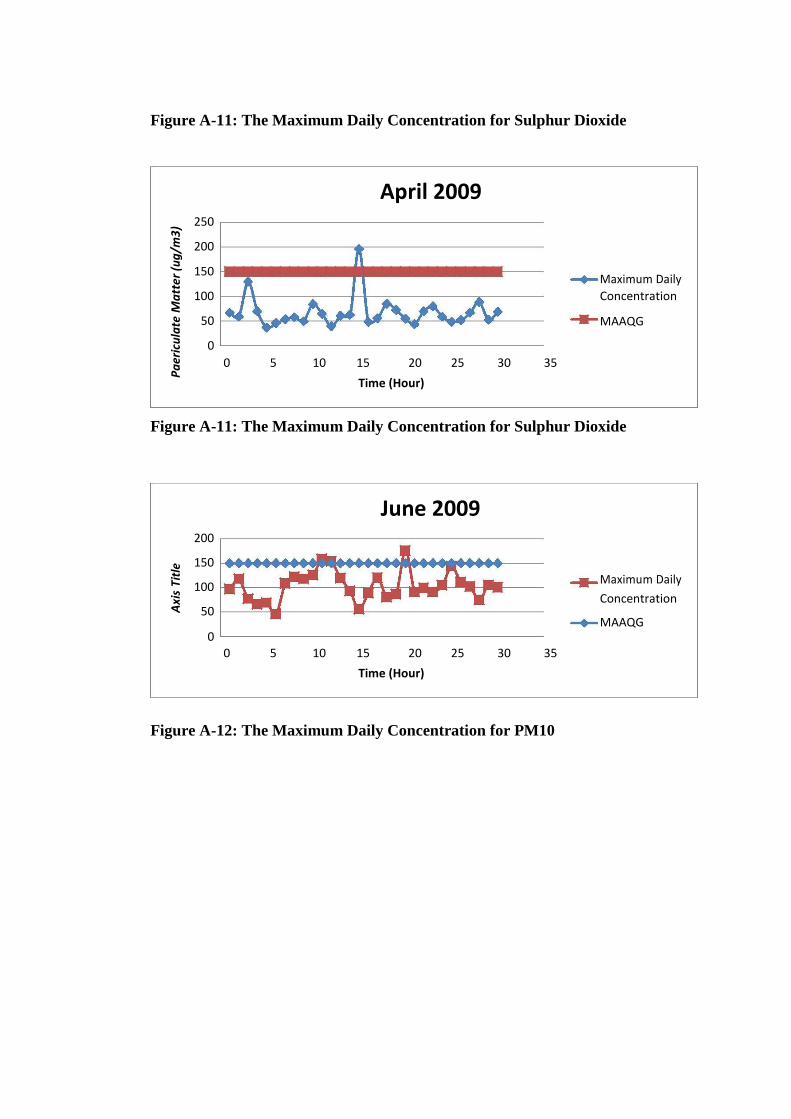
Figure A-11: The Maximum Daily Concentration for Sulphur Dioxide
April 2009
(ug/m
3) 250
200
150
Matter
Maximum Daily
100 Concentration
Paericulate
50 MAAQG
0
0 5 10 15 20 25 30 35
Time (Hour)
Figure A-11: The Maximum Daily Concentration for Sulphur Dioxide
June 2009
200
Title 150
100 Maximum Daily
Axis
Concentration
50
MAAQG
0
0 5 10 15 20 25 30 35
Time (Hour)
Figure A-12: The Maximum Daily Concentration for PM10
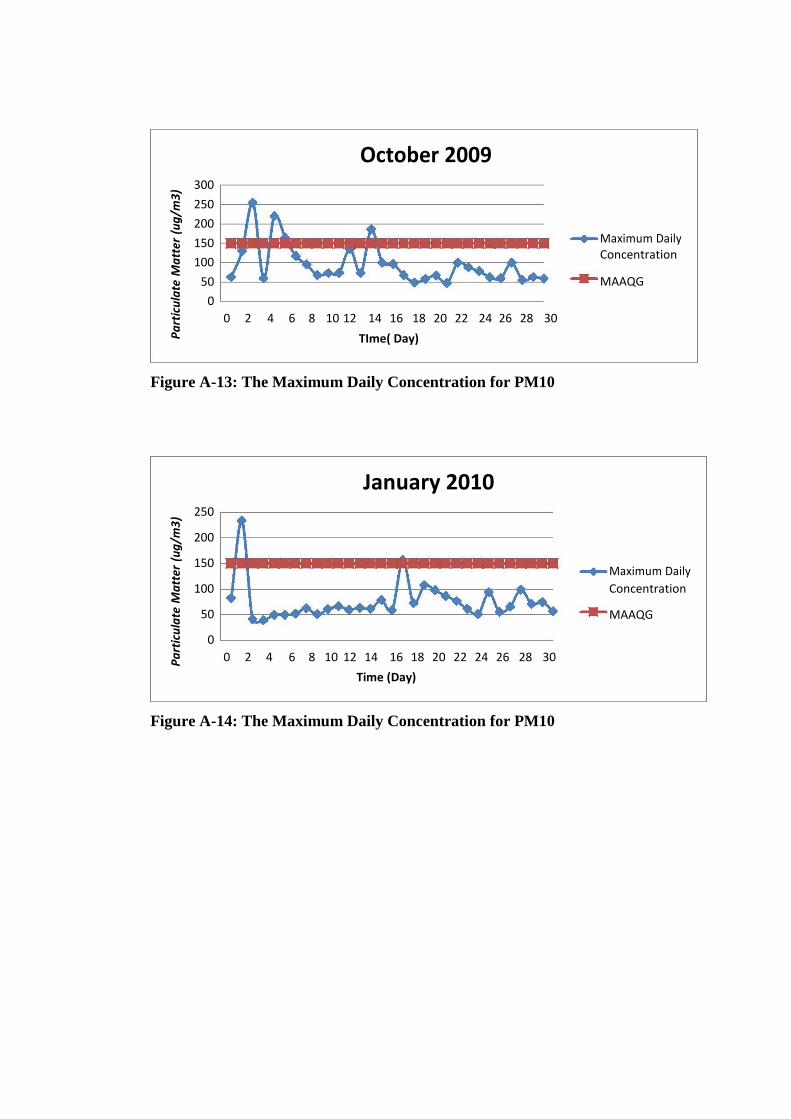
October 2009
(ug/m
3) 300
250
200
Maximum Daily
Matter
150
Concentration
100
50
MAAQG
Particulate
0
0 2 4 6 8 10 12 14 16 18 20 22 24 26 28 30
TIme( Day)
Figure A-13: The Maximum Daily Concentration for PM10
January 2010
(ug/m
3) 250
200
150
Matter
Maximum Daily
100 Concentration
Particulate
50 MAAQG
0
0 2 4 6 8 10 12 14 16 18 20 22 24 26 28 30
Time (Day)
Figure A-14: The Maximum Daily Concentration for PM10
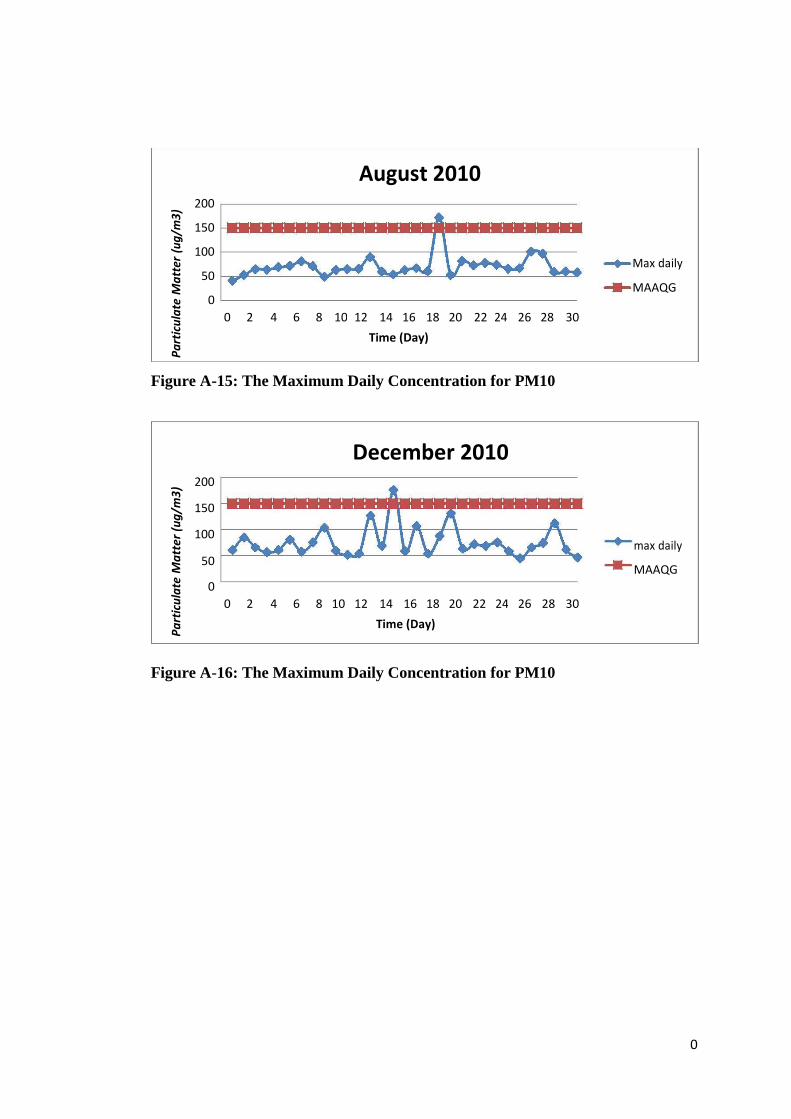
0
August 2010
(ug/m
3) 200
150
100
Matter
Max daily
50
MAAQG
0
Particulate
0 2 4 6 8 10 12 14 16 18 20 22 24 26 28 30
Time (Day)
Figure A-15: The Maximum Daily Concentration for PM10
December 2010
(ug/m
3) 200
150
100
Matter
max daily
50 MAAQG
Particulate
0
0 2 4 6 8 10 12 14 16 18 20 22 24 26 28 30
Time (Day)
Figure A-16: The Maximum Daily Concentration for PM10