Embed Size (px)
Citation preview

Progress Report June 2017
- Consolidated Accounts -

Corporate Bodies
Board of the General Assembly José Lourenço Abreu Teixeira – Chairman Manuel Fernando Monteiro da Silva – Deputy Chairman
Jorge Manuel Coutinho Franco da Quinta – 1st Secretary Maria Olívia Almeida Madureira – 2nd Secretary
Board of Directors José Reis da Silva Ramos – Chairman
Maria Angelina Martins Caetano Ramos – Member Salvador Acácio Martins Caetano – Member Miguel Pedro Caetano Ramos – Member Matthew Peter Harrison – Member
Nobuaki Fujii – Member Rui Manuel Machado de Noronha Mendes – Member
Yoichi Sato – Alternate Member
Supervisory Board José Domingos da Silva Fernandes - Chairman Alberto Luis Lema Mandim – Member Daniel Broekhuizen – Member Maria Lívia Fernandes Alves – Alternate Member Kenichiro Makino – Alternate Member
Statutory Auditor José Miguel Dantas Maio Marques, representing Pricewaterhouse Coopers & Associados - Sociedade de Revisores Oficiais de Contas, Lda. [Statutory Auditors Firm] António Joaquim Brochado Correia - Alternate Member

REPORT INTRODUCTION The following progress report has been prepared in accordance with Article 246(1)(b) of the Portuguese Securities Code. For each of the Companies included in the consolidation scope of Toyota Caetano Portugal, it contains all the main events occurred during the period under analysis, as well as their impact on the financial statements. At the same time, the main expectations for the 2nd half of the current year are also presented, albeit in a summarised way.
TOYOTA CAETANO PORTUGAL, S.A.
INDUSTRIAL ACTIVITY
OVAR MANUFACTURING UNIT In the first semester of 2017, the Ovar Manufacturing Unit produced a total of 1,288 vehicles. This figure is slightly above the expectations for this period (1,180 vehicles). The PPO/PDI activity converted/prepared 2,414 units, a result that is higher than the one achieved in the same period of the previous year.
PRODUCTION 2017 (JAN-JUN) 2016 2015 2014 2013 Toyota Physical Units 1,288 1,823 1,629 1,664 1,111 Conversions 2,414 3,773 4,353 3,271 2,339 Total number of Employees 182 186 192 170 181

Throughout this first semester, TCAP – Ovar Manufacturing Unit worked in close cooperation with TMC (Toyota Motor Corporation), in order to minimise the impact of the Minor Change in the production volume, planned for the second semester. However, we should highlight that we are now able to ensure a significant increase in the number of units assembled in 2017, compared with the volumes achieved in 2016. On the other hand, the actual production costs are perfectly in line with the budgeted figures. Until the end of 2017, there are plans for a greater emphasis on reducing overall costs at the Ovar Manufacturing Unit.
We also highlight the following events: - A new time bank signed between Employees and the Company, making labour more flexible in order to meet market needs and fluctuations. - Audit conducted by APCER as part of the Quality Management System, under ISO 14001 and Quality ISO 9001 (both follow-ups), on 15, 16 and 17 May. - In response to the results of an Organisational Climate Study, the Ovar Manufacturing Unit has been investing in the implementation of various activities and measures aimed at increasing it's employees' satisfaction and motivation levels.
COMMERCIAL ACTIVITY VEHICLES
TOTAL AUTOMOTIVE MARKET
In the 1st semester of 2017, the rising trend observed over the last few years remained unchanged, with the overall market growing some 8%. This recovery is based on positive developments in both passenger vehicles and light commercial vehicles, which have grown by 7.2% and 12.6%, respectively.
118.626 127.199
16.61318.698
Jan-Jun '16 Jan-Jun '17Light Passenger Vehicles Light Commercial Vehicles
12,6%
7,2%
7,9%
Source: ACAP (Portuguese Automobile Trade Association)

TOYOTA
In the first half of the year, Toyota achieved a total of 5,610 units sold, translating into a 5.2% increase, as compared to the same period last year.
This results in a total market share of 3.8% in the first half of the year.
Toyota's performance was different, depending on whether we are talking about Light Passenger Vehicles or Light Commercial Vehicles:
- In Light Passenger Vehicles, Toyota grew by around 1.3%, with a market share of 3.7%.
This performance, weaker than the market developments observed in the 1st semester, is mainly a result of the fact that the model with the highest sales volume - Yaris - witnessed the arrival of a new generation which only began to be sold in June; until then, the sales were based on the "clearance" of the previous model, with an obvious impact in terms of sales volume.
On a positive note, we highlight the increase in th e sales of hybrid vehicles (+73% compared to 2016), boosted by the new hybrid model C-HR, of one of the fastest-growing segments – Crossovers.
- As far as Light Commercial Vehicles , are concerned, Toyota shows a quite strong growth of 33% , with a market share of 4.6% (+0.7 percentage points compared to 2016).
This result is associated with the good performance of the Hilux and Proace models, recently launched in the market.
Prospects are favourable for the second semester of the year.
In terms of Light Passenger Vehicles, we expect the good performance of the brand to improve, thanks to the investment in hybrid vehicles and to the renewed Yaris model, launched at the end of the 1st semester.
With regard to the Commercial Vehicles market, the Hilux and Proace models are expected to continue to show a good performance.
4.684 4.745
651865
Jan-Jun '16 Jan-Jun '17Light Passenger Vehicles Light Commercial Vehicles
32,9%
1,3%
5,2%
Source: ACAP (Portuguese Automobile Trade Association)

PREMIUM MARKET The evolution of the premium market in the 1st half of 2017 was also positive. This market segment witnessed a slight growth of 2%, a figure lower than the one reached in the total passenger vehicle market.
LEXUS
Lexus showed a growth of approximately 22% over the previous year, a figure higher than that of the overall market. This fact resulted from an increase of 0.1 p.p. in the market share of the premium segment.
The favourable developments in sales are expected to continue throughout the 2nd semester, thanks to the growing appetite of the market for hybrid models, the renovation of the CT 200h and NX 300h models, and the launch of the new high-performance hybrid coupe LC 500h.
186226
Jan-Jun '16 Jan-Jun '17Lexus
21,5
Source: ACAP (Portuguese Automobile Trade Association)
27.544
28.180
Jan-Jun '16 Jan-Jun '17Premium
2%
Source: ACAP (Portuguese Automobile Trade Association)

INDUSTRIAL MACHINERY
Toyota Industrial Equipment
TOTAL MARKET TOYOTA + BT SALES 1st semester Variation 1st semester '16 1st semester '17 Variation
'16 '17 % Qty. Share Qty. Share % Forklift Trucks 581 596 2.6% 195 33.6% 159 26.7% -18.5% Warehouse Equipment 773 677 -12.4% 300 38.8% 156 23.0% -48.0%
Total 1354 1273 -6.0% 495 36.6% 315 24.7% -36.4% Source: ACAP (Portuguese Automobile Trade Association)
Market
In the 1st semester of 2017, the domestic market for cargo handling machines (CHM) decreased by approximately 6%, compared to the same period of 2016. This variation resulted in a 2.6% growth in the forklift trucks segment and a 12.4% decrease in the warehouse equipment segment. The downturn in the Warehouse Equipment market is influenced by the lack of significant fleet deals in the 1st half of the year.
Toyota + BT Sales
Overall Toyota / BT sales decreased 36.4%. This decrease is primarily justified by the lack of relevant fleet deals in the first semester. Upon performing the corresponding analysis by segment, we noticed the following: With regard to Toyota Forklift Trucks 155 units were sold in the first 6 months, representing a 18.5% drop in sales and an accumulated share quota of 26.7%. In relation to BT warehouse equipment 156 units were sold in the first 6 months, representing a 48% drop in sales and an accumulated share quota of 23%. This is the segment on which the lack of fleet deals has a greater impact. Overall, Toyota sales represented an accumulated market share of 24.7%.
Year-end outlook
There will be a slight slowdown in activity in July and August, due to the summer holidays. However, as usual, our activity is expected to resume a regular pace, or even speed up, between September and the end of the year.

We should also note that, in the meantime, we have concluded a considerable fleet deal (approximately 290 units), which will have an impact on the 2nd semester. With regard to the budget, in terms of number of units, we expect to meet it, as its degree of implementation by June'17 amounts to 45% of the annual budget.
AFTER-SALES In the first half of 2017, the overall turnover of the After-Sales Division totalled 18.5 million euros. This figure includes the "Guarantee + Extension" and "Total Assistance" services, whose turnover in this period corresponds to just over 0.5 million Euros. The commercial spare parts activity (original & domestic incorporation), which excludes warranty services and "other services" mentioned above, amounted to 14,028,257€. This amount represents a growth of 10.1% over the same period of 2016.
Sales of Spare Parts 1st Semester 2016
Sales of Spare Parts 1st Semester 2017
Growth % 2017/2016
12,746 M€ 14,028 M€ 10.1%
The turnover in accessories (including merchandising) totalled 1,7M€ in the first semester of 2017. These sales were 16.6% higher than the figures achieved in the previous year, and translated into a growth in the incorporation per new vehicle sold.
Sales of Accessories 1st Semester 2016
Sales of Accessories 1st Semester 2017
Growth % 2017/2016
1,445 M€ 1,685 M€ 16.6%
Notes: The fact that the existing Toyota fleet is shrinking and ageing is mainly the result of the sharp market drop occurred during the recent crisis, a circumstance that we continue to witness this year. However, TCAP remains committed to implementing a customer-oriented strategy (360º strategy), focused on meeting all the customer's needs and providing an excellent service. As a result of this strategy, we were able to increase customer retention, promote the sale of original Toyota spare parts and accessories and, last but not least, increase the customer satisfaction/recommendation indexes. The most important initiatives are described below:
• New edition of the annual VCI (Value Chain Index) challenge for the year 2017. This initiative encourages every Toyota dealer to achieve good performances in some of the indicators seen as strategic for the After-Sales business. These indicators include: proactive customer warning programs, the active reception process, customer retention services (insurance, maintenance contracts, ...), the promotion of the sale of accessories and the implementation of specialised services for hybrid vehicles, in addition to the control of all technical activities.

• Extension of the 5+ Service offer (for customers owning vehicles over 5 years old). This service includes competitive fixed prices (nationwide) for replacing oil and filters, clutch parts, shock absorbers and timing belts. In 2017, the clutch pack was extended to the Auris model.
• Use of new forms of communication in the Toyota Warning Program, namely e-card and SMS. As previously done with postcards, Toyota owners are invited to submit their vehicles to the regular pre-inspection and/or Scheduled Servicing.
• Development of Maintenance Contracts for Yaris 2017 and Prius Plug-in. • Extension of maintenance contracts for used vehicles. We intend to offer an alternative
for vehicles whose initial maintenance contract has expired. The new used-vehicle contracts start at the 90,000 Km service and ensure that customers visit the network workshops over the following 3, 4 or 5 years.
• Integration of the accessory promotion program into the Sales Challenge, which combines vehicle sales results with other indicators (accessories, financing, ...).
• A new line of Toyota merchandising was launched to respond to the enthusiasm and passion of the fans of team Toyota Gazoo Racing,
• Continuous promotion of tyre deals, as part of specific campaigns for the different brands. • Launch of the new Uniblade & Flatblade windshield wiper range. The new wipers have an
innovate design and meet the current market demands. The aim is to increase the sale of this type of spare parts, as well as the levels of detection of sale opportunities during the reception process.
• Launch of the Toyota Optiwhite light bulbs, which, in addition to enhancing the vehicle's external look, improve driving safety in all weather conditions.
CAETANO AUTO, S.A. • Using the Bank of Portugal's estimate as reference, the Portuguese economy will grow by
2.5% in 2017, a performance that is expected to be primarily underpinned by strong exports, but also by a recovery in domestic demand, namely in terms of investment.
• So, 2017 comes across as a year of recovery of the Portuguese economy and Caetano Auto's activity appears to be following that trend, showing improvements already in the 1st semester, when compared to the same period of the previous year.
• Accordingly, turnover in the 1st semester exceeded 102 million euros, surpassing the 93 million euros achieved in the previous year and reaching a growth of 10%. This growth was supported by a contribution of 11% from vehicles, 7.6 million more than in 2016, and 6% from after-sales, 1.4 million more than in 2016.
• We should highlight that all efforts made by Caetano Auto with regard to continuous improvement within the scope of its various activities has been yielding rather interesting results, both in terms of activity growth and in terms of cost reduction, which justify the strong growth of the company's profitability.

• With regard to expenditure, the careful management of the Company's costs allowed for a decrease in expenses, particularly staff costs, compared to the previous year, despite the growth in sales.
• As for depreciations and amortisations, they continue to represent more than 1 million euros per semester against the assets held, mainly properties, thus having a significant impact on the results obtained by the company.
• With regard to new facilities, we should highlight the opening, in December of last year, of a
Caetano Auto unit in Santa Maria da Feira, which became fully operational at the beginning of 2017 (vehicles and after-sales).
• In view of the above, in the year under analysis, it was possible to observe a more than adequate business profitability, which offers prospects for a clearly positive year in terms of results.
CAETANO AUTO CABO VERDE, S.A.
Economic Environment Indicator * Despite the fact that the indicators provided by INE Cabo Verde refer to the 1st quarter of 2017, we can see that the climate indicator followed the upward trend evidenced in the last few quarters, i.e., the economy continued to grow at a steady pace in the first quarter of 2017. This indicator reached the highest value in the last twenty three (23) consecutive quarters, showing positive developments when compared to the same period of 2016, thus demonstrating that the economic scenario is favorable. This diagnosis results from a synthesis of various assessments provided by businessmen from the areas of construction, retail sales and tourism, as well as from the manufacturing industry, the transport industry and ancillary transport services. *Source (INE CV Surveys)
COMMERCIAL ACTIVITY
2016 2017 Variation
SEGMENT BRAND Qty. % Light-Duty Passenger Vehicles Toyota 42 30 -12 -28.6% Light Commercial Vehicles Toyota 116 140 +24 +19% Heavy Commercial Vehicles Toyota 10 9 -1 -10.00%
168 179 +11 +6,5%
In the 1st semester of 2017, and compared to the same period of the previous year, Caetano Auto CV, SA sold an additional 11 physical units, which corresponds to a growth of 6.5% in new vehicles.

As shown in the table above, this growth was not uniform, as the strong increase in Commercial Vehicles, with significant contributions from the Hilux and Fortuner models, was partially offset by a reduction in the sales of Passenger Vehicles, with drops in the Yaris and Avensis models. We should highlight the entry into the market of new players, mainly from Asian origin, whose highly competitive prices will surely force us to review our commercial strategy for this market. After-Sales
2016 2017 Varia tion
SALES Value % Parts/Accessories 68,860,583 71,509,498 +2,648,915 +3.84%
Workshop (Labour) 17,808,910 14,893,162 -2,915,748 -16.37%
86,669,493 86,402,660 -266,833 0.30% (Amounts in ECV) With regard to After-Sales, we can see that there was some stagnation in terms of transaction amounts when compared to the same period of the previous year, although we should recognise that the growth in over-the-counter sales of spare parts and accessories was accompanied by a drop in the services provided by the workshops, namely in terms of the labour involved in crash repairs. In the 1st semester we strengthened our partnership with ENACOL by launching our fuel sales operations in the Sal Island, reaching a turnover of approximately 550 MECV in the period under analysis. Despite the challenges posed by the competition, we believe that 2017 will be another year marked by an adequate profitability within the scope of this area of business based in Cape Verde.
CAETANO RENTING, S.A.
In the period under analysis we notice a substantial growth of the Caetano Renting fleet, when compared to the same period of the previous year.
This increase of 54.82% resulted in an operating fleet with 3,070 units and is mainly due to a growth in the Rent-a-Car business, which is currently using 73% of the total Caetano Renting fleet.

In addition to renting passenger vehicles, we also continue to rent industrial equipment, which represents approximately 16% of the total fleet.
In view of the above, we can see that there was an increase in turnover of approximately 57.34%, compared to the same period of the previous year.
In terms of prospects for the current year, and considering the regular course of business, we believe that Caetano Renting will once more make a positive contribution to the consolidated results of the Toyota Caetano Group.
PERSONNEL MANAGEMENT AND DEVELOPMENT Over the last few years, the growing need to attract and retain Talent has led the Organisations to implement Employer Branding strategies. This investment allows cultivating relationships with and commitments to Employees and other Stakeholders, which are expected to bring functional, emotional and symbolic benefits. This path is also being followed by Toyota Caetano Portugal, which created the Corporate Personnel, Brand and Communication Division (DPC) in January 2015, with the main purpose of turning the Company into an increasingly pleasant place to live and work in, through an integrated people management strategy.
1983
3070
0
1000
2000
3000
4000
Jun 16 Jun 17
2588; 84%
482; 16%
Passenger Vehicles
Industrial Machinery
Jun 16 Jun 17

Acting in the areas of wages and benefits, training and development, careers and compensations, law and employment, and corporate brand and communications, this TCAP structure uses knowledge and tools from the fields of Human Resources and Marketing to fulfil its mission. TCAP believes that, this way, it will be better able to meet the needs and expectations of its internal customers, taking into account their entire internal cycle of development within the Company. In line with this strategy, throughout the first semester of 2017, we highlight the development of a number of integrated personnel management policies, processes and procedures, whose implementation is expected to last for a considerable period of time:
− Management and Development Management, which entails an analysis of the Employees' performance and its alignment with the Toyota Way objectives and values;
− Ser Caetano Training for mid-level managers, with the aim of strengthening the Founder's Culture and Values;
− Strategic Thinking Workshop for Toyota Caetano Portugal senior managers, which resulted in an action plan for the future, based on the following issues: Where do we stand? Where do we want to go? What attitudes do we want to develop? Which Leadership and Professional profiles allow us to face up our challenge?;
− Digitalisation of the administrative personnel management processes, thus streamlining, simplifying and dematerialising them through the use of IT tools, such as "Business Project Management" and the Employee Portal, while training the various Teams in order to raise awareness to new ways of working.
− Launch of the Trainees Program, whose purpose is to attract young people with potential suited to our business needs and to our Corporate Identity, offering them an on-the-job learning experience;
− Redesign and launch of the new Employee Portal, turning it into a tool that plays an increasing useful role in the Employees' everyday lives, both by providing contents that are relevant to the Organisation, and by an easier access and more intuitive browsing;
− Employee Welcome and Integration Manual and Procedure, whose purpose is to create better conditions for the integration of all those who start working in the Organisation, in order to convey an image of the services we provide that is as close to reality as possible, providing all the information that might contribute to foster a good working environment and ensure that they are able to achieve a good performance.
In 2017, our integrated Personnel Management and Internal Marketing policies and initiatives continue to be primarily focused on the recognition and retention of Human Capital with High Potential and Performance, contributing to the satisfaction of our Internal Customers, with the belief that, in this way, we are fostering the satisfaction of our End Customers.

FINANCIAL ACTIVITY Consolidated analysis
During the first half of 2017, the scope of consolidation of the Toyota Caetano Portugal Group remained unchanged, when compared to the end of FY 2016. In 2017, the Group had a turnover of 202 million euros, approximately 25 million euros higher (+14,5%) than that obtained in the same period of 2016. This growth is justified mainly by the growth in the automobile market in Portugal and which was somehow accompanied by the activity levels of the Toyota Caetano Group, but also by the clear growth and solid improvement in the profitability of the project for the assembly of off-road vehicles for export (LC70) at the Ovar manufacturing plant. Therefore, the contribution of the motor vehicle industrial area for turnover is approximately 30 million euros, against 24 million euros recorded in the same period of 2016.
As the main objective of the Group is to maintain the position of the Toyota brand as a benchmark in the automotive market, there was a need to implement a set of strategies aimed at minimizing the least favorable product cycle we have experienced (Yaris), including a slight overall increase in the profit margin, which, together with an appropriate management of business-related costs (Overhead and Staff Costs), allowed achieving an EBITDA of approximately 17 million euros, a result nearly 6.7 million higher (+64.9%) than that recorded in 2016.
46%
3%2%
49%
June 2017
Turnover: 202 M€
44%
3%1%
52%
Toyota Caetano
Portugal
Caetano Auto CV
Caetano Renting
Caetano Auto
June 2016
Turnover: 176 M€

Financial results, which were negative by approximately 1.1 million euros, are higher than the 1 million euros recorded in the same period of 2016, reflecting, however, the increased financing needs incurred by the Toyota Caetano Portugal Group in order to handle the growth in activity. As a consequence of the increase in the rental of transport equipment, there was an increase of approximately 1.4 million euros in the item Amortization and Depreciations, which, combined with the aforementioned factors, resulted in a consolidated net income of around 5 million euros, while in 2016 the amount reached was around 2 million euros. A financial autonomy of 46% reflects an appropriate management of the capital structure. The table below shows comparative indicators, that summarize the evolution of the activity and performance of the Toyota Caetano Portugal Group, in thousands of euros:
Jun 16 Jun 17 Variation
Turnover 176,316 201,868 14.5%
Gross Profit 30,471 37,367 22.6%
% (f) sales 17.3% 18.5%
External supplies and services 18,190 20,216 11.1%
% (f) sales 10.3% 10.0%
Staff expenses 20,044 19,295 -3.7%
% (f) sales 11.4% 9.6%
EBITDA 10,310 17,003 64.9%
% (f) sales 5.8% 8.4%
Operating income 2,942 8,275 181.2%
% (f) sales 1.7% 4.1%
Net financial income -1,010 -1,141 -12.9%
% (f) sales -0.6% -0.6%
Consolidated net income 1,992 5,125 157.3%
% (f) sales 1.1% 2.5%
Net Bank Credit 59,692 62,783 5.2%
Level of financial autonomy
47.2% 46.0%
Gross Profit = Sales+ Service Provided – Costs of sales +- Production Variation
We should emphasize that, according to the projected economic development improvements for Portugal, a growth trend in the automotive sector is expected to continue, especially in the Hybrid segment, which will allow the Toyota Caetano Group to strengthen its sustainability in the market, leading to consistent results.

RISK MANAGEMENT Loans and advances to clients Credit risk at Toyota Caetano, mostly results from loans on its Clients, related to operating activity. The main objective of credit risk management at Toyota Caetano is to ensure effective collection of operating receivables from Clients in accordance with the negotiated terms and conditions. In order to mitigate the credit risk arising from potential default of payment by Clients, the Group companies exposed to this type of risk have: - Established a specific department for analysis and follow-up of Credit Risk; - Implemented proactive credit management processes and procedures, always supported by information systems; - Hedge mechanisms (credit insurances, letters of credit, bank guarantees etc.). Interest Rate Risk As a result of the significant proportion of variable rate debt in its Consolidated Balance Sheet, and of the consequent interest payment cash flows, Toyota Caetano is exposed to interest rate risk. Toyota Caetano has been making use of financial derivatives to hedge, at least partially, its exposure to changes in interest rates. Exchange Rate Risk As a geographically diverse Group, with subsidiaries in Cape Verde, exchange rate risk result essentially from business transactions, arising from the purchase and sale of goods and services in currencies other than the functional currency of each business. The exchange rate risk management policy seeks to minimize volatility in investments and operations stated in foreign currency, by making the Group's income less sensitive to exchange rate fluctuations. The Group's foreign exchange risk management policy is towards case-by-case appreciation of the opportunity to cover this risk, taking particularly into account the specific circumstances of the currencies and countries in question. Toyota Caetano has been making use of financial derivatives to hedge, at least partially, its exposure to changes in exchange rates.

Liquidity Risk Liquidity risk management at Toyota Caetano seeks to ensure that the company has the capacity to obtain the timely funding required to carry out its business activities, implement its strategy and meet its payment obligations when due, while avoiding the need to obtain such funding on unfavorable terms. To this end, liquidity management in the Group includes the following: a) Consistent financial planning based on forecasts of operating cash flows in accordance with different time horizons (weekly, monthly, annual and multi-annual); b) Diversification of funding sources; c) Diversification of maturities of issued debt in order to avoid too excessive concentration for debt payment on short periods of time; d) Using partner Banks to open up short-term credit lines, commercial paper programs and other types of financial operations, to ensure a balance between adequate levels of liquidity and commitment fees incurred.
Subsequent Events Since the end of 1st semester 2017 and up to current date, no relevant facts occurred worth of being mentioned.
STATEMENT Pursuant to article 246 (1-c) of the Código de Valores Mobiliários (Portuguese Securities Code) we state that, to the best of our knowledge, Toyota Caetano Portugal consolidated financial statements, for the 1st half of 2017, were prepared in compliance with the applicable accounting standards, giving a true and fair view of the company's assets and liabilities, financial position and income and that the interim management report faithfully describes the information required under article 246 (2) of CVM. Vila Nova de Gaia, 31st August 2017
The Board of Directors
José Reis da Silva Ramos – Chairman Maria Angelina Martins Caetano Ramos Salvador Acácio Martins Caetano Miguel Pedro Caetano Ramos Matthew Peter Harrison Nobuaki Fujii Rui Manuel Machado de Noronha Mendes

INFORMATION ON THE PARTICIPATION OF THE
MANAGING AND SUPERVISORY BOARDS OF
TOYOTA CAETANO PORTUGAL, S.A.
(as per article 447 of the Companies Code and according to Article 9(d) and Article 14(7), both of CMVM Regulation
5/2008)
In compliance with the provisions of article 447 of the Portuguese Commercial Companies Code, it is hereby declared that, on 30 June 2017, the members of the Company's management and supervisory boards did not hold any of its shares or bonds. Furthermore, it is hereby stated that the members of the Company's management and supervisory boards were not engaged, during the first semester, in any acquisitions, encumbering or disposals involving the Company's shares or bonds. It is further stated that the Company's securities held by companies in which the directors and auditors hold corporate positions are as follows: - the shareholder Salvador Caetano Auto, SGPS, S.A. (of which Eng. Salvador Acácio Martins Caetano is the Chairman of the Board of Directors, and Dr. Maria Angelina Martins Caetano Ramos is the Vice-Chairman of the Board of Directors Eng. Miguel Pedro Caetano Ramos is a Member of the Board of Directors) performed no transactions, and so, on 30 June 2017, held 21,288,281 shares with a nominal value of € 1.00 each. - the shareholder FUNDAÇÃO SALVADOR CAETANO (of which Eng. José Reis da Silva Ramos is the Chairman of the Board of Directors, Dr. Maria Angelina Martins Caetano Ramos is the spouse of the Chairman of the Board of Directors, and Eng. Salvador Acácio Martins Caetano and Dr. Rui Manuel Machado de Noronha Mendes are Members of the Board of Directors) performed no transactions, and so, on 30 June 2017, held 138,832 shares, with a nominal value of 1 euro each. - the sharedholder COVIM – Sociedade Agrícola, Silvícola e Imobiliária, S.A. (of which Dr. Maria Angelina Martins Caetano Ramos is the Chairwoman of the Board of Directors, and Eng. José Reis da Silva Ramos is the spouse of the Chairwoman of the Board of Directors) performed no transactions, and so, on 30 June 2017, held 393,252 shares, with a nominal value of 1 euro each. - the sharedholder COCIGA - Construções Civis de Gaia, S.A. (of which Dr. Maria Angelina Martins Caetano Ramos is the Chairwoman of the Board of Directors, Eng. José Reis da Silva Ramos is the spouse of the Chairwoman of the Board of Directors, and Eng. Salvador Acácio Martins Caetano is a Member of the Board of Directors) performed no transactions, and so, on 30 June 2017, held 290 shares, with a nominal value of 1 euro each.

For the purpose provided for in the final section of article 447(1) of the Commercial Companies Code (companies in a control or group relationship with the company), it is stated that: • Eng. José Reis da Silva Ramos , Chairman of the Board of Directors, holds:
- 39.49%1 of the share capital of Group Salvador Caetano, SGPS, S.A., a company in a control relationship with this Company; 1 This percentage includes shares held by the spouse • Dr. Maria Angelina Martins Caetano Ramos , Member of the Board of Directors, holds: - 39.49%1 of the share capital of Group Salvador Caetano, SGPS, S.A., a company in a control relationship with this Company; 1 This percentage includes shares held by the spouse • Eng. Salvador Acácio Martins Caetano , Member of the Board of Directors, holds: - 39.49%1 of the share capital of Group Salvador Caetano, SGPS, S.A., a company in a control relationship with this Company; 1 This percentage includes shares held by the spouse • Eng. Miguel Pedro Caetano Ramos , Member of the Board of Directions, holds: - 0.00223% of the share capital of Grupo Salvador Caetano, SGPS, S.A., a company in a control relationship with the Company. .

INFORMATION REGARDING THE PARTICIPATION OF SHAREHOL DERS IN
TOYOTA CAETANO PORTUGAL, S.A.
In accordance with article 448(4) of the Commercial Companies Code, the following is the list of shareholders that, on 30 June 2017, held, at least, 10%, 33% or 50% of the share capital of this company, as well as of the shareholders that have ceased to hold the aforementioned capital percentages:
Shareholders Shares
Holders of at least 10%
Held 1 Purchased Sold Held 2
31.12.2016 2017 2017 30.06.2017
TOYOTA MOTOR EUROPE NV/SA 9,450,000 -- -- 9,450,000
_____________________________________________________________________________________________
1 Share capital on 31/12/2016: € 35,000,000.00, represented by 35,000,000 shares with a nominal value of € 1.00 each. 2 Share capital on 30.06.2017: € 35,000,000.00, represented by 35,000,000 shares with a nominal value of € 1.00 each.
Shareholders Shares Holders of at least 50% Held 1 Purchased Sold Held 2
31/12/2016 2017 2017 30.06.2017
Salvador Caetano – Auto, SGPS, S.A. 21,288,281 -- -- 21,288,281
____________________________________________________________________________________
1 Share capital on 31/12/2016: € 35,000,000.00, represented by 35,000,000 shares with a nominal value of € 1.00 each. 2 Share capital on 30/06/2017: € 35,000,000.00, represented by 35,000,000 shares with a nominal value of € 1.00 each.

QUALIFIED SHAREHOLDINGS
(Under the terms of CMVM Regulation
5/2008)
On 30 June 2017, the shareholders with qualified shareholdings in the company's share capital are the following:
SHAREHOLDER Shares % of voting rights
___________________________________________________________________________________
Salvador Caetano - Auto - SGPS, S.A. 21,288,281 60.824
Toyota Motor Europe NV/SA 9,450,000 27.000
Salvador Fernandes Caetano (Heirs of) 1,399,255 3.998
___________________________________________________________________________________

1
ASSETS Notes 30/06/2017 31/12/2016
NON-CURRENT ASSETS:
Goodwill
7
611.997
611.997
Intangible assets
8
743.883
1.077.832
Tangible fixed assets
5
105.686.941
86.264.400
Investment properties
6
17.585.691
17.903.011
Available for sale financial assets
9
3.585.698
3.483.128
Deferred tax assets 14 2.077.723 2.194.438
Accounts receivable 11 139.159 26.048
Total non-current assets 130.431.092 111.560.854
CURRENT ASSETS:
Inventories
10
71.793.642
82.791.897
Accounts receivable
11
55.023.724
57.894.408
Other debtors
12
2.994.957
2.999.881
Public entities - Others
20
5.627.359
1.151.938
Public entities - Income taxes 20 - 99.372
Other current assets 13 3.434.613 4.723.329
Cash and cash equivalents 4 7.353.599 14.556.190
Total current assets
146.227.894
164.217.015
Total assets
276.658.986
275.777.869
SHAREHOLDERS' EQUITY & LIABILITIES
EQUITY: Share capital 35.000.000 35.000.000
Legal reserve 7.498.903 7.498.903
Revaluation reserves 6.195.184 6.195.184
Translation reserves
(1.695.238)
(1.695.238)
Fair value reserves - Available for sale financial assets
505.016
402.446
Other reserves
73.725.417
73.024.661
Net income
5.059.897
5.950.756
15
126.289.179
126.376.712
Non-controlling interests 16 1.359.840 1.294.261
Total equity
127.649.019
127.670.973
LIABILITIES:
NON-CURRENT LIABILITIES: Loans 17 31.908.611 32.894.408
Defined benefit obligations 22 8.434.420 8.434.420
Provisions 23 432.259 407.105
Deferred tax liabilities 14 1.702.915 1.717.275
Total non-current liabilities
42.478.205
43.453.208
CURRENT LIABILITIES:
Loans
17
38.228.284
36.326.297
Accounts payable 18 29.411.995 35.509.231
Other creditors 19 2.230.998 1.095.835
Public entities - Others 20 12.936.733 10.321.909 Public entities - Income taxes 20 1.020.416 -
Other current liabilities 21 22.093.617 20.680.411
Defined benefit obligations 22 609.719 691.580
Derivative financial instruments
24
-
28.425
Total current liabilities
106.531.762
104.653.688
Total liabilities 146.009.967 148.106.896
Total liabilities and shareholder' equity
276.658.986
275.777.869
The notes to the financial statements integrates this statement for the period ending at 30 June 2017.
CONSOLIDATED STATEMENT OF FINANCIAL POSITION AT 30 JUNE 2017 AND 31 DECEMBER 2016
(Amounts expressed in Euros)
CHARTERED ACCOUNTANT BOARD OF DIRECTORS ALEXANDRA MARIA PACHECO GAMA JUNQUEIRA JOSE REIS DA SILVA RAMOS –President
MARIA ANGELINA MARTINS CAETANO RAMOS SALVADOR ACÁCIO MARTINS CAETANO MIGUEL PEDRO CAETANO RAMOS MATTHEW PETER HARRISON NOBUAKI FUJII RUI MANUEL MACHADO DE NORONHA MENDES

2
Notes 30/06/2017 30/06/2016 Operating Income: Sales 26 190.303.467 166.250.797 Services rendered 26 11.564.096 10.065.659 Other operating income 29 20.567.657 19.920.201 Variation of products 10 (1.194.186) (174.834) 221.241.034 196.061.823 Operating expenses: Cost of sales 10 (163.306.573) (145.670.389) External supplies and services 27 (20.216.211) (18.189.740) Payroll expenses 28 (19.294.651) (20.043.767) Depreciations and amortizations 5, 6 and 8 (8.728.827) (7.367.586) Provisions 23 (94.828) (98.394) Impairment losses 23 92.732 (252.454) Other operating expenses 29 (1.418.139) (1.497.247) (212.966.497) (193.119.577) Operational Income 8.274.537 2.942.246 Expense and financial losses 30 (1.171.317) (1.085.476) Income and financial gains 30 30.697 75.388 Profit before taxation 7.133.917 1.932.158 Income tax for the year 25 (2.008.441) 59.949 Net profit for the period 5.125.476 1.992.107
Net profit for the period from continuing operations attributable to: Equity holders of the parent 5.059.897 1.962.558 Non-controlling interests 65.579 29.549 5.125.476 1.992.107
Net profit for the period attributable to: Equity holders of the parent 5.059.897 1.962.558 Non-controlling interests 65.579 29.549 5.125.476 1.992.107
Earnings per share: from continuing operations 36 0,146 0,057 Basic 0,146 0,057 from continuing operations 36 0,146 0,057 Diluted 0,146 0,057
The notes to the financial statements integrates this statement for the period ending at 30 June 2017.
CONSOLIDATED INCOME STATEMENT
FOR THE PERIOD ENDED AT 30 JUNE 2017 AND 2016
(Amounts expressed in Euros)
CHARTERED ACCOUNTANT BOARD OF DIRECTORS ALEXANDRA MARIA PACHECO GAMA JUNQUEIRA JOSE REIS DA SILVA RAMOS –President
MARIA ANGELINA MARTINS CAETANO RAMOS SALVADOR ACÁCIO MARTINS CAETANO MIGUEL PEDRO CAETANO RAMOS MATTHEW PETER HARRISON NOBUAKI FUJII RUI MANUEL MACHADO DE NORONHA MENDES

3
CONSOLIDATED STATEMENT OF CHANGES IN SHAREHOLDER'S EQUITY
FOR THE PERIOD ENDED AT 30 JUNE 2017 AND 2016
(Amounts expressed in Euros)
Equity attributable to the parent company Share Legal Revaluation Translation Fair value Other Total Net Non-controlling Capital Reserves Reserves Reserves Reserves Reserves Reserves Profit Subtotal Interests Total Balances at 31 of December 2015 35.000.000 7.498.903 6.195.184 (1.695.238) 382.767 74.490.374 86.871.990 6.134.247 128.006.237 1.647.295 129.653.532 Changes in the period: Application of the consolidated net income 2015 - - - - - 6.134.247 6.134.247 (6.134.247) - - -
Available for sale financial assets fair value changes - - - - (96.360) - (96.360) - (96.360) - (96.360) Others - - - - - (115) (115) - (115) - (115) - - - - (96.360) 6.134.132 6.037.772 (6.134.247) (96.475) - (96.475)
Consolidated net profit for the period - - - - - - - 1.962.558 1.962.558 29.549 1.992.107 Consolidated comprehensive income - - - - (96.360) - (96.360) 1.962.558 1.866.198 29.549 1.895.747 Transactions with equity holders Acquisition of non-controlling interests - - - - - - - - - (54) (54) Distributed dividends - - - - - (5.250.000) (5.250.000) - (5.250.000) - (5.250.000) Balances at 30 of June 2015 35.000.000 7.498.903 6.195.184 (1.695.238) 286.407 75.374.506 87.659.762 1.962.558 124.622.320 1.676.790 126.299.110 Balances at 31 of December 2016 35.000.000 7.498.903 6.195.184 (1.695.238) 402.446 73.024.661 85.425.956 5.950.756 126.376.712 1.294.261 127.670.973 Changes in the period: Application of the consolidated net income 2016 - - - - - 5.950.756 5.950.756 (5.950.756) - - -
Available for sale financial assets fair value changes - - - - 102.570 - 102.570 - 102.570 - 102.570 - - - - 102.570 5.950.756 6.053.326 (5.950.756) 102.570 - 102.570
Consolidated net profit for the period - - - - - - - 5.059.897 5.059.897 65.579 5.125.476 Total comprehensive income for the year - - - - 102.570 - 102.570 5.059.897 5.162.467 65.579 5.228.046 Transactions with equity holders Acquisition of non-controlling interests - - - - - - - - - - - Distributed dividends - - - - - (5.250.000) (5.250.000) - (5.250.000) - (5.250.000) Balances at 30 of June 2017 35.000.000 7.498.903 6.195.184 (1.695.238) 505.016 73.725.417 86.229.282 5.059.897 126.289.179 1.359.840 127.649.019
The notes to the financial statements integrates this statement for the period ending at 30 June 2017.
CHARTERED ACCOUNTANT BOARD OF DIRECTORS ALEXANDRA MARIA PACHECO GAMA JUNQUEIRA JOSE REIS DA SILVA RAMOS –President
MARIA ANGELINA MARTINS CAETANO RAMOS SALVADOR ACÁCIO MARTINS CAETANO MIGUEL PEDRO CAETANO RAMOS MATTHEW PETER HARRISON NOBUAKI FUJII RUI MANUEL MACHADO DE NORONHA MENDES

4
CONSOLIDATED STATMENT OF THE COMPREHENSIVE INCOME
FOR THE PERIOD ENDING AT 30 JUNE 2017 AND 2016
(Amounts expressed in Euros)
30/06/2017 30/06/2016
Consolidated net profit for the period, including non-controlling interests 5.125.476 1.992.107
Components of other consolidated comprehensive income, net of tax,
that could be recycled by profit and loss:
Available for sale financial assets fair value changes (Note 9) 102.570 (96.360)
Consolidated comprehensive income 5.228.046 1.895.747
Attributable to:
Equity holders of the parent company 5.162.467 1.866.198
Non-controlling interests 65.579 29.549
The notes to the financial statements integrates this statement for the period ending at 30 June 2017.
CHARTERED ACCOUNTANT BOARD OF DIRECTORS ALEXANDRA MARIA PACHECO GAMA JUNQUEIRA JOSE REIS DA SILVA RAMOS –President
MARIA ANGELINA MARTINS CAETANO RAMOS SALVADOR ACÁCIO MARTINS CAETANO MIGUEL PEDRO CAETANO RAMOS MATTHEW PETER HARRISON NOBUAKI FUJII RUI MANUEL MACHADO DE NORONHA MENDES

5
CONSOLIDATED CASH FLOWS STATEMENT
OPERATING ACTIVITIES Jun/17 Jun/16 Collections from Customers 205.161.581 174.525.149 Payments to Suppliers (179.084.646) (157.181.045) Payments to Employees (13.855.387) (14.358.360) Operating Flow 12.221.548 2.985.744 Payments of Income Tax (1.040.628) 683.408 Other Collections/Payments Related to Operating Activities (11.518.187) 12.165.218 Cash Flow from Operating Activities (337.267) 15.834.370
INVESTING ACTIVITIES
Collections from: Tangible Fixed Assets 106.630 1.502.275 Interest and Other income - 106.630 110.190 1.612.465 Payments to: Investments - (11) Tangible Fixed Assets (996.674) (13.255.166) Intangible Assets - (996.674) (43.680) (13.298.857) Cash Flow from Investment Activities (890.044) (11.686.392)
FINANCING ACTIVITIES
Collections from: Loans 9.600.000 828.244 Subsidies and donations - 9.600.000 - 828.244 Payments to: Loans (6959127,0) Lease Down Payments (2.200.242) (1.653.145) Interest and Other costs (1.153.562) (1.128.348) Dividends (5.262.349) (15.575.280) (5.249.652) (8.031.145) Cash Flow from Financing Activities (5.975.280) (7.202.901)
CASH
Cash and Cash Equivalents at Beginning of Period (Note 15) 14.556.190 11.364.954 Cash and Cash Equivalents at End of Period (Note 15) 7.353.599 8.310.031 Net Flow in Cash Equivalents (7.202.591) (3.054.923)
CHARTERED ACCOUNTANT BOARD OF DIRECTORS ALEXANDRA MARIA PACHECO GAMA JUNQUEIRA JOSE REIS DA SILVA RAMOS –President
MARIA ANGELINA MARTINS CAETANO RAMOS SALVADOR ACÁCIO MARTINS CAETANO
MIGUEL PEDRO CAETANO RAMOS MATTHEW PETER HARRISON
NOBUAKI FUJII RUI MANUEL MACHADO DE NORONHA MENDES

NOTES TO THE CONSOLIDATED FINANCIAL STATEMENTS AT 30 JUNE 2017
(Amounts in Euros)
6
1. INTRODUCTION
Toyota Caetano Portugal, S.A. (“Toyota Caetano” or “Company”) was incorporated in 1946, has its headquarters in Vila Nova de Gaia, and is the Parent Company of a Group of companies (“Toyota Caetano Group” or “Group”), which mainly develop economic activities included in the automotive sector, namely the import, assembly and commercialization of vehicles, bus and coach industry, sale and rental of industrial equipment forklifts, sale of vehicles parts, as well as the corresponding technical assistance. Toyota Caetano Portugal, S.A. belongs to the Salvador Caetano Group (led by Salvador Caetano Group S.G.P.S., S.A.), being held directly by Salvador Caetano -Auto-, S.G.P.S., S.A., since the end of 2016. Toyota Caetano Group develops its activity mainly in Portugal and Cape Verde. Toyota Caetano shares are listed in Euronext Lisbon since October 1987. As of June 30, 2017, the companies included in Toyota Caetano Group, their headquarters and the abbreviations used, are mentioned in Note 3.
The attached financial statements are stated in Euros (rounding by unit), as this is the functional currency used in the economic environment where the Group operates. Foreign operations and transactions are included in the consolidated financial statements in accordance with the policy described in Note 2.3.
2. BASIS OF PRESENTATION AND MAIN ACCOUNTING POLICIES
The basis of presentation and the main accounting policies adopted in the preparation of the consolidated financial statements are as follows:
2.1. BASIS OF PRESENTATION
Interim financial statements are presented in accordance with IAS 34 – “Interim Financial Reporting”. These interim financial statements, prepared in accordance with the above mentioned framework, do not include all the required information to be included in the annual consolidated financial statements. Therefore, they should be read along with the consolidated financial statements as of December 31, 2016. Comparative information regarding December 31, 2016, included in consolidated financial statements was audited. The accompanying consolidated financial statements have been prepared on a going concern basis and under the historical cost convention, except for some financial instruments which are stated at fair value, from the books and accounting records of the companies included in consolidation (Note 3). The following standards, interpretations, amendments and revisions endorsed by the European Union and mandatory in the fiscal years beginning on or after January 1, 2017, were adopted by the first time in this period:
a) Standards that have been published and are mandatory for the accounting periods beginning on or after January 1, 2018, and were already endorsed by the European Union:
(i) Standards:
• IFRS 9 (new), ‘Financial instruments’ (effective for annual periods beginning on or after January 1, 2018). IFRS
9 replaces the guidance in IAS 39, regarding: (i) the classification and measurement of financial assets and liabilities; (ii) the recognition of credit impairment (through the expected credit losses model); and (iii) the hedge accounting requirements and recognition. No estimated impact of the future adoption of these improvements in the financial statements of the Group.
• IFRS 15 (new), ‘Revenue from contracts with customers’ (effective for annual periods beginning on or after
January 1, 2018). This new standard, applies only to contracts with customers to provide goods or services, and requires an entity to recognize revenue when the contractual obligation to deliver the goods or services is satisfied and by the amount that reflects the consideration the entity is expected to be entitled to, following a five-step approach. No estimated impact of the future adoption of these improvements in the financial statements of the Group.

NOTES TO THE CONSOLIDATED FINANCIAL STATEMENTS AT 30 JUNE 2017
(Amounts in Euros)
7
b) Standards (new and amendments) and interpretations that have been published and are mandatory for the accounting periods beginning on or after 1 January 2017, but are not yet endorsed by the European Union:
(i) Standards:
• IAS 7 (amendment), ‘Cashflow statement – Disclosure initiative’ (effective for annual periods beginning on or after January 1, 2017). This amendment is still subject to endorsement by the European Union. This amendment introduces an additional disclosure about the changes in liabilities arising from financing activities, disaggregated between cash changes and non-cash changes and how it reconciles with the reported cash flows from financing activities, in the Cash Flow Statement. This change had no impact on the Group's financial statements.
• IAS 12 (amendment),’Income taxes – Recognition of deferred tax assets for unrealized losses’ (effective for
annual periods beginning on or after January 1, 2017). This amendment is still subject to endorsement by the European Union. This amendment clarifies how to account for deferred tax assets related to assets measured at fair value, how to estimate future taxable profits when temporary deductible differences exist and how to assess recoverability of deferred tax assets when restrictions exist in the tax law. This change had no impact on the Group's financial statements.
• IAS 40 (amendment), ‘Transfers of Investment property’ (effective for annual periods beginning on or after January 1, 2018). This amendment is still subject to endorsement by the European Union. This amendment clarifies when assets are transferred to, or from investment properties, the evidence of the change in use is required. A change of management intention in isolation is not enough to support a transfer. No estimated impact of the future adoption of these improvements in the financial statements of the Group.
• IFRS 2 (amendment), ‘Classification and measurement of share-based payment transactions’ (effective for
annual periods beginning on or after January 1, 2018). This amendment is still subject to endorsement by the European Union. This amendment clarifies the measurement basis for cash-settled, share-based payments and the accounting for modifications to a share-based payment plan that change the classification an award from cash-settled to equity-settled. It also introduces an exception to the principles in IFRS 2 that will require an award to be treated as if it was wholly equity-settled, where an employer is obliged to withhold an amount for the employee’s tax obligation associated with a share-based payment and pay that amount to the tax authority. No estimated impact of the future adoption of these improvements in the financial statements of the Group.
• IFRS 4 (amendment), ‘Insurance contracts (Applying IFRS 4 with IFRS 9)’ (effective for annual periods beginning on or after January 1, 2018). This amendment is still subject to endorsement by the European Union. This amendment allows companies that issue insurance contracts the option to recognize in Other Comprehensive Income, rather than Profit or Loss the volatility that could rise when IFRS 9 is applied before the new insurance contract standard is issued. Additionally, it is given an optional temporary exemption from applying IFRS 9 until 2021, to the companies whose activities are predominantly connected with insurance, not being applicable at consolidated level. No estimated impact of the future adoption of these improvements in the financial statements of the Group.
• Amendments to IFRS 15 ‘Revenue from contracts with customers’ (effective for annual periods beginning on or after January 1, 2018). These amendments are still subject to endorsement by European Union. These amendments refer to additional guidance for determining the performance obligations in a contract, the timing of revenue recognition from a license of intellectual property, the review of the indicators for principal versus agent classification, and to new practical expedients to simplify transition. No estimated impact of the future adoption of these improvements in the financial statements of the Group.
• IFRS 16 (new), ‘Leases’ (effective for annual periods beginning on or after January 1, 2019). This standard is
still subject to endorsement by European Union. This new standard replaces the IAS 17 with a significant impact on the accounting by lessees that are now required to recognize a lease liability reflecting future lease payments and a “right-of-use asset” for all lease contracts, except for certain short-term leases and for low-value assets. The definition of a lease contract also changed, being based on the “right to control the use of an identified asset”. The Group is analyzing the potential effects of adopting this standard.
• IFRS 17 (new), ‘Insurance contracts’ Leases’ (effective for annual periods beginning on or after January 1,2021). This standard is still subject to endorsement by European Union. This new standard replaces IFRS 4 and applies to all entities issuing insurance contracts, reinsurance contracts and investment contracts with discretionary participation characteristics. IFRS 17 is based on the current measurement of technical liabilities at each reporting date. The current measurement can be based on a complete "building block approach" or "premium allocation approach". The recognition of the technical margin is different depending on whether it is

NOTES TO THE CONSOLIDATED FINANCIAL STATEMENTS AT 30 JUNE 2017
(Amounts in Euros)
8
positive or negative. IFRS 17 is of retrospective application. No estimated impact of the future adoption of these improvements in the financial statements of the Group.
• Annual Improvement 2014 - 2016, (generally effective for annual periods beginning on or after January 1, 2017). These improvements are still subject to endorsement by European Union. The 2014-2016 annual improvements impacts: IFRS 1, IFRS 12 and IAS 28. No estimated impact of the future adoption of these improvements in the financial statements of the Group.
(ii) Interpretations:
• IFRIC 22 (new), ‘Foreign currency transactions and advance consideration’ (effective for annual periods beginning on or after January 1, 2018). This interpretation is still subject to endorsement by European Union. An Interpretation of IAS 21 ‘The effects of changes in foreign exchange rates’ it refers to the determination of the “date of transaction” when an entity either pays or receives consideration in advance for foreign currency denominated contracts”. The date of transaction determines the exchange rate used to translate the foreign currency transactions. No estimated impact of the future adoption of these improvements in the financial statements of the Group.
• IFRIC 23 (new), ‘Uncertainty over income tax treatment’ (effective for annual periods beginning on or after January 1, 2019). This interpretation is still subject to endorsement by European Union. This is an interpretation of IAS 12 - 'Income tax', referring to the measurement and recognition requirements to be applied when there is uncertainty as to the acceptance of an income tax treatment by the tax authorities. In the event of uncertainty as to the position of the tax authority on a specific transaction, the entity shall make its best estimate and record the income tax assets or liabilities under IAS 12, and not under IAS 37 - "Provisions, contingent liabilities and contingent assets ", based on the expected value or the most probable value. The application of IFRIC 23 may be retrospective or retrospective modified. No estimated impact of the future adoption of these improvements in the financial statements of the Group.
2.2. CONSOLIDATION PRINCIPLES AND MAIN MEASUREMENTS METHODS The accompanying financial statements were prepared in accordance with the accounting policies disclosed in the notes to the consolidated financial statements as of June 30, 2017.
FINANCIAL RISK MANAGEMENT POLICIES
The Group’s activity is exposed to a variety of financial risks, such as market risk (including currency risk, interest rate risk and price risk), credit risk and liquidity risk. These risks arise from the unpredictability of financial markets that affect the capacity of projected cash flows and profits subject to a perspective of long term ongoing. Management seeks to minimise potential adverse effects that derive from that uncertainty in its financial performance. The financial risks management is controlled by Toyota Caetano financial department, according to the policies established by the Group Board of Directors. The Board of Directors has established the main principles of global risk management as well as specific policies for some areas, as interest rate risk and credit risk. As mentioned above, these principles and policies are properly described in the notes to the consolidated financial statements as of December 31, 2016. In this context, we presented below some risk indicators as of June 30, 2017, considered particularly relevant:
(i) Foreign currency risk
The Group operates internationally and has a subsidiary operating in Cape Verde. The group selects a
functional currency for each subsidiary (Cape Verde Escudo, for the subsidiary Caetano Auto CV, S.A.), corresponding to the currency of the economical environment and the ones that better represents its cash flows composition. Foreign currency risk arises mainly from future commercial transactions, as a result of purchases and sales of products and services in a different currency than the functional currency used by each Company.
Foreign currency risk management policies seek to minimize the volatility of investments and transactions
made in foreign currencies, aiming to reduce Group’s results impact to changes in foreign exchange rates. The Group uses derivative instruments (currency forwards), as the management of foreign currency risk.

NOTES TO THE CONSOLIDATED FINANCIAL STATEMENTS AT 30 JUNE 2017
(Amounts in Euros)
9
The Group foreign currency risk management hedge policies are decided casuistically, considering the foreign currency and country specific circumstances (as at June 30, 2017 and December 31, 2016 and June 30, 2016, this situation is not applicable to any of the Group Subsidiaries).
Foreign currency risk related to the foreign subsidiaries financial statements translation, also named
translation risk, presents the impact on net equity of the Holding Company, due to the translation of foreign subsidiaries financial statements.
Foreign subsidiaries assets and liabilities are translated into Euros using the exchange rates at statement of
financial position date, and gains and losses in the income statement are translated into Euros using the average exchange rate of the year. Resulting exchange differences are recorded in equity caption “Translation reserves”.
The Group’s assets and liabilities amounts (expressed in Euros) recorded in a different currency from Euro at
June 30, 2017 and December 31, 2016 and June 30, 2016 can be summarized as follows:
Assets Liabilities
Jun-17 Dec-16 Jun-16 Jun-17 Dec-16 Jun-16
Cape Verde Escudo (CVE) 6.771.197 10.416.262 9.026.912 2.532.613 6.383.793 3.051.466
Great Britain Pounds (GBP) - - - - - 989
Japanese Yen (JPY) - - - 410.151 408.216 620.712
Angolan Kwanza (AOA) - - - - 778 -
The sensitivity of the Group to foreign exchange rate changes can be summarized as follows (increases/decreases):
Jun-17 Dec-16
Variation Net Income Equity Net Income Equity
Japanese yen (JPY) 5% (20.508) - (20.411) -
Angolan Kwanza (AOA) 5% - - (39) -
Concerning the sensitivity of variations in the exchange rate of the Cape Verde Escudo (CVE), the Group does not have associated currency risk, because the exchange rate defined does not change.
(ii) Price risk
The group is exposed to the changing in raw material’s prices used on production processes, namely auto parts. However, considering that the acquisition of those raw materials is not in accordance with a price quoted on an exchange market or formed on a volatile market, the price risk is not considered as being significant. During 2017 and 2016, the Group has been exposed to the risk of variation of ‘available for sale financial assets’ prices. At June 30, 2017 and December 31, 2016 and June 30, 2016, the referred caption is composed only by shares of the closed property investment Fund Cimóvel – Fundo de Investimento Imobiliário Fechado (Real Estate Investment Fund). The Group’s sensitivity to price variations in “available for sale financial assets” can be summarized as follows (increases/decreases):
Jun-17 Dec-16 Jun-16
Variation Net Income Equity Net Income Equity Net Income Equity
CIMOVEL FUND 10% - 351.896 - 341.639 - 330.035
CIMOVEL FUND -10% - (351.896) - (341.639) - (330.035)

NOTES TO THE CONSOLIDATED FINANCIAL STATEMENTS AT 30 JUNE 2017
(Amounts in Euros)
10
(iii) Interest rate risk
Toyota Caetano debt is indexed to variable interest rates, exposing the total cost of debt to a high risk of volatility. The impact of this volatility on the Group’s results and shareholders´ equity mitigated due to the effect of the following factors: (i) possible correlation between the market interest rate levels and economic growth, having a positive effect on the other lines of the Group’s consolidated results (particularly operational), thus partially offsetting the increased financial costs (“natural hedge”) and (ii) the availability of consolidated liquidity or cash, also remunerated at variable rates.
Toyota Caetano Board of Directors approves the terms and conditions of the funding, analysing the debt
structure, the inherent risks and the different options available in the market, particularly considering the type of interest rates (fixed / variable) and, permanently monitoring conditions and alternatives existing in the market, and decides upon the contracting of occasional interest rate hedging derivative financial instruments.
Interest rate risk sensitivity analysis
The sensitivity analyses presented below was based on exposure to changes in interest rates for financial
instruments at the statement of financial position date. For floating rate liabilities, the analysis is prepared assuming the following:
(i) Interest rate is superior in 0,5 p.p. than the supported interest rate; (ii) Calculation was made using the Group’s debt at the end of the year; (iii) Spreads maintenance throughout the year.
The sensitivity analyses are based on a change in an assumption while holding all other assumptions
constant. In practice, this is unlikely to occur, and changes in some assumptions may be correlated.
Group’s sensitivity to changes in interest rates is summarized as follows (increases/decreases):
Jun-17 Dec-16 Jun-16
Variation Net Income Equity Net Income Equity Net Income Equity
Loans-Mutual Contract 0,5 p.p. - - 21.053 - 51.316 -
Guaranteed account 0,5 p.p. - - 10.000 - - -
Bank Credits 0,5 p.p. - - 5.006 - 1.645 -
Commercial Paper 0,5 p.p. 112.000 - 64.000 - 135.000 -
Long-term Bank Loan 0,5 p.p. 95.000 - 95.000 - 190.000 -
Confirming 0,5 p.p. 45.910 - 49.653 - 99.493 -
Total 252.910 - 244.712 - 477.454 -
Loans-Mutual Contract (0,5 p.p.) - - (21.053) - (51.316) -
Guaranteed account (0,5 p.p.) - - (10.000) - - -
Bank Credits (0,5 p.p.) - - (5.006) - (1.645) -
Commercial Paper (0,5 p.p.) (112.000) - (64.000) - (135.000) -
Long-term Bank Loan (0,5 p.p.) (95.000) - (95.000) - (190.000) -
Confirming (0,5 p.p.) (45.910) - (49.653) - (99.493) -
Total (252.910) - (244.712) - (477.454) -
The above analysis does not include the consideration of the hedging (swap) financial instrument agreed by the Group to face the interest rates variation and the figures are presented on an annual basis.

NOTES TO THE CONSOLIDATED FINANCIAL STATEMENTS AT 30 JUNE 2017
(Amounts in Euros)
11
(iv) Liquidity risk
Liquidity risk is defined as the risk that the Group could not be able to settle or meet its obligations on time or at a reasonable price. The existence of liquidity in the Group requires the definition of some parameters for the efficient and secure management of liquidity, enabling maximisation of the return obtained and minimisation of the opportunity costs relating to the liquidity, from a safety and efficient way. Toyota Caetano Group liquidity risk management has a threefold objective: (i) Liquidity, which is to ensure permanent access in the most efficient way to sufficient funds to cover current payments on the respective maturity dates, as well as any unexpected requests for funds; (ii) Safety, which is the minimisation of the probability of default in the repayment of any application in funds; and (iii) Financial efficiency, which is ensuring that the Companies maximise the value / minimize the opportunity cost of holding excess liquidity in the short-term. All excess liquidity is applied in short-term debt amortization, according to economic and financial reasonableness criteria. As of June 30, 2017 and December 31, 2016, the Group presents a net debt of 63.783.296 Euros and 54.664.515 Euros, respectively, divided between current and non-current loans (Note 17) and cash and cash equivalents (Note 4), agreed with the different financial institutions.
(v) Capital Risk
The main objective of the Board is to assure the continuity of the operations, providing an adequate remuneration to shareholders and the correspondent benefits to the rest of the stakeholders of the company. For the prosecution of this objective it is fundamental that a careful management of funds invested in the business is assured, trying to keep an optimal capital structure, in order to achieve the desired reduction of the cost of capital. With the purpose of maintaining an adequate capital structure, the Board can propose to the shareholders the measures considered necessary. The company tries to maintain a level of equity considered adequate to the business characteristics, in order to assure continuity and expansion of the business. The capital structure balance is monitored through the financial leverage ratio, defined as net debt/ (net debt + equity).
Jun-17 Dec-16 Jun-16
Debt 70.136.895 69.220.705 68.002.363
Cash and cash equivalents (7.353.599) (14.556.190) (8.310.031)
Net Debt 62.783.296 54.664.515 59.692.332
Equity 127.649.019 127.670.973 126.299.110
Leverage Ratio 32,97% 29,98% 32,09%
The gearing remains between acceptable levels, as established by management.
(vi) Credit risk
Credit risk refers to the risk that the counterpart will default on its contractual obligations resulting in financial loss to the Group. The Group’s exposure to the credit risk is mainly associated to the receivable accounts of its ordinary activities. Before accepting new clients, the company obtains information from credit rating agencies and makes internal analysis to the collection risk and contingent processes through specific credit and legal departments, attributing credit limits by client, based on the information received. Risk management seeks to guarantee an effective collection of its credits in the terms negotiated without impact on the financial Group’s health. This risk is regularly monitored, being Management’s objective (i) to

NOTES TO THE CONSOLIDATED FINANCIAL STATEMENTS AT 30 JUNE 2017
(Amounts in Euros)
12
impose credit limits to customers, considering the number of days of sales outstanding, individually or on groups of customers, (ii) control credit levels and (iii) perform regular impairment analysis. The Group obtains credit guarantees whenever the customers’ financial situation demands. Regarding independent dealership customers, the Group requires guarantees “on first demand”, that, as disclosed in the notes to the consolidated financial statements of December 31, 2016, whenever these amounts are exceeded, these customers’ supplies are suspended. The adjustments for accounts receivable are calculated considering (a) the client risk profile, (b) the average time of receipt, (c) the client financial situation. The movements of these adjustments for the periods ending at June 30, 2017 and 2016 are stated in Note 23. At June 30, 2017, the Group considers that there is no need for additional impairment losses, besides the amounts registered on those dates and stated, briefly, in Note 23. The amount of customers and other debtors in financial statements, which is net of impairment losses, represents the maximum exposure of the Group to credit risk.
The following table presents, on June 30, 2017, the credit quality of bank deposits:
Deposits Long Term Rating Rating Agency Value
A1 Moody's 85.841 A3 Moody's 220.361 B1 Moody's 4.772.764 B3 Moody's 551.463 Ba1 Moody's 43.445 Ba3 Moody's 171.701 Baa1 Moody's 74.633 Baa3 Moody's 330.160 Caa1 Moody's 157.123 Others without rating assigned Others without rating assigned 842.145
Total 7.249.636
The ratings presented correspond to ratings assigned by the Rating Agency Moody's. 2.3. CONVERSION OF FINANCIAL STATEMENTS OF FOREIGN COMPANIES
Exchange rates used in the conversion of foreign affiliated companies, as of June 30, 2017 and December 31, 2016 were as follows:
30-06-2017
Final Exchange Average Exchange Exchange Rate at Final Exchange
Currency Rate for Jun-17 Rate for Jun-17 the Date of Incorporation rate for Dez-16
Caetano Auto CV, S.A. CVE 0,009069 0,009069 0,009069 0,009069
Captions Balance Sheet Income Statement Share Capital Retained except Shareholders Earnings

NOTES TO THE CONSOLIDATED FINANCIAL STATEMENTS AT 30 JUNE 2017
(Amounts in Euros)
13
31-12-2016
Final Exchange Average Exchange Exchange Rate at Final Exchange
Currency Rate for Dez-16 Rate for Dez-16 the Date of Incorporation rate for Dez-15
Caetano Auto CV, S.A. CVE 0,009069 0,009069 0,009069 0,009069
Captions Balance Sheet Income Statement Share Capital Retained except Shareholders
Earnings
3. GROUP COMPANIES INCLUDED IN CONSOLIDATION
The affiliated companies included in consolidation by the full consolidation method and share of capital held as of June 30, 2017 and December 31, 2016, are as follows:
Companies Effective
Percentage Held
Jun-17 Dec-16
Parent Company
Toyota Caetano Portugal, S.A.
Saltano - Investimentos e Gestão (S.G.P.S.), S.A. 99,98% 99,98%
Caetano Auto CV, S.A. 81,24% 81,24%
Caetano Renting, S.A. 99,98% 99,98%
Caetano - Auto, S.A. 98,40% 98,40%
These subsidiaries were included in the consolidated financial statements using the full consolidation method, as established in IFRS 10 – “Consolidated Financial Statements” (subsidiary control through the major voting rights and exposure to variable returns in relevant activities).
4. CASH AND CASH EQUIVALENTS
As of June 30, 2017, December 31, 2016 and June 30, 2016 cash and cash equivalents detail was the following:
Jun-17 Dec-16 Jun-16
Cash 103.963 121.286 124.827
Bank Deposits 7.249.636 14.434.904 8.185.204
7.353.599 14.556.190 8.310.031
The Company and its affiliates have available credit facilities as of June 30, 2017 amounting to approximately 79 Million Euros (of which have been utilized 51 Million Euros), which can be used in future operational activities and to fulfil financial commitments. There are no restrictions on the use of these facilities. This amount is invested in different financial institutions, with no excessive concentration in any of them.

NOTES TO THE CONSOLIDATED FINANCIAL STATEMENTS AT 30 JUNE 2017
(Amounts in Euros)
14
5. TANGIBLE FIXED ASSETS
During the six-month period ended as of June 30, 2017 and 2016, the movement in tangible fixed assets, as well as in the respective accumulated depreciation and impairment losses, was as follows:
30-06-2017
Land
Buildings and Other
Constructions
Machinery and
Equipment Transport Equipment
Administrative Equipment
Other Fixed Assets
Tangible assets in Progress Total
Gross Assets:
Opening Balances 16.471.765 91.068.416 60.432.512 64.700.926 8.124.372 4.370.111 9.400 245.177.502
Additions 157.500 779.153 322.208 31.843.619 90.308 32.124 59.488 33.284.400
Disposals and Write-offs - - (4.684) (9.236.711) - - (28.200) (9.269.595)
Ending Balances 16.629.265 91.847.569 60.750.036 87.307.834 8.214.680 4.402.235 40.688 269.192.307
Accumulated Depreciation and Impairment losses:
Opening Balances - 61.185.509 55.591.865 30.504.452 7.512.127 4.119.149 - 158.913.102
Depreciations - 1.132.993 509.977 6.275.183 74.792 31.155 - 8.024.100
Disposals and Write-offs - - (4.684) (3.427.127) - - - (3.431.811)
Transfer - (25) - - - - - (25)
Ending Balances - 62.318.477 56.097.158 33.352.508 7.586.919 4.150.304 - 163.505.366
Net Tangible Fixed Assets 16.629.265 29.529.092 4.652.878 53.955.326 627.761 251.931 40.688 105.686.941
30-06-2016
Land
Buildings and Other
Constructions
Machinery and
Equipment Transport Equipment
Administrative Equipment
Other Fixed Assets
Tangible assets in Progress Total
Gross Assets:
Opening Balances 16.842.823 93.538.551 60.117.299 55.526.355 7.880.877 4.318.806 397.459 238.622.170
Additions - 286.087 160.203 23.027.076 22.892 16.557 1.748 23.514.563
Disposals and Write-offs - (53.234) (153.437) (8.172.667) (116.277) (28.524) - (8.524.139)
Ending Balances 16.842.823 93.771.404 60.124.065 70.380.764 7.787.492 4.306.839 399.207 253.612.594
Accumulated Depreciation and Impairment losses:
Opening Balances - 60.281.003 54.610.829 28.543.554 7.514.630 4.082.927 - 155.032.943
Depreciations - 1.220.287 600.011 4.818.681 53.194 37.286 - 6.729.459
Disposals and Write-offs - (45.882) (148.632) (3.625.703) (109.415) (27.625) - (3.957.257)
Transfer - 4.053 - - - - - 4.053
Ending Balances - 61.459.461 55.062.208 29.736.532 7.458.409 4.092.588 - 157.809.198
Net Tangible Fixed Assets 16.842.823 32.311.943 5.061.857 40.644.232 329.083 214.251 399.207 95.803.396
The movements registered in item “Transport Equipment” mainly refer to vehicles and forklifts that are being used by the Group as well as being rented, under operating lease, to clients. At June 30, 2017 and 2016, the increases in buildings includes maintenance works in Caetano Auto buildings.
Management believes that a possible change (within a scenario of normal) in the main assumptions used in calculating the fair value will not result in impairment losses, apart from the loss already registered.

NOTES TO THE CONSOLIDATED FINANCIAL STATEMENTS AT 30 JUNE 2017
(Amounts in Euros)
15
As of June 30, 2017 and December 31, 2016, the assets acquired through financial leases are presented as follows:
Jun-17
Gross Assets Accumulated Depreciation Net Tangible Assets
Tangible Fixed Assets 34.055.427 13.259.839 20.795.788
Dec-16
Gross Assets Accumulated Depreciation Net Tangible Assets
Tangible Fixed Assets 32.586.491 10.939.539 21.646.952
6. INVESTMENT PROPERTIES
As of June 30, 2017, December 31, 2016 and June 30, 2016, the caption “Investment properties” refers to real estate assets held to obtain gains through its rental or for capital gain purposes. These real estate assets are recorded at acquisition cost. Rentals related to “Investment properties” are recorded in the caption “Other Operating Income” and amounted to 1.815.019 Euros as the six-month period ended as of June 30, 2017 (1.841.472 Euros as of June 30, 2016) (Note 29).
Additionally, in according with appraisals reported to December 31, 2016, the fair value of those investment properties amounts to, approximately, 51 million Euros.
Management believes that a possible change (within a scenario of normal) in the main assumptions used in calculating the fair value will not result in impairment losses, beyond from losses recognized in previous years.

NOTES TO THE CONSOLIDATED FINANCIAL STATEMENTS AT 30 JUNE 2017
(Amounts in Euros)
16
The real estate assets recorded in the caption “Investment properties” as of June 30, 2017 and December 31, 2016 is made up as follows:
Jun-17 Dec-16
Location
Net accounting value
Fair Value Appraisal Net
accounting value
Fair Value Appraisal
Vila Nova de Gaia - Av. da República 84.202 1.192.400 Internal 84.202 1.192.400 Internal
Braga - Av. da Liberdade 302 1.355.000 Internal 406 1.355.000 Internal
Porto - Rua do Campo Alegre 852.997 2.877.000 Internal 887.680 2.877.000 Internal
Viseu - Teivas 830.004 896.000 External 846.876 896.000 External
Óbidos - Casal do Lameiro 58.290 1.400.000 Internal 58.712 1.400.000 Internal
Castro Daire - Av. João Rodrigues Cabrilho 26.061 58.000 Internal 26.610 58.000 Internal
Caldas da Rainha - Rua Dr. Miguel Bombarda 17.531 85.000 Internal 17.531 85.000 Internal
Viseu - Quinta do Cano 1.734.230 2.461.740 Internal/External 1.742.162 2.461.740 Internal/External
Amadora - Rua Elias Garcia 182.747 149.000 Internal 184.476 149.000 Internal
Portalegre - Zona Industrial 186.387 173.000 Internal 188.958 173.000 Internal
Portimão - Cabeço do Mocho 424.781 550.000 External 424.781 550.000 External
Vila Real de Santo António - Rua de Angola 23.911 83.000 Internal 24.628 83.000 Internal
Rio Maior 107.000 107.000 Internal 107.000 107.000 Internal
S João de Lourosa - Viseu 458.172 487.030 Internal 460.072 487.030 Internal
Vila Nova de Gaia - Av. Vasco da Gama (edifícios A e B) 3.128.265 8.692.000 External 3.236.940 8.692.000 External
Vila Nova de Gaia - Av. Vasco da Gama (edifícios G) 891.991 6.077.000 External 942.873 6.077.000 External
Carregado - Quinta da Boa Água / Quinta do Peixoto 5.062.665 19.218.000 External 5.086.939 19.218.000 External
Lisboa - Av. Infante Santo 1.155.896 1.247.000 Internal 1.170.590 1.247.000 Internal
Vila Nova de Gaia - Rua das Pereiras 255.303 788.000 Internal 261.219 788.000 Internal
Leiria - Azóia 355.125 797.000 Internal 355.125 797.000 Internal
Castelo Branco - Oficinas 818.730 1.450.000 Internal 839.678 1.450.000 Internal
Viana do Castelo - Stand e Oficinas 931.101 975.000 Internal 955.553 975.000 Internal
17.585.691 51.118.170 17.903.011 51.118.170
The investment properties fair value disclosed in December 31, 2016 was determined on an annual basis by an independent appraiser (the fair value was determined by the average of the evaluations by Market Method, Cost Method and Return Method). In accordance to the classification of the evaluation methods mentioned above, and related with the fair value hierarchy (IFRS 13), they are classified as follows:
- Market Method – Level 2 (fair value determined based on observable market data); - Cost Method and Return Method – Level 3 (fair value determined based on non-observable market data,
developed to reflect assumptions to be used by independent appraisers. As of June 30, 2017 the values of the evaluation will be published at December 31, 2016 on the grounds that, given the generalized inexistence of major works in 2017, the inexistence of relevant claims in 2017 and the inexistence of properties in areas of accelerated degradation there will be no significant change to the fair value of these properties. The Management believes will not have been significant changes to the fair value of these buildings, believing they are still valid and current values of the last external evaluation carried out in 2012, 2013, 2014, 2015 and 2016.

NOTES TO THE CONSOLIDATED FINANCIAL STATEMENTS AT 30 JUNE 2017
(Amounts in Euros)
17
The movement in the caption “Investment properties” as of June 30, 2017 and 2016 was as follows:
30/06/2017
Gross Assets: Land Buildings Total
Opening Balances 10.268.017 39.133.728 49.401.745
Additions - 9.596 9.596
Disposals and Write-offs (1) - (1)
Ending Balances 10.268.016 39.143.324 49.411.340
Accumulated Depreciation and Impairment Losses: Land Buildings Total
Opening Balances - 31.498.734 31.498.734
Additions - 326.890 326.890
Transfer - 25 25
Ending Balances - 31.825.649 31.825.649
Net Value 10.268.016 7.317.675 17.585.691
30/06/2016
Gross Assets: Land Buildings Total
Opening Balances 9.916.943 36.133.435 46.050.378
Ending Balances 9.916.943 36.133.435 46.050.378
Accumulated Depreciation and Impairment Losses: Land Buildings Total
Opening Balances - 29.385.179 29.385.179
Additions - 280.937 280.937
Transfer - (4.053) (4.053)
Ending Balances - 29.662.063 29.662.063
Net Value 9.916.943 7.634.994 17.903.011
7. GOODWILL
At June 30, 2017 and 2016 there were not any movements in item “Goodwill”. The item “Goodwill” is totally related to the amount calculated in the acquisition of the affiliate Movicargo whose business was transferred to the parent Toyota Caetano Portugal, S.A. The Goodwill is not amortized. Impairment tests are made annually to the Goodwill. At June 30, 2017 there are no signs of impairment, so it was not necessary to carry out impairment tests.

NOTES TO THE CONSOLIDATED FINANCIAL STATEMENTS AT 30 JUNE 2017
(Amounts in Euros)
18
8. INTANGIBLE ASSETS
During the six-month period ended as of June 30, 2017 and 2016, the movement in intangible assets, as well as in the respective accumulated amortization and accumulated impairment losses, was as follows:
30/06/2017 Research and Development
Expenses
Industrial Property
Goodwill Computer Programs
Intangible Assets in progress
Total
Gross Assets:
Opening Balances 1.477.217 312.774 81.485 2.139.437 160.840 4.171.753
Additions - - - 750 43.138 43.888
Ending Balances 1.477.217 312.774 81.485 2.140.187 203.978 4.215.641
Accumulated Amortization and Impairment losses:
Opening Balances 957.375 184.337 81.485 1.870.724 - 3.093.921
Amortizations 246.203 14.166 - 117.468 - 377.837
Ending Balances 1.203.578 198.503 81.485 1.988.192 - 3.471.758
Net Intangible Assets 273.639 114.271 - 151.995 203.978 743.883
30/06/2016 Research and Development
Expenses
Industrial Property Goodwill
Computer Programs
Intangible Assets in progress
Total
Gross Assets:
Opening Balances 1.394.907 284.179 81.485 2.003.979 60.760 3.825.310
Additions - - - 142.984 43.680 186.664
Ending Balances 1.394.907 284.179 81.485 2.146.963 104.440 4.011.974
Accumulated Amortization and Impairment losses:
Opening Balances 464.969 163.243 81.485 1.655.087 - 2.364.784
Amortizations 232.485 9.166 - 115.539 - 357.190
Ending Balances 697.454 172.409 81.485 1.770.626 - 2.721.974
Net Intangible Assets 697.453 111.770 - 376.337 104.440 1.290.000
9. AVAILABLE FOR SALE FINANCIAL ASSETS
During the period ended as of June 30, 2017, and December 31, 2016 and June 30, 2016 the movements in item “Available for sale financial assets” were as follows:
Jun-17 Dec-16 Jun-16
Available for sale financial assets
Fair value at January 1 3.483.128 3.463.450 3.463.450
Increase/(decrease) in fair value 102.570 19.678 (96.359)
Fair value at June 30 3.585.698 3.483.128 3.367.091

NOTES TO THE CONSOLIDATED FINANCIAL STATEMENTS AT 30 JUNE 2017
(Amounts in Euros)
19
As of June 30, 2017, “Available for sale financial assets” include the amount of 3.518.962 Euros (3.416.391 Euros December 31, 2016) corresponding to 580.476 shares of Cimóvel - Real Estate Investment Fund (9,098%), which are recorded at its fair value (the acquisition cost of those shares ascended to 3.013.947 Euros and accumulated change in fair value to 505.016 Euros). The remaining “Available for sale financial assets” refer to small investments in non listed companies. The Board of Directors consider that the net accounting value is similar to its fair value.
Additionally, the impact in equity and impairment losses during the six-month period ended as of June 30, 2017 and 2016 from recording “Available for sale financial assets” at fair value can be summarized as follows:
Jun-17 Jun-16
Fair value variation 102.570 (96.359)
Effect on equity 102.570 (96.359)
10. INVENTORIES
As of June 30, 2017, December 31, 2016 and June 30, 2016, this caption breakdown is as follows:
Jun-17 Dec-16 Jun-16
Raw and subsidiary Materials 3.155.925 9.307.008 1.246.215
Production in Process 1.172.512 937.645 1.168.752
Finished and semi-finished Products 38.582 1.466.863 1.403.045
Merchandise 68.866.414 72.612.904 68.466.440
73.233.433 84.324.420 72.284.452
Accumulated impairment losses in inventories (Note 23) (1.439.791) (1.532.523) (1.564.231)
71.793.642 82.791.897 70.720.221
During the six-month period ended as of June 30, 2017 and 2016, cost of sales was as follows:
Jun-17 Jun-16
Merchandise Raw and
subsidiary Materials
Total Merchandise Raw and
subsidiary Materials
Total
Opening Balances 72.612.904 9.307.008 81.919.912 70.642.162 10.080.953 80.723.115
Net Purchases 135.638.496 17.770.504 153.409.000 121.876.708 12.783.221 134.659.929
Ending Balances (68.866.414) (3.155.925) (72.022.339) (68.466.440) (1.246.215) (69.712.655)
Total 139.384.986 23.921.587 163.306.573 124.052.430 21.617.959 145.670.389
During the six-month period ended as of June 30, 2017 and 2016, the variation in production was computed as follows:
Finished and semi-finished products
Jun-17 Jun-16
Ending Balances 1.211.094 2.571.797
Inventories adjustments (772) 5.234
Opening Balances (2.404.508) (2.751.865)
Total (1.194.186) (174.834)

NOTES TO THE CONSOLIDATED FINANCIAL STATEMENTS AT 30 JUNE 2017
(Amounts in Euros)
20
11. ACCOUNTS RECEIVABLE
As of June 30, 2017, December 31, 2016 and June 30, 2016, the detail of this caption was as follows:
CURRENT ASSETS NON-CURRENT ASSETS
Jun-17 Dec-16 Jun-16 Jun-17 Dec-16 Jun-16
Customers, current accounts 54.993.992 57.872.820 58.130.427 139.159 26.048 138.841
Doubtful Accounts Receivable 9.465.434 9.465.385 9.878.019 - - -
64.425.426 67.338.205 68.008.446 139.159 26.048 138.841
Accumulated impairment losses in accounts Receivable (Note 23) (9.435.702) (9.443.797) (9.705.658) - - -
55.023.724 57.894.408 58.302.788 139.159 26.048 138.841
Accounts receivable from customers recorded as non-current assets corresponds to the customers of the affiliated company Caetano-Auto, S.A. and Toyota Caetano Portugal, S.A. that are being paid under formal agreements (whose terms of payment may vary between 1 to 7 years, and which bear interests). Group exposure to credit risk is mainly related to trade receivables resulting from its operational activity. Before accepting new customers, the Group contacts credit rating agencies and performs internal analysis of credit risk, through specific credit control, collection and legal service departments, and assigns credit limits by customer, based on the gathered information.
Accounts receivable aging
Debt maturity without recognition of losses by impairment
30-06-2017
- 60 days 60-90 days 90-120 days + 120 days Total
Accounts receivable 34.070.861 2.281.341 1.302.960 11.079.428 48.734.590
Employees 10.300 - - 184.791 195.091
Independent Dealers 5.839.569 350.205 6.229 7.467 6.203.470
Total 39.920.730 2.631.546 1.309.189 11.271.686 55.133.151
31-12-2016
- 60 days 60-90 days 90-120 days + 120 days Total
Accounts receivable 32.787.221 1.177.256 1.163.134 16.234.201 51.361.812
Employees 14.873 - 4.012 526.996 545.881
Independent Dealers 5.649.284 333.953 1.074 6.864 5.991.175
Total 38.451.378 1.511.209 1.168.220 16.768.061 57.898.868

NOTES TO THE CONSOLIDATED FINANCIAL STATEMENTS AT 30 JUNE 2017
(Amounts in Euros)
21
Debt maturity with recognition of losses by impairment
30-06-2017
- 60 days 60-90 days 90-120 days + 120 days Total
Doubtful Accounts Receivable - 20.243 4.986 9.440.205 9.465.434
Total - 20.243 4.986 9.440.205 9.465.434
31-12-2016
- 60 days 60-90 days 90-120 days + 120 days Total
Doubtful Accounts Receivable 12.780 7.463 4.986 9.440.156 9.465.385
Total 12.780 7.463 4.986 9.440.156 9.465.385
The amounts presented in the consolidated Statement of financial position are net of accumulated impairment losses to doubtful accounts receivable estimated by the Group, in accordance with its experience based on its evaluation of the economic environment at the statement of financial position date. Credit risk concentration is limited, because the customers’ basis is wider and not relational. Thus, the Board of Directors understands that the accounting values of accounts receivable are similar to their respective fair value.
Accounts receivable ageing against maturity
30-06-2017
- 60 days 60-90 days 90-120 days + 120 days Total
Doubtful Accounts Receivable 40.191.566 2.640.508 1.233.170 1.661.937 45.727.181
Total 40.191.566 2.640.508 1.233.170 1.661.937 45.727.181
31-12-2016
- 60 days 60-90 days 90-120 days + 120 days Total
Doubtful Accounts Receivable 27.319.238 1.365.201 1.218.907 19.134.153 49.037.499
Total 27.319.238 1.365.201 1.218.907 19.134.153 49.037.499 12. OTHER DEBTORS As of June 30, 2017, December 31, 2016 and June 30, 2016, the detail of this caption was as follows:
Current Assets
Jun-17 Dec-16 Jun-16
Down Payments to Suppliers 373.769 441.391 887.431
Other debtors 2.621.188 2.558.490 2.354.634
2.994.957 2.999.881 3.242.065
The caption “Other credits” includes the amount of, approximately, 0,8 Million Euros as of December 31, 2016 in referring to advance payments made by the Group related with leasehold improvements in commercial facilities for

NOTES TO THE CONSOLIDATED FINANCIAL STATEMENTS AT 30 JUNE 2017
(Amounts in Euros)
22
automotive retail, which were fully invoiced in previous years, being that the remaining amount is expected to be supported in the short term by third parties. As of June 30, 2017, the aforementioned amount is already settled.
Additionally, this caption includes, as of June 30, 2017 the amount of, approximately, 800.000 Euros to be received from Salvador Caetano Auto Africa, S.G.P.S., S.A. (800.000 Euros as of December 31, 2016). It is noted that this amount also includes as of June 30, 2017 an account receivable in the amount of 618.000 Euros from the related party Fundação Salvador Caetano (683.000 Euros as of December 31, 2016).
13. OTHER CURRENT ASSETS
As of June 30, 2017, December 31, 2016 and June 30, 2016, the detail of this caption was as follows:
Jun-17 Dec-16 Jun-16
Accrued Income
Commission 294.454 369.029 382.539
Rappel 152.680 1.135.857 183.488
Warranty claims 285.412 300.251 190.441
Fleet programs and Bonus suppliers 496.302 1.475.076 533.903
Assignment of staff 30.712 121.742 28.256
Fee's 29.658 76.017 73.923
Recovery logistics costs - - 10.596
Others 858.633 483.113 846.727
2.147.851 3.961.085 2.249.873
Deferred Expenses
Insurance 263.326 144.176 314.415
Rentals 135.523 20.642 143.037
Interest 128.073 75.058 -
Others 759.840 522.368 766.545
1.286.762 762.244 1.223.997
Total 3.434.613 4.723.329 3.473.870

NOTES TO THE CONSOLIDATED FINANCIAL STATEMENTS AT 30 JUNE 2017
(Amounts in Euros)
23
14. DEFERRED TAXES
The detail of deferred tax assets and liabilities recorded in the accompanying consolidated financial statements as of June 30, 2017 and 2016 is as follows:
30/06/2017
Dec-16 Profit and Loss
Impact Jun-17
Deferred tax assets:
Provisions not accepted for tax purpose 294.573 - 294.573
Tax losses 88.569 (88.569) -
Defined Benefit Plan Liabilities 1.611.745 - 1.611.745
Write-off of tangible assets/inventories 193.155 (21.570) 171.405
Derivative financial instruments valuation 6.396 (6.396) -
2.194.438 (116.715) 2.077.723
Deferred tax liabilities:
Depreciation as a result of legal and free revaluation of fixed assets (652.771) 14.360 (638.411)
Effect of the reinvestments of the surplus in fixed assets sales (165.772) - (165.772)
Fair value of fixed assets (898.732) - (898.732)
(1.717.275) 14.360 (1.702.915)
Net effect (Note 25) (102.355)
30/06/2016
Dec-15 Profit and Loss
Impact Jun-16
Deferred tax assets:
Provisions not accepted for tax purpose 287.440 - 287.440
Tax losses 502.622 (109.408) 393.214
Defined Benefit Plan Liabilities 1.257.500 - 1.257.500
Write-off of tangible assets/inventories 164.460 (54.561) 109.899
Derivative financial instruments valuation 36.020 (6.920) 29.100
2.248.042 (170.889) 2.077.153
Deferred tax liabilities:
Depreciation as a result of legal and free revaluation of fixed assets (659.109) - (659.109)
Effect of the reinvestments of the surplus in fixed assets sales (165.772) - (165.772)
Fair value of fixed assets (898.732) - (898.732)
(1.723.613) - (1.723.613)
Net effect (Note 25) (170.889)

NOTES TO THE CONSOLIDATED FINANCIAL STATEMENTS AT 30 JUNE 2017
(Amounts in Euros)
24
In accordance with the applicable legislation in Portugal, tax losses can be carried forward for the following periods:
i) Tax losses reported in 2012 and 2013: 5 years ii) Tax losses reported for periods beginning on or after 2014: 12 years
As of June 30, 2017, the tax losses carried forward for which deferred tax assets have been recorded were fully utilized.
From 2012 (inclusive), the deduction of tax losses carried forward, established in previous years or in progress (includes all reported losses identified in i)) is limited to 75% of the taxable profit assessed in the relevant fiscal year and from 2014 (inclusive) is limited to 70% of taxable income in each year. This situation requires the annual evaluation of the amount of deferred tax can be recovered within the time indicated above. As of June 30, 2017 and 2016 tax rates used to compute current and deferred tax assets and liabilities were as follows:
Tax rates
Jun-17 Jun-16
Country of origin of affiliate: Portugal 22,5% - 21% 22,5% - 21% Cape Verde 25,5% 25,5%
Toyota Caetano Group companies with head office in Portugal are taxed according to the Corporate Income Tax (CIT) in accordance with the Special Taxation Regimen for Groups of Companies (“Regime Especial de Tributação de Grupos de Sociedades - RETGS”) as established by articles 69 and 70 of the CIT.
In accordance with the applicable legislation, the income tax returns of Toyota Caetano and other Group companies with headquarters in Portugal are subject to review and correction by the tax authorities for a 4-year period. Therefore, the tax declarations since the year of 2014 and 2017 are still subject to review. Statements regarding the Social Security may be revised over a period of five years. The Board of Directors believe that the corrections that may arise from such reviews/inspections will not have a significant impact in the accompanying consolidated financial statements. Under the terms of article 88 of the Corporate Income Tax Code, the companies with headquarters in Portugal are additionally subject to an income tax over a set of expenses at the rates foreseen in the above mentioned article.
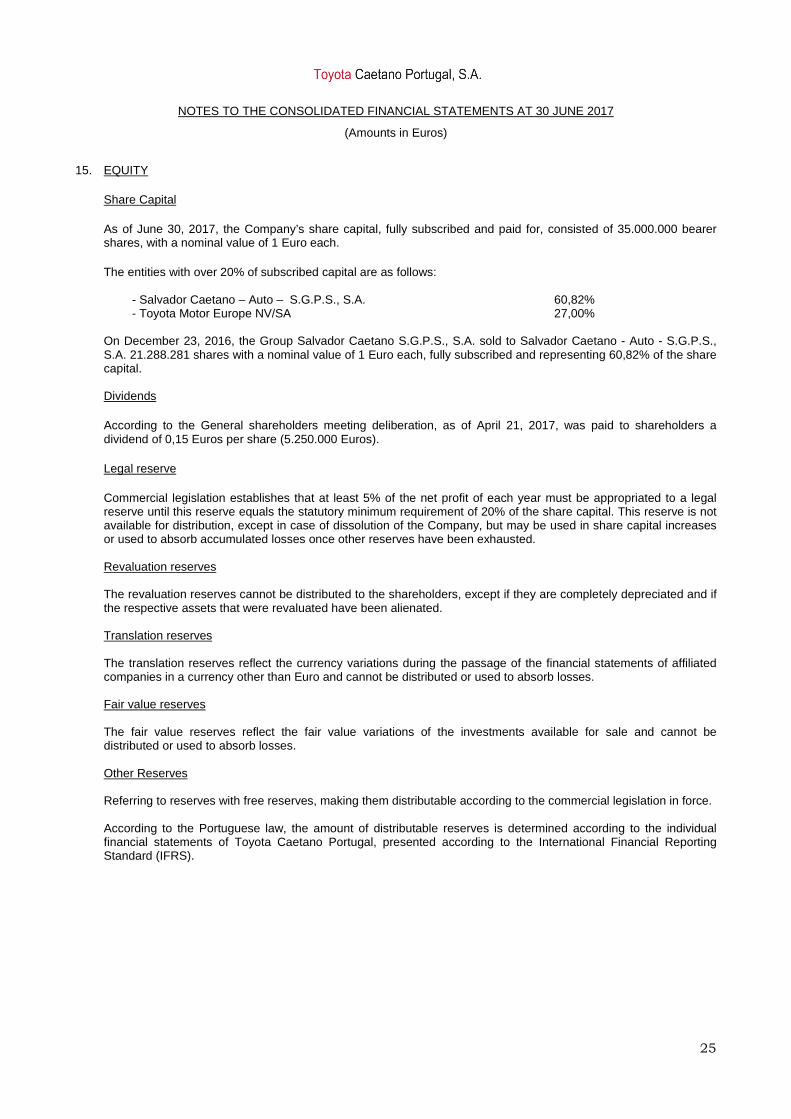
NOTES TO THE CONSOLIDATED FINANCIAL STATEMENTS AT 30 JUNE 2017
(Amounts in Euros)
25
15. EQUITY
Share Capital
As of June 30, 2017, the Company’s share capital, fully subscribed and paid for, consisted of 35.000.000 bearer shares, with a nominal value of 1 Euro each.
The entities with over 20% of subscribed capital are as follows: - Salvador Caetano – Auto – S.G.P.S., S.A. 60,82% - Toyota Motor Europe NV/SA 27,00%
On December 23, 2016, the Group Salvador Caetano S.G.P.S., S.A. sold to Salvador Caetano - Auto - S.G.P.S., S.A. 21.288.281 shares with a nominal value of 1 Euro each, fully subscribed and representing 60,82% of the share capital.
Dividends
According to the General shareholders meeting deliberation, as of April 21, 2017, was paid to shareholders a dividend of 0,15 Euros per share (5.250.000 Euros).
Legal reserve
Commercial legislation establishes that at least 5% of the net profit of each year must be appropriated to a legal reserve until this reserve equals the statutory minimum requirement of 20% of the share capital. This reserve is not available for distribution, except in case of dissolution of the Company, but may be used in share capital increases or used to absorb accumulated losses once other reserves have been exhausted.
Revaluation reserves
The revaluation reserves cannot be distributed to the shareholders, except if they are completely depreciated and if the respective assets that were revaluated have been alienated.
Translation reserves
The translation reserves reflect the currency variations during the passage of the financial statements of affiliated companies in a currency other than Euro and cannot be distributed or used to absorb losses.
Fair value reserves
The fair value reserves reflect the fair value variations of the investments available for sale and cannot be distributed or used to absorb losses. Other Reserves Referring to reserves with free reserves, making them distributable according to the commercial legislation in force. According to the Portuguese law, the amount of distributable reserves is determined according to the individual financial statements of Toyota Caetano Portugal, presented according to the International Financial Reporting Standard (IFRS).

NOTES TO THE CONSOLIDATED FINANCIAL STATEMENTS AT 30 JUNE 2017
(Amounts in Euros)
26
16. NON-CONTROLLING INTERESTS
Movements in this caption during the period ended as of June 30, 2017, December 31, 2016 and June 30, 2016 were as follows:
Jun-17 Dec-16 Jun-16
Opening Balances as of January 1 1.294.261 1.647.295 1.647.295
Dividends - (375.248) -
Others - (30.216) (54)
Net profit attributable to non-controlling interests 65.579 52.430 29.549
1.359.840 1.294.261 1.676.790
The decomposition of the mentioned value by subsidiary company is as follows:
% NCI Non-controlling Interests
Net profit attributable to Non-controlling Interests
Saltano - Investimentos e Gestão (S.G.P.S.), S.A. 0,02% 4.035 -
Caetano Auto CV, S.A. 18,76% 786.165 41.190
Caetano Renting, S.A. 0,02% 404 (163)
Caetano Auto, S.A. 1,60% 569.236 24.552
1.359.840 65.579
The resume of financial information related to each subsidiary that is consolidated is presented below:
Caption Caetano Auto Caetano Renting Saltano Caetano Auto CV
Non-Current Assets 48.158.616 35.693.269 21.956.766 1.404.074
Current Assets 74.215.566 9.656.093 50.938 5.388.301
Total Assets 122.374.182 45.349.362 22.007.704 6.792.375
Non-Current Liabilities 7.472.252 200.014 - 82.378
Current Liabilities 80.707.075 42.788.678 3.579.772 2.553.792
Equity 34.194.854 2.360.671 18.427.932 4.156.205
Revenues 102.565.930 2.867.627 - 5.987.975
Operating Results 1.876.354 (578.792) (2.355) 305.546
Financial Results (12.007) (132.462) - (28.882)
Taxes (85.640) - - (70.549)
Net Income 1.778.707 (711.254) (2.355) 206.115
17. LOANS As of June 30, 2017, December 31, 2016 and June 30, 2016 the caption “Loans” was as follows:
Jun-17 Dec-16 Jun-16
Current Non-Current TOTAL Current Non-Current TOTAL Current Non-Current TOTAL
Bank Loan 33.581.922 17.000.000 50.581.922 30.941.048 17.000.000 47.941.048 25.291.401 22.289.475 47.580.876
Bank Overdrafts - - - 1.001.251 - 1.001.251 164.509 - 164.509
Finance Leases 4.646.362 14.908.611 19.554.973 4.383.998 15.894.408 20.278.406 3.523.832 16.733.146 20.256.978
38.228.284 31.908.611 70.136.895 36.326.297 32.894.408 69.220.705 28.979.742 39.022.621 68.002.363

NOTES TO THE CONSOLIDATED FINANCIAL STATEMENTS AT 30 JUNE 2017
(Amounts in Euros)
27
As of June 30, 2017 and December 31, 2016, the detail of bank loans, overdrafts, other loans and Commercial Paper Programs, as well as its conditions, were as follows:
30-06-2017
Description/Beneficiary Company Used Amount Limit Beginning
Date Date-Limit
Non-current
Mutual Loans
Toyota Caetano Portugal 10.000.000 10.000.000 11/03/2016 5 years
Toyota Caetano Portugal 7.000.000 7.000.000 15/10/2014 4 years
17.000.000 17.000.000
Current
Guaranteed account - 8.000.000
Mutual Loans 2.000.000 2.000.000 15/10/2014 4 years
Bank Overdrafts - 5.500.000
Confirming 9.181.922 10.000.000 24/05/2016
Commercial Paper:
Toyota Caetano Portugal 12.400.000 17.400.000 27/02/2017 3 years
Toyota Caetano Portugal 5.000.000 10.000.000 18/08/2015 5 years
Toyota Caetano Portugal 5.000.000 5.000.000 10/11/2016 5 years
Toyota Caetano Portugal - 4.000.000 24/02/2017 1 year
33.581.922 61.900.000
50.581.922 78.900.000
31-12-2016
Description/Beneficiary Company Used Amount Limit Beginning
Date Date-Limit
Non-current
Mutual Loans
Toyota Caetano Portugal 10.000.000 10.000.000 22/06/2012 5 years
Toyota Caetano Portugal 7.000.000 7.000.000 15/10/2014 4 years
17.000.000 17.000.000
Current
Guaranteed account 1.999.986 5.000.000
Mutual Loans 4.210.526 4.210.526 22/06/2012 5 years
Mutual Loans 2.000.000 2.000.000 15/10/2014 4 years
Bank Overdrafts 1.001.251 5.500.000
Confirming 9.930.536 10.000.000
Commercial Paper:
Toyota Caetano Portugal 9.200.000 9.200.000 27/11/2012 5 years
Toyota Caetano Portugal 3.600.000 3.600.000 26/11/2012 5 years
Toyota Caetano Portugal - 10.000.000
Toyota Caetano Portugal - 5.000.000
31.942.299 54.510.526
48.942.299 71.510.526

NOTES TO THE CONSOLIDATED FINANCIAL STATEMENTS AT 30 JUNE 2017
(Amounts in Euros)
28
Next, we present below the debt amount outstanding, for which there have been granted mortgages (Note 35): - Commercial Paper: 12.400.000. Interests relating to the above mentioned bank loans are indexed to Euribor interest rates, increased with a spread that varies from 1,00 to 3,00 bps. The item “Financial Lease” (current and non-current) is related to the purchase of facilities and equipment. The detail of this caption, as well as the reimbursement plan can be summarized as follows:
Short-term Medium-and long-term
Contract Leasings 12m 12 – 24m 24 – 36m 36 – 48m > 48m TOTAL TOTAL
2028278 Commercial facilities
Capital 96.800 97.529 99.926 99.926 69.636 367.017 463.817
Interests 3.126 2.397 1.663 924 182 5.166 8.292
559769 Commercial facilities
Capital 62.314 62.593 62.874 63.155 522.006 710.628 772.942
Interests 3.330 3.051 2.489 2.489 8.999 17.028 20.358
626064 Commercial facilities
Capital 132.848 169.290 175.311 181.547 627.738 1.153.886 1.286.734
Interests 42.900 37.086 31.064 24.829 34.691 127.670 170.570
2032103 Commercial facilities
Capital 27.061 27.031 27.061 27.061 82.104 163.258 190.319
Interests 7.704 6.713 5.672 4.578 2.788 19.751 27.455
Various Industrial Equipment
Capital 4.327.338 4.519.704 4.255.111 2.086.177 1.652.830 12.513.822 16.841.160
Interests 538.948 377.055 222.258 84.145 17.426 700.884 1.239.832
Total Capital 4.646.362 4.876.148 4.620.283 2.457.866 2.954.313 14.908.611 19.554.973
Total Interests 596.007 426.302 263.147 116.964 64.087 870.499 1.466.506 Debt Maturity The maturities of existing loans at June 30, 2017 can be summarized as follows:
12m 12 – 24m 24 – 36m 36 – 48m > 48m Total
Loan – mutual contract 2.000.000 7.000.000 - 10.000.000 - 19.000.000 Confirming 9.181.922 - - - - 9.181.922 Paper Commercial 22.400.000 - - - - 22.400.000 Finance Leases 4.646.362 4.876.148 4.620.283 2.457.866 2.954.314 19.554.973
Total loans 38.228.284
11.876.148
4.620.283
12.457.866 2.954.314
70.136.895
Interests
12m 12 - 24m 24 - 36m 36 - 48m >48m Total
Loan - mutual contract 548.072 346.250 222.500 222.500 222.500 1.561.822 Financial Leases 596.007 426.302 263.147 116.964 64.086 1.466.507
Total interests 1.144.080 772.552 485.647 339.464 286.586 3.028.329

NOTES TO THE CONSOLIDATED FINANCIAL STATEMENTS AT 30 JUNE 2017
(Amounts in Euros)
29
18. ACCOUNTS PAYABLE
As of June 30, 2017, December 31, 2016 and June 30, 2016 this caption was composed of current accounts with suppliers, which end at short term.
The Group, relating to financial risk management, has implemented policies to ensure that all liabilities are paid for within the defined payment period.
19. OTHER CREDITORS
As of June 30, 2017, December 31, 2016 and June 30, 2016 the detail of other creditors was as follows:
Current Liabilities
Jun-17 Dec-16 Jun-16
Shareholders 10.683 12.052 12.172
Advances from Customers 466.572 735.115 574.311
Other Creditors 1.753.743 348.668 764.607
2.230.998 1.095.835 1.351.090
20. PUBLIC ENTITIES
As of June 30, 2017, December 31, 2016 and June 30, 2016 the caption public entities can be summarized as follows:
Current Assets
Jun-17 Dec-16 Jun-16
Public Entities:
Income Tax - 99.372 1.230.200
Value Added Taxes 5.627.359 1.151.938 2.385.800
5.627.359 1.251.310 3.616.000
Current Liabilities
Jun-17 Dec-16 Jun-16
Public Entities:
Income Taxes withheld 445.420 349.174 400.899
Value Added Taxes 9.878.156 7.826.684 8.186.655
Income Tax (estimated tax) (Note 25) 1.020.417 - 488.464
Vehicles Tax 1.526.685 1.084.948 1.706.590
Custom Duties - 181.991 138.061
Employee's social contributions 806.692 646.318 795.100
Others 279.780 232.794 343.423
13.957.150 10.321.909 12.059.192

NOTES TO THE CONSOLIDATED FINANCIAL STATEMENTS AT 30 JUNE 2017
(Amounts in Euros)
30
21. OTHER CURRENT LIABILITIES
As of June 30, 2017, December 31, 2016 and June 30, 2016 the caption “Other Current Liabilities” was as follows:
Jun-17 Dec-16 Jun-16
Accrued Cost
Vacation pay and bonus 6.448.460 4.840.885 6.592.493
Specialization cost assigned to vehicles sold 879.378 689.185 1.025.524
Rappel charges attributable to fleet managers 956.428 1.360.601 2.080.768
Advertising Campaigns 3.140.634 3.670.380 2.216.796
Supply costs 814.846 614.402 56.388
Accrual for Vehicles Tax 1.105.008 743.009 455.329
Insurance 255.282 170.418 468.663
Commission 646.582 662.110 834.914
Interest 142.399 123.885 50.628
Advance External Supplies and Services 1.079.620 728.634 472.519
Municipal Property Tax 142.608 124.990 149.946
Amounts payable to third parties - 667.807 -
Royalties 157.039 71.284 95.622
Warranty claims 234.017 - 122.085
Specialized work 9.466 - 62.732
Rents - - 126.478
Others 1.155.138 1.292.539 1.834.828
17.166.905 15.760.129 16.645.713
Deferred Income
Vehicle maintenance contracts 3.797.924 3.976.908 3.526.785
Publicity recuperation 36.991 35.301 550.391
Subsidy granted 501.360 501.360 509.507
Interest Charged to Customers 5.066 5.827 5.485
Others 585.371 400.886 207.536
4.926.712 4.920.282 4.799.704
Total 22.093.617 20.680.411 21.445.417
22. LIABILITIES FOR RETIREMENT PENSION COMPLEMENTS
Toyota Caetano (together with other associated and related companies) incorporated by public deed dated December 29, 1988, the Salvador Caetano Pension Fund, which was subsequently updated in February 2, 1994, in April 30,1996, in August 9, 1996, in July 4, 2003, in February 2, 2007, in December 30, 2008, December 23, 2011 and in December 31, 2013.
As of June 30, 2017, the following companies of Toyota Caetano Group were associates of the Salvador Caetano Pension Fund:
- Toyota Caetano Portugal, S.A. - Caetano Auto, S.A. - Caetano Renting, S.A.
The Pension Fund was set up to, while Toyota Caetano Group maintains the decision to make contributions to the referred fund, provide employees (beneficiaries), at their retirement date, the right to a pension complement, which is not subject to update and is based on a percentage of the salary, among other conditions.

NOTES TO THE CONSOLIDATED FINANCIAL STATEMENTS AT 30 JUNE 2017
(Amounts in Euros)
31
A request was made as of December 19, 2006 to the fund manager of the Salvador Caetano Pension Fund (GNB-Sociedade Gestora de Fundo de Pensões.), to act near the “ISP - Instituto de Seguros de Portugal” and take the necessary measures to change the defined benefit plan into a defined contribution plan, among other changes.
Following the above mentioned, a dossier was sent on December 18, 2007 to Instituto de Seguros de Portugal containing the proposals to change the “Constitutive Contract” of Salvador Caetano Pension Fund, as well as the minute of approval of these changes by the Pensions Fund Advisory Committee, and requesting, with effects as from January 1, 2008, the approval of these changes.
The proposal for changing the pension complement, dully approved by the Pension Funds Advisory Committee (“Comissão de Acompanhamento do Fundo de Pensões”), includes the maintenance of a defined benefit plan for the current retired workers and ex-employees with acquired rights, as well as for all the current employees with more than 50 years and more than 15 years of service completed until January 1, 2008. A new group will be created to which all current employees with less than 50 years and/or less than 15 years of service will be transferred.
At December 29, 2008 Toyota Caetano Portugal, S.A. received a letter from ISP - Instituto de Seguros de Portugal (Portuguese Insurance Institute) with the approval of the pretended alterations and entering into force starting from January 1, 2008. ISP determined in the referred approval that the employees associated to the Salvador Caetano Pension Fund who at January 1, 2008 had achieved 15 years of service and had ages inferior to 50 years (and that shall integrate a Defined Contribution Plan) have the right to an individual “initial capital” according to the new Plan, determined according to the actuarial responsibilities as at December 31, 2007 and based on the presumptions and criteria used on that year.
The actuarial presumptions used at 2016 by the fund manager include the “Current Unit Credit” calculation method, the Mortality Table and disability TV 73/77 and SuisseRe 2001, respectively, as well as well as salary increase rate, pensions increase rate and discount rate of 1%, 0% and 1,6%, respectively. To this date were used the assumptions as December 31, 2016. At December 31, 2016 the Group's responsibilities to the defined benefit plan and the assets of the Fund allocated can be summarized as follows:
Defined benefit plan 2016
Responsibility amount 35.367.964
Fund Amount 27.541.632
The net liability of Toyota Caetano Portugal Group evidenced above is guaranteed by a provision recorded in the amount of about 9.044.139 euros, reflected in the balance sheet under "Defined Benefit Obligations".
23. PROVISIONS AND ACCUMULATED IMPAIRMENT LOSSES Movements in provisions and accumulated impairment losses over the six-month period ended as of June 30, 2017, and June 30, 2016 were as follows:
30-06-2017
Opening Balances Increases
Other regularizations
Ending Balances
Accumulated impairment losses in investments 2.780.809 - - 2.780.809
Accumulated impairment losses in accounts receivable (Note 11) 9.443.797 (8.095) 9.435.702
Accumulated impairment losses in inventories (Note 10) 1.532.523 (92.732) - 1.439.791
Provisions 407.105 94.828 (69.674) 432.259

NOTES TO THE CONSOLIDATED FINANCIAL STATEMENTS AT 30 JUNE 2017
(Amounts in Euros)
32
30-06-2016
Opening Balances Increases
Other regularizations
Ending Balances
Accumulated impairment losses in investments 2.780.809 - - 2.780.809
Accumulated impairment losses in accounts Receivable (Note 11) 9.710.649 - (4.991) 9.705.658
Accumulated impairment losses in inventories (Note 10) 1.311.777 252.454 - 1.564.231
Provisions 303.252 98.394 (60.383) 341.263
As of June 30, 2017, December 31, 2016 and June 30, 2016, the caption “Provisions” has the following breakdown:
Jun-17 Dec-16 Jun-16
Warranty provisions 149.867 124.713 108.917
Litigations in progress 282.392 282.392 232.346
432.259 407.105 341.263
24. DERIVATIVE FINANCIAL INSTRUMENTS
The derivative financial instruments used by the group as of June 30, 2017 were as follows: Interest rate Derivatives It is a derivative financial instrument contracted in order to hedge the risk of interest rate associated with a loan agreement (cash flow hedge), which contributes to the reduction of exposure to changes in interest rates or the optimization the cost of funding and has not been designated for accounting purposes coverage. The fair value of such derivative financial instrument at June 30, 2016 was negative by 63.778 Euros. The derivative financial instrument ended on June 22, 2017.
The main characteristics of this contract can be summarized as follows:
Fair Value
Derivate financial instrument Swap rate Rate receivable Type Jun-17 Dec-16 Changes in
financial statement
Swap BBVA 1,10% Euribor 3M Negotiation - (28.425) - (28.425)

NOTES TO THE CONSOLIDATED FINANCIAL STATEMENTS AT 30 JUNE 2017
(Amounts in Euros)
33
25. INCOME TAXES The income tax for the six-month period ended as of June 30, 2017 and 2016 was as follows:
Total Income Tax Jun-17 Jun-16
Insufficient taxes estimation - 32.522
Tax Refunds 4.550 (751.824)
Current taxes estimation (Note 20) 1.901.356 488.464
Deferred income taxes (Note 14) 102.355 170.889
2.008.441 (59.949)
26. SALES AND SERVICES RENDERED BY GEOGRAPHIC MARKETS AND BY ACTIVITIES The detail of sales and services rendered by geographic markets, during the six-month periods ended as of June
30, 2017 and 2016, was as follows:
Jun-17 Jun-16
Market Amount % Amount %
National 165.379.476 81,92% 147.879.600 83,87%
Belgium 30.255.433 14,99% 23.237.606 13,18%
African Countries with Official Portuguese Language 6.133.623 3,04% 5.072.845 2,88%
Spain 22.717 0,01% 23.409 0,01%
Germany - 0,00% 2.775 0,00%
United Kingdom - 0,00% 2.232 0,00%
Others 76.314 0,04% 97.989 0,06%
201.867.563 100,00% 176.316.456 100,00%
The increase occurred in the market "Belgium", refers to sales for the LC70 model. Additionally, sales and services rendered by activity were as follows:
Jun-17 Jun-16
Activity Amount % Amount %
Vehicles 164.631.528 81,55% 143.971.702 81,66%
Spare Parts 23.853.770 11,82% 21.014.807 11,92%
Repairs and after sales services 9.416.717 4,66% 8.858.433 5,02%
Others 3.965.548 1,96% 2.471.514 1,40%
201.867.563 100,00% 176.316.456 100,00%

NOTES TO THE CONSOLIDATED FINANCIAL STATEMENTS AT 30 JUNE 2017
(Amounts in Euros)
34
27. EXTERNAL SUPPLIES AND SERVICES
The caption “External supplies and services” was as follows:
Jun-17 Jun-16
Subcontracts 942.385 871.821 Specialized Services 8.626.000 7.585.903 Professional Services 2.568.237 2.514.096 Advertising 4.531.916 3.653.231 Vigilance and Security 260.876 202.692 Professional Fees 401.571 386.747 Commissions 136.156 120.860 Repairs and Maintenance 727.244 708.277 Materials 429.491 365.176 Tools and utensils 162.978 113.267 Books and technical documentation 133.172 152.872 Office supplies 13.292 13.310 Utilities 1.518.586 1.542.022 Electricity 636.562 658.796 Fuel 673.514 680.390 Water 111.814 102.424 Others 96.696 100.412 Travel and transportation 1.572.776 1.390.034 Traveling expenses 782.524 691.289 Personnel transportation 49.843 48.835 Transportation of materials 740.409 649.910 Other supplies 7.126.973 6.434.784 Rent 1.671.564 1.628.316 Communication 331.693 335.903 Insurance 648.587 635.482 Royalties 307.308 199.987 Notaries 11.515 14.986 Cleaning and comfort 359.373 341.301 Other Services 3.796.933 3.278.809
20.216.211 18.189.740
The caption "Other services" includes about 1,9 million euros, relating to guarantees claims.
28. PAYROLL EXPENSES Payroll expenses are decomposed as follows:
Jun-17 Jun-16
Payroll Management 238.289 235.930
Payroll Personnel 12.959.832 13.417.303
Benefits Plan 1.008.524 1.016.277
Termination Indemnities 170.600 98.401
Social Security Contribution 3.192.962 3.326.193
Workmen´s Insurance 184.143 208.927
Others 1.540.301 1.740.736
19.294.651 20.043.767

NOTES TO THE CONSOLIDATED FINANCIAL STATEMENTS AT 30 JUNE 2017
(Amounts in Euros)
35
28.1. REMUNERATION OF BOARD MEMBERS
The remuneration of members of the board of Toyota Caetano Portugal, S.A. in the six-months ended as of June 30, 2017 and 2016 were as follows:
Board Members Jun-17 Jun-16
Board of Directors Fixed remunerations 238.289 235.930
28.2. AVERAGE NUMBER OF PERSONNEL
During the six-month period ended as of June 30, 2017 and 2016, the average number of personnel was as follows:
Personnel Jun-17 Jun-16
Employees 1.088 1.092 Workers 473 499
1.561 1.591
29. OTHER OPERATING INCOME AND EXPENSES As of June 30, 2017 and 2016, the caption “Other operating income” and “Other operating expenses” were as
follows:
Other operating income Jun-17 Jun-16
Lease Equipment 6.148.122 5.706.504
Guarantees recovered (Toyota) 2.977.603 2.495.872
Commissions 1.671.852 1.936.915
Rents charged (Note 6) 1.815.019 1.841.472
Work for the Company 1.370.033 1.659.252
Subsidies 1.188.232 1.328.908
Advertising expenses and sales promotion recovered 918.681 950.759
Rents expenses recovered 629.812 559.054
Services provided 714.033 848.009
Transport expenses recovered 333.228 282.039
Gains in the disposal Tangible Fixed Assets 264.685 134.312
Materials 23.545 48.075
Others 2.512.812 2.129.030
20.567.657 19.920.201

NOTES TO THE CONSOLIDATED FINANCIAL STATEMENTS AT 30 JUNE 2017
(Amounts in Euros)
36
Jun-17 Jun-16
Taxes 637.679 583.918
Prompt payment discounts granted 707 4.236
Losses in other investments - 10
Losses in other non-financial investments 12.157 40.067
Corrections to previous years 58.171 86.252
Donations 10.100 4.750
Subscriptions 11.341 11.129
Fines and penalties 27.800 15.198
Others 660.184 751.687
1.418.139 1.497.247
30. FINANCIAL INCOME AND EXPENSES Consolidated net financial results as of June 30, 2017 and 2016 were as follows:
Expenses and Losses Jun-17 Jun-16
Interest 978.739 887.986
Other Financial Expenses 192.578 197.490
1.171.317 1.085.476
Income and Gains Jun-17 Jun-16
Interest 2.272 44.634
Other Financial Income 28.425 30.754
30.697 75.388

NOTES TO THE CONSOLIDATED FINANCIAL STATEMENTS AT 30 JUNE 2017
(Amounts in Euros)
37
31. FINANCIAL ASSETS AND LIABILITIES We summarize in the table below a resume of financial instruments of Toyota Caetano Group as of June 30, 2017, December 31, 2016 and June 30, 2016:
Financial Assets Financial Liabilities
Note Jun-17 Dec-16 Jun-16 Jun-17 Dec-16 Jun-16
Derivate Financial Instruments 25 - - - - 28.425 63.778
Available for sale Financial Assets 9 3.585.698 3.483.128 3.367.091 - - -
Accounts Receivable 11 55.162.883 57.920.456 58.441.630 - - -
Other Debtors - Current 12 2.994.957 2.999.881 3.242.065 - - -
Bank Loan 18 - - - 50.581.922 47.941.048 47.580.876
Finance Leases 18 - - - 19.554.973 20.278.406 20.256.978
Bank Overdrafts 18 - - - - 1.001.251 164.509
Other Creditors 20 - - - 2.230.998 1.095.835 1.351.090
Accounts Payable 19 - - - 29.411.995 35.509.231 30.355.943
Cash and Cash Equivalents 15 7.353.599 14.556.190 8.310.031 - - -
69.097.137 78.959.655 73.360.817 101.779.888 105.854.196 99.773.174
Financial Instruments at Fair Value
Financial Assets Financial Liabilities
Note Jun-17 Dec-16 Jun-16 Jun-17 Dec-16 Jun-16
Derivate Financial Instruments 25 - - - - (28.425) (63.778)
Available for sale Financial Assets 9 3.585.698 3.483.128 3.367.091 - - -
3.585.698 3.483.128 3.367.091 - (28.425) (63.778)
Classification and Measurement
Available for sale Assets Derivate Financial Instruments
Level At fair value At cost
Cash Flow Hedge
Accounting Negotiation
Cimóvel Fund
3.518.962 - - - 1)
Others - 66.736 - - 3)
According to the paragraph 93 of IFRS 13, we provide below, the disclosure of classification and measurement of financial instruments’ fair value, by hierarchy level:
a) level 1 – quoted prices – available for sale financial assets: 3.518.962 Euros (3.416.391 Euros in December 31, 2016);
b) level 2 - inputs different from quoted prices included on level 1 that are observable for the asset or liability, both directly (prices), or indirectly – negotiation derivatives (swaps e forwards): (-28.425 Euros in December 31, 2016);
c) level 3 - inputs for the asset or liability that are not based on observable market data.

NOTES TO THE CONSOLIDATED FINANCIAL STATEMENTS AT 30 JUNE 2017
(Amounts in Euros)
38
Impact on the Income Statement and Equity
Impact on equity Impact on Income
Jun-17 Dec-16 Jun-16 Jun-17 Dec-16 Jun-16
Derivate Financial Instruments - - - (28.425) 66.107 (30.754)
Available for sale Financial Assets 102.570 19.678 (96.359) - - -
102.570 19.678 (96.359) (28.425) 66.107 (30.754)
32. OPERATIONAL LEASE
During the six-month period ended as of June 30, 2017 the minimum payments for operational leases amounted to approximately 4,3 million Euros (5,7 million Euros in 2016). Of that amount, 2 million relate to payments with maturity of one year and 2,1 million relate to payments to occur in the period between two to five years.
Minimum payments of operational lease Jun-17 Dec-16
Not more than one year 2.089.171 2.149.610
More than one year and no more than five 2.124.774 3.409.638
More than five years 119.009 118.370
4.332.955 5.677.618

NOTES TO THE CONSOLIDATED FINANCIAL STATEMENTS AT 30 JUNE 2017
(Amounts in Euros)
39
33. RELATED PARTIES
Balances and transactions between the Parent Company and its affiliates, which are related entities to the Parent Company, were eliminated in the consolidation process, so they will not be disclosed in this Note. Balances and transactions details between the Toyota Caetano Group and the related parties can be summarized as follows:
Commercial Debts Products Fixed assets Services Others
Company Receivable payable Sales Purchases Purchases Disposals Rendered Obtained Costs Income
Amorim Brito & Sardinha, Lda. 1.316 - - - - - - - - 1.168 Atlântica - Companhia Portuguesa de Pesca, S.A. 5.152 - - - - - - - - 17 Auto Partner Imobiliária, S.A. - 13.787 - - - - - 66.554 - - Cabo Verde Rent-a-Car, Lda. 9.674 3.604 - - - - 77.299 6.232 - - Caetano Active, S.A. 2.856 6.666 261 14 - - 1.697 5.738 - 271 Caetano Aeronautic, S.A. 821.134 - 112 - - - 12.726 - - 257.160 Caetano Baviera - Comércio de Automóveis, S.A. 999.193 246.155 1.588.561 238.475 - - 1.514 80.714 141.982 402.132 Caetano City e Active (Norte), S.A. 527.741 28.746 1.671.576 1.732 - 36.317 85 44.293 75.463 180.305 Caetano Drive, Sport e Urban, S.A. 79.888 118.874 1.305 1.684 - 81.463 41.195 123.241 - 140.368 Caetano Energy, S.A. 102.369 2.170 572 - - - 1.447 - - 83.487 Caetano Fórmula, S.A. 26.960 228.972 20.462 403.096 - 19.125 44.330 445 - 69.307 Caetano Formula East África, S.A. - 500 - - - - - - - - Caetano Motors, S.A. 52.638 23.122 2.178 8.271 - - - 21.622 - 99.804 Caetano Move África, S.A. - - - - - - - - - 43 Caetano One CV, Lda. - 283.416 2.441 8.227 - - 69 41.196 - - Caetano Parts, Lda. 52.824 1.779.449 893.624 3.101.890 - - 788 9.663 - 94.892 Caetano Power, S.A. 98.959 56.979 1.936 29.441 23.152 18.167 8.349 (3.529) - 105.615 Caetano Retail (S.G.P.S.), S.A. 38.868 811.922 62 - - - 28 1.504 - 45.084 Caetano Squadra África, S.A. - - - - - - - - - 42 Caetano Star, S.A. 17.395 4.002 455 775 - - - 344 - 6.820 Caetano Technik, Lda. 489 62.187 2.934 60 - - 5.209 (5.896) 18.948 1.747 CaetanoBus - Fabricação de Carroçarias, S.A. 7.554.768 121.716 23.712 28.985 - - 2.011 49.717 4.053 1.249.079 Caetsu Publicidade, S.A. 40.054 782.201 61.620 - - - 4.589 1.523.764 - 1.055 Carplus - Comércio de Automóveis, S.A. 48.536 - 49.821 - - - 74.576 267 - 117.112 Choice Car, S.A. 673 360 - - - - - 340 - 3.397 COCIGA - Construções Civis de Gaia, S.A. 7.243 131.945 - - 164.458 - - 35.120 - 2.633 Finlog - Aluguer e Comércio de Automóveis, S.A. 260.060 252.166 629.223 14.431 - - 185.840 667.476 473.849 101.490 Fundação Salvador Caetano 617.902 - - - - - - - - 94

NOTES TO THE CONSOLIDATED FINANCIAL STATEMENTS AT 30 JUNE 2017
(Amounts in Euros)
40
Commercial Debts Products Fixed assets Services Others Company Receivable payable Sales Purchases Purchases Disposals Rendered Obtained Costs Income
Globalwatt, (S.G.P.S.), S.A. - - - - - - - - - 9 Grupo Salvador Caetano, (S.G.P.S.), S.A. 21 2.526 - - - - - - - 136 Guérin - Rent-a-Car (Dois), Lda. 282.709 18.827 14.207 - - - 637.213 14.282 40.674 24.298 Ibericar - Sociedad Iberica del Automovil, S.A. - - - - - - - - - 1.166 Ibericar Auto Nipon, S.A. 775 - - - - - - - - - Ibericar Barcelona Premium, S.L. - - - - - - - - 583 - Ibericar Gestoso, S.L. - - - - - - - - 583 - Ibericar Motors Cádiz, S.L. - - - - - - - - - 450 Ibericar Movil, S.L. - - - - - - - - - 150 Ibericar Reicomsa, S.A. 134 - - - - - - - - 134 Lavorauto - Administração e Consultoria de Empresas, S.A. - 2.550 - - - - - - - - Lidera Soluciones, S.L. - - - - - - - 54.713 - - Lusilectra - Veículos e Equipamentos, S.A. 88.514 191.627 31.303 11.629 203.524 - 40.382 201.122 1.400 35.202 MDS Auto - Mediação de Seguros, S.A. 25.321 - - - - - - - - 4.578 Movicargo - Movimentação Industrial, Lda. 2.929 405.166 290 372.752 - - 2.472 17.416 - 1.725 Portianga - Comércio Internacional e Participações, S.A. 45.001 - 29.068 - - - 62.680 14 192.560 14.137 RARCON - Arquitectura e Consultadoria, S.A. - 7.038 - - - - - 39.152 - 47 Rigor - Consultoria e Gestão, S.A. 40.562 996.848 2.586 - 22.457 - 72.293 2.071.399 670 145.010 Robert Hudson, LTD 217 2.682 208 - - - - - - 117 Salvador Caetano - Auto - (S.G.P.S.), S.A. 282 - - - - - - - - 374 Salvador Caetano Auto África, (S.G.P.S.), S.A. 812.010 83 - - - - - - 83 17 Salvador Caetano Capital, (S.G.P.S.), S.A. 10 - - - - - - - - 9 SIMOGA - Sociedade Imobiliária de Gaia, S.A. 1.374 - - - - - - - - 337 Sózó Portugal, S.A. 2.166 - - - - - - - - 1.889 Tovicar - Sociedade Comercial de Automóveis, S.A. 7.019 - - - - - - - - - Turispaiva - Sociedade Turística Paivense, S.A. 406 - - - - - - - - 660 VAS África (S.G.P.S.), S.A. - - - - - - - - - 111 Vas Cabo Verde, Sociedade Unipessoal, S.A. - 1.321 10.157 3.344 - - 34.766 1.572 - 57.506
12.676.137 6.587.608 5.038.675 4.224.804 413.590 155.073 1.311.560 5.068.473 950.848 3.251.180
Goods and services purchased and sales to related parties were made at market prices.
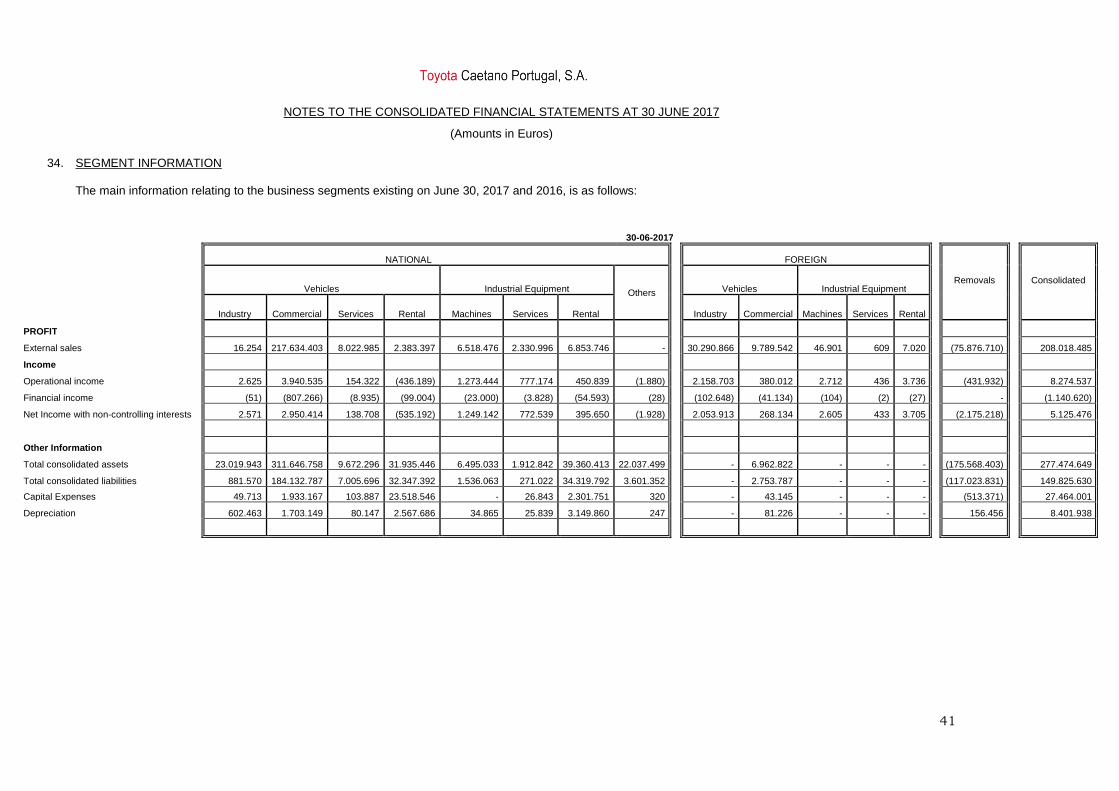
NOTES TO THE CONSOLIDATED FINANCIAL STATEMENTS AT 30 JUNE 2017
(Amounts in Euros)
41
34. SEGMENT INFORMATION The main information relating to the business segments existing on June 30, 2017 and 2016, is as follows:
30-06-2017
NATIONAL FOREIGN
Vehicles Industrial Equipment Others Vehicles Industrial Equipment Removals Consolidated
Industry Commercial Services Rental Machines Services Rental Industry Commercial Machines Services Rental
PROFIT
External sales 16.254 217.634.403 8.022.985 2.383.397 6.518.476 2.330.996 6.853.746 - 30.290.866 9.789.542 46.901 609 7.020 (75.876.710) 208.018.485
Income
Operational income 2.625 3.940.535 154.322 (436.189) 1.273.444 777.174 450.839 (1.880) 2.158.703 380.012 2.712 436 3.736 (431.932) 8.274.537
Financial income (51) (807.266) (8.935) (99.004) (23.000) (3.828) (54.593) (28) (102.648) (41.134) (104) (2) (27) - (1.140.620)
Net Income with non-controlling interests 2.571 2.950.414 138.708 (535.192) 1.249.142 772.539 395.650 (1.928) 2.053.913 268.134 2.605 433 3.705 (2.175.218) 5.125.476
Other Information
Total consolidated assets 23.019.943 311.646.758 9.672.296 31.935.446 6.495.033 1.912.842 39.360.413 22.037.499 - 6.962.822 - - - (175.568.403) 277.474.649
Total consolidated liabilities 881.570 184.132.787 7.005.696 32.347.392 1.536.063 271.022 34.319.792 3.601.352 - 2.753.787 - - - (117.023.831) 149.825.630
Capital Expenses 49.713 1.933.167 103.887 23.518.546 - 26.843 2.301.751 320 - 43.145 - - - (513.371) 27.464.001
Depreciation 602.463 1.703.149 80.147 2.567.686 34.865 25.839 3.149.860 247 - 81.226 - - - 156.456 8.401.938

NOTES TO THE CONSOLIDATED FINANCIAL STATEMENTS AT 30 JUNE 2017
(Amounts in Euros)
42
30-06-2016
NATIONAL FOREIGN
Vehicles Industrial Equipment Others Vehicles Industrial Equipment Removals Consolidated
Industry Commercial Services Rental Machines Services Rental Industry Commercial Machines Services Rental
PROFIT
External sales 281.836 193.425.076 7.618.246 1.645.553 9.269.710 2.046.551 6.236.394 957.346 23.615.483 8.428.725 24.515 4.829 8.820 (71.537.124) 182.025.960
Income
Operational income (129.226) 2.111.197 117.345 (407.839) 1.075.992 857.079 340.321 (2.150) (1.382.397) 354.503 1.459 167 5.330 465 2.942.246
Financial income 4.932 (725.065) (31.511) (61.301) (21.799) (4.236) (49.744) (33) (99.238) (22.032) (24) - (37) - (1.010.088)
Net Income with non-controlling interests (124.294) 1.358.653 53.260 (469.140) 1.054.193 852.843 290.577 (2.217) (1.481.635) 278.097 1.435 167 5.293 174.875 1.992.107
Other Information
Total consolidated assets 22.475.980 247.347.206 29.637.240 22.299.076 17.370.969 9.473.292 31.844.475 22.821.888 - 9.399.508 - - - (145.327.866) 267.341.768
Total consolidated liabilities 382.942 148.970.371 20.150.669 16.865.289 1.493.538 263.230 29.785.750 3.601.891 - 3.304.798 - - - (83.775.820) 141.042.658
Capital Expenses 6.370 1.357.984 125.308 11.864.337 - 28.900 5.473.268 131 - 64.085 - - - 209.909 19.130.292
Depreciation 614.508 1.724.678 212.389 1.787.829 30.706 19.320 2.488.307 350 - 83.722 - - - 124.840 7.086.649
The line "Turnover" includes Sales, Services Rendered and the amount of about 6.150.922 Euros (5.709.504 Euros as of June 30, 2016) related to equipment rentals accounted in Other Operating Income (Note 29).
The column “Eliminations” mainly includes the elimination of transactions between Group companies included in consolidation, mainly belonging to Vehicles segment.

NOTES TO THE CONSOLIDATED FINANCIAL STATEMENTS AT 30 JUNE 2017
(Amounts in Euros)
43
35. CONTINGENT ASSETS AND LIABILITIES
Financial commitments not included in the consolidated balance sheet As of June 30, 2017, December 31, 2016 and June 30, 2016, Toyota Caetano Group had assumed the following financial commitments:
Commitments Jun-17 Dec-16 Jun-16
Credits 105.190 105.190 110.504
Guarantees of Imports 4.000.000 5.500.000 7.000.000
4.105.190 5.605.190 7.110.504
The amounts presented classified as “Guarantees for Imports”, the amount of 4 million Euros is related with guarantees on imports provided to Customs Agency. Following the 29,9 million Euros debt contracting process occurred in 2012, remaining, at the present date, approximately 12,4 million Euros outstanding as a liability in the consolidated statement of financial position (see Note 17), the Group has granted mortgages to the respective financial institutions, valued at about 37,8 million Euros, at the financing date.
36. INFORMATION RELATED TO ENVIRONMENTAL AREA The Group adopts the necessary measures relating to the environment, aiming to fulfil current applicable legislation.
The Toyota Caetano Group Board of Directors does not estimate that there are risks related to the environmental protection and improvement, not having received any infraction related to this matter during the first half of 2017.
37. END OF LIFE VEHICLES
In September 2000, the European Commission approved a Directive regarding end-of-life vehicles and the responsibility of Producers/Distributors for dismantling and recycling them.
Producers/Distributors will have to support at least a significant part of the cost of the dismantling of vehicles that went to the market after July 1, 2002, as well as in relation to vehicles produced before this date, but presented as of January 1, 2007.
This legislation will impact Toyota vehicles sold in Portugal. Toyota Caetano and Toyota are closely monitoring
the development of Portuguese National Legislation in order to access the impact of these operations in its financial statements.
It is our conviction, in accordance with studies performed on the Portuguese market, and taking in consideration
the possible usage of the vehicles parts resulting from the dismantlement, that the effective impact of this legislation in the Company accounts will be reduced or nil.
Meanwhile, and according to the legislation in force (Dec. /Law 196/2003), the Company signed a contract with
“ValorCar – Sociedade de Gestão de Veículos em Fim de Vida, Lda.” - a licensed entity for the management of an integrated system of VLF- the transfer of the liabilities in this process.

NOTES TO THE CONSOLIDATED FINANCIAL STATEMENTS AT 30 JUNE 2017
(Amounts in Euros)
44
38. EARNINGS PER SHARE
The earnings per share for the six-month period ended as of June 30, 2017 and 2016 were computed based on
the following amounts:
Jun-17 Jun-16
Net Income
Basic 5.125.476 1.992.107
Diluted 5.125.476 1.992.107
Number of shares 35.000.000 35.000.000
Earnings per share (basic and diluted) 0,146 0,057
During the six-month period ended as of June 30, 2017 and June 30, 2016 there were no changes in the number of shares outstanding.
39. SUBSEQUENT EVENTS
Since the conclusion of the 1st semester and up to date, no significant events occurred.
40. FINANCIAL STATEMENTS APPROVAL
The consolidated financial statements were approved by the Board of Directors on August 31th, 2017. According to the Portuguese Commercial Companies Code, it is possible the amended for these Financial Statements, after approval by the Board of Directors.
41. EXPLANATION ADDED FOR TRANSLATION
These financial statements are a translation of financial statements originally issued in Portuguese language in accordance with IFRS. In the event of discrepancies, the Portuguese language version prevails.
CHARTERED ACCOUNTANT BOARD OF DIRECTORS ALEXANDRA MARIA PACHECO GAMA JUNQUEIRA JOSÉ REIS DA SILVA RAMOS - President MARIA ANGELINA MARTINS CAETANO RAMOS SALVADOR ACÁCIO MARTINS CAETANO MIGUEL PEDRO CAETANO RAMOS
NOBUAKI FUJII MATTHEW PETER HARRISON
RUI MANUEL MACHADO DE NORONHA MENDES

Report and opinion of the Fiscal Council
In accordance with the terms of item g) of Article 420.º of the Companies Code and of the Articles of Association, it competes us to appreciate the report of the management performed and proceed to the general appraisal of the documents and statement of consolidated accounts of TOYOTA CAETANO PORTUGAL, SA, referring to the first semester of 2017 and which were presented to us by the Board of Directors. In accordance with the assignments conferred to us, during this exercise we proceeded to the follow-up of the evolution of the social business with the frequency and to the extend considered advisable, to the general analysis of the financial procedures and the confirmation by sampling of the respective files. We have no knowledge of any situation which didn’t respect the articles of association and the legal terms applicable. We analysed the limited revision Report elaborated by the registered auditor in CMVM (Comissão Mercado Valores Mobiliários) under number 9077, with which we agree. Thus, All members of the Board of Auditors of the TOYOTA CAETANO PORTUGAL, SA under the terms of item c) of number 1 of Article 246.º of the Exchange Stock Code, hereby confirm, as far as it is our knowledge, that the information provided in item a) of the above referred article was elaborated according to accounting rules applicable, evidencing a correct and clear image of the assets and liabilities, of the financial highlights and results of Group TOYOTA CAETANO PORTUGAL, SA and that the report of the management clearly shows the business evolution, the performance and the position of the Group, evidencing as well a description of the mains risks and incertitude’s to be faced. In these terms, we believe that the Financial Statements referring to the period ending at 30th June 2017 accurately reflect the result of all operations developed in that same period by the Group Toyota Caetano Portugal, S.A. Vila Nova de Gaia, 31th August 2017 José Domingos da Silva Fernandes Alberto Luis Lema Mandim Daniel Broekhuizen

PricewaterhouseCoopers & Associados - Sociedade de Revisores Oficiais de Contas, Lda.
o′Porto Bessa Leite Complex, Rua António Bessa Leite, 1430 - 5º, 4150-074 Porto, Portugal
Tel +351 225 433 000 Fax +351 225 433 499, www.pwc.pt
Matriculada na CRC sob o NUPC 506 628 752, Capital Social Euros 314.000
Inscrita na lista das Sociedades de Revisores Oficiais de Contas sob o nº 183 e na CMVM sob o nº 20161485
PricewaterhouseCoopers & Associados - Sociedade de Revisores Oficiais de Contas, Lda. pertence à rede de entidades que são membros da PricewaterhouseCoopers International Limited, cada uma das quais é uma entidade legal autónoma e independente. Sede: Palácio Sottomayor, Rua Sousa Martins, 1 - 3º, 1069-316 Lisboa, Portugal
Review Report on the Consolidated Financial Stateme nts (Free translation from the original in Portuguese) Introduction We have reviewed the accompanying consolidated financial statements of Toyota Caetano Portugal, S.A. (the Company), which comprise the consolidated statement of financial position as at 30 June 2017 (which shows total assets of Euro 276,658,986 and total shareholder's equity of Euro 127,649,019, including a net profit of 5,059,897), the consolidated statements of income by nature, comprehensive income, changes in equity and cash flows for the six-month period then ended, and the accompanying explanatory notes to these consolidated financial statements.
Management’s responsibility The Management is responsible for the preparation and fair presentation of these consolidated financial statements in accordance with International Accounting Standard 34 – Interim Financial Reporting as adopted by the European Union, as well as to create and maintain appropriate systems of internal control to enable the preparation of consolidated financial statements that are free from material misstatement, whether due to fraud or error.
Auditor’s Responsibility
Our responsibility is to express a conclusion on the accompanying consolidated financial statements. We conducted our review in accordance with ISRE 2410 – Review of Interim Financial Information Performed by the Independent Auditor of the Entity and other technical and ethical standards and recommendations issued by the Institute of Statutory Auditors. Those standards require that we conduct the review in order to conclude whether anything has come to our attention that causes us to believe that the consolidated financial statements are not prepared, in all material respects, in accordance with International Accounting Standard 34 – Interim Financial Reporting as adopted by the European Union.
A review of financial statements is a limited assurance engagement. The procedures performed mainly consist of making inquiries and applying analytical procedures, and evaluating the evidence obtained. The procedures performed in a review are substantially less than those performed in an audit conducted in accordance with International Standards on Auditing (ISA). Accordingly, we do not express an opinion on these consolidated financial statements.

PricewaterhouseCoopers & Associados - Sociedade de Revisores Oficiais de Contas, Lda.
o′Porto Bessa Leite Complex, Rua António Bessa Leite, 1430 - 5º, 4150-074 Porto, Portugal
Tel +351 225 433 000 Fax +351 225 433 499, www.pwc.pt
Matriculada na CRC sob o NUPC 506 628 752, Capital Social Euros 314.000
Inscrita na lista das Sociedades de Revisores Oficiais de Contas sob o nº 183 e na CMVM sob o nº 20161485
PricewaterhouseCoopers & Associados - Sociedade de Revisores Oficiais de Contas, Lda. pertence à rede de entidades que são membros da PricewaterhouseCoopers International Limited, cada uma das quais é uma entidade legal autónoma e independente. Sede: Palácio Sottomayor, Rua Sousa Martins, 1 - 3º, 1069-316 Lisboa, Portugal
Conclusion Based on our review, nothing has come to our attention that causes us to believe that accompanying consolidated financial statements of Toyota Caetano Portugal, S.A. as at 30 June 2017 are not prepared, in all material respects, in accordance with International Accounting Standard 34 – Interim Financial Reporting as adopted by the European Union.
Porto, 31 agosto 2017 PricewaterhouseCoopers & Associados - Sociedade de Revisores Oficiais de Contas, Lda Registered in the Comissão do Mercado de Valores Mobiliários with no. 20161485 represented by: José Miguel Dantas Maio Marques, R.O.C. (This is a translation, not to be signed)