Embed Size (px)
Citation preview

1
Progress report on The Nature Conservancy’s Komodo marine conservation project - July 2004
in collaboration with
Balai Taman Nasional Komodo
2
Progress report on The Nature Conservancy’s
Komodo marine conservation project - July 2004
last updated: November 22 2004
compiled by Dr Peter J. Mous, Abdul Halim, Gede Wiadnya, Johannes Subijanto
in collaboration with Dr Mattheus Halim, Head of Komodo National Park
TNC Southeast Asia Center for Marine Protected Areas Jl Pengembak 2, Sanur, Bali, INDONESIA phone +62-(0)361-287272, fax +62-(0)361-270737
3
Table of contents
Acknowledgements ................................................................................................................... 9
1 Introduction .......................................................................................................................... 10
2 Planning................................................................................................................................ 12
2.1 Long-term (25 year) and mid-term (five year) management plans ............................... 12
2.2 Park financing and management structure..................................................................... 14
2.2.1 Concession for eco-tourism development .............................................................. 14
2.2.2 Komodo Collaborative Management Initiative (KCMI) ........................................ 16
2.2.3 Milestones............................................................................................................... 17
2.2.4 Next steps ............................................................................................................... 18
2.3 Zoning and licensing ..................................................................................................... 18
3 Surveillance .......................................................................................................................... 22
3.1 Introduction ................................................................................................................... 22
3.2 Legal framework ........................................................................................................... 22
3.3 Implementation of the surveillance program................................................................. 23
3.4 Speedboat patrols........................................................................................................... 23
3.5 Floating Ranger Stations ............................................................................................... 27
3.6 Surveillance exchanges with Ujung Kulon National Park and Wakatobi Marine National Park ....................................................................................................................... 31
4 Community awareness and outreach .................................................................................... 31
4.1 Extension of the Komodo self-financing structure and the Komodo Collaborative Management Initiative......................................................................................................... 32
4.2 Reaching out to the media ............................................................................................. 33
4.3 Conservation education campaign and community involvement in marine conservation............................................................................................................................................. 36
4.3.1 Local sparkplugs..................................................................................................... 37
4.3.2 Village visits and group discussions....................................................................... 37
4.3.3 Community action .................................................................................................. 38
4.3.4 Conservation education at the Labuan Bajo fisheries high school ......................... 40
4.4 Pride campaign .............................................................................................................. 42
4.5 Outreach materials......................................................................................................... 44
4.6 Website .......................................................................................................................... 44
5 Alternative livelihood development ..................................................................................... 48
5.1 Fish culture .................................................................................................................... 49
5.2 Seaweed culture............................................................................................................. 51
4
5.2.1 Objectives of the Komodo seaweed culture project ............................................... 51
5.2.2 Socio-economic aspects of seaweed culture........................................................... 51
5.2.3 Initial assessments .................................................................................................. 52
5.2.4 Progress of the seaweed culture project ................................................................. 52
5.2.5 Lessons learned, next steps..................................................................................... 53
5.3 Pelagic fishery development.......................................................................................... 55
5.3.1 Objectives of the Komodo pelagic fishery development project............................ 55
5.3.2 Socio-economic aspects of pelagic fishery............................................................. 55
5.3.3 Initial assessments .................................................................................................. 56
5.3.4 Progress of the pelagic fishery development project .............................................. 56
5.3.5 Lessons learned, next steps..................................................................................... 58
5.4 Miscellaneous alternative livelihood development projects.......................................... 64
5.4.1 Wood carving ......................................................................................................... 64
5.4.2 Sewing .................................................................................................................... 65
6 Monitoring and research....................................................................................................... 66
6.1 Introduction ................................................................................................................... 66
6.2 Coral monitoring ........................................................................................................... 67
6.3 Fish monitoring ............................................................................................................. 70
6.4 Resource use monitoring ............................................................................................... 72
6.4.1 Introduction ............................................................................................................ 72
6.4.2 Survey practicalities, performance of the surveillance and resource use monitoring program ........................................................................................................................... 73
6.4.3 Characteristics of the artisanal fishery in Komodo National Park ......................... 76
6.4.4 Spatial patterns in the reef fishery in Komodo National Park ................................ 77
6.5 Assessment of the Park’s mangroves and sea grass stands ........................................... 89
6.5.1 Mangrove monitoring............................................................................................. 89
6.5.2 Sea grasses.............................................................................................................. 89
6.6 Assessment of cetaceans, manta rays and turtle nesting beaches .................................. 89
6.6.1 Cetaceans................................................................................................................ 89
6.6.2 Manta rays .............................................................................................................. 90
6.6.3 Sea turtle nesting beaches....................................................................................... 90
6.7 Coral reef rehabilitation................................................................................................. 91
6.8 Measuring success and auditing .................................................................................... 92
7 References ............................................................................................................................ 93
8 Appendix – situation diagrams........................................................................................... 100

5
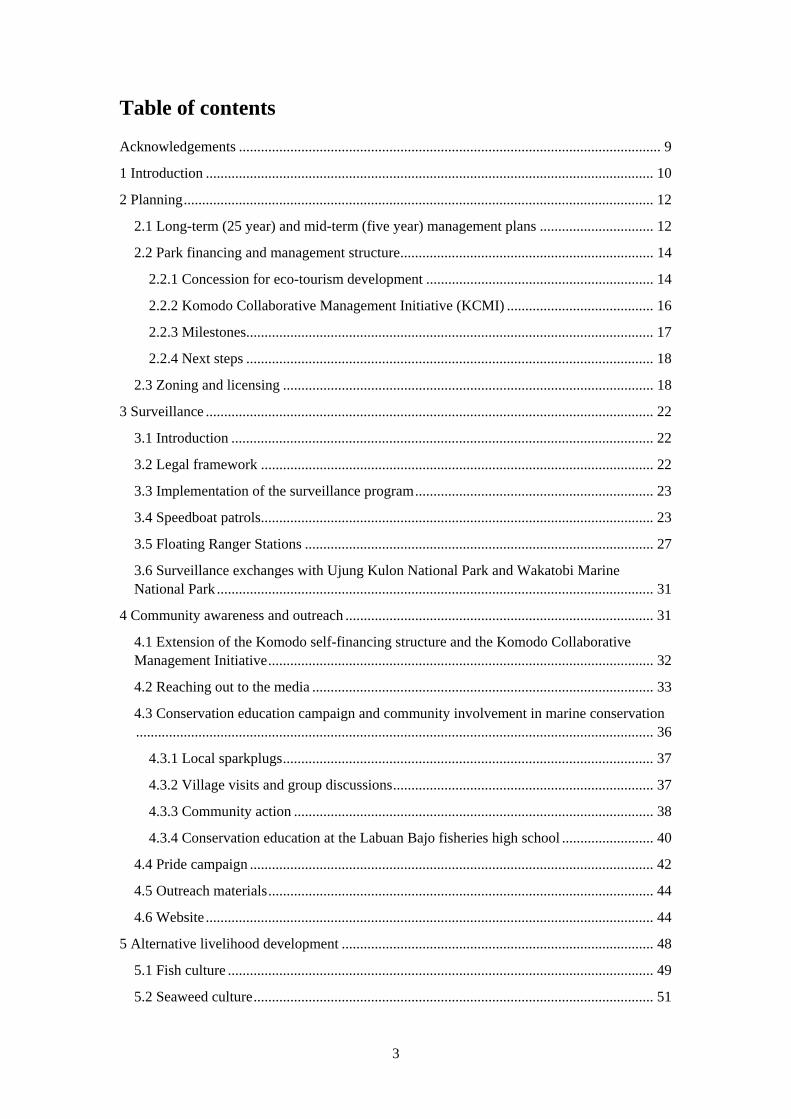
Figures Figure 1. Location of Komodo National Park in Indonesia.................................................... 11
Figure 2. Funds generated through the tourism concession (years 1-7), as compared to the present situation (year 0). PNK = eco-tourism revenues, collected and distributed by PT Putri Naga Komodo; GovIn = income for government agencies generated by the Park as entrance fees, taxes etc.; TNC = contribution of The Nature Conservancy to concession operations and Park management; GEF = contribution of the Global Environmental Facility to concession operations and Park management, GEF+ = contribution of the Global Environmental Facility to start-up costs and carrying capacity studies (see also PT Putri Naga Komodo 2003). ........................................................................................ 15
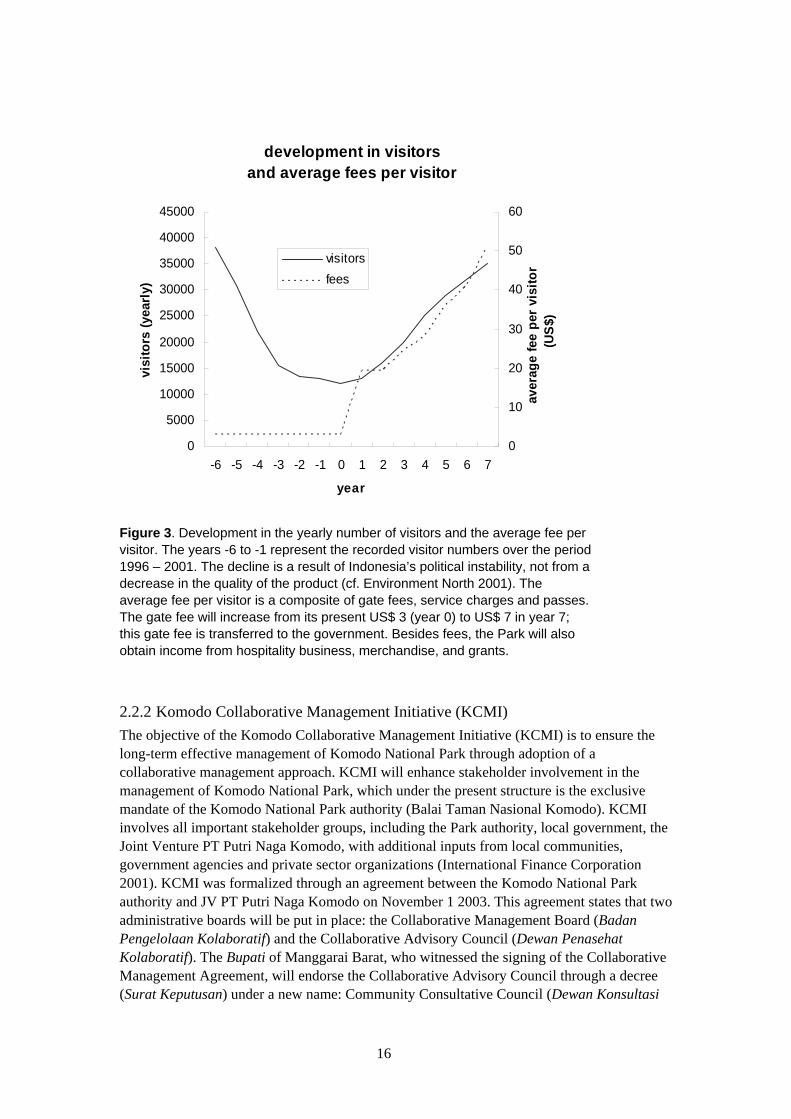
Figure 3. Development in the yearly number of visitors and the average fee per visitor. The years -6 to -1 represent the recorded visitor numbers over the period 1996 – 2001. The decline is a result of Indonesia’s political instability, not from a decrease in the quality of the product (cf. Environment North 2001). The average fee per visitor is a composite of gate fees, service charges and passes. The gate fee will increase from its present US$ 3 (year 0) to US$ 7 in year 7; this gate fee is transferred to the government. Besides fees, the Park will also obtain income from hospitality business, merchandise, and grants.... 16
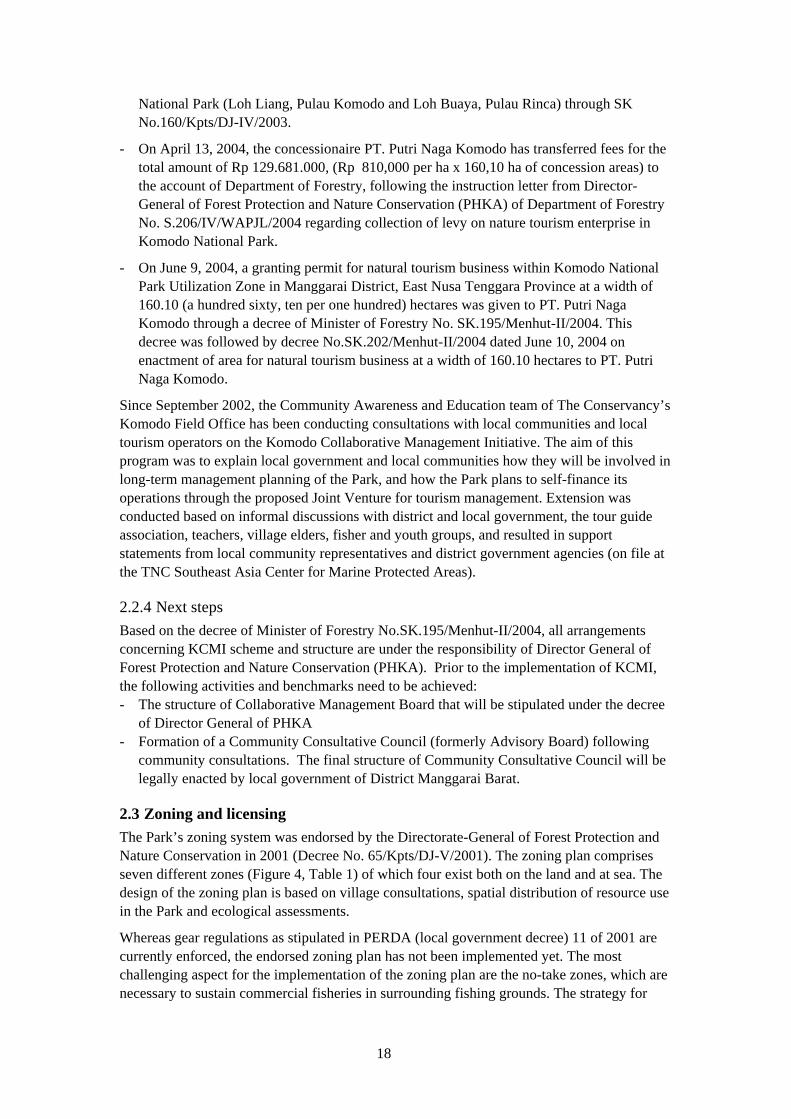
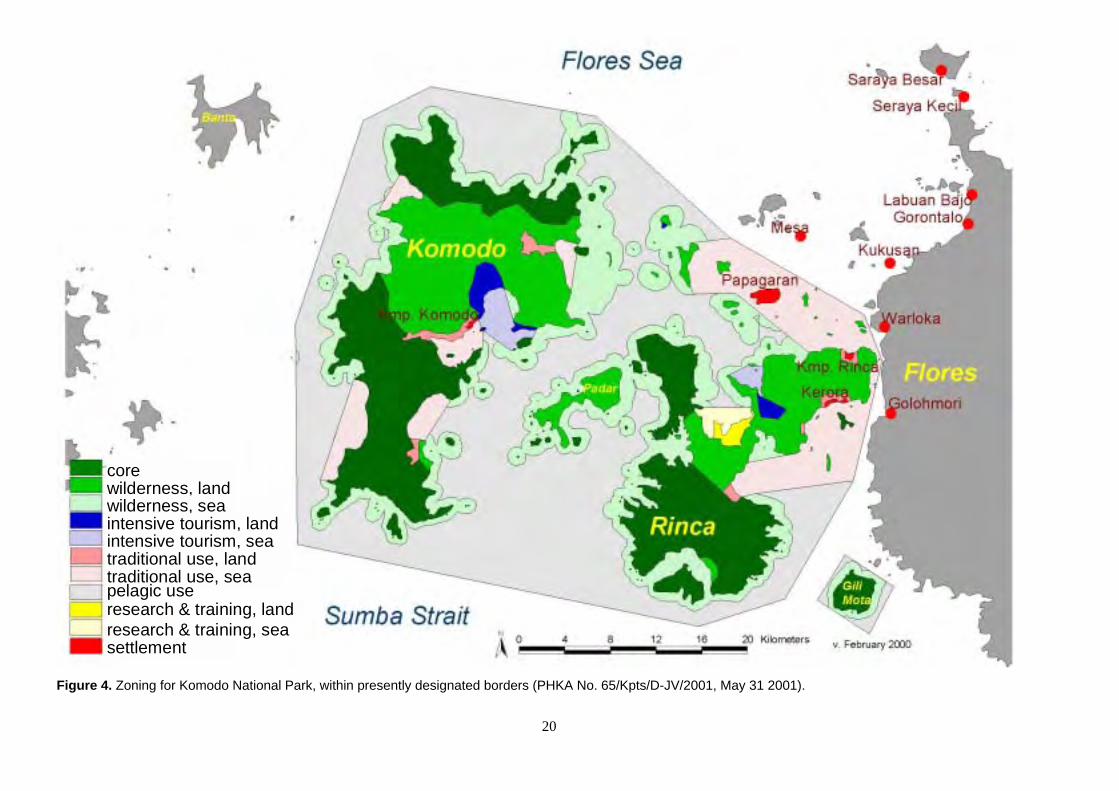
Figure 4. Zoning for Komodo National Park, within presently designated borders (PHKA No. 65/Kpts/D-JV/2001, May 31 2001). ................................................................................ 20
Figure 5. Local fishing vessel being labeled with its registration number. Fishing vessel registration was undertaken in preparation for the licensing program. ........................... 22
Figure 6. Catch of rabbitfish from a fishing weir at Papagaran Island. .................................. 40
Figure 7. Field excursion with students of the Labuan Bajo fisheries high school. ............... 41
Figure 8. Speech contest on marine conservation for secondary school students in Labuan Bajo (right). ..................................................................................................................... 42
Figure 9. Manta-shaped cake, made during the Pride campaign cake-baking contest. .......... 43
Figure 10. Puppet show at a local primary school (Menjaga), featuring a life-size manta ray.......................................................................................................................................... 44
Figure 11. Front page of the Komodo National Park website. ............................................... 45
Figure 12. Usage of the website www.komodonationalpark.org over the period August 2001 – October 2003. The number of visits, as indexed by the average number of requests per day, increased dramatically in February 2003, possible as a consequence of increased media coverage following an incident with poachers in the Park. The total monthly data transfer increased more gradually, indicative of a steady increase in the demand for downloadable documents. ............................................................................................... 46
Figure 13. Aerial picture of the hatchery, taken on 5 July 2003, view from the north-east. .. 51
Figure 14. Seaweed culture site near Kukusan, to the Northeast of Komodo National Park. The seaweed grows on ropes that are suspended from floats. (Photo taken on January 6, 2002)................................................................................................................................ 52
Figure 15. Local fishers constructing anchors for Fish Aggregating Devices........................ 60
6
Figure 16. Deployment of a Fish Aggregating Device. .......................................................... 60
Figure 17. Two different styles of Fish Aggregating Devices installed by fishers participating in the Komodo pelagic fisheries development project. ................................................... 61
Figure 18. Fishers fishing around a Fish Aggregating Device deployed to the Northeast of Komodo National Park. ................................................................................................... 61
Figure 19. Diver below a Fish Aggregating Device, surrounded by fusiliers (Caesionidae) (left). Weighing tuna that were caught around the Fish Aggregating Devices to the North of Komodo National Park (right)..................................................................................... 62
Figure 20. Wood carver at Kampung Komodo. ..................................................................... 65
Figure 21. Villagers from Kampung Komodo selling carved Komodo dragons to visitors in Loh Liang, the main entrance gate to Komodo National Park. ....................................... 65
Figure 22. Trend in number of blast fishing incidents per month in Komodo National Park over the period January 1996 – December 1996. After implementation of the speedboat patrol program, blast fishing incidence dropped dramatically. Currently, blast fishing incidence is very low. ...................................................................................................... 68
Figure 23. Live hard coral coverage at 185 survey sites in and around Komodo National Park. After a gradual overall improvement during the period 1996 –2000, live coral cover decreased around Banta (the island to the Northwest of the Park) and in the area to the Northeast of the Park while coral cover inside the Park continued to increase. See text for further explanation........................................................................................................... 69
Figure 24. Numbers of Epinephelus fuscoguttatus observed per monthly transect conducted from March 1998 to March 2003 at Site 7 during the full moon and new moon phases. 71
Figure 25. Numbers of P. leopardus observed per monthly transect conducted from March 1998 to March 2003 at sites 3-8 during the full and new moon phases. ......................... 72
Figure 26. Distribution of surveillance and resource use monitoring effort over week days in the period 1996 – 2001 (top) and 2002 – 2004 (bottom)................................................. 74
Figure 27. Resource use monitoring sectors in Komodo National Park................................. 75
Figure 28. Percentage distribution of the origin (home village or area) of artisanal fishers encountered in Komodo National Park in the period 1996 – 2001 (top) and 2002 – 2004 (bottom). .......................................................................................................................... 78
Figure 29. Percentage distribution of the types of fishing gear used in Komodo National Park over the years 1996 – 2001 (top) and 2002 – 2004) (bottom). ........................................ 79
Figure 30. Percentage distribution of fishing methods per village over the period 1996 – 2001 (top) and 2002 – 2004 (bottom). Kom = Komodo, RK = Rinca, Kerora, Pap = Pagagaran, WG = Warloka, Golohmori, Mes = Mesa, LS = Labuan Bajo, Seraya, LBR = Longos, Boleng, Rangko (period 2002 – 2004 only), Sap = Sape, B = Bali (period 2002 – 2004 only), ON = Other areas, in Indonesia (period 2002 – 2004 only), OF = Other areas, abroad (period 2002 – 2004 only), Oth = Other areas (domestic and abroad combined, period 1996 – 2001) only. ............................................................................................... 80
Figure 31. Yearly averages of reef fishing effort per sortie as observed by the surveillance / resource use monitoring team.......................................................................................... 81

7
Figure 32. Home range for fishers hailing from Kampung Komodo over the years 2002 – 2004. ................................................................................................................................ 82
Figure 33. Home range for fishers hailing from Rinca and Kerora villages over the years 2002 – 2004. .................................................................................................................... 83
Figure 34. Home range for fishers hailing from Papagaran village over the years 2002 – 2004. ................................................................................................................................ 84
Figure 35. Home range for fishers hailing from Warloka and Golohmori villages over the years 2002 – 2004............................................................................................................ 85
Figure 36. Home range for fishers hailing from Mesa village over the years 2002 – 2004. .. 86
Figure 37. Home range for fishers hailing from Labuan Bajo and Seraya villages over the year 2002 – 2004. ............................................................................................................ 87
Figure 38. Home range for fishers hailing from Sape over the years 2002 – 2004. Sape is located to the West of Komodo National Park, in Sumbawa. ......................................... 88
Figure 39. Left: Coral growth and fish populations on 4 year old rock piles. Right: Area just next to rock pile, which is what the habitat looked like prior to rehabilitation. .............. 92
Tables
Table 1. Summary of regulations for each of the zones in Komodo National Park. .............. 21
Table 2. Overview of speedboat patrols for the period July 2003 – September 2004. ........... 25
Table 3. Summary of violations reported by speedboat patrol team over the period July 2002 –June 2003. See Table 2 for violations after June 2003. ................................................. 27
Table 4. Technical details on the three Floating Ranger Stations (FRS) used to patrol Komodo National Park .................................................................................................... 28
Table 5. Overview of Floating Ranger Station activities over the period July 2003 – September 2004. .............................................................................................................. 29
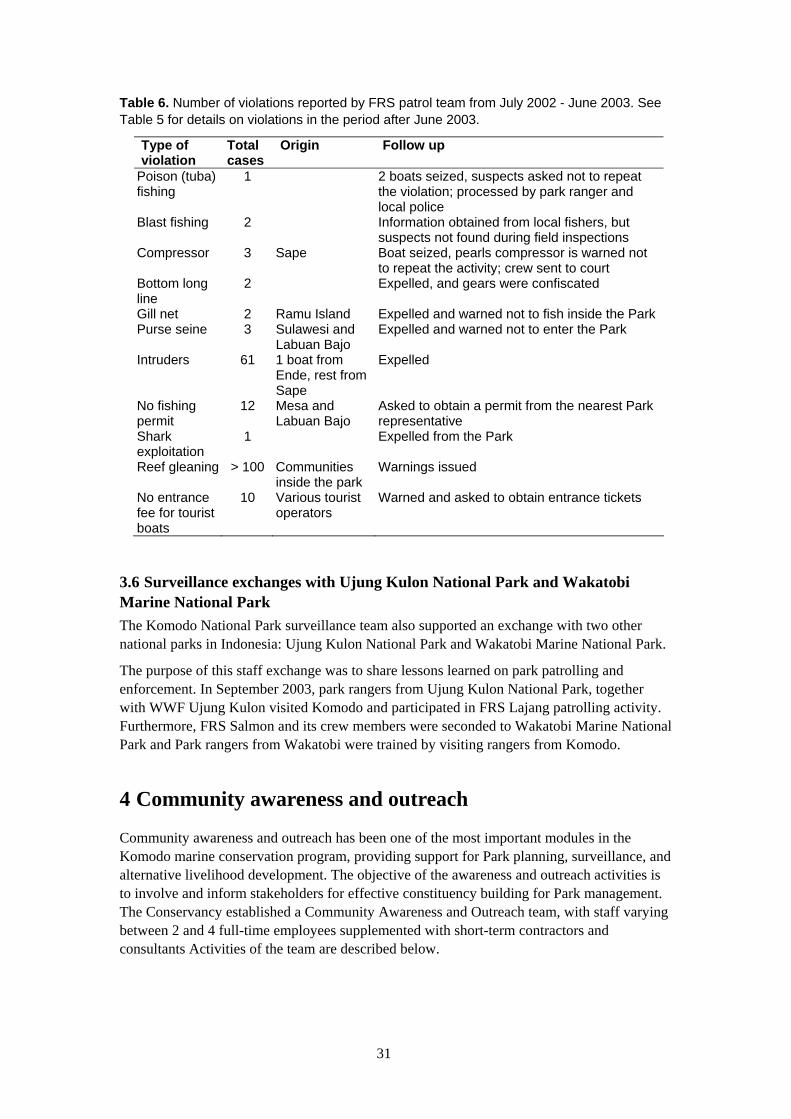
Table 6. Number of violations reported by FRS patrol team from July 2002 - June 2003. See Table 5 for details on violations in the period after June 2003. ...................................... 31
Table 7. Video documentaries that were prepared with the assistance of The Nature Conservancy. ................................................................................................................... 34
Table 8. Visits of reporters to Komodo National Park that were facilitated by The Conservancy over the period of 2002 – 2003.................................................................. 36
Table 9. Results from three Crown-of-Thorns Starfish (COTS) clean-ups in the Komodo area. DW = dry weight (i.e., weight after sun drying). ............................................................ 39
Table 10. Catch per unit of effort of the rabbitfish fishery practiced by villagers from Papagaran. Data from interviews conducted by Komodo Field Office staff................... 40
Table 11. Usage statistics of the Komodo National Park website. ........................................ 47
Table 12. Production of dried seaweed by 12 families from Pulau Kukusan (seaweed culture group ‘Usaha Baru’......................................................................................................... 54
Table 13. Details of groups involved in the seaweed culture project ..................................... 54
8
Table 14. Details of supplies provided to villages over the period July 2002 – June 2003.... 54
Table 15. Catch statistics from fisher’s groups Harapan Keluarga and Harapan Baru. The catch realized with hand lines mostly comprises large-sized pelagics whereas the purse seine catches consist of small-sized pelagics, hence the difference in average price...... 62
Table 16. Details of fisher’s groups involved in the pelagic fishery development project..... 63
Table 17. Material support provided to fishers group ‘Harapan Keluarga’ (Labuan Bajo) and ‘Harapan Baru’ (Seraya Besar)........................................................................................ 63
Table 18. Summary of results from the coral monitoring program. Coverage with live hard coral, expressed as coverage in m2 per 100 m2 bottom. .................................................. 68
Table 19. Number of field days per year allocated to speedboat surveillance and resource use monitoring. ...................................................................................................................... 73
Table 20. Average percentage covered for each Sector during speedboat surveillance and resource use monitoring during 2002 – 2004 (cf. Figure 27 for location of the Sectors).75
Table 21. Frequency of occurrence of different types of resource use during a total of 82 surveillance and resource use monitoring trips. .............................................................. 76
9
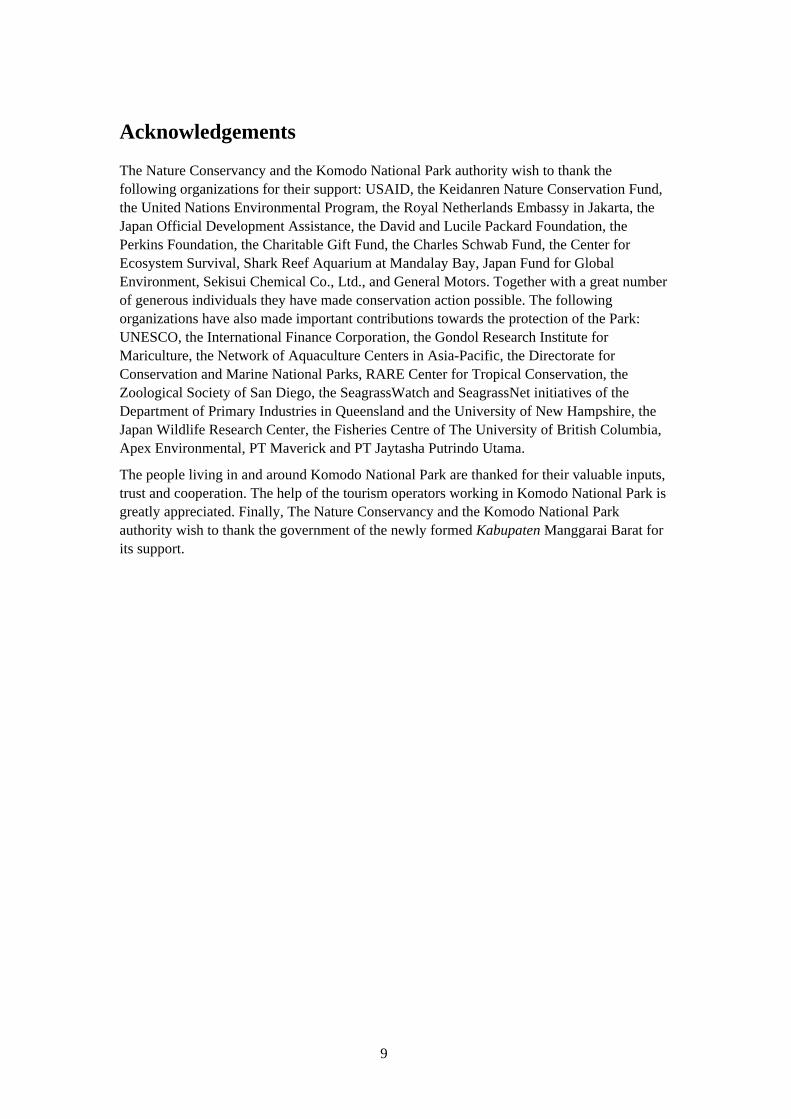
Acknowledgements
The Nature Conservancy and the Komodo National Park authority wish to thank the following organizations for their support: USAID, the Keidanren Nature Conservation Fund, the United Nations Environmental Program, the Royal Netherlands Embassy in Jakarta, the Japan Official Development Assistance, the David and Lucile Packard Foundation, the Perkins Foundation, the Charitable Gift Fund, the Charles Schwab Fund, the Center for Ecosystem Survival, Shark Reef Aquarium at Mandalay Bay, Japan Fund for Global Environment, Sekisui Chemical Co., Ltd., and General Motors. Together with a great number of generous individuals they have made conservation action possible. The following organizations have also made important contributions towards the protection of the Park: UNESCO, the International Finance Corporation, the Gondol Research Institute for Mariculture, the Network of Aquaculture Centers in Asia-Pacific, the Directorate for Conservation and Marine National Parks, RARE Center for Tropical Conservation, the Zoological Society of San Diego, the SeagrassWatch and SeagrassNet initiatives of the Department of Primary Industries in Queensland and the University of New Hampshire, the Japan Wildlife Research Center, the Fisheries Centre of The University of British Columbia, Apex Environmental, PT Maverick and PT Jaytasha Putrindo Utama.
The people living in and around Komodo National Park are thanked for their valuable inputs, trust and cooperation. The help of the tourism operators working in Komodo National Park is greatly appreciated. Finally, The Nature Conservancy and the Komodo National Park authority wish to thank the government of the newly formed Kabupaten Manggarai Barat for its support.

10
1 Introduction
Nestled in a volcanic chain known as the Lesser Sunda Islands, Indonesia’s Komodo National Park (Figure 1) encompasses nearly half a million acres of land and sea. Famous for its unique Komodo dragons Varanus komodoensis, the Park also features one of the world’s richest marine environments, including coral reefs, mangroves, seagrass beds, seamounts, and bays. These habitats harbor more than 1,000 species of fish, 260 species of reef-building corals, and 70 species of sponges. In addition, dolphins, whales, and sea turtles are found in the park. There are 4 villages inside the Park, inhabited by ca. 3000 people who mostly depend on fishing for their livelihood. About 17,000 people live in the direct surroundings of the Park
In 1986, UNESCO declared the Park a World Heritage Site and a Man and Biosphere Reserve. The Indonesian Park authority focused conservation management on protection of the Komodo dragon, and invited The Nature Conservancy in 1995 to help implementing a conservation program for coastal and marine conservation targets. The Conservancy conducted a Rapid Ecological Assessment that confirmed the high biodiversity of marine biota. Early appraisals also confirmed that like in many other areas in Indonesia, destructive fishing practices such as blast fishing and cyanide fishing as well as over-exploitation were severely threatening the coral reef communities in the Park. It was clear that besides the opportunity provided by a supportive government and by a high biodiversity value there was also a need for a coastal and marine conservation program.
In 1996, The Conservancy’s Coastal and Marine Program – Indonesia opened the Komodo Field Office that, supported from the Jakarta Office, implemented a comprehensive conservation program. Some activities, such as awareness, constituency building, monitoring and enforcing the ban on blast fishing could be implemented immediately, and consequently blast fishing incidence in the Park decreased almost immediately with 90%. For other activities, a more comprehensive planning process was necessary. The Conservancy was actively involved in this planning process, culminating in the 25 Year Master Plan for Management of Komodo National Park – a milestone that was endorsed by the national Park authority and by the District Government of Manggarai on July 4 2000. The Management Plan was the precursor for the endorsement of the zoning plan (October 2001) and for a District decree (PERDA) that provided a
Facts & figures on Komodo National Park
- Country: Indonesia. Province: Nusa Tenggara Timur. District: West Manggarai. District capital: Labuan Bajo
- Authority responsible for management: Ministry of Forestry, Directorate-General of Forest Protection and Nature Conservation
- 132,000 ha of marine waters, 41,000 ha of land
- Major islands: Komodo, Rinca, Padar
- UNESCO World Heritage Site, and a Man and Biosphere Reserve
- last remaining habitat of the Komodo dragon Varanus komodiensis
- ‘hotspot’ of marine biodiversity: at least 1000 fish species inhabit the Park, at least 260 species of reef-building corals
- human population: ca. 3,000 inside the Park in three villages (Komodo, Rinca, Kerora), ca. 17,000 around the Park
- major threats to the Park’s reef habitats: destructive fishing practices (cyanide, blast fishing, meting) and over-exploitation

11
legal basis for the zoning plan. Only since the zoning plan and the PERDA have come into effect, a start could be made with abating the threat of over-exploitation in the Park. Parallel to these efforts, a financing plan for Komodo National Park was designed that addresses the root of the problem of many protected areas in Indonesia: lack of funds.
The marine conservation program that has been implemented with the Komodo National Park authority over the period 1996 – 2004, can roughly be subdivided in the following components:
- Park management, planning and financing – The Conservancy assisted the Park authority with management planning and with establishing mechanisms for self-financing of Park operations through eco-tourism development.
- Surveillance – The Conservancy worked together with the Park authority, local enforcement agencies and local communities to establish an efficient surveillance system that prevents illegal resource use and destructive fishing.
- Community awareness and outreach – The Conservancy implemented a variety of community awareness and outreach activities, ranging from environmental lectures at local high schools, village information meetings and a campaign that builds local pride on the Park.
- Alternative livelihood development – The Conservancy has explored various options to shift fishing pressure away from the reefs by offering alternative livelihoods in fish culture, pelagic fisheries, seaweed culture, wood carving and other home industries.
- Monitoring and research – The Conservancy implemented a comprehensive monitoring program that informs adaptive management and that measures success. The monitoring program comprises species, habitats and resource use by humans. Furthermore, The Conservancy conducted applied research on coral reef rehabilitation.
Each of the modules are discussed in detail in the sections below.
Figure 1. Location of Komodo National Park in Indonesia.
12
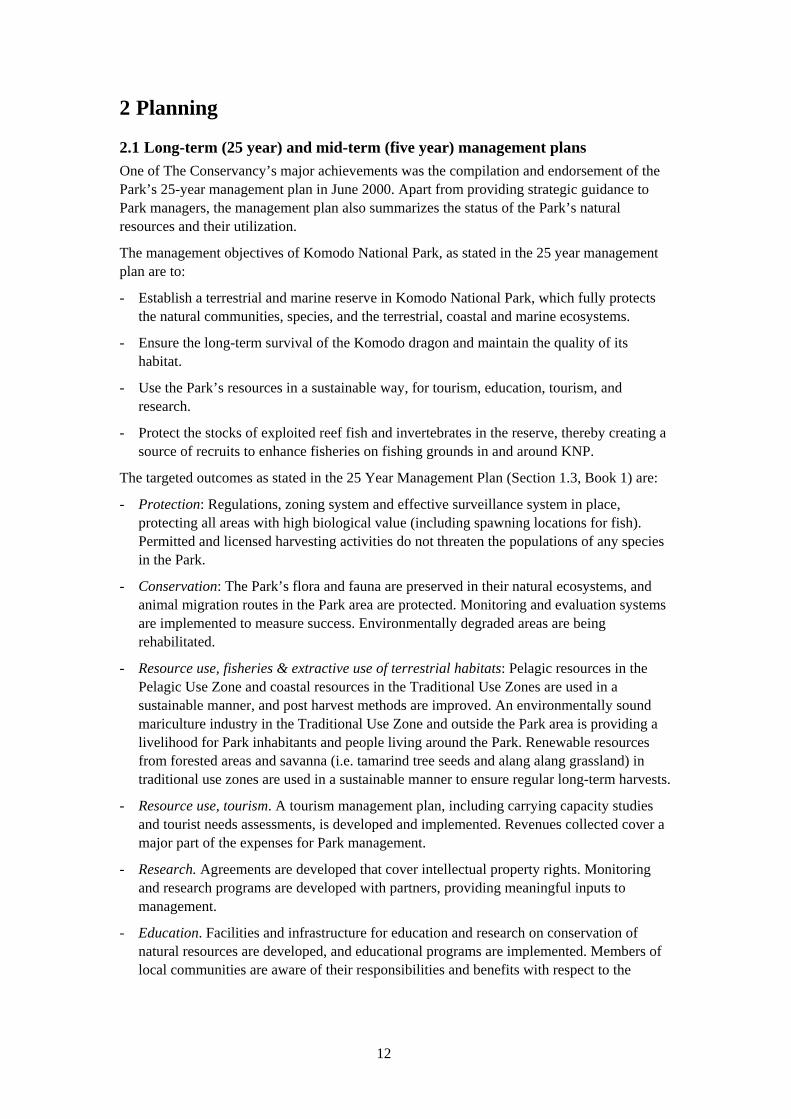
2 Planning
2.1 Long-term (25 year) and mid-term (five year) management plans One of The Conservancy’s major achievements was the compilation and endorsement of the Park’s 25-year management plan in June 2000. Apart from providing strategic guidance to Park managers, the management plan also summarizes the status of the Park’s natural resources and their utilization.
The management objectives of Komodo National Park, as stated in the 25 year management plan are to:
- Establish a terrestrial and marine reserve in Komodo National Park, which fully protects the natural communities, species, and the terrestrial, coastal and marine ecosystems.
- Ensure the long-term survival of the Komodo dragon and maintain the quality of its habitat.
- Use the Park’s resources in a sustainable way, for tourism, education, tourism, and research.
- Protect the stocks of exploited reef fish and invertebrates in the reserve, thereby creating a source of recruits to enhance fisheries on fishing grounds in and around KNP.
The targeted outcomes as stated in the 25 Year Management Plan (Section 1.3, Book 1) are:
- Protection: Regulations, zoning system and effective surveillance system in place, protecting all areas with high biological value (including spawning locations for fish). Permitted and licensed harvesting activities do not threaten the populations of any species in the Park.
- Conservation: The Park’s flora and fauna are preserved in their natural ecosystems, and animal migration routes in the Park area are protected. Monitoring and evaluation systems are implemented to measure success. Environmentally degraded areas are being rehabilitated.
- Resource use, fisheries & extractive use of terrestrial habitats: Pelagic resources in the Pelagic Use Zone and coastal resources in the Traditional Use Zones are used in a sustainable manner, and post harvest methods are improved. An environmentally sound mariculture industry in the Traditional Use Zone and outside the Park area is providing a livelihood for Park inhabitants and people living around the Park. Renewable resources from forested areas and savanna (i.e. tamarind tree seeds and alang alang grassland) in traditional use zones are used in a sustainable manner to ensure regular long-term harvests.
- Resource use, tourism. A tourism management plan, including carrying capacity studies and tourist needs assessments, is developed and implemented. Revenues collected cover a major part of the expenses for Park management.
- Research. Agreements are developed that cover intellectual property rights. Monitoring and research programs are developed with partners, providing meaningful inputs to management.
- Education. Facilities and infrastructure for education and research on conservation of natural resources are developed, and educational programs are implemented. Members of local communities are aware of their responsibilities and benefits with respect to the
13
Komodo National Park. Members of local communities and Park staff benefit from the educational programs through enhanced skill levels and consequently higher incomes.
- Improved management system. A self-sustaining management system is developed and implemented for the management of the Park. Local on-site capacity in Park management is sufficient and being enhanced. Local stakeholders are contributing positively to the management of the Park.
In cooperation with Gadja Mada University (Yogyakarta), The Conservancy assisted with drafting the Park authority’s five-year management plan. This management plan for Komodo National Park intends to make operational the principles outlined in the 25 Year Master Plan for Management of Komodo National Park (in short: the 25 Year Management Plan). The 25 Year Management Plan has been endorsed by the Director General of Forest Protection and Nature Conservation and acknowledged by the Bupati of Manggarai on July 4 2000. The five-year management plan lists all activities pertaining to the management of Komodo National Park. Detailed scheduling and budgeting are included in the 1-year workplans.
The management objectives for the 5-year period under consideration are:
- To put a collaborative management structure in place that includes a stakeholder advisory board
- To put a system in place to make the Park financially self-sustaining. This system should be based on eco-tourism development.
- To implement the endorsed zoning plan
- To develop and implement a licensing system that includes all permitted uses
- To put mechanisms in place that control human population growth within the Park area
- To perform carrying capacity studies for all permitted uses, and to formulate Environmental Impact Assessment requirements for permitted uses.
- To enhance Park regulations and to create a legal and political climate that favors efficient management of the Park
- To strengthen on-going operations (outreach, surveillance, monitoring, alternative livelihood development etc.)
- To formulate Standard Operating Procedures for the most important Park management activities
- To enhance the capacity of staff for Park management, for example by providing support for selected Park staff to enroll in graduate programs related to the management of protected areas in Indonesian or foreign institutions
- To improve Park staff expertise in wildlife and habitat monitoring (marine and terrestrial) and to improve capacity for data analysis
- To expand the Park boundaries and buffer zones as proposed in the 25 Year Management Plan (see Fig. 11 of Book 1) or to declare areas adjacent to the national park as District (local government) conservation areas.
- To strengthen cooperation with BKSDA to further conservation in areas in West Flores that also have or used to have Komodo dragons.
14
- Assess whether certain conservation areas in Flores (notably SM Wae Wuul and HL Mbeliling) can be brought under the management of the Komodo National Park authority, or whether the management of these areas can be improved in other ways.
- Facilitate community-based management of fishing grounds in the surrounding waters of Komodo National Park.
The 5-year management plan is currently reviewed by the Park authority. It is expected that in FY05, the 5-year management plan can be submitted to the Directorate-General of Forest Protection and Nature Conservation for final approval.
2.2 Park financing and management structure
2.2.1 Concession for eco-tourism development The Conservancy’s strategy to sustain park operations is to develop eco-tourism in Komodo National Park, and use part of the revenues to finance park management. The vehicle for achieving this is a tourism concession granted to a company, in this case the Joint Venture ‘PT Putri Naga Komodo’ in which 60% of the shares are held by The Nature Conservancy and 40% of the shares are held by an Indonesian tourism company, PT Jaytasha Putrindo Utama. This Joint Venture will improve tourism infrastructure, collect tourism revenues and make part of these revenues available for park management. Also, part of the revenues will be used to fund a community development program.
Presently, entrance fee is collected by the Komodo National Park authority (Balai Taman Nasional Komodo). This revenue is then shared and distributed to government institutions: 40% to government of Manggarai Barat District, 30% to government of Nusa Tenggara Timur Province, 15% to Ministry of Forestry in Jakarta, and 15% to General Revenue Service of the Ministry of Finances. However, the amount of annual budget allocated for the Park is solely determined by the Ministries of Forestry and Finance apart from the park’s revenues shared to central government.
In the proposed financing structure for park management the entrance fees will be maintained, but the difference is that an additional conservation fee will be levied. This conservation fee will be used for park management. Studies showed that willingness-to-pay for entrance fee was much higher than the present fee of Rp. 30,000 (ca. US$ 4) per three days per visitor (unpublished report by Monitor Company, Inc; Environment North 2001; Ruitenbeek & Cartier 2001). This willingness-to-pay can be enhanced by offering higher quality and more diversified experiences, and clearly explaining the use of revenues for better park management.
To set up the tourism concession, the World Bank’s Global Environmental Facility (GEF) and The Nature Conservancy will provide US$ 10 million over a period of seven years to cover start-up costs, operating expenses and carrying capacity studies for Park management. Over this period, the Park will generate eco-tourism revenues for Park management as well as income for district, provincial and central government amounting to nearly US$ 8 million. By the end of the seventh year the Park is expected to be financially self-sustaining (Figure 2) on an operational budget of US$ 2 million per year. The increasing eco-tourism revenues and revenues for government agencies are achieved through a combination of higher visitor numbers and a gradual introduction of additional fees (Figure 3).

15
funds generated by the Park under the tourism concession
0
500,000
1,000,000
1,500,000
2,000,000
2,500,000
3,000,000
0 1 2 3 4 5 6 7
year of concession operations
amou
nt (U
S$)
PNK GovIn TNC GEF GEF+
Figure 2. Funds generated through the tourism concession (years 1-7), as compared to the present situation (year 0). PNK = eco-tourism revenues, collected and distributed by PT Putri Naga Komodo; GovIn = income for government agencies generated by the Park as entrance fees, taxes etc.; TNC = contribution of The Nature Conservancy to concession operations and Park management; GEF = contribution of the Global Environmental Facility to concession operations and Park management, GEF+ = contribution of the Global Environmental Facility to start-up costs and carrying capacity studies (see also PT Putri Naga Komodo 2003).
16
development in visitors and average fees per visitor
0
5000
10000
15000
20000
25000
30000
35000
40000
45000
-6 -5 -4 -3 -2 -1 0 1 2 3 4 5 6 7
year
visi
tors
(yea
rly)
0
10
20
30
40
50
60
aver
age
fee
per
visi
tor
(US
$)
visitorsfees
Figure 3. Development in the yearly number of visitors and the average fee per visitor. The years -6 to -1 represent the recorded visitor numbers over the period 1996 – 2001. The decline is a result of Indonesia’s political instability, not from a decrease in the quality of the product (cf. Environment North 2001). The average fee per visitor is a composite of gate fees, service charges and passes. The gate fee will increase from its present US$ 3 (year 0) to US$ 7 in year 7; this gate fee is transferred to the government. Besides fees, the Park will also obtain income from hospitality business, merchandise, and grants.
2.2.2 Komodo Collaborative Management Initiative (KCMI) The objective of the Komodo Collaborative Management Initiative (KCMI) is to ensure the long-term effective management of Komodo National Park through adoption of a collaborative management approach. KCMI will enhance stakeholder involvement in the management of Komodo National Park, which under the present structure is the exclusive mandate of the Komodo National Park authority (Balai Taman Nasional Komodo). KCMI involves all important stakeholder groups, including the Park authority, local government, the Joint Venture PT Putri Naga Komodo, with additional inputs from local communities, government agencies and private sector organizations (International Finance Corporation 2001). KCMI was formalized through an agreement between the Komodo National Park authority and JV PT Putri Naga Komodo on November 1 2003. This agreement states that two administrative boards will be put in place: the Collaborative Management Board (Badan Pengelolaan Kolaboratif) and the Collaborative Advisory Council (Dewan Penasehat Kolaboratif). The Bupati of Manggarai Barat, who witnessed the signing of the Collaborative Management Agreement, will endorse the Collaborative Advisory Council through a decree (Surat Keputusan) under a new name: Community Consultative Council (Dewan Konsultasi
17
Masyarakat). The Collaborative Management Board will include representatives from the following entities: - Directorate-General of Forest Protection and Nature Conservation (PHKA). - Komodo National Park authority (Balai Taman Nasional Komodo). - PT Putri Naga Komodo. - Government of the Manggarai Barat District. - Collaborative Advisory Council / Community Consultative Council.
The composition and function of the Council is subject to further discussions between the district government, PHKA, the Komodo National Park authority, PT Putri Naga Komodo and local communities.
Section 4.1 contains more detail on outreach activities in relation to the Collaborative Management Initiative.
2.2.3 Milestones In the period of 2002-2004, the following milestones were reached: - On May 1 2003, the Bupati of Manggarai issued a decree to endorse extension of the
Komodo Collaborative Management Initiative through a hand-picked team of 76 people (Ref: HK/42/Tahun 2003).
- On June 18 2003, the Minister of Forestry issued a principle agreement on collaborative management and the tourism concession (Ref: No. 381/Menhut-II/203). The agreement stated that the JV PT Putri Naga Komodo can proceed with business planning process (RKPPA) with the Directorate-General of Forest Protection and Nature Conservation (PHKA). It also stated that PHKA and PT Putri Naga Komodo should operate under the umbrella of the collaborative management scheme.
- A workshop on business planning of the tourism concession was held in PHKA, and suggestions and recommendations from this workshop were consolidated in the business plan (RKPPA). The business plan was endorsed by PHKA in November 2003.
- On October 23 2003, the Director-General of PHKA issued an instruction letter to the Head of Komodo National Park to develop collaborative management agreement with PT Putri Naga Komodo (Ref: 1017/di-IV/KK/2003)
- On October 22, 2003, the Bupati of the newly formed Kabupaten Manggarai Barat issued a support letter that urges for fast implementation of the Komodo Collaborative Management Initiative (ref: 01/BUP.MABAR/X/2003).
- On November 1 2003, a Memorandum Of Understanding between PT Putri Naga Komodo and Komodo National Park was signed on the implementation of the Komodo Collaborative Management Initiative. Co-signing witnesses to this event were the President of The Nature Conservancy, Steven McCormick and the Bupati of Manggarai Barat, Drs Fidelis W. Pranda. With the signing of this MOU, implementation of the Komodo Collaborative Management Initiative can start.
- An Environmental Impact Assessment for the proposed infrastructural improvements (AMDAL) in Komodo National Park was completed by a consultant, and findings were presented in Labuan Bajo to the district government of Manggarai Barat (PEMDA) and the management of Komodo National Park on November 18, 2003. This AMDAL was approved and endorsed by the Bupati of Manggarai Barat district through Letter No./Pem.130/025/XI/2003 on November 27, 2003.
- On December 29, 2003, Directorate General of Forest Protection and Nature Conservation approved the Natural Tourism Business Plan of PT. Putri Naga Komodo at Komodo
18
National Park (Loh Liang, Pulau Komodo and Loh Buaya, Pulau Rinca) through SK No.160/Kpts/DJ-IV/2003.
- On April 13, 2004, the concessionaire PT. Putri Naga Komodo has transferred fees for the total amount of Rp 129.681.000, (Rp 810,000 per ha x 160,10 ha of concession areas) to the account of Department of Forestry, following the instruction letter from Director-General of Forest Protection and Nature Conservation (PHKA) of Department of Forestry No. S.206/IV/WAPJL/2004 regarding collection of levy on nature tourism enterprise in Komodo National Park.
- On June 9, 2004, a granting permit for natural tourism business within Komodo National Park Utilization Zone in Manggarai District, East Nusa Tenggara Province at a width of 160.10 (a hundred sixty, ten per one hundred) hectares was given to PT. Putri Naga Komodo through a decree of Minister of Forestry No. SK.195/Menhut-II/2004. This decree was followed by decree No.SK.202/Menhut-II/2004 dated June 10, 2004 on enactment of area for natural tourism business at a width of 160.10 hectares to PT. Putri Naga Komodo.
Since September 2002, the Community Awareness and Education team of The Conservancy’s Komodo Field Office has been conducting consultations with local communities and local tourism operators on the Komodo Collaborative Management Initiative. The aim of this program was to explain local government and local communities how they will be involved in long-term management planning of the Park, and how the Park plans to self-finance its operations through the proposed Joint Venture for tourism management. Extension was conducted based on informal discussions with district and local government, the tour guide association, teachers, village elders, fisher and youth groups, and resulted in support statements from local community representatives and district government agencies (on file at the TNC Southeast Asia Center for Marine Protected Areas).
2.2.4 Next steps Based on the decree of Minister of Forestry No.SK.195/Menhut-II/2004, all arrangements concerning KCMI scheme and structure are under the responsibility of Director General of Forest Protection and Nature Conservation (PHKA). Prior to the implementation of KCMI, the following activities and benchmarks need to be achieved: - The structure of Collaborative Management Board that will be stipulated under the decree
of Director General of PHKA - Formation of a Community Consultative Council (formerly Advisory Board) following
community consultations. The final structure of Community Consultative Council will be legally enacted by local government of District Manggarai Barat.
2.3 Zoning and licensing The Park’s zoning system was endorsed by the Directorate-General of Forest Protection and Nature Conservation in 2001 (Decree No. 65/Kpts/DJ-V/2001). The zoning plan comprises seven different zones (Figure 4, Table 1) of which four exist both on the land and at sea. The design of the zoning plan is based on village consultations, spatial distribution of resource use in the Park and ecological assessments.
Whereas gear regulations as stipulated in PERDA (local government decree) 11 of 2001 are currently enforced, the endorsed zoning plan has not been implemented yet. The most challenging aspect for the implementation of the zoning plan are the no-take zones, which are necessary to sustain commercial fisheries in surrounding fishing grounds. The strategy for

19
FY05 is to make no-take zones more acceptable for local communities by granting exclusive use rights to local communities for fishing grounds inside the Park.
The Conservancy supported the demarcation of zones in the Park by production of an orientation guide for Park staff and by placing concrete boundary demarcations. Furthermore, an information booklet and map targeting the general public on the zoning plan (in Bahasa Indonesia) was produced.
As stated in the 25 year management plan for Komodo National Park, and as endorsed by District regulation 11 of 2001, all resource uses in the Park are regulated by a licensing system. The main purpose of this licensing system is to keep the level of resource use within limits of the Park’s carrying capacity. A proposed system for a preliminary licensing system was drafted by a natural resource use management expert. An adapted version of this licensing system will be implemented in FY05 in conjunction with the implementation of the zoning plan and exclusive fishing rights scheme. In preparation for this, all fishing vessels of Park residents have been registered and marked by the Park authority.
20
Figure 4. Zoning for Komodo National Park, within presently designated borders (PHKA No. 65/Kpts/D-JV/2001, May 31 2001).
research & training, land
core wilderness, landwilderness, sea intensive tourism, land intensive tourism, sea traditional use, land traditional use, sea pelagic use
research & training, sea settlement

21
Table 1. Summary of regulations for each of the zones in Komodo National Park.
Zone Permissible activities Prohibited activities All Zones
monitoring, research (with permits), environmental restoration
Anchoring except in designated areas, collecting legally protected species, damaging marine or terrestrial habitat, keeping dogs or cats, trash/waste disposal except where designated, harvesting fuel wood, the use of cyanide, poisons, hookah, scuba, or explosives for fishing in the Park
1. Core Zone (Zona Inti)
see All Zones
all other activities prohibited
2. Wilderness Zone with Limited Tourism (Zona Rimba dengan Wisata Terbatas)
plus limited tourism with permits
all other activities prohibited
3. Tourism Use Zone (Zona Pemanfaatan Wisata)
plus tourism with permits (temporary accommodations allowed dependent on outcome of EIA), facilities development for Park management (dependent on outcome of EIA)
all other activities prohibited
4. Traditional Use Zone (Zona Pemanfaatan Tradisional)
plus tourism (temporary accommodations), mariculture, captive breeding, fishing in designated sites using small-scale gear subject to certain restrictions (all subject to permits and dependent on outcome of EIA)
all other activities prohibited
5. Pelagic Zone (Zona Pelagis)
plus recreational, sustenance, and commercial pelagic fishing subject to restrictions on gear type, species harvested, and location (all subject to permits and dependent on outcome of an EIA)
plus capture of demersal species is prohibited, capture of Nautilidae, Sepiidae, Octopodidae, and marine invertebrates apart from Loliginidae is prohibited, all other activities prohibited
6. Special Research and Training Zone (Zona khusus Penelitian dan Latihan)
plus research and training (all subject to permits and dependent on outcome of EIA)
all other activities prohibited
7. Traditional Settlement Zone (Zona Pemukiman Tradisional)
plus rearing of domestic animals, harvesting sand or limestone, the use of pesticides within the home, limited agriculture (no pesticides or fertilizer), limited fresh water use, and other normal daily living activities
plus immigration prohibited, all other activities prohibited

22
Figure 5. Local fishing vessel being labeled with its registration number. Fishing vessel registration was undertaken in preparation for the licensing program.
3 Surveillance
3.1 Introduction The main purpose of the surveillance program is to prevent illegal resource use. Furthermore, the vessels that are managed by the surveillance team also support general Park operations, such as transport of staff and supplies to and from ranger stations.
Even where local communities and user groups agree that certain types of resource uses should be regulated, restricted or outright forbidden, the potential gains for individuals who choose not to comply with measures that serve a public or long term good are high. Furthermore, some users such as fishers from other areas in Indonesia or tourism operators who only occasionally visit the Park may either not be aware of the regulations, or they may just not have an incentive to comply with regulations that serve a long-term public good because they do not have a long-term stake in the Park’s resources. For these reasons, an efficient surveillance program is an important module in the Park’s conservation program.
Major threats to the Park’s resources that are addressed by the Park’s surveillance program come from illegal human activities. At sea, practices such as blast fishing, cyanide fishing, reef gleaning, fish poisoning (locally known as tuba kamande) coupled with over-fishing are the major concern of park authority. On the land, deer poaching and human-made bush fires threaten the habitat and the forage base of the Komodo dragon.
3.2 Legal framework The following government laws and regulations apply to natural resources management of Komodo National Park:
- National Law No.5, 1990 on biodiversity conservation.
- National Law No. 9, 1985 on Fisheries.
23
- Decree of Directorate General of Forest Protection and Nature Conservation No. 65/Kpts/DJ-V/2001 on zoning system in Komodo National Park.
- District Regulation (PERDA) No. 11, 2001 on Fishery Regulation in Komodo National Park
All the above regulations are intended to facilitate the effective implementation of Park management and provide legal basis for park authority to enforce the Park’s regulations to ensure the biodiversity in the park in perpetuity. The decree on zoning is the legal basis for the Park’s zoning system (see Section 2.3). District Regulation (PERDA) No. 11, which details out which fishing gears may be operated within the Park’s waters, provides specific legal guideline for the Park’s surveillance team. Furthermore, this PERDA makes fishery management in the Park a joint responsibility of the Park authority and the District Fisheries Service, and this PERDA outlaws the use of the hookah compressor, a gear that is used for the highly destructive practices of blast fishing, cyanide fishing and reef gleaning. The Nature Conservancy actively supported the design and enactment of the decrees on zoning and on fishery regulation.
3.3 Implementation of the surveillance program Whereas The Conservancy provides logistical support for surveillance, implementation is in the hand of Indonesian enforcement agencies. The surveillance team of Komodo National Park consists of representatives from the following enforcement agencies: the Park authority (Balai Taman Nasional Komodo), local police, water police, army and navy. This team is officially lead and coordinated by the Park headquarters. However, during patrols in the field, the most senior person in the team takes command.
To improve professionalism of the patrol team, The Conservancy supported several trainings on surveillance and human rights procedures in accordance with international standards. More specific surveillance guidelines that apply to Komodo National Park were endorsed by the Directorate General of Forest Protection and Nature Conservation of the Forestry Department. A Standard Operating Procedures manual for surveillance in Komodo National Park was produced.
The surveillance program comprises the following modules:
- speedboat patrols, which are conducted in conjunction with resource use monitoring (see Section 6.4).
- Floating Ranger Station operations: the Park operates three vessels that are small (30 – 40 GRT) local cargo vessels that were refitted to sleep a surveillance team.
- responsive action: if there is a report of any illegal activity or a request for assistance, the Park will respond by organizing an ad hoc action.
3.4 Speedboat patrols Speedboat patrols are scheduled weekly for 2 days. The intention is to cover all of the Park’s near-shore waters, where most resource use is concentrated. In practice, each two-day speedboat patrol typically covers ca. 50% of the Park waters. Speed boat patrols increase field presence of Park staff thereby preventing illegal resource use, the speedboat patrol teams may arrest violators (though for minor violations usually only a warning is issued), and the speedboat patrol also provides a platform to conduct resource use monitoring. The Conservancy supports this program by providing infrastructure (speed boats and crew, fuel,
24
logistics and technical assistance) to the patrol team. One of the Conservancy’s Komodo Field Office staff joins to conduct resource use monitoring.
A Standard Operating Procedures manual for speedboat patrols was compiled. In summary, procedures are as follows:
- Speedboat patrols last two days and they start in the morning of the first day from Labuan Bajo, following routes that have been planned ahead.
- Once team spots a fishing boat, they will approach it and conduct brief interview with the captain or crew.
- If a violation of Park regulations is suspected (such as possession of illegal fishing gears), the team will board and further inspect the boat.
- If evidence for violation of Park regulations is found, then the team may confiscate fishing gear, arrest the captain and crew for further legal follow-up in Labuan Bajo, or the team may just issue a warning.
- Speedboat patrols take place during daytime only.
Table 2 and Table 3 contain details on speedboat patrols for the period July 2002 – August 2004.

25
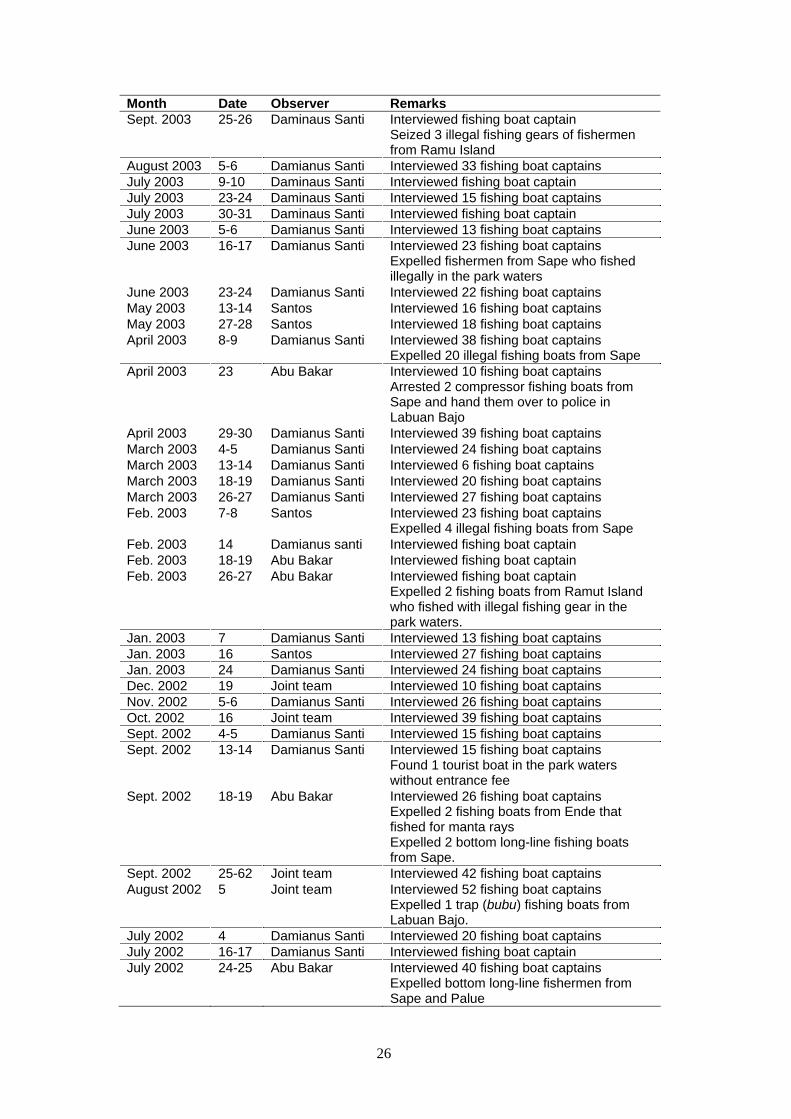
Table 2. Overview of speedboat patrols for the period July 2003 – September 2004. Month Date Observer Remarks August 2004 5-6 Damianus Santi Interviewed 33 fishing boat captains August 2004 13-14 Damianus Santi Interviewed 33 fishing boat captains August 2004 24-25 Damianus Santi Interviewed 49 fishing boat captains
Expelled 8 fishing boats and seized 30 units of illegal fishing gears
July 2004 8-9 Damianus Santi Interviewed fishing boats captains Routine patrolling
July 2004 15-16 Damianus Santi Interviewed fishing boats captains Routine patrolling
June 2004 8-9 Damianus Santi Interviewed 25 fishing boat captains Expelled fisher from Sape Gusung and confiscated 1 long line
June 2004 18-19 Damianus Santi Interviewed 55 fishing boat captains June 2004 24-25 Damianus Santi Interviewed 25 fishing boat captains May 2004 6-7 Damianus Santi Interviewed 32 fishing boat captains May 2004 13-14 Damianus Santi Interviewed 32 fishing boat captains May 2004 25-26 Damianus Santi Interviewed 19 fishing boat captains April 2004 7-8 Damianus Santi Interviewed 32 fishing boat captains April 2004 23-24 Damianus Santi Interviewed 36 fishing boat captains April 2004 28-29 Damianus Santi Interviewed 19 fishing boat captains March 2004 4-5 Damianus Santi Interviewed 17 fishing boat captains March 2004 12-13 Damianus Santi Interviewed 41 fishing boat captains March 2004 19-20 Damianus Santi Interviewed 40 fishing boat captains March 2004 25-26 Damianus Santi Interviewed 32 fishing boat captains Feb. 2004 17-18 Damianus Santi Interviewed 5 fishing boat captains Feb. 2004 26-27 Damianus Santi Interviewed 60 fishing boat captains Jan. 2004 7-8 Damianus Santi Interviewed fishing boats captains
Arrested 1 compressor boat from Sape. This boat was later released per instruction from Head of the Park because they just passed through Park waters.
Jan. 2004 23-24 Damianus Santi, Haris Mahfud
Interviewed fishing boat captains. Confiscated 80 illegal fishing gear units from Sape fishers
Jan. 2004 27-28 Daminaus Santi Interviewed fishing boat captain Dec. 2003 8-9 Daminaus Santi Interviewed fishing boat captain Dec. 2003 17-18 Daminaus Santi Interviewed 22 fishing boat captains Dec. 2003 29-30 Daminaus Santi Interviewed 28 fishing boat captains
Expelled 2 illegal fishing boat from Sape Nov. 2003 4-5 Daminaus Santi Interviewed fishing boat captain Nov. 2003 18-19 Daminaus Santi Interviewed 44 fishing boat captains
Seized 39 illegal fishing gears from 11 fishermen from Sape
Oct. 2003 Daminaus Santi Interviewed 29 fishing boat captains Oct. 2003 14-15 Daminaus Santi Interviewed 15 fishing boat captains
Expelled 4 illegal fishing boat from Sape Oct. 2003 16-17 Daminaus Santi Interviewed 16 fishing boat captains Oct. 2003 23-24 Daminaus Santi Interviewed 19 fishing boat captains
Patrol route: North Rinca, Padar, Sabita, Gililawa and west Komodo
Sept. 2003 12-13 Daminaus Santi Interviewed fishing boat captain Sept. 2003 18-19 Daminaus Santi Interviewed fishing boat captain
26
Month Date Observer Remarks Sept. 2003 25-26 Daminaus Santi Interviewed fishing boat captain
Seized 3 illegal fishing gears of fishermen from Ramu Island
August 2003 5-6 Damianus Santi Interviewed 33 fishing boat captains July 2003 9-10 Daminaus Santi Interviewed fishing boat captain July 2003 23-24 Daminaus Santi Interviewed 15 fishing boat captains July 2003 30-31 Daminaus Santi Interviewed fishing boat captain June 2003 5-6 Damianus Santi Interviewed 13 fishing boat captains June 2003 16-17 Damianus Santi Interviewed 23 fishing boat captains
Expelled fishermen from Sape who fished illegally in the park waters
June 2003 23-24 Damianus Santi Interviewed 22 fishing boat captains May 2003 13-14 Santos Interviewed 16 fishing boat captains May 2003 27-28 Santos Interviewed 18 fishing boat captains April 2003 8-9 Damianus Santi Interviewed 38 fishing boat captains
Expelled 20 illegal fishing boats from Sape April 2003 23 Abu Bakar Interviewed 10 fishing boat captains
Arrested 2 compressor fishing boats from Sape and hand them over to police in Labuan Bajo
April 2003 29-30 Damianus Santi Interviewed 39 fishing boat captains March 2003 4-5 Damianus Santi Interviewed 24 fishing boat captains March 2003 13-14 Damianus Santi Interviewed 6 fishing boat captains March 2003 18-19 Damianus Santi Interviewed 20 fishing boat captains March 2003 26-27 Damianus Santi Interviewed 27 fishing boat captains Feb. 2003 7-8 Santos Interviewed 23 fishing boat captains
Expelled 4 illegal fishing boats from Sape Feb. 2003 14 Damianus santi Interviewed fishing boat captain Feb. 2003 18-19 Abu Bakar Interviewed fishing boat captain Feb. 2003 26-27 Abu Bakar Interviewed fishing boat captain
Expelled 2 fishing boats from Ramut Island who fished with illegal fishing gear in the park waters.
Jan. 2003 7 Damianus Santi Interviewed 13 fishing boat captains Jan. 2003 16 Santos Interviewed 27 fishing boat captains Jan. 2003 24 Damianus Santi Interviewed 24 fishing boat captains Dec. 2002 19 Joint team Interviewed 10 fishing boat captains Nov. 2002 5-6 Damianus Santi Interviewed 26 fishing boat captains Oct. 2002 16 Joint team Interviewed 39 fishing boat captains Sept. 2002 4-5 Damianus Santi Interviewed 15 fishing boat captains Sept. 2002 13-14 Damianus Santi Interviewed 15 fishing boat captains
Found 1 tourist boat in the park waters without entrance fee
Sept. 2002 18-19 Abu Bakar Interviewed 26 fishing boat captains Expelled 2 fishing boats from Ende that fished for manta rays Expelled 2 bottom long-line fishing boats from Sape.
Sept. 2002 25-62 Joint team Interviewed 42 fishing boat captains August 2002 5 Joint team Interviewed 52 fishing boat captains
Expelled 1 trap (bubu) fishing boats from Labuan Bajo.
July 2002 4 Damianus Santi Interviewed 20 fishing boat captains July 2002 16-17 Damianus Santi Interviewed fishing boat captain July 2002 24-25 Abu Bakar Interviewed 40 fishing boat captains
Expelled bottom long-line fishermen from Sape and Palue

27
Table 3. Summary of violations reported by speedboat patrol team over the period July 2002 –June 2003. See Table 2 for violations after June 2003.
Type of Violation
Total cases
Origin Follow-up actions
Compressor 1 Boat from Sape Boats were confiscated, crews were sent to court
Intruders 36 Boats from Sape Expelled and not allowed to re-enter the park
No fishing permit
8 Boats from Ende, Mesa and Labuan Bajo.
Asked to obtain permit from the nearest Park representative.
Reef gleaning > 200 Communities inside the park
Warnings issued
No entrance fee from tourist boats
5 Asked to immediately relocate to the main Park gate (Loh Liang) to pay entrance tickets
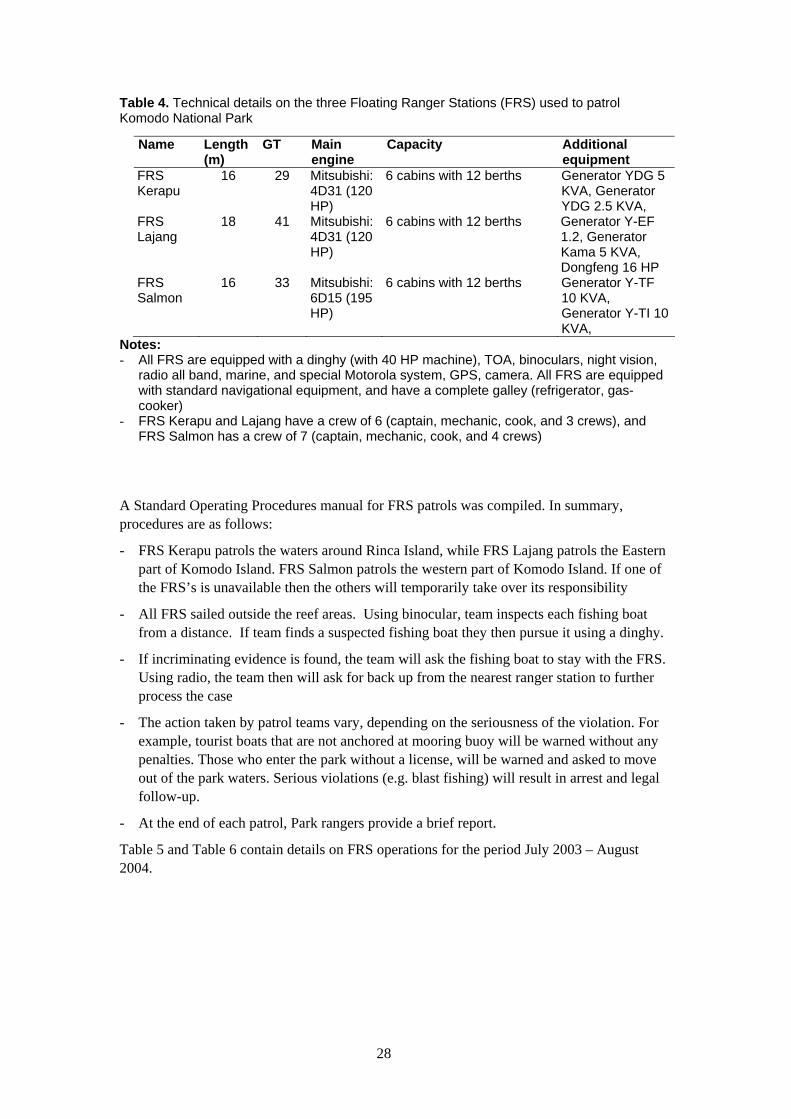
3.5 Floating Ranger Stations Presently, there are three vessels used as floating ranger stations in Komodo National Park: FRS Kerapu, FRS Lajang and FRS Salmon (details see Table 4). FRS Salmon is now (2004) seconded to Wakatobi Marine National Park of Wakatobi district in Southeast Sulawesi. All FRS’s were refitted under the supervision of The Conservancy’s Marine Operations Manager. The Conservancy provides fuel, logistics and technical assistance to the team. Boat crew are also on The Conservancy’s payroll.
FRS patrol schedule is 80 days followed by a 10-day maintenance period (docking). FRS team members are rotated every 10 days. Hence, the FRS provides permanent field presence of Park officials and officials of other enforcement agencies. Over the period July 2002 – February 2003, the patrol team comprised of 6 personnel: 2 Park rangers, 1 police officer, 1 army officer, 1 from navy officer and 1 water police officer. In February 2003, total personnel were reduced to 4 personnel comprising 2 Park rangers, 1 police officer, and 1 from water police officer.
28
Table 4. Technical details on the three Floating Ranger Stations (FRS) used to patrol Komodo National Park
Notes: - All FRS are equipped with a dinghy (with 40 HP machine), TOA, binoculars, night vision,
radio all band, marine, and special Motorola system, GPS, camera. All FRS are equipped with standard navigational equipment, and have a complete galley (refrigerator, gas-cooker)
- FRS Kerapu and Lajang have a crew of 6 (captain, mechanic, cook, and 3 crews), and FRS Salmon has a crew of 7 (captain, mechanic, cook, and 4 crews)
Name Length (m)
GT Main engine
Capacity Additional equipment
FRS Kerapu
16 29 Mitsubishi: 4D31 (120 HP)
6 cabins with 12 berths Generator YDG 5 KVA, Generator YDG 2.5 KVA,
FRS Lajang
18 41 Mitsubishi: 4D31 (120 HP)
6 cabins with 12 berths Generator Y-EF 1.2, Generator Kama 5 KVA, Dongfeng 16 HP
FRS Salmon
16 33 Mitsubishi: 6D15 (195 HP)
6 cabins with 12 berths Generator Y-TF 10 KVA, Generator Y-TI 10 KVA,
A Standard Operating Procedures manual for FRS patrols was compiled. In summary, procedures are as follows:
- FRS Kerapu patrols the waters around Rinca Island, while FRS Lajang patrols the Eastern part of Komodo Island. FRS Salmon patrols the western part of Komodo Island. If one of the FRS’s is unavailable then the others will temporarily take over its responsibility
- All FRS sailed outside the reef areas. Using binocular, team inspects each fishing boat from a distance. If team finds a suspected fishing boat they then pursue it using a dinghy.
- If incriminating evidence is found, the team will ask the fishing boat to stay with the FRS. Using radio, the team then will ask for back up from the nearest ranger station to further process the case
- The action taken by patrol teams vary, depending on the seriousness of the violation. For example, tourist boats that are not anchored at mooring buoy will be warned without any penalties. Those who enter the park without a license, will be warned and asked to move out of the park waters. Serious violations (e.g. blast fishing) will result in arrest and legal follow-up.
- At the end of each patrol, Park rangers provide a brief report.
Table 5 and Table 6 contain details on FRS operations for the period July 2003 – August 2004.
29
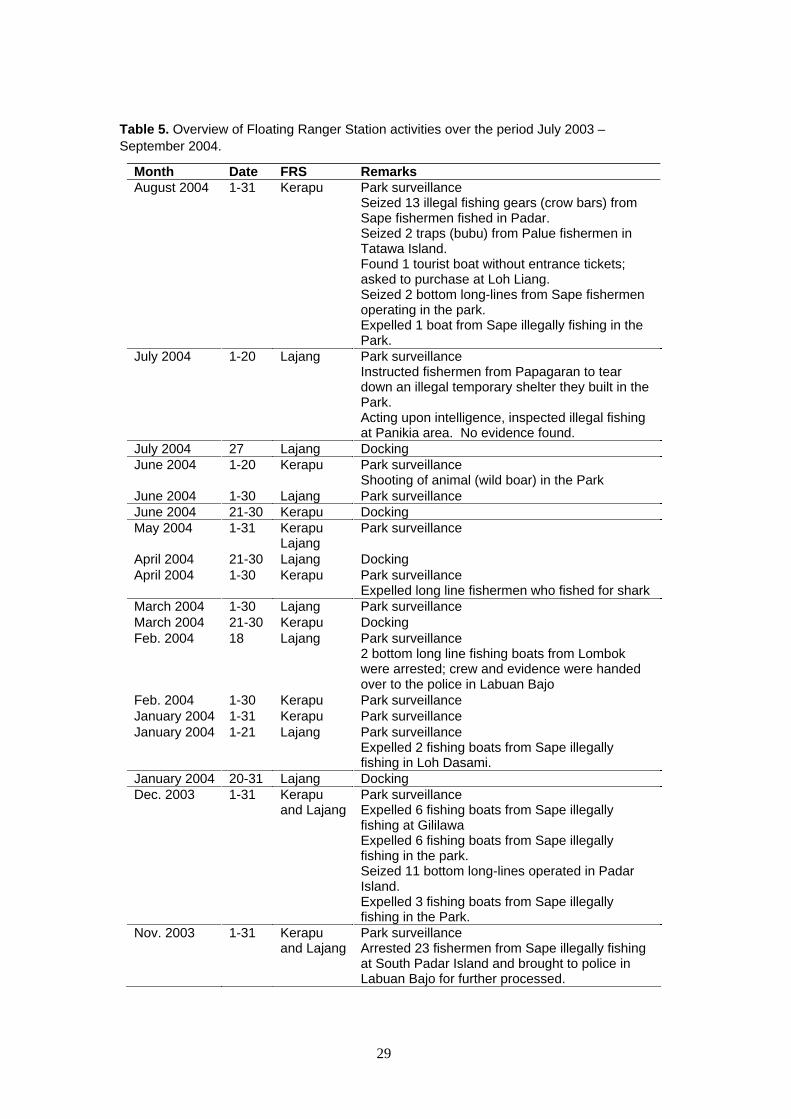
Table 5. Overview of Floating Ranger Station activities over the period July 2003 – September 2004.
Month Date FRS Remarks August 2004 1-31 Kerapu Park surveillance
Seized 13 illegal fishing gears (crow bars) from Sape fishermen fished in Padar. Seized 2 traps (bubu) from Palue fishermen in Tatawa Island. Found 1 tourist boat without entrance tickets; asked to purchase at Loh Liang. Seized 2 bottom long-lines from Sape fishermen operating in the park. Expelled 1 boat from Sape illegally fishing in the Park.
July 2004 1-20 Lajang Park surveillance Instructed fishermen from Papagaran to tear down an illegal temporary shelter they built in the Park. Acting upon intelligence, inspected illegal fishing at Panikia area. No evidence found.
July 2004 27 Lajang Docking June 2004 1-20 Kerapu Park surveillance
Shooting of animal (wild boar) in the Park June 2004 1-30 Lajang Park surveillance June 2004 21-30 Kerapu Docking May 2004 1-31 Kerapu
Lajang Park surveillance
April 2004 21-30 Lajang Docking April 2004 1-30 Kerapu Park surveillance
Expelled long line fishermen who fished for shark March 2004 1-30 Lajang Park surveillance March 2004 21-30 Kerapu Docking Feb. 2004 18 Lajang Park surveillance
2 bottom long line fishing boats from Lombok were arrested; crew and evidence were handed over to the police in Labuan Bajo
Feb. 2004 1-30 Kerapu Park surveillance January 2004 1-31 Kerapu Park surveillance January 2004 1-21 Lajang Park surveillance
Expelled 2 fishing boats from Sape illegally fishing in Loh Dasami.
January 2004 20-31 Lajang Docking Dec. 2003 1-31 Kerapu
and Lajang Park surveillance Expelled 6 fishing boats from Sape illegally fishing at Gililawa Expelled 6 fishing boats from Sape illegally fishing in the park. Seized 11 bottom long-lines operated in Padar Island. Expelled 3 fishing boats from Sape illegally fishing in the Park.
Nov. 2003 1-31 Kerapu and Lajang
Park surveillance Arrested 23 fishermen from Sape illegally fishing at South Padar Island and brought to police in Labuan Bajo for further processed.
30
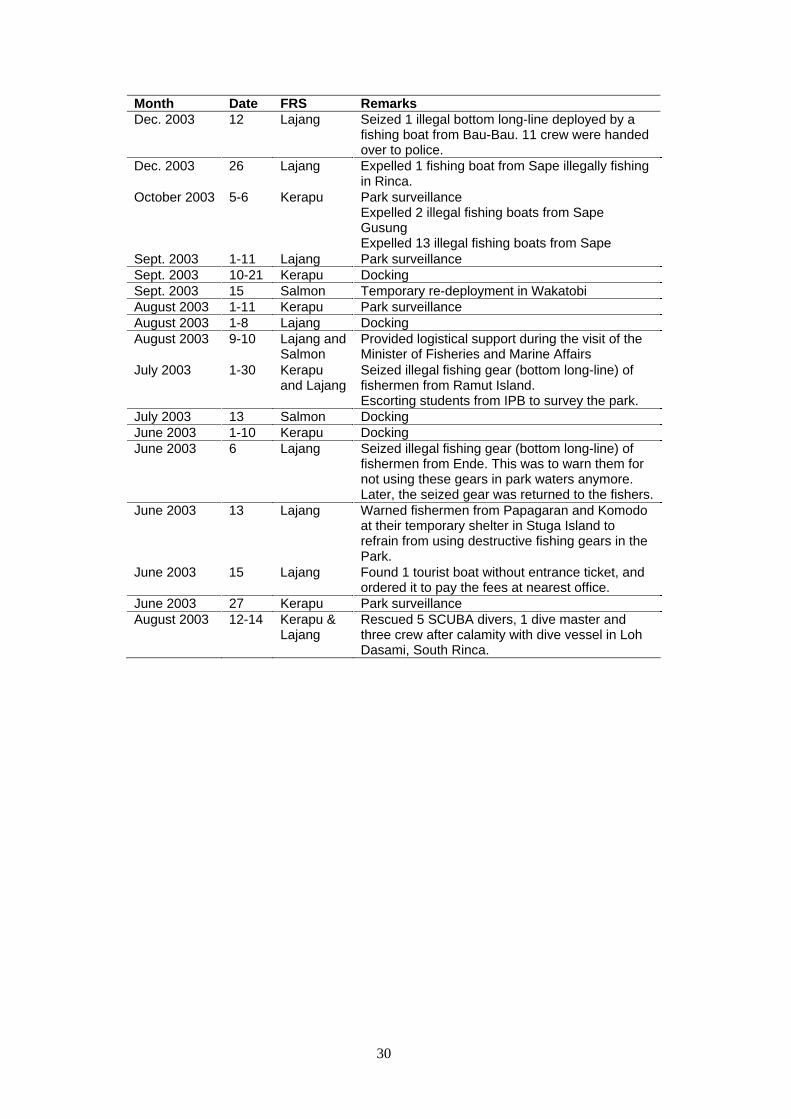
Month Date FRS Remarks Dec. 2003 12 Lajang Seized 1 illegal bottom long-line deployed by a
fishing boat from Bau-Bau. 11 crew were handed over to police.
Dec. 2003 26 Lajang Expelled 1 fishing boat from Sape illegally fishing in Rinca.
October 2003 5-6 Kerapu Park surveillance Expelled 2 illegal fishing boats from Sape Gusung Expelled 13 illegal fishing boats from Sape
Sept. 2003 1-11 Lajang Park surveillance Sept. 2003 10-21 Kerapu Docking Sept. 2003 15 Salmon Temporary re-deployment in Wakatobi August 2003 1-11 Kerapu Park surveillance August 2003 1-8 Lajang Docking August 2003 9-10 Lajang and
Salmon Provided logistical support during the visit of the Minister of Fisheries and Marine Affairs
July 2003 1-30 Kerapu and Lajang
Seized illegal fishing gear (bottom long-line) of fishermen from Ramut Island. Escorting students from IPB to survey the park.
July 2003 13 Salmon Docking June 2003 1-10 Kerapu Docking June 2003 6 Lajang Seized illegal fishing gear (bottom long-line) of
fishermen from Ende. This was to warn them for not using these gears in park waters anymore. Later, the seized gear was returned to the fishers.
June 2003 13 Lajang Warned fishermen from Papagaran and Komodo at their temporary shelter in Stuga Island to refrain from using destructive fishing gears in the Park.
June 2003 15 Lajang Found 1 tourist boat without entrance ticket, and ordered it to pay the fees at nearest office.
June 2003 27 Kerapu Park surveillance August 2003 12-14 Kerapu &
Lajang Rescued 5 SCUBA divers, 1 dive master and three crew after calamity with dive vessel in Loh Dasami, South Rinca.
31
Table 6. Number of violations reported by FRS patrol team from July 2002 - June 2003. See Table 5 for details on violations in the period after June 2003.
Type of violation
Total cases
Origin Follow up
Poison (tuba) fishing
1 2 boats seized, suspects asked not to repeat the violation; processed by park ranger and local police
Blast fishing 2 Information obtained from local fishers, but suspects not found during field inspections
Compressor 3 Sape Boat seized, pearls compressor is warned not to repeat the activity; crew sent to court
Bottom long line
2 Expelled, and gears were confiscated
Gill net 2 Ramu Island Expelled and warned not to fish inside the Park Purse seine 3 Sulawesi and
Labuan Bajo Expelled and warned not to enter the Park
Intruders 61 1 boat from Ende, rest from Sape
Expelled
No fishing permit
12 Mesa and Labuan Bajo
Asked to obtain a permit from the nearest Park representative
Shark exploitation
1 Expelled from the Park
Reef gleaning > 100 Communities inside the park
Warnings issued
No entrance fee for tourist boats
10 Various tourist operators
Warned and asked to obtain entrance tickets
3.6 Surveillance exchanges with Ujung Kulon National Park and Wakatobi Marine National Park The Komodo National Park surveillance team also supported an exchange with two other national parks in Indonesia: Ujung Kulon National Park and Wakatobi Marine National Park.
The purpose of this staff exchange was to share lessons learned on park patrolling and enforcement. In September 2003, park rangers from Ujung Kulon National Park, together with WWF Ujung Kulon visited Komodo and participated in FRS Lajang patrolling activity. Furthermore, FRS Salmon and its crew members were seconded to Wakatobi Marine National Park and Park rangers from Wakatobi were trained by visiting rangers from Komodo.
4 Community awareness and outreach
Community awareness and outreach has been one of the most important modules in the Komodo marine conservation program, providing support for Park planning, surveillance, and alternative livelihood development. The objective of the awareness and outreach activities is to involve and inform stakeholders for effective constituency building for Park management. The Conservancy established a Community Awareness and Outreach team, with staff varying between 2 and 4 full-time employees supplemented with short-term contractors and consultants Activities of the team are described below.

32
4.1 Extension of the Komodo self-financing structure and the Komodo Collaborative Management Initiative Restructuring the management and financing of the Park has been a participatory process started in 1996, when The Conservancy organized the first meeting to discuss options for management and Park financing with local stakeholders. Since then, a wide range of workshops, meetings and consultations have been conducted, targeting government agencies and stakeholder groups. Public has also been informed about issues pertaining to Komodo National Park management through mass media (TV documentaries and articles in magazines and newspapers).
The first stakeholder meeting on collaborative management was held in Labuan Bajo in August 1996. All parties from Manggarai districts of East Nusa Tenggara Province and neighboring Bima District of West Nusa Tenggara agreed to support a collaborative management system for Komodo National Park.
The Nature Conservancy co-facilitated a meeting on the proposed self-financing scheme for Komodo National Park that took place on 10 February 2000 in Jakarta. This meeting was attended by the Directorate-General of Forest Protection and Nature Conservation, the Directorate-General of Nature Tourism, the Directorate-General of Fisheries, the State Ministry of Environment, the Department of Finance, the National Planning Board (BAPPENAS), the Navy, and the NGO Conservation International. The meeting agreed to study legal aspects that affect the management system of the park, especially the self-financing scheme for the Park.
With the endorsement of the Park’s 25 year management plan in 2000, plans to implement the self-financing mechanism and the collaborative management initiative were expedited, and the following were among the organizations and government agencies who expressed their support in writing: UNESCO (No. JAK/ECO/01.0726, dated July 10, 2001), IUCN-World Conservation Union (letter dated on 22 May 2001), the Bupati of the District Manggarai (no. 019.1/455/VI/2001, dated 11 June 2001), the Minister of Culture and Tourism (no. UM/201/3/24/ MKP/2002 dated on 7 May 2002).
Starting July 2002, The Conservancy worked closely with the Park authority in the village extension program for the Komodo Collaborative Management Initiative (KCMI). The aim of this program was to explain local government and local communities how they will be involved in long-term management planning of the Park, and how the Park plans to self-finance its operations through the proposed Joint Venture for tourism management. The extension was also strengthened with the involvement of Sub-District head (Camat) followed by Decree Letter from Bupati (Head of Manggarai District) to endorse 40 local community stakeholders to participate in the extension process. Finally, Director General of Forest Protection and Nature Conservation representing central government, and head of District Manggarai conducted a public hearing in Labuan Bajo, to assess the community perception towards the proposed management structure and financing planning for Komodo National Park. In coordination with park authority, The Conservancy also supported the local community consultations with the Ministry of Forestry (represented by Director of Forest Protection and Nature Conservation) in Jakarta, and with the Head of the Manggarai District.
Since July 2002 to February 2004, there have been 114 meetings and discussions conducted with various stakeholders in around Labuan Bajo, Ruteng, and Jakarta. The following are some milestones of these extensions:
33
- Following informal consultation and discussion between The Conservancy (Rili Djohani) and the Head of National Park with local-key stakeholders held on October 2002, it seemed that local communities realized the need for improved management structure of the park and long-term self financing of the park from eco-tourism. This was indicated from support statements provided by 76 local stakeholder components and local community organizations to continue the extension process of Komodo Collaborative Management Initiative.
- From the result of public consultation meeting between Director General of Forest Protection and Nature Conservation, the Head of Manggarai District, National Park, and The Conservancy with local communities, and stakeholder consultation with Bupati, a support letter was issued by Bupati of Manggarai No. Hk/42/2003, dated 15 June 2003 on the involvement of 45 local community stakeholders within KCMI extension activities together with District and local government
- Bupati Manggarai also sent a support letter for the Collaborative Management of Komodo National Park, to IFC. The letter, No. EK.019.1/141/V/2003, issued on May 5, 2003 strongly indicated government support on co-management system for Komodo National Park.
- The KNP Director issued a support letter on the nature tourism concession proposal and its operating area dated on August 2003
- After reviewing the proposal, Minister of Forestry issued a principal approval letter No. 381/Menhut-II/2003, dated on June 18, 2003, in which several points to condition the concession are stated. Those included the cooperation with the park employee cooperative in operating the accommodation, and the collaborative management principles.
- Director of the Nature Tourism and Environment under Directorate General of Forest Protection and Nature Conservation, together with his team visited Komodo National Park on August 2003 to further socialize this ministerial principal approval and internalize it with the park staffs.
The local political and administrative framework of Komodo National Park changed dramatically in July 2003 when the District of West Manggarai separated as an independent District from its ‘mother’ District Manggarai. As a consequence, the Komodo Collaborative Management Initiative had to be re-introduced to the new government officials. In November 2003, the new head of West Manggarai district expressed his support by officially witnessing the signing of the Memorandum of Understanding between PT Putri Naga Komodo and Komodo National Park, together with the President of The Nature Conservancy, Steven McCormick This clearly indicates that the Komodo Collaborative Management Initiative has received positive recognition from local government and community stakeholders.
4.2 Reaching out to the media Komodo, a UNESCO World Heritage Site and Man and Biosphere Reserve, has a high profile and attracts considerable attention from the media. Even though a wealth of information on Komodo National Park and its management is available, coverage of issues related to the Park by domestic media is not accurate. Especially the Collaborative Management Initiative, the concession for tourism management have been misinterpreted. Also the necessity of no-take zones in the Park was not well understood by the media. Journalists generally focus on short-term economic losses associated with the implementation of no-take zones, losing sight of the long-term economic benefits these no-take zones provide.
To enhance the accuracy of media coverage on issues pertaining to Komodo National Park, The Conservancy actively supports the Park authority to reach out to domestic and foreign

34
journalists and reporters. As it is often difficult for domestic reporters to visit Komodo National Park, The Conservancy helps to coordinate travel and site visits.
The Conservancy has provided assistance to video documentary makers to get footage (interviews, underwater and above-water shots). Video documentaries that were produced with assistance of The Conservancy are listed in Table 7. Table 7. Video documentaries that were prepared with the assistance of The Nature Conservancy.
Subject / title Agency Year
Nationally and internationally broadcasted video documentaries
Destructive fishing and marine conservation in Komodo National Park
RCTI (national broadcaster), Sunday Special News 1996
Perils of Plectropomus Richard Smith / Australian Broadcasting Corporation 1999
Silent Sentinels Richard Smith / Australian Broadcasting Corporation 1999
Indonesia Beyond the Reefs Raffles Marina Singapore / National Geographic Channel 2000
Starship’s visit to Komodo (published on the Internet) Starship / Stern magazine 2000
Monster Mantas of Komodo Wild Things 2001
Komodo – Kingdom of the Dragon Telcast Productions 2001
Awareness videos produced by TNC SEACMPA
Komodo Underwater (various videos on Komodo’s underwater life)
TNC SEACMPA amongst others with Arnaz Mehta-Erdmann
1996 – 1998
Conservation Management of the Komodo National Park marine waters
TNC SEACMPA 1999
Marine Biodiversity in Komodo National Park TNC SEACMPA with Chris Paporakis 2003
Together with the Park authority, The Conservancy organized media orientation trips to reach out to international, national and local printed media. There have been 9 series of media visits that were facilitated by The Conservancy over the period August 2002 – October 2003 (Table 8). Results were as follows:
- In total, 83 articles were published, comprising 47 publications in local media, 23 publications in regional media, and 13 in national media. The articles predominantly
35
covered the dilemma between long-term benefits and short-term losses resulting from implementation of no-take zones in a Marine Protected Area.
- Special article publications from ASITA and ‘Bali and Beyond’ on how a healthy marine reserve can replenish surrounding fisheries, realize a long-term fishery benefit, and promote the development of eco-tourism. These two special publications were also used as material for outreach, especially targeting tourism operators in Labuan Bajo.
Furthermore, The Conservancy assisted with the publication of various articles in international popular media, including ‘On the trail of a dragon’ (One Conservancy, 2002), ‘Komodo Beneath the Dragon's Realm’ (Asian Diver, 2002), ‘Komodo & Galapagos: Uniting two different worlds’, (IslandLife Special Edition on Sustainable Tourism, 2002), ‘Dragons and mantas and sharks, oh my....’ (tnc.org, Asia Pacific Postcard From the Field, 2002), ‘Komodo Aria’ (AsianGeographic, 2001), ‘Blast fishing ring busted in Indonesia’ (Environmental News Network, 2000)
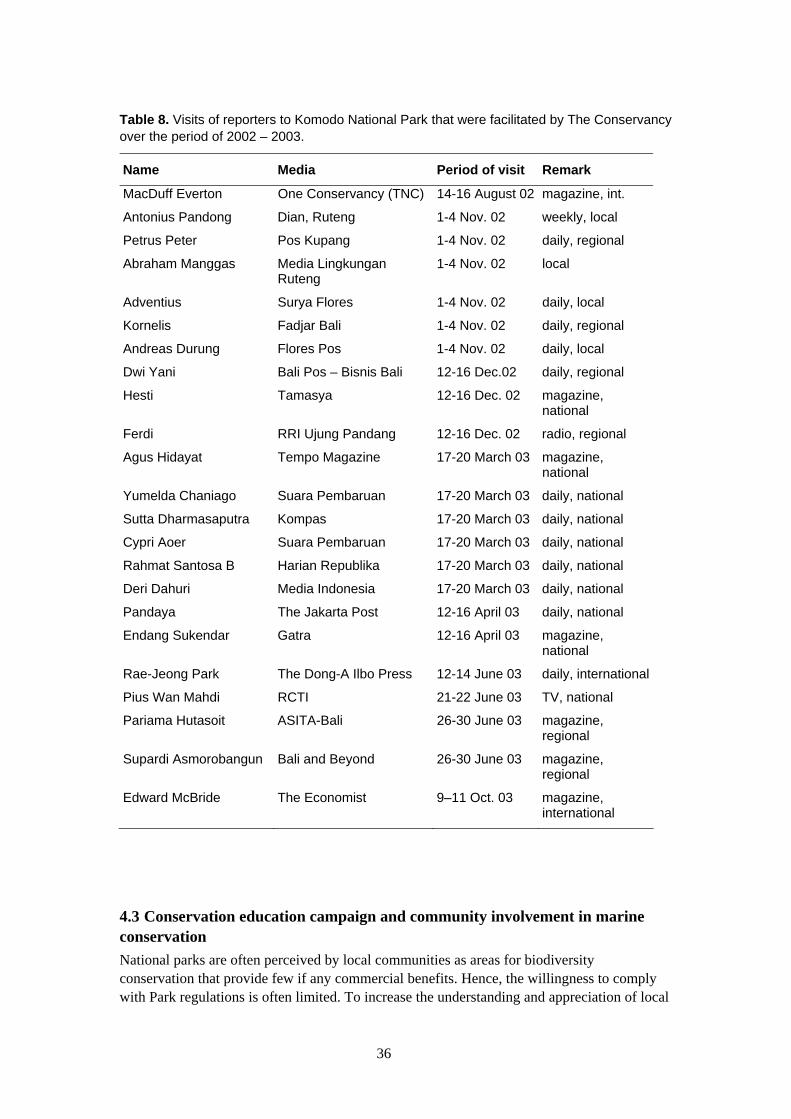
36
Table 8. Visits of reporters to Komodo National Park that were facilitated by The Conservancy over the period of 2002 – 2003.
Name Media Period of visit Remark
MacDuff Everton One Conservancy (TNC) 14-16 August 02 magazine, int.
Antonius Pandong Dian, Ruteng 1-4 Nov. 02 weekly, local
Petrus Peter Pos Kupang 1-4 Nov. 02 daily, regional
Abraham Manggas Media Lingkungan Ruteng
1-4 Nov. 02 local
Adventius Surya Flores 1-4 Nov. 02 daily, local
Kornelis Fadjar Bali 1-4 Nov. 02 daily, regional
Andreas Durung Flores Pos 1-4 Nov. 02 daily, local
Dwi Yani Bali Pos – Bisnis Bali 12-16 Dec.02 daily, regional
Hesti Tamasya 12-16 Dec. 02 magazine, national
Ferdi RRI Ujung Pandang 12-16 Dec. 02 radio, regional
Agus Hidayat Tempo Magazine 17-20 March 03 magazine, national
Yumelda Chaniago Suara Pembaruan 17-20 March 03 daily, national
Sutta Dharmasaputra Kompas 17-20 March 03 daily, national
Cypri Aoer Suara Pembaruan 17-20 March 03 daily, national
Rahmat Santosa B Harian Republika 17-20 March 03 daily, national
Deri Dahuri Media Indonesia 17-20 March 03 daily, national
Pandaya The Jakarta Post 12-16 April 03 daily, national
Endang Sukendar Gatra 12-16 April 03 magazine, national
Rae-Jeong Park The Dong-A Ilbo Press 12-14 June 03 daily, international
Pius Wan Mahdi RCTI 21-22 June 03 TV, national
Pariama Hutasoit ASITA-Bali 26-30 June 03 magazine, regional
Supardi Asmorobangun Bali and Beyond 26-30 June 03 magazine, regional
Edward McBride The Economist 9–11 Oct. 03 magazine, international
4.3 Conservation education campaign and community involvement in marine conservation National parks are often perceived by local communities as areas for biodiversity conservation that provide few if any commercial benefits. Hence, the willingness to comply with Park regulations is often limited. To increase the understanding and appreciation of local

37
communities for the Park and its management, and to solicit meaningful inputs for improved Park management, The Conservancy has reached out to local communities in three ways: (1) village visits and group discussions, (2) organizing and facilitating community action (clean-ups), (3) providing a curriculum on marine conservation and Marine Protected Areas to the local fisheries high school. Furthermore, The Conservancy implemented a campaign that intends to build pride of the Park and its biodiversity (see Section 4.4 below). In most awareness activities, three groups of local sparkplugs (Conservation Cadre, the Conservancy Club and Forum Peduli) played a pivotal role.
4.3.1 Local sparkplugs Often, awareness activities were implemented with the Conservation Cadre, the Conservancy Club and Forum Peduli. Representatives of these groups function as ‘sparkplugs’ who pass on messages on marine conservation to their constituencies.
Conservation Cadre – Since the early 1990s, the Komodo National Park authority has been inviting youths from villages in and around the park (25 – 35 persons in total) to participate in a conservation training. The training consisted of class sessions (three days) followed with two days field trip inside the park. At the end of the training, they were asked to help the Park authority to explain what they learnt on conservation to their constituencies. By repeating this training each year, the Park authority recruited new members of Conservation Cadre. Up to now, at least 200 persons have joint the training program and have been enlisted as members of Conservation Cadre. The park has used the Conservation Cadre members for extension of Park regulations and for field work such as the yearly census of the Komodo dragon population.
Conservancy Club – In 2001, RARE Tropical Conservation Centre, in coordination with Komodo National Park and The Conservancy organized a one-week training on conservation. Attendees (20 persons) were selected from mainly Conservation Cadre, park rangers, school teachers, tour guides, police officers, and local (sub-district) staffs. At the end of the training, the group produced two sermon sheets, a poem, and a song related to the conservation of Komodo National Park. All these materials have been multiplied by The Conservancy Komodo Field Office for the community awareness and education campaign. This group of 20 persons called themselves the ‘Conservancy Club’, and they are committed to support the conservation program of Komodo National Park.
Forum Peduli Lingkungan Hidup Komodo (FPLK) – Since September 2002, the idea on Komodo Collaborative Management Initiative (KCMI) was socialized by both the park staffs and The Nature Conservancy. Stakeholders who agreed with the concept and who support KCMI conducted meetings and formed a forum call Peduli Lingkungan Hidup Komodo on December 2002. The members (40 persons) who came from the Conservation Cadre, Conservancy Club, local elders, fisher groups, tour guide association, and individuals committed to help the Park with further extension of the KCMI. This group was formalized by the Bupati (Head) of the District Manggarai through a decree in June 2003
4.3.2 Village visits and group discussions The Conservancy conducted regular presentations and group discussions at the villages and in Labuan Bajo for a variety of audiences (local government officials, tourists, local tourism operators, local fishers etc.). At the villages, these sessions usually started with a video presentation on Komodo’s underwater life, followed with a music performance, football gathering, or puppet show. During the evening, the community awareness team used the
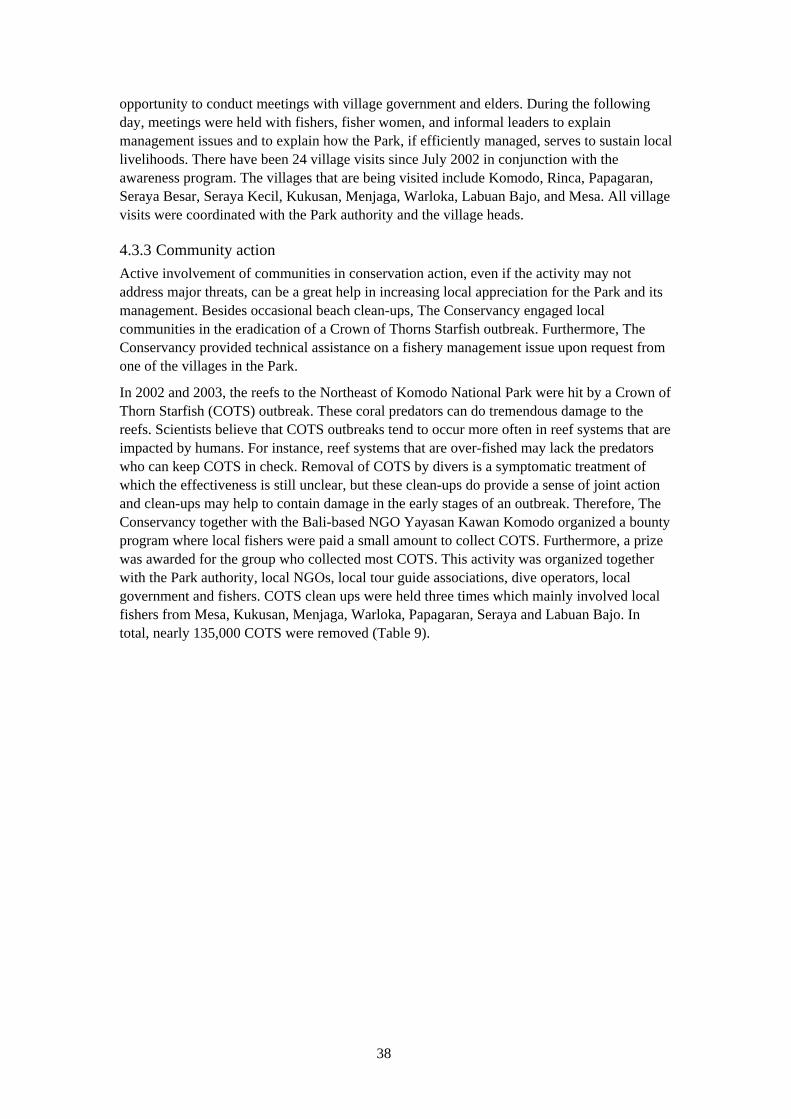
38
opportunity to conduct meetings with village government and elders. During the following day, meetings were held with fishers, fisher women, and informal leaders to explain management issues and to explain how the Park, if efficiently managed, serves to sustain local livelihoods. There have been 24 village visits since July 2002 in conjunction with the awareness program. The villages that are being visited include Komodo, Rinca, Papagaran, Seraya Besar, Seraya Kecil, Kukusan, Menjaga, Warloka, Labuan Bajo, and Mesa. All village visits were coordinated with the Park authority and the village heads.
4.3.3 Community action Active involvement of communities in conservation action, even if the activity may not address major threats, can be a great help in increasing local appreciation for the Park and its management. Besides occasional beach clean-ups, The Conservancy engaged local communities in the eradication of a Crown of Thorns Starfish outbreak. Furthermore, The Conservancy provided technical assistance on a fishery management issue upon request from one of the villages in the Park.
In 2002 and 2003, the reefs to the Northeast of Komodo National Park were hit by a Crown of Thorn Starfish (COTS) outbreak. These coral predators can do tremendous damage to the reefs. Scientists believe that COTS outbreaks tend to occur more often in reef systems that are impacted by humans. For instance, reef systems that are over-fished may lack the predators who can keep COTS in check. Removal of COTS by divers is a symptomatic treatment of which the effectiveness is still unclear, but these clean-ups do provide a sense of joint action and clean-ups may help to contain damage in the early stages of an outbreak. Therefore, The Conservancy together with the Bali-based NGO Yayasan Kawan Komodo organized a bounty program where local fishers were paid a small amount to collect COTS. Furthermore, a prize was awarded for the group who collected most COTS. This activity was organized together with the Park authority, local NGOs, local tour guide associations, dive operators, local government and fishers. COTS clean ups were held three times which mainly involved local fishers from Mesa, Kukusan, Menjaga, Warloka, Papagaran, Seraya and Labuan Bajo. In total, nearly 135,000 COTS were removed (Table 9).
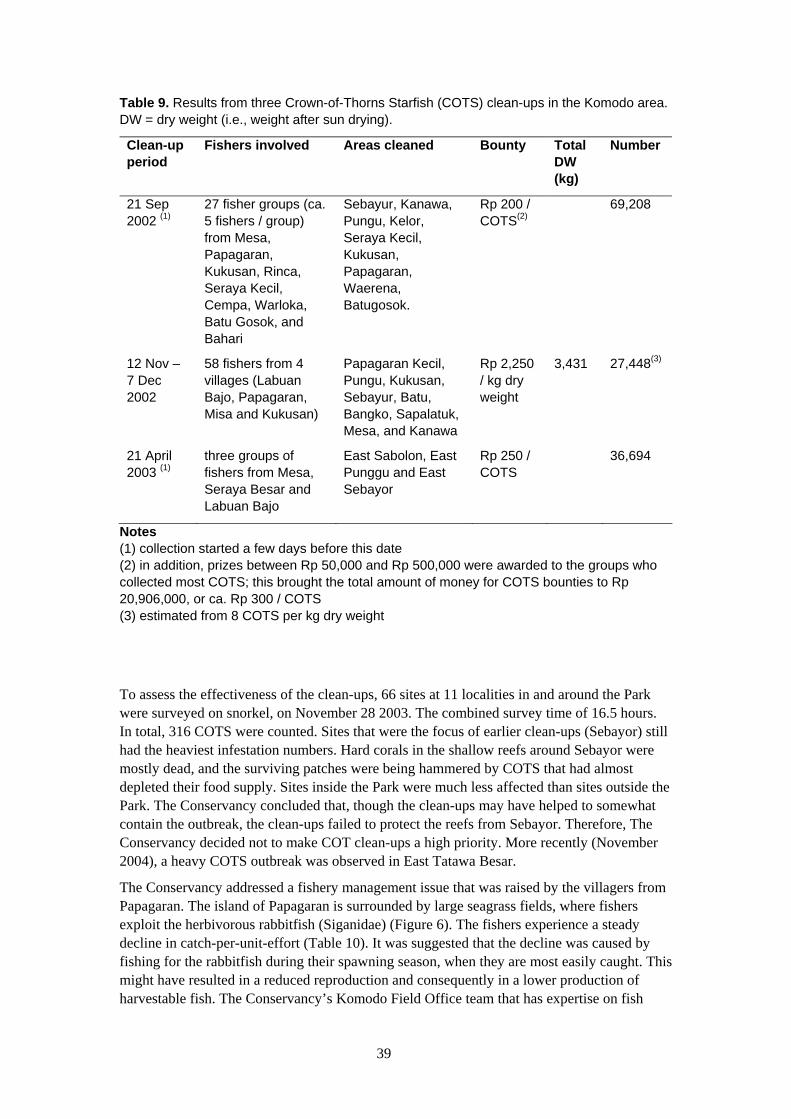
39
Table 9. Results from three Crown-of-Thorns Starfish (COTS) clean-ups in the Komodo area. DW = dry weight (i.e., weight after sun drying).
Clean-up period
Fishers involved Areas cleaned Bounty Total DW (kg)
Number
21 Sep 2002 (1)
27 fisher groups (ca. 5 fishers / group) from Mesa, Papagaran, Kukusan, Rinca, Seraya Kecil, Cempa, Warloka, Batu Gosok, and Bahari
Sebayur, Kanawa, Pungu, Kelor, Seraya Kecil, Kukusan, Papagaran, Waerena, Batugosok.
Rp 200 / COTS(2)
69,208
12 Nov – 7 Dec 2002
58 fishers from 4 villages (Labuan Bajo, Papagaran, Misa and Kukusan)
Papagaran Kecil, Pungu, Kukusan, Sebayur, Batu, Bangko, Sapalatuk, Mesa, and Kanawa
Rp 2,250 / kg dry weight
3,431 27,448(3)
21 April 2003 (1)
three groups of fishers from Mesa, Seraya Besar and Labuan Bajo
East Sabolon, East Punggu and East Sebayor
Rp 250 / COTS
36,694
Notes (1) collection started a few days before this date (2) in addition, prizes between Rp 50,000 and Rp 500,000 were awarded to the groups who collected most COTS; this brought the total amount of money for COTS bounties to Rp 20,906,000, or ca. Rp 300 / COTS (3) estimated from 8 COTS per kg dry weight
To assess the effectiveness of the clean-ups, 66 sites at 11 localities in and around the Park were surveyed on snorkel, on November 28 2003. The combined survey time of 16.5 hours. In total, 316 COTS were counted. Sites that were the focus of earlier clean-ups (Sebayor) still had the heaviest infestation numbers. Hard corals in the shallow reefs around Sebayor were mostly dead, and the surviving patches were being hammered by COTS that had almost depleted their food supply. Sites inside the Park were much less affected than sites outside the Park. The Conservancy concluded that, though the clean-ups may have helped to somewhat contain the outbreak, the clean-ups failed to protect the reefs from Sebayor. Therefore, The Conservancy decided not to make COT clean-ups a high priority. More recently (November 2004), a heavy COTS outbreak was observed in East Tatawa Besar.
The Conservancy addressed a fishery management issue that was raised by the villagers from Papagaran. The island of Papagaran is surrounded by large seagrass fields, where fishers exploit the herbivorous rabbitfish (Siganidae) (Figure 6). The fishers experience a steady decline in catch-per-unit-effort (Table 10). It was suggested that the decline was caused by fishing for the rabbitfish during their spawning season, when they are most easily caught. This might have resulted in a reduced reproduction and consequently in a lower production of harvestable fish. The Conservancy’s Komodo Field Office team that has expertise on fish
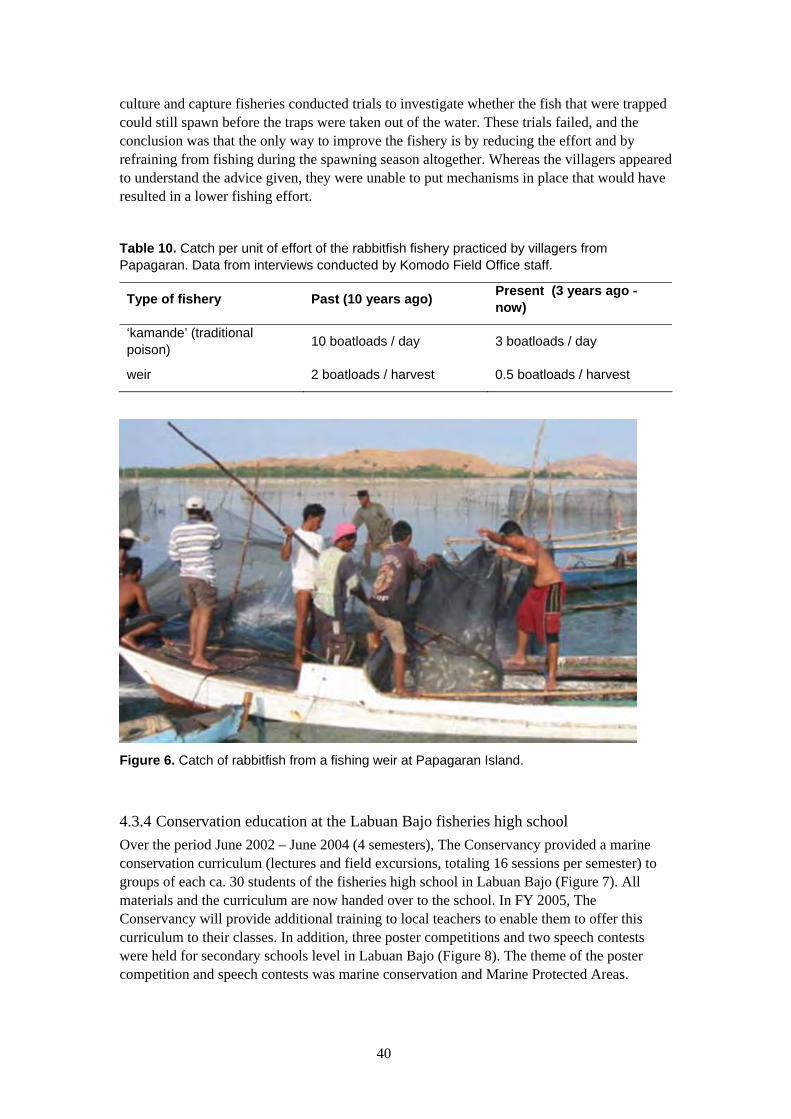
40
culture and capture fisheries conducted trials to investigate whether the fish that were trapped could still spawn before the traps were taken out of the water. These trials failed, and the conclusion was that the only way to improve the fishery is by reducing the effort and by refraining from fishing during the spawning season altogether. Whereas the villagers appeared to understand the advice given, they were unable to put mechanisms in place that would have resulted in a lower fishing effort.
Table 10. Catch per unit of effort of the rabbitfish fishery practiced by villagers from Papagaran. Data from interviews conducted by Komodo Field Office staff.
Type of fishery Past (10 years ago) Present (3 years ago - now)
‘kamande’ (traditional poison) 10 boatloads / day 3 boatloads / day
weir 2 boatloads / harvest 0.5 boatloads / harvest
Figure 6. Catch of rabbitfish from a fishing weir at Papagaran Island.
4.3.4 Conservation education at the Labuan Bajo fisheries high school Over the period June 2002 – June 2004 (4 semesters), The Conservancy provided a marine conservation curriculum (lectures and field excursions, totaling 16 sessions per semester) to groups of each ca. 30 students of the fisheries high school in Labuan Bajo (Figure 7). All materials and the curriculum are now handed over to the school. In FY 2005, The Conservancy will provide additional training to local teachers to enable them to offer this curriculum to their classes. In addition, three poster competitions and two speech contests were held for secondary schools level in Labuan Bajo (Figure 8). The theme of the poster competition and speech contests was marine conservation and Marine Protected Areas.

41
Figure 7. Field excursion with students of the Labuan Bajo fisheries high school.

42
Figure 8. Speech contest on marine conservation for secondary school students in Labuan Bajo (right).
4.4 Pride campaign In order to increase awareness of local communities on conservation issues and to build local pride for the Park and its biodiversity, The Conservancy committed to support a “Promoting Protection through Pride” conservation education campaign implemented by the RARE Center for Tropical Conservation in coordination with Komodo National Park authority. The Conservancy dedicated one of its Komodo Field Office staff to this project. The project aims to influence attitudes and behavior of Park residents towards environmentally-friendly practices.
The project started on June 2003 and will finalize in March 2005. Field implementation started in April 2004. The Conservancy staff joined a 10 weeks course on conservation education at Kent University, after which she implemented campaign modules on-site in close cooperation with the Park staff who were assigned to this project. To assess the baseline level of awareness of the local community, a pre-survey was held in early November 2003 among 266 locals, representing 5% of the targeted population in and just around the Park. The survey showed that 73% of the respondents were aware that they were living in or adjacent to a national park, and that resource use is regulated. The second (post-survey) will be held in February 2005. It is anticipated that this assessment will demonstrate a 25% increase in awareness and support for conservation in the Park as a result of the campaign.
Based on the first survey and stakeholder workshops, the manta ray was selected as ‘flagship species’ for the pride campaign in Komodo National Park. Campaign activities targeting local children and youths comprised school visits, puppet shows, a ‘manta song’, beach clean-ups and field excursions. For the fishers and their wives, a quiz on marine conservation and Park regulations was organized, and a ‘manta cake’ competition was held. The quiz showed that fishers are already aware of the Park’s zoning system. A radio feature based on interviews
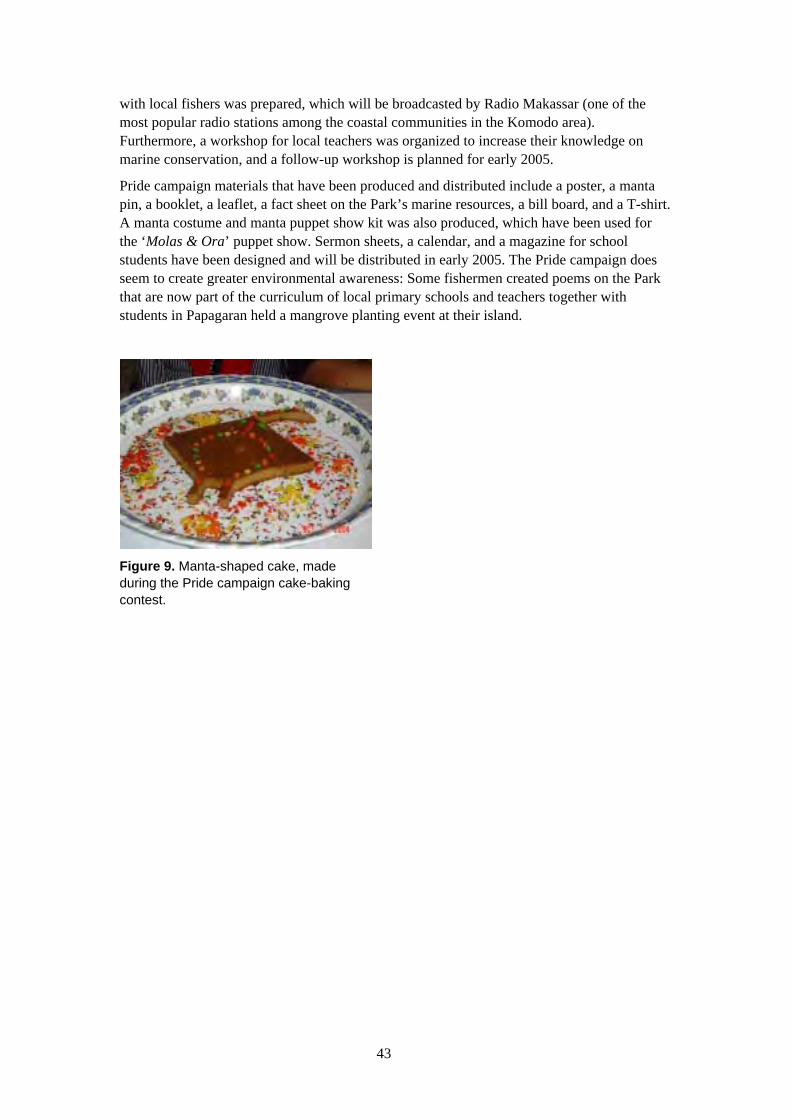
43
with local fishers was prepared, which will be broadcasted by Radio Makassar (one of the most popular radio stations among the coastal communities in the Komodo area). Furthermore, a workshop for local teachers was organized to increase their knowledge on marine conservation, and a follow-up workshop is planned for early 2005.
Pride campaign materials that have been produced and distributed include a poster, a manta pin, a booklet, a leaflet, a fact sheet on the Park’s marine resources, a bill board, and a T-shirt. A manta costume and manta puppet show kit was also produced, which have been used for the ‘Molas & Ora’ puppet show. Sermon sheets, a calendar, and a magazine for school students have been designed and will be distributed in early 2005. The Pride campaign does seem to create greater environmental awareness: Some fishermen created poems on the Park that are now part of the curriculum of local primary schools and teachers together with students in Papagaran held a mangrove planting event at their island.
Figure 9. Manta-shaped cake, made during the Pride campaign cake-baking contest.
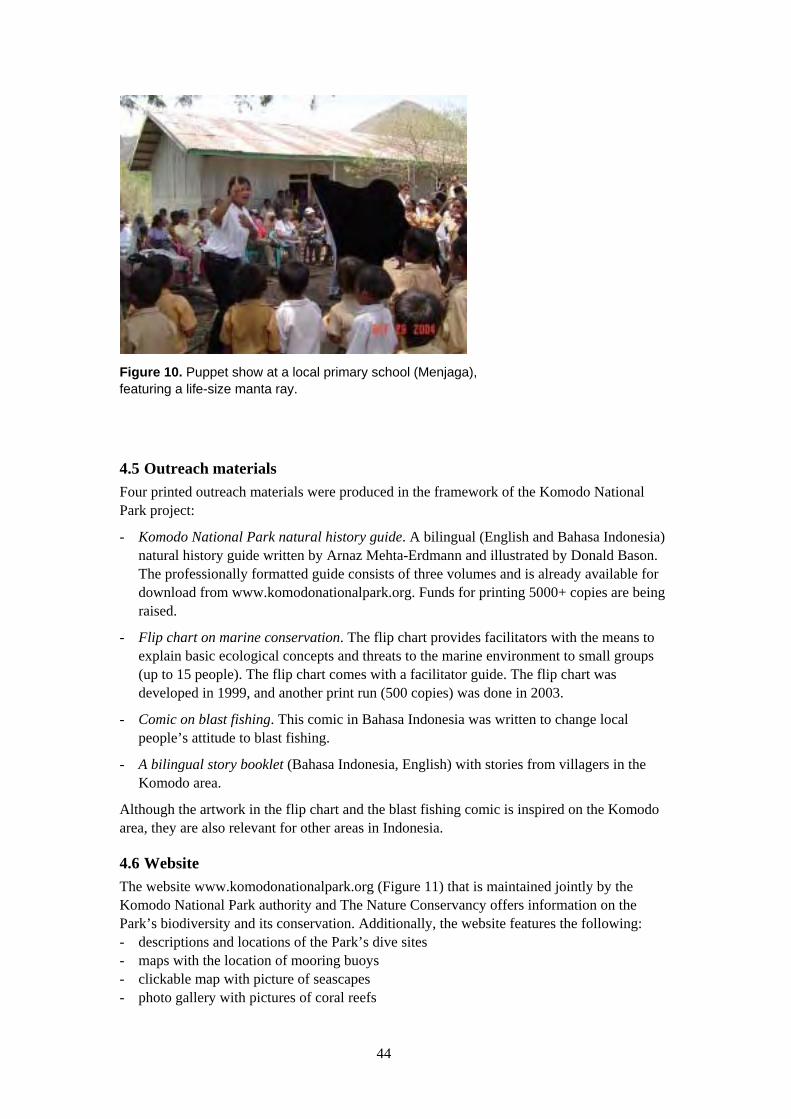
44
Figure 10. Puppet show at a local primary school (Menjaga), featuring a life-size manta ray.
4.5 Outreach materials Four printed outreach materials were produced in the framework of the Komodo National Park project:
- Komodo National Park natural history guide. A bilingual (English and Bahasa Indonesia) natural history guide written by Arnaz Mehta-Erdmann and illustrated by Donald Bason. The professionally formatted guide consists of three volumes and is already available for download from www.komodonationalpark.org. Funds for printing 5000+ copies are being raised.
- Flip chart on marine conservation. The flip chart provides facilitators with the means to explain basic ecological concepts and threats to the marine environment to small groups (up to 15 people). The flip chart comes with a facilitator guide. The flip chart was developed in 1999, and another print run (500 copies) was done in 2003.
- Comic on blast fishing. This comic in Bahasa Indonesia was written to change local people’s attitude to blast fishing.
- A bilingual story booklet (Bahasa Indonesia, English) with stories from villagers in the Komodo area.
Although the artwork in the flip chart and the blast fishing comic is inspired on the Komodo area, they are also relevant for other areas in Indonesia.
4.6 Website The website www.komodonationalpark.org (Figure 11) that is maintained jointly by the Komodo National Park authority and The Nature Conservancy offers information on the Park’s biodiversity and its conservation. Additionally, the website features the following: - descriptions and locations of the Park’s dive sites - maps with the location of mooring buoys - clickable map with picture of seascapes - photo gallery with pictures of coral reefs
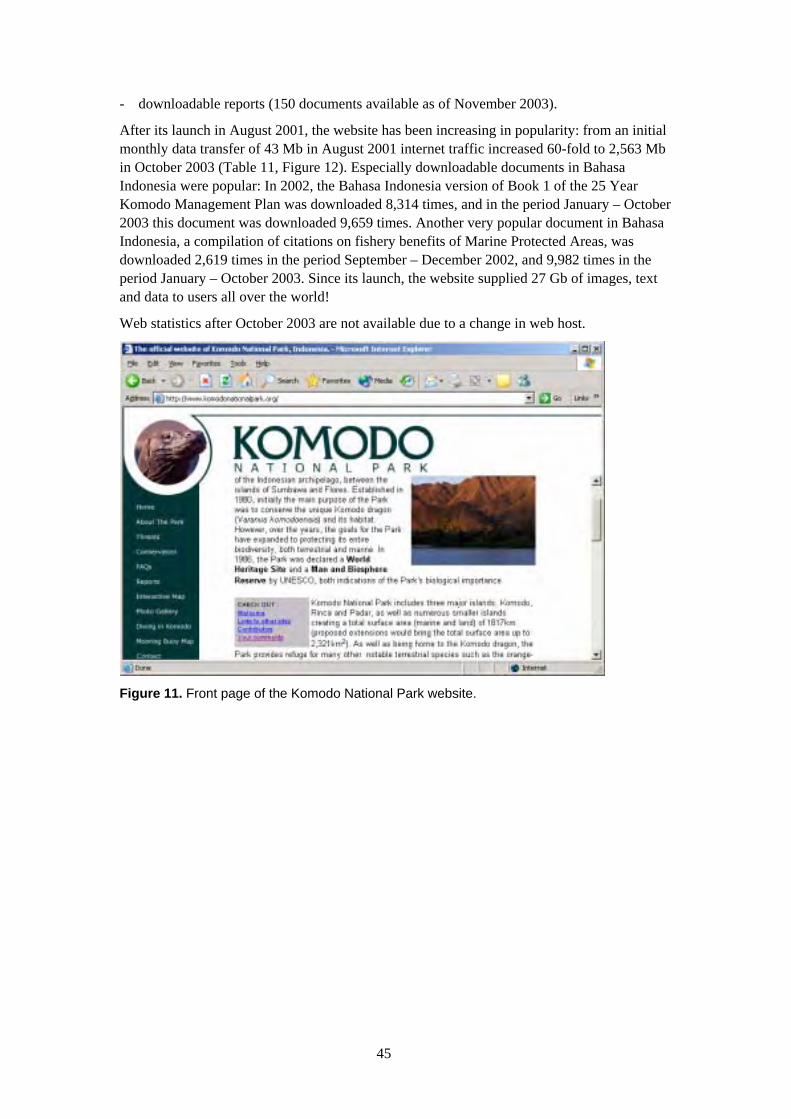
45
- downloadable reports (150 documents available as of November 2003).
After its launch in August 2001, the website has been increasing in popularity: from an initial monthly data transfer of 43 Mb in August 2001 internet traffic increased 60-fold to 2,563 Mb in October 2003 (Table 11, Figure 12). Especially downloadable documents in Bahasa Indonesia were popular: In 2002, the Bahasa Indonesia version of Book 1 of the 25 Year Komodo Management Plan was downloaded 8,314 times, and in the period January – October 2003 this document was downloaded 9,659 times. Another very popular document in Bahasa Indonesia, a compilation of citations on fishery benefits of Marine Protected Areas, was downloaded 2,619 times in the period September – December 2002, and 9,982 times in the period January – October 2003. Since its launch, the website supplied 27 Gb of images, text and data to users all over the world!
Web statistics after October 2003 are not available due to a change in web host.
Figure 11. Front page of the Komodo National Park website.
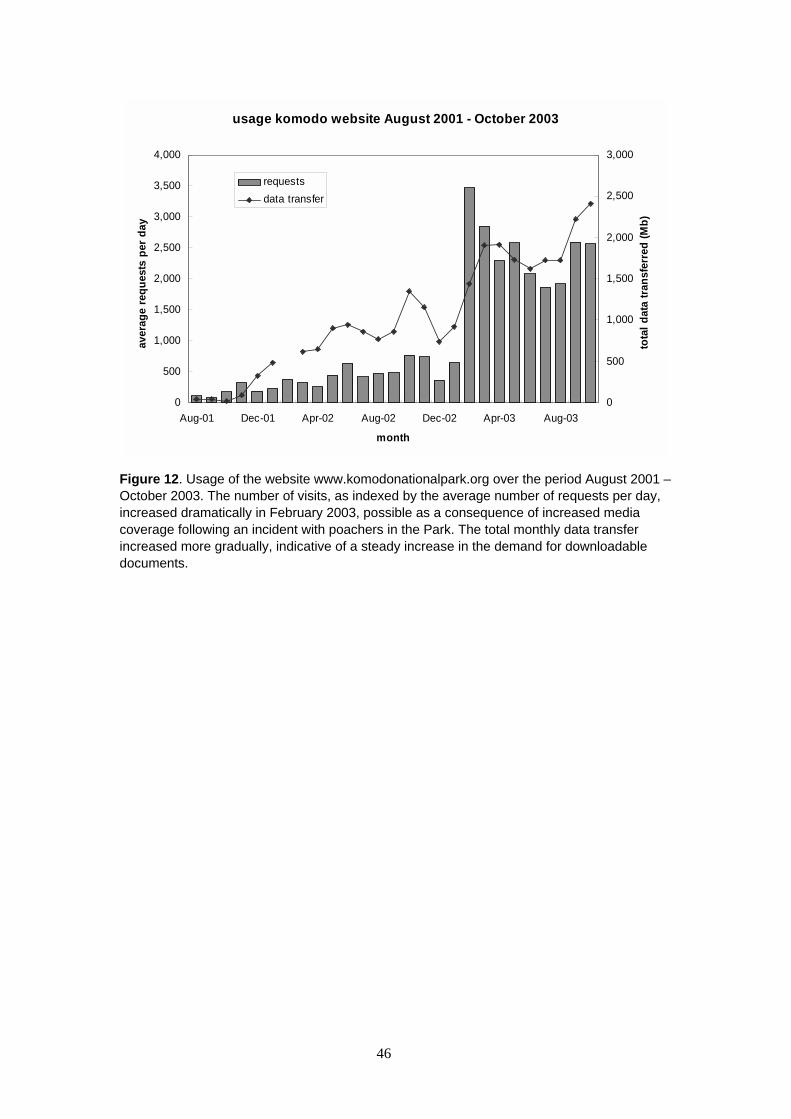
46
usage komodo website August 2001 - October 2003
0
500
1,000
1,500
2,000
2,500
3,000
3,500
4,000
Aug-01 Dec-01 Apr-02 Aug-02 Dec-02 Apr-03 Aug-03
month
aver
age
requ
ests
per
day
0
500
1,000
1,500
2,000
2,500
3,000
tota
l dat
a tra
nsfe
rred
(Mb)
requestsdata transfer
Figure 12. Usage of the website www.komodonationalpark.org over the period August 2001 – October 2003. The number of visits, as indexed by the average number of requests per day, increased dramatically in February 2003, possible as a consequence of increased media coverage following an incident with poachers in the Park. The total monthly data transfer increased more gradually, indicative of a steady increase in the demand for downloadable documents.
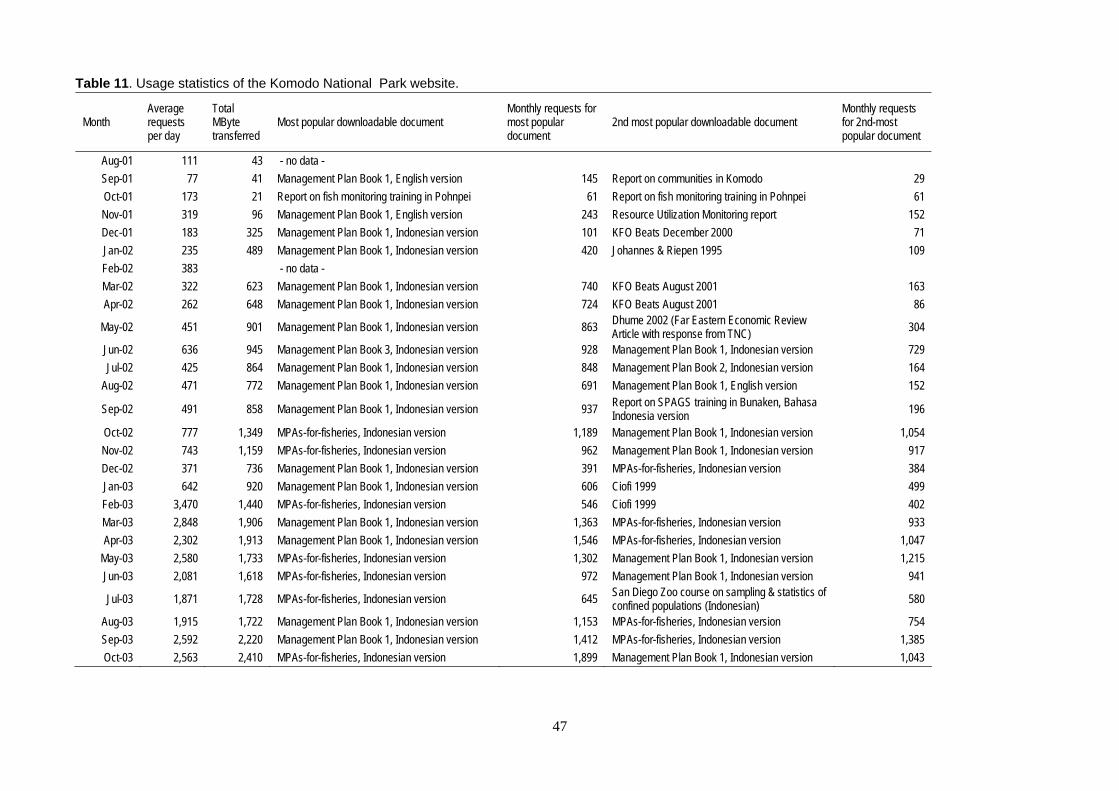
47
Table 11. Usage statistics of the Komodo National Park website.
Month Average requests per day
Total MByte transferred
Most popular downloadable document Monthly requests for most popular document
2nd most popular downloadable document Monthly requests for 2nd-most popular document
Aug-01 111 43 - no data - Sep-01 77 41 Management Plan Book 1, English version 145 Report on communities in Komodo 29 Oct-01 173 21 Report on fish monitoring training in Pohnpei 61 Report on fish monitoring training in Pohnpei 61 Nov-01 319 96 Management Plan Book 1, English version 243 Resource Utilization Monitoring report 152 Dec-01 183 325 Management Plan Book 1, Indonesian version 101 KFO Beats December 2000 71 Jan-02 235 489 Management Plan Book 1, Indonesian version 420 Johannes & Riepen 1995 109 Feb-02 383 - no data - Mar-02 322 623 Management Plan Book 1, Indonesian version 740 KFO Beats August 2001 163 Apr-02 262 648 Management Plan Book 1, Indonesian version 724 KFO Beats August 2001 86
May-02 451 901 Management Plan Book 1, Indonesian version 863 Dhume 2002 (Far Eastern Economic Review Article with response from TNC) 304
Jun-02 636 945 Management Plan Book 3, Indonesian version 928 Management Plan Book 1, Indonesian version 729 Jul-02 425 864 Management Plan Book 1, Indonesian version 848 Management Plan Book 2, Indonesian version 164
Aug-02 471 772 Management Plan Book 1, Indonesian version 691 Management Plan Book 1, English version 152
Sep-02 491 858 Management Plan Book 1, Indonesian version 937 Report on SPAGS training in Bunaken, Bahasa Indonesia version 196
Oct-02 777 1,349 MPAs-for-fisheries, Indonesian version 1,189 Management Plan Book 1, Indonesian version 1,054 Nov-02 743 1,159 MPAs-for-fisheries, Indonesian version 962 Management Plan Book 1, Indonesian version 917 Dec-02 371 736 Management Plan Book 1, Indonesian version 391 MPAs-for-fisheries, Indonesian version 384 Jan-03 642 920 Management Plan Book 1, Indonesian version 606 Ciofi 1999 499 Feb-03 3,470 1,440 MPAs-for-fisheries, Indonesian version 546 Ciofi 1999 402 Mar-03 2,848 1,906 Management Plan Book 1, Indonesian version 1,363 MPAs-for-fisheries, Indonesian version 933 Apr-03 2,302 1,913 Management Plan Book 1, Indonesian version 1,546 MPAs-for-fisheries, Indonesian version 1,047
May-03 2,580 1,733 MPAs-for-fisheries, Indonesian version 1,302 Management Plan Book 1, Indonesian version 1,215 Jun-03 2,081 1,618 MPAs-for-fisheries, Indonesian version 972 Management Plan Book 1, Indonesian version 941
Jul-03 1,871 1,728 MPAs-for-fisheries, Indonesian version 645 San Diego Zoo course on sampling & statistics of confined populations (Indonesian) 580
Aug-03 1,915 1,722 Management Plan Book 1, Indonesian version 1,153 MPAs-for-fisheries, Indonesian version 754 Sep-03 2,592 2,220 Management Plan Book 1, Indonesian version 1,412 MPAs-for-fisheries, Indonesian version 1,385 Oct-03 2,563 2,410 MPAs-for-fisheries, Indonesian version 1,899 Management Plan Book 1, Indonesian version 1,043

48
5 Alternative livelihood development
Coastal people in the Komodo area are depend for their livelihoods on extractive resource use. The main type of fishery in Komodo is the bagan fishery for small pelagics, which takes place in coastal waters off the reef. This type of fishery is not likely to have serious, direct impact on fragile reef communities, and therefore the bagan fishery will be permitted in large areas of the Park. However, local people supplement income from the bagan fishery by exploiting reef resources, and some fishers exclusively depend on this type of fishery. As reef fishery will be restricted in the Park, some fishers will face short-term losses in income, and it is expected that only after a period of ca. five years these short term losses will be compensated by the commercial benefits generated by no-take zones through larvae export, spill-over, and risk control. To compensate these short-term losses, The Nature Conservancy implements various alternative livelihood development projects. These alternative livelihood projects aim to make fishers less dependent on exploitation of reef resources, and they serve the additional goal of providing excellent vehicles for community outreach.
Alternative livelihood projects implemented by The Nature Conservancy share the following characteristics:
- The industries that the projects aim to develop have little or no impact on the environment, and where possible they are implemented in the areas around the Park. Where necessary, environmental impact assessments are conducted and ‘best practices’ are formulated. The Nature Conservancy also works with local authorities to put in place a governance framework to keep development within the boundaries of the carrying capacity of the ecosystem.
- As most fishers have no other professional skills besides fishing, introduction of alternative livelihoods always involves a substantial training component.
- Ultimately, alternative livelihood projects should result in self-sufficient, community-based businesses. Therefore, business planning and economic feasibility assessments are always conducted.
- Introduced technologies are compatible with local conditions. This means that technologies introduced to local communities are simple, using materials that are available locally. Where more complicated technologies are introduced (as is the case for the fish culture hatchery), a competent local business partner will be involved who can sustain the project.
- Alternative livelihoods that are introduced by The Nature Conservancy aim to keep the level of investment required from the fishers as low as possible. Where substantial investment is required (as is the case for the grow-out farms in the fish culture project), fishers are offered a credit scheme.
Implementation of alternative livelihood projects starts with the formation of a group of participants. The level and nature of involvement varies between the members of the group, which is reflected in the way members share in the benefits generated by the project. The intention is for these groups to continue to function after termination of the project. Because these groups are efficient vehicles for outreach, The Nature Conservancy maintains a working relationship with these groups by providing limited organizational and administrative support.
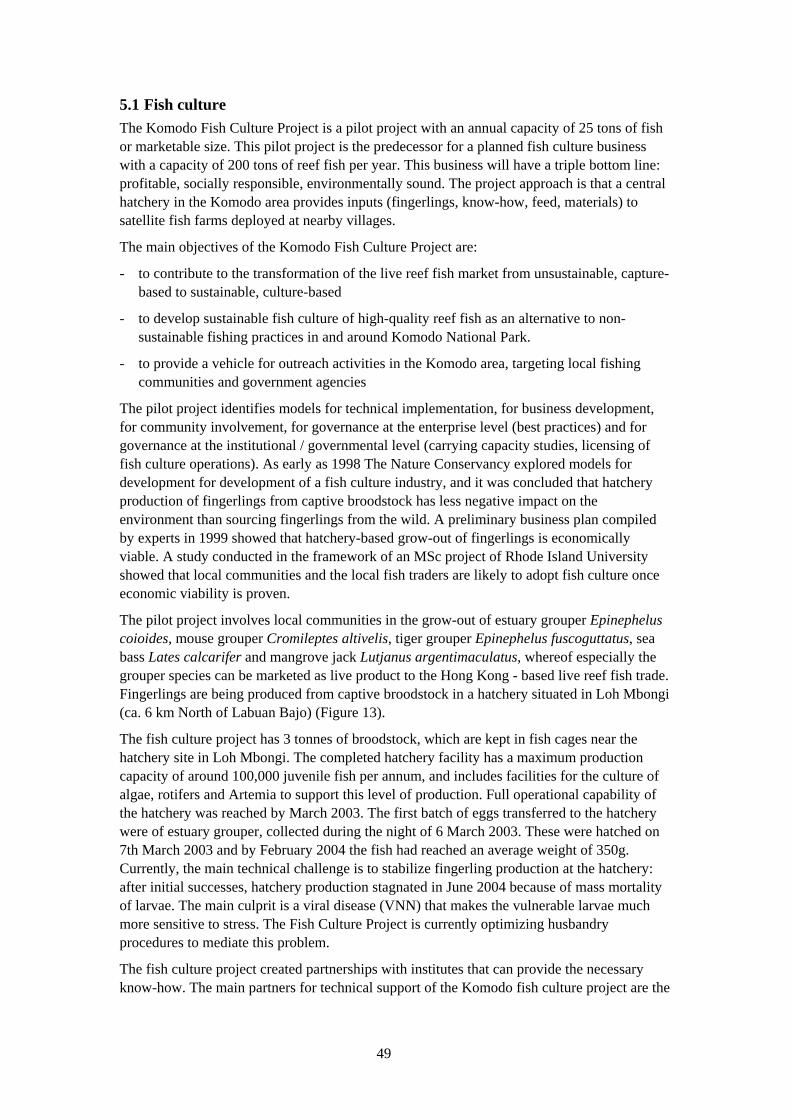
49
5.1 Fish culture The Komodo Fish Culture Project is a pilot project with an annual capacity of 25 tons of fish or marketable size. This pilot project is the predecessor for a planned fish culture business with a capacity of 200 tons of reef fish per year. This business will have a triple bottom line: profitable, socially responsible, environmentally sound. The project approach is that a central hatchery in the Komodo area provides inputs (fingerlings, know-how, feed, materials) to satellite fish farms deployed at nearby villages.
The main objectives of the Komodo Fish Culture Project are:
- to contribute to the transformation of the live reef fish market from unsustainable, capture-based to sustainable, culture-based
- to develop sustainable fish culture of high-quality reef fish as an alternative to non-sustainable fishing practices in and around Komodo National Park.
- to provide a vehicle for outreach activities in the Komodo area, targeting local fishing communities and government agencies
The pilot project identifies models for technical implementation, for business development, for community involvement, for governance at the enterprise level (best practices) and for governance at the institutional / governmental level (carrying capacity studies, licensing of fish culture operations). As early as 1998 The Nature Conservancy explored models for development for development of a fish culture industry, and it was concluded that hatchery production of fingerlings from captive broodstock has less negative impact on the environment than sourcing fingerlings from the wild. A preliminary business plan compiled by experts in 1999 showed that hatchery-based grow-out of fingerlings is economically viable. A study conducted in the framework of an MSc project of Rhode Island University showed that local communities and the local fish traders are likely to adopt fish culture once economic viability is proven.
The pilot project involves local communities in the grow-out of estuary grouper Epinephelus coioides, mouse grouper Cromileptes altivelis, tiger grouper Epinephelus fuscoguttatus, sea bass Lates calcarifer and mangrove jack Lutjanus argentimaculatus, whereof especially the grouper species can be marketed as live product to the Hong Kong - based live reef fish trade. Fingerlings are being produced from captive broodstock in a hatchery situated in Loh Mbongi (ca. 6 km North of Labuan Bajo) (Figure 13).
The fish culture project has 3 tonnes of broodstock, which are kept in fish cages near the hatchery site in Loh Mbongi. The completed hatchery facility has a maximum production capacity of around 100,000 juvenile fish per annum, and includes facilities for the culture of algae, rotifers and Artemia to support this level of production. Full operational capability of the hatchery was reached by March 2003. The first batch of eggs transferred to the hatchery were of estuary grouper, collected during the night of 6 March 2003. These were hatched on 7th March 2003 and by February 2004 the fish had reached an average weight of 350g. Currently, the main technical challenge is to stabilize fingerling production at the hatchery: after initial successes, hatchery production stagnated in June 2004 because of mass mortality of larvae. The main culprit is a viral disease (VNN) that makes the vulnerable larvae much more sensitive to stress. The Fish Culture Project is currently optimizing husbandry procedures to mediate this problem.
The fish culture project created partnerships with institutes that can provide the necessary know-how. The main partners for technical support of the Komodo fish culture project are the
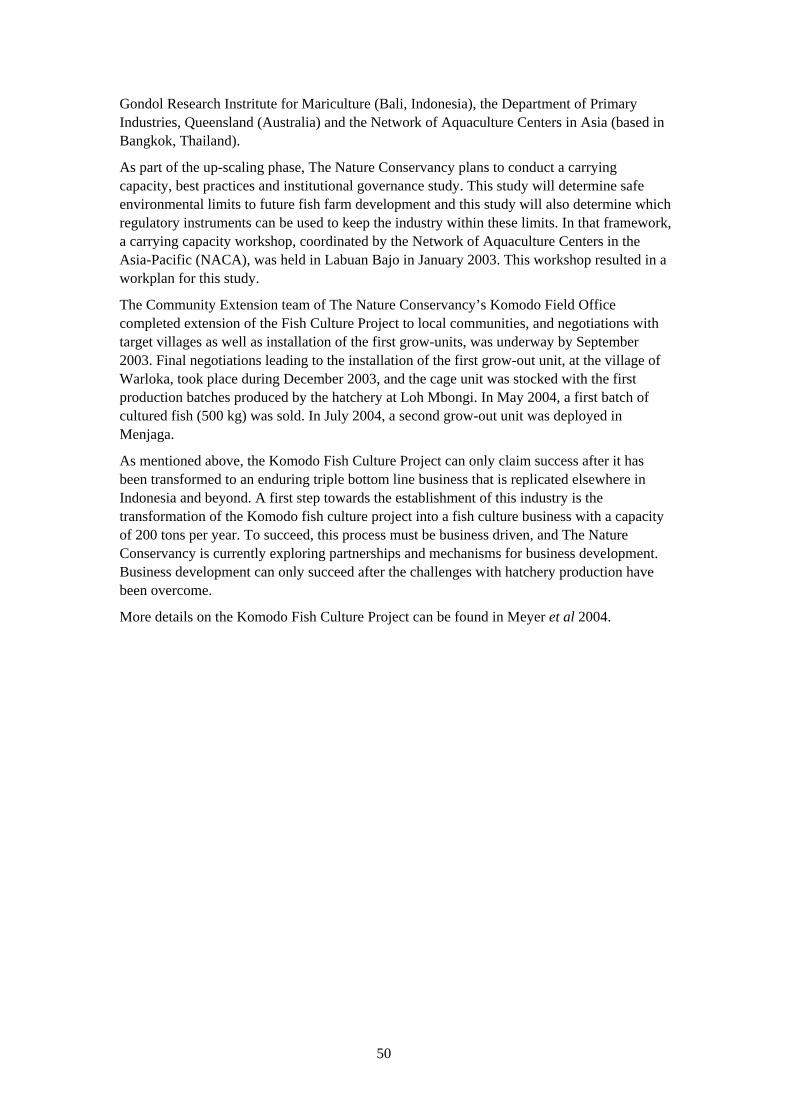
50
Gondol Research Instritute for Mariculture (Bali, Indonesia), the Department of Primary Industries, Queensland (Australia) and the Network of Aquaculture Centers in Asia (based in Bangkok, Thailand).
As part of the up-scaling phase, The Nature Conservancy plans to conduct a carrying capacity, best practices and institutional governance study. This study will determine safe environmental limits to future fish farm development and this study will also determine which regulatory instruments can be used to keep the industry within these limits. In that framework, a carrying capacity workshop, coordinated by the Network of Aquaculture Centers in the Asia-Pacific (NACA), was held in Labuan Bajo in January 2003. This workshop resulted in a workplan for this study.
The Community Extension team of The Nature Conservancy’s Komodo Field Office completed extension of the Fish Culture Project to local communities, and negotiations with target villages as well as installation of the first grow-units, was underway by September 2003. Final negotiations leading to the installation of the first grow-out unit, at the village of Warloka, took place during December 2003, and the cage unit was stocked with the first production batches produced by the hatchery at Loh Mbongi. In May 2004, a first batch of cultured fish (500 kg) was sold. In July 2004, a second grow-out unit was deployed in Menjaga.
As mentioned above, the Komodo Fish Culture Project can only claim success after it has been transformed to an enduring triple bottom line business that is replicated elsewhere in Indonesia and beyond. A first step towards the establishment of this industry is the transformation of the Komodo fish culture project into a fish culture business with a capacity of 200 tons per year. To succeed, this process must be business driven, and The Nature Conservancy is currently exploring partnerships and mechanisms for business development. Business development can only succeed after the challenges with hatchery production have been overcome.
More details on the Komodo Fish Culture Project can be found in Meyer et al 2004.
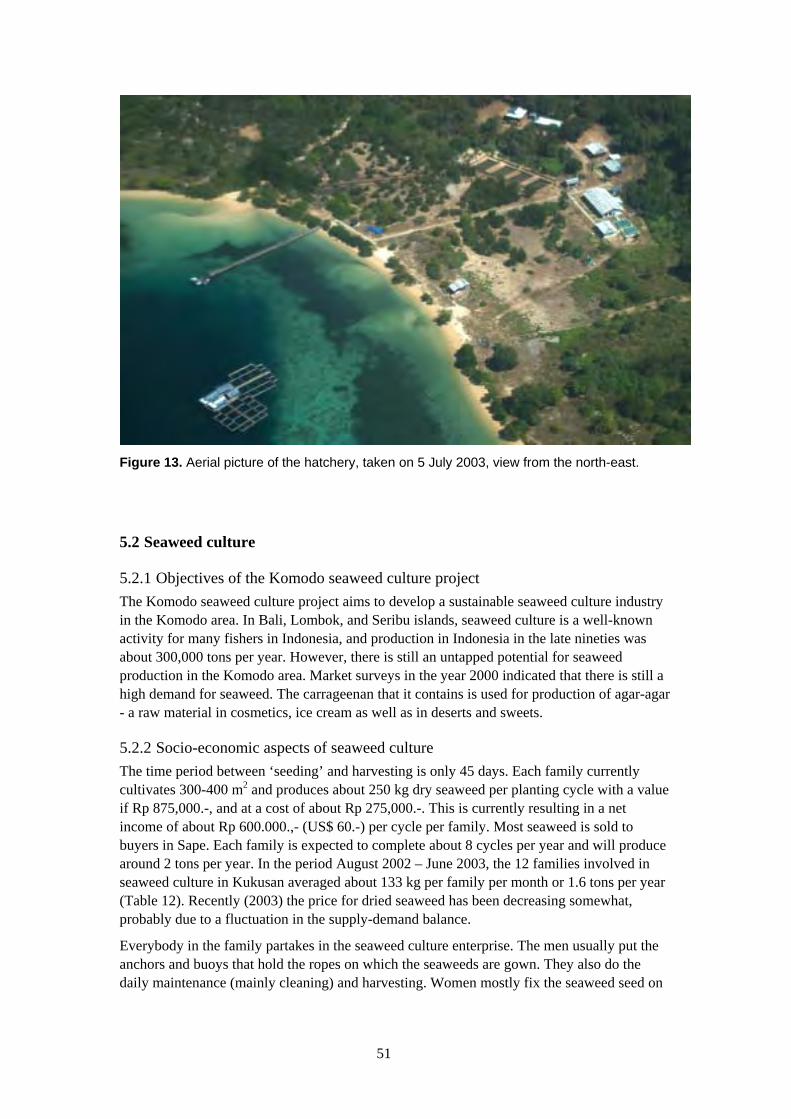
51
Figure 13. Aerial picture of the hatchery, taken on 5 July 2003, view from the north-east.
5.2 Seaweed culture
5.2.1 Objectives of the Komodo seaweed culture project The Komodo seaweed culture project aims to develop a sustainable seaweed culture industry in the Komodo area. In Bali, Lombok, and Seribu islands, seaweed culture is a well-known activity for many fishers in Indonesia, and production in Indonesia in the late nineties was about 300,000 tons per year. However, there is still an untapped potential for seaweed production in the Komodo area. Market surveys in the year 2000 indicated that there is still a high demand for seaweed. The carrageenan that it contains is used for production of agar-agar - a raw material in cosmetics, ice cream as well as in deserts and sweets.
5.2.2 Socio-economic aspects of seaweed culture The time period between ‘seeding’ and harvesting is only 45 days. Each family currently cultivates 300-400 m2 and produces about 250 kg dry seaweed per planting cycle with a value if Rp 875,000.-, and at a cost of about Rp 275,000.-. This is currently resulting in a net income of about Rp 600.000.,- (US$ 60.-) per cycle per family. Most seaweed is sold to buyers in Sape. Each family is expected to complete about 8 cycles per year and will produce around 2 tons per year. In the period August 2002 – June 2003, the 12 families involved in seaweed culture in Kukusan averaged about 133 kg per family per month or 1.6 tons per year (Table 12). Recently (2003) the price for dried seaweed has been decreasing somewhat, probably due to a fluctuation in the supply-demand balance.
Everybody in the family partakes in the seaweed culture enterprise. The men usually put the anchors and buoys that hold the ropes on which the seaweeds are gown. They also do the daily maintenance (mainly cleaning) and harvesting. Women mostly fix the seaweed seed on
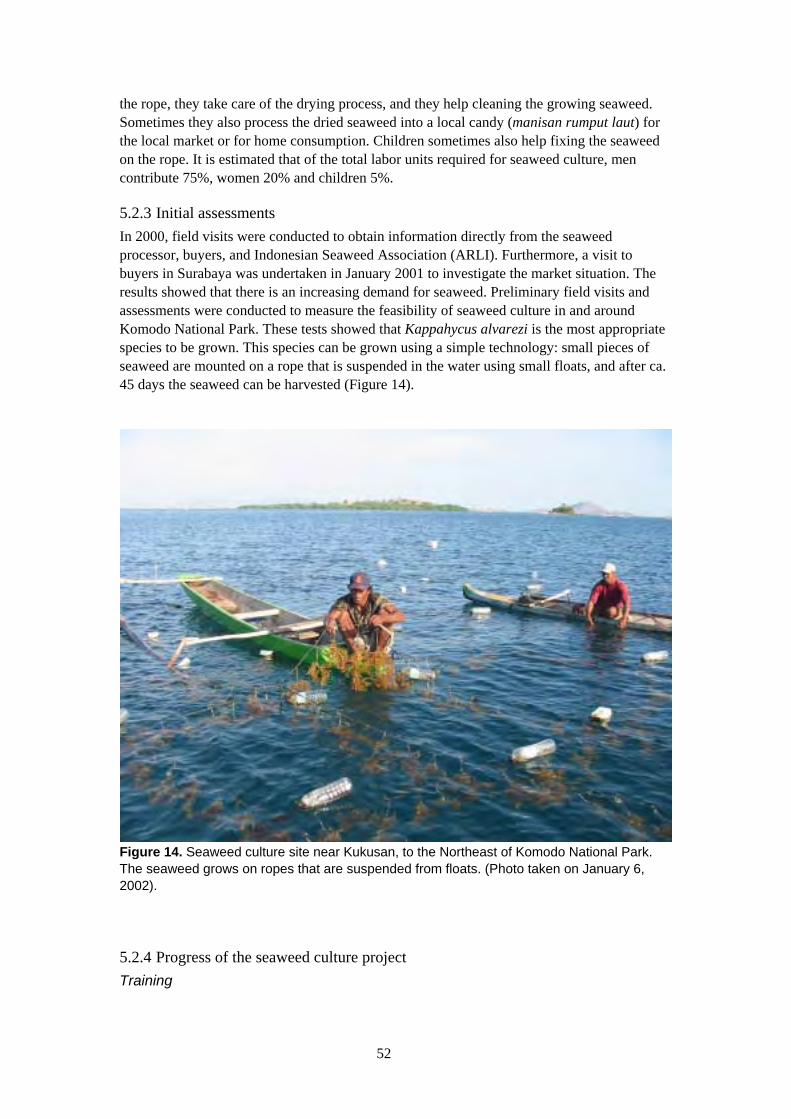
52
the rope, they take care of the drying process, and they help cleaning the growing seaweed. Sometimes they also process the dried seaweed into a local candy (manisan rumput laut) for the local market or for home consumption. Children sometimes also help fixing the seaweed on the rope. It is estimated that of the total labor units required for seaweed culture, men contribute 75%, women 20% and children 5%.
5.2.3 Initial assessments In 2000, field visits were conducted to obtain information directly from the seaweed processor, buyers, and Indonesian Seaweed Association (ARLI). Furthermore, a visit to buyers in Surabaya was undertaken in January 2001 to investigate the market situation. The results showed that there is an increasing demand for seaweed. Preliminary field visits and assessments were conducted to measure the feasibility of seaweed culture in and around Komodo National Park. These tests showed that Kappahycus alvarezi is the most appropriate species to be grown. This species can be grown using a simple technology: small pieces of seaweed are mounted on a rope that is suspended in the water using small floats, and after ca. 45 days the seaweed can be harvested (Figure 14).
5.2.4 Progress of the seaweed culture project Training
Figure 14. Seaweed culture site near Kukusan, to the Northeast of Komodo National Park. The seaweed grows on ropes that are suspended from floats. (Photo taken on January 6, 2002).
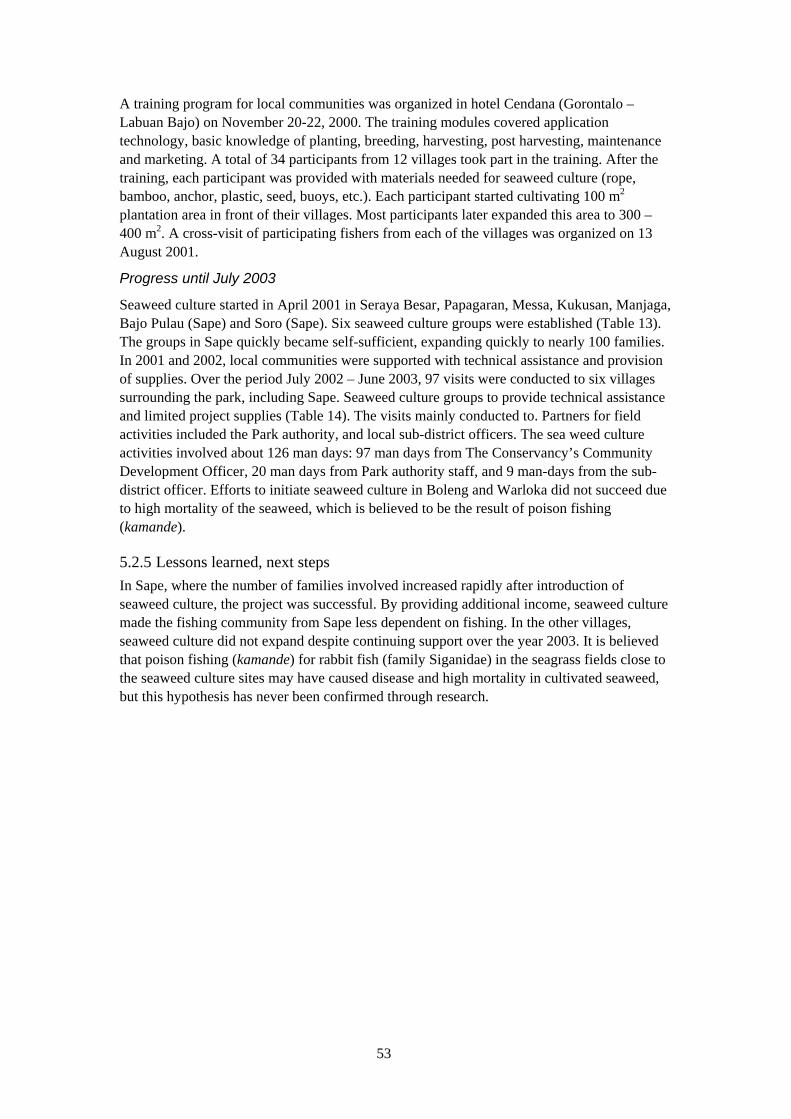
53
A training program for local communities was organized in hotel Cendana (Gorontalo – Labuan Bajo) on November 20-22, 2000. The training modules covered application technology, basic knowledge of planting, breeding, harvesting, post harvesting, maintenance and marketing. A total of 34 participants from 12 villages took part in the training. After the training, each participant was provided with materials needed for seaweed culture (rope, bamboo, anchor, plastic, seed, buoys, etc.). Each participant started cultivating 100 m2
plantation area in front of their villages. Most participants later expanded this area to 300 – 400 m2. A cross-visit of participating fishers from each of the villages was organized on 13 August 2001.
Progress until July 2003
Seaweed culture started in April 2001 in Seraya Besar, Papagaran, Messa, Kukusan, Manjaga, Bajo Pulau (Sape) and Soro (Sape). Six seaweed culture groups were established (Table 13). The groups in Sape quickly became self-sufficient, expanding quickly to nearly 100 families. In 2001 and 2002, local communities were supported with technical assistance and provision of supplies. Over the period July 2002 – June 2003, 97 visits were conducted to six villages surrounding the park, including Sape. Seaweed culture groups to provide technical assistance and limited project supplies (Table 14). The visits mainly conducted to. Partners for field activities included the Park authority, and local sub-district officers. The sea weed culture activities involved about 126 man days: 97 man days from The Conservancy’s Community Development Officer, 20 man days from Park authority staff, and 9 man-days from the sub-district officer. Efforts to initiate seaweed culture in Boleng and Warloka did not succeed due to high mortality of the seaweed, which is believed to be the result of poison fishing (kamande).
5.2.5 Lessons learned, next steps In Sape, where the number of families involved increased rapidly after introduction of seaweed culture, the project was successful. By providing additional income, seaweed culture made the fishing community from Sape less dependent on fishing. In the other villages, seaweed culture did not expand despite continuing support over the year 2003. It is believed that poison fishing (kamande) for rabbit fish (family Siganidae) in the seagrass fields close to the seaweed culture sites may have caused disease and high mortality in cultivated seaweed, but this hypothesis has never been confirmed through research.
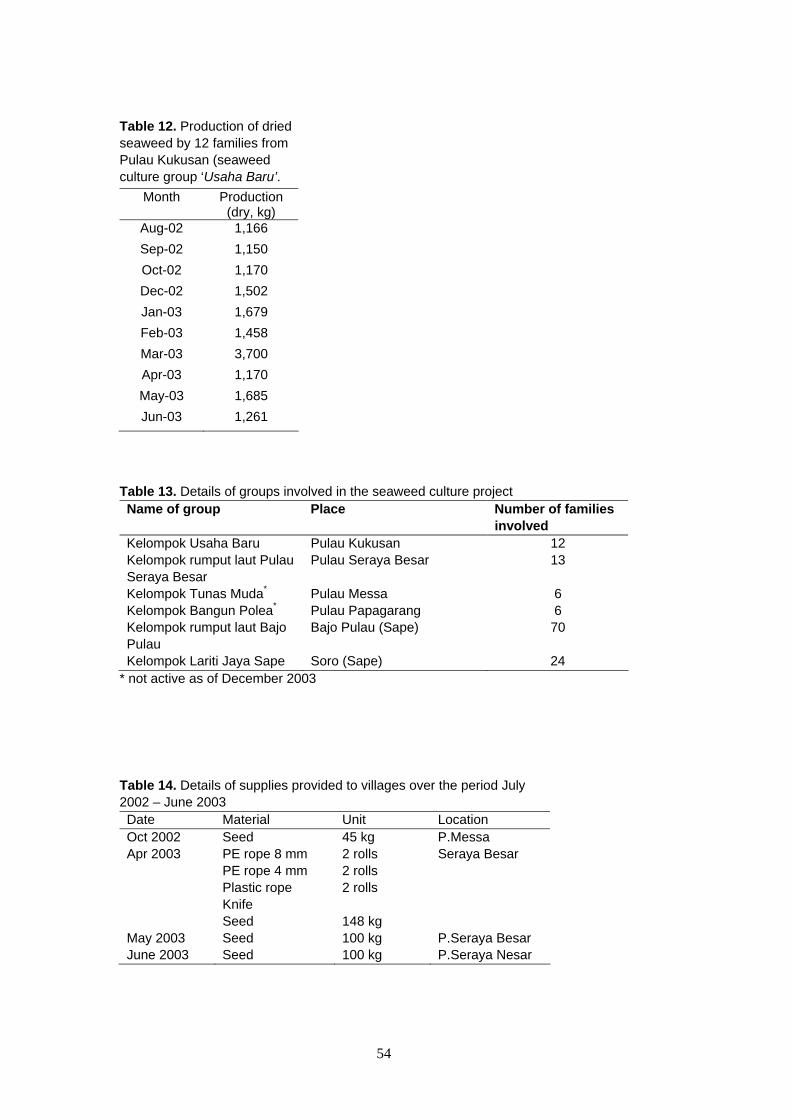
54
Table 13. Details of groups involved in the seaweed culture project Name of group Place Number of families
involved Kelompok Usaha Baru Pulau Kukusan 12 Kelompok rumput laut Pulau Seraya Besar
Pulau Seraya Besar 13
Kelompok Tunas Muda* Pulau Messa 6 Kelompok Bangun Polea* Pulau Papagarang 6 Kelompok rumput laut Bajo Pulau
Bajo Pulau (Sape) 70
Kelompok Lariti Jaya Sape Soro (Sape) 24 * not active as of December 2003
Table 14. Details of supplies provided to villages over the period July 2002 – June 2003 Date Material Unit Location Oct 2002 Seed 45 kg P.Messa Apr 2003 PE rope 8 mm
PE rope 4 mm Plastic rope Knife Seed
2 rolls 2 rolls 2 rolls 148 kg
Seraya Besar
May 2003 Seed 100 kg P.Seraya Besar June 2003 Seed 100 kg P.Seraya Nesar
Table 12. Production of dried seaweed by 12 families from Pulau Kukusan (seaweed culture group ‘Usaha Baru’.
Month Production (dry, kg)
Aug-02 1,166 Sep-02 1,150 Oct-02 1,170 Dec-02 1,502 Jan-03 1,679 Feb-03 1,458 Mar-03 3,700 Apr-03 1,170 May-03 1,685 Jun-03 1,261
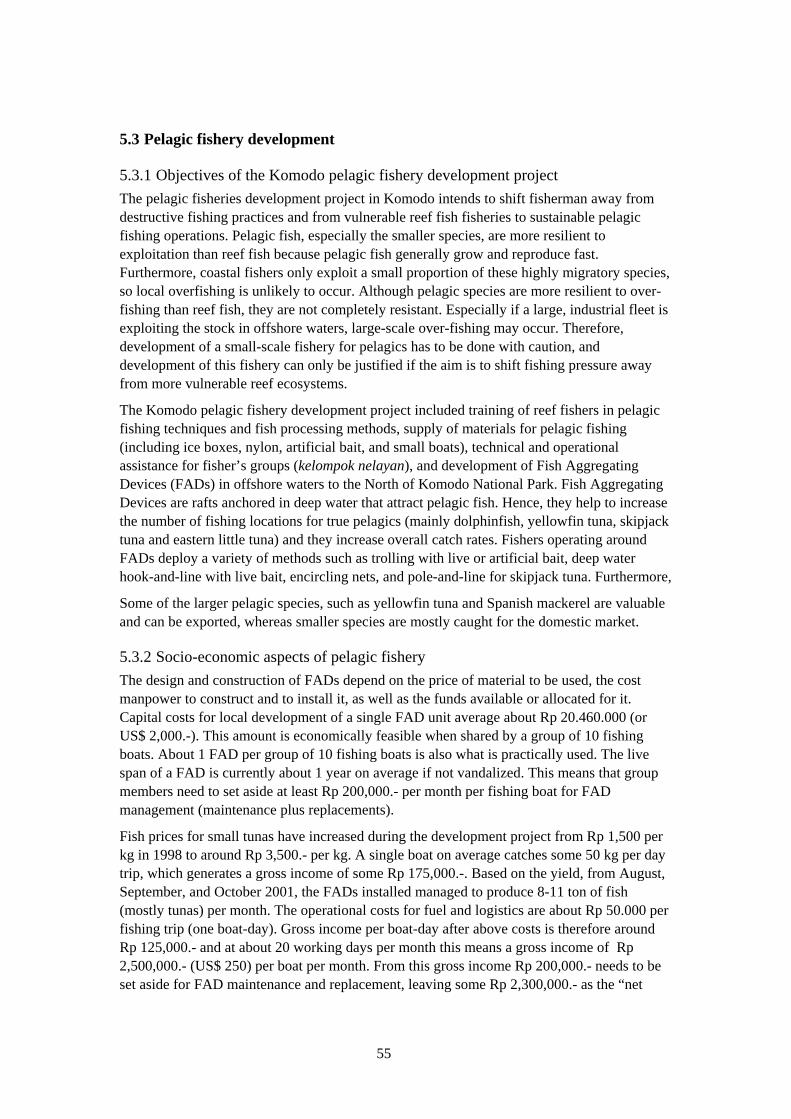
55
5.3 Pelagic fishery development
5.3.1 Objectives of the Komodo pelagic fishery development project The pelagic fisheries development project in Komodo intends to shift fisherman away from destructive fishing practices and from vulnerable reef fish fisheries to sustainable pelagic fishing operations. Pelagic fish, especially the smaller species, are more resilient to exploitation than reef fish because pelagic fish generally grow and reproduce fast. Furthermore, coastal fishers only exploit a small proportion of these highly migratory species, so local overfishing is unlikely to occur. Although pelagic species are more resilient to over-fishing than reef fish, they are not completely resistant. Especially if a large, industrial fleet is exploiting the stock in offshore waters, large-scale over-fishing may occur. Therefore, development of a small-scale fishery for pelagics has to be done with caution, and development of this fishery can only be justified if the aim is to shift fishing pressure away from more vulnerable reef ecosystems.
The Komodo pelagic fishery development project included training of reef fishers in pelagic fishing techniques and fish processing methods, supply of materials for pelagic fishing (including ice boxes, nylon, artificial bait, and small boats), technical and operational assistance for fisher’s groups (kelompok nelayan), and development of Fish Aggregating Devices (FADs) in offshore waters to the North of Komodo National Park. Fish Aggregating Devices are rafts anchored in deep water that attract pelagic fish. Hence, they help to increase the number of fishing locations for true pelagics (mainly dolphinfish, yellowfin tuna, skipjack tuna and eastern little tuna) and they increase overall catch rates. Fishers operating around FADs deploy a variety of methods such as trolling with live or artificial bait, deep water hook-and-line with live bait, encircling nets, and pole-and-line for skipjack tuna. Furthermore,
Some of the larger pelagic species, such as yellowfin tuna and Spanish mackerel are valuable and can be exported, whereas smaller species are mostly caught for the domestic market.
5.3.2 Socio-economic aspects of pelagic fishery The design and construction of FADs depend on the price of material to be used, the cost manpower to construct and to install it, as well as the funds available or allocated for it. Capital costs for local development of a single FAD unit average about Rp 20.460.000 (or US$ 2,000.-). This amount is economically feasible when shared by a group of 10 fishing boats. About 1 FAD per group of 10 fishing boats is also what is practically used. The live span of a FAD is currently about 1 year on average if not vandalized. This means that group members need to set aside at least Rp 200,000.- per month per fishing boat for FAD management (maintenance plus replacements).
Fish prices for small tunas have increased during the development project from Rp 1,500 per kg in 1998 to around Rp 3,500.- per kg. A single boat on average catches some 50 kg per day trip, which generates a gross income of some Rp 175,000.-. Based on the yield, from August, September, and October 2001, the FADs installed managed to produce 8-11 ton of fish (mostly tunas) per month. The operational costs for fuel and logistics are about Rp 50.000 per fishing trip (one boat-day). Gross income per boat-day after above costs is therefore around Rp 125,000.- and at about 20 working days per month this means a gross income of Rp 2,500,000.- (US$ 250) per boat per month. From this gross income Rp 200,000.- needs to be set aside for FAD maintenance and replacement, leaving some Rp 2,300,000.- as the “net

56
income” which can be compared with incomes from other fisheries but from which boat maintenance still needs to be deducted. At 3 persons per boat crew this amounts to some Rp 750,000.- per crew member per month (although sharing systems vary with different ownership systems). For comparison with destructive fishing practices such as blasting and cyanide fishing estimates of income are used of about Rp 700,000.- per month per local fisher. Income in the demersal fisheries is estimated at Rp 600.000,- per month per fisher. The above figures were estimated during recent field interviews and although very rough estimates they show the competitiveness of the new fisheries.
5.3.3 Initial assessments A pilot study and assessment on the feasibility of the development of pelagic fisheries in the Komodo area was carried out in September - October 1996 (Gillett 1996). This pilot study, which was carried out by an expert consultant, concluded that there are very good opportunities for the development of a fishery for large coastal pelagic species and especially for Spanish mackerel (Scomberomorus commerson) fishery. The pilot study specifically mentioned:
- Positive indications for both catch rates and biological potential, - Established fish traders in Indonesia are willing to purchase Spanish mackerel at prices
which are likely to encourage fishermen to enter the fishery, - Because the market is for high quality products, relatively small amounts of the fish could
result in adequate revenue to the fishermen, - The gear required for Spanish mackerel fishing is quite simple and inexpensive, - The vessels presently operated by local villagers are suitable for the type of fishing
required, - The targeted pelagic resource is far more resilient than reef fish resources, which are
vulnerable to local over-exploitation (due to limited migration), and - Examples in other areas have shown promising results with former dynamite fishermen
successfully converting to pelagic fisheries (i.e. Makassar, Sape).
Only very few fishermen from the Komodo area were involved in pelagic fisheries until 1997, although a variety of pelagic species, with relatively high prices on remote markets, were abundant in and around the Komodo area. The reason why only very few fishermen from the Komodo area were interested in pelagic fisheries was that they:
- earned very attractive incomes by exploiting the demersal resources inside Komodo National Park, especially in the cyanide fishery for live reef fish,
- were not prosecuted for illegal fishing practices, - were insufficiently skilled in the fishery for large coastal pelagic species, and - lacked the skills and resources to build and use pelagic FADs.
In June 1998, a short survey was conducted among fish buyers in Bali to assess the market situation for Spanish mackerel.
5.3.4 Progress of the pelagic fishery development project Training
The project included a three-month training program for fishermen conducted in 1999. The training program was carried out by expert contractors from the fishery sector. Fishers from Sumatra provided training on construction of traditional FADs and skipjack tuna fishing; fishers from Flores provided training on live and dead bait still-fishing, fishers from Sulawesi
57
provided training on artificial bait trolling, and fishers from Sape provided training natural bait trolling. The training program for fishing communities also contained a post-harvest component, covering a variety of techniques from fish handling onboard to fish processing on shore. In early 2001, an additional training for fishers was organized, wherein a total of 70 crews with their boats participated.
There is considerable potential for the production of various kinds of processed fish, even though a large portion of the catch is destined for sale as a fresh chilled product. Therefore, the project has trained 25 women on Pulau Mesa and Pulau Seraya, ranging in age from 17 to 37 years old to prepare pengasinan (dried salted fish), pindang (salty boiled fish), ikan kayu (katsuobushi), dendeng (fish jerky), and abon (shredded fish jerky). Furthermore, two seaweed-processing techniques were taught to the participants. The project also supplied some of the basic tools. The post-harvest and fish-processing training team completed its curriculum in October 1999. By introducing these 'new' value-added products, the fishing communities now have a better chance of increasing their income in the pelagic fishery.
Progress until June 2002
The first FADs, seven for deep-water (1,000 – 1,200 m) and five for shallow-water (70 – 100 m), were deployed in April – May 1999 (Figure 15, Figure 16, Figure 17, Figure 18, Figure 19). Shallow-water FADs proved less efficient, and were not replaced after loss. In April-May 2000 five deepwater FADs were installed in waters of ca. 800 m deep North to Seraya to replace lost FADs. Some of the FADs were lost as a result of the fishing operation of purse seine boats from Sulawesi, who detached the raft of the FAD from its mooring line in order to set their encircling nets. These fishers were operating without any license from the local government, and after project staff brought this to the attention of government officials six illegally operating purse seiners were apprehended and sent back to Sulawesi. Furthermore, a more professional management system, including continuous guarding of the FADs, has been implemented in close cooperation with local government agencies since 2001. After this, loss of FADs because of illegal fishing operations did not occur any more. In early 2001, local fishers (Seraya Besar) installed 2 additional FADs. In 2001 three deepwater FADs were installed to the Northwest of Komodo National Park, near Banta Island, to accommodate fishers from Sape.
In 1999, an initial number of 40 local boats have been equipped with insulated ice boxes and basic gears to catch large pelagic species in 1999. Furthermore, three large land-based ice boxes for storage were donated to three villages. The fishery for Spanish mackerel, which is independent of FADs, developed quickly, and the fishery become self-sufficient soon after the project started. By the year 2000, no further effort was allocated to the development of this lucrative fishery. In 2001, 159 fishers from the Sub-District of Komodo (fisher group ‘Harapan Keluarga’, later split up in ‘Harapan Keluarga’ and ‘Harapan Baru’) and 153 fishers from Sub-District Sape (fisher group ‘Banta Jaya’) were engaged in pelagic fisheries activities. These fishers together operated a fleet of some 100 boats of which 30 to 40 were full time engaged in pelagic fisheries at the FADs. Fishers from other villages (Mesa, Papagaran and Sape) were also involved, but as these fishers did not form more formal groups, it is unknown to which extent they continued to be involved in the fishery for pelagics.
In 2000, project staff reached an agreement with fish buying company Pt Usaha Mina who brought cold storage vessel ‘Cakalang’ to Labuan Bajo to buy fish from project fishermen and others. Because catches from local fishers were irregular in that period, ‘Cakalang’ operated only for some months in the Komodo area. In 2001, a cold storage for fisheries products with
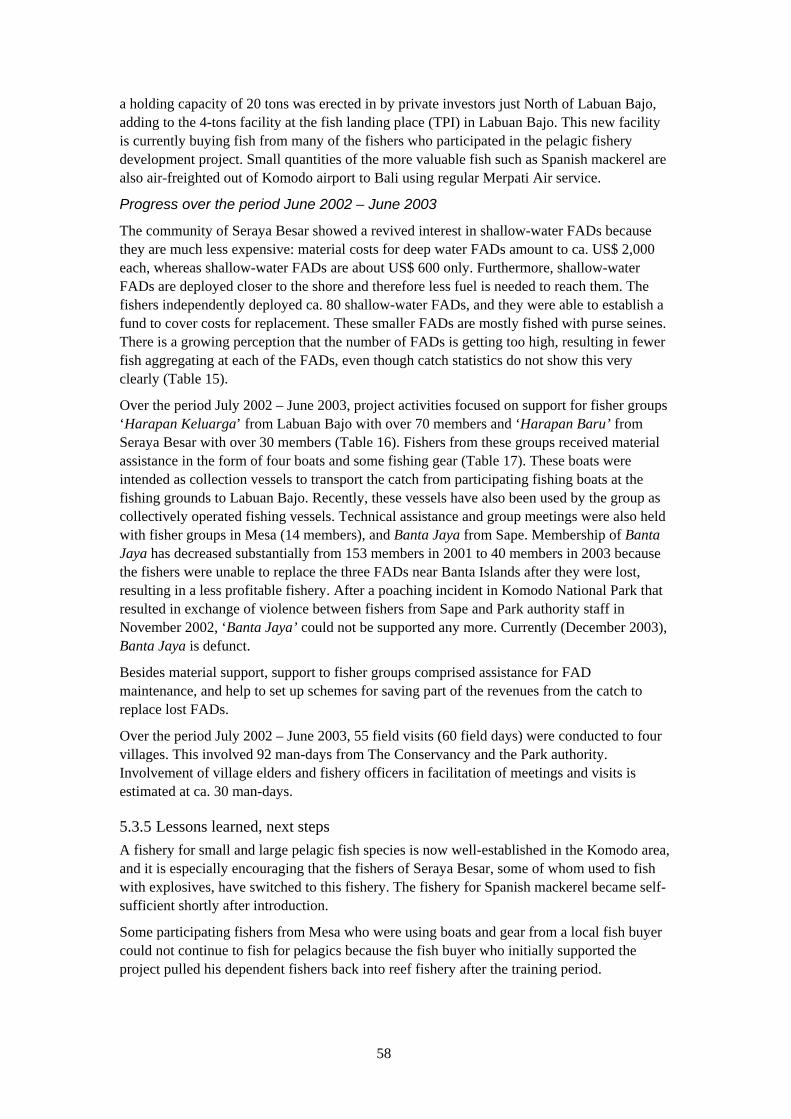
58
a holding capacity of 20 tons was erected in by private investors just North of Labuan Bajo, adding to the 4-tons facility at the fish landing place (TPI) in Labuan Bajo. This new facility is currently buying fish from many of the fishers who participated in the pelagic fishery development project. Small quantities of the more valuable fish such as Spanish mackerel are also air-freighted out of Komodo airport to Bali using regular Merpati Air service.
Progress over the period June 2002 – June 2003
The community of Seraya Besar showed a revived interest in shallow-water FADs because they are much less expensive: material costs for deep water FADs amount to ca. US$ 2,000 each, whereas shallow-water FADs are about US$ 600 only. Furthermore, shallow-water FADs are deployed closer to the shore and therefore less fuel is needed to reach them. The fishers independently deployed ca. 80 shallow-water FADs, and they were able to establish a fund to cover costs for replacement. These smaller FADs are mostly fished with purse seines. There is a growing perception that the number of FADs is getting too high, resulting in fewer fish aggregating at each of the FADs, even though catch statistics do not show this very clearly (Table 15).
Over the period July 2002 – June 2003, project activities focused on support for fisher groups ‘Harapan Keluarga’ from Labuan Bajo with over 70 members and ‘Harapan Baru’ from Seraya Besar with over 30 members (Table 16). Fishers from these groups received material assistance in the form of four boats and some fishing gear (Table 17). These boats were intended as collection vessels to transport the catch from participating fishing boats at the fishing grounds to Labuan Bajo. Recently, these vessels have also been used by the group as collectively operated fishing vessels. Technical assistance and group meetings were also held with fisher groups in Mesa (14 members), and Banta Jaya from Sape. Membership of Banta Jaya has decreased substantially from 153 members in 2001 to 40 members in 2003 because the fishers were unable to replace the three FADs near Banta Islands after they were lost, resulting in a less profitable fishery. After a poaching incident in Komodo National Park that resulted in exchange of violence between fishers from Sape and Park authority staff in November 2002, ‘Banta Jaya’ could not be supported any more. Currently (December 2003), Banta Jaya is defunct.
Besides material support, support to fisher groups comprised assistance for FAD maintenance, and help to set up schemes for saving part of the revenues from the catch to replace lost FADs.
Over the period July 2002 – June 2003, 55 field visits (60 field days) were conducted to four villages. This involved 92 man-days from The Conservancy and the Park authority. Involvement of village elders and fishery officers in facilitation of meetings and visits is estimated at ca. 30 man-days.
5.3.5 Lessons learned, next steps A fishery for small and large pelagic fish species is now well-established in the Komodo area, and it is especially encouraging that the fishers of Seraya Besar, some of whom used to fish with explosives, have switched to this fishery. The fishery for Spanish mackerel became self-sufficient shortly after introduction.
Some participating fishers from Mesa who were using boats and gear from a local fish buyer could not continue to fish for pelagics because the fish buyer who initially supported the project pulled his dependent fishers back into reef fishery after the training period.
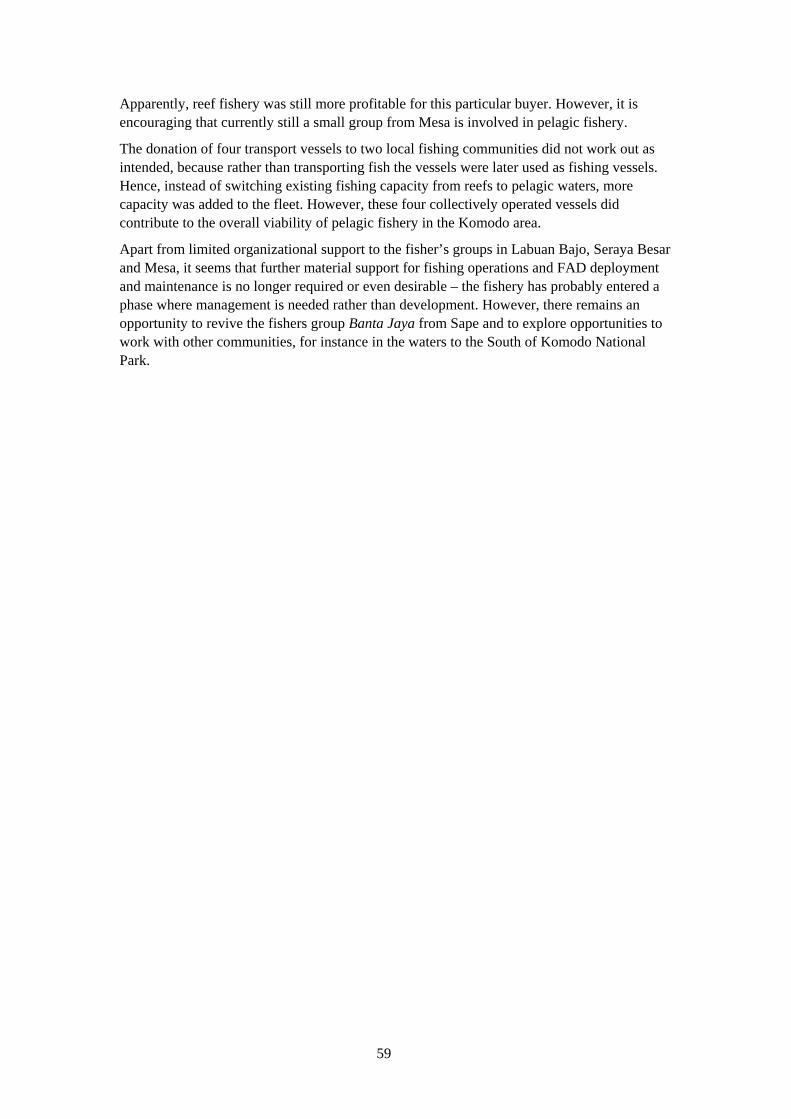
59
Apparently, reef fishery was still more profitable for this particular buyer. However, it is encouraging that currently still a small group from Mesa is involved in pelagic fishery.
The donation of four transport vessels to two local fishing communities did not work out as intended, because rather than transporting fish the vessels were later used as fishing vessels. Hence, instead of switching existing fishing capacity from reefs to pelagic waters, more capacity was added to the fleet. However, these four collectively operated vessels did contribute to the overall viability of pelagic fishery in the Komodo area.
Apart from limited organizational support to the fisher’s groups in Labuan Bajo, Seraya Besar and Mesa, it seems that further material support for fishing operations and FAD deployment and maintenance is no longer required or even desirable – the fishery has probably entered a phase where management is needed rather than development. However, there remains an opportunity to revive the fishers group Banta Jaya from Sape and to explore opportunities to work with other communities, for instance in the waters to the South of Komodo National Park.
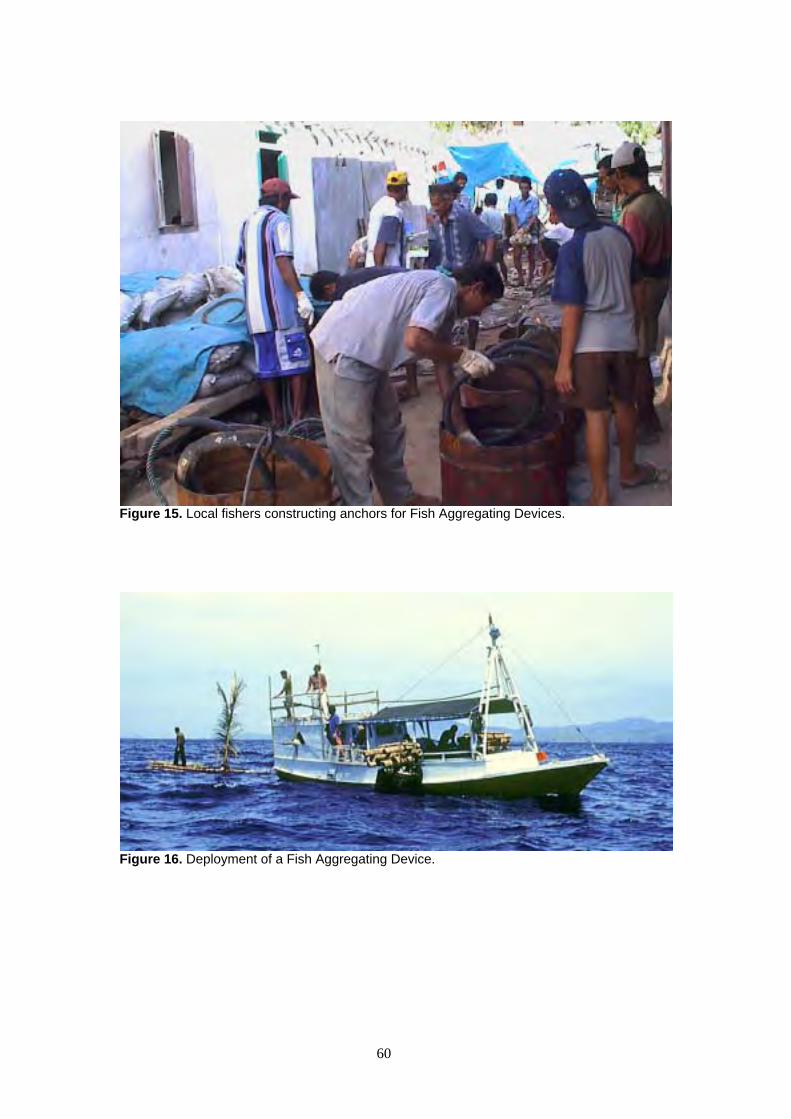
60
Figure 15. Local fishers constructing anchors for Fish Aggregating Devices.
Figure 16. Deployment of a Fish Aggregating Device.
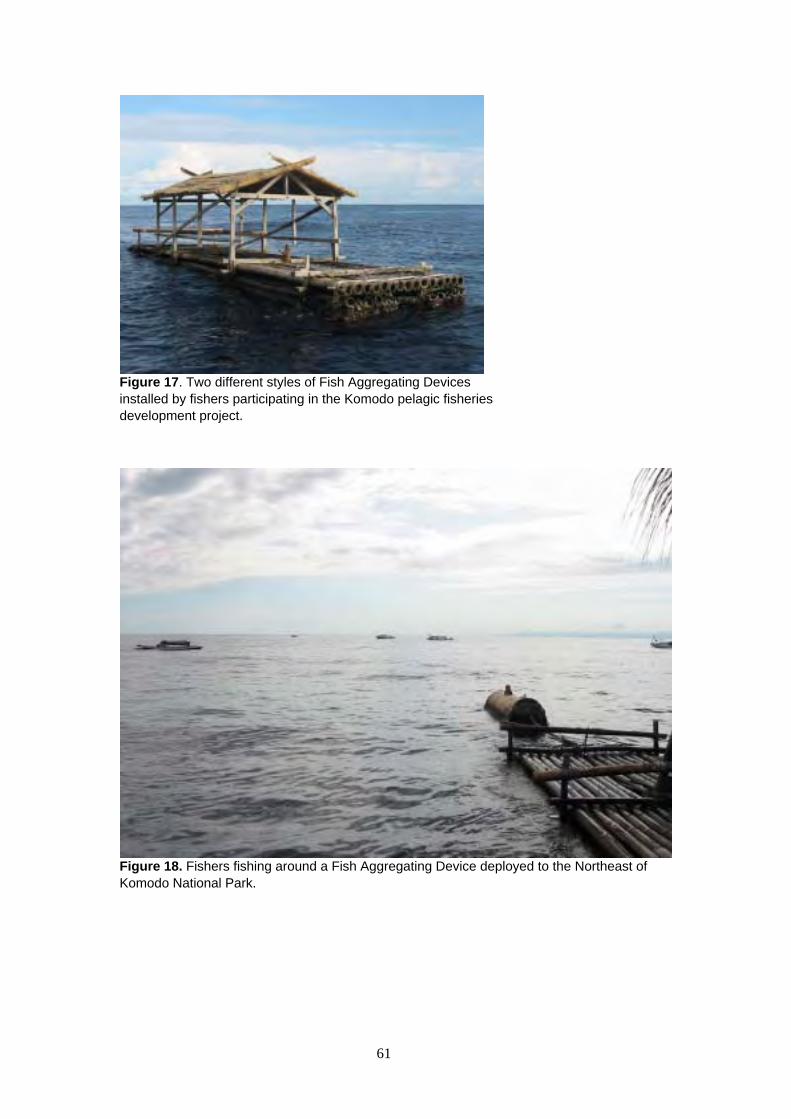
61
Figure 17. Two different styles of Fish Aggregating Devices installed by fishers participating in the Komodo pelagic fisheries development project.
Figure 18. Fishers fishing around a Fish Aggregating Device deployed to the Northeast of Komodo National Park.

62
Figure 19. Diver below a Fish Aggregating Device, surrounded by fusiliers (Caesionidae) (left). Weighing tuna that were caught around the Fish Aggregating Devices to the North of Komodo National Park (right).
Table 15. Catch statistics from fisher’s groups Harapan Keluarga and Harapan Baru. The catch realized with hand lines mostly comprises large-sized pelagics whereas the purse seine catches consist of small-sized pelagics, hence the difference in average price.
month gear number of
FADs in operation
catch volume (kg)
average price per kg (Rp)
July 2002 hand line 2 7,000 2,850 Aug hand line 2 6,300 3,500 Sep hand line 2 6,300 3,500
hand line 2 1,500 3,000 Oct purse seine 5 15,000 2,500
hand line 2 2,100 3,000 Nov purse seine 20 20,000 2,500
Dec purse seine 2 8,800 2,500 Mar 2003 purse seine 40 25,000 2,500
Apr purse seine 60 30,000 2,500 May purse seine 80 40,000 2,500 June purse seine 80 20,000 2,500
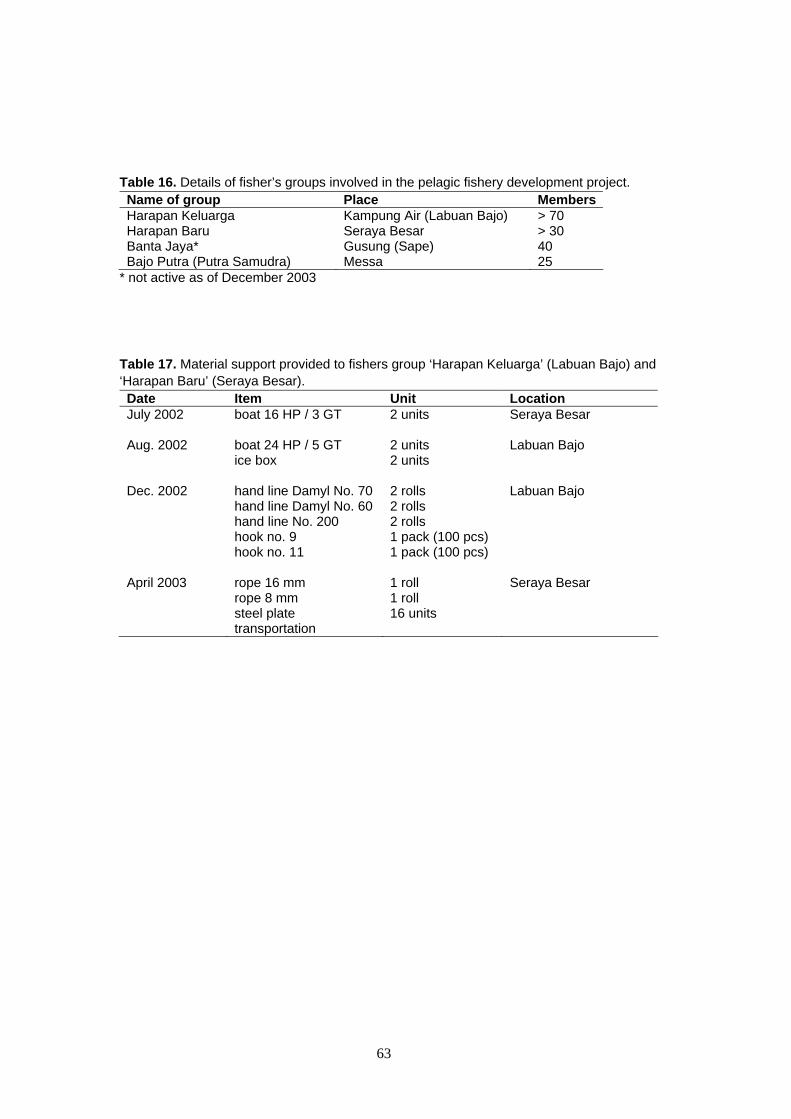
63
Table 16. Details of fisher’s groups involved in the pelagic fishery development project. Name of group Place Members Harapan Keluarga Kampung Air (Labuan Bajo) > 70 Harapan Baru Seraya Besar > 30 Banta Jaya* Gusung (Sape) 40 Bajo Putra (Putra Samudra) Messa 25
* not active as of December 2003
Table 17. Material support provided to fishers group ‘Harapan Keluarga’ (Labuan Bajo) and ‘Harapan Baru’ (Seraya Besar). Date Item Unit Location July 2002 boat 16 HP / 3 GT 2 units
Seraya Besar
Aug. 2002 boat 24 HP / 5 GT ice box
2 units 2 units
Labuan Bajo
Dec. 2002 hand line Damyl No. 70 hand line Damyl No. 60 hand line No. 200 hook no. 9 hook no. 11
2 rolls 2 rolls 2 rolls 1 pack (100 pcs) 1 pack (100 pcs)
Labuan Bajo
April 2003 rope 16 mm rope 8 mm steel plate transportation
1 roll 1 roll 16 units
Seraya Besar
64
5.4 Miscellaneous alternative livelihood development projects Over the period July 2002 – June 20003, a range of smaller alternative livelihood projects were implemented: - wood carving for villagers from Kampung Komodo (23 participants) - sewing and weaving for women from Kampung Komodo (8 participants) - production of home-made cakes for women from Mesa (3 participants) and Papagaran (4
participants) - book keeping and limited material support for a fishers group from Kampung Ujung,
Labuan Bajo (18 participants).
5.4.1 Wood carving Villagers from Kampung Komodo have been involved in carving of Komodo dragons since the early seventies, when an American tourist asked a local carpenter to carve a wooden dragon to take home as a souvenir (). In these early days, the quality of the carvings was not very good. To increase the quality of the carvings, The Nature Conservancy and the Park authority invited skilled carvers from Bali to train a group of villagers from Kampung Komodo in basic carving techniques. Currently, the quality of most carvings is excellent.
Of concern is use of wood illegally harvested from the Park or originating from rainforests elsewhere in Indonesia. Furthermore, villagers sometimes approach potential buyers (visitors) in an unprofessional and annoying manner, thereby degrading the experience of visitors and ultimately harming their own interests. The second issue is being dealt with by conducting meetings where villagers are explained how to approach visitors. Furthermore, the Park authority made a space available where locals can sell souvenirs near the main entrance gate of Loh Liang (Komodo) and there is an unwritten agreement that visitors can only be approached in that space. The first issue is more difficult to address. Project staff did explain that it is ultimately in the carver’s own interest to keep the Park in good condition by refraining from cutting wood for raw material, but there are no mechanisms to check the origin of the wood that was used for the carving. Furthermore, if the carvers buy wood from traders they can only take their word about the origin of the purchased wood. However, the positive effect of providing additional income to local fishing communities outweighs the possible negative effect of contribution to deforestation, especially considering that the price structure of high-quality carvings is determined to a significant degree by skill and labor rather than by the cost of raw material.
Over the period July 2002 – June 2003, a group established comprising 23 carvers who were interested to improve the quality of their product and of their marketing skills. Project staff from The Nature Conservancy and the Park authority conducted meetings with this group at least twice each month. A training session was organized where the most senior carver of the group trained junior members. Two sets of carving tools (40 pieces each) were donated to the group. Furthermore, the group was introduced to the District Small-Scale Industrial Service, a governmental agency that can help to promote the product in markets beyond the Komodo area. A savings system was set up to collectively buy raw materials.
All field activities were done implemented with the Park authority. Furthermore, two senior carvers were involved in organization and implementation of field activities. Total effort invested in support of the wood carving group was ca. 75 man days, including staff of The

65
Conservancy’s Komodo Field Office, Park rangers, the village head, sub-district officer, and the two senior wood carvers.
Figure 20. Wood carver at Kampung Komodo.
Figure 21. Villagers from Kampung Komodo selling carved Komodo dragons to visitors in Loh Liang, the main entrance gate to Komodo National Park.
5.4.2 Sewing The women in the fishing community of Kampung Komodo supplement household income with collection of tamarind and ‘meting’, or collection of shellfish, sea cucumber and other valuable species from shallow reefs during low tide. This practice can do severe damage to the sensitive reef flats in the Park, especially if crow bars are used to break open the corals. Therefore, a start was made to implement alternative livelihood projects that specifically
66
target women in the fishing community, so that households become less dependent on extractive resource use for their income.
The women of Kampung Komodo are well-positioned to produce for the souvenir trade taking place at the main gate of Komodo National Park, at walking distance from their village. One option is to produce traditional woven cloth (kain) embroidered with motives inspired on Komodo National Park. The district of Manggarai of which Komodo is part is famous for its woven cloth. However, the women from Kampung Komodo lacked the skills and materials needed for sewing. Therefore, a small group of eight women was established to introduce sewing of souvenirs to the community of Kampung Komodo.
This women’s group (Batu Tiga) was supported in the following ways: - In June 2002, five women from the group received training on sewing in Ruteng, one of
the main production centers for traditional cloth. In January 2003, six women received follow-up training in Kampung Komodo.
- Group meetings were held every month, discussing how the Park authority and The Conservancy can support the group
- The group received two sewing machines, three packs of traditional cloth for sewing to the group to initiate the sewing activity, on August 2002
The group has been able to set up a savings system, and the group purchased three additional sewing machines from income generated by product sales. Roughly, each group member added Rp 300,000 / month to their household income from sewing.
6 Monitoring and research
6.1 Introduction Monitoring has been a vital component of Komodo’s multi-faceted conservation program, which has helped identify where management has been successful (measuring success) as well as identifying areas that require further attention (adaptive management). In addition, monitoring contributes to enhanced field presence of Park staff, which prevents illegal resource use. Finally, monitoring has also proven to greatly support outreach – often, findings by the monitoring team bring the Komodo National Park marine conservation program in the spotlight.
Various monitoring programs have been implemented over recent years, focusing not only on vulnerable species and ecosystems (including coral reefs), but also on resource use by humans. The coral reef monitoring program has been conducted since 1996, aiming to gather spatial and temporal information on coral reef health and reef recovery both inside and outside the Park. It was designed to provide insights in management effectiveness, trading off biological detail to spatial coverage. The fish monitoring program focuses on spawning aggregations of groupers and Napoleon wrasse, species that are extremely vulnerable to over-fishing and that can be used as an indicator for the status of the Park’s fish stocks. These species are targeted by the Hong Kong-based trade in live reef fish. Resource use monitoring helped to identify who is doing what, where and when in the Park.
Besides aforementioned long-term monitoring program, a number of short-term monitoring programs and assessments were conducted.

67
6.2 Coral monitoring The Conservancy’s Komodo Field Office has been carrying out a comprehensive coral monitoring program since 1996. The protocol for the monitoring program is simple, requiring only a minimum amount of training. At three depths (4 m, 8 m, and 12 m) observers make five repeated swims of each four minutes. After each swim, the observer stops and records on underwater paper his cover estimates for four major bottom types: live hard coral; dead hard coral; soft coral; and other (rock, sand, sponges, tunicates, algae, weeds, anemones, clams, etc.). In total 185 sites inside and around the Park are surveyed. The program is repeated every 2nd year, and before each monitoring period the team comprising TNC field staff and Park rangers take ca. 2 weeks to practice the observation techniques together with ‘veterans’ of earlier monitoring periods. The survey sites are fixed, and they are located by the team with a GPS receiver. Because of the relatively large distance covered during the swims, the results are robust to deviations caused by inaccuracies in positioning of the survey sites. After each monitoring period, the team prepares a survey report, where the coverage live hard coral is the most important statistic.
The coral monitoring program demonstrated that inside the park, average live hard coral cover gradually increased with 60% from 15 m2 per 100 m2 reef in 1996 to 24 m2 per 100 m2 reef in 2004 (Table 18, Figure 23), and a more detailed statistical analysis showed that this increase was statistically significant (ANOVA on arcsine-transformed values, P<0.05). However, outside the Park hard coral cover dropped from 25 m2 per 100 m2 to 17 m2 per 100 m2 over the years 2000-2002 after an initial increase over the years 1996-2000. It is possible that a Crown-Of-Thorns Starfish outbreak in the waters to the Northeast of the Park (see Section 4.3.3 above) and continued blast fishing around an island situated to the Northwest of the Park caused this pattern, but more detailed analysis will need to be performed to confirm this hypothesis.
The coral monitoring program has been very instrumental to demonstrate the effectiveness of improved management, especially if the results are combined with other observations. Park rangers were keeping records of the number of blast incidents they heard while staying at the ranger posts inside the Park. Though these data are only available for the year 1996, they clearly show that incidence of blast fishing decreased dramatically after implementation of an enhanced surveillance program (see Figure 22). So the coral monitoring program and the observations by the Park rangers combined show that a major threat was curbed resulting in recovery of the Park’s reefs. This program shows the value of long-term monitoring and managers can now state confidently that most of the damage to the reefs has been by blast fishing and that the reefs recover rapidly when the damaging practices are stopped.
In addition to the straightforward benefits from monitoring the reef, several secondary benefits of monitoring have emerged. For example, monitoring teams function as the eyes and ears of management as they are out in Park waters on a daily basis, and contribute considerably to the prevention and detection of illegal activities in the Park. Hence, the presence of monitoring teams to some extent reduces the need for costly patrols by surveillance vessels. The constant presence in the Park of a monitoring team also helps to detect biological events that are not strictly the focus of this particular monitoring program, such as coral bleaching and crown-of-thorns starfish outbreaks. Finally, sharing of monitoring results helps to maintain a close working relationship with Park rangers, patrol and enforcement teams and local communities.

68
Table 18. Summary of results from the coral monitoring program. Coverage with live hard coral, expressed as coverage in m2 per 100 m2 bottom. Year Inside the Park Outside the Park 1996 15 17 1998 19 23 2000 19 25 2002 24 17
Jan Feb Mar Apr May Jun Jul Aug Sep Oct Nov Dec
Month
0
6
12
18
24
30
Num
ber o
f inc
iden
ts
12
20
10
16
9
21 1
31 1
ad hoc anti-dynamite operations
before May 1996
28 May 1996, start of routine
(weekly) patrolling program
Figure 22. Trend in number of blast fishing incidents per month in Komodo National Park over the period January 1996 – December 1996. After implementation of the speedboat patrol program, blast fishing incidence dropped dramatically. Currently, blast fishing incidence is very low.
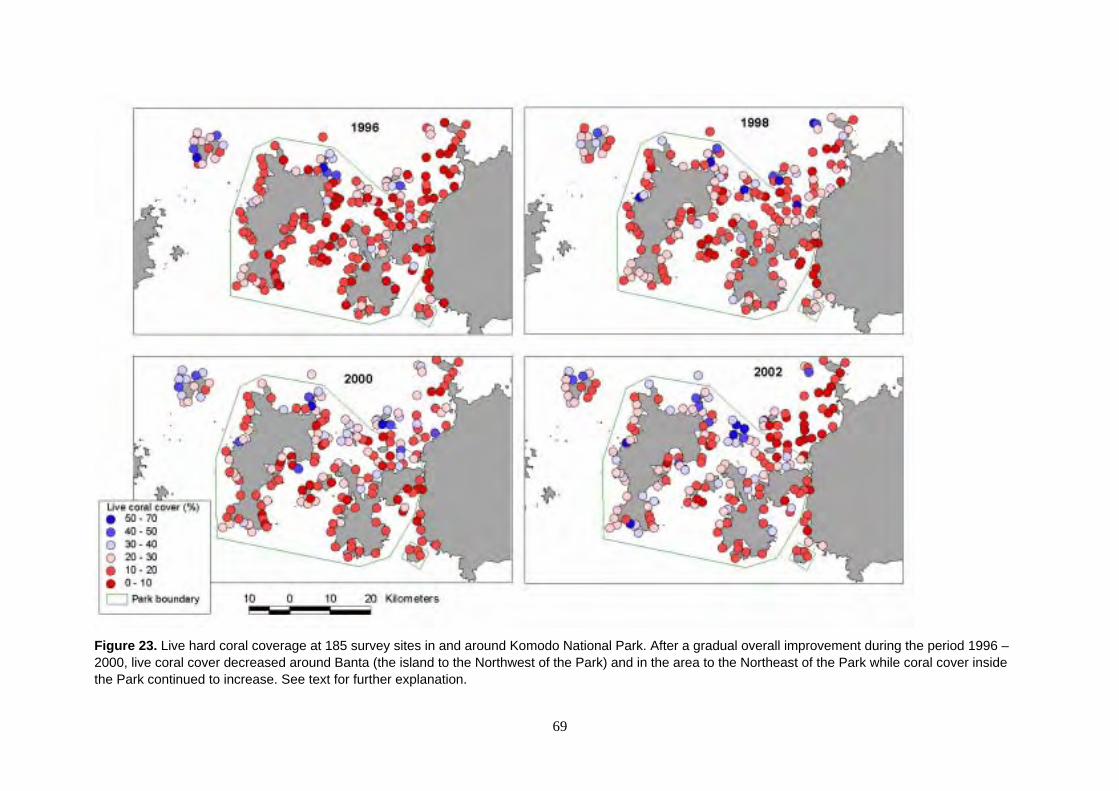
69
Figure 23. Live hard coral coverage at 185 survey sites in and around Komodo National Park. After a gradual overall improvement during the period 1996 –2000, live coral cover decreased around Banta (the island to the Northwest of the Park) and in the area to the Northeast of the Park while coral cover inside the Park continued to increase. See text for further explanation.
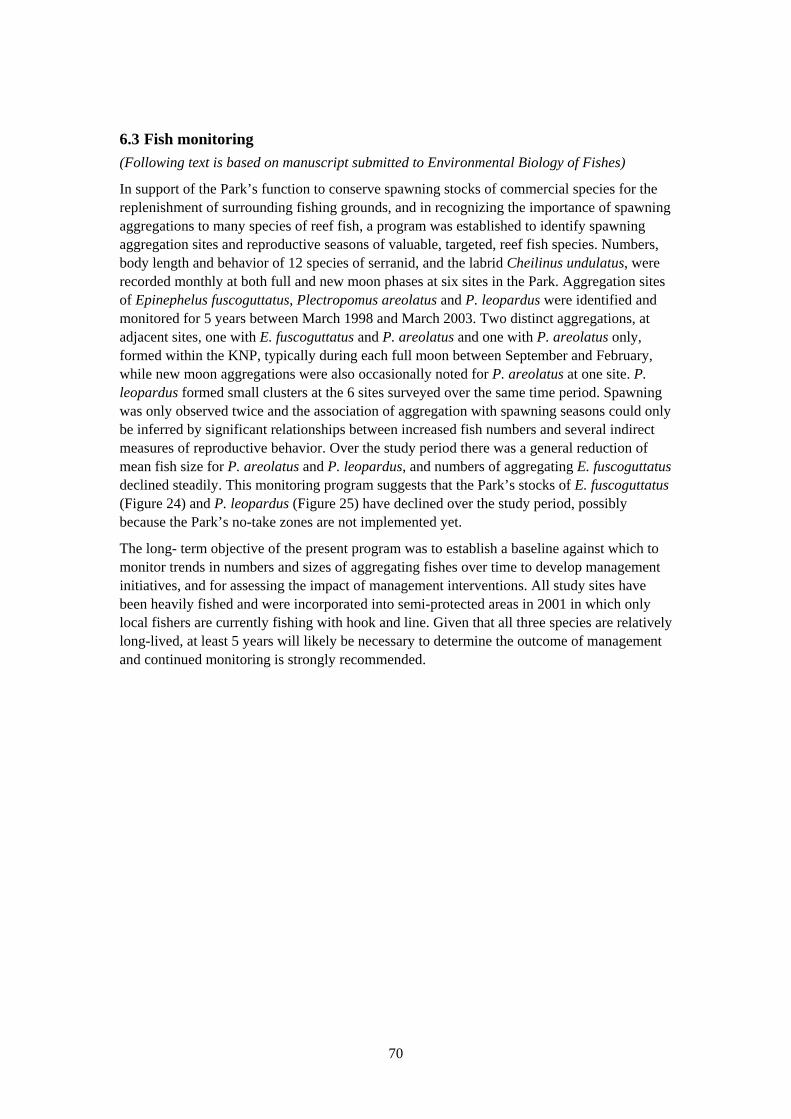
70
6.3 Fish monitoring (Following text is based on manuscript submitted to Environmental Biology of Fishes)
In support of the Park’s function to conserve spawning stocks of commercial species for the replenishment of surrounding fishing grounds, and in recognizing the importance of spawning aggregations to many species of reef fish, a program was established to identify spawning aggregation sites and reproductive seasons of valuable, targeted, reef fish species. Numbers, body length and behavior of 12 species of serranid, and the labrid Cheilinus undulatus, were recorded monthly at both full and new moon phases at six sites in the Park. Aggregation sites of Epinephelus fuscoguttatus, Plectropomus areolatus and P. leopardus were identified and monitored for 5 years between March 1998 and March 2003. Two distinct aggregations, at adjacent sites, one with E. fuscoguttatus and P. areolatus and one with P. areolatus only, formed within the KNP, typically during each full moon between September and February, while new moon aggregations were also occasionally noted for P. areolatus at one site. P. leopardus formed small clusters at the 6 sites surveyed over the same time period. Spawning was only observed twice and the association of aggregation with spawning seasons could only be inferred by significant relationships between increased fish numbers and several indirect measures of reproductive behavior. Over the study period there was a general reduction of mean fish size for P. areolatus and P. leopardus, and numbers of aggregating E. fuscoguttatus declined steadily. This monitoring program suggests that the Park’s stocks of E. fuscoguttatus (Figure 24) and P. leopardus (Figure 25) have declined over the study period, possibly because the Park’s no-take zones are not implemented yet.
The long- term objective of the present program was to establish a baseline against which to monitor trends in numbers and sizes of aggregating fishes over time to develop management initiatives, and for assessing the impact of management interventions. All study sites have been heavily fished and were incorporated into semi-protected areas in 2001 in which only local fishers are currently fishing with hook and line. Given that all three species are relatively long-lived, at least 5 years will likely be necessary to determine the outcome of management and continued monitoring is strongly recommended.
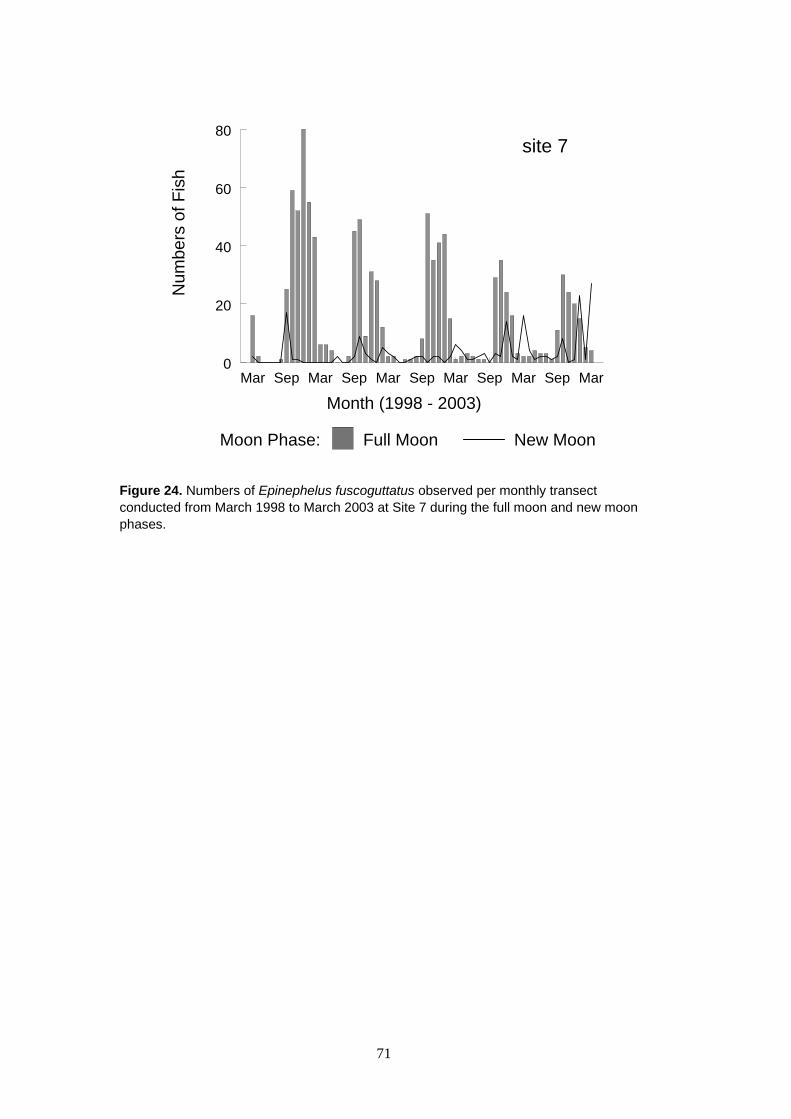
71
Moon Phase: Full Moon New Moon
Month (1998 - 2003)Mar Sep Mar Sep Mar Sep Mar Sep Mar Sep Mar
0
20
40
60
80site 7
Num
bers
of F
ish
Figure 24. Numbers of Epinephelus fuscoguttatus observed per monthly transect conducted from March 1998 to March 2003 at Site 7 during the full moon and new moon phases.
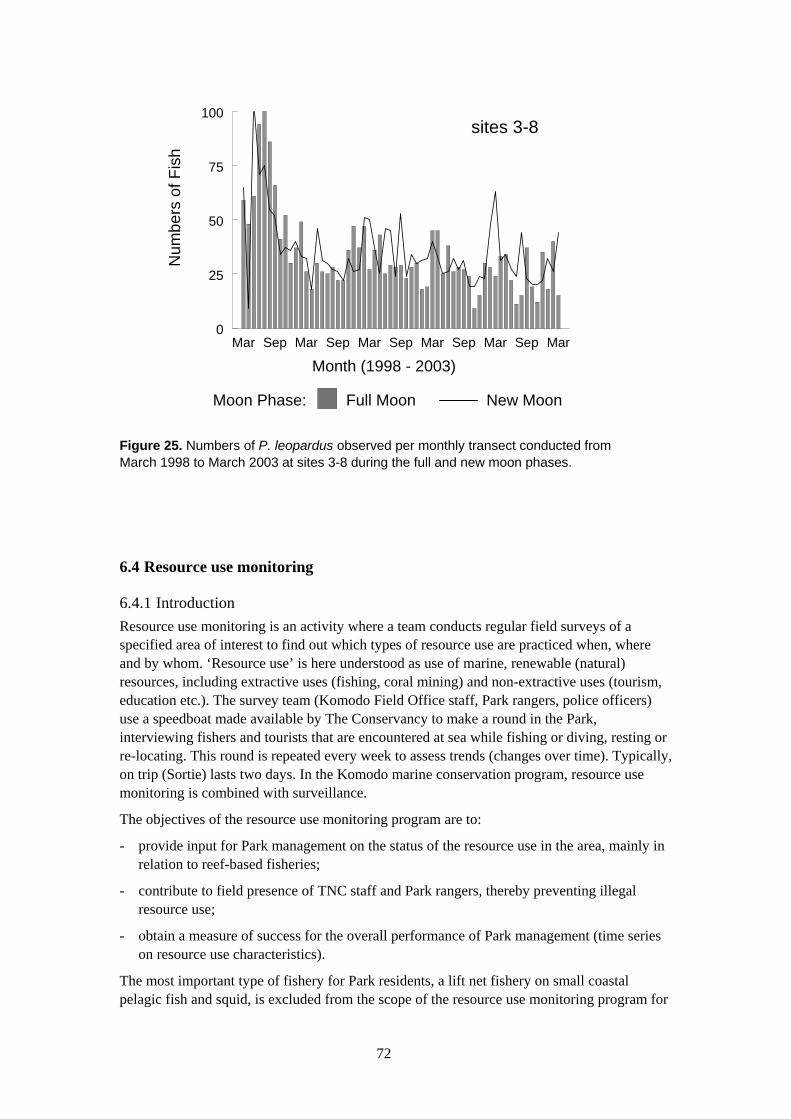
72
Moon Phase: Full Moon New Moon
Month (1998 - 2003)Mar Sep Mar Sep Mar Sep Mar Sep Mar Sep Mar
0
25
50
75
100sites 3-8
Num
bers
of F
ish
Figure 25. Numbers of P. leopardus observed per monthly transect conducted from March 1998 to March 2003 at sites 3-8 during the full and new moon phases.
6.4 Resource use monitoring
6.4.1 Introduction Resource use monitoring is an activity where a team conducts regular field surveys of a specified area of interest to find out which types of resource use are practiced when, where and by whom. ‘Resource use’ is here understood as use of marine, renewable (natural) resources, including extractive uses (fishing, coral mining) and non-extractive uses (tourism, education etc.). The survey team (Komodo Field Office staff, Park rangers, police officers) use a speedboat made available by The Conservancy to make a round in the Park, interviewing fishers and tourists that are encountered at sea while fishing or diving, resting or re-locating. This round is repeated every week to assess trends (changes over time). Typically, on trip (Sortie) lasts two days. In the Komodo marine conservation program, resource use monitoring is combined with surveillance.
The objectives of the resource use monitoring program are to:
- provide input for Park management on the status of the resource use in the area, mainly in relation to reef-based fisheries;
- contribute to field presence of TNC staff and Park rangers, thereby preventing illegal resource use;
- obtain a measure of success for the overall performance of Park management (time series on resource use characteristics).
The most important type of fishery for Park residents, a lift net fishery on small coastal pelagic fish and squid, is excluded from the scope of the resource use monitoring program for
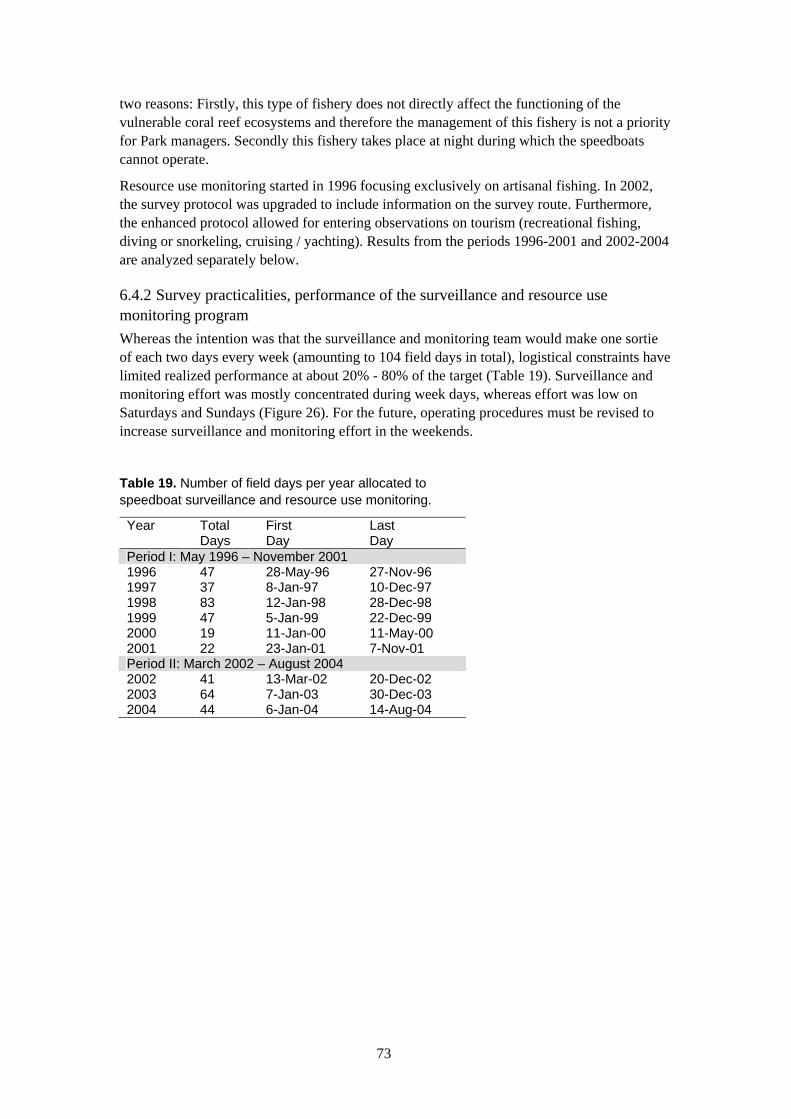
73
two reasons: Firstly, this type of fishery does not directly affect the functioning of the vulnerable coral reef ecosystems and therefore the management of this fishery is not a priority for Park managers. Secondly this fishery takes place at night during which the speedboats cannot operate.
Resource use monitoring started in 1996 focusing exclusively on artisanal fishing. In 2002, the survey protocol was upgraded to include information on the survey route. Furthermore, the enhanced protocol allowed for entering observations on tourism (recreational fishing, diving or snorkeling, cruising / yachting). Results from the periods 1996-2001 and 2002-2004 are analyzed separately below.
6.4.2 Survey practicalities, performance of the surveillance and resource use monitoring program Whereas the intention was that the surveillance and monitoring team would make one sortie of each two days every week (amounting to 104 field days in total), logistical constraints have limited realized performance at about 20% - 80% of the target (Table 19). Surveillance and monitoring effort was mostly concentrated during week days, whereas effort was low on Saturdays and Sundays (Figure 26). For the future, operating procedures must be revised to increase surveillance and monitoring effort in the weekends.
Table 19. Number of field days per year allocated to speedboat surveillance and resource use monitoring.
Year Total Days
First Day
Last Day
Period I: May 1996 – November 2001 1996 47 28-May-96 27-Nov-96 1997 37 8-Jan-97 10-Dec-97 1998 83 12-Jan-98 28-Dec-98 1999 47 5-Jan-99 22-Dec-99 2000 19 11-Jan-00 11-May-00 2001 22 23-Jan-01 7-Nov-01 Period II: March 2002 – August 2004 2002 41 13-Mar-02 20-Dec-02 2003 64 7-Jan-03 30-Dec-03 2004 44 6-Jan-04 14-Aug-04
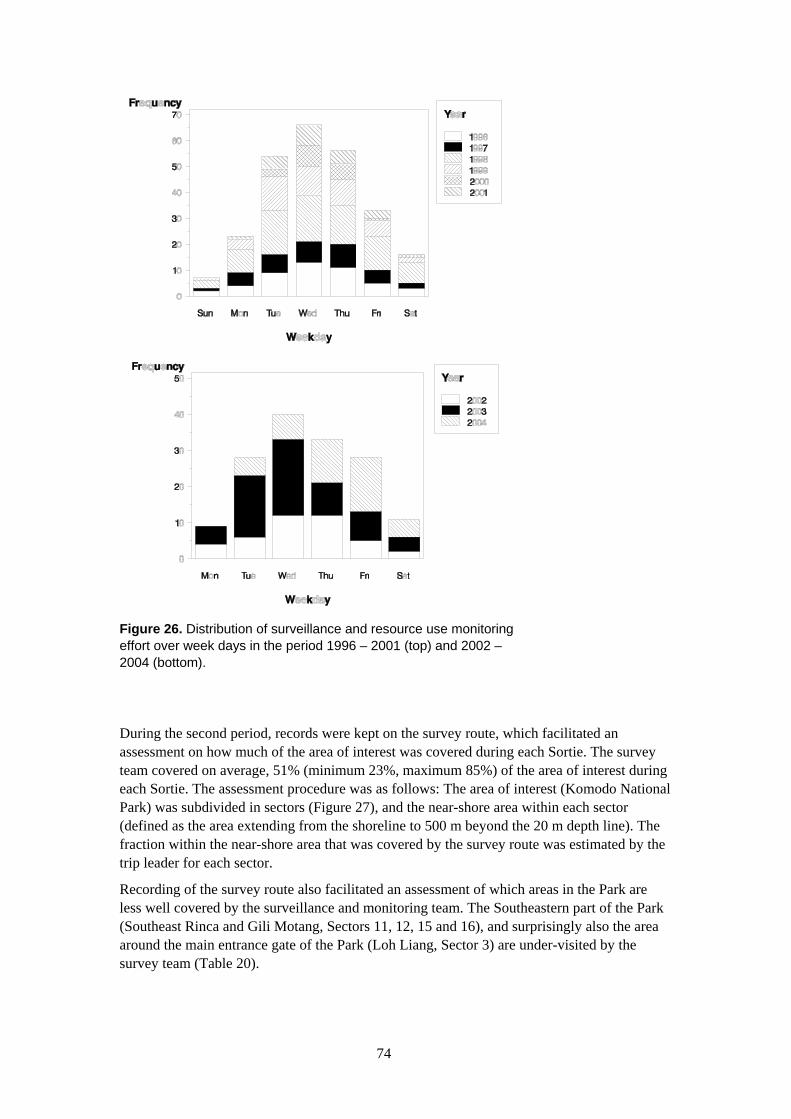
74
Figure 26. Distribution of surveillance and resource use monitoring effort over week days in the period 1996 – 2001 (top) and 2002 – 2004 (bottom).
During the second period, records were kept on the survey route, which facilitated an assessment on how much of the area of interest was covered during each Sortie. The survey team covered on average, 51% (minimum 23%, maximum 85%) of the area of interest during each Sortie. The assessment procedure was as follows: The area of interest (Komodo National Park) was subdivided in sectors (Figure 27), and the near-shore area within each sector (defined as the area extending from the shoreline to 500 m beyond the 20 m depth line). The fraction within the near-shore area that was covered by the survey route was estimated by the trip leader for each sector.
Recording of the survey route also facilitated an assessment of which areas in the Park are less well covered by the surveillance and monitoring team. The Southeastern part of the Park (Southeast Rinca and Gili Motang, Sectors 11, 12, 15 and 16), and surprisingly also the area around the main entrance gate of the Park (Loh Liang, Sector 3) are under-visited by the survey team (Table 20).
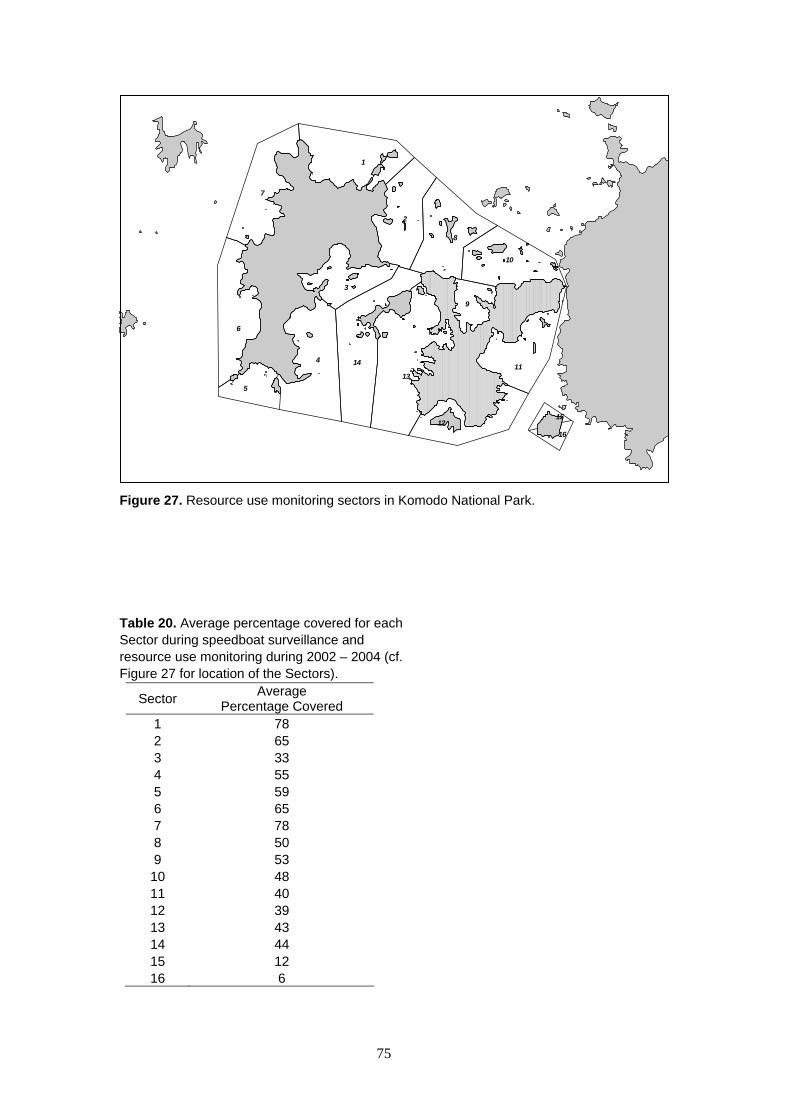
75
Figure 27. Resource use monitoring sectors in Komodo National Park.
Table 20. Average percentage covered for each Sector during speedboat surveillance and resource use monitoring during 2002 – 2004 (cf. Figure 27 for location of the Sectors).
Sector Average Percentage Covered
1 78 2 65 3 33 4 55 5 59 6 65 7 78 8 50 9 53 10 48 11 40 12 39 13 43 14 44 15 12 16 6
4
1
8
6
7
2
13
3
14
10
11
5
12
9
16
15
76
During the period 2002-2004, other resources besides fishing were monitored as well (Table 21). The level of use by marine tourism seems low compared to artisanal fishing, but anecdotal information and personal observations suggest that the monitoring program severely under-estimates use of the Park by tourist vessels (cruising or carrying divers) and recreational fishers. For example, there are now at least two sport fishing charter vessels operational in the Park that visit the Park almost daily (especially South Padar). It is a matter of concern that these sport-fishing vessels are often seen fishing in no-take zones.
Table 21. Frequency of occurrence of different types of resource use during a total of 82 surveillance and resource use monitoring trips.
Type of resource use Year 2002 Year 2003 Year 2004
artisanal fishing 523 710 696
recreational fishing (angling)
4 2 1
dive tourism 20 20 24
cruising 12 0 1
6.4.3 Characteristics of the artisanal fishery in Komodo National Park The origin of reef fishers encountered in the Park varies between years (Figure 28). Over the period 1996 – 2001, the contribution of reef fishers from Kampung Komodo decreased, whereas this percentage increased over the period 2002 – 2004. Also the contribution of fishers from Kampung Rinca and Kampung Kerora (both inside the Park) increased over the period 2002 – 2004, after having declined over the period 1996 – 2001. The village Papagaran focuses almost exclusively on the bagan (lift net) fishery and contributes little to the effort of reef fishery in the Park. The percentage of resource users from the three villages closest to the Park, Warloka, Golohmori and Mesa, is approximately stable throughout the period 1996 – 2004, whereas the contribution of Labuan Bajo and Seraya (to the Northeast of the Park) increased from 2001 – 2004. Fishers from Sape, who in the period 1996 – 2001 realized most of the reef fishing effort in the Park, contributed much less to the fishing effort in the period 2002 – 2004. In conclusion, the reef fishery in recent years (2002 – 2004) is increasingly dominated by Park residents and fishers living around the Park, whereas fishers from Sape now contribute much less to the reef fishery effort. The increasing contribution of resident fishers to the total fishing effort suggests that a management strategy of granting ‘exclusive use rights’ to resident fishers by itself will not keep the effort within the constraints of the Park’s carrying capacity. Therefore, implementation of the Park’s no-take zones in combination of a licensing system for resident fishers is required to guarantee sustained use.
Throughout the period 1996 – 2004, hook-and-line and gillnetting remained the dominant fishing methods practiced in Komodo National Park (Figure 29). Over the years 2002-2004, these methods comprised 80% of the reef fishing effort observed. During the years 2000 and 2001, most fishers encountered by the survey team were bottom hook-and-lining. Fishing using hookah compressors, a destructive gear, virtually disappeared after the local government outlawed it in 2000. Over the period 2002-2004, reef gleaning seems to have gained in importance.
77
Villages tend to have specific portfolios of fishing methods that can differ strongly between villages, even in a relatively small area such as Komodo (Figure 30). Whereas fishers from Kampung Komodo focused on reef gleaning during 1996 – 2001, their portfolio of fishing methods was more diverse in 2002 – 2004; especially the relative increase in gillnetting and the increase in the use of small-meshed seine (targeting fish and shrimp) is noteworthy. Reef fishers from Papagaran mostly practiced gill netting over the period 2002 – 2004, whereas they seem to have abandoned the use of fish traps, which their preferred gear over the period 1996 – 2001. Fishers from Sape have switched almost completely to bottom hook-and-lining in 2002 – 2004.
Reef fishing effort over the period 1996 – 2004 varied between 20 and 30 vessels observed (and interviewed) per Sortie (Figure 31). There is no clear trend over this 9-year period, but the recent increase over the years 2003 – 2004 is a matter of concern. Assuming that each Sortie covers 51% (see Section 6.4.2 above), it is likely that between 40 and 60 fishing vessels are active at any one time in Komodo National Park.
6.4.4 Spatial patterns in the reef fishery in Komodo National Park The coordinates of the vessels that were observed by the survey team were recorded and a home range analysis was performed. This type of analysis delineates the smallest area where a fisher from a certain village can be encountered for a specified likelihood. In this study, probabilities of 10, 50, 75 and 95% were used. For instance, the area delineated with the polygon for Probability = 50% is the area that includes 50% of the observations, and this polygon can be interpreted as the area where a fisher is 50% likely to be found. Hence, these home range maps (Figure 32- Figure 38) give an impression of where the fishery is spatially concentrated.
There were clear differences in the home range between villages, which can be explained through their tendency to minimize travel from their village to the fishing grounds. There were also clear differences in fishing ground between years for each village. It is also clear that the fishing effort of Park residents and of fishers from villages around the Park is concentrated in areas that are designated no-take zones. Especially Northeast Komodo is heavily exploited.

78
Figure 28. Percentage distribution of the origin (home village or area) of artisanal fishers encountered in Komodo National Park in the period 1996 – 2001 (top) and 2002 – 2004 (bottom).
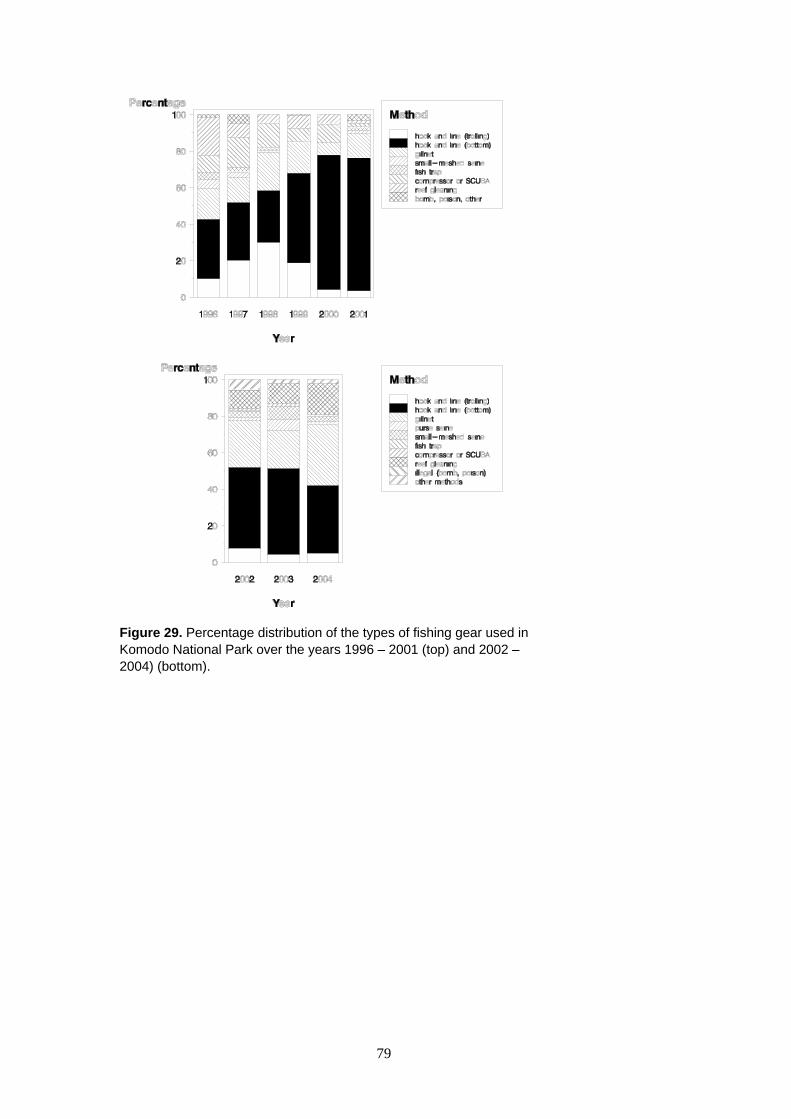
79
Figure 29. Percentage distribution of the types of fishing gear used in Komodo National Park over the years 1996 – 2001 (top) and 2002 – 2004) (bottom).

80
Figure 30. Percentage distribution of fishing methods per village over the period 1996 – 2001 (top) and 2002 – 2004 (bottom). Kom = Komodo, RK = Rinca, Kerora, Pap = Pagagaran, WG = Warloka, Golohmori, Mes = Mesa, LS = Labuan Bajo, Seraya, LBR = Longos, Boleng, Rangko (period 2002 – 2004 only), Sap = Sape, B = Bali (period 2002 – 2004 only), ON = Other areas, in Indonesia (period 2002 – 2004 only), OF = Other areas, abroad (period 2002 – 2004 only), Oth = Other areas (domestic and abroad combined, period 1996 – 2001) only.

81
Figure 31. Yearly averages of reef fishing effort per sortie as observed by the surveillance / resource use monitoring team.

82
Figure 32. Home range for fishers hailing from Kampung Komodo over the years 2002 – 2004.
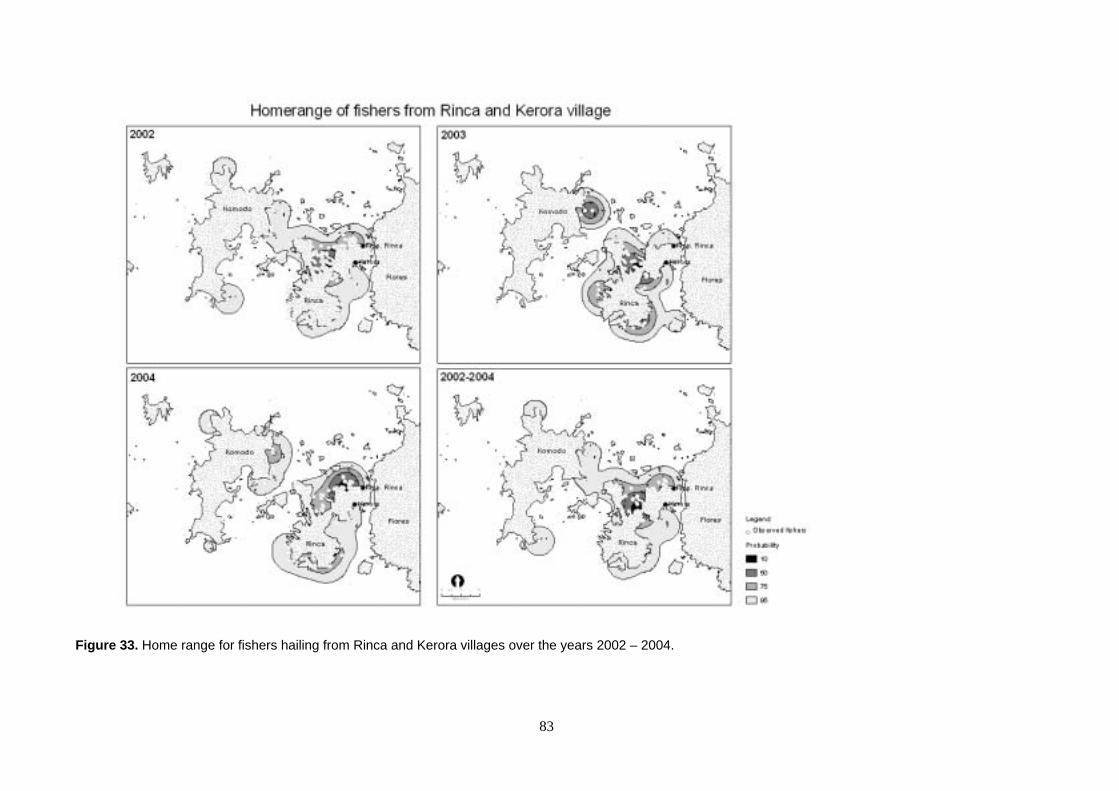
83
Figure 33. Home range for fishers hailing from Rinca and Kerora villages over the years 2002 – 2004.

84
Figure 34. Home range for fishers hailing from Papagaran village over the years 2002 – 2004.

85
Figure 35. Home range for fishers hailing from Warloka and Golohmori villages over the years 2002 – 2004.

86
Figure 36. Home range for fishers hailing from Mesa village over the years 2002 – 2004.

87
Figure 37. Home range for fishers hailing from Labuan Bajo and Seraya villages over the year 2002 – 2004.
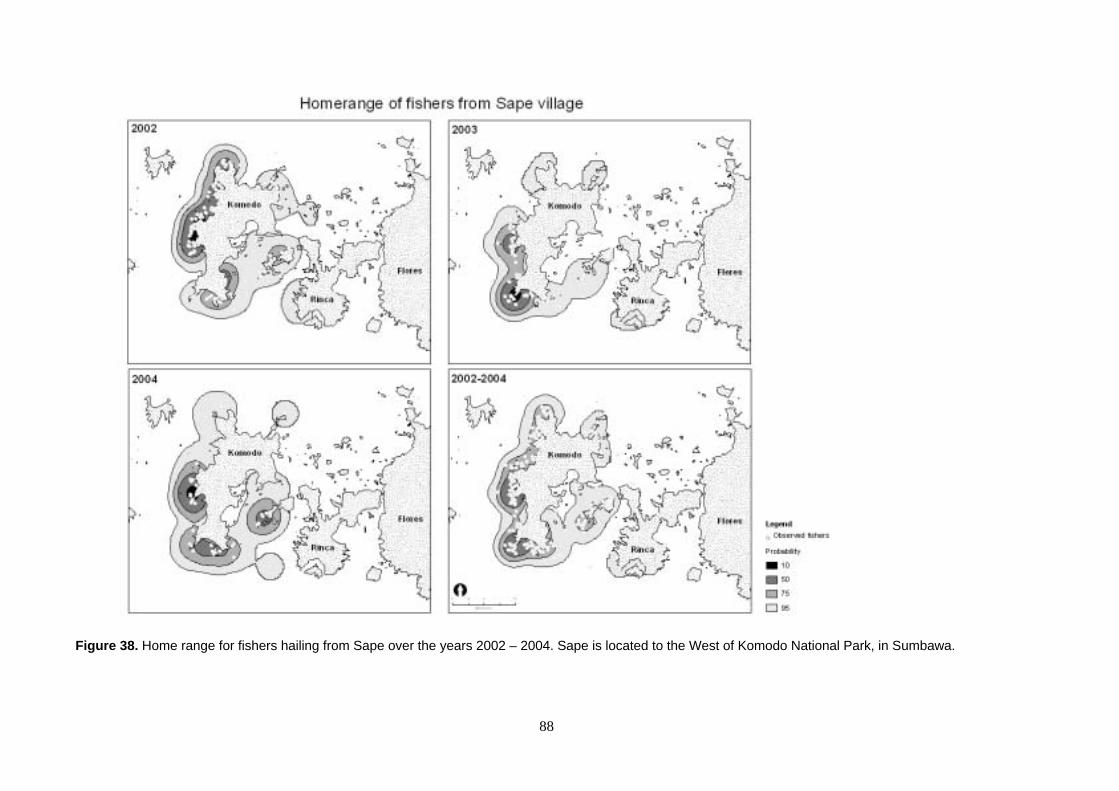
88
Figure 38. Home range for fishers hailing from Sape over the years 2002 – 2004. Sape is located to the West of Komodo National Park, in Sumbawa.
89
6.5 Assessment of the Park’s mangroves and sea grass stands
6.5.1 Mangrove monitoring After having tried various methods to assess mangrove coverage using satellite imagery, it was concluded that the most efficient method was to combine LandSat imagery with aerial pictures taken from low-altitude Fokker F27 aircraft servicing the route Denpasar – Labuan Bajo. LandSat imagery was available for 1992 and 2000. Interpretation of the LandSat image of the year 2000 was facilitated by aerial pictures, after which the image from the year 2000 could be compared to the one from 1992. It was concluded that mangrove coverage inside the park amounted to 732 ha, and that there was no visible difference in coverage between 1992 and 2000. This means that cutting presently does not pose a severe threat to the mangrove forests in Komodo National Park.
6.5.2 Sea grasses The monitoring team has identified 9 different sea grass species found in and around Komodo National Park, out of 12 known species in Indonesia. Those species are Cymodocea serrulata, C. rotundata, Enhalus acoroides, Thalassia hemprichii, Halodule uninervis, Halophila pinifolium, H. ovalis, Syringodium isoetifolium, and Thalassodendron ciliatium. Overall, mean sea grass coverage was 28% in the seagrass beds investigated. Sea grass canopy varied between sites: at Papagaran seagrasses were 30 cm tall, whereas at Seraya Kecil it was only 16 cm. This may due to the differences in substrate and in nutrient loading (Papagaran has a fairly large village whereas Searaya Kecil has a much smaller human population).
The seagrass monitoring program that was conducted for one full year by the Komodo Field Office (in consultation with the University of New Hampshire) will likely be continued by the Komodo National Park authority in direct collaboration with the University of New Hampshire.
6.6 Assessment of cetaceans, manta rays and turtle nesting beaches
6.6.1 Cetaceans During the period October 02 – April 03, cetacean surveys were conducted for about one week each month. In April 03, a 6-day field training event on visual and acoustic cetacean survey techniques and cetacean conservation was organized together with Apex Environmental, who provided their researchers and survey equipment in-kind. The training was attended by three university students (from Semarang, Bogor, and Australia), 3 rangers of Komodo National Park, and one TNC Komodo Field Office staff. Participants improved their field skills (species identification, identification of behavioral patterns), data recording skills and overall knowledge of cetacean ecology, conservation and management issues (relevant to many endangered marine species).
The Cetacean monitoring program provided insights in the species richness, abundance and distribution of whales and dolphins in Komodo National Park. Some of the highlights include the discovery of the pygmy Bryde’s whale, the occurrence of endangered sperm and blue whales in or near Park waters and the regular sightings of large groups of spotted dolphins in the southern waters of the Park. Also, the recent strandings in Komodo National Park (sperm whale and Fraser's dolphin) provided an opportunity to more directly involve local

90
communities with the cetacean program and provided links with the community development program.
Importantly, the proposal to extend Park boundaries is partly based on new knowledge on cetacean migration routes as observed during this program. Species new to the Komodo waters were not encountered in 2003, and therefore it is expected that the presently established species list is nearly complete as far as the more conspicuous species are concerned.
The monitoring program showed that there are no specific areas or seasons when sightings of large cetaceans are so common and consistent that a dedicated whale watching industry could be established. Sightings of cetaceans, and especially of dolphins, are often mentioned as the highlight of the day for many visiting divers and dragon-watchers. The cetacean results have identified areas where chances of seeing sperm- and melon-headed whales and large groups of spinner, spotted dolphins are relatively high. Several live-aboard dive vessels which routinely visit the Park have been informed of these areas and some operators already adjust their travel routes in between dive sites to make the most of these opportunistic whale and dolphin watching areas.
6.6.2 Manta rays Hydroacoustic monitoring of manta rays has been continued. Tags deployed in May 2002 were still picked up at the listening stations deployed in the Park in June 2003. This is a long period, considering that the batteries of acoustic tags usually do not normally last that long and considering that manta rays may shed their tags after some time. This long period during which many of the manta rays ‘reported back’ at one of the listening stations corroborates the hypothesis that the manta rays of Komodo National Park are probably residents that may spend most of their life within a relatively confined area. In July and August, none of the tagged mantas reported back, probably because the batteries have finally powered out. The intention is to glean the survey results for any additional information that may be of relevance for management.
During one of the manta monitoring field days, a lost or discarded manta harpoon was found, proving that manta’s are occasionally poached inside the Park. The Floating Ranger Stations and Park rangers have been made aware of this problem, but so far no manta hunters were apprehended. The major center for trade in manta products is likely to be Lamakera, in the Alor area, and it is possible that mantas hunted in Komodo and surrounding waters end up there. To test this hypothesis, 100 manta rays will be tagged with conventional tags in the coming months, and the a Fisheries officer in Lamakera will collect any tags from captured mantas, for which a small reward is offered to the fishers.
6.6.3 Sea turtle nesting beaches Initial surveys on potential nesting beaches of sea turtles were conducted from October 2001 – March 2002, From 145 surveyed beaches, 62 beaches were concluded as potential beaches for turtle nesting sites. Regular monitoring was started since March 2002 at 12 different sites in and around Komodo National Park. The monitoring was held twice a month. Some sites (6 places) are specific for nesting site of Hawksbill Turtle, 5 sites are specific nesting site of Green Turtle, and 1 place was a mixed nesting site for both species. The regular monitoring was stopped in January 2003, at which point in time it had become clear that massive turtle nesting beaches do not exist in Komodo National Park, and that the eggs of nearly all nests suffered complete mortality through predation by either Komodo dragons, pigs or humans.

91
In the light of other priorities, and under the cautious conclusion that Komodo National Park may never have had large turtle rookeries, it has been decided not to allocate focused effort on the protection of turtle nests at present. Of course, turtle egg poachers will still be apprehended if spotted, but there are presently no detailed plans to relocate eggs to hatching pens.
6.7 Coral reef rehabilitation Large areas within Komodo National Park suffered extensive damage from blast fishing. In the framework of a PhD research project with Berkeley University, The Conservancy facilitated research on reef rehabilitation to explore whether rehabilitation could speed up recovery of these damaged areas. This research, which was carried out in 1998 – 1999, demonstrated that the stability of the substrate is a determining factor for coral settlement and growth. Areas that were exposed to blast fishing often have coral rubble as a substrate. This rubble turns over in the current, thereby smothering any young coral colonies that may have settled. Hence, the research focused on finding a cost-efficient way to stabilize substrate and on performance evaluation of alternatives for substrate stabilization.
After the pilot research, where stabilization with netting, cement slabs, and rock piles, was tried out, the most successful method (rock piles) was scaled up in 2000 to larger-scale studies. This project is “ecologically-significant” reef rehabilitation at scales of thousands of square meters.
Four sites were chosen for large-scale substrate stabilization: Gililawadarat, Karang Makassar, NE Padar, and Papagarang. By testing four rock pile designs at each site, each with the same total volume of rock, the configuration that best resists rubble encroachment and gives the best ecosystem recovery for the same cost can be determined. The four designs installed at each site are: 1) complete rock coverage, 2) rock piles (used in the larger-scale trials), 3) “spur and groove” morphology parallel to the prevailing current, and 4) spur and groove perpendicular to the current.
The different designs have different potential strengths and weaknesses. A relatively high (50-75 cm) solid coverage of rocks (method 1) may keep rubble out, but this method covers the least area per cubic meter of rock. Piles of rock 1-2 m3 in volume spaced every 2-3 m (method 2) cover the most area per cubic meter but leave the most rubble free to move in the stabilized area. The other two designs are based on the fact that on some reefs with high wave energy, spurs and grooves naturally form perpendicular to the waves, with the spurs, or ridges, breaking the force of the waves, and the grooves, or valleys, allowing the channeling of sand. Where rubble motion is fairly unidirectional (as with a steep slope or some currents), a spur and groove system parallel to the direction of flow (method 3) might allow the buildup of coral on the spurs, and the “flushing through” of rubble in the grooves. Alternatively, a spur and groove system perpendicular to the direction of flow (method 4) might generate turbulent flow and eddies as they block the current, enhancing settlement of coral larvae from the water column.
Many more corals per square meter grew on the rock piles compared to untreated rubble. Rocks also provided the most natural, complex substrate, were easiest to scale up, and are relatively inexpensive compared to reef rehabilitation methods being investigated elsewhere. Mid-scale rock piles were installed in 2000; cover by hard corals on the rocks continued to increase as of the most recent visit in September 2004 (Figure 39).
In 2002, rehabilitation efforts in KNP were further scaled up, testing four rock pile designs at each of four different rubble field sites, covering more than 6,000 m2 total.
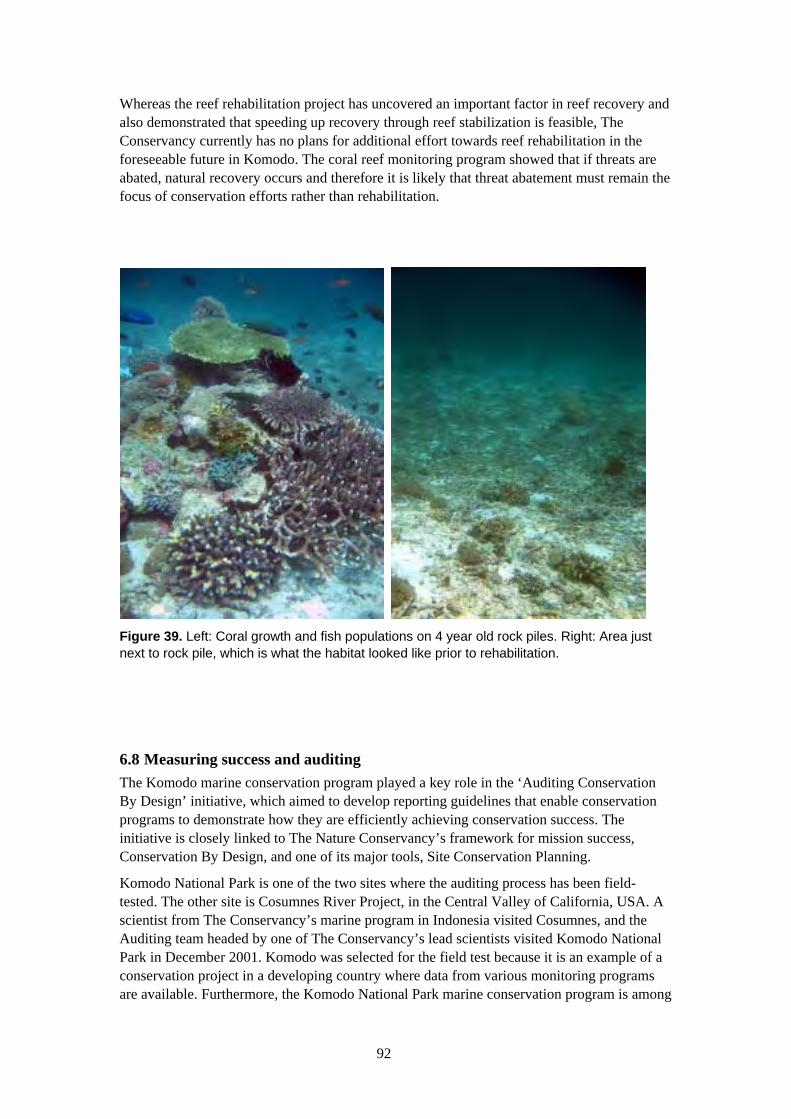
92
Whereas the reef rehabilitation project has uncovered an important factor in reef recovery and also demonstrated that speeding up recovery through reef stabilization is feasible, The Conservancy currently has no plans for additional effort towards reef rehabilitation in the foreseeable future in Komodo. The coral reef monitoring program showed that if threats are abated, natural recovery occurs and therefore it is likely that threat abatement must remain the focus of conservation efforts rather than rehabilitation.
Figure 39. Left: Coral growth and fish populations on 4 year old rock piles. Right: Area just next to rock pile, which is what the habitat looked like prior to rehabilitation.
6.8 Measuring success and auditing The Komodo marine conservation program played a key role in the ‘Auditing Conservation By Design’ initiative, which aimed to develop reporting guidelines that enable conservation programs to demonstrate how they are efficiently achieving conservation success. The initiative is closely linked to The Nature Conservancy’s framework for mission success, Conservation By Design, and one of its major tools, Site Conservation Planning.
Komodo National Park is one of the two sites where the auditing process has been field-tested. The other site is Cosumnes River Project, in the Central Valley of California, USA. A scientist from The Conservancy’s marine program in Indonesia visited Cosumnes, and the Auditing team headed by one of The Conservancy’s lead scientists visited Komodo National Park in December 2001. Komodo was selected for the field test because it is an example of a conservation project in a developing country where data from various monitoring programs are available. Furthermore, the Komodo National Park marine conservation program is among
93
the few programs that can demonstrate how successful and measurable abatement of a threat (blast fishing) resulted in a tangible result (recovery of the Park’s reefs).
In the framework of the ‘Auditing’-initiative, a formal cause-and-effect analysis was done, which links conservation targets to indirect and direct factors that impact them. The analysis is included in the Appendix.
7 References
Many of the following materials are downloadable from the Komodo National Park website (www.komodonationalpark.org).
Management plan
PKA & TNC 2000. 25 Year Master Plan for Management Komodo National Park, Book 1: Management Plan. 81 p.
PKA & TNC 2000. 25 Year Master Plan for Management Komodo National Park, Book 2: Data and Analysis 242 p.
PKA & TNC 2000. 25 Year Master Plan for Management Komodo National Park, Book 3: Site Planning 62 p.
PKA & TNC 2000. Rencana Pengelolaan 25 Tahun Taman Nasional Komodo, Buku 1: Rencana Pengelolaan. 92 p.
PKA & TNC 2000. Rencana Pengelolaan 25 Tahun Taman Nasional Komodo, Buku 2: Data dan Analisis. 253 p.
PKA & TNC 2000. Rencana Pengelolaan 25 Tahun Taman Nasional Komodo, Buku 3: Rencana Tapak. 66 p.
Komodo natural history guide
Mehta-Erdmann, A. and Bason, D. 2004. A natural history guide to Komodo National Park, Book 1: Terrestrial / Panduan sejarah ekologi Taman Nasional Komodo, Buku 1: Darat. The Nature Conservancy Southeast Asia Center for Marine Protected Areas, Sanur, Bali, Indonesia. 97p.
Mehta-Erdmann, A. and Bason, D. 2004. A natural history guide to Komodo National Park, Book 2: Marine / Panduan sejarah ekologi Taman Nasional Komodo, Buku 2: Lautan. The Nature Conservancy Southeast Asia Center for Marine Protected Areas, Sanur, Bali, Indonesia. 228p.
Mehta-Erdmann, A. and Bason, D. 2004. A natural history guide to Komodo National Park, Book 3: Management / Panduan sejarah ekologi Taman Nasional Komodo, Buku 3: Pengelolaan. The Nature Conservancy Southeast Asia Center for Marine Protected Areas, Sanur, Bali, Indonesia. 69p.
Information sheets published by The Nature Conservancy
Komodo National Park: Effective Marine Protected Area Management
Zonation in Komodo National Park
94
Coral Reef Monitoring in Komodo National Park
Fish Monitoring in Komodo National Park
Marine Resource Utilization in Komodo National Park
Cetacean Surveys in Komodo National Park
Coral Reef Recovery
Enforcement in Komodo National Park
Marine Environmental Awareness and Education
Pelagic Fisheries
Komodo Fish Culture Project: Promoting Alternative Livelihoods and Market Transformation
Collaborative Park Management: Partnerships, Financing and Ecotourism at Komodo National Park
Frequently-Asked questions about The Nature Conservancy in Komodo
Beberapa pertanyaan yang sering diajukan tentang The Nature Conservancy
Dive sites in Komodo
Report and papers
Bakar, A. & Mous, P.J., 1999. Resource utilization in and around Komodo National Park. Report, 30 p.
Ciofi, C. and Jessup, T., 2004. Tracing the dragon. BBC Wild Life p. 52 - 58
CMPI & YPAN, 2000. Pelagic fisheries project report, Komodo National Park and surrounding waters, January 2000. Prepared by The Nature Conservancy Indonesia Coastal and Marine Program and Yayasan Pusaka Alam Nusantara, Jakarta, Indonesia. 15 p.
CMPI 2000. Progress report on the pelagic fisheries project, prepared on request of Yayasan Pusaka Alam Nusantara, Feb. 15 2000 - May 15 2000. Prepared by The Nature Conservancy Indonesia Coastal and Marine Program, Jakarta, Indonesia. 5 p. (pdf; 228 Kb)
Dames & Moore Indonesia 1999. Final Report. Environmental Impact Assessment Scoping Study for Komodo National Park. Report to The Nature Conservancy, Sanur, Bali, Indonesia. 52 p. + appendices
Dobkowski Keith, Yesenia Gallegos, Jason Hoffman and Angela Mapa, 2001. Fact Sheets on Management of Nine Coastal and Marine Protected Areas. USF School of Law. 104 p.
Environment North 2001. Komodo National Park tourism strategy. Final report October 2001. Report prepared for the International Finance Corporation. Environment North, North Cairns, Australia. 157 p.
Fox H.E., Pet J.S. & Dahuri R. 2001. Enhancing coral reef recovery after destructive fishing practices: Initial results in Komodo National Park. Indonesian Journal of Coastal and Marine Resources (Jurnal Pesisir dan Lautan) 3: 36-44.

95
Fox H.E., Dahuri R., Muljadi A., Mous P.J. & Pet J.S. 2001 Increased coral cover in Komodo National Park, Indonesia: Monitoring for management relevance. Indonesian Journal of Coastal and Marine Resources (Jurnal Pesisir dan Lautan) 3: 27-35.
Fox H.E. & Pet J.S. 2001. Pilot study suggests viable options for reef restoration in Komodo National Park. Coral Reefs 20: 219-220.
Fox H.E, Mous P.J., Muljadi A., Purwanto & Pet J.S. 2003. Enhancing Reef Recovery in Komodo National Park, Indonesia: Coral Reef Rehabilitation at Ecologically Significant Scales. (Mempercepat pemulihan terumbu karang di Taman Nasional Komodo, Indonesia: Rehabilitasi terumbu karang pada skala ekologis). Report from The Nature Conservancy Southeast Asia Center for Marine Protected Areas, Sanur, Bali, Indonesia. 19 p.
Gillett R. 1996. The development of pelagic fisheries in the Komodo area of Indonesia. A report prepared for The Nature Conservancy by Gillett, Preston and Associates. 49 p.
Imansyah, M.J., Purwandana, D., Rudiharto, H., Jessop, T.S. 2003. Survei Potensi Hidupan Liar Terestrial di Pulau Komodo, Taman Nasional Komodo 2002, The Nature Conservancy, Zoological Society of San Diego, Komodo National Park, 23 p.
Imansyah, M.J., Purwandana, D., Jessop, T.S. 2002. Materi Kursus 1: Dasar-dasar Sistem Informasi Geografis untuk Staff Taman Nasional Komodo, The Nature Conservancy, Zoological Society of San Diego, Komodo National Park, 13 p.
International Finance Corporation 2001. Komodo Collaborative Management Initiative. Project Document September 2001. 108 p.
Jessop T.S., Sumner J., Rudiharto H., Phillips, J.A., and Ciofi, C. 2004. Variasi ukuran tubuh antar pupulasi terbatas-pulau pada Komodo (Varanidae). Report from Zoological society of San Diego - The Nature Conservancy, Bali, Indonesia. 21p.
Jessop T.S., Sumner J., Rudiharto H., Purwandana D., Imansyah M.J. & Phillips, J.A. 2004. Distribution, use and selection of nest type by Komodo Dragons. Biological Conservation 117: 463 – 470
Jessop, T.S., Sumner J., Rudiharto H., Purwandana D., Imansyah M.J. & Phillips, J.A., 2003, Studi Distribusi, Penggunaan dan Pemilihan Tipe Sarang oleh Biawak Komodo: Implikasi untuk Konservasi dan Manajemen, The Nature Conservancy, Zoological Society of San Diego, Komodo National Park, 25 p
Jessop, T.S., Sumner J., Rudiharto H., Purwandana D., Imansyah M.J., 2002, Kursus Metode Sampling dan Statistik dalam Populasi Tertutup Digunakan untuk Penaksiran Kelimpahan Varanus Komodoensis, The Nature Conservancy, Zoological Society of San Diego, Komodo National Park, 21 p.
Kahn B., 2002. Komodo National Park Cetacean surveys. A rapid ecological assessment of Cetacean diversity, abundance and distribution. Interim report - October 2001. Apex Environmental, Cairns, Australia and The Nature Conservancy Coastal and Marine Program / Indonesia, Bali. 16 p.
Kahn B., 2001. Komodo National Park Cetacean surveys. A rapid ecological assessment of Cetacean diversity, abundance and distribution. Monitoring report - April 2000. 1999-2000 Synopsis. Apex Environmental, Cairns, Australia and The Nature Conservancy Coastal and Marine Program / Indonesia, Bali. 39 p.
96
Kahn B., 2000. Komodo National Park Cetacean surveys. Monitoring report, October 2000. Apex Environmental, Cairns, Australia and The Nature Conservancy Coastal and Marine Program / Indonesia, Bali. 27 p.
Kahn, B., James-Kahn, Y. and J. Pet. 2000. Komodo National Park cetacean surveys - A rapid ecological assessment of cetacean diversity, distribution and abundance. Indonesian Journal of Coastal and Marine Resources 3(2): 41-59
Kahn B. & Pet, J.S. 2003. Long-term visual and acoustic cetacean surveys in Komodo National Park, Indonesia 1999-2001: Management implications for large migratory marine life. In Beumer, J.P., Grant, A., & Smith, D.C. (eds.) Aquatic Protected Areas, what works best and how do we know? Proceedings and Publications of the World Congress on Aquatic Protected Areas 2002. Australian Society for Fish Biology. p. 625-673
Kahn, B. & Pet, J.S. 2003. Long-term visual and acoustic cetacean surveys in Komodo National Park, Indonesia 1999-2001: Management implications for large migratory marine life. In: Proceedings and Publications of the World Congress on Aquatic Protected Areas 2002. Australian Society for Fish Biology. 27pp.
Len McKenzie 2003. Western Pacific – Komodo National Park (Indonesia). Seagrass-Watch News 18, October 2003. p. 7
Meyer T., Sudaryanto, Widodo D. & Mous P.J. 2004. Progress report on the Komodo Fish Culture Project: A pilot project to establish a multi-species reef fish hatchery in Loh Mbongi and village-based grow-out farms in communities surrounding Komodo National Park, West Flores, Indonesia. April 2004. Report from The Nature Conservancy, Southeast Asia Center for Marine Protected Areas, Sanur, Bali, Indonesia. 19 p.
Monitor Company, Inc. 1999. [unpublished reports on eco-tourism development]
Mous P.J. 2001 (Ed). Report Workshop on Sustainable Marine Tourism in Komodo National Park. Grand Bali Beach Hotel, Sanur, Bali, Indonesia. February 28-March 2, 2001. Organized and hosted by The Nature Conservancy, Coastal and Marine Program - Indonesia in collaboration with PADI-AWARE. 31 p
Mous P.J. & Gorrez M. 2001. Stakeholder involvement in the Site Conservation Planning process for Komodo National Park. Workplan and budget, Feb. - June 2001. The Nature Conservancy, Sanur (Bali), Indonesia. 20 p.
Mous P.J., Muljadi A. & Pet J.S. 2000. Spatial distribution patterns in resource use by the fishing communities in and around Komodo National Park, a marine protected area in Central Indonesia. Ninth International Coral Reef Symposium, Bali, Indonesia 23-27 October 2000. Abstracts. Published by State Ministry for the Environment Indonesia, Indonesian Institute of Sciences & The International Society for Reef Studies. p. 208, 237
Mous, P.J., Pet, J.S., & Halim A., 1999. Harvest characteristics of gango, a method to capture fingerling groupers from mangrove areas in West Flores, Indonesia. Report, 25 p.
Mous P.J. 2002. Report on mooring buoy installation in Komodo National Park, October 2001 - January 2002. Report from The Nature Conservancy, Coastal and Marine Program Indonesia in collaboration with the Komodo National Park authority, June 2002. 11 p.

97
Mous P.J., Sudaryanto & Meyer T. 2003. Report on the Komodo Fish Culture Project. A pilot project to establish a multi-species reef fish hatchery in Loh Mbongi and village-based grow-out farms in communities surrounding Komodo National Park, West Flores, Indonesia. September 2003. Report from The Nature Conservancy Southeast Asia Center for Marine Protected Areas, Sanur, Bali Indonesia. 17 p
Pedju M. 2002. Report on Seagrass Monitoring Training in Komodo National Park, July 26th – August 3rd 2002. Report from The Nature Conservancy, Coastal and Marine Program Indonesia in collaboration with Komodo National Park authority and WWF Wallacea. TNC Southeast Asia Center for Marine Protected Areas, Sanur, Bali. 18 p.
Pet, J. 1997. Destructive fishing methods in and around Komodo National Park. SPC Live Reef Fish Information Bulletin 2, p. 20-24
Pet, J.S., 1999. Marine resource utilization in Komodo National Park, Monitoring report 1997-1998
Pet, J & Djohani, R. 1998. Combating destructive fishing practices in Komodo National Park: Ban the hookah compressor! SPC Live Reef Fish Information Bulletin 4, p17-28
Pet, J.S., & Mous P.J. 1998. Status of the coral reefs in and around Komodo National Park 1996-1998 (with an update of 2000), monitoring report.
Pet, J.S., & Mulyadi, A. 2001. Grouper and Napoleon wrasse spawning aggregation sites Komodo National Park 1998-2001, Monitoring report.
Pet J.S. & Squire L. 2000. Grouper spawning aggregations in Komodo National Park. In: ASIH, AES, HL, SSAR, NIA, CAH. Program Book and Abstracts of the 80th Annual Meeting American Society of Ichthyologists and Herpetologists, hosted by Universidad Autonoma de Baja California Sur, La Paz, B.C.S., Mexico, June 14-20, 2000. p. 291.
Pet J.S & Subijanto J. 2001. Enforcement and protection of Komodo National Park (draft). The Nature Conservancy, Sanur (Bali), Indonesia. The Nature Conservancy, Sanur (Bali), Indonesia. 14 p.
Pet-Soede, L (Ed.). 2002. The Solor and Alor islands: Expedition Results, data collected during 2 reconnaissance trips: 9-12 September, 2001 and 7-19 May, 2002, Report from WWF Wallacea Bioregional Program and The Nature Conservancy Southeast Asia Center for Marine Protected Areas, Bali, Indonesia. 110 p.
PIER & TNC 2001. Komodo Marine Park manta rays: acoustic tagging report (draft). Draft report from the Pfleger Institute of Environmental Research and The Nature Conservancy, Bali, Indonesia. 8 p.
PKA & TNC 2003. Overview of Komodo Stakeholder Consultations, 1996 - 2003. 33 p.
PKA & TNC 2002. Minutes of Meeting between Government (PHKA), Stakeholders, and TNC Indonesia in KSDA Office, Bali, July 17, 2002. 9 p.
Purwandana D., Imansyah, M.J., Rudiharto H., Jessop, T. 2004. Kegiatan Penelitian Ekologi Varanus komodoensis di Taman Nasional Komodo Tahun 2003, Laporan No. 2, The Nature Conservancy, Zoological Society of San Diego, Komodo National Park, 27 p.
PT Putri Naga Komodo 2003. Proposal Pengusahaan Pariwisata Alam, Taman Nasional Komodo, Kabupaten Daerah Tingkat II Manggarai, Propinsi Nusa Tenggara Timur. Jangka Waktu 2002 – 2032. Prepared by PT Putri Naga Komodo, Sanur, Bali, Indonesia. 42 p.

98
Ruitenbeek J. & Cartier C. 2001. Komodo National Park, Indonesia: Economic issues, analyses and prescriptions. Draft report prepared for the International Finance Corporation. 60 p. + appendices.
Ruitenbeek H.J. 2001. An economic analysis of the spawning aggregation function in Komodo National Park, Indonesia. SPC Live Reef Fish Information Bulletin #9 – December 2001. p. 13-16
Sadovy, Y & Pet, J. 1998. Wild collection of juveniles for grouper mariculture: just another capture fishery? SPC Live Reef Fish Information Bulletin 4, p. 36-39
Shurcliff K., 2001. Final report on Komodo National Park collaborative management. Report to the International Finance Corporation, 57. p.
Singleton J. & Sulaiman R. 2002. Environmental Assessment Study - Komodo National Park, Indonesia. Report from The Nature Conservancy Southeast Asia Center for Marine Protected Areas, Sanur, Bali, Indonesia. 28 p
Sudaryanto & T. Meyer 2003. Brief report of student internship at the TNC Fish Culture Project, Loh Mbongi, 28 July to 28 August, 2003. Report from TNC SEACMPA, Sanur, Bali, Indonesia. 4 p.
Sudaryanto, Meyer T. & Mous P.J. 2004. Natural spawning of three species of grouper in floating cages at a pilot broodstock facility at Komodo, Flores, Indonesia. SPC Live Reef Fish Information Bulletin 12. p. 21-26
Thorsell J. 2001. Komodo National Park Collaborative Management Initiative. Preliminary Monitoring and Evaluation Plan. Report prepared for the International Finance Corporation. 20 p.
TNC SEACMPA 2003. Leveraging lessons learned form Komodo National Park to create a resilient network of marine protected areas at priority sites in the Flores and Banda Seas Eco-Region. Mid-Term report to Keidanren April – October 2003, by The Nature Conservancy - Southeast Asia Center for Marine Protected Areas, Bali, Indonesia. 17 p.
The Nature Conservancy Coastal and Marine Program Indonesia 2001. Strategy and action plan for the TNC Komodo fish culture project. The Nature Conservancy, Sanur (Bali), Indonesia. 73 p.
Press releases, articles and clippings
December 2002. Komodo Beneath the Dragon's Realm. Clipping from Asian Diver - http://www.asiandiver.com/magazine/03feb_mar/dragon_realm
October 2002. Komodo & Galapagos: Uniting two different worlds, by Djuna Ivereigh. IslandLife, Special Edition on Sustainable Tourism. p. 27-30.
May 2002. Dragons and mantas and sharks, oh my.... by Donna Perot. Asia Pacific Postcard From the Field. Clipping from http://www.nature.org/
July 2001. Rare whale species identified in Komodo National Park, Indonesia. Press release about the recent discovery of a pygmy Bryde's whale.
January 2001. Komodo Aria, by Michael Aw. AsianGeographic, Edition Jan / Feb 2001, p. 26-41
October 2000. Clippings from the Environmental News Network on abatement of blast fishing in Komodo.

99
March 1999. The Komodo Dragon, by Claudio Ciofi. Scientific American, March 1999. Clipping from http://www.sciam.com

100
8 Appendix – situation diagrams

101
coralcommunities
physical stresseson hard corals
(coral breakage)
chemical stresseson hard corals
(poisoning)
This conservation targetincludes coral reefs andcommunities on rockysubstrate with soft or hardcorals. The exploitedspecies that are part of thecoral communities areincluded as separateconservation targets.
temperaturestresses on hardcorals (bleaching)
balance betweencorals and macro-
algae
anchoring
damage ordisturbance
caused by naturetourists
blast fishing
cyanide fishing forfood fish
cyanide fishing foraquarium fish
‘bubu’ trap fishing
reef gleaning
tuba fishing
Cyanide fishing for foodfish hardly contributesto either physical andchemical damage tocorals (Mous et al.2000).
destructive fishingtechniques
exploited bony fish
exploitedinvertebrates
exploited sharksand rays
size- and species-selective mortality
exerted by thefishery
fishing or huntingmethods thatcause over-
exploitation but arenot destructive to
habitat
balance betweenherbivores and
piscivores
Coral communitiesconstitute thehabitat of exploitedorganisms, andthus affect theirgrowth,recruitment andmigration rates.
users’ understanding ofecology and of
production of renewablenatural resources
global warming
need(subsistence and cash)
socio-economiclinkages to middlemen
competitiveness andavailability of alternative
sources of income inother industries
compliance with rules ®ulations
user’s awareness andappreciation for rules
and regulations
presence of other,especially non-local
users
adequacy of rules andregulations
market demand
resources for design and implementation of Park management
attitude to conservation(NOT based on rules
and regulations)
exploiter’saction
skills
other livelihoods
alignment betweengovernment agencies
religion,pilgrimage to Mecca
policy maker’sunderstanding of Parkmanagement, ecologyand of production ofrenewable natural
resources
national and localeconomic situation
educationalsystem
alignment of politics andlegislation with effective
Park management
enforcement of rulesand regulations
rubble formation,affecting
settlement of coral
excessivemangrove cutting(over-exploitation
of mangrovewood) mortality of
mangroves mangrove forests
Degradation of mangrove forests and seagrassbeds has effects on coral communities and onexploited organisms, because mangroves andseagrasses protect reefs from siltation andeutrophication and because mangroves areimportant spawning and foraging areas for manyaquatic species.
global economy
operator’saction
tourist’saction
availability of mooringbuoys
number and budget oftourists who visit the Park
causal chains with‘attitude’ and ‘compliance’
(see below) apply heretoo
pollution of watersand beaches,
eutrophication ofreefs
coastal, tourismdevelopment
5
3a
1a, b
3d
3c
3d
1a
4
1b, 4
3b
5
1a, b
7
1b, 2
..
6a
6b
avoidance of Parkwaters
seagrass bedsmortality ofseagrasses
over-exploitation ofseagrasses
Strategies for conserving coastal and marine biodiversity inKomodo National Park.Grey oval callouts relate strategies to factors or processes.1a. Assist with the design and implementation of an effective Parkmanagement system, including design and implementation of azoning and licensing system.1b. Conduct carrying capacity studies for extractive and non-extractive uses in the Park, assist with the design of a coastal zonemanagement plan for West Flores and East Sumbawa that is alignedwith the functions of the Park.2. Generate a sustainable source of income to cover expenses forPark management through the development of eco-tourism.3a. Develop user's awareness of Park rules and regulations, buildconstituency among users for conservation management, ensureappropriate participation of users in design and implementation ofPark management.3b. Increase users' knowledge on ecology, production of naturalrenewable resources and on conservation issues.3c. Increase policy maker's knowledge on ecology, production ofnatural renewable resources and on conservation issues; developpolicy makers' understanding of Park management, buildconstituency among policy makers for conservation management.3d. Work with national and district government agencies to alignpolicy and legal framework with conservation management.4. Develop alternative livelihoods.5. Assist with enforcement of Park rules and regulations.6a. Rehabilitate damaged coral reefs.6b. Assess the need to rehabilitate mangrove forests.6c. Protect turtle nests from predation by feral dogs and pigs andremove feral dogs.7. Improve Park infrastructure for eco-tourism, including installationof mooring buoys.
4
4
1a, b
Monitoring programs to obtain measures of success.monitoring programs that have been implementedmonitoring programs that are being developedmonitoring programs that are planned
1. Coral monitoring2. Fish monitoring (spawning aggregation site monitoring)3. Manta ray monitoring4. Shark monitoring5. Mangrove monitoring6. Sea grass monitoring7. Sea turtle monitoring8. Cetacean monitoring9. Resource use monitoring10. Violation monitoring (number of arrests, fines, etc.)11. User attitude / knowledge surveys12. Policy makers attitude / knowledge surveys13. Visitation surveys (including monitoring of revenues)14. Alternative livelihood project monitoring (i.e. progressreporting, monitoring of target group involvement)15. Monitoring of environmental impacts16. Monitoring by collecting statistics from other agencies
population size
1
4
6
market demand
seagrass beds
globaleconomy
blast fishing
mortality ofseagrasses
Conservation target (‘System’)Process or factor that acts directly on theconservation target (‘Stress’), and that is not affectedby other Stresses.Process or factor that acts directly on the Stress(‘Source’).Process or factor
Complex process or factor.
exploiter’saction
Actor who effectuates and determines the‘Source’.
1
12
2
3 4
6
5
9
9
9
9
10
11
11
13
14 15
15
16
1613
Flowchart I. Corals,mangroves,seagrasses andexploited species

102
damage ordisturbance
caused by naturetourists
blast fishing
sea turtles
cetaceans
fishing or huntingmethods thatcause over-
exploitation but arenot destructive to
habitat
exploiter’saction
tourist’saction
avoidance of Parkwaters
mortality of (sub-)adult turtles
size- and species-selective mortality
exerted by thefishery
mortality of turtleeggs andhatchlings
predation by otherwildlife (wild boar,Komodo dragons,
feral dogs)
coastal, tourismdevelopment
coastal, tourismdevelopment
damage ordisturbance
caused by naturetourists
tourist’saction
avoidance of Parkwaters
exploiter’saction fishing or hunting
methods thatcause over-
exploitation but arenot destructive to
habitat
all inputs andrelationships depicted inFlowchart I apply here as
well
all inputs andrelationships depicted inFlowchart I apply here as
well
6c
7
8
Flowchart II.Cetaceans
Flowchart III.Sea turtles