Embed Size (px)
Citation preview
TOROMONT INDUSTRIES LTD.Corporate Office3131 Highway 7 WestP.O. Box 5511Concord ON L4K 1B7Tel: 416 667 5511www.toromont.com
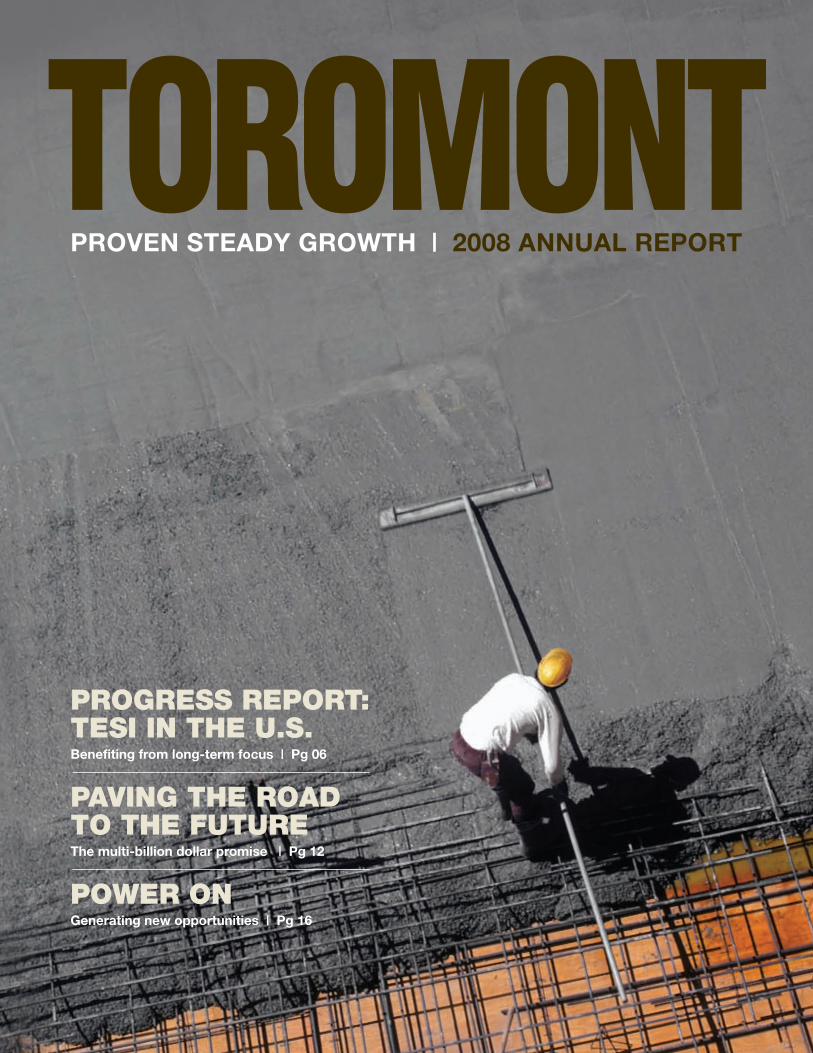
PROVEN STEADY GROWTH | 2008 ANNUAL REPORT
POWER ONGenerating new opportunities | Pg 16
PAVING THE ROAD TO THE FUTUREThe multi-billion dollar promise | Pg 12
PROGRESS REPORT: TESI IN THE U.S.Benefiting from long-term focus | Pg 06
TO
RO
MO
NT
IND
US
TR
IES
LTD
. 2008 AN
NU
AL R
EP
OR
T
HOW TO GET IN TOUCH WITH US Tel: 416 667 5511Fax: 416 667 5555E-mail: [email protected]
HOW TO REACH OUR TRANSFER AGENT AND REGISTRARInvestors are encouraged to contact CIBC Mellon Trust Company for information regarding their security holdings.
CIBC Mellon Trust Company P.O. Box 7010 Adelaide Street Postal Station Toronto ON M5C 2W9 CANADA AnswerLine: 416 643 5500 or Toll-Free North America: 1 800 387 0825 Email: [email protected] www.cibcmellon.com
COMMON SHARESListed on the Toronto Stock ExchangeStock Symbol – TIH
This annual report was printed in Canada on stock manufactured totally chlorine-free with 10% postconsumer fibre.
Des
ign
and
Coo
rdin
atio
n: O
ve D
esig
n &
Com
mun
icat
ions
ww
w.o
ved
esig
n.co
m
Ed
itoria
l: B
arne
sMcI
nern
ey In
c.
2008
2008
2007
2006
2005
2004
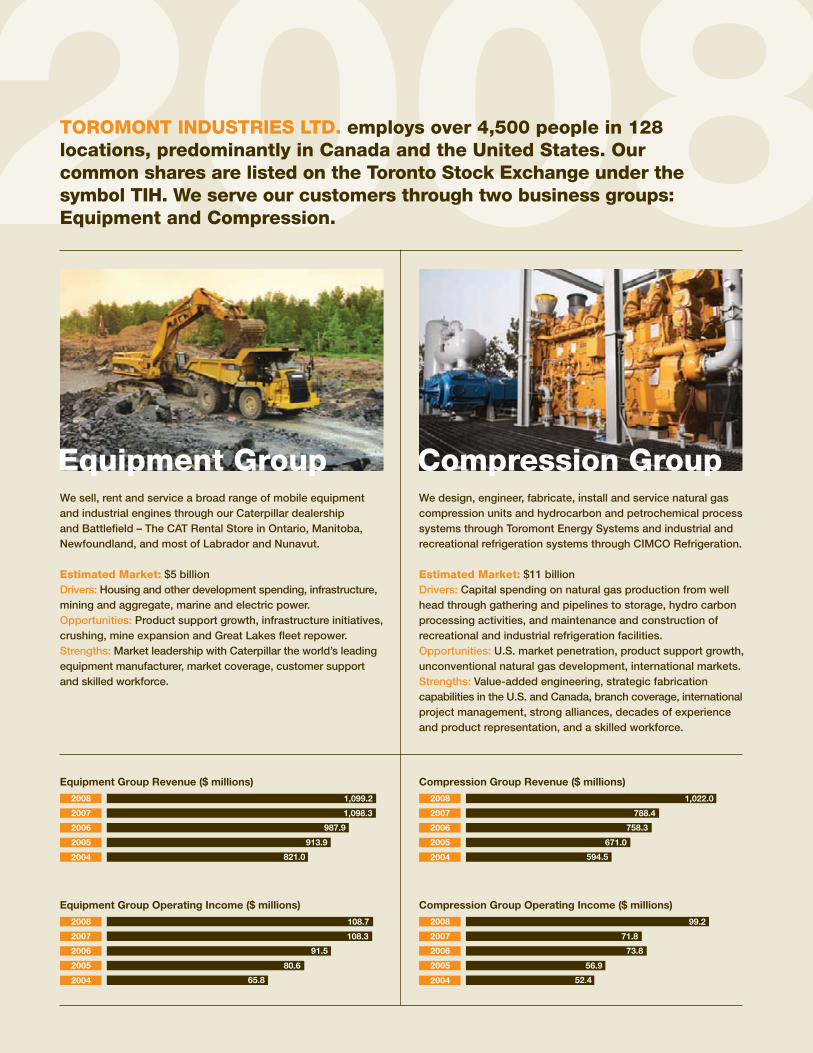
Equipment Group Revenue ($ millions)
1,099.2
1,098.3
987.9
913.9
821.0
2008
2007
2006
2005
2004
Compression Group Revenue ($ millions)
1,022.0
788.4
758.3
671.0
594.5
2008
2007
2006
2005
2004
Equipment Group Operating Income ($ millions)
108.7
108.3
91.5
80.6
65.8
2008
2007
2006
2005
2004
Compression Group Operating Income ($ millions)
99.2
71.8
73.8
56.9
52.4
TOROMONT INDUSTRIES LTD. employs over 4,500 people in 128 locations, predominantly in Canada and the United States. Our common shares are listed on the Toronto Stock Exchange under the symbol TIH. We serve our customers through two business groups: Equipment and Compression.
We sell, rent and service a broad range of mobile equipment and industrial engines through our Caterpillar dealership and Battlefield – The CAT Rental Store in Ontario, Manitoba, Newfoundland, and most of Labrador and Nunavut.
Estimated Market: $5 billionDrivers: Housing and other development spending, infrastructure, mining and aggregate, marine and electric power.Opportunities: Product support growth, infrastructure initiatives, crushing, mine expansion and Great Lakes fleet repower.Strengths: Market leadership with Caterpillar the world’s leading equipment manufacturer, market coverage, customer support and skilled workforce.
We design, engineer, fabricate, install and service natural gas compression units and hydrocarbon and petrochemical process systems through Toromont Energy Systems and industrial and recreational refrigeration systems through CIMCO Refrigeration.
Estimated Market: $11 billionDrivers: Capital spending on natural gas production from well head through gathering and pipelines to storage, hydro carbon processing activities, and maintenance and construction of recreational and industrial refrigeration facilities.Opportunities: U.S. market penetration, product support growth, unconventional natural gas development, international markets.Strengths: Value-added engineering, strategic fabrication capabilities in the U.S. and Canada, branch coverage, international project management, strong alliances, decades of experience and product representation, and a skilled workforce.
Equipment Group Compression Group

FEATURES06 PROGRESS REPORT:
TESI IN THE U.S. 2008 was a record year for Toromont
Energy Systems in the U.S. leading to a significant presence in this multi-billion dollar compression market.
12 PAvING THE ROAd TO THE FUTURE Canadian government commitments
to spend billions on public infrastructure provide reason for optimism for several of Toromont’s businesses.
16 POwER ON What do telecommunications
companies, banks, retailers and Great Lakes freighters have in common? The need to generate uninterrupted power – and Toromont CAT.
02 LETTER TO SHAREHOLdERS
04 FINANcIAL HIGHLIGHTS
05 mANAGING THROUGH THE bUSINESS cycLE
18 mINING: IN FOR THE LONG HAUL
20 cImcO AT THE OLymPIcS
22 A bATTLEFIELd SOLUTION FOR PUbLIc wORkS cONTRAcTORS
23 TOROmONT IN THE cOmmUNITy
24 cUSTOmER SUPPORT: ANNUITy ANd OPPORTUNITy
26 TOROmONT ANd THE ENvIRONmENT
28 cORPORATE GOvERNANcE
29 bOARd OF dIREcTORS
30 md&A
51 mANAGEmENT’S ANd AUdITORS’ REPORTS
52 FINANcIALS
contentsToromont marked new milestones in 2008, including 40 years as a public company and 40 years of consecutive dividend payments. In this report, we look closely at what has contributed to the company’s long-term success, including its steady and proven approach to shareholder and customer value creation, well diversified markets and strong capital structure.
2 | TOROMONT 2008 ANNUAL REPORT
we are pleased to report that Toromont once again set new performance records in 2008 while also celebrating two milestones: 40 years as a listed issuer on the Toronto
Stock Exchange and 15 years as a Caterpillar dealer.Financially, we achieved revenue growth from continuing
operations for the 16th straight year, despite economic turbulence in many markets. Consolidated revenues surpassed $2 billion, up 12% from 2007.
Both operating groups contributed to milestone results. Compression Group revenues climbed 30% to $1 billion, spurred by rapid growth in our U.S. natural gas compression business.
Equipment Group revenues of $1.1 billion were even with records set in 2007, on the strength of record rental volumes and increased product support business on our larger installed base.
Net income rose 15% to a record $140.5 million and basic per share earnings increased 14% to a record $2.16.
PERFORmANcE bEyONd THE bUSINESS cycLEWe are proud of our long history of growth and exceptional performance through several business cycles: n Return on opening shareholders’ equity has averaged 18.2%
over the last 10 years, and was 21.5% in 2008. n Net income has climbed an average of 14% a year for the last
10 years.n Dividends have increased in each of the last 20 years, including
the 7% increase recently authorized by your Board. 2008 marked the 40th straight year of dividend payments since Toromont went public in 1968.
n Total return to shareholders including reinvested dividends
has averaged 13% over 10 years, versus 5% for the S&P/TSX. n The Company has generated $268 million in free cash flow
over the past decade and we ended 2008 with net debt to shareholders’ equity of 0.05:1. As a result, we entered the current phase of the economic cycle in a solid financial position.
bUILT FOR THE LONG HAULWe are in business for the long haul. For customers, this means supporting our equipment long after sale. For shareholders, it means holding ourselves accountable for long-term performance. Our primary financial goals are 18% return on equity and 10% income growth over the business cycle while maintaining financial strength to weather downturns and capitalize on opportunities whenever they arise.
2008 PROGRESS REPORTOver the past five years, we invested $311 million to strengthen Toromont’s market leadership positions, better serve our customers, increase efficiencies, improve employee health and safety, and to grow.
A key investment in 2008 was the expansion of the Toromont Energy Systems Inc. (TESI) manufacturing plant in Casper, Wyoming. When complete, the facility will include almost 200,000 square feet of production space.
This US$10 million investment, as well as others over the past five years in our Houston and Casper plants and multiple sales and service offices, have allowed Toromont to establish a substantial platform in the U.S. market for compression and process equipment. In 2008, the U.S. contributed 56% of our Compression Group revenue, compared to 44% in 2007.
Toromont’s Compression Group is very diversified in terms of applications and regional markets served. Orders received included:n a $20 million order for a gas storage plant in California;n a $44 million order from an integrated energy company for its new
pipeline serving the midwest and northeast United States, which is scheduled to enter service in 2010 or 2011;
n a $5 million order to build a processing plant that will deliver liquid CO2 to developing energy resource plays in northwestern Alberta and northeastern British Columbia;
n a strong volume of recreational ice rink projects including headline work for the National Hockey League’s “Winter Classic” in Chicago, plus industrial refrigeration projects for companies such as Wal-Mart, Nova Chemicals, Maple Leaf Foods, Nestlé and Tyson Foods; and
n work for the Rockies Express Pipeline also continued and was a significant contributor to revenue.
dear Fellow ShareholdersTOROMONT WAS BUILT TO DELIVER RESULTS, NOT JUST IN GOOD TIMES, BUT OVER A BUSINESS CYCLE. OUR STEADY PERFORMANCE THROUGH MANY CYCLES PROVES WHAT CAN BE ACCOMPLISHED WITH A DISCIPLINED, SHAREHOLDER-FOCUSED APPROACH.
TOROMONT 2008 ANNUAL REPORT | 3
Progress, measured by financial performance and improved positioning, is also clearly evident within the Equipment Group.n We delivered equipment to Agrium’s Kapuskasing, Ontario
phosphate mine, Goldcorp for its Red Lake, Musselwhite and Hoyle Pond projects in Ontario, and Agnico-Eagle Mines Ltd. for its Meadowbank project in Nunavut;
n We designed and built a 5.2 megawatt co-generation plant for Markham District Energy to serve the power needs of that growing community;
n We continued to enjoy the benefits of our Caterpillar MaK engine dealership for the Great Lakes region, awarded in 2006. Since then, Toromont CAT has generated $49 million in marine power sales and entered 2009 with a substantial marine power backlog;
n Battlefield – The CAT Rental Store opened a new store in Sault Ste. Marie in 2008 to expand its northern Ontario reach and invested over $20 million in its rental equipment fleet;
n Toromont CAT secured rights to represent Metso Corporation’s line of moveable crushers. This product enables us to further leverage the strength of our sales and service infrastructure and serve the specialized needs of customers in the aggregate industry – a sector that is expected to benefit from spending on roads and construction; and
n Recent government announcements lead us to believe that infrastructure activity may become even more significant for us in 2009 and 2010.
dEPARTURES ANd TRANSITIONSIn June of 2008, the operations of Aero Tech Manufacturing Inc. were sold to its management team, led by Tim Riley. Aero Tech has been a steady contributor to Toromont’s profitability for 30 years but it has little in common with our other businesses. We wish Tim and his team all the best for future success.
Also in 2008, we “allowed” Wayne Hill to return to retirement. Wayne had agreed to come out of retirement to help with the transition when I resumed the CEO position in 2006. Wayne is one of the builders of the organization that Toromont is today. I wish him happiness in retirement and will continue to appreciate his ongoing sage advice as a Director of the Company.
LOOkING AHEAdWith 40 years in the books as a public company, Toromont has been through business cycles before. We acknowledge that this recession will be more difficult and will require extra diligence on the part of our management team. Indeed, action plans were implemented in the third quarter of 2008.
We will not compromise our long-term focus on shareholder value. We will continue to invest in our businesses while employing an approach to cost and risk management that is appropriate for volatile conditions. At the same time, our management teams are focused on ensuring operational excellence is achieved with a particular eye to cost control and working capital management.
In markets where only the strong will thrive, we believe Toromont is well positioned. We entered this downturn with the strongest balance sheet in our history. Year-end backlogs in the Compression and Equipment Groups were strong. Our substantial product support business, while not impervious to slowdowns, will help to sustain us.
In 2009, we will use our strength to support our customers, further solidify our leading market positions, and capitalize on opportunities for expansion. The preservation of sales, engineering design and service capabilities will ensure that we can capitalize on opportunities when they are presented.
With the strength of our team of over 4,500 dedicated employees, we remain confident in Toromont’s future.
My sincere thanks to all customers, shareholders, Board members and employees for being part of another great year at Toromont.
Yours sincerely,
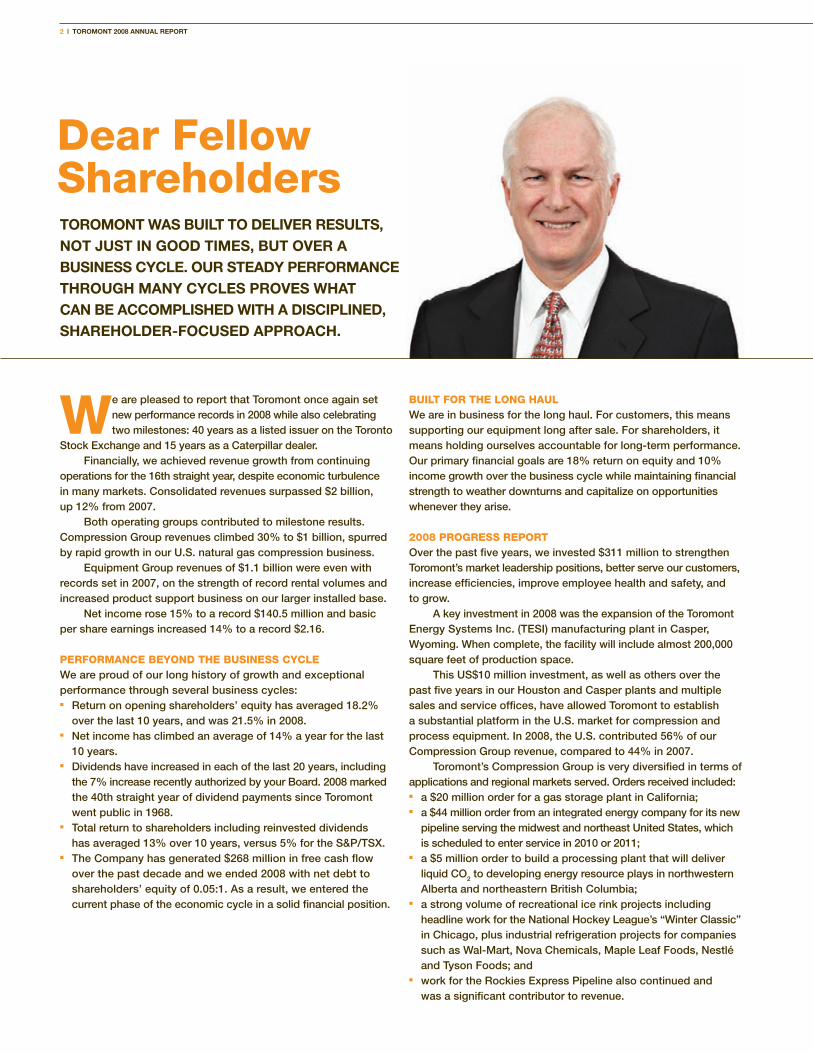
Robert M. OgilvieChairman of the Boardand Chief Executive Officer
4 | TOROMONT 2008 ANNUAL REPORT
Toromont believes in employee share ownership. In 2008, the Company enhanced its employee share ownership program with a goal of encouraging all employees to become owners. For every $3 that an employee contributes to the Employee Share Purchase Plan, the Company invests $1 to a maximum of
$1,000 per year. Prior to launching the program, 28% of employees were shareholders, by year end 2008, 39% were shareholders.
Together with the Board of Directors, Toromont employees own more than 3.5 million shares of the Company. TIH
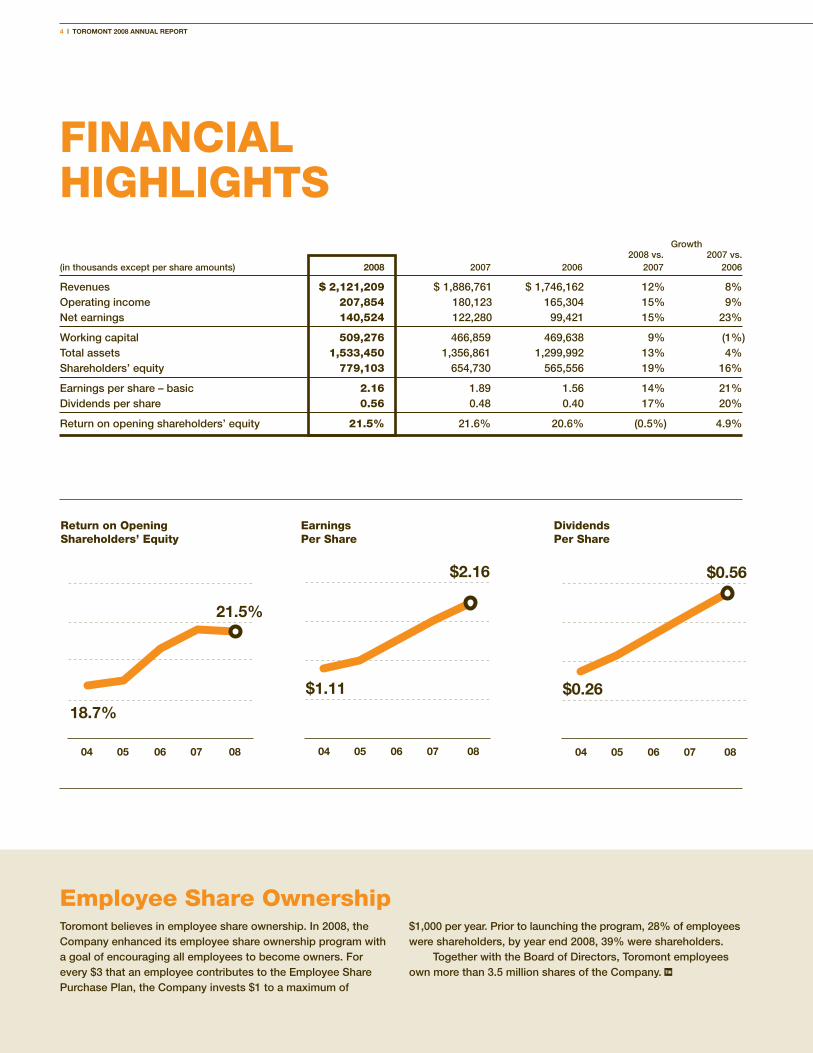
FINANcIAL HIGHLIGHTS Growth 2008 vs. 2007 vs.(in thousands except per share amounts) 2008 2007 2006 2007 2006
Revenues $ 2,121,209 $ 1,886,761 $ 1,746,162 12% 8%Operating income 207,854 180,123 165,304 15% 9%Net earnings 140,524 122,280 99,421 15% 23%
Working capital 509,276 466,859 469,638 9% (1%)Total assets 1,533,450 1,356,861 1,299,992 13% 4%Shareholders’ equity 779,103 654,730 565,556 19% 16%
Earnings per share – basic 2.16 1.89 1.56 14% 21%Dividends per share 0.56 0.48 0.40 17% 20%
Return on opening shareholders’ equity 21.5% 21.6% 20.6% (0.5%) 4.9%87 88 90 92 94 96 98 00 03 06 08
04 05 06 07 08 04 05 06 07 0804 05 06 07 08
18.7%
21.5%
26.4%
$0.26
$0.56
20.6%
Return on Opening Shareholders’ Equity
dividends Per Share
Earnings Per Share
04 05 06 07 08
$1.11
$2.16
87 88 90 92 94 96 98 00 03 06 08
04 05 06 07 08 04 05 06 07 0804 05 06 07 08
18.7%
21.5%
26.4%
$0.26
$0.56
20.6%
Employee Share Ownership
TOROMONT 2008 ANNUAL REPORT | 5
EQUIPmENT GROUP SOURcES OF REvENUE
Other Equipment Sales 10%
Infrastructure 12%
Construction 9%
Mining 9%
Engines 8%
Industrial 7%
Aggregates 4%
Product Support 26%
Power Generation 1%
Rental 14%
EQUIPMENT SALES (59%)
cOmPRESSION GROUP SOURcES OF REvENUE
U.S. Natural Gas 41%
Cdn Natural Gas 13%
Process Systems 12%
Refrigeration Systems 12%
Rental 2%
Product Support 20%
EQUIPMENT SALES (78%)
mANAGING FOR THE bUSINESS cycLEToromont manages for the business cycle using
a pragmatic approach that has, at its core, some basic beliefs:
n The first job of any business is to allocate capital to achieve shareholder objectives.
n Market leadership supported by a strong balance sheet is the best way to drive shareholder and customer value.
n Decentralized management teams empower decision making in the field.
n Business leaders care more when they have a personal stake in the outcome of decisions made.
n Management discipline counts as much as strategy in achieving results.
n Ethical behaviour and concern for employee safety should underlie all business activities.
Our approach also acknowledges a simple truth: that capital spending is cyclical and building a consistent performance capability is central to the delivery of returns over business cycles.
To manage for the business cycle, Toromont: n supplies specialized capital equipment and supports that
equipment for the long term – a business model that is designed to have a stabilizing effect on revenue, generate attractive returns and keep the Company focused on value-added, rather than commoditized equipment;
n uses a decentralized approach to management, which strengthens the speed and quality of capital allocation and decision-making and engenders an entrepreneurial spirit by ensuring, through compensation tied to results and the requirement to own shares, that business unit leaders have a personal stake in the outcome of their decisions and have an economic alignment of interests with public shareholders;
n pursues specific corporate performance targets (income growth and after-tax return on equity) and business unit objectives (return on capital employed) over a business cycle that are considered key measures of shareholder value creation, while ensuring it maintains a strong balance sheet at all times;
n encourages its business units to pursue revenue diversification but only by entering markets where there is the prospect of achieving leadership, differentiation, the opportunity to deliver after-sale service and target investment returns.
“We have two very recent examples of the benefit of revenue diversification within our business units,” said Paul R. Jewer, Vice President Finance and Chief Financial Officer. “The diversity of industries served has benefitted the Equipment Group in recent years as growth in mining has more than compensated for declines in forestry and housing. We’ve also seen the benefit of geographic diversification as growth in the U.S. has fueled TESI’s growth, even as markets in Canada went soft.”
Over the years, Toromont’s management processes and financial targets have been refined and tied to performance-based compensation. New industrial and geographic markets have been entered organically and by way of acquisition. The asset base has grown from $45.7 million in 1986 to $1.5 billion at year end 2008.
Yet despite enormous change and progress, the Company’s core business model and decentralized management approach are pretty much the same as they were two decades ago. If the test of discipline is best measured in years, Toromont’s consistency over nearly a quarter of a century is a distinguishing trait. TIH
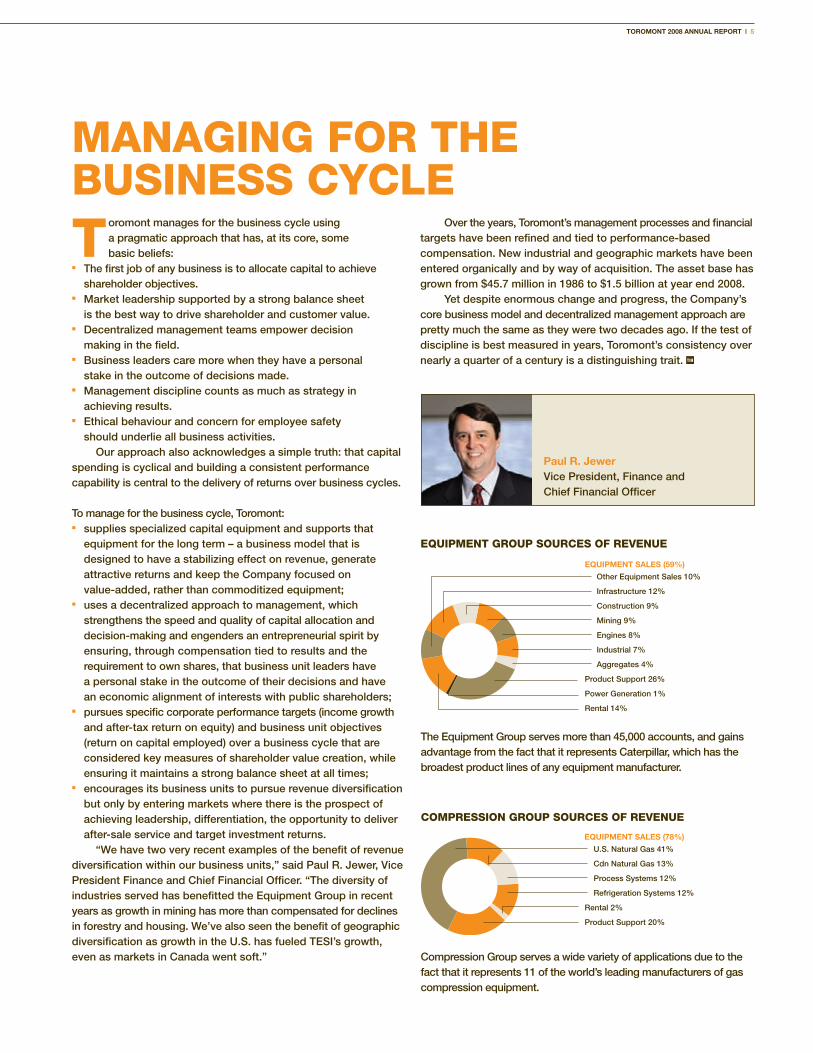
Paul R. Jewer Vice President, Finance and Chief Financial Officer
The Equipment Group serves more than 45,000 accounts, and gains advantage from the fact that it represents Caterpillar, which has the broadest product lines of any equipment manufacturer.
Compression Group serves a wide variety of applications due to the fact that it represents 11 of the world’s leading manufacturers of gas compression equipment.
6 | TOROMONT 2008 ANNUAL REPORT
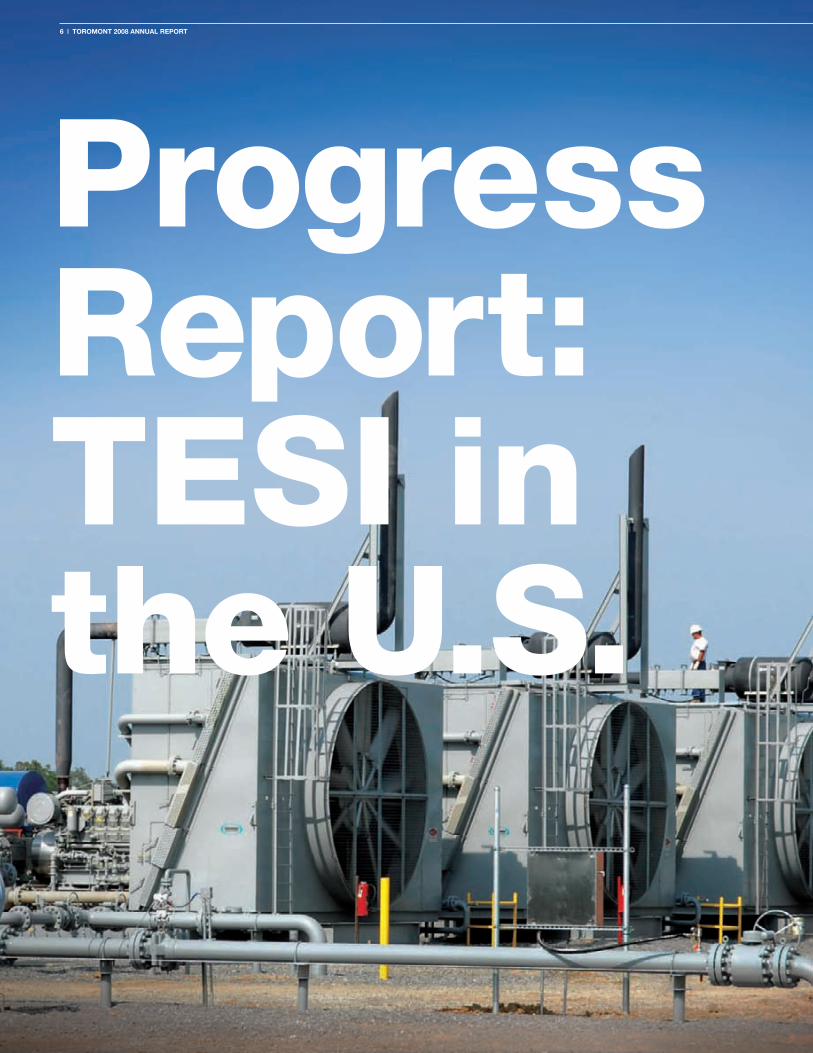
Progress Report:TESI inthe U.S.
TOROMONT 2008 ANNUAL REPORT | 7
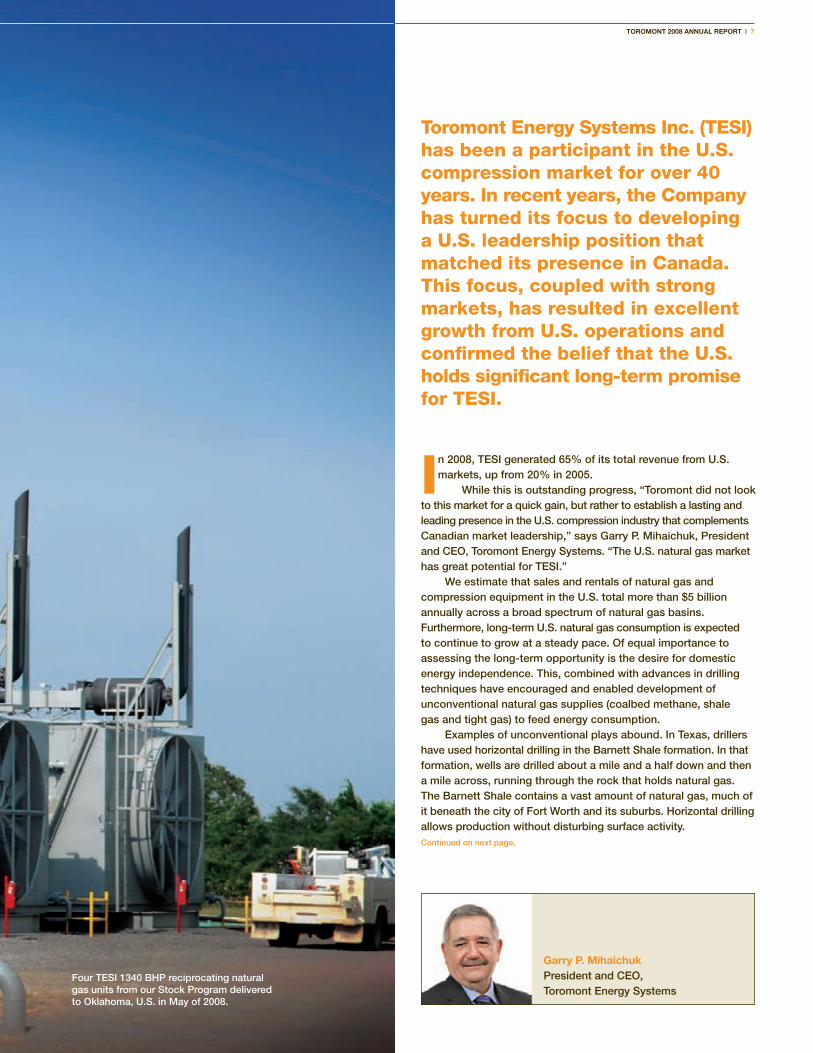
I n 2008, TESI generated 65% of its total revenue from U.S. markets, up from 20% in 2005.
While this is outstanding progress, “Toromont did not look to this market for a quick gain, but rather to establish a lasting and leading presence in the U.S. compression industry that complements Canadian market leadership,” says Garry P. Mihaichuk, President and CEO, Toromont Energy Systems. “The U.S. natural gas market has great potential for TESI.”
We estimate that sales and rentals of natural gas and compression equipment in the U.S. total more than $5 billion annually across a broad spectrum of natural gas basins. Furthermore, long-term U.S. natural gas consumption is expected to continue to grow at a steady pace. Of equal importance to assessing the long-term opportunity is the desire for domestic energy independence. This, combined with advances in drilling techniques have encouraged and enabled development of unconventional natural gas supplies (coalbed methane, shale gas and tight gas) to feed energy consumption.
Examples of unconventional plays abound. In Texas, drillers have used horizontal drilling in the Barnett Shale formation. In that formation, wells are drilled about a mile and a half down and then a mile across, running through the rock that holds natural gas. The Barnett Shale contains a vast amount of natural gas, much of it beneath the city of Fort Worth and its suburbs. Horizontal drilling allows production without disturbing surface activity. Continued on next page.
Toromont Energy Systems Inc. (TESI) has been a participant in the U.S. compression market for over 40 years. In recent years, the company has turned its focus to developing a U.S. leadership position that matched its presence in canada. This focus, coupled with strong markets, has resulted in excellent growth from U.S. operations and confirmed the belief that the U.S. holds significant long-term promise for TESI.
Four TESI 1340 BHP reciprocating natural gas units from our Stock Program delivered to Oklahoma, U.S. in May of 2008.
Garry P. Mihaichuk President and CEO, Toromont Energy Systems

8 | TOROMONT 2008 ANNUAL REPORT
�
�
��
�
�
�
�
�
�
�
�
Sales, Rentals & Service (CAN)
Sales, Rentals, Fabrication & Service (U.S.)
Service Location (U.S.)
Sales Location (U.S.)
Satellite Location
Head Office & Fabrication Facility (CAN)
Head Office (U.S.)
In the San Juan Basin in New Mexico and Colorado, the Black Warrior Basin in Alabama, the Powder River Basin in Wyoming, and the northern and central Appalachian Basins in the eastern U.S., coalbed methane reserves have been proven and are being exploited. Coalbed methane is attractive for a number of reasons. The reserves support higher well density compared with conventional reserves, and much of it is relatively close to the surface. These factors mean that drilling and well completions are more cost effective. Additionally, since the coal sources in the U.S. are well known, finding deposits is a much easier process than traditional exploration drilling.
The Wyoming Oil & Gas Conservation Commission stated that more than 30,000 coalbed methane wells had been drilled in the Powder River Basin as of 2008, up almost ten-fold from the 3,221 drilled up to the end of 1999. Production from the Powder River Basin has climbed from 159 million cubic feet a day in 1999 to 1.45 billion cubic feet a day at the end of 2008. TESI has been serving this growing market since 1998.
Unconventional plays require a considerable amount of compression and in many cases, not just any form of compression. The cold-weather location of many of these natural gas projects is perfectly suited to one of TESI’s unique strengths: the expertise to design, engineer, build and support cold-weather compression packages.
This capability was forged in Canada, where TESI’s compression systems are rated specifically for deep freeze temperatures. Self-contained, these cold weather packages include special heating and insulation. Modular in nature, they are also easy to customize and quick to build. Competitively priced, these packages have been quick to win over U.S. customers that previously had only warm weather equipment to choose from.
To serve cold weather markets such as Wyoming, Colorado and parts of Utah, TESI acquired a small manufacturing facility in Casper, Wyoming in January of 2006. At the time of acquisition, the Casper plant employed 26 people in a 40,000 square foot space. Subsequent expansions, including one now nearing completion, will make this facility one of TESI’s largest, with 350 employees and 200,000 square feet.
Having a fully capable plant close to natural gas projects gives TESI a cost and delivery advantage. Revenues for the Wyoming plant more than doubled in 2008 from 2007.
TESI derives additional strength from its 100,000 square foot Houston facility, which specializes in reciprocating compression and high specification compression and processing. Revenues from this facility have increased by 42% on average in each of the past five years.
To meet customer need and as a demonstration of its commitment to the American natural gas industry, TESI’s U.S. footprint also includes nine service and sales
locations. Consistent with Toromont’s overall business model and approach, TESI’s infrastructure enables it to maintain equipment in the field. The sale of parts and service to keep compression and process systems operating at all times is an emerging source of U.S. revenue.
As part of its long-term strategy, TESI is active in upstream, midstream and downstream segments of the U.S. market. (See Expanding on Compression page 9.) Customer wins to date have been exciting.
The U.S. pipeline business, which has seen tremendous investment in the past few years, has been a source of great opportunity to date. In 2008, TESI delivered compression equipment to both the Midcontinent Express Pipeline, a 507-mile pipeline from Oklahoma to Alabama, and the Rockies Express Pipeline, a 1,679-mile pipeline from Colorado to Ohio. These assignments represented over $120 million of business.
In 2009, TESI will provide a compression system for a gas storage facility in California. This $20 million order will see TESI’s Casper plant supply five 10,000 horsepower compressors to the storage facility. This is one of many orders that contributed to TESI’s attractive year-end backlog.
Near term, the compression industry will be challenged by the U.S. recession and its impact on natural gas prices. Long term, management is confident that market fundamentals are positive, and that TESI is well situated to continue its path to market leadership. TIH
For over 30 years, Toromont has been leading the industry in the re-engineering and reconfiguration of gas compressor packages. We now have full retrofit services capabilities both in the U.S. and Canada.
TESI IN NORTH AmERIcA
TOROMONT 2008 ANNUAL REPORT | 9
Expanding on compression:TESI in Profile
Those new to the Toromont story usually have an easier time understanding the Equipment Group side of the business than they do the Compression Group, and more particularly
Toromont Energy Systems Inc.’s (TESI) operations and contribution. This is probably due to the fact that for many, seeing Caterpillar equipment in operation daily provides a more visible and tangible connection. On the other hand, TESI’s equipment runs 24/7, usually in remote locations, in support of applications that are not as easily understood.
We decided to demystify part of the story by highlighting one of the companies in Compression Group – TESI and its main market of natural gas compression. (Compression also has solutions for fuel gas, carbon dioxide, industrial and recreational and process applications).
On the surface, the business of natural gas seems straightforward. Explorers find it, producers drill and produce it, mid-streamers gather and process it, pipeliners ship and store it, distributors transfer it and businesses, utilities and consumers use it.
Along the way, many types of equipment are used to enable natural gas to flow at desired rates, beginning with upstream applications. It is here that TESI’s equipment first comes into play.
UPSTREAmFor TESI, the opportunity begins when natural gas is to be brought to the surface. This can occur either “naturally” by the pressure within the reservoir or “assisted” by the use of gas lift devices. As the well is produced, the reservoir pressure drops, which reduces the flow rate of the natural gas. To maintain or increase the flow rate of natural gas, producers compress or pressurize the gas on the surface using either a reciprocating or a rotary screw compression system. In a rotary screw compression system, interlocking spiral rotors twist together, squeezing the gas to reduce its volume, and then eject it into an outtake pipe at a pressure up to 300 pounds per square inch (psi). A reciprocating compressor has pistons moving back and forth to compress the gas, generally at much higher pressures than rotary screw compressors. The pressure generated from either system allows the gas to move through the gathering pipeline system. The choice of reciprocating versus screw depends on the application and, sometimes, customer preference.
The compressor systems can be configured with scrubbers to clean water and condensates from the natural gas, along with large particles produced from the reservoir.
An average natural gas project might need one compressor for each well or it might connect several wells to a common compressor. Systems designed by TESI reflect the individual characteristics of the well and the most optimum configuration to save costs through centralization.
No two wells are exactly the same. While one may have a high volume of gas under low pressure, another may have low volumes at high pressure. Together with customers, TESI custom engineers systems with rotors of the right diameter and length or pistons of various sizes and stages (numbers of cylinders) to achieve the desired balance of pressure and volume for the output. Continued on next page.
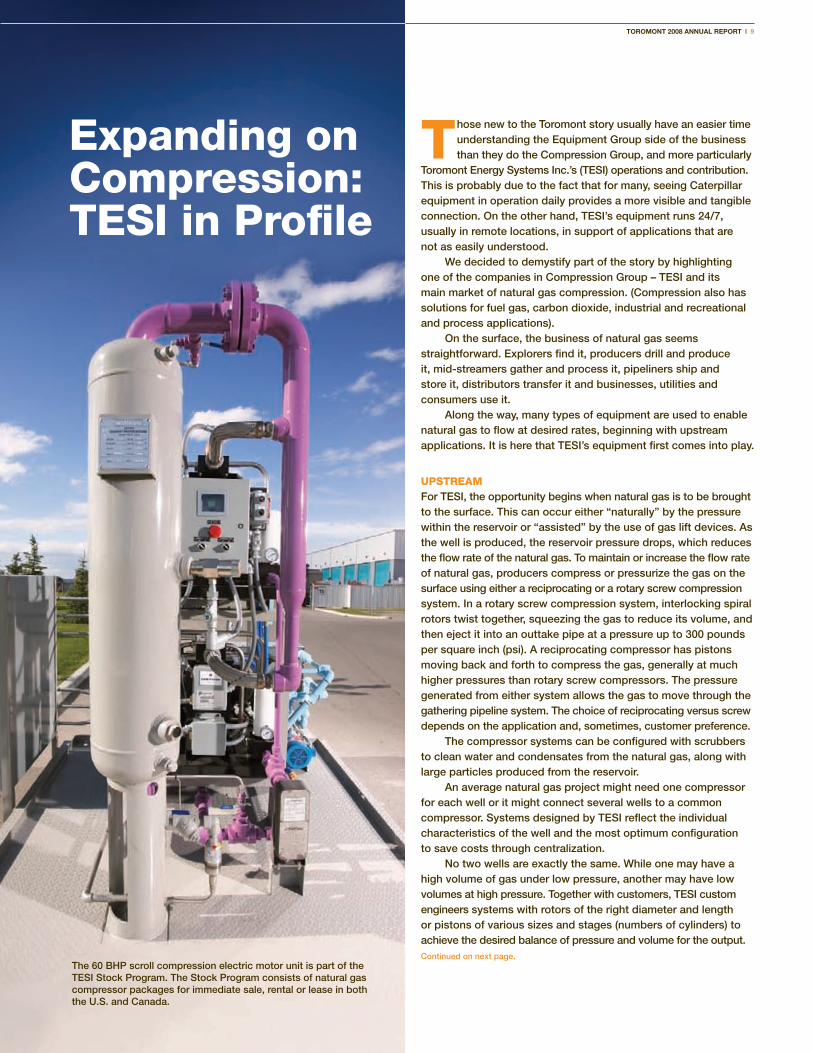
The 60 BHP scroll compression electric motor unit is part of the TESI Stock Program. The Stock Program consists of natural gas compressor packages for immediate sale, rental or lease in both the U.S. and Canada.
10 | TOROMONT 2008 ANNUAL REPORT
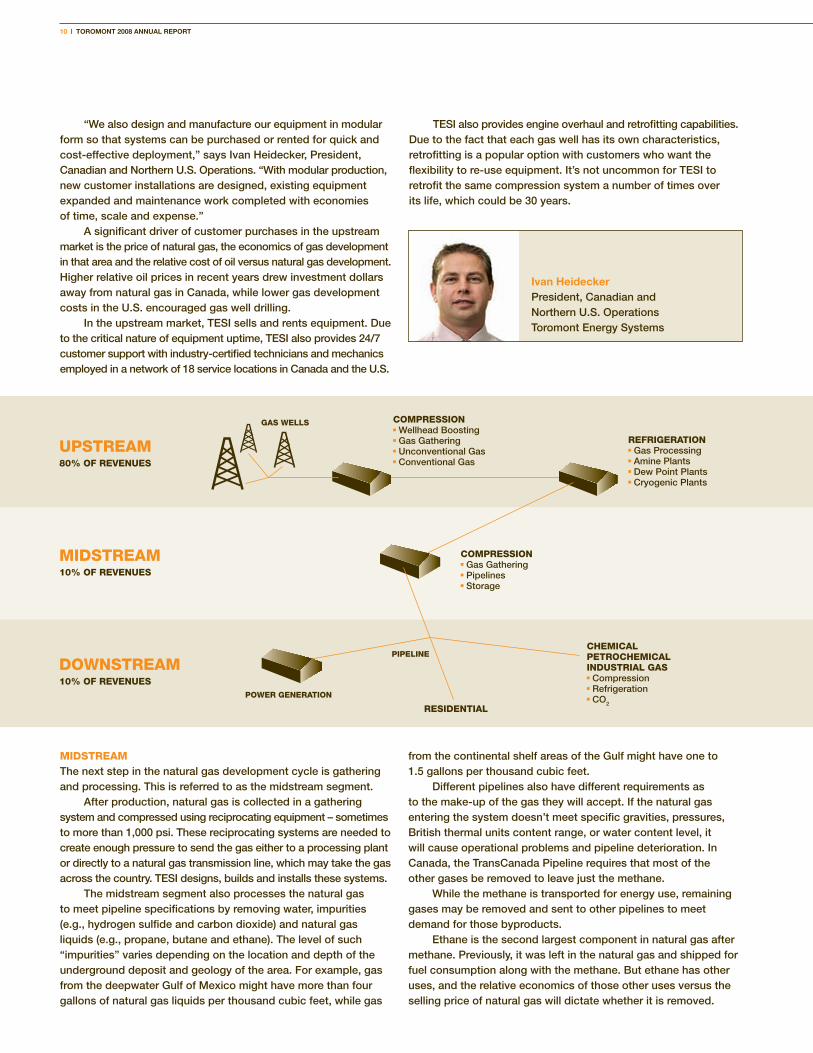
mIdSTREAmThe next step in the natural gas development cycle is gathering and processing. This is referred to as the midstream segment.
After production, natural gas is collected in a gathering system and compressed using reciprocating equipment – sometimes to more than 1,000 psi. These reciprocating systems are needed to create enough pressure to send the gas either to a processing plant or directly to a natural gas transmission line, which may take the gas across the country. TESI designs, builds and installs these systems.
The midstream segment also processes the natural gas to meet pipeline specifications by removing water, impurities (e.g., hydrogen sulfide and carbon dioxide) and natural gas liquids (e.g., propane, butane and ethane). The level of such “impurities” varies depending on the location and depth of the underground deposit and geology of the area. For example, gas from the deepwater Gulf of Mexico might have more than four gallons of natural gas liquids per thousand cubic feet, while gas
“We also design and manufacture our equipment in modular form so that systems can be purchased or rented for quick and cost-effective deployment,” says Ivan Heidecker, President, Canadian and Northern U.S. Operations. “With modular production, new customer installations are designed, existing equipment expanded and maintenance work completed with economies of time, scale and expense.”
A significant driver of customer purchases in the upstream market is the price of natural gas, the economics of gas development in that area and the relative cost of oil versus natural gas development. Higher relative oil prices in recent years drew investment dollars away from natural gas in Canada, while lower gas development costs in the U.S. encouraged gas well drilling.
In the upstream market, TESI sells and rents equipment. Due to the critical nature of equipment uptime, TESI also provides 24/7 customer support with industry-certified technicians and mechanics employed in a network of 18 service locations in Canada and the U.S.
TESI also provides engine overhaul and retrofitting capabilities. Due to the fact that each gas well has its own characteristics, retrofitting is a popular option with customers who want the flexibility to re-use equipment. It’s not uncommon for TESI to retrofit the same compression system a number of times over its life, which could be 30 years.
from the continental shelf areas of the Gulf might have one to 1.5 gallons per thousand cubic feet.
Different pipelines also have different requirements as to the make-up of the gas they will accept. If the natural gas entering the system doesn’t meet specific gravities, pressures, British thermal units content range, or water content level, it will cause operational problems and pipeline deterioration. In Canada, the TransCanada Pipeline requires that most of the other gases be removed to leave just the methane.
While the methane is transported for energy use, remaining gases may be removed and sent to other pipelines to meet demand for those byproducts.
Ethane is the second largest component in natural gas after methane. Previously, it was left in the natural gas and shipped for fuel consumption along with the methane. But ethane has other uses, and the relative economics of those other uses versus the selling price of natural gas will dictate whether it is removed.
UPSTREAM80% OF REVENUES
COMPRESSION� Wellhead Boosting� Gas Gathering� Unconventional Gas� Conventional Gas
COMPRESSION� Gas Gathering� Pipelines � Storage
CHEMICALPETROCHEMICALINDUSTRIAL GAS� Compression� Refrigeration� CO2
REFRIGERATION� Gas Processing� Amine Plants� Dew Point Plants� Cryogenic Plants
RESIDENTIAL
GAS WELLS
PIPELINE
POWER GENERATION
MIDSTREAM10% OF REVENUES
DOWNSTREAM10% OF REVENUES
Ivan Heidecker President, Canadian and Northern U.S. OperationsToromont Energy Systems
In Canada, ethane is sometimes removed through a cryogenic (low temperature) process that cools the gas to about –120° Fahrenheit. Then it can be shipped on the 1,324-kilometre long Alberta Ethane Gathering System to Joffre or Fort Saskatchewan, Alberta, where it’s used to make polyethylene, a substance used in products such as grocery and milk bags, and wire and cable coatings. Demand for polyethylene is tightly linked to economic growth.
The market for ethane also depends on variables such as the ratio of gas to oil prices, processing margins and the cost of removing ethane from the gas compared with the selling price.
There are more than 1,000 gas processing plants in Alberta alone, with some operated by producers, and some operated by companies that focus on midstream services only and don’t own the gas.
The equipment needed in a gas processing plant will vary depending on the nature of the gas. Sour gas, for example, is raw gas that has a heavy concentration of hydrogen sulfide, a toxic gas. Many
metals are sensitive to hydrogen sulfide, requiring TESI to once again custom design the equipment with that in mind. The gas processing plant would remove the hydrogen sulfide from the gas and convert it to common sulphur used in fertilizers and other products.
CO2 is another common component of natural gas that can be stripped out of the gas stream and sold. Consumer applications include soft drinks and soda water, fire extinguishers and decaffeinated coffee. On the energy side, CO2 can be injected into oil and gas reservoirs to increase recovery. A side benefit of the CO2 injection is that it will be trapped underground where it can’t contribute to global warming.
TESI is a market leader in this area and sees CO2 processing, transmission and injection/storage as growth opportunities.
Says Jerry A. Fraelic, TESI’s President U.S. Operations, “In both process and compression, engineering capabilities broaden TESI’s addressable markets, but in process, these skills set the Company apart. Building a large process plant is
complex work, often requiring as many as 9,500 engineering and design hours to complete. TESI’s extensive engineering resources and track record are key selling points for process customers.”
dOwNSTREAmThe downstream natural gas business broadly refers to the end user, including petrochemical plants, natural gas distributors and storage facilities.
Storage facility operators buy natural gas when prices are low, typically in the summer, and resell the natural gas when prices are higher, making a profit from the price differential. Compression is needed to enable the gas to be injected into the storage reservoir.
The systems TESI designs, builds and installs for customers in this market segment are reciprocating compressors that are driven by large gas or electric motors.
Across the spectrum, TESI has a track record of having built more than 3,000 systems – experience and expertise that have defined it as a leader in the supply of highly specified compression equipment. TIH
TOROMONT 2008 ANNUAL REPORT | 11
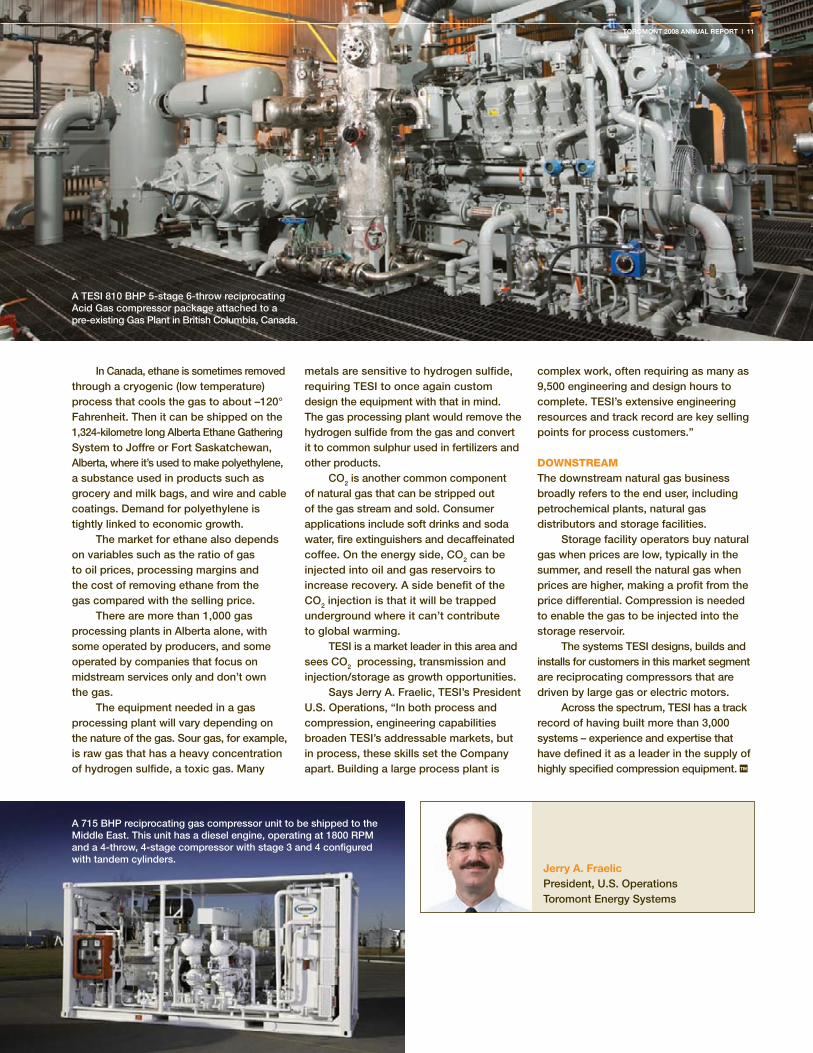
A TESI 810 BHP 5-stage 6-throw reciprocating Acid Gas compressor package attached to a pre-existing Gas Plant in British Columbia, Canada.
A 715 BHP reciprocating gas compressor unit to be shipped to the Middle East. This unit has a diesel engine, operating at 1800 RPM and a 4-throw, 4-stage compressor with stage 3 and 4 configured with tandem cylinders.
Jerry A. Fraelic President, U.S. OperationsToromont Energy Systems

12 | TOROMONT 2008 ANNUAL REPORT
Paving the road to the future
TOROMONT 2008 ANNUAL REPORT | 13
Such is the promise of unprecedented public infrastructure investments recently introduced by public
policy-makers, including our own federal government. In its January 27, 2009 budget, Ottawa announced that “the amount available to provinces, territories and municipalities for infrastructure projects will hit more than $18 billion over the next two years,” three times the amount spent over the previous two years.
For several of Toromont’s businesses, their customers and all those employed in construction, engineering and equipment supply the budget provided many exciting reasons for optimism, including:n a new $4-billion Infrastructure Stimulus
Fund specifically for road, bridge and sewer rehabilitation projects that will begin during the 2009 and 2010 construction seasons;
n $2 billion to support maintenance and repair projects at post-secondary institutions;
n $2 billion of low-cost loans to Canadian municipalities to stimulate their spending on public works;
n $515 million for “ready-to-go” First Nations infrastructure projects plus $165 million for drinking water and waste water projects in those communities;
n $500 million to support construction of new community recreational facilities – including ice rinks – and upgrades to existing facilities; and
n $323 million for the repair and restoration of federally owned infrastructure.
The budget also included $7.8 billion in tax relief and funding to stimulate the housing sector and enhance energy efficiency and $1 billion over five years for a Green Infrastructure Fund to support sustainable energy projects. These infrastructure investments complement the 7 year, $33 billion Building Canada Fund launched by the federal government in 2007.
The primary catalysts for this extraordinary level of investment are economic stimulation and job creation.
In its report “Municipal Infrastructure Projects: Key to Putting Canadians to Work,” the Federation of Canadian Municipalities (FCM) reported that local infrastructure investments employed 190,000 Canadians and contributed 2.1% of gross domestic product in 2007. The larger infusion of capital proposed in 2009 shovel-ready projects – those that can begin immediately – promises to have an even bigger impact on jobs and the economy. In late 2008, FCM published a list of 1,000 shovel-ready municipal infrastructure projects – of which 362 (representing an investment of $2.0 billion in total value) are road and bridge related.
Beyond the need for economic stimulus, there are significant reasons to invest in public infrastructure. After decades of underfunding, policy-makers are realizing now is the time to play catch-up. In a 2007 report referenced in last year’s Toromont Annual Report entitled “Danger Ahead: The Coming Collapse of Canada’s Municipal Infrastructure” FCM concluded the cost to fix the municipal infrastructure deficit had reached $123 billion.
PROjEcT POTENTIALOne of the targets of this new spending that most appeals to Toromont is road construction.
Even before the federal government announced its latest infrastructure spending initiatives – including improvements to Highways 11 and 17 in northern Ontario and to a six-kilometre stretch of the Trans-Canada Highway through Headingley, Manitoba – a surge in road building has been noted. Continued on next page.
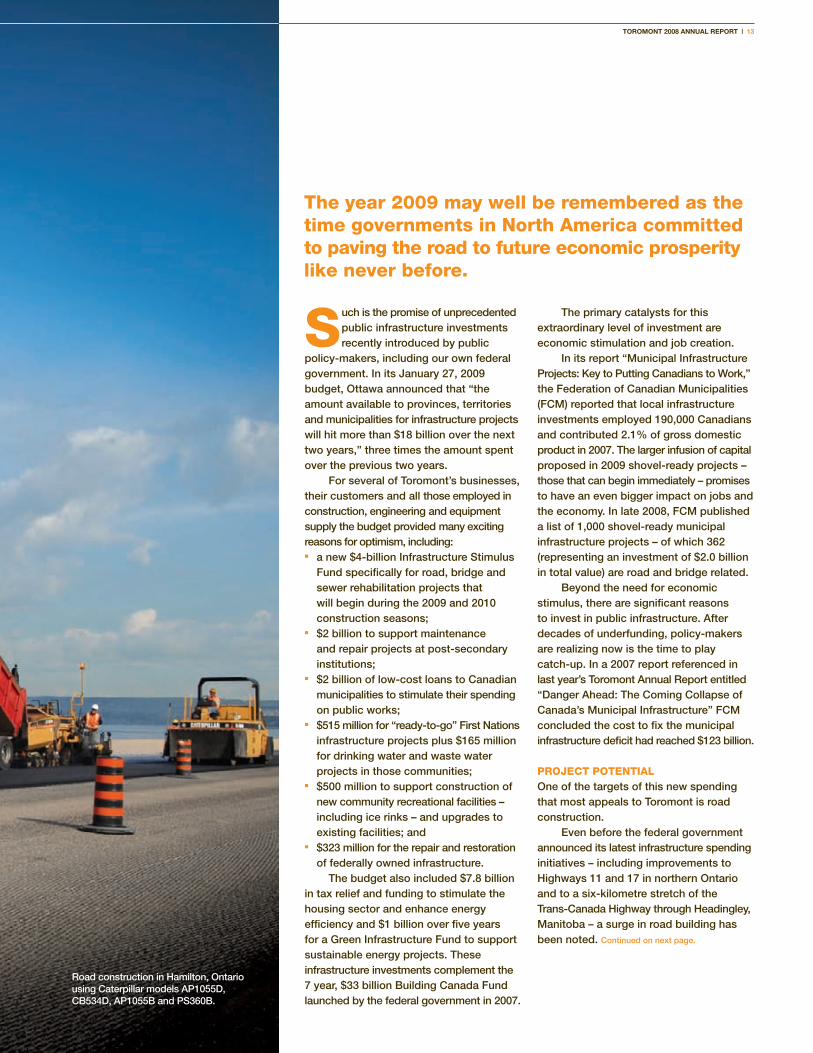
The year 2009 may well be remembered as the time governments in North America committed to paving the road to future economic prosperity like never before.
Paving the road to the future
Road construction in Hamilton, Ontario using Caterpillar models AP1055D, CB534D, AP1055B and PS360B.
For 2009, Ontario has hundreds of projects planned to expand and repair its aging highway infrastructure – 68 of which are worth more than $1 million each. The province maintains separate highway spending plans for northern and southern Ontario. In southern Ontario, projects already approved and funded include building high-occupancy vehicle lanes on Highways 404, 417 and the QEW, and widening Highway 401 to six lanes over a 12-kilometre stretch near Kingston. In central and northern Ontario, Highways 11, 69 and 17 are all being expanded.
Municipalities are also doing their part. The City of Toronto has a five-year $830 million road and related infrastructure budget and will benefit from the MetroLinx five-year $7 billion budget to improve transit.
In Newfoundland and Labrador, the government announced that it will increase infrastructure spending by more than 50% to approximately $800 million in the 2009–2010 fiscal year, and in excess of $4 billion over the next several years. Of the $800 million, $300 million is to go to transportation infrastructure, such as paving roads and highways. This is on top of the $17 million already committed to build Phase III of the Trans-Labrador Highway, a 250-kilometre section from Cartwright Junction to Happy Valley-Goose Bay.
The Manitoba government is in the third year of a $4 billion, 10-year highway renewal project. Plans include spending $85 million to upgrade Highway 75, the province’s key trade route to the U.S.
INFRASTRUcTURE’S OTHER bENEFIcIARIESThe economic benefits of increased infrastructure spending are far-reaching.
Consider the aggregate industry. To build roads and bridges, expand hospitals, and repair water systems, construction companies will need truckloads of aggregate material, including sand, gravel and crushed stone.
One kilometre of a six-lane road requires approximately 51,800 tonnes of aggregate, or 2,590 truckloads to build, according to the Ontario Stone, Sand and Gravel Association, the non-profit industry association representing over 250 sand, gravel and crushed stone producers and suppliers of valuable industry products and services.
Aggregate production requires some of the same specialized equipment used in road building, including wheel loaders, excava-tors, trucks and scrapers – and some others such as crushers and screening equipment, which Toromont now supplies (see Toromont Broadens Products on page 15).
14 | TOROMONT 2008 ANNUAL REPORT
Toromont is a prime supplier to aggregate producers. About 8% of Toromont CAT and 4% of Battlefield’s market opportunities come from aggregate customers, who collectively operate more than 3,500 pits and quarries in Ontario alone.
bUILdING mOmENTUmBeyond aggregate, infrastructure spending will drive activity and equipment usage in other areas of importance to Toromont.
Take hospital and university expansions for example. Battlefield has identified over $500 million of relevant spending in Manitoba alone in 2009.
Water projects will also put equipment to work. The City of Toronto recently awarded contracts worth $215 million to expand the capacity of Scarborough’s F.J. Horgan water treatment plant to 800 million litres a day from 570. Manitoba also has exciting potential projects in the works, including the Conawapa hydroelectric project on the Nelson River. Plans call for it to proceed in 2011 and open in 2021. Estimates suggest this project will be worth $5 billion.
The Federation of Canadian Municipalities identified 386 water and waste water projects with a total value of $2.7 billion that are shovel ready. It also describes Canada’s water and sewage infrastructure as requiring urgent rehabilitation “especially in older, large cities…”
In the field of nuclear energy, Bruce Power is now completing the reconditioning of two reactors at its generating complex on Lake Huron and is expected to begin work on two more. During the first stage of this overhaul, Battlefield provided an on-site rental capability serving 950 workers and Toromont CAT provided standby power systems.
Ontario Power Generation is upgrading transmission lines from Milton to Kincardine, Ontario – a 180-kilometre route. This is creating work for Battlefield through the key contractors.
The Portlands Energy Centre development in downtown Toronto is now well into its construction phase. When complete, this 550 MW natural gas-fired, combined cycle generation facility will help meet Toronto’s growing energy needs. Battlefield actively supports the principal contractors on this site.
For a review of how energy and other forms of infrastructure spending impact Toromont (see Power On on page 16).
By aggregating all of these projects, it’s not hard to conclude that government infrastructure spending will be good for Canada and Toromont not only in 2009 but well beyond. TIH
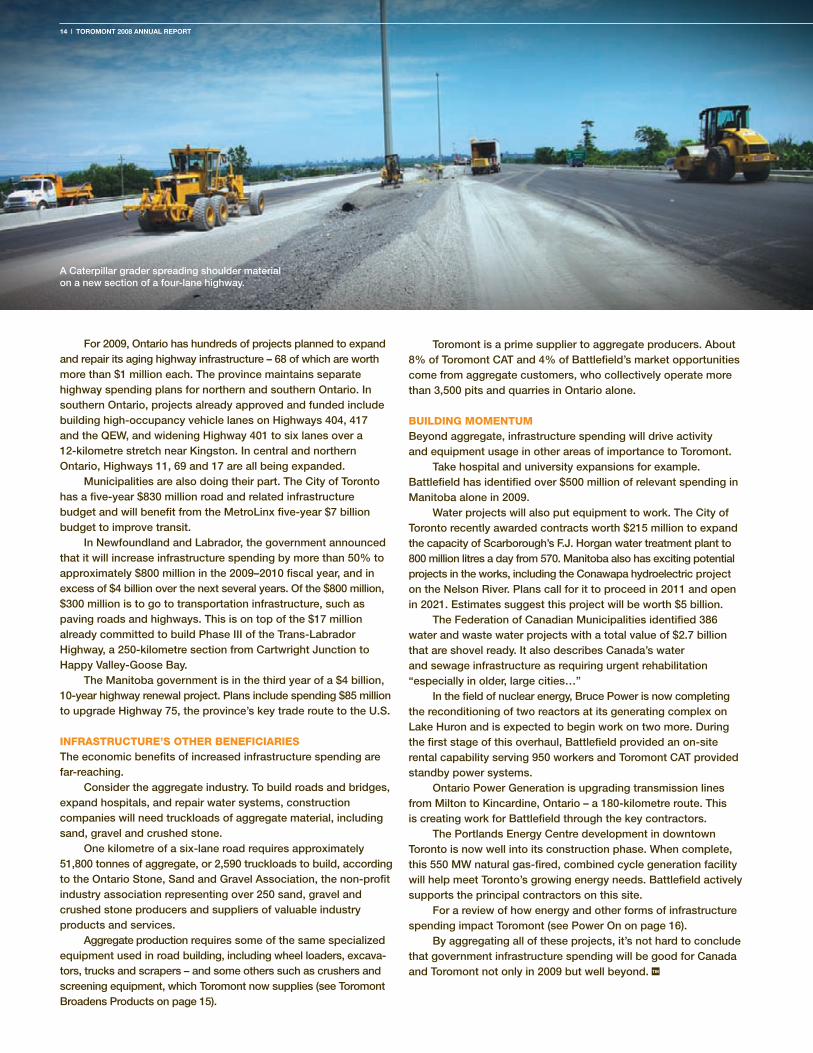
A Caterpillar grader spreading shoulder material on a new section of a four-lane highway.
TOROMONT 2008 ANNUAL REPORT | 15
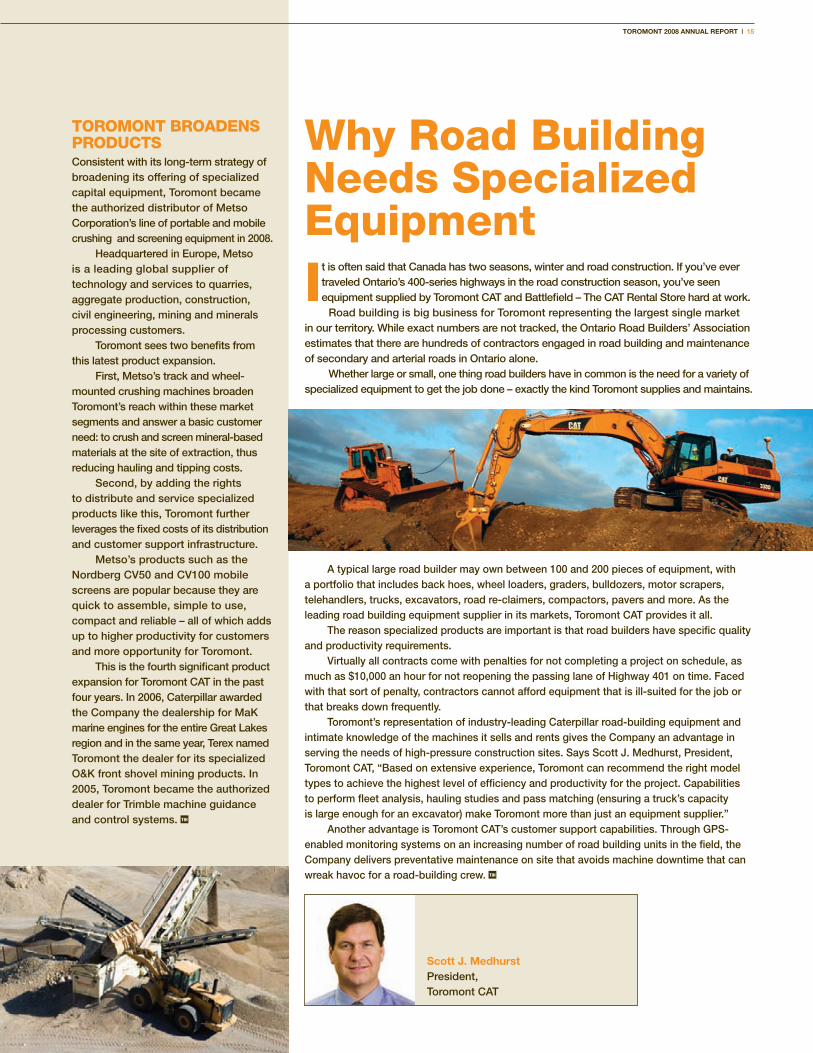
It is often said that Canada has two seasons, winter and road construction. If you’ve ever traveled Ontario’s 400-series highways in the road construction season, you’ve seen equipment supplied by Toromont CAT and Battlefield – The CAT Rental Store hard at work.
Road building is big business for Toromont representing the largest single market in our territory. While exact numbers are not tracked, the Ontario Road Builders’ Association estimates that there are hundreds of contractors engaged in road building and maintenance of secondary and arterial roads in Ontario alone.
Whether large or small, one thing road builders have in common is the need for a variety of specialized equipment to get the job done – exactly the kind Toromont supplies and maintains.
why Road building Needs Specialized Equipment
TOROmONT bROAdENS PROdUcTSConsistent with its long-term strategy of broadening its offering of specialized capital equipment, Toromont became the authorized distributor of Metso Corporation’s line of portable and mobile crushing and screening equipment in 2008.
Headquartered in Europe, Metso is a leading global supplier of technology and services to quarries, aggregate production, construction, civil engineering, mining and minerals processing customers.
Toromont sees two benefits from this latest product expansion.
First, Metso’s track and wheel-mounted crushing machines broaden Toromont’s reach within these market segments and answer a basic customer need: to crush and screen mineral-based materials at the site of extraction, thus reducing hauling and tipping costs.
Second, by adding the rights to distribute and service specialized products like this, Toromont further leverages the fixed costs of its distribution and customer support infrastructure.
Metso’s products such as the Nordberg CV50 and CV100 mobile screens are popular because they are quick to assemble, simple to use, compact and reliable – all of which adds up to higher productivity for customers and more opportunity for Toromont.
This is the fourth significant product expansion for Toromont CAT in the past four years. In 2006, Caterpillar awarded the Company the dealership for MaK marine engines for the entire Great Lakes region and in the same year, Terex named Toromont the dealer for its specialized O&K front shovel mining products. In 2005, Toromont became the authorized dealer for Trimble machine guidance and control systems. TIH
A typical large road builder may own between 100 and 200 pieces of equipment, with a portfolio that includes back hoes, wheel loaders, graders, bulldozers, motor scrapers, telehandlers, trucks, excavators, road re-claimers, compactors, pavers and more. As the leading road building equipment supplier in its markets, Toromont CAT provides it all.
The reason specialized products are important is that road builders have specific quality and productivity requirements.
Virtually all contracts come with penalties for not completing a project on schedule, as much as $10,000 an hour for not reopening the passing lane of Highway 401 on time. Faced with that sort of penalty, contractors cannot afford equipment that is ill-suited for the job or that breaks down frequently.
Toromont’s representation of industry-leading Caterpillar road-building equipment and intimate knowledge of the machines it sells and rents gives the Company an advantage in serving the needs of high-pressure construction sites. Says Scott J. Medhurst, President, Toromont CAT, “Based on extensive experience, Toromont can recommend the right model types to achieve the highest level of efficiency and productivity for the project. Capabilities to perform fleet analysis, hauling studies and pass matching (ensuring a truck’s capacity is large enough for an excavator) make Toromont more than just an equipment supplier.”
Another advantage is Toromont CAT’s customer support capabilities. Through GPS-enabled monitoring systems on an increasing number of road building units in the field, the Company delivers preventative maintenance on site that avoids machine downtime that can wreak havoc for a road-building crew. TIH
Scott J. Medhurst President,Toromont CAT
Toromont CAT, as a leading supplier of standby power systems, is part of the vital safety net used by the
financial services, communications, public sector and telecommunications industries in Canada. In fact, it designs, builds, installs and maintains standby generation equipment for many of Canada’s largest companies. As such Toromont is well positioned to capture the opportunity created by the heavy investments customers in these segments are making in their data infrastructures.
These investments are well worthwhile, considering that a power outage can mean the loss of thousands of dollars of sales – per hour – for retailers, and in the case of grocery stores, thousands more in spoiled goods.
Data centres are also a particularly large consumer of standby power. There are a significant number of data centres in the Equipment Group’s territories and quite often these facilities have not one, but two levels of back-up power. It is not uncommon for a single, large data centre to invest up to $10 million in standby power equipment. They also reinvest frequently in power systems to accommodate growth in data and advancing technology and are significant consumers of 24/7 service and maintenance – as are customers in
16 | TOROMONT 2008 ANNUAL REPORT
healthcare and life safety. Life safety applications include elevators, fire pumps and emergency lighting.
To address these applications, Toromont continues to grow its operation and maintenance services. Regular maintenance, testing and system validation ensure equipment operates as intended, when needed, reliably.
The need for worry-free power and the desire to work with an experienced and capable supplier to provide consistent and reliable support led The Home Depot to hire Toromont CAT in 2008 to maintain their standby power generation equipment across their Canadian network. For this national retailer, computerized cash registers, inventory systems and in-store lighting must operate at all times. Toromont works with the other Caterpillar dealers across the country to provide seamless support to this market leader.
dISTRIbUTEd POwERStandby isn’t the only type of power system in demand. Through public and private investments in distributed power generation, Toromont is also providing prime power in applications such as district energy plants where it has significant expertise.
District energy plants provide a promising opportunity for Canadian communities because they reduce dependence on the electrical grid and feature meaningful environmental advantages. A recent example is the Warden Energy Centre in the city of Markham.
Toromont CAT was hired by Markham District Energy to undertake a turnkey project for a natural-gas fuelled combined heat and power plant, also known as a cogeneration facility. Opened June 2, 2008, this 5.2 megawatt facility generates electricity for the local distribution grid, while the thermal energy from the plant is piped underground to Markham Centre where it is used to heat and cool commercial, residential and institutional buildings. Unlike traditional power plants that waste energy during the generation process, cogeneration technology captures a significant portion of the energy and puts it to good use.
For this project and many others, Toromont CAT provided a complete, one-stop solution, taking on the responsibility for all aspects of the project including design, construction, commissioning and ongoing operational support.
Toromont’s power systems also find homes in waste water treatment and
POwER ONThe next time you go through the checkout at your local retailer, withdraw cash from a banking machine, make a cell phone call, or watch television, odds are that the company delivering its service to you has taken substantial precautions to avoid power outages or interruptions.
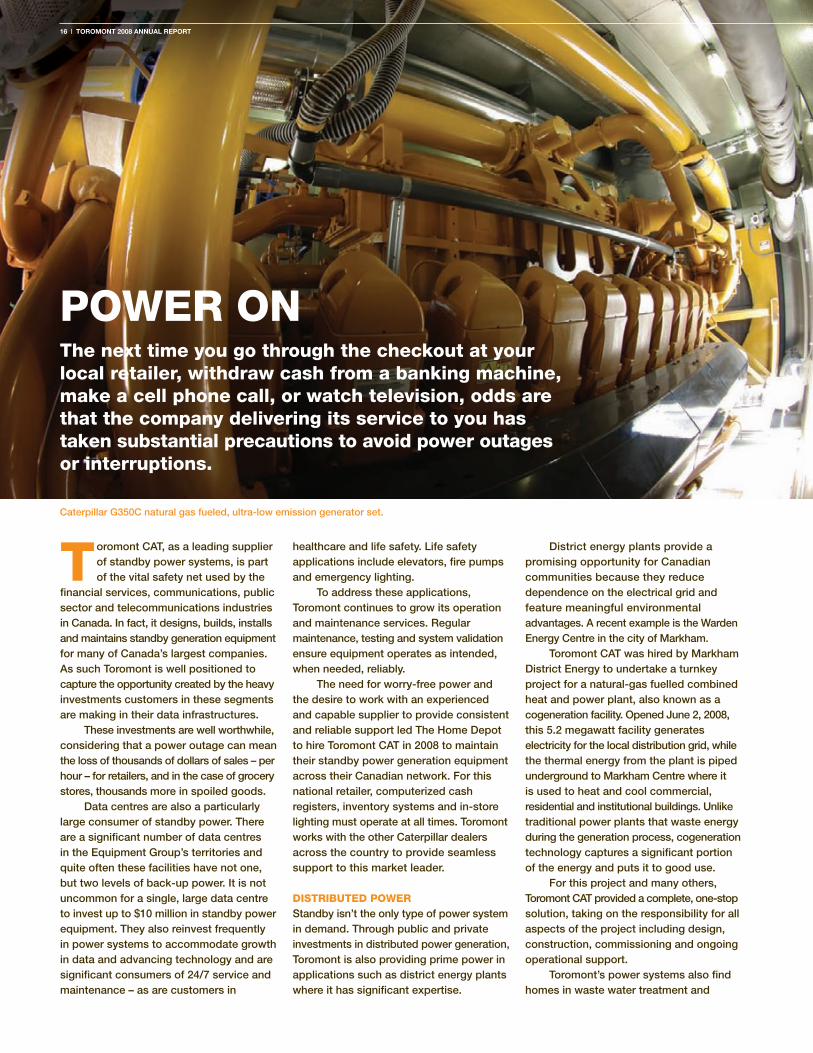
Caterpillar G350C natural gas fueled, ultra-low emission generator set.

mARINE POwER Toromont CAT doesn’t just supply power on land. For years, it has been a leading provider of marine power systems. In 2008, it delivered $25 million of marine engines used to power vessels such as Great Lakes freighters, ferries, fire boats, tugs and other commercial applications. Orders totalling another $17 million have been received for delivery in 2009 and 2010.
Since 2006, when Caterpillar named it the MaK engine dealer for the Great Lakes, Toromont’s marine power systems business has grown dramatically as customers look to the long term to ensure the viability of their industry. As such, they continue to consider prudent investments that reduce their ownership and operating costs and improve the reliability of their fleets. This has led to investments in new ships, as well as in repowering existing vessels. The benefits of lower maintenance costs, reduced fuel consumption and reduced emissions provide the incentive and reward for these investments.
mINING POwERRemote mines also need power. Toromont Power Systems is often among the first suppliers to a mine site under development. At Agnico-Eagle’s Meadowbank mine in the Kivalliq Region of Nunavut, Toromont delivered all of the power systems needed for the ongoing construction of the site in 2008 along with the first two of six generators it will provide for the main power plant. Once all equipment is in place in 2009, the power plant will provide 26 MW of electricity – enough power to operate the entire mine.
Also in 2008, Toromont shipped a multiple unit power system to Newmont Mining Corp.’s Hope Bay mine project in Nunavut. These units, with total output of 3 MW, will be used to provide power during the mine’s construction. The units will then be used as part of the standby power system for the permanent installation.
PRIvATE / PUbLIc POwERIn 2008, Toromont delivered power systems to Niigon Technologies, an injection molding facility on the Moose Deer Point First Nation near Parry Sound. This multi-million dollar facility is a private, public and First Nation partnership that is considered a new model for sustainable development in First Nation communities.
For this site, Toromont CAT supplied a complete power system that addressed two critical issues: reliability and quality of the power. Power outages wreak havoc for many types of manufacturing, especially injection molding. The standby Caterpillar 3512B diesel generator used in this application supports the operation in the event of a power outage, while the Caterpillar UPS 1200 uninterruptible power system instantly corrects for power quality issues such as voltage fluctuations as brief as a few milliseconds by monitoring utility power quality, supplying power on an as-needed basis and starting a generator backup for prolonged outages.
TOROMONT 2008 ANNUAL REPORT | 17
landfill-gas-to-energy applications. The Blackwell Road Renewable Energy plant in Sarnia was one such recent application. The system built for this customer enabled gas emitted from the closed Sarnia Landfill to be redirected to generate electricity for the city. Here, Toromont acted as a turnkey supplier. Projects like this also involve a significant amount of excavation and grading as well as electrical work to support the export of electrical power to the grid. The advantage is that landfill gas becomes
a source of fuel and commerce for the landfill operator instead of being wasted, and worse, contributing to greenhouse gas emissions.
Toromont also provides long-term operational support for these projects to maintain and operate the power plants and gas collection systems.
Advances in technology are also opening new vistas for other forms of waste-to-energy projects including biomass and municipal solid waste-fuelled projects. With gasification, thermal or
chemical processes, materials such as wood can be converted into energy rather than being left to decay and produce CO2. Green box compost represents another source of biomass fuel. In late 2008, Sunbay Energy announced its intent to develop one such project in Chapleau, Ontario with Toromont CAT as a key partner.
When power must be on, Toromont solutions make it happen. TIH
31 2SUbSTANTIALLy ENLARGEd INSTALLEd bASE OF mINING EQUIPmENT
After substantial growth in new product sales in the last four years, Toromont CAT now has over 1,000 CAT mining machines in service at over 70 customer mine sites. This represents a significant opportunity for product support, as the harsh conditions under which the equipment operates grinds away at core components. In mining, the frequency of rebuilds and overhauls far exceeds the norm in other heavy equipment applications, even when applying the most advanced maintenance practices.
We have a large installed base of equipment and we are the largest CAT underground dealer in North America. This is also a positive for product support because underground machines are exposed to even harsher conditions than surface mining equipment. Of the over 40 underground mines operat-ing in Toromont’s territories, the Company serves the majority – providing replacement parts, components and service expertise. Over 20 surface mines are also served by Toromont as prime supplier of CAT mining equipment, parts and support services and this adds to our service opportunity.
Mining product support revenue exceeded $80 million in 2008, double the level reported in 2005. While continued growth is certainly dependent on equipment usage, having more equipment in place in customers’ mines makes for a more promising future.
THE PRESENcE OF GOLd mINING IN TOROmONT’S TERRITORIESThe presence of gold mining in Toromont’s service territories is considered a strength because gold prices have historically reacted positively to times of economic uncertainty. The Company estimates that gold represents about 40% of Toromont’s mining opportunity.
In 2008, the Company continued to make significant headway with leading gold producers. Agnico-Eagle Mines is one. This large producer accelerated the start-up of its Meadowbank Project in Nunavut and now plans to begin gold production in the first quarter of 2010. To support this plan, Toromont CAT made substantial deliveries in 2008 as part of a $62 million order secured in 2007. Toromont CAT also established an onsite branch to support the growing CAT fleet, staffed by qualified equipment technicians.
Toromont CAT made further strides with several underground gold mine projects in 2008. CAT underground trucks and loaders now serve as the equipment backbone for several large and growing northern Ontario gold mines. One site is said to have one of the highest quality ore bodies in the world.
In southeast Manitoba, Toromont CAT added underground loaders to a gold mine. This project consists of a deep underground mine and near-surface deposits. Both mines feed the 1,250 tonne per day Rice Lake mill with prospects of further production growth.
All of this proves that recent success is a result of both increased gold mining activity and Toromont’s long-haul strategy to dedicate attention and resources to developing broader relationships with miners – both senior and junior – mining contractors and the companies that advise them.
mINING: In for the long haul Following a multi-year bull run, prices for many metals and minerals corrected in the second half of 2008, creating uncertainty for global mining activity entering 2009.
while Toromont cannot predict the future of this important market, it expects that four factors will help its prospects.
18 | TOROMONT 2008 ANNUAL REPORT
For more than a decade, Toromont has operated a partnership with Kitikmeot, Qikiqtalluk and Sakku Inuit Nations to bring the economic benefits of development to their communities, including employment and skills development.
In 2008, Toromont CAT went a step further by establishing a scholarship at
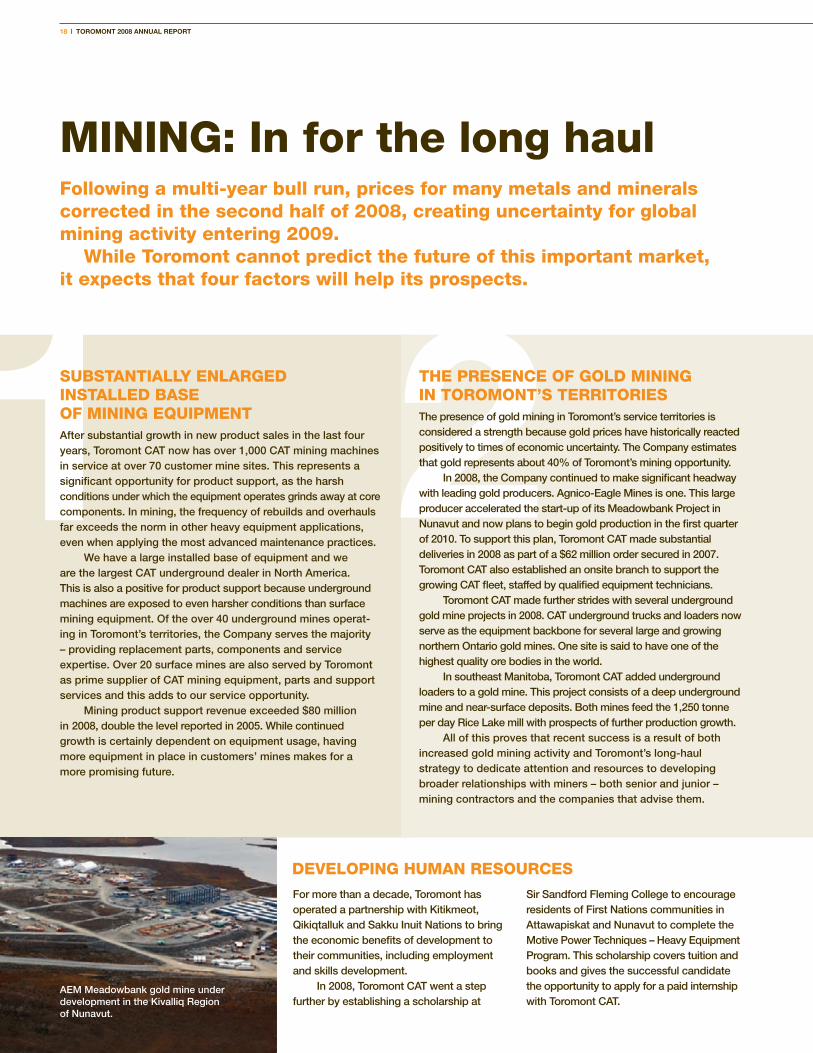
AEM Meadowbank gold mine under development in the Kivalliq Region of Nunavut.
Sir Sandford Fleming College to encourage residents of First Nations communities in Attawapiskat and Nunavut to complete the Motive Power Techniques – Heavy Equipment Program. This scholarship covers tuition and books and gives the successful candidate the opportunity to apply for a paid internship with Toromont CAT.
dEvELOPING HUmAN RESOURcES
3 4THE dIvERSITy OF mINING AcTIvITy IN ITS TERRITORIESIt’s never possible to predict prices for minerals let alone precious or base metals – and prices determine activity. However, the diversity of mining in Toromont’s Equipment Group territories is a strength of nature – and a third factor to consider in assessing the future.
In addition to gold – nickel, copper, zinc, rock salt and diamonds are the most significant materials in the Equipment Group’s territories. In these and other mining segments, Toromont has employed the same approach to developing deep customer relationships – with success.
In 2008, Ontario’s first diamond mine was officially opened. Day in and day out, a large Caterpillar mining fleet supported by Toromont staff located onsite at the Victor Mine, moves kimberlite ore containing the world’s finest quality diamonds.
Also late last year, Toromont secured a purchase order for a fleet operating at a phosphate mine in northern Ontario. Phosphates are used in fertilizer production.
It is not common knowledge that the world’s largest salt mine is in Ontario. The Goderich underground salt mine produces over six million tonnes of rock salt a year – a product many of us use every day. In 2008, Toromont delivered two new large pieces of production equipment that had to be disassembled, lowered 1,800 feet underground and carefully assembled again. The active CAT mining fleet onsite is over 30 pieces strong and includes a large 70 tonne, quarry-class, surface truck – working underground.
THE cOmPANy’S cOmmITmENT TO THIS mARkET FOR THE LONG HAULToromont has long been dedicated to serving mining, knowing that this was a cyclical industry. The recent downturn in metal and mineral prices, while disruptive, has not changed Toromont’s dedication or its commitment to doing those things that will further enhance its long-term market prospects.
Our commitment to the mining industry is evident in our product line-up and history of innovation.n We were the first Canadian dealer to introduce the CAT/Elphinstone
Load Haul Dump (LHD).n We offer Minestar, an integrated mine management system
for production and maintenance.n We customize equipment to suit its operating environment,
from adding auxiliary heaters, replacing normal lubricants, modifying emissions and braking systems to turning cabs into low profile workspaces.
Investments in mining customer support infrastructure, along with a continued focus on broadening our customer base and more deeply penetrating existing mining accounts will continue. This is the benefit of having the financial strength to implement a long-term market strategy.
Short term, there is volatility in the industry but the Company’s diversified customer base and significant contribution from product support should help to smooth the bumps.
Like the industry-leading Caterpillar equipment we represent, Toromont is in mining for the long haul. TIH
TOROMONT 2008 ANNUAL REPORT | 19
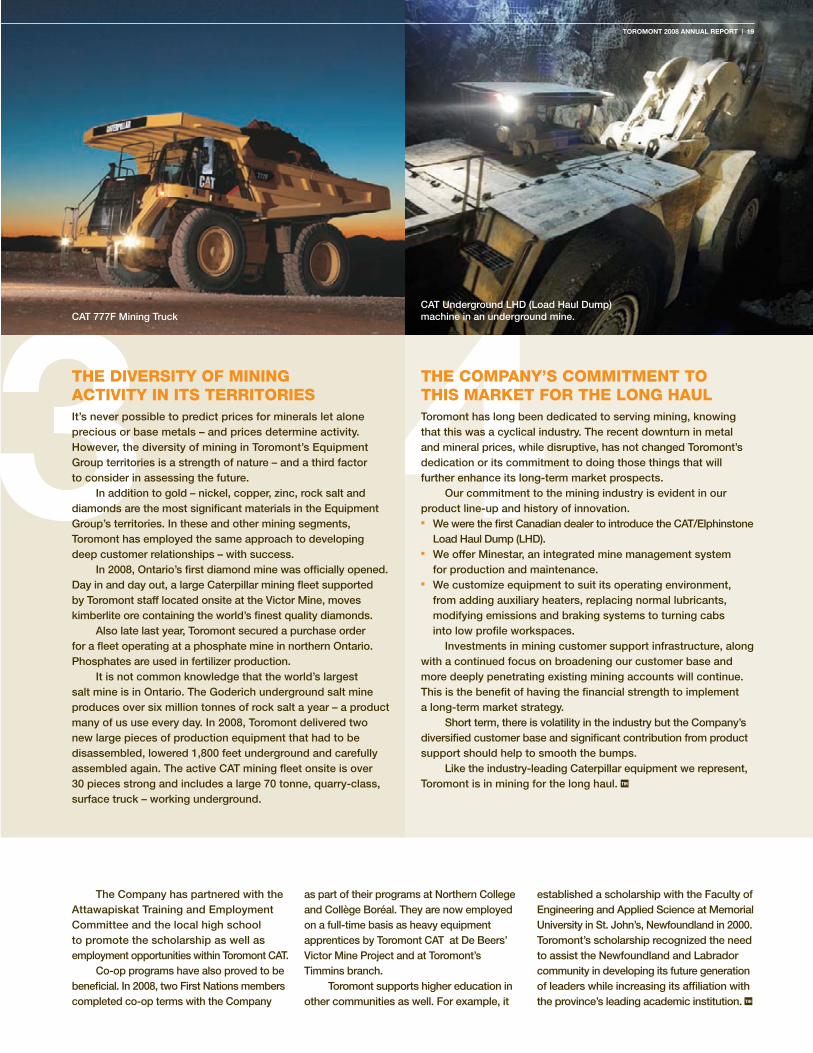
CAT 777F Mining Truck CAT Underground LHD (Load Haul Dump) machine in an underground mine.
The Company has partnered with the Attawapiskat Training and Employment Committee and the local high school to promote the scholarship as well as employment opportunities within Toromont CAT.
Co-op programs have also proved to be beneficial. In 2008, two First Nations members completed co-op terms with the Company
as part of their programs at Northern College and Collège Boréal. They are now employed on a full-time basis as heavy equipment apprentices by Toromont CAT at De Beers’ Victor Mine Project and at Toromont’s Timmins branch.
Toromont supports higher education in other communities as well. For example, it
established a scholarship with the Faculty of Engineering and Applied Science at Memorial University in St. John’s, Newfoundland in 2000. Toromont’s scholarship recognized the need to assist the Newfoundland and Labrador community in developing its future generation of leaders while increasing its affiliation with the province’s leading academic institution. TIH

cImcO cOmPLETES wINTER OLymPIc vENUES
20 | TOROMONT 2008 ANNUAL REPORT
In August 2008, CIMCO participated in commissioning the Richmond Speed Skating Oval, a world class multi-use facility that will host the long-track speed skating competition for the
2010 Olympic and Paralympic Winter Games. This $178 million facility is powered by CIMCO’s custom
designed and engineered refrigeration system. Every one of these projects, from the Whistler Olympic Sliding Centre at Blackcomb to the Hillcrest/Nat Bailey Stadium Park, was won through a competitive bid process.
What makes Richmond Oval stand out isn’t just its 400-metre speed skating track (which will be home to up to 12 medal events) or its flexible design that allows it to be used for a wide variety of sport and community uses. It is also the fact that it uses ECO CHILL technology from CIMCO to adhere to the highest environmental standards (see page 27).
with vancouver’s winter Olympics just under a year away, cImcO Refrigeration is ready, having completed its eighth and final assignment for this prestigious international event.
“We could make outdoor ice on the equator with this truck if we really wanted to,” said Dan Craig, National Hockey League’s Facilities Operations Manager.
Mr. Craig was referring to the NHL’s new 53-foot refrigeration trailer and its performance at the 2009 NHL “Winter Classic”, held at famed Wrigley Field. Designed, engineered and manufactured by CIMCO Refrigeration, this special big rig represents the latest in a long collaboration with the world’s leading hockey league.
Since 1913, CIMCO has been recognized as a world leader in the provision of specialized refrigeration equipment for winter sports, and is the NHL’s “Preferred Rink Equipment Supplier.”
Although the 2009 NHL “Winter Classic” did not feature tropical weather, the refrigeration system housed in the big rig provided great ice conditions for this nationally televised outdoor game. It featured two “Original Six” teams, the Chicago Blackhawks and Detroit Red Wings, playing in front of over 40,000 fans at wind-swept Wrigley Field.
cImcO ScORES AT NHL OUTdOOR wINTER cLASSIc
Additionally, CIMCO was responsible for complete project commissioning at the 2009 “Winter Classic” and will be at all future events designated by the NHL.
To sum up the performance of the system, Michael DiLorenzo NHL Director of Communications said: “The truck was a real publicity difference maker. When it left Alabama it provided a symbolic “kick-off” for the 2009 “Winter Classic”. The publicity it generated with the local media as it made its way to Chicago was enormous. For ten days, it was the star of the show. As for how the refrigeration system itself performed, it was like a game with great officiating – you don’t notice anything because everything was so good. Now that we know the capability of the system, it makes big events much more viable in almost any location. We don’t need to worry about the quality of the ice… we can take it for granted.” TIH
Thanks to the refrigeration trailer, ice conditions were perfect and the game turned out to be exceedingly fast and physical – easily the best of the three NHL regular season outdoor games played to date.
The unique refrigeration plant was designed and manufactured specifically for the NHL. Every system in the truck has a back-up. If one component fails, the system will still operate efficiently.
Using its own expertise together with strategic partners, CIMCO was mandated by the NHL to deliver:n project management of the big rig and
its deploymentn detailed design and engineeringn in-house manufacturing to ensure the
quality and integrity of the key componentsn energy efficient and environmentally
friendly equipmentn a convenient, transportable,
simple-to-operate systemn after-sales service n storage in Hamilton, Ontario
TOROMONT 2008 ANNUAL REPORT | 21
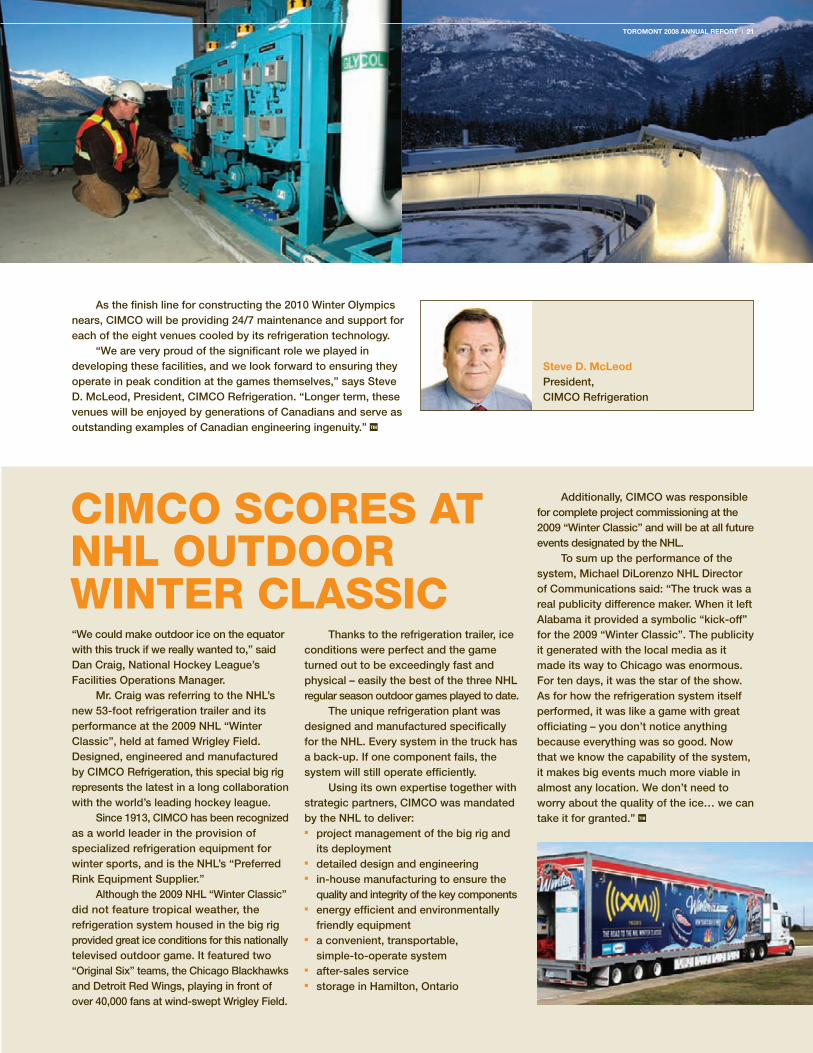
As the finish line for constructing the 2010 Winter Olympics nears, CIMCO will be providing 24/7 maintenance and support for each of the eight venues cooled by its refrigeration technology.
“We are very proud of the significant role we played in developing these facilities, and we look forward to ensuring they operate in peak condition at the games themselves,” says Steve D. McLeod, President, CIMCO Refrigeration. “Longer term, these venues will be enjoyed by generations of Canadians and serve as outstanding examples of Canadian engineering ingenuity.” TIH
Steve D. McLeod President, CIMCO Refrigeration
22 | TOROMONT 2008 ANNUAL REPORT
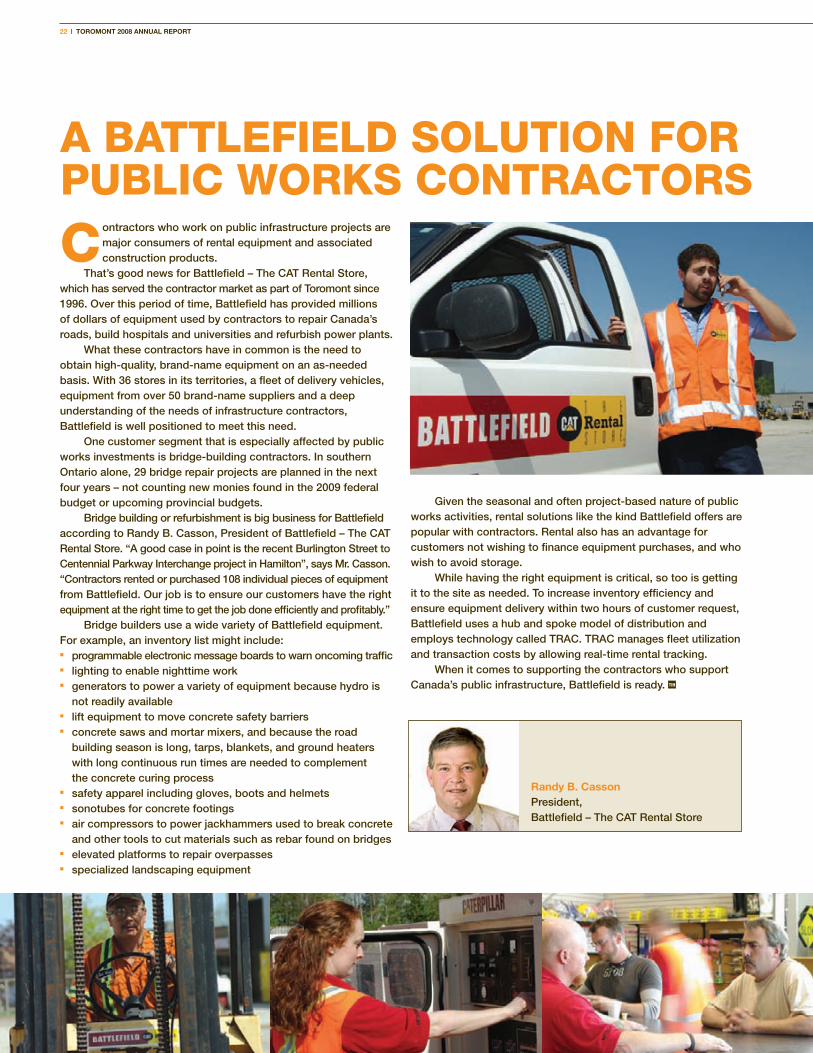
contractors who work on public infrastructure projects are major consumers of rental equipment and associated construction products.
That’s good news for Battlefield – The CAT Rental Store, which has served the contractor market as part of Toromont since 1996. Over this period of time, Battlefield has provided millions of dollars of equipment used by contractors to repair Canada’s roads, build hospitals and universities and refurbish power plants.
What these contractors have in common is the need to obtain high-quality, brand-name equipment on an as-needed basis. With 36 stores in its territories, a fleet of delivery vehicles, equipment from over 50 brand-name suppliers and a deep understanding of the needs of infrastructure contractors, Battlefield is well positioned to meet this need.
One customer segment that is especially affected by public works investments is bridge-building contractors. In southern Ontario alone, 29 bridge repair projects are planned in the next four years – not counting new monies found in the 2009 federal budget or upcoming provincial budgets.
Bridge building or refurbishment is big business for Battlefield according to Randy B. Casson, President of Battlefield – The CAT Rental Store. “A good case in point is the recent Burlington Street to Centennial Parkway Interchange project in Hamilton”, says Mr. Casson. “Contractors rented or purchased 108 individual pieces of equipment from Battlefield. Our job is to ensure our customers have the right equipment at the right time to get the job done efficiently and profitably.”
Bridge builders use a wide variety of Battlefield equipment. For example, an inventory list might include:n programmable electronic message boards to warn oncoming trafficn lighting to enable nighttime workn generators to power a variety of equipment because hydro is
not readily availablen lift equipment to move concrete safety barriers n concrete saws and mortar mixers, and because the road
building season is long, tarps, blankets, and ground heaters with long continuous run times are needed to complement the concrete curing process
n safety apparel including gloves, boots and helmetsn sonotubes for concrete footings n air compressors to power jackhammers used to break concrete
and other tools to cut materials such as rebar found on bridgesn elevated platforms to repair overpassesn specialized landscaping equipment
A bATTLEFIELd SOLUTION FOR PUbLIc wORkS cONTRAcTORS
Given the seasonal and often project-based nature of public works activities, rental solutions like the kind Battlefield offers are popular with contractors. Rental also has an advantage for customers not wishing to finance equipment purchases, and who wish to avoid storage.
While having the right equipment is critical, so too is getting it to the site as needed. To increase inventory efficiency and ensure equipment delivery within two hours of customer request, Battlefield uses a hub and spoke model of distribution and employs technology called TRAC. TRAC manages fleet utilization and transaction costs by allowing real-time rental tracking.
When it comes to supporting the contractors who support Canada’s public infrastructure, Battlefield is ready. TIH
Randy B. Casson President, Battlefield – The CAT Rental Store
TOROMONT 2008 ANNUAL REPORT | 23
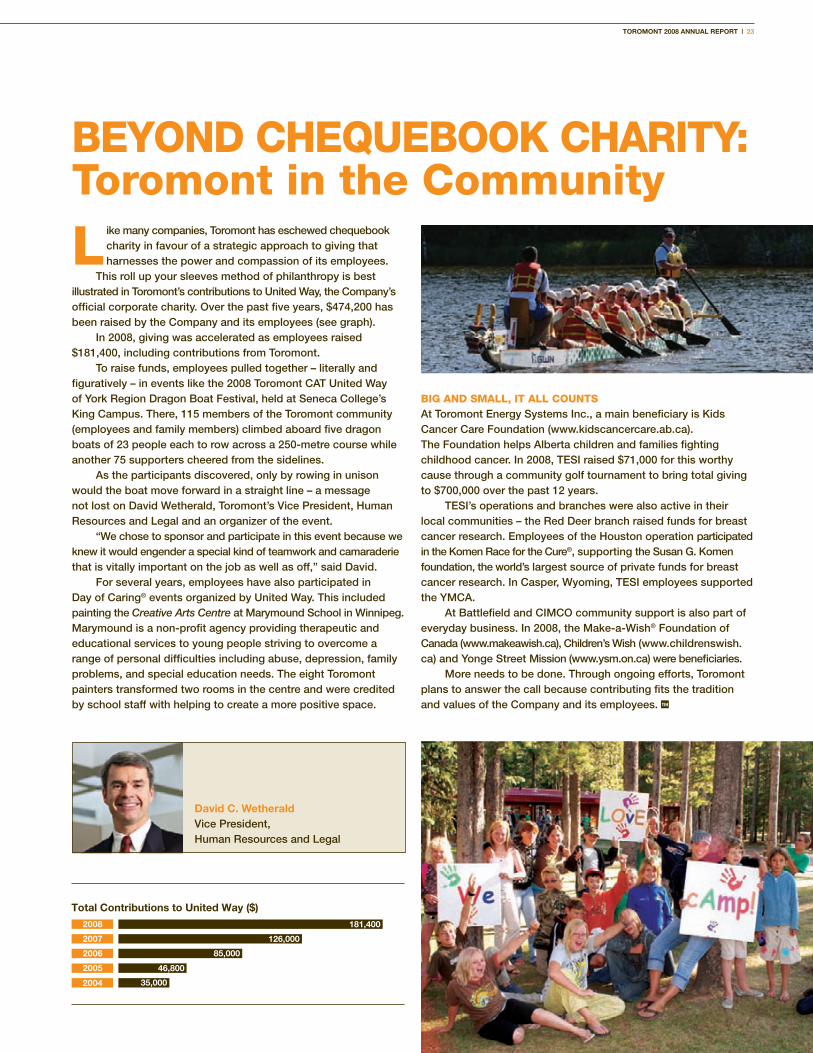
L ike many companies, Toromont has eschewed chequebook charity in favour of a strategic approach to giving that harnesses the power and compassion of its employees.
This roll up your sleeves method of philanthropy is best illustrated in Toromont’s contributions to United Way, the Company’s official corporate charity. Over the past five years, $474,200 has been raised by the Company and its employees (see graph).
In 2008, giving was accelerated as employees raised $181,400, including contributions from Toromont.
To raise funds, employees pulled together – literally and figuratively – in events like the 2008 Toromont CAT United Way of York Region Dragon Boat Festival, held at Seneca College’s King Campus. There, 115 members of the Toromont community (employees and family members) climbed aboard five dragon boats of 23 people each to row across a 250-metre course while another 75 supporters cheered from the sidelines.
As the participants discovered, only by rowing in unison would the boat move forward in a straight line – a message not lost on David Wetherald, Toromont’s Vice President, Human Resources and Legal and an organizer of the event.
“We chose to sponsor and participate in this event because we knew it would engender a special kind of teamwork and camaraderie that is vitally important on the job as well as off,” said David.
For several years, employees have also participated in Day of Caring® events organized by United Way. This included painting the Creative Arts Centre at Marymound School in Winnipeg. Marymound is a non-profit agency providing therapeutic and educational services to young people striving to overcome a range of personal difficulties including abuse, depression, family problems, and special education needs. The eight Toromont painters transformed two rooms in the centre and were credited by school staff with helping to create a more positive space.
bEyONd cHEQUEbOOk cHARITy: Toromont in the community
bIG ANd SmALL, IT ALL cOUNTS At Toromont Energy Systems Inc., a main beneficiary is Kids Cancer Care Foundation (www.kidscancercare.ab.ca). The Foundation helps Alberta children and families fighting childhood cancer. In 2008, TESI raised $71,000 for this worthy cause through a community golf tournament to bring total giving to $700,000 over the past 12 years.
TESI’s operations and branches were also active in their local communities – the Red Deer branch raised funds for breast cancer research. Employees of the Houston operation participated in the Komen Race for the Cure®, supporting the Susan G. Komen foundation, the world’s largest source of private funds for breast cancer research. In Casper, Wyoming, TESI employees supported the YMCA.
At Battlefield and CIMCO community support is also part of everyday business. In 2008, the Make-a-Wish® Foundation of Canada (www.makeawish.ca), Children’s Wish (www.childrenswish.ca) and Yonge Street Mission (www.ysm.on.ca) were beneficiaries.
More needs to be done. Through ongoing efforts, Toromont plans to answer the call because contributing fits the tradition and values of the Company and its employees. TIH
2008
2007
2006
2005
2004
Total Contributions to United Way ($)
181,400
126,000
85,000
46,800
35,000
David C. Wetherald Vice President, Human Resources and Legal
24 | TOROMONT 2008 ANNUAL REPORT
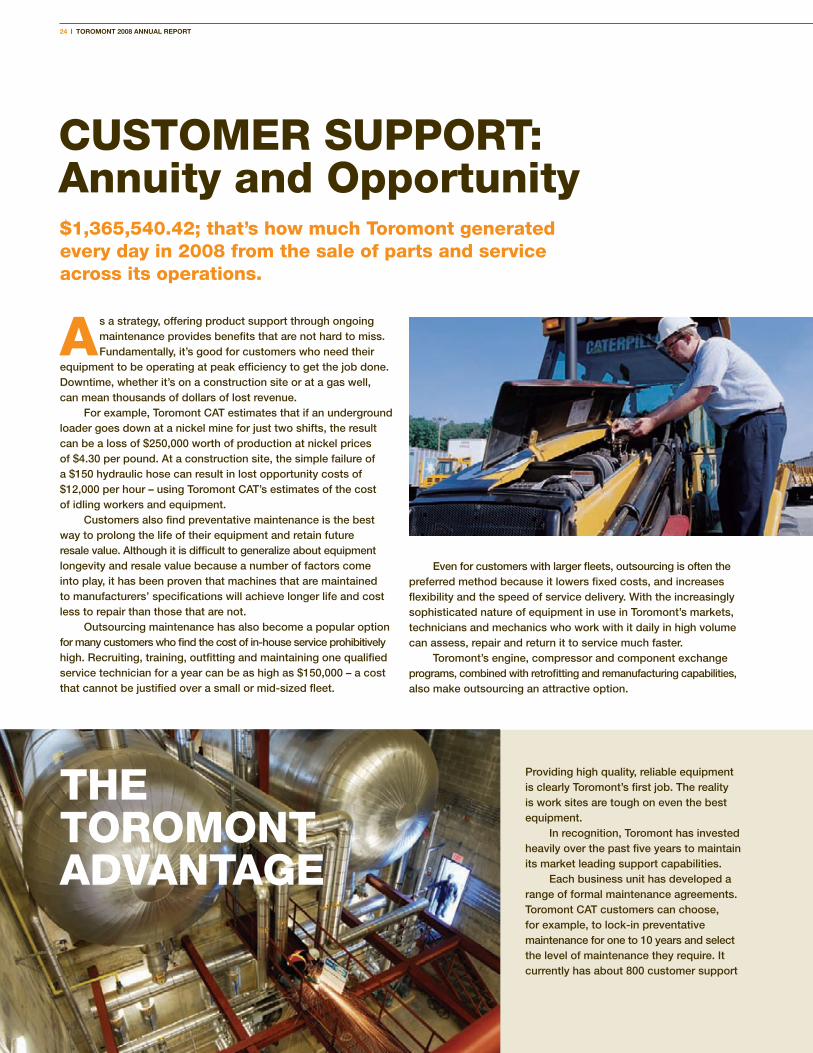
As a strategy, offering product support through ongoing maintenance provides benefits that are not hard to miss. Fundamentally, it’s good for customers who need their
equipment to be operating at peak efficiency to get the job done. Downtime, whether it’s on a construction site or at a gas well, can mean thousands of dollars of lost revenue.
For example, Toromont CAT estimates that if an underground loader goes down at a nickel mine for just two shifts, the result can be a loss of $250,000 worth of production at nickel prices of $4.30 per pound. At a construction site, the simple failure of a $150 hydraulic hose can result in lost opportunity costs of $12,000 per hour – using Toromont CAT’s estimates of the cost of idling workers and equipment.
Customers also find preventative maintenance is the best way to prolong the life of their equipment and retain future resale value. Although it is difficult to generalize about equipment longevity and resale value because a number of factors come into play, it has been proven that machines that are maintained to manufacturers’ specifications will achieve longer life and cost less to repair than those that are not.
Outsourcing maintenance has also become a popular option for many customers who find the cost of in-house service prohibitively high. Recruiting, training, outfitting and maintaining one qualified service technician for a year can be as high as $150,000 – a cost that cannot be justified over a small or mid-sized fleet.
cUSTOmER SUPPORT: Annuity and Opportunity$1,365,540.42; that’s how much Toromont generated every day in 2008 from the sale of parts and service across its operations.
Even for customers with larger fleets, outsourcing is often the preferred method because it lowers fixed costs, and increases flexibility and the speed of service delivery. With the increasingly sophisticated nature of equipment in use in Toromont’s markets, technicians and mechanics who work with it daily in high volume can assess, repair and return it to service much faster.
Toromont’s engine, compressor and component exchange programs, combined with retrofitting and remanufacturing capabilities, also make outsourcing an attractive option.
Providing high quality, reliable equipment is clearly Toromont’s first job. The reality is work sites are tough on even the best equipment.
In recognition, Toromont has invested heavily over the past five years to maintain its market leading support capabilities.
Each business unit has developed a range of formal maintenance agreements. Toromont CAT customers can choose, for example, to lock-in preventative maintenance for one to 10 years and select the level of maintenance they require. It currently has about 800 customer support
THE TOROmONT AdvANTAGE
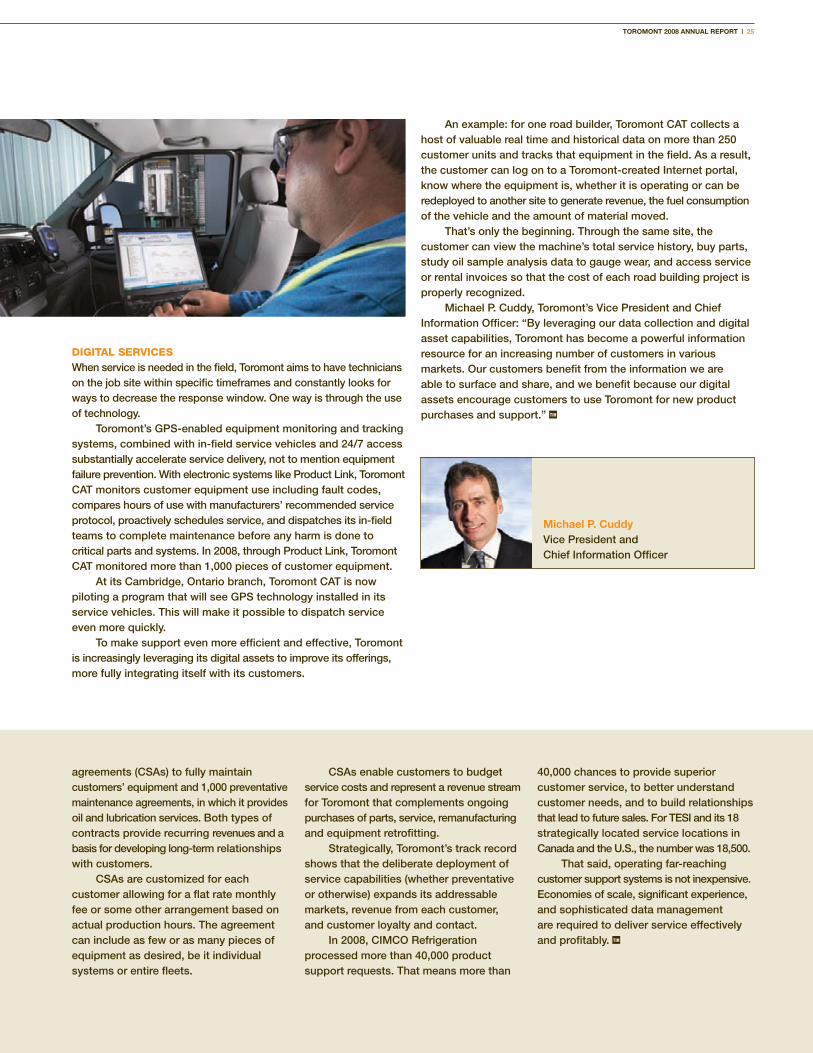
TOROMONT 2008 ANNUAL REPORT | 25
cUSTOmER SUPPORT: Annuity and Opportunity
agreements (CSAs) to fully maintain customers’ equipment and 1,000 preventative maintenance agreements, in which it provides oil and lubrication services. Both types of contracts provide recurring revenues and a basis for developing long-term relationships with customers.
CSAs are customized for each customer allowing for a flat rate monthly fee or some other arrangement based on actual production hours. The agreement can include as few or as many pieces of equipment as desired, be it individual systems or entire fleets.
CSAs enable customers to budget service costs and represent a revenue stream for Toromont that complements ongoing purchases of parts, service, remanufacturing and equipment retrofitting.
Strategically, Toromont’s track record shows that the deliberate deployment of service capabilities (whether preventative or otherwise) expands its addressable markets, revenue from each customer, and customer loyalty and contact.
In 2008, CIMCO Refrigeration processed more than 40,000 product support requests. That means more than
40,000 chances to provide superior customer service, to better understand customer needs, and to build relationships that lead to future sales. For TESI and its 18 strategically located service locations in Canada and the U.S., the number was 18,500.
That said, operating far-reaching customer support systems is not inexpensive. Economies of scale, significant experience, and sophisticated data management are required to deliver service effectively and profitably. TIH
dIGITAL SERvIcESWhen service is needed in the field, Toromont aims to have technicians on the job site within specific timeframes and constantly looks for ways to decrease the response window. One way is through the use of technology.
Toromont’s GPS-enabled equipment monitoring and tracking systems, combined with in-field service vehicles and 24/7 access substantially accelerate service delivery, not to mention equipment failure prevention. With electronic systems like Product Link, Toromont CAT monitors customer equipment use including fault codes, compares hours of use with manufacturers’ recommended service protocol, proactively schedules service, and dispatches its in-field teams to complete maintenance before any harm is done to critical parts and systems. In 2008, through Product Link, Toromont CAT monitored more than 1,000 pieces of customer equipment.
At its Cambridge, Ontario branch, Toromont CAT is now piloting a program that will see GPS technology installed in its service vehicles. This will make it possible to dispatch service even more quickly.
To make support even more efficient and effective, Toromont is increasingly leveraging its digital assets to improve its offerings, more fully integrating itself with its customers.
An example: for one road builder, Toromont CAT collects a host of valuable real time and historical data on more than 250 customer units and tracks that equipment in the field. As a result, the customer can log on to a Toromont-created Internet portal, know where the equipment is, whether it is operating or can be redeployed to another site to generate revenue, the fuel consumption of the vehicle and the amount of material moved.
That’s only the beginning. Through the same site, the customer can view the machine’s total service history, buy parts, study oil sample analysis data to gauge wear, and access service or rental invoices so that the cost of each road building project is properly recognized.
Michael P. Cuddy, Toromont’s Vice President and Chief Information Officer: “By leveraging our data collection and digital asset capabilities, Toromont has become a powerful information resource for an increasing number of customers in various markets. Our customers benefit from the information we are able to surface and share, and we benefit because our digital assets encourage customers to use Toromont for new product purchases and support.” TIH
Michael P. Cuddy Vice President and Chief Information Officer
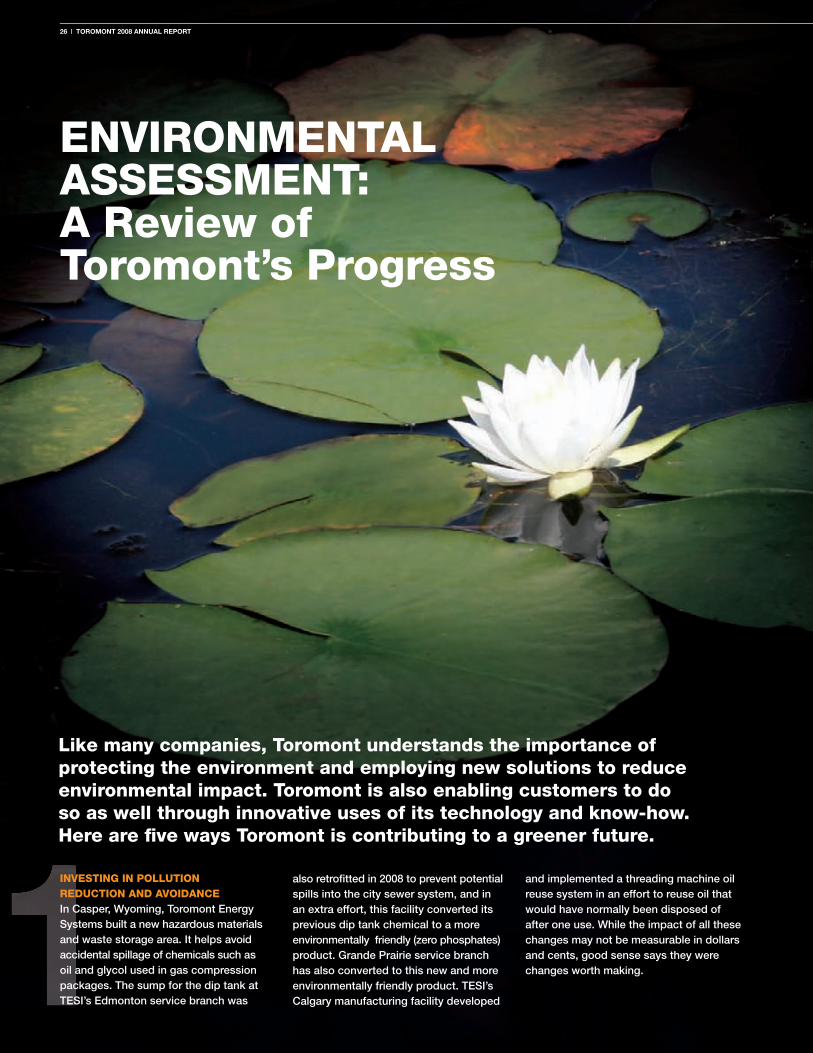
INvESTING IN POLLUTION REdUcTION ANd AvOIdANcE In Casper, Wyoming, Toromont Energy Systems built a new hazardous materials and waste storage area. It helps avoid accidental spillage of chemicals such as oil and glycol used in gas compression packages. The sump for the dip tank at TESI’s Edmonton service branch was
also retrofitted in 2008 to prevent potential spills into the city sewer system, and in an extra effort, this facility converted its previous dip tank chemical to a more environmentally friendly (zero phosphates) product. Grande Prairie service branch has also converted to this new and more environmentally friendly product. TESI’s Calgary manufacturing facility developed
and implemented a threading machine oil reuse system in an effort to reuse oil that would have normally been disposed of after one use. While the impact of all these changes may not be measurable in dollars and cents, good sense says they were changes worth making.
ENvIRONmENTAL ASSESSmENT: A Review of Toromont’s Progress
Like many companies, Toromont understands the importance of protecting the environment and employing new solutions to reduce environmental impact. Toromont is also enabling customers to do so as well through innovative uses of its technology and know-how. Here are five ways Toromont is contributing to a greener future.
26 | TOROMONT 2008 ANNUAL REPORT
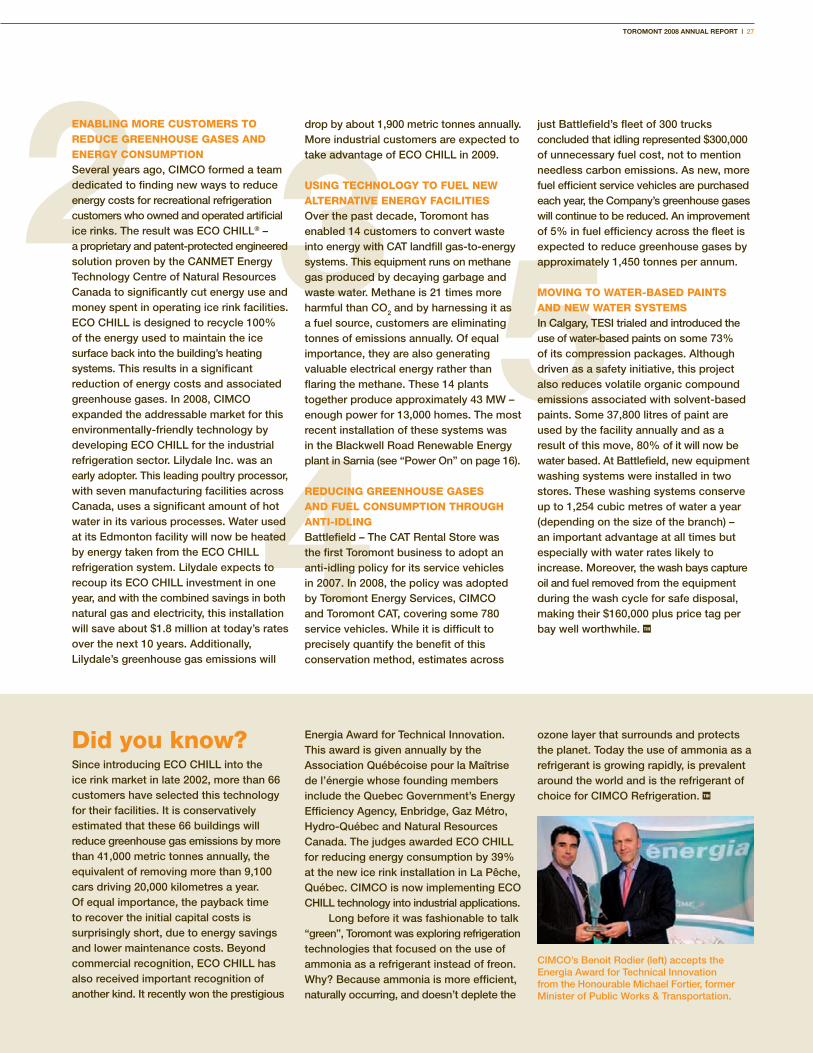
TOROMONT 2008 ANNUAL REPORT | 27
ENAbLING mORE cUSTOmERS TO REdUcE GREENHOUSE GASES ANd ENERGy cONSUmPTION Several years ago, CIMCO formed a team dedicated to finding new ways to reduce energy costs for recreational refrigeration customers who owned and operated artificial ice rinks. The result was ECO CHILL® – a proprietary and patent-protected engineered solution proven by the CANMET Energy Technology Centre of Natural Resources Canada to significantly cut energy use and money spent in operating ice rink facilities. ECO CHILL is designed to recycle 100% of the energy used to maintain the ice surface back into the building’s heating systems. This results in a significant reduction of energy costs and associated greenhouse gases. In 2008, CIMCO expanded the addressable market for this environmentally-friendly technology by developing ECO CHILL for the industrial refrigeration sector. Lilydale Inc. was an early adopter. This leading poultry processor, with seven manufacturing facilities across Canada, uses a significant amount of hot water in its various processes. Water used at its Edmonton facility will now be heated by energy taken from the ECO CHILL refrigeration system. Lilydale expects to recoup its ECO CHILL investment in one year, and with the combined savings in both natural gas and electricity, this installation will save about $1.8 million at today’s rates over the next 10 years. Additionally, Lilydale’s greenhouse gas emissions will
drop by about 1,900 metric tonnes annually. More industrial customers are expected to take advantage of ECO CHILL in 2009.
USING TEcHNOLOGy TO FUEL NEw ALTERNATIvE ENERGy FAcILITIES Over the past decade, Toromont has enabled 14 customers to convert waste into energy with CAT landfill gas-to-energy systems. This equipment runs on methane gas produced by decaying garbage and waste water. Methane is 21 times more harmful than CO2 and by harnessing it as a fuel source, customers are eliminating tonnes of emissions annually. Of equal importance, they are also generating valuable electrical energy rather than flaring the methane. These 14 plants together produce approximately 43 MW – enough power for 13,000 homes. The most recent installation of these systems was in the Blackwell Road Renewable Energy plant in Sarnia (see “Power On” on page 16).
REdUcING GREENHOUSE GASES ANd FUEL cONSUmPTION THROUGH ANTI-IdLINGBattlefield – The CAT Rental Store was the first Toromont business to adopt an anti-idling policy for its service vehicles in 2007. In 2008, the policy was adopted by Toromont Energy Services, CIMCO and Toromont CAT, covering some 780 service vehicles. While it is difficult to precisely quantify the benefit of this conservation method, estimates across
just Battlefield’s fleet of 300 trucks concluded that idling represented $300,000 of unnecessary fuel cost, not to mention needless carbon emissions. As new, more fuel efficient service vehicles are purchased each year, the Company’s greenhouse gases will continue to be reduced. An improvement of 5% in fuel efficiency across the fleet is expected to reduce greenhouse gases by approximately 1,450 tonnes per annum.
mOvING TO wATER-bASEd PAINTS ANd NEw wATER SySTEmSIn Calgary, TESI trialed and introduced the use of water-based paints on some 73% of its compression packages. Although driven as a safety initiative, this project also reduces volatile organic compound emissions associated with solvent-based paints. Some 37,800 litres of paint are used by the facility annually and as a result of this move, 80% of it will now be water based. At Battlefield, new equipment washing systems were installed in two stores. These washing systems conserve up to 1,254 cubic metres of water a year (depending on the size of the branch) – an important advantage at all times but especially with water rates likely to increase. Moreover, the wash bays capture oil and fuel removed from the equipment during the wash cycle for safe disposal, making their $160,000 plus price tag per bay well worthwhile. TIH
did you know? Since introducing ECO CHILL into the ice rink market in late 2002, more than 66 customers have selected this technology for their facilities. It is conservatively estimated that these 66 buildings will reduce greenhouse gas emissions by more than 41,000 metric tonnes annually, the equivalent of removing more than 9,100 cars driving 20,000 kilometres a year. Of equal importance, the payback time to recover the initial capital costs is surprisingly short, due to energy savings and lower maintenance costs. Beyond commercial recognition, ECO CHILL has also received important recognition of another kind. It recently won the prestigious
Energia Award for Technical Innovation. This award is given annually by the Association Québécoise pour la Maîtrise de l’énergie whose founding members include the Quebec Government’s Energy Efficiency Agency, Enbridge, Gaz Métro, Hydro-Québec and Natural Resources Canada. The judges awarded ECO CHILL for reducing energy consumption by 39% at the new ice rink installation in La Pêche, Québec. CIMCO is now implementing ECO CHILL technology into industrial applications.
Long before it was fashionable to talk “green”, Toromont was exploring refrigeration technologies that focused on the use of ammonia as a refrigerant instead of freon. Why? Because ammonia is more efficient, naturally occurring, and doesn’t deplete the
ozone layer that surrounds and protects the planet. Today the use of ammonia as a refrigerant is growing rapidly, is prevalent around the world and is the refrigerant of choice for CIMCO Refrigeration. TIH
CIMCO’s Benoit Rodier (left) accepts the Energia Award for Technical Innovation from the Honourable Michael Fortier, former Minister of Public Works & Transportation.
28 | TOROMONT 2008 ANNUAL REPORT
corporate Governance OverviewA strong and effective corporate governance program continues to be a principal priority for Toromont. The Nominating and Corporate Governance Committee, on behalf of the Board, establishes and monitors the governance program and its effectiveness. The Company’s corporate governance structure and procedures are founded on our Code of Business Conduct that applies to all directors, officers and employees. Our governance program includes the activities of the Board of Directors, who are elected by and are accountable to the shareholders, and the activities of management who are appointed by the Board and are charged with the day-to-day management of the Company.
Toromont regularly reviews and enhances its governance practices in response to evolving regulatory developments and other applicable legislation.
The Company’s corporate governance program is in compliance with National Policy 58-201 – Corporate Governance Guidelines and Multilateral Instrument 52-110 – Audit Committees.
bOARd OF dIREcTORSThe role of the Board of Directors, its activities and responsibilities are documented and are assessed at least annually, as are the terms of reference for each of the committees of the Board, the Chairs of the committees, the Lead Director and the Chairman, inclusive of scope and limits of authority of management. The Board acts in a supervisory role and any responsibilities not delegated to management remain with the Board. The Board’s supervisory role includes such matters as strategic planning, identification and management of risks, succession planning, communication policy, internal controls and governance.
The Lead Director is an independent director appointed annually by the independent directors of the Board to facilitate the Board’s functioning autonomously from management. The Lead Director serves as a non-partisan contact for other directors on matters not deemed appropriate to be discussed initially with the Chairman or in situations where the Chairman is not available. The Lead Director is available to counsel the Chairman on matters appropriate for review in advance of discussion with the full Board of Directors. The Lead Director chairs a session at each Board meeting during which only independent directors are present.
cOmmITTEE STRUcTURE ANd mANdATESCommittees of the Board are an integral part of the Company’s governance structure. Three committees have been established with a view to allocating expertise and resources to particular areas, and to enhance the quality of discussion at Board meetings. The committees facilitate Board decision-making by providing recommendations to the Board on matters within their respective responsibilities.
All committees are comprised solely of directors who are independent of management. A summary of the responsibilities and the membership of the committees follow.
The Nominating and Corporate Governance Committee: Principal responsibilities are reviewing and making recommendations as to all matters relating to effective corporate governance. The committee is responsible for assessing effectiveness of the Board, its size and composition, its committees, director compensation, the Board’s relationship to management and individual performance and contribution of its directors. The committee is responsible for identification and recruitment of new directors and new director orientation.
The Audit Committee: Principal duties include oversight responsibility for financial statements and related disclosures, reports to shareholders and other related communications, establishment of appropriate financial policies, the integrity of accounting systems and internal controls, legal compliance on ethics programs established by management, the approval of all audit and non-audit services provided by the independent auditors and consultation with the auditors independent of management and overseeing the work of the auditors and the Internal Audit department.
The Human Resources and Compensation Committee: Principal responsibilities are compensation of executive officers and other senior management, short- and long-term incentive programs, pension and other benefit plans, executive officer appointments, evaluation of performance of the Chief Executive Officer, succession planning and executive development. The committee also oversees compliance with the Company’s Code of Business Conduct and the health, safety and environment program.

TOROMONT 2008 ANNUAL REPORT | 29
board of directorsRobert S. boswell Director since 2007
Mr. Boswell is Chairman and Chief Executive Officer of Laramie Energy II, LLC., a Denver-based company primarily focused on finding and developing natural gas reserves from unconventional gas reservoirs within the Western Sedimentary Basin of North America. He is also a director of Complete Production Services, Inc., an oil and gas service provider based in Houston, Texas.
Robert m. Franklin l s Director since 1994
Chairman, Human Resources and Compensation Committee Mr. Franklin is President of Signalta Capital Corporation, a private investment company. He is also a director of Barrick Gold Corporation, First Uranium Corporation, Canadian Tire Corporation and Resolve Business Outsourcing Income Fund. He is also the Trustee of Stratos Global Corporation.
Ronald G. Gage, fca n l Director since 2000
Chairman, Nominating and Corporate Governance CommitteeMr. Gage, a Fellow of The Institute of Chartered Accountants of Ontario, was Chairman and Chief Executive Officer of Ernst & Young LLP, Canada from 1993 to 1999. He is a director of Invesco Trimark Canada Fund Inc., Invesco Trimark Corporate Class Inc., easyhome Ltd., and the Canadian Public Accountability Board.
david A. Galloway n s Director since 2002
Mr. Galloway is Chairman of the Board of Directors of Bank of Montreal. He also serves on the Board of Directors of E.W. Scripps Company.
n Member of Nominating and Corporate Governance Committeel Member of Audit Committees Member of Human Resources and Compensation Committee
wayne S. Hill Director since 1988
Mr. Hill is a former Executive Vice President of the Company. Mr. Hill joined Toromont in 1985 as Vice President, Finance and Chief Financial Officer and became Executive Vice President in 2002. He retired from the Company in May 2008. He is also a director of First Uranium Corporation.
H. Stanley marshall s Director since 1998
Mr. Marshall is President and Chief Executive Officer and a director of Fortis Inc. and several of its subsidiaries (an international electric utility holding company).
john S. mccallum n l Director since 1985
Lead Director and Chairman, Audit Committee
Mr. McCallum is a Professor of Finance in the I.H. Asper School of Business at the University of Manitoba. He is also a director of IGM Financial Inc., Wawanesa Mutual Insurance Company, Wawanesa General Insurance Company, Wawanesa Life Insurance Company and Fortis Inc. (including subsidiaries in British Columbia and Alberta).
Robert m. Ogilvie Director since 1986
Mr. Ogilvie is Chairman of the Board and Chief Executive Officer of the Company. Mr. Ogilvie joined Toromont in 1985 and has been Chairman since 1987. He has also been the Company’s CEO since 1987, excluding the period from 2002 to 2006. Mr. Ogilvie is also on the Board of Regents of Mount Allison University.
Stephen j. Savidant Director since 2007
Mr. Savidant is an independent businessman and Chairman of ProspEx Resources Ltd., a Calgary-based oil and gas company focused on exploration for natural gas in the Western Canadian Sedimentary Basin. He is also a director of Empire Company Limited.
Back row left to right:H. Stanley MarshallRonald G. GageStephen J. SavidantDavid A. GallowayRobert M. FranklinFront row left to right:Robert M. OgilvieRobert S. BoswellWayne S. HillJohn S. McCallum
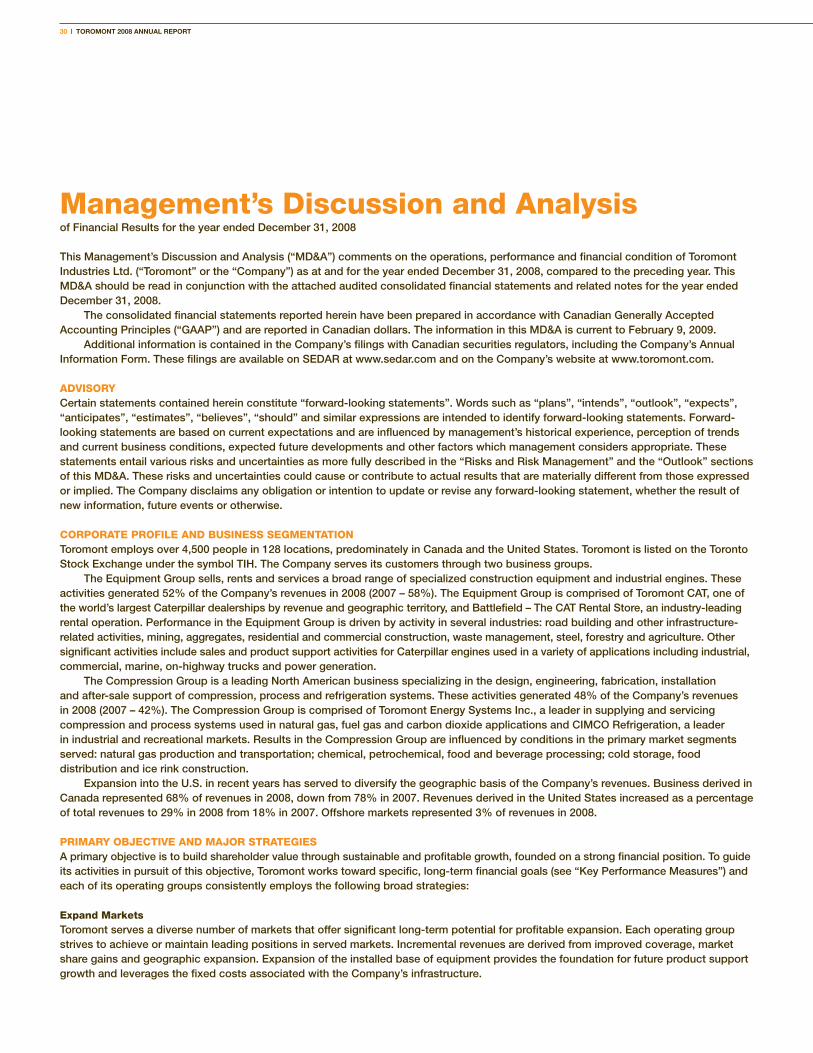
30 | TOROMONT 2008 ANNUAL REPORT
Management’s Discussion and Analysisof Financial Results for the year ended December 31, 2008
This Management’s Discussion and Analysis (“MD&A”) comments on the operations, performance and financial condition of Toromont Industries Ltd. (“Toromont” or the “Company”) as at and for the year ended December 31, 2008, compared to the preceding year. This MD&A should be read in conjunction with the attached audited consolidated financial statements and related notes for the year ended December 31, 2008.
The consolidated financial statements reported herein have been prepared in accordance with Canadian Generally Accepted Accounting Principles (“GAAP”) and are reported in Canadian dollars. The information in this MD&A is current to February 9, 2009.
Additional information is contained in the Company’s filings with Canadian securities regulators, including the Company’s Annual Information Form. These filings are available on SEDAR at www.sedar.com and on the Company’s website at www.toromont.com.
ADVISORYCertain statements contained herein constitute “forward-looking statements”. Words such as “plans”, “intends”, “outlook”, “expects”, “anticipates”, “estimates”, “believes”, “should” and similar expressions are intended to identify forward-looking statements. Forward-looking statements are based on current expectations and are influenced by management’s historical experience, perception of trends and current business conditions, expected future developments and other factors which management considers appropriate. These statements entail various risks and uncertainties as more fully described in the “Risks and Risk Management” and the “Outlook” sections of this MD&A. These risks and uncertainties could cause or contribute to actual results that are materially different from those expressed or implied. The Company disclaims any obligation or intention to update or revise any forward-looking statement, whether the result of new information, future events or otherwise.
CORPORATE PROFILE AND BUSINESS SEGMENTATIONToromont employs over 4,500 people in 128 locations, predominately in Canada and the United States. Toromont is listed on the Toronto Stock Exchange under the symbol TIH. The Company serves its customers through two business groups.
The Equipment Group sells, rents and services a broad range of specialized construction equipment and industrial engines. These activities generated 52% of the Company’s revenues in 2008 (2007 – 58%). The Equipment Group is comprised of Toromont CAT, one of the world’s largest Caterpillar dealerships by revenue and geographic territory, and Battlefield – The CAT Rental Store, an industry-leading rental operation. Performance in the Equipment Group is driven by activity in several industries: road building and other infrastructure-related activities, mining, aggregates, residential and commercial construction, waste management, steel, forestry and agriculture. Other significant activities include sales and product support activities for Caterpillar engines used in a variety of applications including industrial, commercial, marine, on-highway trucks and power generation.
The Compression Group is a leading North American business specializing in the design, engineering, fabrication, installation and after-sale support of compression, process and refrigeration systems. These activities generated 48% of the Company’s revenues in 2008 (2007 – 42%). The Compression Group is comprised of Toromont Energy Systems Inc., a leader in supplying and servicing compression and process systems used in natural gas, fuel gas and carbon dioxide applications and CIMCO Refrigeration, a leader in industrial and recreational markets. Results in the Compression Group are influenced by conditions in the primary market segments served: natural gas production and transportation; chemical, petrochemical, food and beverage processing; cold storage, food distribution and ice rink construction.
Expansion into the U.S. in recent years has served to diversify the geographic basis of the Company’s revenues. Business derived in Canada represented 68% of revenues in 2008, down from 78% in 2007. Revenues derived in the United States increased as a percentage of total revenues to 29% in 2008 from 18% in 2007. Offshore markets represented 3% of revenues in 2008.
PRIMARY OBJECTIVE AND MAJOR STRATEGIESA primary objective is to build shareholder value through sustainable and profitable growth, founded on a strong financial position. To guide its activities in pursuit of this objective, Toromont works toward specific, long-term financial goals (see “Key Performance Measures”) and each of its operating groups consistently employs the following broad strategies:
Expand MarketsToromont serves a diverse number of markets that offer significant long-term potential for profitable expansion. Each operating group strives to achieve or maintain leading positions in served markets. Incremental revenues are derived from improved coverage, market share gains and geographic expansion. Expansion of the installed base of equipment provides the foundation for future product support growth and leverages the fixed costs associated with the Company’s infrastructure.
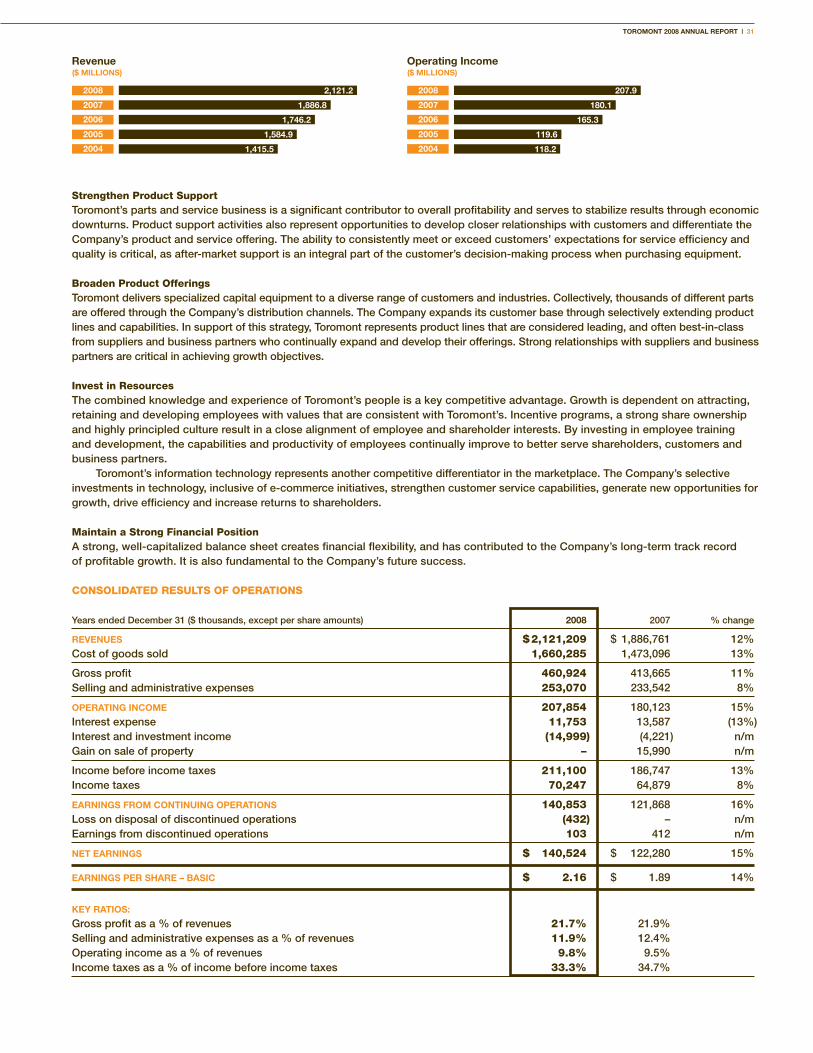
TOROMONT 2008 ANNUAL REPORT | 31
Strengthen Product SupportToromont’s parts and service business is a significant contributor to overall profitability and serves to stabilize results through economic downturns. Product support activities also represent opportunities to develop closer relationships with customers and differentiate the Company’s product and service offering. The ability to consistently meet or exceed customers’ expectations for service efficiency and quality is critical, as after-market support is an integral part of the customer’s decision-making process when purchasing equipment.
Broaden Product OfferingsToromont delivers specialized capital equipment to a diverse range of customers and industries. Collectively, thousands of different parts are offered through the Company’s distribution channels. The Company expands its customer base through selectively extending product lines and capabilities. In support of this strategy, Toromont represents product lines that are considered leading, and often best-in-class from suppliers and business partners who continually expand and develop their offerings. Strong relationships with suppliers and business partners are critical in achieving growth objectives.
Invest in ResourcesThe combined knowledge and experience of Toromont’s people is a key competitive advantage. Growth is dependent on attracting, retaining and developing employees with values that are consistent with Toromont’s. Incentive programs, a strong share ownership and highly principled culture result in a close alignment of employee and shareholder interests. By investing in employee training and development, the capabilities and productivity of employees continually improve to better serve shareholders, customers and business partners.
Toromont’s information technology represents another competitive differentiator in the marketplace. The Company’s selective investments in technology, inclusive of e-commerce initiatives, strengthen customer service capabilities, generate new opportunities for growth, drive efficiency and increase returns to shareholders.
Maintain a Strong Financial PositionA strong, well-capitalized balance sheet creates financial flexibility, and has contributed to the Company’s long-term track record of profitable growth. It is also fundamental to the Company’s future success.
CONSOLIDATED RESULTS OF OPERATIONS
Years ended December 31 ($ thousands, except per share amounts) 2008 2007 % change
REvENUEs $ 2,121,209 $ 1,886,761 12% Cost of goods sold 1,660,285 1,473,096 13%
Gross profit 460,924 413,665 11%Selling and administrative expenses 253,070 233,542 8%
OPERATiNg iNcOME 207,854 180,123 15%Interest expense 11,753 13,587 (13%)Interest and investment income (14,999) (4,221) n/mGain on sale of property – 15,990 n/m
Income before income taxes 211,100 186,747 13%Income taxes 70,247 64,879 8%
EARNiNgs fROM cONTiNUiNg OPERATiONs 140,853 121,868 16%Loss on disposal of discontinued operations (432) – n/mEarnings from discontinued operations 103 412 n/m
NET EARNiNgs $ 140,524 $ 122,280 15%
EARNiNgs PER shARE – BAsic $ 2.16 $ 1.89 14%
KEy RATiOs:
Gross profit as a % of revenues 21.7% 21.9%Selling and administrative expenses as a % of revenues 11.9% 12.4%Operating income as a % of revenues 9.8% 9.5%Income taxes as a % of income before income taxes 33.3% 34.7%
2008
2007
2006
2005
2004
Revenue($ MiLLiONs)
1,415.5
1,584.9
1,746.2
1,886.8
2,121.2
Operating income($ MiLLiONs)
2008
2007
2006
2005
2004 118.2
119.6
165.3
180.1
207.9

32 | TOROMONT 2008 ANNUAL REPORT
Revenues increased by $234.4 million or 12% in 2008 compared to a year ago, representing the 16th consecutive year of growth. Compression revenues were 30% higher on strong growth in natural gas compression. Natural gas compression package revenues increased 58% year-over-year on strong demand in U.S. markets. Equipment Group revenues were even with the prior year as higher used machine sales, rental and product support business offset lower sales of new machines.
The Canadian/U.S. dollar exchange rate impacts reported revenues on the translation of the financial statements of the Compression Group’s growing U.S. operations. While the Canadian dollar was volatile through the year, trading from a low of $0.77 to a high of $1.01, on average, the dollar was 1% stronger in 2008 compared to 2007. As such, the impact in 2008 was relatively minor, reducing revenues by $3.6 million and net income by approximately $0.3 million. In addition, the exchange rate impacts revenues in the Canadian operations of both the Equipment and Compression Groups, as pricing to customers typically reflects movements in the exchange rate on U.S. sourced equipment, components and spare parts, although this will typically lag posted rate changes given age of inventory, timing of orders and hedging practices.
Gross profit increased 11% in 2008, consistent with the year-over-year growth rate in revenues. Gross profit margin in 2008 was 21.7%, compared to 21.9% in 2007. The slight change in gross margin reflected the increased proportion of revenues coming from the relatively lower margin Compression Group. Compression Group gross margins are generally lower due to the lower relative contribution from product support and were also slightly lower in 2008 due to product mix, with several large, lower margin pipeline projects. Equipment Group gross profit margins were 90 basis points higher than in the prior year on improved price realization and a higher proportion of product support business.
Selling and administrative expenses increased $19.5 million or 8% in 2008 versus the prior year in support of the 12% increase in revenue. Compensation costs were $6.0 million higher due to increased profit sharing related to earnings growth, scheduled annual salary increases and higher employment levels in support of U.S. growth. Bad debt expense increased $6.7 million reflecting conservatism in the face of increasing economic uncertainty and an increased aging of accounts receivable. Sales-related expenses such as freight, service costs and marketing were up approximately $1.2 million to support activity levels. Other increases included higher spending on information technology, up $1.4 million, and higher occupancy costs related to increased facilities, up $1.3 million. Selling and administrative expenses as a percentage of revenues were 11.9% for 2008, improved from 12.4% in 2007.
Operating income in 2008 was 15% or $27.7 million higher than the prior year on higher revenues and lower relative expense levels. Operating income as a percentage of revenue improved to 9.8% from 9.5% in 2007.
Interest expense was $1.8 million or 13% lower in 2008 than in the prior year. Certain long-term debt was repaid during the year as scheduled and served to reduce the effective average interest rate.
Interest and investment income in 2008 included gains realized on the sale of marketable securities of $8.2 million or $0.10 per share after tax. Excluding this item, interest and investment income increased $2.5 million or 60% from the prior year. The Company had higher cash balances in 2008 as a result of strong cash flow. This was partially offset by lower interest rates.
In 2007, certain property held for future development was sold. Net proceeds were $17.6 million and a gain of $16.0 million ($12.9 million after tax, or $0.20 per share) was realized.
The effective income tax rate for 2008 was 33.3% compared to 34.7% for 2007, reflecting lower corporate income tax rates compared to 2007.
Net earnings in 2008 were $140.5 million, $2.16 basic per share, up 15% from 2007. Excluding gains in both years, net earnings in 2008 were $134.0 million or $2.06 basic per share, up 23% and 22% respectively.
Comprehensive income for the year was $167.6 million, comprised of net earnings of $140.5 million and other comprehensive income of $27.1 million. Other comprehensive income arose primarily on translation of self-sustaining foreign operations ($21.1 million) and an increase in fair value of derivatives designated as cash flow hedges ($7.5 million).
BUSINESS SEGMENT OPERATING RESULTSThe accounting policies of the segments are the same as those of the consolidated entity. Management evaluates overall business segment performance based on revenue growth and operating income relative to revenues. Corporate expenses are allocated based on each segment’s operating income. Interest expense and interest and investment income are not allocated.
The shares of Aero Tech Manufacturing were sold to its management effective June 30, 2008. The Aero Tech operations were previously included with those of the Compression Group. The accompanying consolidated financial statements have been restated to reflect Aero Tech as a discontinued operation. This discussion and analysis has been prepared on a continuing operations basis. Additional disclosure has been provided in Note 3 to the audited consolidated financial statements.
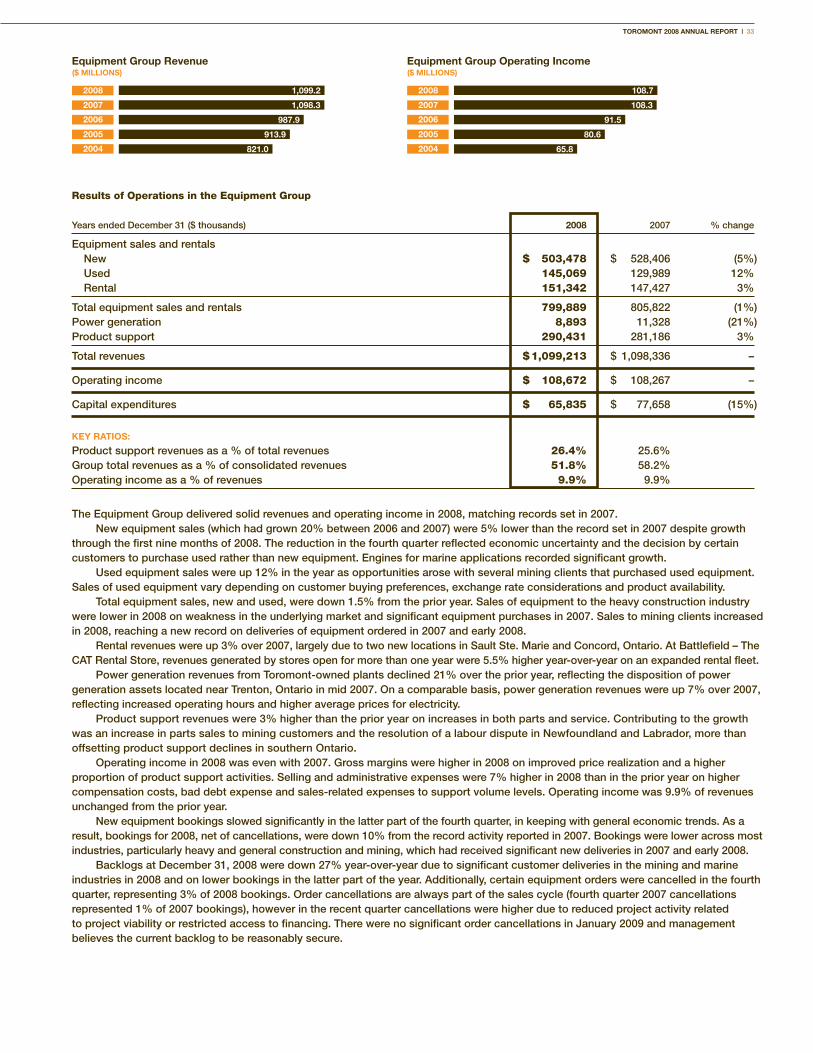
TOROMONT 2008 ANNUAL REPORT | 33
Results of Operations in the Equipment Group
Years ended December 31 ($ thousands) 2008 2007 % change
Equipment sales and rentals New $ 503,478 $ 528,406 (5%) Used 145,069 129,989 12% Rental 151,342 147,427 3%
Total equipment sales and rentals 799,889 805,822 (1%)Power generation 8,893 11,328 (21%)Product support 290,431 281,186 3%
Total revenues $ 1,099,213 $ 1,098,336 –
Operating income $ 108,672 $ 108,267 –
Capital expenditures $ 65,835 $ 77,658 (15%)
KEy RATiOs:
Product support revenues as a % of total revenues 26.4% 25.6%Group total revenues as a % of consolidated revenues 51.8% 58.2%Operating income as a % of revenues 9.9% 9.9%
The Equipment Group delivered solid revenues and operating income in 2008, matching records set in 2007. New equipment sales (which had grown 20% between 2006 and 2007) were 5% lower than the record set in 2007 despite growth
through the first nine months of 2008. The reduction in the fourth quarter reflected economic uncertainty and the decision by certain customers to purchase used rather than new equipment. Engines for marine applications recorded significant growth.
Used equipment sales were up 12% in the year as opportunities arose with several mining clients that purchased used equipment. Sales of used equipment vary depending on customer buying preferences, exchange rate considerations and product availability.
Total equipment sales, new and used, were down 1.5% from the prior year. Sales of equipment to the heavy construction industry were lower in 2008 on weakness in the underlying market and significant equipment purchases in 2007. Sales to mining clients increased in 2008, reaching a new record on deliveries of equipment ordered in 2007 and early 2008.
Rental revenues were up 3% over 2007, largely due to two new locations in Sault Ste. Marie and Concord, Ontario. At Battlefield – The CAT Rental Store, revenues generated by stores open for more than one year were 5.5% higher year-over-year on an expanded rental fleet.
Power generation revenues from Toromont-owned plants declined 21% over the prior year, reflecting the disposition of power generation assets located near Trenton, Ontario in mid 2007. On a comparable basis, power generation revenues were up 7% over 2007, reflecting increased operating hours and higher average prices for electricity.
Product support revenues were 3% higher than the prior year on increases in both parts and service. Contributing to the growth was an increase in parts sales to mining customers and the resolution of a labour dispute in Newfoundland and Labrador, more than offsetting product support declines in southern Ontario.
Operating income in 2008 was even with 2007. Gross margins were higher in 2008 on improved price realization and a higher proportion of product support activities. Selling and administrative expenses were 7% higher in 2008 than in the prior year on higher compensation costs, bad debt expense and sales-related expenses to support volume levels. Operating income was 9.9% of revenues unchanged from the prior year.
New equipment bookings slowed significantly in the latter part of the fourth quarter, in keeping with general economic trends. As a result, bookings for 2008, net of cancellations, were down 10% from the record activity reported in 2007. Bookings were lower across most industries, particularly heavy and general construction and mining, which had received significant new deliveries in 2007 and early 2008.
Backlogs at December 31, 2008 were down 27% year-over-year due to significant customer deliveries in the mining and marine industries in 2008 and on lower bookings in the latter part of the year. Additionally, certain equipment orders were cancelled in the fourth quarter, representing 3% of 2008 bookings. Order cancellations are always part of the sales cycle (fourth quarter 2007 cancellations represented 1% of 2007 bookings), however in the recent quarter cancellations were higher due to reduced project activity related to project viability or restricted access to financing. There were no significant order cancellations in January 2009 and management believes the current backlog to be reasonably secure.
Equipment group Revenue($ MiLLiONs)
2008
2007
2006
2005
2004
913.9
987.9
1,098.3
1,099.2
821.0
Equipment group Operating income($ MiLLiONs)
2008
2007
2006
2005
2004 65.8
80.6
91.5
108.3
108.7

34 | TOROMONT 2008 ANNUAL REPORT
Capital expenditures in the Equipment Group totaled $65.8 million in 2008, of which approximately 78% were for replacement and expansion of the rental fleet. Other capital expenditures included investments in upgrades to existing branches as well as service and delivery vehicles. Capital expenditures in 2007 totaled $77.7 million, 78% of which was for replacement and expansion of the rental fleet.
Results of Operations in the Compression Group
Years ended December 31 ($ thousands) 2008 2007 % change
Package sales and rentals Package sales $ 792,856 $ 577,810 37% Rentals 21,149 19,236 10%
Total package sales and rentals 814,005 597,046 36%Product support 207,991 191,379 9%
Total revenues $ 1,021,996 $ 788,425 30%
Operating income $ 99,182 $ 71,856 38%
Capital expenditures $ 30,640 $ 19,450 58%
KEy RATiOs:
Product support revenues as a % of total revenues 20.4% 24.3%Group total revenues as a % of consolidated revenues 48.2% 41.8%Operating income as a % of revenues 9.7% 9.1%
The Compression Group delivered excellent growth in revenues and operating income in 2008 and set new performance records for both.Revenue growth within the Compression Group reflects varied natural gas market conditions across North America. In the U.S., natural
gas compression revenues doubled in 2008 from 2007 levels. Market conditions have been favourable and the Company’s participation in this market has increased through investment in facilities and people over the last two years. Several significant pipeline orders received in 2007 also contributed to this growth.
In Canada, revenues from natural gas compression packages declined 5% from 2007. Natural gas markets peaked in 2005 and have declined since then due to a number of industry factors including high levels of gas in storage, low commodity prices, higher costs associated with drilling activity and, until recently, a strong Canadian dollar.
Revenues from process system applications increased 8% in 2008. The Company continues to focus on this area as part of its strategy to diversify and grow its revenue base.
Revenues from sales of refrigeration systems were up 2% as growth in Canada was partially offset by lower activity within international markets. Industrial activity within the U.S. has also been slow due to the generally weak economic environment.
Rental revenues were $1.9 million or 10% higher in 2008 than in 2007. The increase was due to the Company’s larger rental fleet in the U.S., which was driven by specific customer requirements.
Product support revenues were up 9% in the year, with even growth in natural gas and industrial refrigeration. The growing installed base and additional service technicians continued to strengthen Compression product support activities, particularly in the U.S.
Operating income for the Compression Group increased 38% in the year on the 30% increase in revenues. Gross margins were down slightly over the prior year due to a lower proportion of product support business in 2008. General and administrative expenses increased 11% year-over-year with increases driven by higher bad debt expense and higher compensation and occupancy costs reflecting expanded operations in the U.S. Operating income increased to 9.7% of revenues for the year compared with 9.1% in the prior year.
Compression bookings in 2008, net of cancellations, were up 24% for the year. Natural gas compression bookings were up 45%, with double digit increases in both Canada and the U.S. Industrial and recreational bookings were down 26%, as gains in the recreational sector were more than offset by a weaker industrial sector. End-of-year backlogs were 19% higher than last year. The Compression Group also saw cancellations of certain orders late in the fourth quarter. These cancellations represented 4% of full-year bookings. Additional cancellations in January 2009, represented a relatively insubstantial 0.6% of 2008 bookings. There was also a noticeable decline in booking levels in the latter part of the fourth quarter as lower prices for natural gas have led to reductions in the capital spending plans of the major natural gas producers.
compression group Revenue($ MiLLiONs)
2008
2007
2006
2005
2004
671.0
758.3
788.4
1,022.0
594.5
compression group Operating income($ MiLLiONs)
2008
2007
2006
2005
2004 52.4
56.9
73.8
71.8
99.2
TOROMONT 2008 ANNUAL REPORT | 35
Capital expenditures in the Compression Group totaled $30.6 million in 2008. Significant capital expenditures related to the expansion of manufacturing facilities in Casper, Wyoming. Approximately 22% of capital expenditures in 2008 were for natural gas compression package rental fleet in the U.S. in response to specific demand. Capital expenditures in 2007 were $19.4 million. Investments in 2007 were related to the expansion of the Canadian natural gas compression package rental fleet and expansion of Casper, Wyoming fabrication facilities.
CONSOLIDATED FINANCIAL CONDITIONThe Company has maintained a strong financial position for many years. At December 31, 2008, the ratio of total debt, net of cash, to equity was 0.05:1 compared to 0.19:1 in the prior year. Total assets were $1.5 billion at December 31, 2008, compared with $1.4 billion at the end of 2007.
Working CapitalThe Company’s investment in non-cash working capital increased to $372.0 million at December 31, 2008. The major components, along with the changes from December 31, 2007, are identified in the following table.
Years ended December 31 ($ thousands) 2008 2007 $ change % change
Accounts receivable $ 375,059 $ 339,381 $ 35,678 11%Inventories 499,360 444,858 54,502 12%Future income tax assets 34,934 24,362 10,572 43%Derivative financial instruments 11,246 (3,575) 14,821 n/mOther current assets 11,381 27,607 (16,226) (59%)Accounts payable and accrued liabilities (337,073) (267,999) (69,074) 26%Dividends payable (9,045) (7,792) (1,253) 16%Deferred revenue (194,261) (160,678) (33,583) 21%Current portion of long-term debt (15,363) (26,874) 11,511 (43%)Income taxes payable, net (4,236) (5,945) 1,709 (29%)
Total non-cash working capital $ 372,002 $ 363,345 $ 8,657 2%
n/m = not meaningful
Accounts receivable were 11% higher than last year. Approximately half of the increase ($17.5 million) was a result of foreign exchange translation of U.S. subsidiaries. Accounts receivable in the Compression Group were up 33% (23% excluding foreign exchange) on 39% higher fourth quarter revenues in 2008 compared to 2007. Equipment Group accounts receivable were down 12% on 4% lower fourth quarter revenues in 2008 compared to 2007 and a modest improvement in collections.
Inventories were 12% higher than at December 31, 2007. Equipment Group inventory was up 13% from a year ago on higher new machine inventory cost related to the weaker Canadian dollar and supplier price increases, and more equipment on rent with purchase options. Compression Group inventory was up 11%, or 4% excluding the impact of foreign exchange on U.S. subsidiaries. Increases in inventory in the U.S. to support higher volumes and plant expansion were largely offset by decreases in inventory in Canada in light of current and expected sales volumes.
Future income tax assets reflect differences between income tax and accounting. Derivative financial instruments represent the fair value of foreign exchange contracts. Given the recent volatility in the Canadian/U.S.
dollar exchange rate, the Company’s hedging practices have led to a cumulative net opportunity gain of $11.2 million as at December 31, 2008, compared to an opportunity loss of $3.6 million in 2007. This is not expected to affect net income, as the unrealized gain will offset future losses on hedged items.
Other current assets in 2007 included deposits made for equipment ordered for a significant project and scheduled for delivery through 2008. This equipment was received and charged to cost of sales in 2008.
Accounts payable and accrued liabilities were 26% higher than at December 31, 2007. Compression Group accounts payable and accrued liabilities were higher on increased supplier payables and warranty reserves in support of higher volumes. Equipment Group was up on higher key supplier payables.
Dividends payable were 16% higher than in 2007 reflecting the higher dividend rate of $0.14 per share compared to $0.12 per share a year ago.

36 | TOROMONT 2008 ANNUAL REPORT
Deferred revenues increased 21% from December 31, 2007, or 7% excluding the impact of the weaker Canadian dollar in 2008. The Compression Group uses progress billings as a method of funding working capital requirements on long-term contracts. Certain progress billings collected in 2006 on certain long-term contracts scheduled for delivery in 2009 are now classified as current.
Current portion of long-term debt reflects scheduled principal repayments due in 2009. This amount is lower as a result of the maturity of senior debentures in September 2008.
Income taxes payable reflects amounts owing for corporate income taxes less installments made to date. The amount payable decreased from 2007 due to higher installments in 2008.
GoodwillThe Company performs impairment tests on its goodwill balances on an annual basis or as warranted by events or circumstances. The assessment of goodwill entails estimating the fair value of operations to which the goodwill relates using the present value of expected discounted future cash flows. This assessment affirmed goodwill values as at December 31, 2008.
Employee Share OwnershipThe Company employs a variety of stock-based compensation plans to align employees’ interests with corporate objectives. At December 31, 2008, 1.9 million options to purchase common shares were outstanding, with 0.9 million exercisable at the reporting date (2007 – 1.8 million and 0.8 million, respectively). There was a one cent impact on diluted EPS in 2008 and 2007 as per Note 18 to the consolidated financial statements.
The Company offers an Employee Share Ownership Plan whereby employees can purchase shares by way of payroll deductions. In 2008, the Company enhanced this plan to provide a Company match on contributions at a rate of $1 for every $3 dollars contributed, to a maximum of $1,000 per annum. Company contributions vest to the employee immediately. Company contributions amounting to $0.8 million in 2008 (2007 - nil), were charged to selling and administrative expense when paid. A third party administers the Plan.
Employee Future BenefitsThe Company sponsors pension arrangements for substantially all of its employees, primarily through defined contribution plans in Canada and a 401(k) matched savings plan in the United States. Certain unionized employees do not participate in Company-sponsored plans, and contributions are made to these union-sponsored plans in accordance with respective collective bargaining agreements. In the case of the defined contribution plans, regular contributions are made to the employees’ individual accounts, which are administered by a plan trustee, in accordance with the plan document. Future expense for these plans will vary based on future participation rates.
Approximately 5% of active employees participate in one of two defined benefit plans:n Powell Plan – Consists of personnel of Powell Equipment (acquired by Toromont in 2001); and n Other plan assets and obligations – Provides for certain retirees and terminated vested employees of businesses previously acquired
by the Company as well as for retired participants of the defined contribution plan who, in accordance with the plan provisions, have elected to receive a pension directly from the plan.
The downturn in financial markets in 2008 resulted in a loss on opening plan assets of $7.2 million or 13%. The funded status of the plans has declined from a surplus of $4.4 million to zero surplus. The unrecognized actuarial loss at December 31, 2008, increased to $12.4 million from $7.1 million last year. Pension plan accounting requires gains and losses to be effectively smoothed over future periods, beginning in the following period. The actuarial losses in 2008 will not begin to impact the Company’s income directly until 2009. The Company expects pension expense to increase in 2009 by approximately $1.5 million to reflect changes in underlying plan assets and obligations. The Company expects 2009 cash pension contributions to be similar to 2008 levels. Pending results of the next scheduled actuarial valuation, cash contribution requirements may change, but this is not expected to have any impact until 2010.
The Company also has a pension arrangement for certain senior executives that provides for a supplementary retirement payout in excess of amounts provided for under the registered plan. This “Executive Plan” is a non-contributory pension arrangement and is solely the obligation of the Company. The Company is not obligated to fund this plan but is obligated to pay benefits under the terms of the plan as they come due. The Company has posted letters of credit to secure the obligations under this plan, which were $21.5 million as at December 31, 2008. As there are only nominal plan assets, the impact of recent volatile markets on pension expense and contributions for this plan are insignificant.
The Company estimates a long-term return on plan assets of 7%. While there is no assurance that the plan will be able to generate this assumed rate of return each year, management believes that it is a reasonable longer-term estimate.
2007
2006
2005
2004
2008
capital structure($ MiLLiONs)
shareholders’ equity
debt, net of cash
415.9
481.8
565.6
654.7
779.1
187.0
203.4
205.6
126.8
36.2
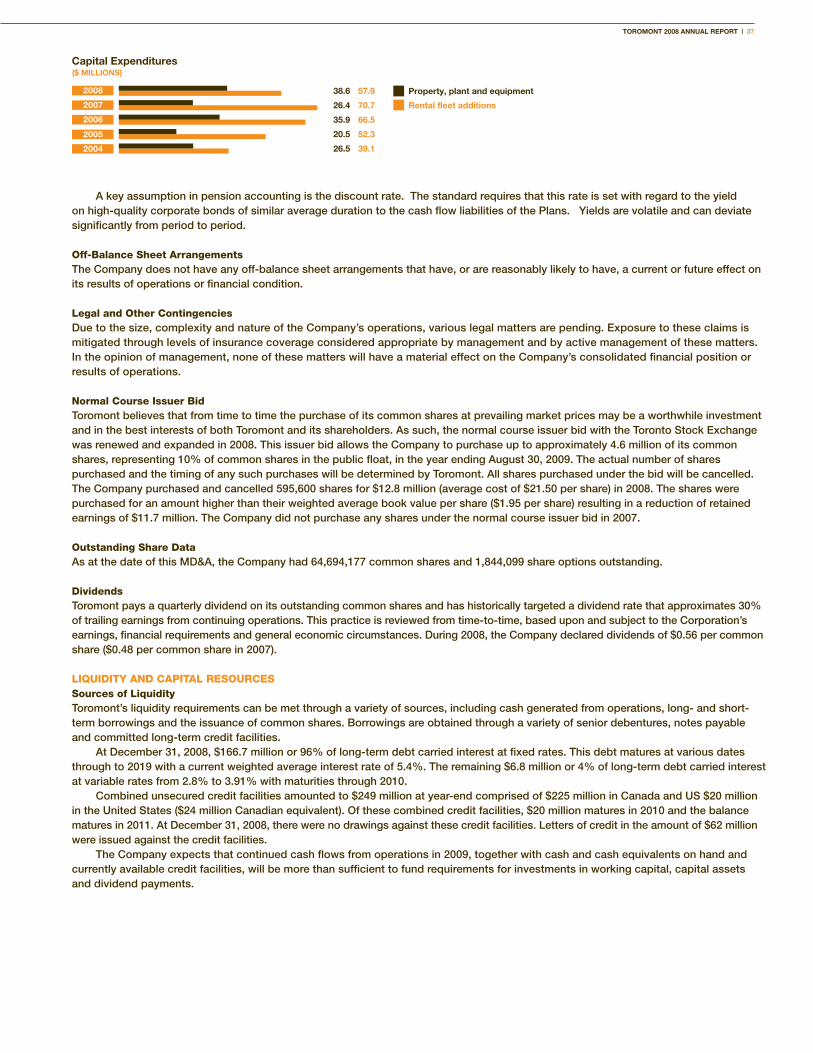
TOROMONT 2008 ANNUAL REPORT | 37
A key assumption in pension accounting is the discount rate. The standard requires that this rate is set with regard to the yield on high-quality corporate bonds of similar average duration to the cash flow liabilities of the Plans. Yields are volatile and can deviate significantly from period to period.
Off-Balance Sheet ArrangementsThe Company does not have any off-balance sheet arrangements that have, or are reasonably likely to have, a current or future effect on its results of operations or financial condition.
Legal and Other ContingenciesDue to the size, complexity and nature of the Company’s operations, various legal matters are pending. Exposure to these claims is mitigated through levels of insurance coverage considered appropriate by management and by active management of these matters. In the opinion of management, none of these matters will have a material effect on the Company’s consolidated financial position or results of operations.
Normal Course Issuer BidToromont believes that from time to time the purchase of its common shares at prevailing market prices may be a worthwhile investment and in the best interests of both Toromont and its shareholders. As such, the normal course issuer bid with the Toronto Stock Exchange was renewed and expanded in 2008. This issuer bid allows the Company to purchase up to approximately 4.6 million of its common shares, representing 10% of common shares in the public float, in the year ending August 30, 2009. The actual number of shares purchased and the timing of any such purchases will be determined by Toromont. All shares purchased under the bid will be cancelled. The Company purchased and cancelled 595,600 shares for $12.8 million (average cost of $21.50 per share) in 2008. The shares were purchased for an amount higher than their weighted average book value per share ($1.95 per share) resulting in a reduction of retained earnings of $11.7 million. The Company did not purchase any shares under the normal course issuer bid in 2007.
Outstanding Share DataAs at the date of this MD&A, the Company had 64,694,177 common shares and 1,844,099 share options outstanding.
DividendsToromont pays a quarterly dividend on its outstanding common shares and has historically targeted a dividend rate that approximates 30% of trailing earnings from continuing operations. This practice is reviewed from time-to-time, based upon and subject to the Corporation’s earnings, financial requirements and general economic circumstances. During 2008, the Company declared dividends of $0.56 per common share ($0.48 per common share in 2007).
LIQUIDITY AND CAPITAL RESOURCESSources of LiquidityToromont’s liquidity requirements can be met through a variety of sources, including cash generated from operations, long- and short-term borrowings and the issuance of common shares. Borrowings are obtained through a variety of senior debentures, notes payable and committed long-term credit facilities.
At December 31, 2008, $166.7 million or 96% of long-term debt carried interest at fixed rates. This debt matures at various dates through to 2019 with a current weighted average interest rate of 5.4%. The remaining $6.8 million or 4% of long-term debt carried interest at variable rates from 2.8% to 3.91% with maturities through 2010.
Combined unsecured credit facilities amounted to $249 million at year-end comprised of $225 million in Canada and US $20 million in the United States ($24 million Canadian equivalent). Of these combined credit facilities, $20 million matures in 2010 and the balance matures in 2011. At December 31, 2008, there were no drawings against these credit facilities. Letters of credit in the amount of $62 million were issued against the credit facilities.
The Company expects that continued cash flows from operations in 2009, together with cash and cash equivalents on hand and currently available credit facilities, will be more than sufficient to fund requirements for investments in working capital, capital assets and dividend payments.
capital Expenditures($ MiLLiONs)
Property, plant and equipment
Rental fleet additions
26.5
20.5
35.9
26.4
38.6
39.1
52.3
66.5
70.7
57.92008
2007
2006
2005
2004
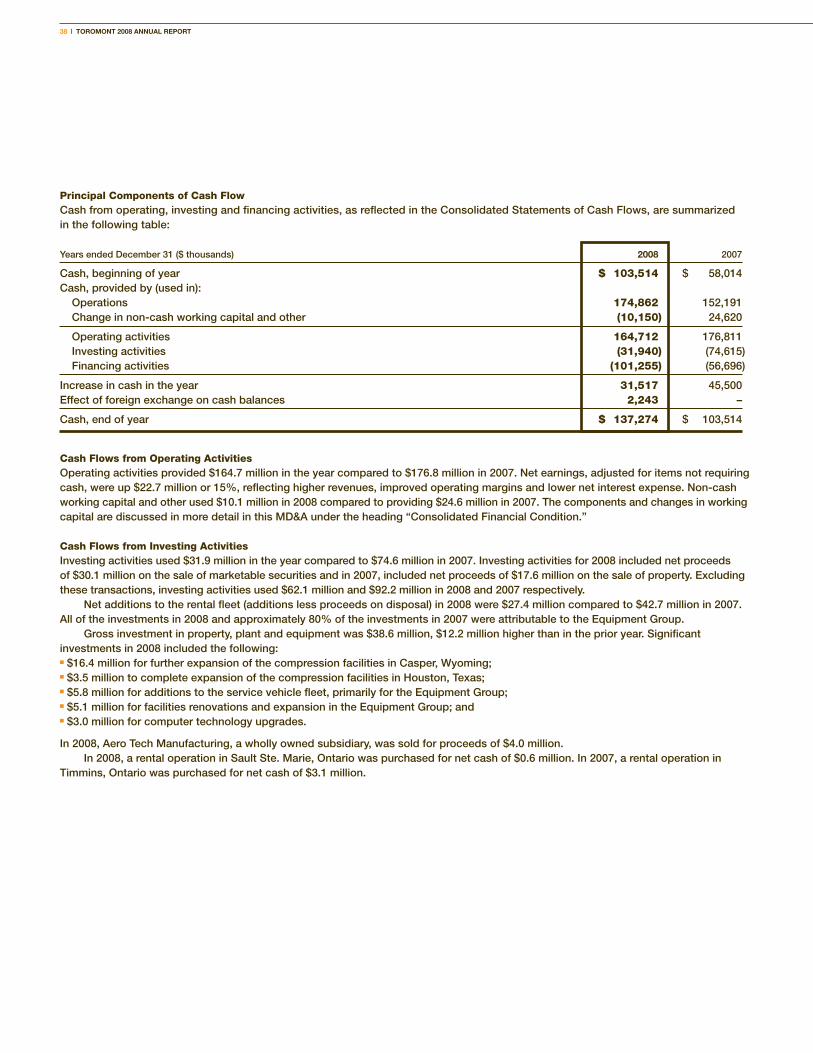
38 | TOROMONT 2008 ANNUAL REPORT
Principal Components of Cash FlowCash from operating, investing and financing activities, as reflected in the Consolidated Statements of Cash Flows, are summarized in the following table:
Years ended December 31 ($ thousands) 2008 2007
Cash, beginning of year $ 103,514 $ 58,014Cash, provided by (used in): Operations 174,862 152,191 Change in non-cash working capital and other (10,150) 24,620
Operating activities 164,712 176,811 Investing activities (31,940) (74,615) Financing activities (101,255) (56,696)
Increase in cash in the year 31,517 45,500Effect of foreign exchange on cash balances 2,243 –
Cash, end of year $ 137,274 $ 103,514
Cash Flows from Operating ActivitiesOperating activities provided $164.7 million in the year compared to $176.8 million in 2007. Net earnings, adjusted for items not requiring cash, were up $22.7 million or 15%, reflecting higher revenues, improved operating margins and lower net interest expense. Non-cash working capital and other used $10.1 million in 2008 compared to providing $24.6 million in 2007. The components and changes in working capital are discussed in more detail in this MD&A under the heading “Consolidated Financial Condition.”
Cash Flows from Investing ActivitiesInvesting activities used $31.9 million in the year compared to $74.6 million in 2007. Investing activities for 2008 included net proceeds of $30.1 million on the sale of marketable securities and in 2007, included net proceeds of $17.6 million on the sale of property. Excluding these transactions, investing activities used $62.1 million and $92.2 million in 2008 and 2007 respectively.
Net additions to the rental fleet (additions less proceeds on disposal) in 2008 were $27.4 million compared to $42.7 million in 2007. All of the investments in 2008 and approximately 80% of the investments in 2007 were attributable to the Equipment Group.
Gross investment in property, plant and equipment was $38.6 million, $12.2 million higher than in the prior year. Significant investments in 2008 included the following:n $16.4 million for further expansion of the compression facilities in Casper, Wyoming;n $3.5 million to complete expansion of the compression facilities in Houston, Texas;n $5.8 million for additions to the service vehicle fleet, primarily for the Equipment Group;n $5.1 million for facilities renovations and expansion in the Equipment Group; andn $3.0 million for computer technology upgrades.
In 2008, Aero Tech Manufacturing, a wholly owned subsidiary, was sold for proceeds of $4.0 million.In 2008, a rental operation in Sault Ste. Marie, Ontario was purchased for net cash of $0.6 million. In 2007, a rental operation in
Timmins, Ontario was purchased for net cash of $3.1 million.
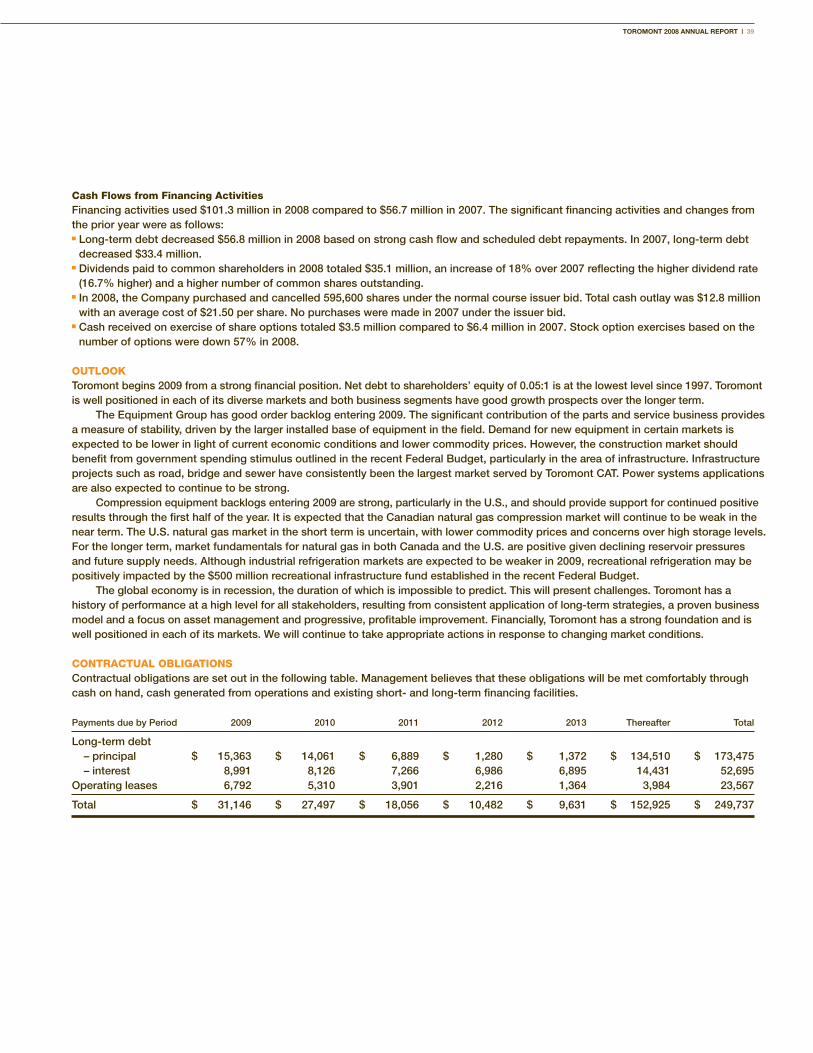
TOROMONT 2008 ANNUAL REPORT | 39
Cash Flows from Financing ActivitiesFinancing activities used $101.3 million in 2008 compared to $56.7 million in 2007. The significant financing activities and changes from the prior year were as follows:n Long-term debt decreased $56.8 million in 2008 based on strong cash flow and scheduled debt repayments. In 2007, long-term debt
decreased $33.4 million. n Dividends paid to common shareholders in 2008 totaled $35.1 million, an increase of 18% over 2007 reflecting the higher dividend rate
(16.7% higher) and a higher number of common shares outstanding. n In 2008, the Company purchased and cancelled 595,600 shares under the normal course issuer bid. Total cash outlay was $12.8 million
with an average cost of $21.50 per share. No purchases were made in 2007 under the issuer bid.n Cash received on exercise of share options totaled $3.5 million compared to $6.4 million in 2007. Stock option exercises based on the
number of options were down 57% in 2008.
OUTLOOKToromont begins 2009 from a strong financial position. Net debt to shareholders’ equity of 0.05:1 is at the lowest level since 1997. Toromont is well positioned in each of its diverse markets and both business segments have good growth prospects over the longer term.
The Equipment Group has good order backlog entering 2009. The significant contribution of the parts and service business provides a measure of stability, driven by the larger installed base of equipment in the field. Demand for new equipment in certain markets is expected to be lower in light of current economic conditions and lower commodity prices. However, the construction market should benefit from government spending stimulus outlined in the recent Federal Budget, particularly in the area of infrastructure. Infrastructure projects such as road, bridge and sewer have consistently been the largest market served by Toromont CAT. Power systems applications are also expected to continue to be strong.
Compression equipment backlogs entering 2009 are strong, particularly in the U.S., and should provide support for continued positive results through the first half of the year. It is expected that the Canadian natural gas compression market will continue to be weak in the near term. The U.S. natural gas market in the short term is uncertain, with lower commodity prices and concerns over high storage levels. For the longer term, market fundamentals for natural gas in both Canada and the U.S. are positive given declining reservoir pressures and future supply needs. Although industrial refrigeration markets are expected to be weaker in 2009, recreational refrigeration may be positively impacted by the $500 million recreational infrastructure fund established in the recent Federal Budget.
The global economy is in recession, the duration of which is impossible to predict. This will present challenges. Toromont has a history of performance at a high level for all stakeholders, resulting from consistent application of long-term strategies, a proven business model and a focus on asset management and progressive, profitable improvement. Financially, Toromont has a strong foundation and is well positioned in each of its markets. We will continue to take appropriate actions in response to changing market conditions.
CONTRACTUAL OBLIGATIONSContractual obligations are set out in the following table. Management believes that these obligations will be met comfortably through cash on hand, cash generated from operations and existing short- and long-term financing facilities.
Payments due by Period 2009 2010 2011 2012 2013 Thereafter Total
Long-term debt – principal $ 15,363 $ 14,061 $ 6,889 $ 1,280 $ 1,372 $ 134,510 $ 173,475 – interest 8,991 8,126 7,266 6,986 6,895 14,431 52,695 Operating leases 6,792 5,310 3,901 2,216 1,364 3,984 23,567
Total $ 31,146 $ 27,497 $ 18,056 $ 10,482 $ 9,631 $ 152,925 $ 249,737
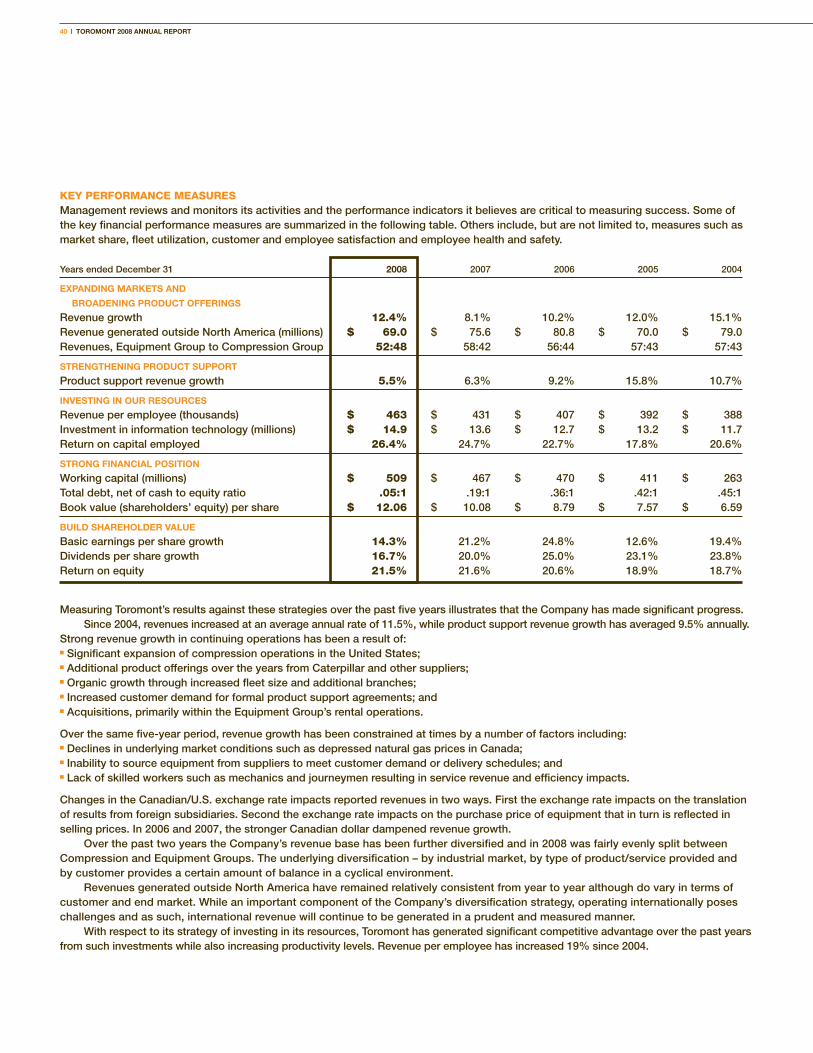
40 | TOROMONT 2008 ANNUAL REPORT
KEY PERFORMANCE MEASURESManagement reviews and monitors its activities and the performance indicators it believes are critical to measuring success. Some of the key financial performance measures are summarized in the following table. Others include, but are not limited to, measures such as market share, fleet utilization, customer and employee satisfaction and employee health and safety.
Years ended December 31 2008 2007 2006 2005 2004
ExPANdiNg MARKETs ANd
BROAdENiNg PROdUcT OffERiNgs
Revenue growth 12.4% 8.1% 10.2% 12.0% 15.1%Revenue generated outside North America (millions) $ 69.0 $ 75.6 $ 80.8 $ 70.0 $ 79.0 Revenues, Equipment Group to Compression Group 52:48 58:42 56:44 57:43 57:43
sTRENgThENiNg PROdUcT sUPPORT
Product support revenue growth 5.5% 6.3% 9.2% 15.8% 10.7%
iNvEsTiNg iN OUR REsOURcEs
Revenue per employee (thousands) $ 463 $ 431 $ 407 $ 392 $ 388 Investment in information technology (millions) $ 14.9 $ 13.6 $ 12.7 $ 13.2 $ 11.7 Return on capital employed 26.4% 24.7% 22.7% 17.8% 20.6%
sTRONg fiNANciAL POsiTiON
Working capital (millions) $ 509 $ 467 $ 470 $ 411 $ 263 Total debt, net of cash to equity ratio .05:1 .19:1 .36:1 .42:1 .45:1Book value (shareholders’ equity) per share $ 12.06 $ 10.08 $ 8.79 $ 7.57 $ 6.59
BUiLd shAREhOLdER vALUE
Basic earnings per share growth 14.3% 21.2% 24.8% 12.6% 19.4%Dividends per share growth 16.7% 20.0% 25.0% 23.1% 23.8%Return on equity 21.5% 21.6% 20.6% 18.9% 18.7%
Measuring Toromont’s results against these strategies over the past five years illustrates that the Company has made significant progress. Since 2004, revenues increased at an average annual rate of 11.5%, while product support revenue growth has averaged 9.5% annually.
Strong revenue growth in continuing operations has been a result of:n Significant expansion of compression operations in the United States;n Additional product offerings over the years from Caterpillar and other suppliers;n Organic growth through increased fleet size and additional branches; n Increased customer demand for formal product support agreements; andn Acquisitions, primarily within the Equipment Group’s rental operations.
Over the same five-year period, revenue growth has been constrained at times by a number of factors including:n Declines in underlying market conditions such as depressed natural gas prices in Canada;n Inability to source equipment from suppliers to meet customer demand or delivery schedules; andn Lack of skilled workers such as mechanics and journeymen resulting in service revenue and efficiency impacts.
Changes in the Canadian/U.S. exchange rate impacts reported revenues in two ways. First the exchange rate impacts on the translation of results from foreign subsidiaries. Second the exchange rate impacts on the purchase price of equipment that in turn is reflected in selling prices. In 2006 and 2007, the stronger Canadian dollar dampened revenue growth.
Over the past two years the Company’s revenue base has been further diversified and in 2008 was fairly evenly split between Compression and Equipment Groups. The underlying diversification – by industrial market, by type of product/service provided and by customer provides a certain amount of balance in a cyclical environment.
Revenues generated outside North America have remained relatively consistent from year to year although do vary in terms of customer and end market. While an important component of the Company’s diversification strategy, operating internationally poses challenges and as such, international revenue will continue to be generated in a prudent and measured manner.
With respect to its strategy of investing in its resources, Toromont has generated significant competitive advantage over the past years from such investments while also increasing productivity levels. Revenue per employee has increased 19% since 2004.
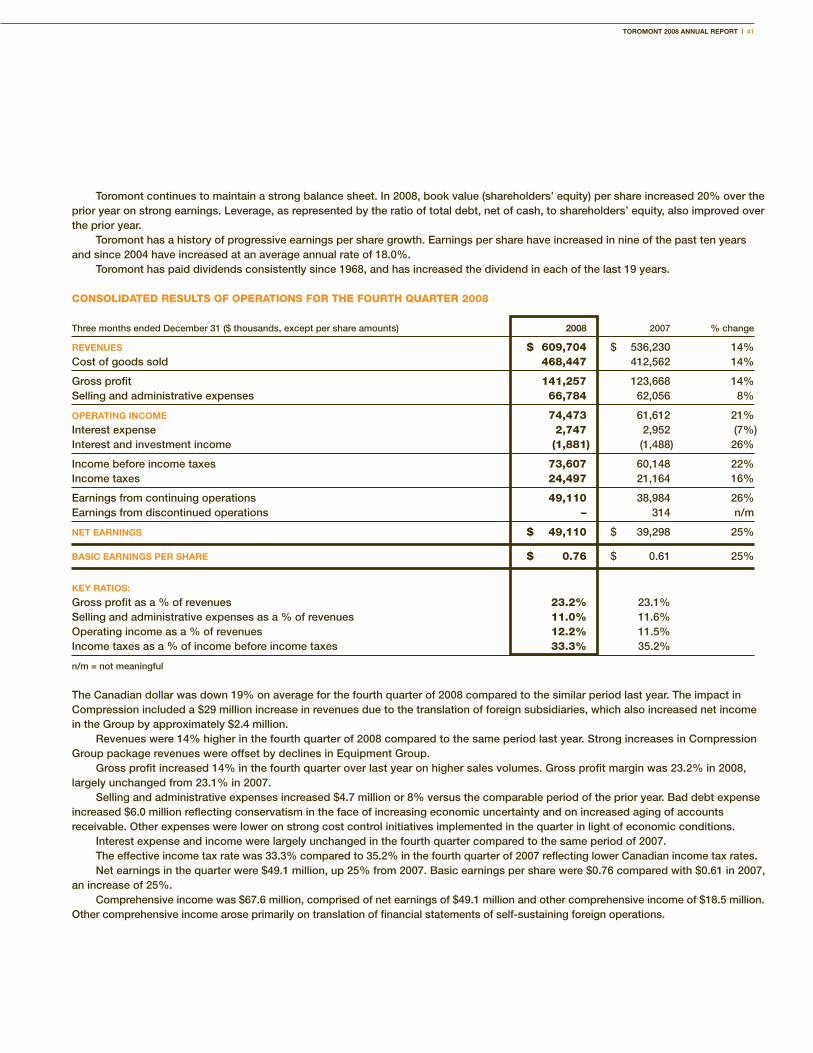
TOROMONT 2008 ANNUAL REPORT | 41
Toromont continues to maintain a strong balance sheet. In 2008, book value (shareholders’ equity) per share increased 20% over the prior year on strong earnings. Leverage, as represented by the ratio of total debt, net of cash, to shareholders’ equity, also improved over the prior year.
Toromont has a history of progressive earnings per share growth. Earnings per share have increased in nine of the past ten years and since 2004 have increased at an average annual rate of 18.0%.
Toromont has paid dividends consistently since 1968, and has increased the dividend in each of the last 19 years.
CONSOLIDATED RESULTS OF OPERATIONS FOR THE FOURTH QUARTER 2008
Three months ended December 31 ($ thousands, except per share amounts) 2008 2007 % change
REvENUEs $ 609,704 $ 536,230 14% Cost of goods sold 468,447 412,562 14%
Gross profit 141,257 123,668 14%Selling and administrative expenses 66,784 62,056 8%
OPERATiNg iNcOME 74,473 61,612 21%Interest expense 2,747 2,952 (7%)Interest and investment income (1,881) (1,488) 26%
Income before income taxes 73,607 60,148 22%Income taxes 24,497 21,164 16%
Earnings from continuing operations 49,110 38,984 26%Earnings from discontinued operations – 314 n/m
NET EARNiNgs $ 49,110 $ 39,298 25%
BAsic EARNiNgs PER shARE $ 0.76 $ 0.61 25%
KEy RATiOs:
Gross profit as a % of revenues 23.2% 23.1%Selling and administrative expenses as a % of revenues 11.0% 11.6%Operating income as a % of revenues 12.2% 11.5%Income taxes as a % of income before income taxes 33.3% 35.2%
n/m = not meaningful
The Canadian dollar was down 19% on average for the fourth quarter of 2008 compared to the similar period last year. The impact in Compression included a $29 million increase in revenues due to the translation of foreign subsidiaries, which also increased net income in the Group by approximately $2.4 million.
Revenues were 14% higher in the fourth quarter of 2008 compared to the same period last year. Strong increases in Compression Group package revenues were offset by declines in Equipment Group.
Gross profit increased 14% in the fourth quarter over last year on higher sales volumes. Gross profit margin was 23.2% in 2008, largely unchanged from 23.1% in 2007.
Selling and administrative expenses increased $4.7 million or 8% versus the comparable period of the prior year. Bad debt expense increased $6.0 million reflecting conservatism in the face of increasing economic uncertainty and on increased aging of accounts receivable. Other expenses were lower on strong cost control initiatives implemented in the quarter in light of economic conditions.
Interest expense and income were largely unchanged in the fourth quarter compared to the same period of 2007. The effective income tax rate was 33.3% compared to 35.2% in the fourth quarter of 2007 reflecting lower Canadian income tax rates.Net earnings in the quarter were $49.1 million, up 25% from 2007. Basic earnings per share were $0.76 compared with $0.61 in 2007,
an increase of 25%.Comprehensive income was $67.6 million, comprised of net earnings of $49.1 million and other comprehensive income of $18.5 million.
Other comprehensive income arose primarily on translation of financial statements of self-sustaining foreign operations.
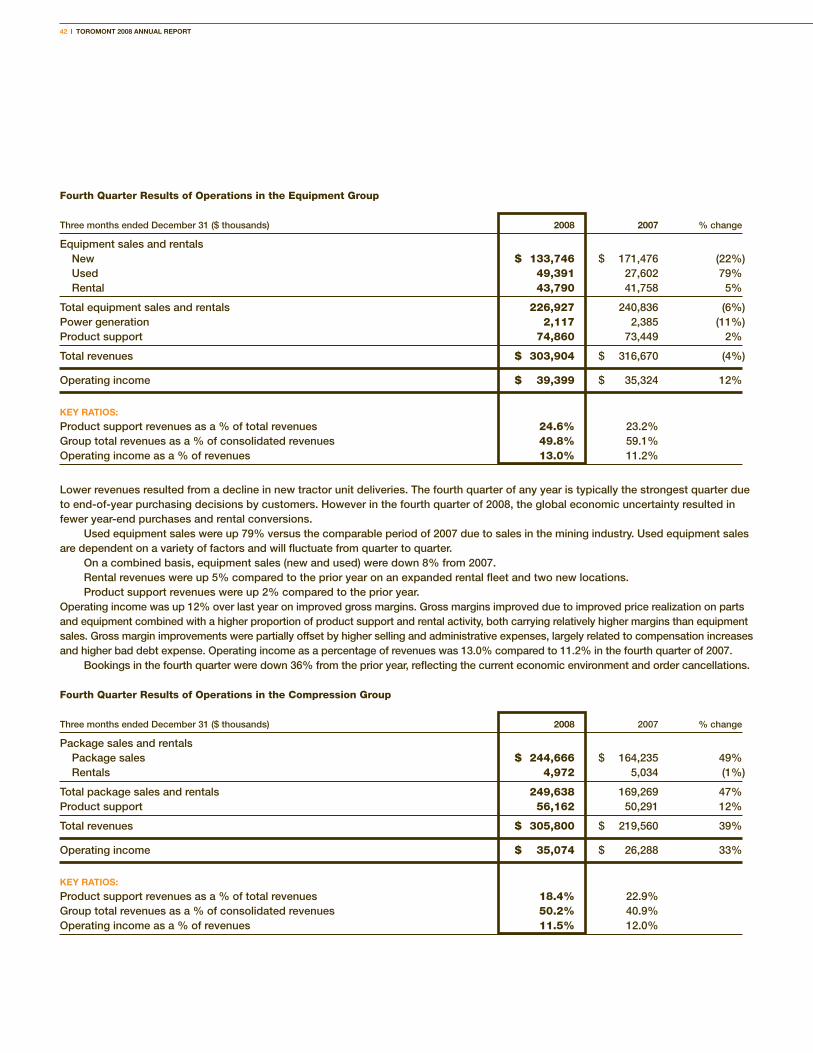
42 | TOROMONT 2008 ANNUAL REPORT
Fourth Quarter Results of Operations in the Equipment Group
Three months ended December 31 ($ thousands) 2008 2007 % change
Equipment sales and rentals New $ 133,746 $ 171,476 (22%) Used 49,391 27,602 79% Rental 43,790 41,758 5%
Total equipment sales and rentals 226,927 240,836 (6%)Power generation 2,117 2,385 (11%)Product support 74,860 73,449 2%
Total revenues $ 303,904 $ 316,670 (4%)
Operating income $ 39,399 $ 35,324 12%
KEy RATiOs:
Product support revenues as a % of total revenues 24.6% 23.2%Group total revenues as a % of consolidated revenues 49.8% 59.1%Operating income as a % of revenues 13.0% 11.2%
Lower revenues resulted from a decline in new tractor unit deliveries. The fourth quarter of any year is typically the strongest quarter due to end-of-year purchasing decisions by customers. However in the fourth quarter of 2008, the global economic uncertainty resulted in fewer year-end purchases and rental conversions.
Used equipment sales were up 79% versus the comparable period of 2007 due to sales in the mining industry. Used equipment sales are dependent on a variety of factors and will fluctuate from quarter to quarter.
On a combined basis, equipment sales (new and used) were down 8% from 2007. Rental revenues were up 5% compared to the prior year on an expanded rental fleet and two new locations. Product support revenues were up 2% compared to the prior year.
Operating income was up 12% over last year on improved gross margins. Gross margins improved due to improved price realization on parts and equipment combined with a higher proportion of product support and rental activity, both carrying relatively higher margins than equipment sales. Gross margin improvements were partially offset by higher selling and administrative expenses, largely related to compensation increases and higher bad debt expense. Operating income as a percentage of revenues was 13.0% compared to 11.2% in the fourth quarter of 2007.
Bookings in the fourth quarter were down 36% from the prior year, reflecting the current economic environment and order cancellations.
Fourth Quarter Results of Operations in the Compression Group
Three months ended December 31 ($ thousands) 2008 2007 % change
Package sales and rentals Package sales $ 244,666 $ 164,235 49% Rentals 4,972 5,034 (1%)
Total package sales and rentals 249,638 169,269 47%Product support 56,162 50,291 12%
Total revenues $ 305,800 $ 219,560 39%
Operating income $ 35,074 $ 26,288 33%
KEy RATiOs:
Product support revenues as a % of total revenues 18.4% 22.9%Group total revenues as a % of consolidated revenues 50.2% 40.9%Operating income as a % of revenues 11.5% 12.0%
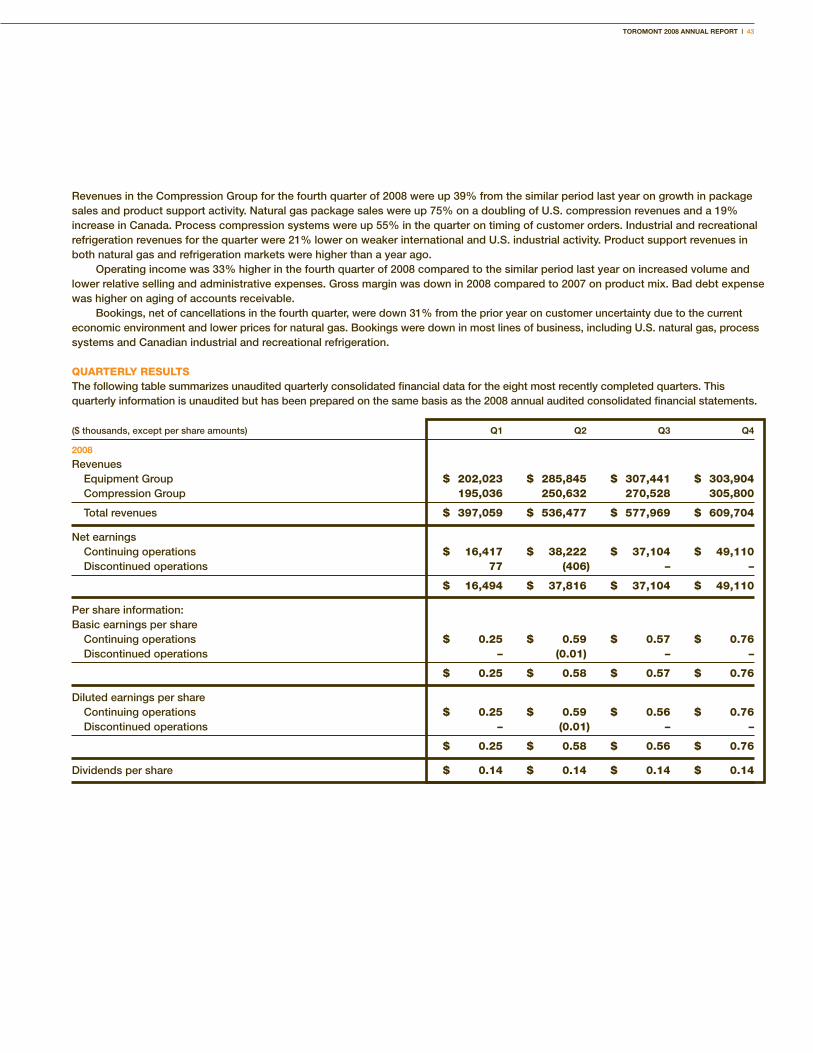
TOROMONT 2008 ANNUAL REPORT | 43
Revenues in the Compression Group for the fourth quarter of 2008 were up 39% from the similar period last year on growth in package sales and product support activity. Natural gas package sales were up 75% on a doubling of U.S. compression revenues and a 19% increase in Canada. Process compression systems were up 55% in the quarter on timing of customer orders. Industrial and recreational refrigeration revenues for the quarter were 21% lower on weaker international and U.S. industrial activity. Product support revenues in both natural gas and refrigeration markets were higher than a year ago.
Operating income was 33% higher in the fourth quarter of 2008 compared to the similar period last year on increased volume and lower relative selling and administrative expenses. Gross margin was down in 2008 compared to 2007 on product mix. Bad debt expense was higher on aging of accounts receivable.
Bookings, net of cancellations in the fourth quarter, were down 31% from the prior year on customer uncertainty due to the current economic environment and lower prices for natural gas. Bookings were down in most lines of business, including U.S. natural gas, process systems and Canadian industrial and recreational refrigeration.
QUARTERLY RESULTSThe following table summarizes unaudited quarterly consolidated financial data for the eight most recently completed quarters. This quarterly information is unaudited but has been prepared on the same basis as the 2008 annual audited consolidated financial statements.
($ thousands, except per share amounts) Q1 Q2 Q3 Q4
2008
Revenues Equipment Group $ 202,023 $ 285,845 $ 307,441 $ 303,904 Compression Group 195,036 250,632 270,528 305,800
Total revenues $ 397,059 $ 536,477 $ 577,969 $ 609,704
Net earnings Continuing operations $ 16,417 $ 38,222 $ 37,104 $ 49,110 Discontinued operations 77 (406) – –
$ 16,494 $ 37,816 $ 37,104 $ 49,110
Per share information:Basic earnings per share Continuing operations $ 0.25 $ 0.59 $ 0.57 $ 0.76 Discontinued operations – (0.01) – –
$ 0.25 $ 0.58 $ 0.57 $ 0.76
Diluted earnings per share Continuing operations $ 0.25 $ 0.59 $ 0.56 $ 0.76 Discontinued operations – (0.01) – –
$ 0.25 $ 0.58 $ 0.56 $ 0.76
Dividends per share $ 0.14 $ 0.14 $ 0.14 $ 0.14
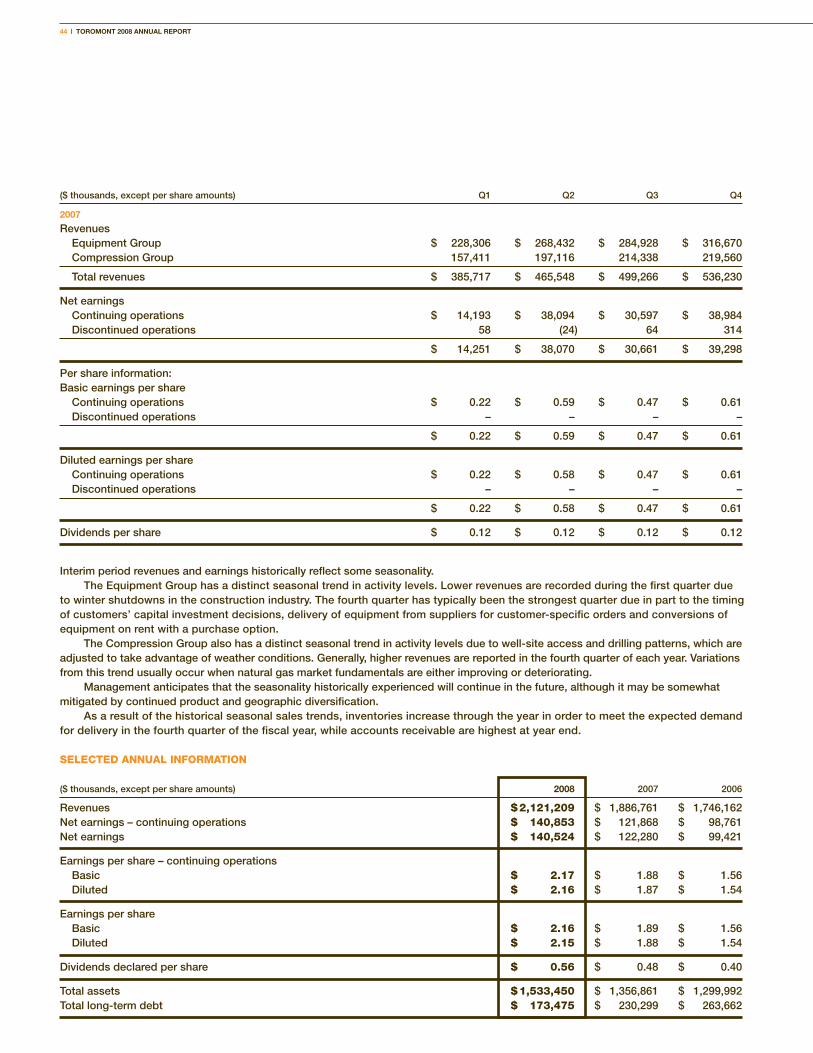
44 | TOROMONT 2008 ANNUAL REPORT
($ thousands, except per share amounts) Q1 Q2 Q3 Q4
2007
Revenues Equipment Group $ 228,306 $ 268,432 $ 284,928 $ 316,670 Compression Group 157,411 197,116 214,338 219,560
Total revenues $ 385,717 $ 465,548 $ 499,266 $ 536,230
Net earnings Continuing operations $ 14,193 $ 38,094 $ 30,597 $ 38,984 Discontinued operations 58 (24) 64 314
$ 14,251 $ 38,070 $ 30,661 $ 39,298
Per share information:Basic earnings per share Continuing operations $ 0.22 $ 0.59 $ 0.47 $ 0.61 Discontinued operations – – – –
$ 0.22 $ 0.59 $ 0.47 $ 0.61
Diluted earnings per share Continuing operations $ 0.22 $ 0.58 $ 0.47 $ 0.61 Discontinued operations – – – –
$ 0.22 $ 0.58 $ 0.47 $ 0.61
Dividends per share $ 0.12 $ 0.12 $ 0.12 $ 0.12
Interim period revenues and earnings historically reflect some seasonality.The Equipment Group has a distinct seasonal trend in activity levels. Lower revenues are recorded during the first quarter due
to winter shutdowns in the construction industry. The fourth quarter has typically been the strongest quarter due in part to the timing of customers’ capital investment decisions, delivery of equipment from suppliers for customer-specific orders and conversions of equipment on rent with a purchase option.
The Compression Group also has a distinct seasonal trend in activity levels due to well-site access and drilling patterns, which are adjusted to take advantage of weather conditions. Generally, higher revenues are reported in the fourth quarter of each year. Variations from this trend usually occur when natural gas market fundamentals are either improving or deteriorating.
Management anticipates that the seasonality historically experienced will continue in the future, although it may be somewhat mitigated by continued product and geographic diversification.
As a result of the historical seasonal sales trends, inventories increase through the year in order to meet the expected demand for delivery in the fourth quarter of the fiscal year, while accounts receivable are highest at year end.
SELECTED ANNUAL INFORMATION
($ thousands, except per share amounts) 2008 2007 2006
Revenues $ 2,121,209 $ 1,886,761 $ 1,746,162Net earnings – continuing operations $ 140,853 $ 121,868 $ 98,761Net earnings $ 140,524 $ 122,280 $ 99,421
Earnings per share – continuing operations Basic $ 2.17 $ 1.88 $ 1.56 Diluted $ 2.16 $ 1.87 $ 1.54
Earnings per share Basic $ 2.16 $ 1.89 $ 1.56 Diluted $ 2.15 $ 1.88 $ 1.54
Dividends declared per share $ 0.56 $ 0.48 $ 0.40
Total assets $ 1,533,450 $ 1,356,861 $ 1,299,992Total long-term debt $ 173,475 $ 230,299 $ 263,662
TOROMONT 2008 ANNUAL REPORT | 45
Revenue growth in continuing operations has been strong with year-over-year increases of 10%, 8% and 12% in 2006, 2007 and 2008 respectively. Strong organic growth was achieved in the Compression Group on increases in package sales and product support activities. Revenue growth within the Equipment Group was strong in 2006 and 2007 on strong demand for new machines and engines. Revenues were flat in 2008 compared to the prior year on lower new machine sales resulting from general market uncertainty. Rental and product support growth with Equipment has been strong over the three-year period above. Organic revenue growth has also been complemented by acquisitions.
Growth in net earnings on a continuing operations basis, has also been strong, with year-over-year increases of 27%, 23% and 16% in 2006, 2007 and 2008 respectively. Improvements in all years have been the result of higher sales volumes, lower interest expense and gains on sales of assets in 2007 and 2008.
Earnings per share have grown in line with earnings growth, dampened somewhat by an increase in number of shares outstanding due to the exercise of stock options.
Dividends have generally increased in proportion to earnings growth.Total assets have increased over the three-year period on higher inventories held in light of strong customer demand and short
supply of product. Accounts receivable have also increased due to higher reported revenues. The Company has also invested in rental assets and other property, plant and equipment in targeted markets.
Long-term debt decreased in 2008 and represented 22% of total shareholders’ equity at year end. In 2007, long-term debt represented 35% of shareholders’ equity. The ratio of total debt, net of cash, to shareholders’ equity has improved to 5% at December 31, 2008 compared to 19% at the end of 2007.
RISKS AND RISK MANAGEMENTIn the normal course of business, Toromont is exposed to risks that may potentially impact its financial results in either or both of its business segments. The Company and each operating segment employ risk management strategies with a view to mitigating these risks on a cost-effective basis.
Business CycleExpenditures on capital goods have historically been cyclical, reflecting a variety of factors including interest rates, foreign exchange rates, consumer and business confidence, commodity prices, corporate profits, credit conditions and the availability of capital to finance purchases. Toromont’s customers are typically affected, to varying degrees, by these factors and trends in the general business cycle within their respective markets. As a result, Toromont’s financial performance is affected by the impact of such business cycles on the Company’s customer base.
Commodity prices, and, in particular, changes in the view on long-term trends, affect demand for the Company’s products and services in both operating segments. Commodity price movements in the natural gas and base metals sectors in particular can have an impact on customers’ demands for equipment and customer service. With lower commodity prices, demand is reduced as development of new projects is often stopped and existing projects can be curtailed, both leading to less demand for heavy equipment and compression packages.
Toromont’s business is diversified across a wide range of industry market segments and geographic territories, serving to temper the effects of business cycles on consolidated results. Continued diversification strategies such as expanding the Company’s customer base, broadening product offerings and geographic diversification are designed to moderate business cycle impacts. Across both operating segments, the Company has focused on the sale of specialized equipment and ongoing support through parts distribution and skilled service. Product support growth has been, and will continue to be, fundamental to mitigation of downturns in the business cycle. The product support business contributes significantly higher profit margins and is typically subject to less volatility than equipment supply activities.
Product and SupplyThe Equipment Group purchases most of its equipment inventories and parts from Caterpillar under a dealership agreement that dates back to 1993. As is customary in distribution arrangements of this type, the agreement with Caterpillar can be terminated by either party upon 90 days notice. In the event Caterpillar terminates, it must repurchase substantially all inventories of new equipment and parts at cost. Toromont has maintained an excellent relationship with Caterpillar for 15 years and management expects this will continue going forward.
Toromont is dependent on the continued market acceptance of Caterpillar’s products. It is believed that Caterpillar has a solid reputation as a high-quality manufacturer, with excellent brand recognition and customer support and leading market shares in many of the markets it serves. However, there can be no assurance that Caterpillar will be able to maintain its reputation and market position in the future. Any resulting decrease in the demand for Caterpillar products could have a material adverse impact on the Company’s business, results of operations and future prospects.
46 | TOROMONT 2008 ANNUAL REPORT
Toromont is also dependent on Caterpillar for timely supply of equipment and parts. From time to time during periods of intense demand, Caterpillar may find it necessary to allocate its supply of particular products among its dealers. Such allocations of supply have not, in the past, proven to be a significant impediment in the conduct of business. However, there can be no assurance that Caterpillar will continue to supply its products in the quantities and timeframes required by customers.
CompetitionThe Company competes with a large number of international, national, regional and local suppliers in each of its markets. Although price competition can be strong, there are a number of factors that have enhanced the Company’s ability to compete throughout its market areas including: the range and quality of products and services; ability to meet sophisticated customer requirements; distribution capabilities including number and proximity of locations; in certain cases, financial services offered by Caterpillar Finance; e-commerce solutions; reputation and financial strength. Increased competitive pressures or the inability of the Company to maintain the factors that have enhanced its competitive position to date could adversely affect the Company’s business, results of operations and financial condition.
Credit RiskFinancial instruments that potentially subject the Company to concentrations of credit risk consist of cash equivalents, accounts receivable and derivative financial instruments. The carrying amount of assets included on the balance sheet represents the maximum credit exposure.
Cash equivalents consist mainly of short-term investments, such as money market deposits. No asset-backed commercial paper products were held. The Company manages its credit exposure by ensuring there is no significant concentration of credit risk with a single counterparty, and by dealing only with highly rated financial institutions as counterparties.
The Company has accounts receivable from a large diversified customer base, and is not dependent on any single customer, industry or geographic area. The Company has accounts receivable from customers engaged in various industries including mining, construction, natural gas production, food and beverage, and governmental agencies. These customers are based across North America with a small percentage of accounts receivable held with international clients. Management does not believe that any single industry or geographic region represents significant credit risk.
The credit risk associated with derivative financial instruments arises from the possibility that the counterparties may default on their obligations. In order to minimize this risk, the Company enters into derivative transactions only with highly rated financial institutions.
Warranties and Maintenance ContractsToromont provides warranties for most of the equipment it sells, typically for a one-year period following sale. The warranty claim risk is generally shared jointly with the equipment manufacturer. Accordingly, liability is generally limited to the service component of the warranty claim, while the manufacturer is responsible for providing the required parts.
The Company also enters into long-term maintenance and repair contracts, whereby it is obligated to maintain equipment for its customers. The length of these contracts varies generally from two to five years. The contracts are typically fixed price with provisions for inflationary adjustments. Due to the long-term nature of these contracts, there is a risk that maintenance costs may exceed the estimate, thereby resulting in a loss on the contract. These contracts are closely monitored for early warning signs of cost overruns. In addition, the manufacturer may, in certain circumstances, share in the cost overruns if profitability falls below a certain threshold.
Foreign ExchangeThe Company transacts business in multiple currencies, the most significant of which are the Canadian dollar, the U.S. dollar and the Euro. As a result, the Company has foreign currency exposure with respect to items denominated in foreign currencies. The types of foreign exchange risk can be categorized as follows:
Transaction ExposureThe Company sources the majority of its products and major components from the United States. Consequently, reported costs of inventory and the transaction prices charged to customers for equipment and parts are affected by the relative strength of the Canadian dollar. The Company mitigates exchange rate risk by entering into foreign currency contracts to fix the cost of imported inventory where appropriate. In addition, pricing to customers is customarily adjusted to reflect changes in the Canadian dollar landed cost of imported goods.
The Company also sells compression packages in foreign currencies, primarily the U.S. dollar and Euro, and enters into foreign currency contracts to reduce these exchange rate risks.
TOROMONT 2008 ANNUAL REPORT | 47
Foreign exchange contracts reduce volatility by fixing landed costs related to specific customer orders and establishing a level of price stability for high-volume goods such as spare parts. The Company does not enter into foreign exchange forward contracts for speculative purposes. The gains and losses on the foreign exchange forward contracts designated as cash flow hedges are intended to offset the translation losses and gains on the hedged foreign currency transactions when they occur.
As a result, the foreign exchange impact on earnings with respect to transactional activity is not significant.
Translation ExposureAll of the Company’s foreign operations are considered self-sustaining. Accordingly, assets and liabilities are translated into Canadian dollars using the exchange rates in effect at the balance sheet dates. Unrealized translation gains and losses are deferred and included in accumulated other comprehensive income. The cumulative currency translation adjustments are recognized in income when there has been a reduction in the net investment in the foreign operations.
Foreign currency-based earnings are translated into Canadian dollars each period. As a result, fluctuations in the value of the Canadian dollar relative to these other currencies will impact reported net income. Such exchange rate fluctuations have historically not been material year-over-year relative to the overall earnings or financial position of the Company. The impact in 2008 was to reduce revenues by $3.6 million and net income by approximately $0.3 million.
Interest RateThe Company minimizes its interest rate risk by managing its portfolio of floating and fixed rate debt, as well as managing the term to maturity.
The Company is exposed to changes in interest rates, which may impact on the Company’s floating rate borrowing costs. At December 31, 2008, the Company’s debt portfolio is comprised of 96% fixed rate and 4% floating rate debt.
Fixed rate debt exposes the Company to future interest rate movements upon refinancing the debt at maturity. The Company’s fixed rate debt matures between 2011 and 2019, with 72% maturing in 2015.
Further, the fair value of the Company’s fixed rate debt obligations may be negatively affected by declines in interest rates, thereby exposing the Company to potential losses on early settlements or refinancing. The Company does not intend to settle or refinance any existing debt before maturity.
Financing ArrangementsThe Company requires capital to finance its growth and to refinance its outstanding debt obligations as they come due for repayment. If the cash generated from the Company’s business, together with the credit available under existing bank facilities, is not sufficient to fund future capital requirements, the Company will require additional debt or equity financing in the capital markets. The Company’s ability to access capital markets on terms that are acceptable will be dependent upon prevailing market conditions, as well as the Company’s future financial condition. Further, the Company’s ability to increase its debt financing may be limited by its financial covenants or its credit rating objectives. The Company maintains a conservative leverage structure and although it does not anticipate difficulties, there can be no assurance that capital will be available on suitable terms and conditions, or that borrowing costs and credit ratings will not be adversely affected.
CRITICAL ACCOUNTING POLICIES AND ESTIMATESThe Company’s significant accounting policies are described in Note 1 to the unaudited consolidated financial statements. The preparation of financial statements in conformity with Canadian GAAP requires estimates and assumptions that affect the results of operations and financial position. By their nature, these judgments are subject to an inherent degree of uncertainty and are based upon historical experience, trends in the industry and information available from outside sources. Management reviews its estimates on an ongoing basis. Different accounting policies, or changes to estimates or assumptions could potentially have a material impact, positive or negative, on Toromont’s financial position and results of operations. The critical accounting policies and estimates described below affect both the Equipment Group and Compression Group similarly and therefore are not discussed on a segmented basis.
Revenue RecognitionThe Company reflects revenues generated from the assembly and manufacture of projects using the percentage-of-completion approach of accounting for performance of production-type contracts. This approach to revenue recognition requires management to make a number of estimates and assumptions surrounding the expected profitability of the contract, the estimated degree of completion based on cost progression and other detailed factors. Although these factors are routinely reviewed as part of the project management process, changes in these estimates or assumptions could lead to changes in the revenues recognized in a given period. However, there are many of these projects in process at any given point, the majority of which are in actual construction for a period of three months or less.
48 | TOROMONT 2008 ANNUAL REPORT
Property, Plant and EquipmentFixed assets are stated at cost less accumulated depreciation, including asset impairment losses. Depreciation is calculated using the straight-line method over the estimated useful lives of the assets.
The estimated useful lives of fixed assets are reviewed on a regular basis. Assessing the reasonableness of the estimated useful lives of fixed assets requires judgment and is based on currently available information.
Fixed assets are also reviewed for potential impairment on a regular basis or whenever events or changes in circumstances indicate that the carrying amount may not be recoverable. In cases where the undiscounted expected future cash flows are less than the carrying amount, an impairment loss is recognized. Impairment losses on long-lived assets are measured as the amount by which the carrying value of an asset or asset group exceeds its fair value, as determined by the discounted future cash flows of the asset or asset group. In estimating future cash flows, the Company uses its best estimates based on internal plans that incorporate management’s judgments as to the remaining service potential of the fixed assets.
Changes in circumstances, such as technological advances and changes to business strategy can result in actual useful lives and future cash flows differing significantly from estimates. The assumptions used, including rates and methodologies, are reviewed on an ongoing basis to ensure they continue to be appropriate. Revisions to the estimated useful lives of fixed assets or future cash flows constitute a change in accounting estimate and are applied prospectively.
Income TaxesThe liability method of accounting for income taxes is used. Future income tax assets and liabilities, measured at substantively enacted tax rates, are recognized for all temporary differences caused when the tax bases of assets and liabilities differ from those reported in the audited consolidated financial statements.
Income tax rules and regulations in the countries in which the Company operates and income tax treaties between these countries are subject to interpretation and require estimates and assumptions in determining the Company’s consolidated income tax provision that may be challenged by the taxation authorities.
Changes or differences in these estimates or assumptions may result in changes to the current or future income tax balances on the consolidated balance sheet, a charge or credit to income tax expense in the consolidated statement of earnings and may result in cash payments or receipts. Additional information on income taxes is provided in Note 17 of the accompanying unaudited consolidated financial statements.
CHANGES IN ACCOUNTING POLICIESInventoriesEffective January 1, 2008, the Company adopted the Canadian Institute of Chartered Accountants (CICA) Handbook Section 3031 Inventories. The standard provides guidance on the types of costs that can be capitalized and requires reversal of previous inventory write-downs if economic circumstances have changed to support the higher inventory values. There was no impact on the valuation of inventory as at January 1, 2008, or on net income for current or prior periods. The reader is referred to Note 5.
Capital DisclosuresEffective January 1, 2008, the Company adopted the CICA Handbook Section 1535 Capital Disclosures. The standard requires disclosure about the Company’s capital and how it is managed, as presented in Note 20. This standard has no impact on the classification or measurement of the Company’s consolidated financial statements.
Financial Instruments Disclosures and PresentationEffective January 1, 2008, the Company adopted CICA Handbook Sections 3862 Financial Instruments – Disclosures; and 3863 Financial Instruments – Presentation. These new standards require disclosure on financial instruments and related risks, as presented in Note 14. These standards had no impact on the classification or measurement of the Company’s consolidated financial statements.
FUTURE ACCOUNTING STANDARDSIn February 2008, the CICA approved Handbook Section 3064 Goodwill and Intangible Assets, replacing previous guidance. The new section establishes standards for the recognition, measurement, presentation and disclosure of goodwill and intangible assets subsequent to initial recognition. Standards concerning goodwill are unchanged. This new standard is applicable to fiscal years beginning on or after October 1, 2008. The Company has evaluated the new section and determined that adoption of these new requirements will have no impact on the Company’s consolidated financial statements.

TOROMONT 2008 ANNUAL REPORT | 49
In January 2009, the CICA approved EIC 173 Credit Risk and the Fair Value of Financial Assets and Financial Liabilities. This guidance clarified that an entity’s own credit risk and the credit risk of the counterparty should be taken into account in determining the fair value of financial assets and financial liabilities including derivative instruments. This guidance is applicable to fiscal periods ending on or after January 12, 2009. The Company will adopt this guidance for the fiscal period beginning on January 1, 2009. The Company is in process of evaluating the impact of this new guidance.
INTERNATIONAL FINANCIAL REPORTING STANDARDSIn February 2008, the AcSB confirmed that Canadian GAAP for publicly accountable enterprises would be converged with IFRS effective in calendar year 2011. IFRS uses a conceptual framework similar to Canadian GAAP, but there are significant differences on recognition, measurement and disclosures. In the period leading up to the changeover, the AcSB will continue to issue accounting standards that are converged with IFRS such as IAS 2 “Inventories” and IAS 38 “Intangible assets”, thus mitigating the impact of adopting IFRS at the changeover date.
The Company commenced its IFRS conversion project in 2008. The project consists of four phases: diagnostic, design and planning, solution development and implementation. The Company will invest in training and resources throughout the transition period to facilitate a timely conversion.
The diagnostic phase was completed during 2008 with the assistance of external advisors. This work involved a high-level review of the major differences between current Canadian GAAP and IFRS. While a number of differences have been identified, the areas of highest potential impact are as follows: property, plant and equipment; provisions; certain aspects of revenue recognition; and IFRS 1 First Time Adoption. The Company expects the transition to IFRS to impact financial reporting, business processes, internal controls and information systems.
During the coming year, the Company will initiate the design and planning phase. This will involve establishing issue-specific work teams to focus on quantification of impact, generating options and making recommendations in the identified risk areas. During the design and planning phase, the Company will establish a staff communications plan, begin to develop staff training programs, and evaluate the impacts of the IFRS transition on other business activities.
RESPONSIBILITY OF MANAGEMENT AND THE BOARD OF DIRECTORSManagement is responsible for the information disclosed in this MD&A and the accompanying consolidated financial statements, and has in place appropriate information systems, procedures and controls to ensure that information used internally by management and disclosed externally is materially complete and reliable. In addition, the Company’s Audit Committee, on behalf of the Board of Directors, provides an oversight role with respect to all public financial disclosures made by the Company, and has reviewed and approved this MD&A and the accompanying consolidated financial statements. The Audit Committee is also responsible for determining that management fulfills its responsibilities in the financial control of operations, including disclosure controls and procedures and internal control over financial reporting.
DISCLOSURE CONTROLS AND PROCEDURES AND INTERNAL CONTROL OVER FINANCIAL REPORTINGThe Chairman & Chief Executive Officer and the Chief Financial Officer, together with other members of management, have evaluated the effectiveness of the Company’s disclosure controls and procedures and internal controls over financial reporting as at December 31, 2008, using the internal control integrated framework issued by the Committee of Sponsoring Organizations of the Treadway Commission. Based on that evaluation, they have concluded that the design and operation of the Company’s disclosure controls and procedures were adequate and effective as at December 31, 2008, to provide reasonable assurance that a) material information relating to the Company and its consolidated subsidiaries would have been known to them and by others within those entities, and b) information required to be disclosed is recorded, processed, summarized and reported within required time periods. They have also concluded that the design and operation of internal controls over financial reporting were adequate and effective as at December 31, 2008, to provide reasonable assurance regarding the reliability of financial reporting and the preparation of financial reporting in accordance with GAAP.
There have been no changes in the design of the Company’s internal controls over financial reporting during the fourth quarter of 2008 that would materially affect, or is reasonably likely to materially affect, the Company’s internal controls over financial reporting.
While the Officers of the Company have evaluated the effectiveness of disclosure controls and procedures and internal control over financial reporting as at December 31, 2008 and have concluded that these controls and procedures are being maintained as designed, they expect that the disclosure controls and procedures and internal controls over financial reporting may not prevent all errors and fraud. A control system, no matter how well conceived or operated, can only provide reasonable, not absolute, assurance that the objectives of the control system are met.
50 | TOROMONT 2008 ANNUAL REPORT
NON-GAAP FINANCIAL MEASURESThe success of the Company and business unit strategies is measured using a number of key performance indicators, which are outlined below. These measures are also used by management in its assessment of relative investments in operations. These key performance indicators are not measurements in accordance with Canadian GAAP. It is possible that these measures will not be comparable to similar measures prescribed by other companies. They should not be considered as an alternative to net income or any other measure of performance under Canadian GAAP.
Operating Income and Operating MarginEach business segment assumes responsibility for its operating results as measured by, amongst other factors, operating income, which is defined as income before income taxes, interest income and interest expense. Financing and related interest charges cannot be attributed to business segments on a meaningful basis that is comparable to other companies. Business segments and income tax jurisdictions are not synonymous, and it is believed that the allocation of income taxes distorts the historical comparability of the performance of the business segments. Consolidated and segmented operating income is reconciled to net earnings in tables where used in this MD&A.
Operating income margin is calculated by dividing operating income by total revenue.
Return on Equity (ROE) and Return on Capital Employed (ROCE)Return on equity is monitored to assess the profitability of the consolidated Company. ROE is calculated by dividing net earnings by opening shareholders’ equity.
ROCE is a key performance indicator that is utilized to assess both current operating performance and prospective investments. The numerator used for the calculation is income before income taxes, interest expense and interest income (excluding interest on rental conversions). The denominator in the calculation is the monthly average capital employed, which is defined as net debt plus shareholders’ equity.
Working Capital and Non-Cash Working CapitalWorking capital is defined as current assets less current liabilities. Non-cash working capital is defined as working capital less cash and equivalents.
TOROMONT 2008 ANNUAL REPORT | 51
Management’s Report The preparation and presentation of the Company’s consolidated financial statements is the responsibility of management. The financial statements have been prepared in accordance with Canadian generally accepted accounting principles and necessarily include estimates, which are based on management’s best judgments. Information contained elsewhere in the Annual Report is consistent, where applicable, with that contained in the financial statements.
Management maintains appropriate systems of internal control. Policies and procedures are designed to give reasonable assurance that transactions are appropriately authorized, assets are safeguarded from loss or unauthorized use and financial records are properly maintained to provide reliable information for preparation of financial statements.
Ernst & Young LLP, an independent firm of Chartered Accountants, were appointed by the shareholders as external auditors to examine the consolidated financial statements in accordance with generally accepted auditing standards in Canada and provide an independent professional opinion. Their report is presented with the consolidated financial statements.
The Board of Directors, acting through an Audit Committee comprised solely of independent directors, is responsible for determining that management fulfills its responsibilities in the preparation of the consolidated financial statements and the financial control of operations. The Audit Committee recommends the independent auditors for appointment by the shareholders. It meets regularly with financial management and the internal and external auditors to discuss internal controls, auditing matters and financial reporting issues. The independent auditors have unrestricted access to the Audit Committee. The consolidated financial statements and Management’s Discussion and Analysis have been approved by the Board of Directors for inclusion in this Annual Report, based on the review and recommendation of the Audit Committee. Robert M. Ogilvie Paul R. Jewer Toronto, Ontario, Canada Chairman and Vice President Finance and February 2, 2009 Chief Executive Officer Chief Financial Officer
Auditors’ Report To the Shareholders of Toromont Industries Ltd.: We have audited the consolidated balance sheets of Toromont Industries Ltd. as at December 31, 2008 and 2007 and the consolidated statements of earnings, retained earnings, comprehensive income and cash flows for the years then ended. These financial statements are the responsibility of the Company’s management. Our responsibility is to express an opinion on these financial statements based on our audits.
We conducted our audits in accordance with Canadian generally accepted auditing standards. Those standards require that we plan and perform an audit to obtain reasonable assurance whether the financial statements are free of material misstatement. An audit includes examining, on a test basis, evidence supporting the amounts and disclosures in the financial statements. An audit also includes assessing the accounting principles used and significant estimates made by management, as well as evaluating the overall financial statement presentation.
In our opinion, these consolidated financial statements present fairly, in all material respects, the financial position of the Company as at December 31, 2008 and 2007 and the results of its operations and its cash flows for the years then ended in accordance with Canadian generally accepted accounting principles. Ernst & Young LLP Toronto, Ontario, Canada Chartered Accountants February 2, 2009 Licensed Public Accountants
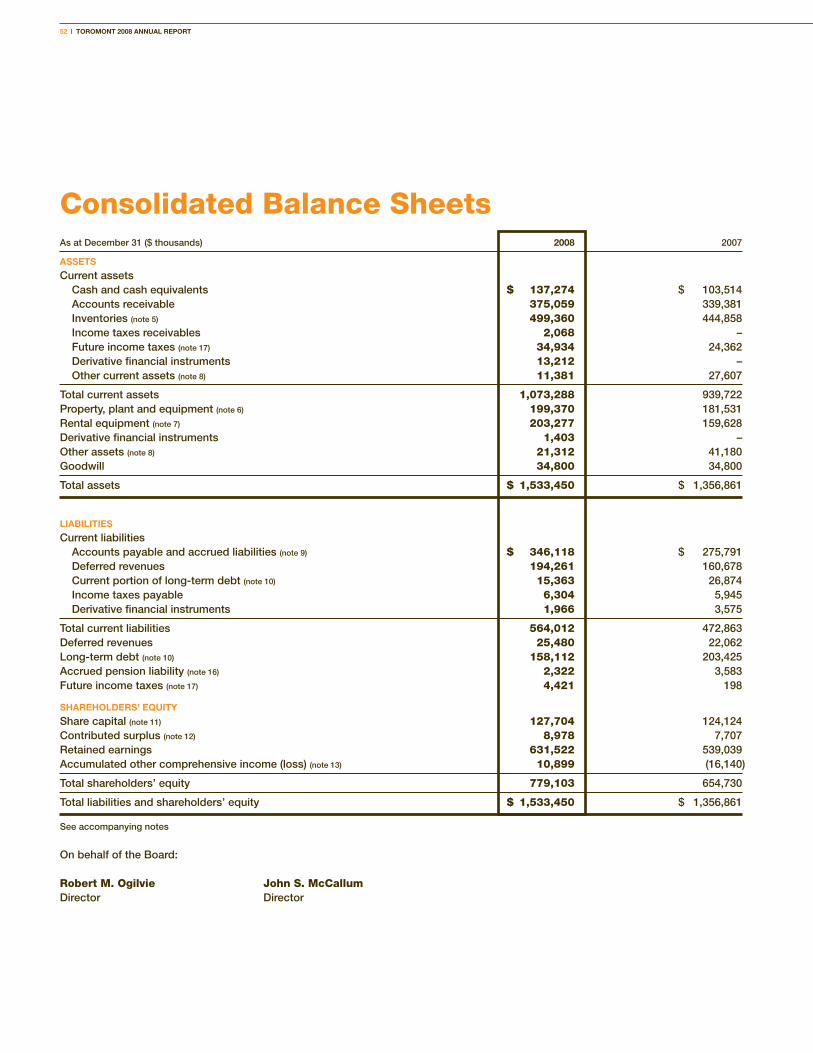
52 | TOROMONT 2008 ANNUAL REPORT
Consolidated Balance SheetsAs at December 31 ($ thousands) 2008 2007
AssETs
Current assets Cash and cash equivalents $ 137,274 $ 103,514 Accounts receivable 375,059 339,381 Inventories (note 5) 499,360 444,858 Income taxes receivables 2,068 – Future income taxes (note 17) 34,934 24,362 Derivative financial instruments 13,212 – Other current assets (note 8) 11,381 27,607
Total current assets 1,073,288 939,722Property, plant and equipment (note 6) 199,370 181,531Rental equipment (note 7) 203,277 159,628Derivative financial instruments 1,403 –Other assets (note 8) 21,312 41,180Goodwill 34,800 34,800
Total assets $ 1,533,450 $ 1,356,861
LiABiLiTiEs
Current liabilities Accounts payable and accrued liabilities (note 9) $ 346,118 $ 275,791 Deferred revenues 194,261 160,678 Current portion of long-term debt (note 10) 15,363 26,874 Income taxes payable 6,304 5,945 Derivative financial instruments 1,966 3,575
Total current liabilities 564,012 472,863Deferred revenues 25,480 22,062Long-term debt (note 10) 158,112 203,425Accrued pension liability (note 16) 2,322 3,583Future income taxes (note 17) 4,421 198
shAREhOLdERs’ EQUiTy
Share capital (note 11) 127,704 124,124Contributed surplus (note 12) 8,978 7,707Retained earnings 631,522 539,039Accumulated other comprehensive income (loss) (note 13) 10,899 (16,140)
Total shareholders’ equity 779,103 654,730
Total liabilities and shareholders’ equity $ 1,533,450 $ 1,356,861
See accompanying notes
On behalf of the Board:
Robert M. Ogilvie John S. McCallumDirector Director
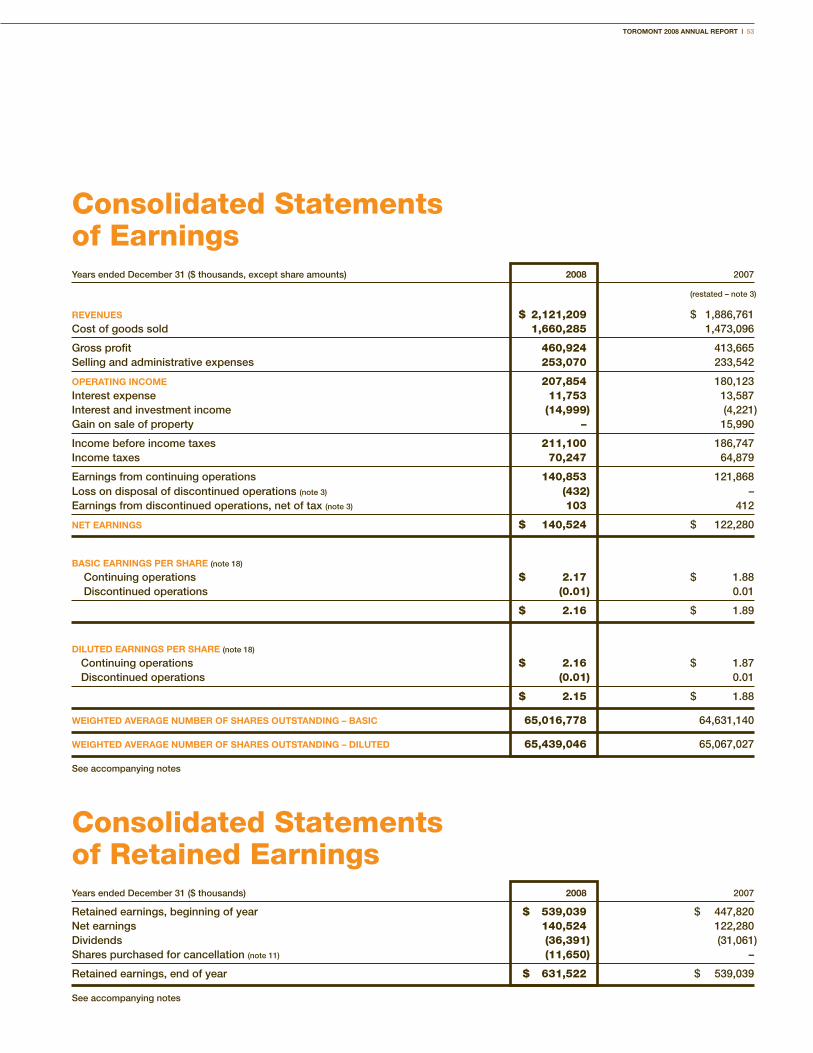
TOROMONT 2008 ANNUAL REPORT | 53
Consolidated Statements of EarningsYears ended December 31 ($ thousands, except share amounts) 2008 2007
(restated – note 3)
REvENUEs $ 2,121,209 $ 1,886,761Cost of goods sold 1,660,285 1,473,096
Gross profit 460,924 413,665Selling and administrative expenses 253,070 233,542
OPERATiNg iNcOME 207,854 180,123Interest expense 11,753 13,587Interest and investment income (14,999) (4,221)Gain on sale of property – 15,990
Income before income taxes 211,100 186,747Income taxes 70,247 64,879
Earnings from continuing operations 140,853 121,868Loss on disposal of discontinued operations (note 3) (432) –Earnings from discontinued operations, net of tax (note 3) 103 412
NET EARNiNgs $ 140,524 $ 122,280
BAsic EARNiNgs PER shARE (note 18)
Continuing operations $ 2.17 $ 1.88 Discontinued operations (0.01) 0.01
$ 2.16 $ 1.89
diLUTEd EARNiNgs PER shARE (note 18)
Continuing operations $ 2.16 $ 1.87 Discontinued operations (0.01) 0.01
$ 2.15 $ 1.88
WEighTEd AvERAgE NUMBER Of shAREs OUTsTANdiNg – BAsic 65,016,778 64,631,140
WEighTEd AvERAgE NUMBER Of shAREs OUTsTANdiNg – diLUTEd 65,439,046 65,067,027
See accompanying notes
Consolidated Statements of Retained EarningsYears ended December 31 ($ thousands) 2008 2007
Retained earnings, beginning of year $ 539,039 $ 447,820Net earnings 140,524 122,280Dividends (36,391) (31,061)Shares purchased for cancellation (note 11) (11,650) –
Retained earnings, end of year $ 631,522 $ 539,039
See accompanying notes
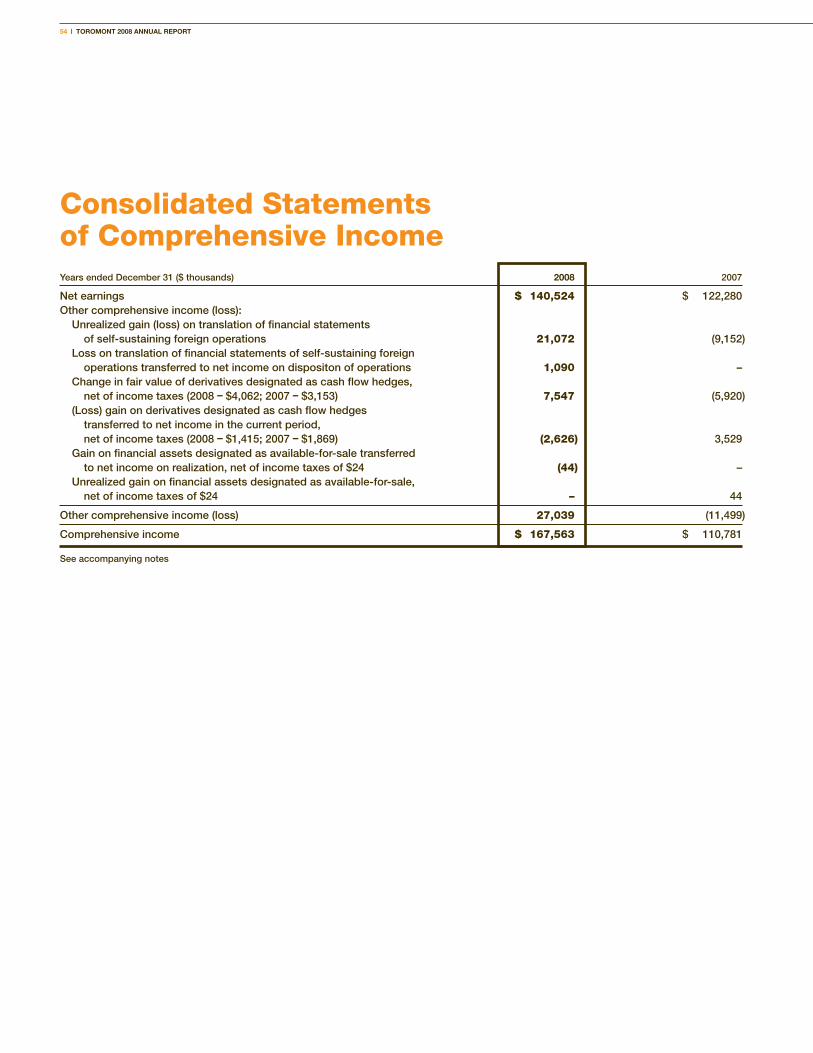
54 | TOROMONT 2008 ANNUAL REPORT
Consolidated Statements of Comprehensive IncomeYears ended December 31 ($ thousands) 2008 2007
Net earnings $ 140,524 $ 122,280Other comprehensive income (loss): Unrealized gain (loss) on translation of financial statements
of self-sustaining foreign operations 21,072 (9,152) Loss on translation of financial statements of self-sustaining foreign
operations transferred to net income on dispositon of operations 1,090 – Change in fair value of derivatives designated as cash flow hedges,
net of income taxes (2008 – $4,062; 2007 – $3,153) 7,547 (5,920) (Loss) gain on derivatives designated as cash flow hedges
transferred to net income in the current period, net of income taxes (2008 – $1,415; 2007 – $1,869) (2,626) 3,529
Gain on financial assets designated as available-for-sale transferred to net income on realization, net of income taxes of $24 (44) –
Unrealized gain on financial assets designated as available-for-sale, net of income taxes of $24 – 44
Other comprehensive income (loss) 27,039 (11,499)
Comprehensive income $ 167,563 $ 110,781
See accompanying notes

TOROMONT 2008 ANNUAL REPORT | 55
Consolidated Statements of Cash FlowsYears ended December 31 ($ thousands) 2008 2007
OPERATiNg AcTiviTiEs
Net earnings $ 140,524 $ 122,280Items not requiring cash and cash equivalents Depreciation 56,070 52,702 Stock-based compensation 2,494 2,073 Accrued pension liability (1,261) (1,900) Future income taxes (8,972) 365 Gain on sale of: Rental equipment, property, plant, and equipment (6,191) (23,329) Investments (8,234) – Loss on disposal of discontinued operations 432 –
174,862 152,191Net change in non-cash working capital and other (note 21) (10,150) 24,620
Cash provided by operating activities 164,712 176,811
iNvEsTiNg AcTiviTiEs
Additions to: Rental equipment (57,901) (70,697) Property, plant and equipment (38,574) (26,411) Investments (13,811) (21,972)Proceeds on disposal of: Rental equipment 30,456 27,985 Property, plant and equipment 1,319 18,540 Investments 43,948 –Disposal of discontinued operations (note 3) 4,038 –(Increase) decrease in other assets (786) 1,064Business acquisitions (note 4) (629) (3,124)
Cash used in investing activities (31,940) (74,615)
fiNANciNg AcTiviTiEs
Decrease in term credit facility debt (30,000) (13,686)Issue of other long-term debt – 5,836Repayment of other long-term debt (26,824) (25,513)Dividends (35,138) (29,700)Shares purchased for cancellation (12,808)Cash received on exercise of options 3,515 6,367
Cash used in financing activities (101,255) (56,696)
Effect of exchange rate changes on cash denominated in foreign currency 2,243 –Increase in cash and cash equivalents 33,760 45,500Cash and cash equivalents at beginning of year 103,514 58,014
Cash and cash equivalents at end of year $ 137,274 $ 103,514
sUPPLEMENTAL cAsh fLOW iNfORMATiON (note 21)
See accompanying notes
56 | TOROMONT 2008 ANNUAL REPORT
Notes to the Consolidated Financial StatementsDecember 31, 2008($ thousands except where otherwise indicated)
1. DESCRIPTION OF BUSINESS AND SIGNIFICANT ACCOUNTING POLICIESToromont Industries Ltd. and its subsidiaries (the “Company”) operate through two business segments: The Equipment Group and the Compression Group. The Equipment Group includes one of the world’s largest Caterpillar dealerships by revenue and geographic territory in addition to industry leading rental operations. The Compression Group is a North American leader specializing in the design, engineering, fabrication, and installation of compression systems for natural gas, coal-bed methane, fuel gas and carbon dioxide in addition to process systems and industrial and recreational refrigeration systems. Both Groups offer comprehensive product support capabilities. Toromont employs over 4,500 people in 128 locations and is listed on the Toronto Stock Exchange under the symbol TIH.
These consolidated financial statements have been prepared by management in accordance with Canadian Generally Accepted Accounting Principles (“GAAP”).
Basis of ConsolidationThe consolidated financial statements include the accounts of the Company and its wholly owned subsidiaries. All significant inter-company accounts and transactions have been eliminated.
Use of EstimatesThe preparation of the consolidated financial statements in conformity with Canadian GAAP requires management to make estimates and assumptions that affect the reported amounts of assets and liabilities and disclosures of contingent assets and liabilities at the date of the financial statements and the reported amounts of revenues and expenses during the year. Actual results could differ from those estimates. Estimates are used in accounting for items and matters such as long-term contracts, allowance for uncollectible accounts receivable, allowance for inventory obsolescence, product warranty, estimated useful lives of assets for depreciation, asset and goodwill impairment assessments, employee benefits and income taxes.
Revenue RecognitionRevenue is recognized when persuasive evidence of an arrangement exists, the price is fixed or determinable, performance requirements are achieved and ultimate collection is reasonably assured. In addition to this general policy, the following describes the specific revenue recognition policies for each major category of revenue.(a) Revenues from the sale of equipment are recorded when goods are shipped to the customer, at which time title to the equipment and
significant risks of ownership have passed.(b) Revenues from the supply of equipment systems involving design, manufacture, installation and start-up are determined using the
percentage-of-completion method, based on total costs incurred as a proportion of expected total costs of the project. Revenues and costs begin to be recognized when progress reaches a stage of completion sufficient to reasonably determine the probable results. Any foreseeable losses on such projects are charged to operations when determined.
(c) Revenues from equipment rentals are recognized in accordance with the terms of the relevant agreement with the customer, generally on a straight-line basis over the term of the agreement.
(d) Product support services include sales of parts and servicing of equipment. For the sale of parts, revenues are recognized when the part is shipped to the customer. For servicing of equipment, revenues are recognized as the service work is completed and billed.
(e) Revenues on extended warranty and long-term maintenance contracts are recognized either on a percentage-of-completion basis proportionate to the service work that has been performed based on the parts and labour service provided, or on a straight-line basis over the life of the warranty. At the completion of the contract, any remaining profit on the contract is recognized as revenue. Any losses estimated during the term of the contract are recognized when identified.
(f) Revenues on equipment sold directly to customers or to third-party lessors for which the Company has provided a guarantee to repurchase the equipment at predetermined residual values and dates are accounted for as operating leases wherein revenue is recognized over the period extending to the date of the residual guarantee. The value of such equipment at December 31, 2008 was $21.0 million (2007 – $19.7 million) and was included in other long-term assets.
Translation of Foreign CurrenciesTransactions denominated in foreign currencies are translated into Canadian dollars at the rate of exchange in effect at the time of the transaction. Monetary assets and liabilities are translated into Canadian dollars at the year-end exchange rate. Non-monetary items are translated at historical rates. All exchange gains and losses are included in earnings.
Foreign subsidiaries are financially and operationally self-sustaining. Accordingly, their assets and liabilities are translated into Canadian funds at the year-end exchange rate. Revenue and expense items are translated at the average exchange rate for the year. The foreign exchange impact of these translations is included in accumulated other comprehensive income in shareholders’ equity.
TOROMONT 2008 ANNUAL REPORT | 57
Financial InstrumentsFinancial instruments are measured at fair value on initial recognition. After initial recognition, financial instruments are measured at their fair values, except for financial assets classified as held-to-maturity or loans and receivables and other financial liabilities, which are measured at cost or amortized cost using the interest rate method.
The Company has made the following classifications:n Cash and cash equivalents are classified as assets held for trading and are measured at fair value. Gains and losses resulting from the
periodic revaluation are recorded in net income.n Accounts receivable are classified as loans and receivables and are recorded at amortized cost, which upon their initial measurement is
equal to their fair value. Subsequent measurements are recorded at amortized cost using the effective interest rate method.n Investments are classified as available for sale and are recorded at fair value based on quoted market prices. Gains and losses resulting
from the periodic revaluation are recorded in other comprehensive income.n Accounts payable and accrued liabilities and long-term debt are classified as other financial liabilities and are initially measured at their
fair value. Subsequent measurements are recorded at amortized cost using the effective interest rate method.
Transaction costs are expensed as incurred for financial instruments classified or designated as held for trading. Transaction costs for financial assets classified as available for sale are added to the value of the instrument at acquisition. Transaction costs related to other financial liabilities are added to the value of the instrument at acquisition and taken into net income using the effective interest rate method.
Derivative Financial Instruments and Hedge AccountingDerivative financial agreements are used to manage exposure to fluctuations in exchange rates and interest rates. The Company does not enter into derivative financial agreements for speculative purposes.
Derivative financial instruments are measured at their fair value upon initial recognition and on each subsequent reporting date. The fair value of quoted derivatives is equal to their positive or negative market value. If a market value is not available, the fair value is calculated using standard financial valuation models, such as discounted cash flow or option pricing models. Derivatives are carried as assets when the fair value is positive and as liabilities when the fair value is negative.
The Company elected to apply hedge accounting for foreign exchange forward contracts for firm commitments and anticipated transactions. These are also designated as cash flow hedges. For cash flow hedges, fair value changes of the effective portion of the hedging instrument are recognized in accumulated other comprehensive income, net of taxes. The ineffective portion of the fair value changes is recognized in net income. Amounts charged to accumulated other comprehensive income are reclassified to the income statement when the hedged transaction affects the income statement.
All hedging relationships are formally documented, including the risk management objective and strategy. On an ongoing basis, an assessment is made as to whether the designated derivative financial instruments continue to be effective in offsetting changes in cash flows of the hedged transactions.
Income TaxesThe liability method of accounting for income taxes is used. Future income tax assets and liabilities are recognized for the future income tax consequences attributable to differences between the financial statement carrying values of existing assets and liabilities and their respective income tax bases. Future income tax assets and liabilities are measured using enacted or substantively enacted income tax rates expected to apply to taxable income in the years in which those temporary differences are expected to be recovered or settled. The effect on future income tax assets and liabilities of a change in income tax rates is recognized in net earnings in the period that includes the date of substantive enactment.
Stock-Based CompensationThe fair value method of accounting for stock options is used. The fair value of option grants are calculated using the Black-Scholes option pricing model and is recognized as compensation expense over the vesting period of those grants with a corresponding adjustment to contributed surplus. On the exercise of stock options, the consideration paid by the employee and the related amounts in contributed surplus are credited to common share capital.
Employee Future BenefitsFor defined contribution plans, which cover the majority of employees, the pension expense recorded in earnings is the amount of the contributions the Company is required to pay in accordance with the terms of the plan.
For defined benefit plans, which cover approximately 5% of employees, the Company accrues its obligations and the related costs, net of plan assets. The Company has adopted the following policies for its defined benefit plans:n The cost of pensions earned by employees is actuarially determined using the projected unit credit method pro-rated on length of
service and management’s best estimate assumptions to value its pensions using a measurement date of December 31;n For the purpose of calculating the expected return on plan assets, those assets are valued at fair value;

58 | TOROMONT 2008 ANNUAL REPORT
n Past service costs from plan amendments are amortized on a straight-line basis over the average remaining service period of employees active at the date of amendments;
n The excess of the net actuarial gain (loss) over 10% of the greater of the benefit obligation and the fair value of plan assets is amortized on a straight-line basis over the average remaining service period of the active employees or on the average remaining life in the case of retirees.
Earnings per Share (“EPS”)Basic EPS is calculated by dividing the net earnings available to common shareholders by the weighted average number of common shares outstanding during the year. Diluted EPS is calculated using the treasury stock method, which assumes that all outstanding stock option grants are exercised, if dilutive, and the assumed proceeds are used to purchase the Company’s common shares at the average market price during the year.
Cash and Cash EquivalentsCash and cash equivalents, including cash on account, demand deposits and short-term investments with original maturities of three months or less, are recorded at cost, which approximates market value.
InventoriesInventories are valued at the lower of cost and net realizable value.
Cost of equipment, repair and distribution parts and direct materials include purchase cost and costs incurred in bringing each product to its present location and condition. Serialized inventory is determined on a specific item basis. Non-serialized inventory is determined based on a weighted average actual cost.
Cost of work-in-process includes cost of direct materials, labour and an allocation of manufacturing overheads, excluding borrowing costs, based on normal operating capacity.
Cost of inventories include the transfer from accumulated other comprehensive income (loss) of gains and losses on qualifying cash flow hedges in respect of the purchase of inventory.
Net realizable value is the estimated selling price in the ordinary course of business, less estimated costs of completion and the estimated costs necessary to make the sale.
Rental EquipmentRental equipment is recorded at cost. Rental equipment is depreciated over its estimated useful life on a straight-line basis. Estimated useful lives range from 1 to 15 years.
Property, Plant and EquipmentProperty, plant and equipment are recorded at cost. Depreciation is recognized principally on a straight-line basis to depreciate the cost of these assets over their estimated useful lives. Estimated useful lives range from 20 to 30 years for buildings, 3 to 10 years for equipment and 20 years for power generation assets.
Leasehold improvements and lease inducements are amortized on a straight-line basis over the term of the lease.
Impairment of Long-lived AssetsLong-lived assets are reviewed for impairment whenever events or changes in circumstances indicate that the carrying amount may not be recoverable. In cases where the undiscounted expected future cash flows are less than the carrying amount, an impairment loss is recognized. Impairment losses on long-lived assets are measured as the amount by which the carrying value of an asset group exceeds its fair value, as determined by the discounted future cash flows of the asset group.
GoodwillGoodwill represents the cost of acquired businesses in excess of the fair value of net identifiable assets acquired. Goodwill is tested for impairment annually, or more frequently if events or changes in circumstances indicate a potential impairment. In the fourth quarter of 2007 and 2008, annual goodwill assessments were performed and determined that there was no impairment in either year.
Discontinued OperationsThe results of discontinued operations are presented net of tax on a one-line basis in the consolidated statements of earnings. Direct corporate overheads and income taxes are allocated to discontinued operations. Interest expense (income) and general corporate overheads are not allocated to discontinued operations.
Comparative AmountsCertain comparative figures have been restated to conform with the current year’s presentation.

TOROMONT 2008 ANNUAL REPORT | 59
2. CHANGES IN ACCOUNTING POLICIES InventoriesEffective January 1, 2008, the Company adopted the Canadian Institute of Chartered Accountants (CICA) Handbook Section 3031 Inventories. The standard provides guidance on the types of costs that can be capitalized and requires reversal of previous inventory write-downs if economic circumstances have changed to support the higher inventory values. There was no impact on the valuation of inventory as at January 1, 2008, or on net income for current or prior periods.
Capital DisclosuresEffective January 1, 2008, the Company adopted the CICA Handbook Section 1535 Capital Disclosures. The standard requires disclosure about the Company’s capital and how it is managed. This standard has no impact on the classification or measurement of the Company’s consolidated financial statements.
Financial Instruments Disclosures and PresentationEffective January 1, 2008, the Company adopted CICA Handbook Sections 3862 Financial Instruments – Disclosures; and 3863 Financial Instruments – Presentation. These new standards require disclosure on financial instruments and related risks. These standards had no impact on the classification or measurement of the Company’s consolidated financial statements.
Future Accounting StandardsIn February 2008, the CICA approved Handbook Section 3064 Goodwill and Intangible Assets, replacing previous guidance. The new section establishes standards for the recognition, measurement, presentation and disclosure of goodwill and intangible assets subsequent to initial recognition. Standards concerning goodwill are unchanged. This new standard is applicable to fiscal years beginning on or after October 1, 2008. The Company has evaluated the new section and determined that adoption of these new requirements will have no impact on the Company’s consolidated financial statements.
In January 2009, the CICA approved EIC 173 Credit Risk and the Fair Value of Financial Assets and Financial Liabilities. This guidance clarified that an entity’s own credit risk and the credit risk of the counterparty should be taken into account in determining the fair value of financial assets and financial liabilities including derivative instruments. This guidance is applicable to fiscal periods ending on or after January 12, 2009. The Company will adopt this guidance for the fiscal period beginning on January 1, 2009. The Company is in the process of evaluating the impact of this new guidance.
3. DISCONTINUED OPERATIONSEffective June 30, 2008, the shares of Aero Tech Manufacturing Inc. were sold to its local management. Aero Tech is a U.S. based provider of precision sheet metal fabrication and had been previously included in the Compression Group. It was determined that this business was not core to the growth of the Company. The Company recorded an after-tax loss of $0.4 million on the transaction, being total consideration of $4.0 million less net assets disposed of $3.6 million (comprised of $3.2 non-cash working capital and $0.4 fixed assets) less a cumulative foreign exchange loss of $0.8 million.
The results of discontinued operations included the following:
2008 2007
Revenues $ 7,621 $ 16,219Income before income taxes 163 664
4. BUSINESS ACQUISITIONSEffective June 25, 2008, certain assets of a privately owned rental operation in Sault Ste. Marie, Ontario, were purchased. In 2007, certain assets of a privately owned rental operation in Timmins, Ontario were acquired.
The acquisitions were recorded using the purchase method. The fair values of net assets acquired were as follows:
2008 2007
Non-cash working capital $ 126 $ 1,048Property, plant and equipment 165 188Rental assets 338 1,888
Purchase price $ 629 $ 3,124
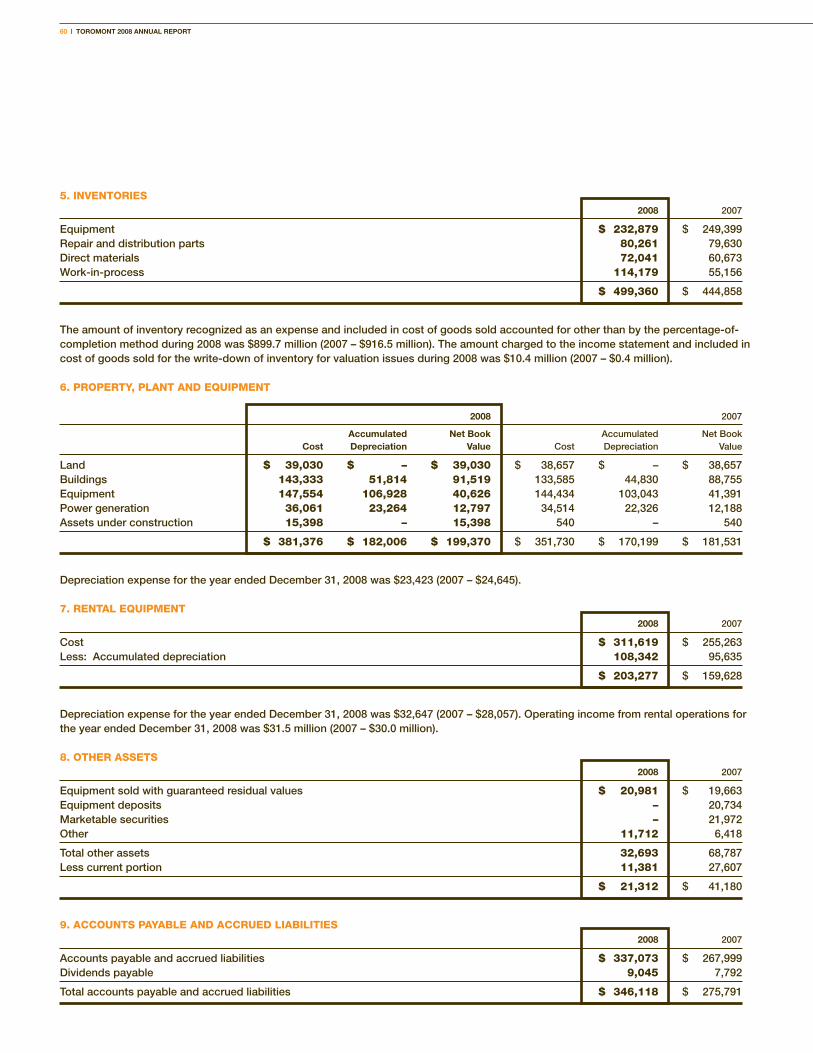
60 | TOROMONT 2008 ANNUAL REPORT
5. INVENTORIES 2008 2007
Equipment $ 232,879 $ 249,399 Repair and distribution parts 80,261 79,630 Direct materials 72,041 60,673 Work-in-process 114,179 55,156
$ 499,360 $ 444,858
The amount of inventory recognized as an expense and included in cost of goods sold accounted for other than by the percentage-of-completion method during 2008 was $899.7 million (2007 – $916.5 million). The amount charged to the income statement and included in cost of goods sold for the write-down of inventory for valuation issues during 2008 was $10.4 million (2007 – $0.4 million).
6. PROPERTY, PLANT AND EQUIPMENT
2008 2007
Accumulated Net Book Accumulated Net Book cost depreciation value Cost Depreciation Value
Land $ 39,030 $ – $ 39,030 $ 38,657 $ – $ 38,657Buildings 143,333 51,814 91,519 133,585 44,830 88,755Equipment 147,554 106,928 40,626 144,434 103,043 41,391Power generation 36,061 23,264 12,797 34,514 22,326 12,188Assets under construction 15,398 – 15,398 540 – 540
$ 381,376 $ 182,006 $ 199,370 $ 351,730 $ 170,199 $ 181,531
Depreciation expense for the year ended December 31, 2008 was $23,423 (2007 – $24,645).
7. RENTAL EQUIPMENT 2008 2007
Cost $ 311,619 $ 255,263Less: Accumulated depreciation 108,342 95,635
$ 203,277 $ 159,628
Depreciation expense for the year ended December 31, 2008 was $32,647 (2007 – $28,057). Operating income from rental operations for the year ended December 31, 2008 was $31.5 million (2007 – $30.0 million).
8. OTHER ASSETS 2008 2007
Equipment sold with guaranteed residual values $ 20,981 $ 19,663Equipment deposits – 20,734Marketable securities – 21,972Other 11,712 6,418
Total other assets 32,693 68,787Less current portion 11,381 27,607
$ 21,312 $ 41,180
9. ACCOUNTS PAYABLE AND ACCRUED LIABILITIES 2008 2007
Accounts payable and accrued liabilities $ 337,073 $ 267,999Dividends payable 9,045 7,792
Total accounts payable and accrued liabilities $ 346,118 $ 275,791
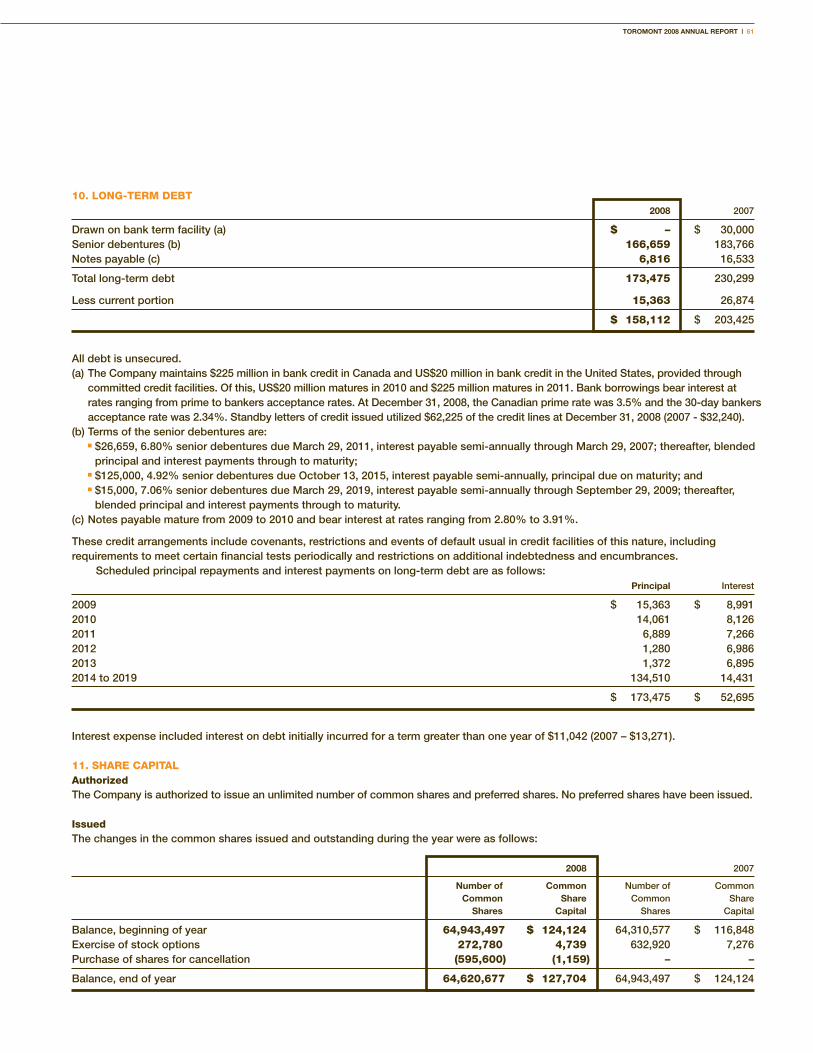
TOROMONT 2008 ANNUAL REPORT | 61
10. LONG-TERM DEBT 2008 2007
Drawn on bank term facility (a) $ – $ 30,000Senior debentures (b) 166,659 183,766Notes payable (c) 6,816 16,533
Total long-term debt 173,475 230,299
Less current portion 15,363 26,874
$ 158,112 $ 203,425
All debt is unsecured. (a) The Company maintains $225 million in bank credit in Canada and US$20 million in bank credit in the United States, provided through
committed credit facilities. Of this, US$20 million matures in 2010 and $225 million matures in 2011. Bank borrowings bear interest at rates ranging from prime to bankers acceptance rates. At December 31, 2008, the Canadian prime rate was 3.5% and the 30-day bankers acceptance rate was 2.34%. Standby letters of credit issued utilized $62,225 of the credit lines at December 31, 2008 (2007 - $32,240).
(b) Terms of the senior debentures are: n $26,659, 6.80% senior debentures due March 29, 2011, interest payable semi-annually through March 29, 2007; thereafter, blended
principal and interest payments through to maturity; n $125,000, 4.92% senior debentures due October 13, 2015, interest payable semi-annually, principal due on maturity; and n $15,000, 7.06% senior debentures due March 29, 2019, interest payable semi-annually through September 29, 2009; thereafter,
blended principal and interest payments through to maturity.(c) Notes payable mature from 2009 to 2010 and bear interest at rates ranging from 2.80% to 3.91%.
These credit arrangements include covenants, restrictions and events of default usual in credit facilities of this nature, including requirements to meet certain financial tests periodically and restrictions on additional indebtedness and encumbrances.
Scheduled principal repayments and interest payments on long-term debt are as follows: Principal Interest
2009 $ 15,363 $ 8,9912010 14,061 8,1262011 6,889 7,2662012 1,280 6,9862013 1,372 6,8952014 to 2019 134,510 14,431
$ 173,475 $ 52,695
Interest expense included interest on debt initially incurred for a term greater than one year of $11,042 (2007 – $13,271).
11. SHARE CAPITALAuthorizedThe Company is authorized to issue an unlimited number of common shares and preferred shares. No preferred shares have been issued.
IssuedThe changes in the common shares issued and outstanding during the year were as follows:
2008 2007
Number of common Number of Common common share Common Share shares capital Shares Capital
Balance, beginning of year 64,943,497 $ 124,124 64,310,577 $ 116,848Exercise of stock options 272,780 4,739 632,920 7,276Purchase of shares for cancellation (595,600) (1,159) – –
Balance, end of year 64,620,677 $ 127,704 64,943,497 $ 124,124

62 | TOROMONT 2008 ANNUAL REPORT
Shareholder Rights PlanThe Shareholder Rights Plan is designed to encourage the fair treatment of shareholders in connection with any takeover offer for the Company. Rights issued under the plan become exercisable when a person, and any related parties, acquires or commences a take-over bid to acquire 20% or more of the Company’s outstanding common shares without complying with certain provisions set out in the plan or without approval of the Company’s Board of Directors. Should such an acquisition occur, each rights holder, other than the acquiring person and related parties, will have the right to purchase common shares of the Company at a 50% discount to the market price at that time. Unless renewed by shareholders at the Annual and Special Meeting of Shareholders to be held on April 23, 2009, the plan expires in April 2009.
Normal Course Issuer Bid (NCIB)On August 28, 2008, Toromont announced the renewal and expansion of its NCIB program. The issuer bid allows the Company to purchase up to approximately 4.6 million of its common shares, representing 10% of common shares in the public float, in the year ending August 30, 2009. The actual number of shares purchased and the timing of any such purchases will be determined by Toromont. All shares purchased under the bid will be cancelled. The Company purchased and cancelled 595,600 shares for $12,808 (average cost of $21.50 per share) in 2008. The shares were purchased for an amount higher than their weighted average book value per share ($1.95 per share) resulting in a reduction of retained earnings of $11,650. The Company did not purchase any shares under the normal course issuer bid in 2007.
2008
Total shares purchased (number of shares) 595,600Average purchase price (per share) $ 21.50
Total cash paid (thousands) $ 12,808Book value of shares cancelled 1,158
Reduction to retained earnings $ 11,650
12. CONTRIBUTED SURPLUSContributed surplus consists of accumulated stock option expense less the fair value of the options at the grant date that have been exercised and reclassified to share capital. Changes in contributed surplus were as follows:
2008 2007
Balance, beginning of year $ 7,707 $ 6,543Stock-based compensation expense, net of forfeitures 2,494 2,073Value of compensation cost associated with exercised options (1,223) (909)
Balance, end of year $ 8,978 $ 7,707
13. ACCUMULATED OTHER COMPREHENSIVE INCOMEThe changes in accumulated other comprehensive income were as follows: 2008 2007
Balance, beginning of year $ (16,140) $ (4,641)Other comprehensive income (loss) 27,039 (11,499)
Balance, end of year $ 10,899 $ (16,140)
Accumulated other comprehensive income was comprised of the following amounts as at year end:
2008 2007
Unrealized gains (losses) on translation of financial statements of self-sustaining foreign operations $ 7,355 $ (14,807)Gains (losses) on foreign exchange derivatives designated as cash flow hedges, net of taxes (2008 – $1,909, 2007 – $627) 3,544 (1,168)Unrealized gain on financial assets designated as available-for-sale, net of taxes of $24 – 44Loss on interest rate derivative designated as a cash flow hedge, net of taxes of $111 – (209)
Balance, end of year $ 10,899 $ (16,140)
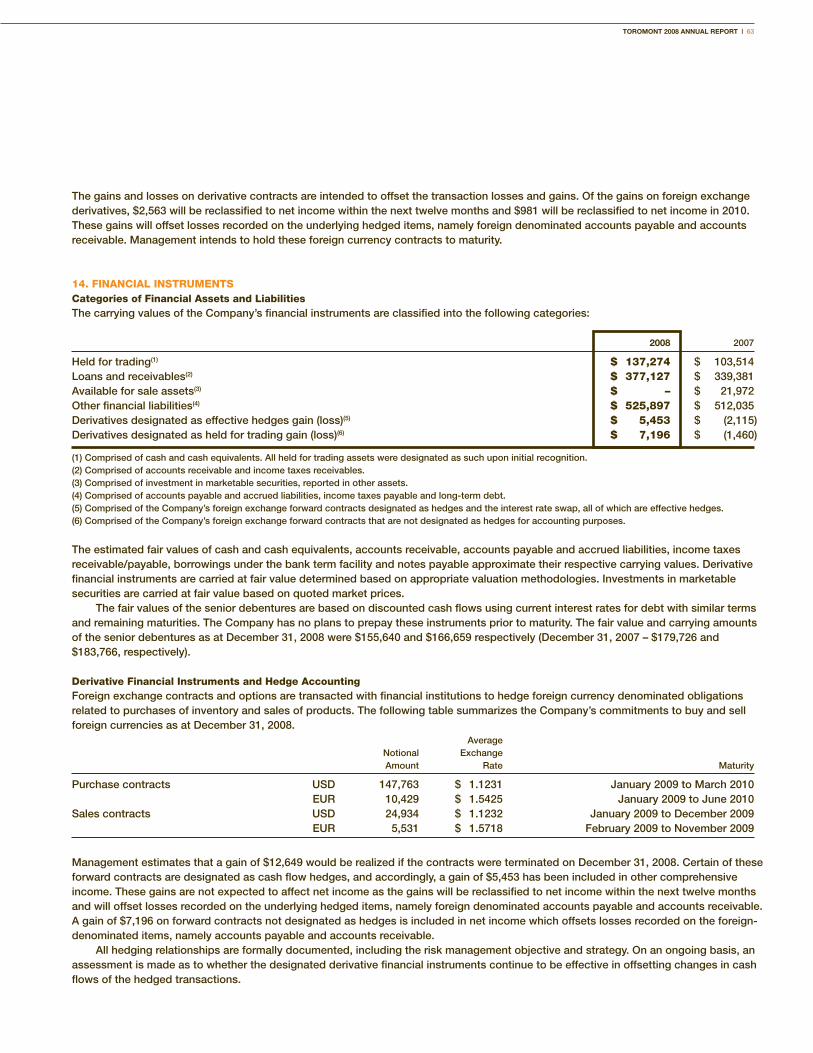
TOROMONT 2008 ANNUAL REPORT | 63
The gains and losses on derivative contracts are intended to offset the transaction losses and gains. Of the gains on foreign exchange derivatives, $2,563 will be reclassified to net income within the next twelve months and $981 will be reclassified to net income in 2010. These gains will offset losses recorded on the underlying hedged items, namely foreign denominated accounts payable and accounts receivable. Management intends to hold these foreign currency contracts to maturity.
14. FINANCIAL INSTRUMENTSCategories of Financial Assets and LiabilitiesThe carrying values of the Company’s financial instruments are classified into the following categories:
2008 2007
Held for trading(1) $ 137,274 $ 103,514Loans and receivables(2) $ 377,127 $ 339,381Available for sale assets(3) $ – $ 21,972Other financial liabilities(4) $ 525,897 $ 512,035Derivatives designated as effective hedges gain (loss)(5) $ 5,453 $ (2,115)Derivatives designated as held for trading gain (loss)(6) $ 7,196 $ (1,460)
(1) Comprised of cash and cash equivalents. All held for trading assets were designated as such upon initial recognition.(2) Comprised of accounts receivable and income taxes receivables.(3) Comprised of investment in marketable securities, reported in other assets.(4) Comprised of accounts payable and accrued liabilities, income taxes payable and long-term debt.(5) Comprised of the Company’s foreign exchange forward contracts designated as hedges and the interest rate swap, all of which are effective hedges.(6) Comprised of the Company’s foreign exchange forward contracts that are not designated as hedges for accounting purposes.
The estimated fair values of cash and cash equivalents, accounts receivable, accounts payable and accrued liabilities, income taxes receivable/payable, borrowings under the bank term facility and notes payable approximate their respective carrying values. Derivative financial instruments are carried at fair value determined based on appropriate valuation methodologies. Investments in marketable securities are carried at fair value based on quoted market prices.
The fair values of the senior debentures are based on discounted cash flows using current interest rates for debt with similar terms and remaining maturities. The Company has no plans to prepay these instruments prior to maturity. The fair value and carrying amounts of the senior debentures as at December 31, 2008 were $155,640 and $166,659 respectively (December 31, 2007 – $179,726 and $183,766, respectively).
Derivative Financial Instruments and Hedge AccountingForeign exchange contracts and options are transacted with financial institutions to hedge foreign currency denominated obligations related to purchases of inventory and sales of products. The following table summarizes the Company’s commitments to buy and sell foreign currencies as at December 31, 2008. Average Notional Exchange Amount Rate Maturity
Purchase contracts USD 147,763 $ 1.1231 January 2009 to March 2010 EUR 10,429 $ 1.5425 January 2009 to June 2010Sales contracts USD 24,934 $ 1.1232 January 2009 to December 2009 EUR 5,531 $ 1.5718 February 2009 to November 2009
Management estimates that a gain of $12,649 would be realized if the contracts were terminated on December 31, 2008. Certain of these forward contracts are designated as cash flow hedges, and accordingly, a gain of $5,453 has been included in other comprehensive income. These gains are not expected to affect net income as the gains will be reclassified to net income within the next twelve months and will offset losses recorded on the underlying hedged items, namely foreign denominated accounts payable and accounts receivable. A gain of $7,196 on forward contracts not designated as hedges is included in net income which offsets losses recorded on the foreign-denominated items, namely accounts payable and accounts receivable.
All hedging relationships are formally documented, including the risk management objective and strategy. On an ongoing basis, an assessment is made as to whether the designated derivative financial instruments continue to be effective in offsetting changes in cash flows of the hedged transactions.
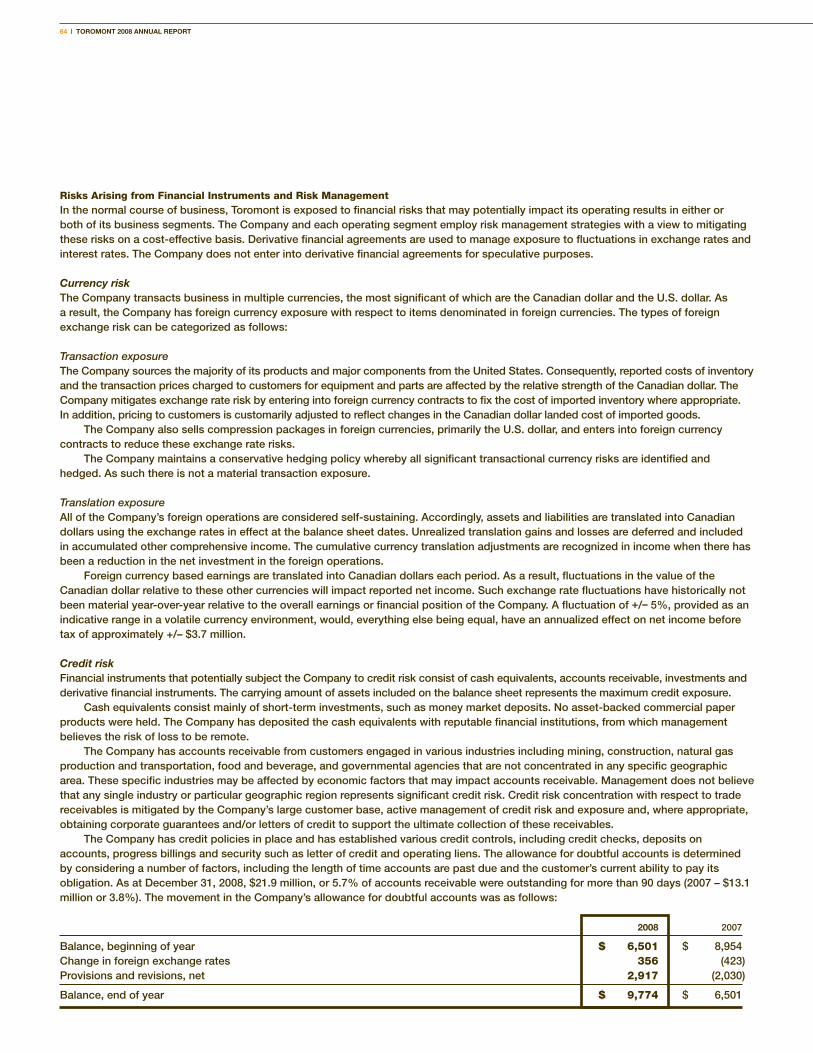
64 | TOROMONT 2008 ANNUAL REPORT
Risks Arising from Financial Instruments and Risk ManagementIn the normal course of business, Toromont is exposed to financial risks that may potentially impact its operating results in either or both of its business segments. The Company and each operating segment employ risk management strategies with a view to mitigating these risks on a cost-effective basis. Derivative financial agreements are used to manage exposure to fluctuations in exchange rates and interest rates. The Company does not enter into derivative financial agreements for speculative purposes.
Currency riskThe Company transacts business in multiple currencies, the most significant of which are the Canadian dollar and the U.S. dollar. As a result, the Company has foreign currency exposure with respect to items denominated in foreign currencies. The types of foreign exchange risk can be categorized as follows:
Transaction exposureThe Company sources the majority of its products and major components from the United States. Consequently, reported costs of inventory and the transaction prices charged to customers for equipment and parts are affected by the relative strength of the Canadian dollar. The Company mitigates exchange rate risk by entering into foreign currency contracts to fix the cost of imported inventory where appropriate. In addition, pricing to customers is customarily adjusted to reflect changes in the Canadian dollar landed cost of imported goods.
The Company also sells compression packages in foreign currencies, primarily the U.S. dollar, and enters into foreign currency contracts to reduce these exchange rate risks.
The Company maintains a conservative hedging policy whereby all significant transactional currency risks are identified and hedged. As such there is not a material transaction exposure.
Translation exposureAll of the Company’s foreign operations are considered self-sustaining. Accordingly, assets and liabilities are translated into Canadian dollars using the exchange rates in effect at the balance sheet dates. Unrealized translation gains and losses are deferred and included in accumulated other comprehensive income. The cumulative currency translation adjustments are recognized in income when there has been a reduction in the net investment in the foreign operations.
Foreign currency based earnings are translated into Canadian dollars each period. As a result, fluctuations in the value of the Canadian dollar relative to these other currencies will impact reported net income. Such exchange rate fluctuations have historically not been material year-over-year relative to the overall earnings or financial position of the Company. A fluctuation of +/– 5%, provided as an indicative range in a volatile currency environment, would, everything else being equal, have an annualized effect on net income before tax of approximately +/– $3.7 million.
Credit riskFinancial instruments that potentially subject the Company to credit risk consist of cash equivalents, accounts receivable, investments and derivative financial instruments. The carrying amount of assets included on the balance sheet represents the maximum credit exposure.
Cash equivalents consist mainly of short-term investments, such as money market deposits. No asset-backed commercial paper products were held. The Company has deposited the cash equivalents with reputable financial institutions, from which management believes the risk of loss to be remote.
The Company has accounts receivable from customers engaged in various industries including mining, construction, natural gas production and transportation, food and beverage, and governmental agencies that are not concentrated in any specific geographic area. These specific industries may be affected by economic factors that may impact accounts receivable. Management does not believe that any single industry or particular geographic region represents significant credit risk. Credit risk concentration with respect to trade receivables is mitigated by the Company’s large customer base, active management of credit risk and exposure and, where appropriate, obtaining corporate guarantees and/or letters of credit to support the ultimate collection of these receivables.
The Company has credit policies in place and has established various credit controls, including credit checks, deposits on accounts, progress billings and security such as letter of credit and operating liens. The allowance for doubtful accounts is determined by considering a number of factors, including the length of time accounts are past due and the customer’s current ability to pay its obligation. As at December 31, 2008, $21.9 million, or 5.7% of accounts receivable were outstanding for more than 90 days (2007 – $13.1 million or 3.8%). The movement in the Company’s allowance for doubtful accounts was as follows:
2008 2007
Balance, beginning of year $ 6,501 $ 8,954 Change in foreign exchange rates 356 (423)Provisions and revisions, net 2,917 (2,030)
Balance, end of year $ 9,774 $ 6,501
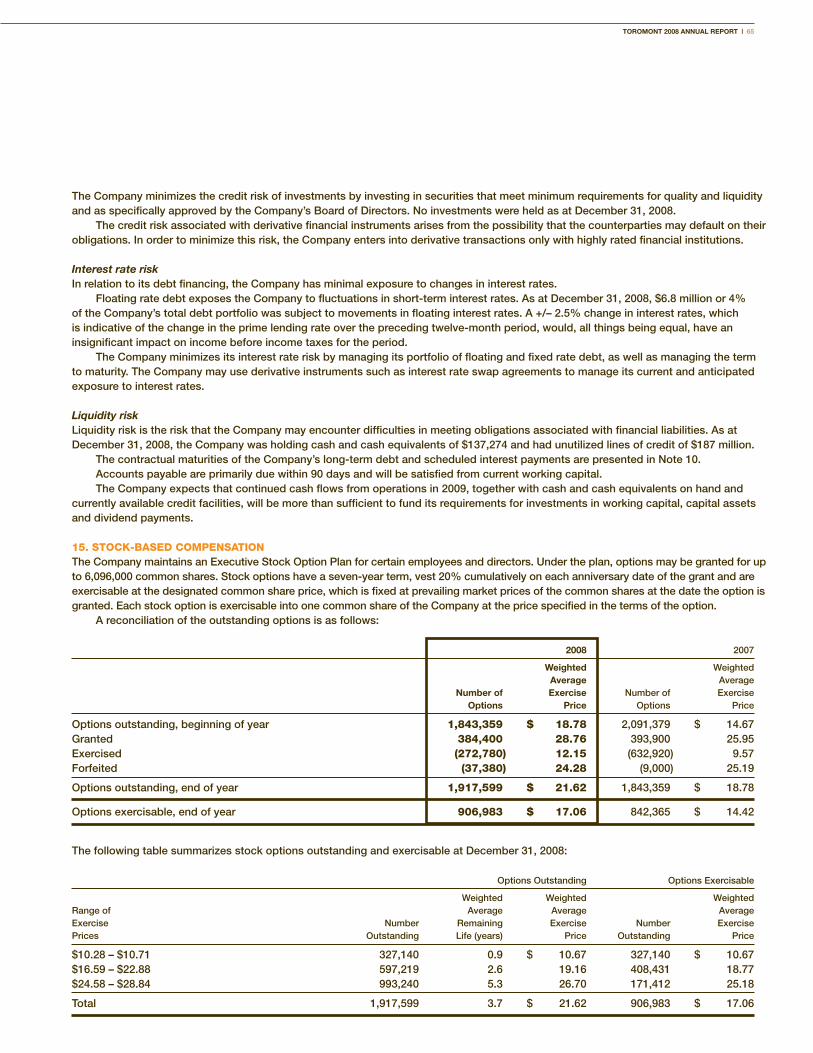
TOROMONT 2008 ANNUAL REPORT | 65
The Company minimizes the credit risk of investments by investing in securities that meet minimum requirements for quality and liquidity and as specifically approved by the Company’s Board of Directors. No investments were held as at December 31, 2008.
The credit risk associated with derivative financial instruments arises from the possibility that the counterparties may default on their obligations. In order to minimize this risk, the Company enters into derivative transactions only with highly rated financial institutions.
Interest rate riskIn relation to its debt financing, the Company has minimal exposure to changes in interest rates.
Floating rate debt exposes the Company to fluctuations in short-term interest rates. As at December 31, 2008, $6.8 million or 4% of the Company’s total debt portfolio was subject to movements in floating interest rates. A +/– 2.5% change in interest rates, which is indicative of the change in the prime lending rate over the preceding twelve-month period, would, all things being equal, have an insignificant impact on income before income taxes for the period.
The Company minimizes its interest rate risk by managing its portfolio of floating and fixed rate debt, as well as managing the term to maturity. The Company may use derivative instruments such as interest rate swap agreements to manage its current and anticipated exposure to interest rates.
Liquidity riskLiquidity risk is the risk that the Company may encounter difficulties in meeting obligations associated with financial liabilities. As at December 31, 2008, the Company was holding cash and cash equivalents of $137,274 and had unutilized lines of credit of $187 million.
The contractual maturities of the Company’s long-term debt and scheduled interest payments are presented in Note 10.Accounts payable are primarily due within 90 days and will be satisfied from current working capital.The Company expects that continued cash flows from operations in 2009, together with cash and cash equivalents on hand and
currently available credit facilities, will be more than sufficient to fund its requirements for investments in working capital, capital assets and dividend payments.
15. STOCK-BASED COMPENSATIONThe Company maintains an Executive Stock Option Plan for certain employees and directors. Under the plan, options may be granted for up to 6,096,000 common shares. Stock options have a seven-year term, vest 20% cumulatively on each anniversary date of the grant and are exercisable at the designated common share price, which is fixed at prevailing market prices of the common shares at the date the option is granted. Each stock option is exercisable into one common share of the Company at the price specified in the terms of the option.
A reconciliation of the outstanding options is as follows:
2008 2007
Weighted Weighted Average Average Number of Exercise Number of Exercise Options Price Options Price
Options outstanding, beginning of year 1,843,359 $ 18.78 2,091,379 $ 14.67 Granted 384,400 28.76 393,900 25.95Exercised (272,780) 12.15 (632,920) 9.57Forfeited (37,380) 24.28 (9,000) 25.19
Options outstanding, end of year 1,917,599 $ 21.62 1,843,359 $ 18.78
Options exercisable, end of year 906,983 $ 17.06 842,365 $ 14.42
The following table summarizes stock options outstanding and exercisable at December 31, 2008:
Options Outstanding Options Exercisable
Weighted Weighted Weighted Range of Average Average Average Exercise Number Remaining Exercise Number Exercise Prices Outstanding Life (years) Price Outstanding Price
$10.28 – $10.71 327,140 0.9 $ 10.67 327,140 $ 10.67$16.59 – $22.88 597,219 2.6 19.16 408,431 18.77 $24.58 – $28.84 993,240 5.3 26.70 171,412 25.18
Total 1,917,599 3.7 $ 21.62 906,983 $ 17.06
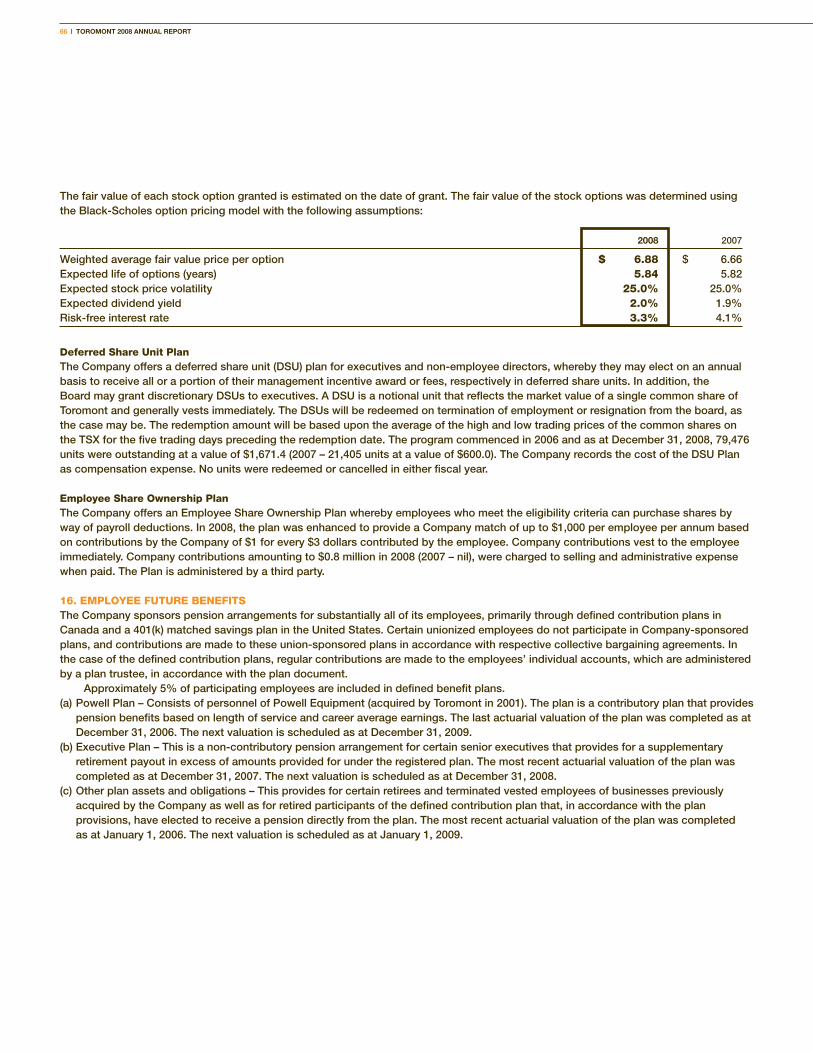
66 | TOROMONT 2008 ANNUAL REPORT
The fair value of each stock option granted is estimated on the date of grant. The fair value of the stock options was determined using the Black-Scholes option pricing model with the following assumptions:
2008 2007
Weighted average fair value price per option $ 6.88 $ 6.66Expected life of options (years) 5.84 5.82Expected stock price volatility 25.0% 25.0%Expected dividend yield 2.0% 1.9%Risk-free interest rate 3.3% 4.1%
Deferred Share Unit PlanThe Company offers a deferred share unit (DSU) plan for executives and non-employee directors, whereby they may elect on an annual basis to receive all or a portion of their management incentive award or fees, respectively in deferred share units. In addition, the Board may grant discretionary DSUs to executives. A DSU is a notional unit that reflects the market value of a single common share of Toromont and generally vests immediately. The DSUs will be redeemed on termination of employment or resignation from the board, as the case may be. The redemption amount will be based upon the average of the high and low trading prices of the common shares on the TSX for the five trading days preceding the redemption date. The program commenced in 2006 and as at December 31, 2008, 79,476 units were outstanding at a value of $1,671.4 (2007 – 21,405 units at a value of $600.0). The Company records the cost of the DSU Plan as compensation expense. No units were redeemed or cancelled in either fiscal year.
Employee Share Ownership PlanThe Company offers an Employee Share Ownership Plan whereby employees who meet the eligibility criteria can purchase shares by way of payroll deductions. In 2008, the plan was enhanced to provide a Company match of up to $1,000 per employee per annum based on contributions by the Company of $1 for every $3 dollars contributed by the employee. Company contributions vest to the employee immediately. Company contributions amounting to $0.8 million in 2008 (2007 – nil), were charged to selling and administrative expense when paid. The Plan is administered by a third party.
16. EMPLOYEE FUTURE BENEFITSThe Company sponsors pension arrangements for substantially all of its employees, primarily through defined contribution plans in Canada and a 401(k) matched savings plan in the United States. Certain unionized employees do not participate in Company-sponsored plans, and contributions are made to these union-sponsored plans in accordance with respective collective bargaining agreements. In the case of the defined contribution plans, regular contributions are made to the employees’ individual accounts, which are administered by a plan trustee, in accordance with the plan document.
Approximately 5% of participating employees are included in defined benefit plans. (a) Powell Plan – Consists of personnel of Powell Equipment (acquired by Toromont in 2001). The plan is a contributory plan that provides
pension benefits based on length of service and career average earnings. The last actuarial valuation of the plan was completed as at December 31, 2006. The next valuation is scheduled as at December 31, 2009.
(b) Executive Plan – This is a non-contributory pension arrangement for certain senior executives that provides for a supplementary retirement payout in excess of amounts provided for under the registered plan. The most recent actuarial valuation of the plan was completed as at December 31, 2007. The next valuation is scheduled as at December 31, 2008.
(c) Other plan assets and obligations – This provides for certain retirees and terminated vested employees of businesses previously acquired by the Company as well as for retired participants of the defined contribution plan that, in accordance with the plan provisions, have elected to receive a pension directly from the plan. The most recent actuarial valuation of the plan was completed as at January 1, 2006. The next valuation is scheduled as at January 1, 2009.
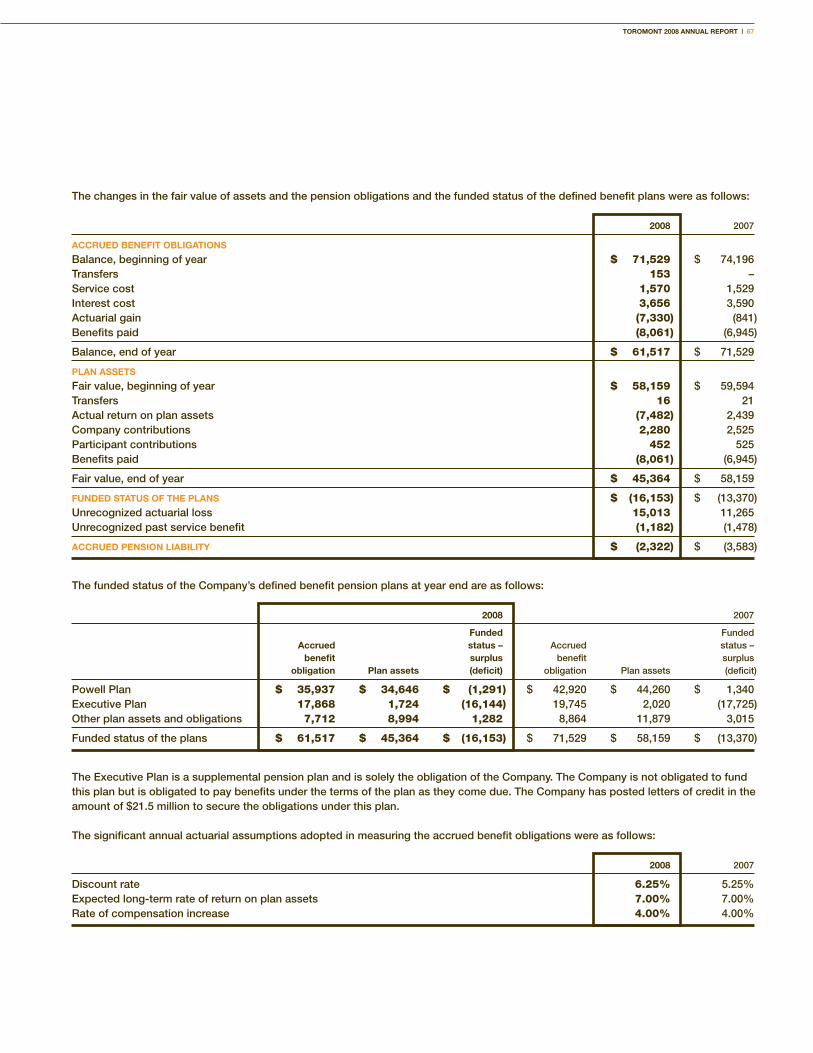
TOROMONT 2008 ANNUAL REPORT | 67
The changes in the fair value of assets and the pension obligations and the funded status of the defined benefit plans were as follows:
2008 2007
AccRUEd BENEfiT OBLigATiONs
Balance, beginning of year $ 71,529 $ 74,196Transfers 153 –Service cost 1,570 1,529Interest cost 3,656 3,590Actuarial gain (7,330) (841)Benefits paid (8,061) (6,945)
Balance, end of year $ 61,517 $ 71,529
PLAN AssETs
Fair value, beginning of year $ 58,159 $ 59,594Transfers 16 21Actual return on plan assets (7,482) 2,439Company contributions 2,280 2,525Participant contributions 452 525Benefits paid (8,061) (6,945)
Fair value, end of year $ 45,364 $ 58,159
fUNdEd sTATUs Of ThE PLANs $ (16,153) $ (13,370)Unrecognized actuarial loss 15,013 11,265Unrecognized past service benefit (1,182) (1,478)
AccRUEd PENsiON LiABiLiTy $ (2,322) $ (3,583)
The funded status of the Company’s defined benefit pension plans at year end are as follows:
2008 2007
funded Funded Accrued status – Accrued status – benefit surplus benefit surplus obligation Plan assets (deficit) obligation Plan assets (deficit)
Powell Plan $ 35,937 $ 34,646 $ (1,291) $ 42,920 $ 44,260 $ 1,340Executive Plan 17,868 1,724 (16,144) 19,745 2,020 (17,725)Other plan assets and obligations 7,712 8,994 1,282 8,864 11,879 3,015
Funded status of the plans $ 61,517 $ 45,364 $ (16,153) $ 71,529 $ 58,159 $ (13,370)
The Executive Plan is a supplemental pension plan and is solely the obligation of the Company. The Company is not obligated to fund this plan but is obligated to pay benefits under the terms of the plan as they come due. The Company has posted letters of credit in the amount of $21.5 million to secure the obligations under this plan.
The significant annual actuarial assumptions adopted in measuring the accrued benefit obligations were as follows:
2008 2007
Discount rate 6.25% 5.25%Expected long-term rate of return on plan assets 7.00% 7.00%Rate of compensation increase 4.00% 4.00%
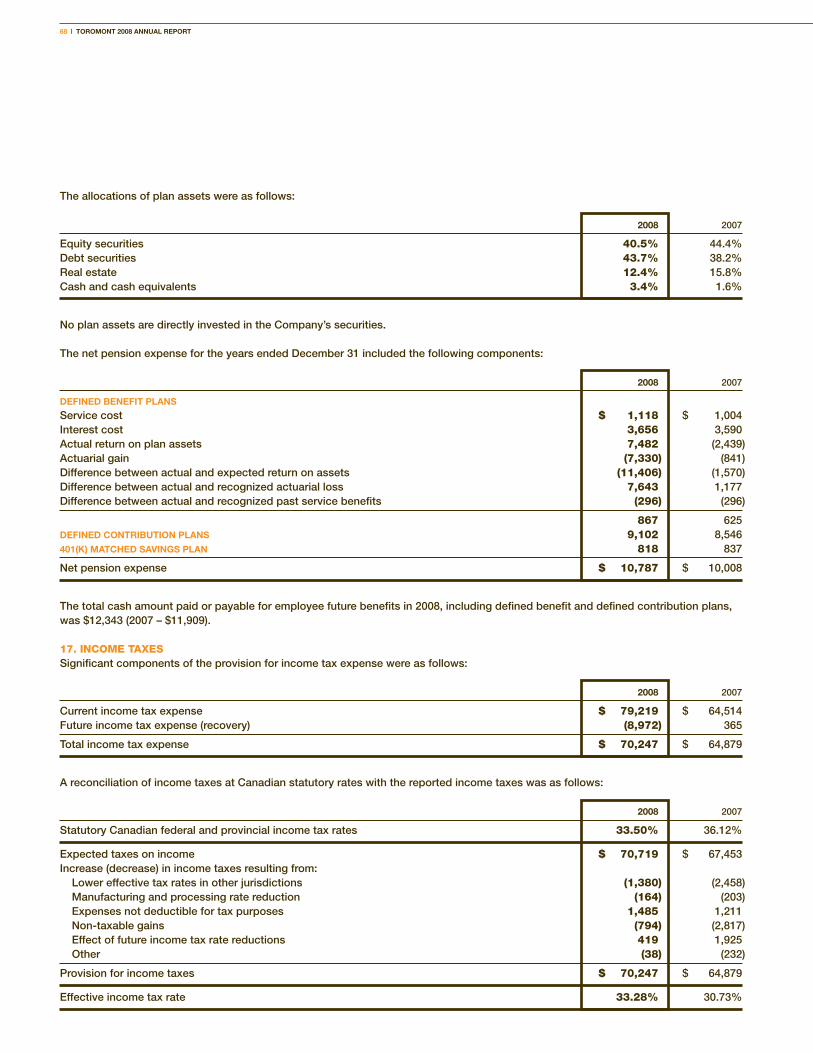
68 | TOROMONT 2008 ANNUAL REPORT
The allocations of plan assets were as follows:
2008 2007
Equity securities 40.5% 44.4%Debt securities 43.7% 38.2%Real estate 12.4% 15.8%Cash and cash equivalents 3.4% 1.6%
No plan assets are directly invested in the Company’s securities.
The net pension expense for the years ended December 31 included the following components:
2008 2007
dEfiNEd BENEfiT PLANs
Service cost $ 1,118 $ 1,004 Interest cost 3,656 3,590 Actual return on plan assets 7,482 (2,439)Actuarial gain (7,330) (841)Difference between actual and expected return on assets (11,406) (1,570)Difference between actual and recognized actuarial loss 7,643 1,177 Difference between actual and recognized past service benefits (296) (296)
867 625dEfiNEd cONTRiBUTiON PLANs 9,102 8,546401(K) MATchEd sAviNgs PLAN 818 837
Net pension expense $ 10,787 $ 10,008
The total cash amount paid or payable for employee future benefits in 2008, including defined benefit and defined contribution plans, was $12,343 (2007 – $11,909).
17. INCOME TAXES Significant components of the provision for income tax expense were as follows:
2008 2007
Current income tax expense $ 79,219 $ 64,514 Future income tax expense (recovery) (8,972) 365
Total income tax expense $ 70,247 $ 64,879
A reconciliation of income taxes at Canadian statutory rates with the reported income taxes was as follows:
2008 2007
Statutory Canadian federal and provincial income tax rates 33.50% 36.12%
Expected taxes on income $ 70,719 $ 67,453Increase (decrease) in income taxes resulting from: Lower effective tax rates in other jurisdictions (1,380) (2,458) Manufacturing and processing rate reduction (164) (203) Expenses not deductible for tax purposes 1,485 1,211 Non-taxable gains (794) (2,817) Effect of future income tax rate reductions 419 1,925 Other (38) (232)
Provision for income taxes $ 70,247 $ 64,879
Effective income tax rate 33.28% 30.73%
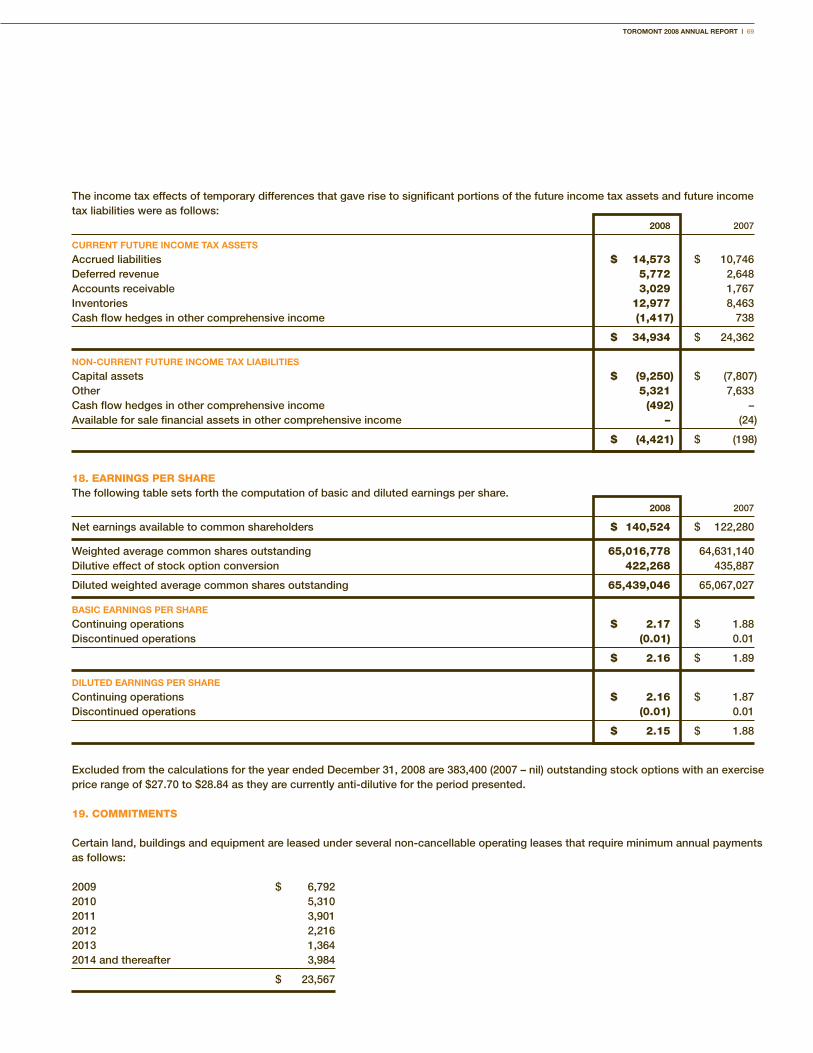
TOROMONT 2008 ANNUAL REPORT | 69
The income tax effects of temporary differences that gave rise to significant portions of the future income tax assets and future income tax liabilities were as follows: 2008 2007
cURRENT fUTURE iNcOME TAx AssETs
Accrued liabilities $ 14,573 $ 10,746Deferred revenue 5,772 2,648Accounts receivable 3,029 1,767Inventories 12,977 8,463Cash flow hedges in other comprehensive income (1,417) 738
$ 34,934 $ 24,362
NON-cURRENT fUTURE iNcOME TAx LiABiLiTiEs
Capital assets $ (9,250) $ (7,807)Other 5,321 7,633Cash flow hedges in other comprehensive income (492) –Available for sale financial assets in other comprehensive income – (24)
$ (4,421) $ (198)
18. EARNINGS PER SHAREThe following table sets forth the computation of basic and diluted earnings per share. 2008 2007
Net earnings available to common shareholders $ 140,524 $ 122,280
Weighted average common shares outstanding 65,016,778 64,631,140Dilutive effect of stock option conversion 422,268 435,887
Diluted weighted average common shares outstanding 65,439,046 65,067,027
BAsic EARNiNgs PER shARE
Continuing operations $ 2.17 $ 1.88Discontinued operations (0.01) 0.01
$ 2.16 $ 1.89
diLUTEd EARNiNgs PER shARE
Continuing operations $ 2.16 $ 1.87Discontinued operations (0.01) 0.01
$ 2.15 $ 1.88
Excluded from the calculations for the year ended December 31, 2008 are 383,400 (2007 – nil) outstanding stock options with an exercise price range of $27.70 to $28.84 as they are currently anti-dilutive for the period presented.
19. COMMITMENTS
Certain land, buildings and equipment are leased under several non-cancellable operating leases that require minimum annual payments as follows:
2009 $ 6,7922010 5,3102011 3,9012012 2,2162013 1,3642014 and thereafter 3,984
$ 23,567
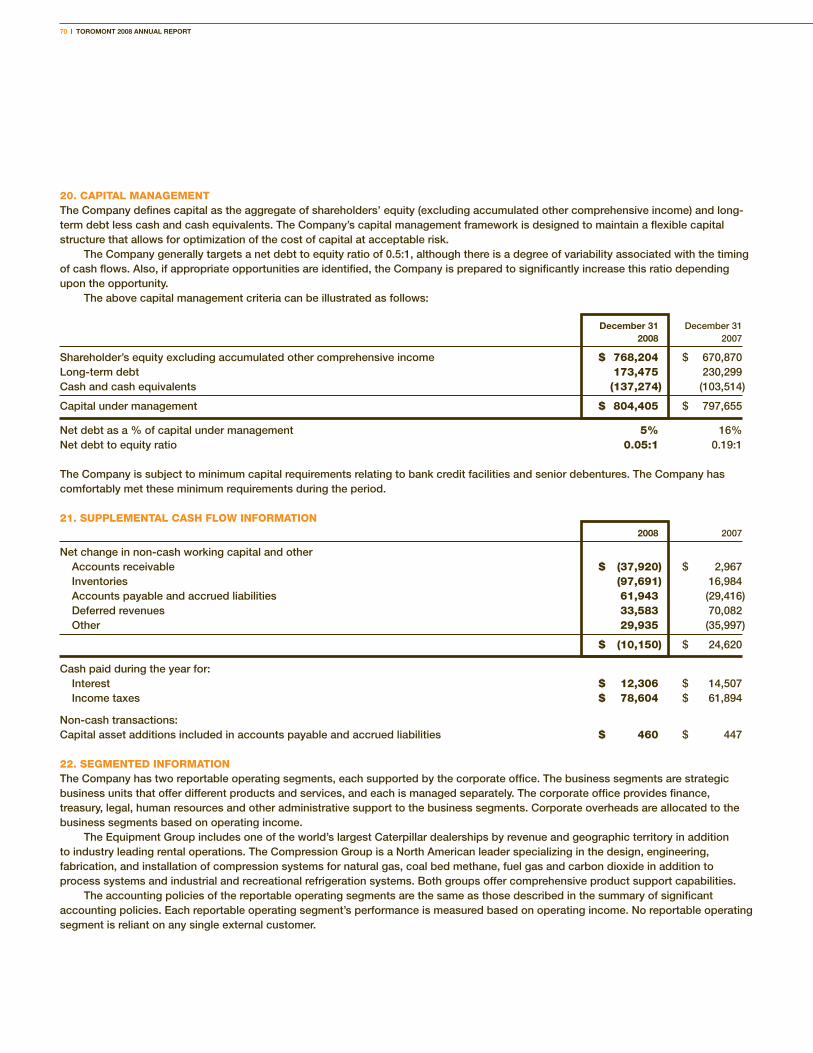
70 | TOROMONT 2008 ANNUAL REPORT
20. CAPITAL MANAGEMENTThe Company defines capital as the aggregate of shareholders’ equity (excluding accumulated other comprehensive income) and long-term debt less cash and cash equivalents. The Company’s capital management framework is designed to maintain a flexible capital structure that allows for optimization of the cost of capital at acceptable risk.
The Company generally targets a net debt to equity ratio of 0.5:1, although there is a degree of variability associated with the timing of cash flows. Also, if appropriate opportunities are identified, the Company is prepared to significantly increase this ratio depending upon the opportunity.
The above capital management criteria can be illustrated as follows:
december 31 December 31 2008 2007
Shareholder’s equity excluding accumulated other comprehensive income $ 768,204 $ 670,870Long-term debt 173,475 230,299Cash and cash equivalents (137,274) (103,514)
Capital under management $ 804,405 $ 797,655
Net debt as a % of capital under management 5% 16%Net debt to equity ratio 0.05:1 0.19:1
The Company is subject to minimum capital requirements relating to bank credit facilities and senior debentures. The Company has comfortably met these minimum requirements during the period.
21. SUPPLEMENTAL CASH FLOW INFORMATION 2008 2007
Net change in non-cash working capital and other Accounts receivable $ (37,920) $ 2,967 Inventories (97,691) 16,984 Accounts payable and accrued liabilities 61,943 (29,416) Deferred revenues 33,583 70,082 Other 29,935 (35,997)
$ (10,150) $ 24,620
Cash paid during the year for: Interest $ 12,306 $ 14,507 Income taxes $ 78,604 $ 61,894
Non-cash transactions:Capital asset additions included in accounts payable and accrued liabilities $ 460 $ 447
22. SEGMENTED INFORMATIONThe Company has two reportable operating segments, each supported by the corporate office. The business segments are strategic business units that offer different products and services, and each is managed separately. The corporate office provides finance, treasury, legal, human resources and other administrative support to the business segments. Corporate overheads are allocated to the business segments based on operating income.
The Equipment Group includes one of the world’s largest Caterpillar dealerships by revenue and geographic territory in addition to industry leading rental operations. The Compression Group is a North American leader specializing in the design, engineering, fabrication, and installation of compression systems for natural gas, coal bed methane, fuel gas and carbon dioxide in addition to process systems and industrial and recreational refrigeration systems. Both groups offer comprehensive product support capabilities.
The accounting policies of the reportable operating segments are the same as those described in the summary of significant accounting policies. Each reportable operating segment’s performance is measured based on operating income. No reportable operating segment is reliant on any single external customer.
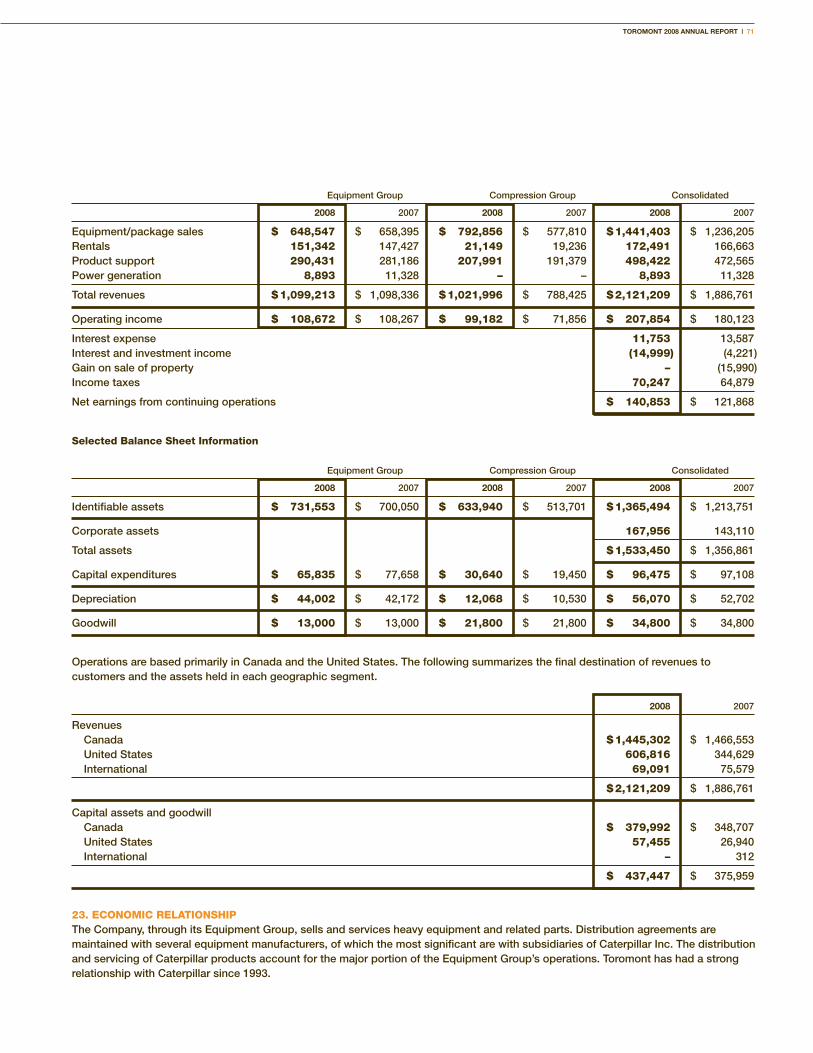
TOROMONT 2008 ANNUAL REPORT | 71
Equipment Group Compression Group Consolidated
2008 2007 2008 2007 2008 2007
Equipment/package sales $ 648,547 $ 658,395 $ 792,856 $ 577,810 $ 1,441,403 $ 1,236,205 Rentals 151,342 147,427 21,149 19,236 172,491 166,663 Product support 290,431 281,186 207,991 191,379 498,422 472,565Power generation 8,893 11,328 – – 8,893 11,328
Total revenues $ 1,099,213 $ 1,098,336 $ 1,021,996 $ 788,425 $ 2,121,209 $ 1,886,761
Operating income $ 108,672 $ 108,267 $ 99,182 $ 71,856 $ 207,854 $ 180,123
Interest expense 11,753 13,587 Interest and investment income (14,999) (4,221)Gain on sale of property – (15,990)Income taxes 70,247 64,879
Net earnings from continuing operations $ 140,853 $ 121,868
Selected Balance Sheet Information
Equipment Group Compression Group Consolidated
2008 2007 2008 2007 2008 2007
Identifiable assets $ 731,553 $ 700,050 $ 633,940 $ 513,701 $ 1,365,494 $ 1,213,751
Corporate assets 167,956 143,110
Total assets $ 1,533,450 $ 1,356,861
Capital expenditures $ 65,835 $ 77,658 $ 30,640 $ 19,450 $ 96,475 $ 97,108
Depreciation $ 44,002 $ 42,172 $ 12,068 $ 10,530 $ 56,070 $ 52,702
Goodwill $ 13,000 $ 13,000 $ 21,800 $ 21,800 $ 34,800 $ 34,800
Operations are based primarily in Canada and the United States. The following summarizes the final destination of revenues to customers and the assets held in each geographic segment.
2008 2007
Revenues Canada $ 1,445,302 $ 1,466,553 United States 606,816 344,629 International 69,091 75,579
$ 2,121,209 $ 1,886,761
Capital assets and goodwill Canada $ 379,992 $ 348,707 United States 57,455 26,940 International – 312
$ 437,447 $ 375,959
23. ECONOMIC RELATIONSHIPThe Company, through its Equipment Group, sells and services heavy equipment and related parts. Distribution agreements are maintained with several equipment manufacturers, of which the most significant are with subsidiaries of Caterpillar Inc. The distribution and servicing of Caterpillar products account for the major portion of the Equipment Group’s operations. Toromont has had a strong relationship with Caterpillar since 1993.

72 | TOROMONT 2008 ANNUAL REPORT
Ten-Year Financial ReviewFor the years ended December 31
($ thousands except where otherwise indicated) 2008 2007 2006 2005 2004(1) 2003 2002 2001 2000 1999
OPERATiNg REsULTs
Revenues 2,121,209 1,886,761 1,746,162 1,584,911 1,434,756 1,299,389 1,076,930 911,005 800,464 723,937Net earnings 140,524 122,280 99,421 78,962 70,518 58,693 40,457 43,700 32,345 32,057Net interest (income) expense (3,246) 9,331 11,110 10,192 10,202 10,608 7,136 (6,913) 3,797 (1,774)Capital expenditures 96,475 97,108 102,444 72,813 65,608 72,922 53,042 77,394 57,968 52,146Dividends declared 36,391 31,061 25,594 20,280 16,486 13,319 11,541 10,646 9,257 8,213
fiNANciAL POsiTiON
Working capital 509,276 466,859 469,638 410,990 263,294 203,577 213,222 218,132 165,098 183,922Capital assets 402,647 341,159 323,504 283,407 297,645 293,211 258,764 252,104 206,526 138,499Total assets 1,533,450 1,356,861 1,299,992 1,143,972 962,437 856,176 771,902 720,702 613,787 531,201Long-term debt 158,112 203,425 238,468 241,265 166,508 159,694 156,479 171,970 157,187 120,000Shareholders’ equity 779,103 654,730 565,556 481,812 415,855 376,837 335,316 314,248 218,213 203,062
fiNANciAL RATiOs
Working capital 1.9:1 2.0:1 2.1:1 2.1:1 1.8:1 1.7:1 1.8:1 2.0:1 1.7:1 1.9:1Return on opening shareholders’ equity (%) 21.5 21.6 20.6 18.9 18.7 17.5 12.9 17.1 15.9 17.5Total debt net of cash to shareholders’ equity .05:1 .2:1 .4:1 .4:1 .4:1 .5:1 .4:1 .5:1 .7:1 .6:1
PER shARE dATA ($)
Net earnings 2.16 1.89 1.56 1.25 1.11 0.93 0.63 0.71 0.56 0.55Dividends declared 0.56 0.48 0.40 0.32 0.26 0.21 0.18 0.17 0.16 0.14Book value (shareholders’ equity) 12.06 10.08 8.79 7.57 6.59 5.93 5.28 4.90 3.77 3.47Shares outstanding at year end 64,620,677 64,943,497 64,310,377 63,624,936 63,082,586 63,563,246 63,455,146 64,194,946 57,951,396 58,576,196Price range High 32.90 30.00 27.15 25.68 20.85 16.73 13.25 13.10 10.38 9.95 Low 19.03 22.30 20.08 20.05 15.88 9.88 9.25 7.63 6.90 6.88 Close 22.99 28.26 24.50 25.40 20.72 16.53 10.33 10.24 8.75 8.13
Notes
(1) Results in 2004 and prior have not been restated to conform with the current year’s presentation.

TOROMONT 2008 ANNUAL REPORT | 73
Ten-Year Financial ReviewFor the years ended December 31
($ thousands except where otherwise indicated) 2008 2007 2006 2005 2004(1) 2003 2002 2001 2000 1999
OPERATiNg REsULTs
Revenues 2,121,209 1,886,761 1,746,162 1,584,911 1,434,756 1,299,389 1,076,930 911,005 800,464 723,937Net earnings 140,524 122,280 99,421 78,962 70,518 58,693 40,457 43,700 32,345 32,057Net interest (income) expense (3,246) 9,331 11,110 10,192 10,202 10,608 7,136 (6,913) 3,797 (1,774)Capital expenditures 96,475 97,108 102,444 72,813 65,608 72,922 53,042 77,394 57,968 52,146Dividends declared 36,391 31,061 25,594 20,280 16,486 13,319 11,541 10,646 9,257 8,213
fiNANciAL POsiTiON
Working capital 509,276 466,859 469,638 410,990 263,294 203,577 213,222 218,132 165,098 183,922Capital assets 402,647 341,159 323,504 283,407 297,645 293,211 258,764 252,104 206,526 138,499Total assets 1,533,450 1,356,861 1,299,992 1,143,972 962,437 856,176 771,902 720,702 613,787 531,201Long-term debt 158,112 203,425 238,468 241,265 166,508 159,694 156,479 171,970 157,187 120,000Shareholders’ equity 779,103 654,730 565,556 481,812 415,855 376,837 335,316 314,248 218,213 203,062
fiNANciAL RATiOs
Working capital 1.9:1 2.0:1 2.1:1 2.1:1 1.8:1 1.7:1 1.8:1 2.0:1 1.7:1 1.9:1Return on opening shareholders’ equity (%) 21.5 21.6 20.6 18.9 18.7 17.5 12.9 17.1 15.9 17.5Total debt net of cash to shareholders’ equity .05:1 .2:1 .4:1 .4:1 .4:1 .5:1 .4:1 .5:1 .7:1 .6:1
PER shARE dATA ($)
Net earnings 2.16 1.89 1.56 1.25 1.11 0.93 0.63 0.71 0.56 0.55Dividends declared 0.56 0.48 0.40 0.32 0.26 0.21 0.18 0.17 0.16 0.14Book value (shareholders’ equity) 12.06 10.08 8.79 7.57 6.59 5.93 5.28 4.90 3.77 3.47Shares outstanding at year end 64,620,677 64,943,497 64,310,377 63,624,936 63,082,586 63,563,246 63,455,146 64,194,946 57,951,396 58,576,196Price range High 32.90 30.00 27.15 25.68 20.85 16.73 13.25 13.10 10.38 9.95 Low 19.03 22.30 20.08 20.05 15.88 9.88 9.25 7.63 6.90 6.88 Close 22.99 28.26 24.50 25.40 20.72 16.53 10.33 10.24 8.75 8.13
Notes
(1) Results in 2004 and prior have not been restated to conform with the current year’s presentation.
74 | TOROMONT 2008 ANNUAL REPORT
Corporate InformationEQUIPMENT GROUP Toromont CAT 3131 Highway 7 West P.O. Box 5511 Concord, Ontario L4K 1B7 T: 416 667 5511 F: 416 667 5555 S.J. Medhurst President
Battlefield – The CAT Rental Store 880 South Service Road Stoney Creek, Ontario L8H 7S8 T: 905 577 7777 F: 905 643 6008 R.B. Casson President
ANNUAL AND SPECIAL MEETINGThe Annual and Special Meeting of the Shareholders of Toromont Industries Ltd. will be held at 10:00 a.m. on Thursday, April 23, 2009 in the Imperial Room at the Fairmont Royal York Hotel, 100 Front Street West, Toronto, Ontario.
COMPRESSION GROUP Toromont Energy Systems Inc. 10121 Barlow Trail Northeast Calgary, Alberta T3J 3C6 T: 403 291 3438 F: 403 291 3443 G.P. Mihaichuk President and Chief Executive Officer
CIMCO Refrigeration 65 Villiers Street Toronto, Ontario M5A 3S1 T: 416 465 7581 F: 416 465 8815 S.D. McLeod President
OfficersRobert M. Ogilvie, Chairman and Chief Executive OfficerPaul R. Jewer, Vice President, Finance and Chief Financial OfficerMichael P. Cuddy, Vice President and Chief Information OfficerDavid C. Wetherald, Vice President, Human Resources and Legal
HOW TO GET IN TOUCH WITH US Tel: 416 667 5511Fax: 416 667 5555E-mail: [email protected]
HOW TO REACH OUR TRANSFER AGENT AND REGISTRARInvestors are encouraged to contact CIBC Mellon Trust Company for information regarding their security holdings.
CIBC Mellon Trust Company P.O. Box 7010 Adelaide Street Postal Station Toronto ON M5C 2W9 CANADA AnswerLine: 416 643 5500 or Toll-Free North America: 1 800 387 0825 Email: [email protected] www.cibcmellon.com
COMMON SHARESListed on the Toronto Stock ExchangeStock Symbol – TIH
This annual report was printed in Canada on stock manufactured totally chlorine-free with 10% postconsumer fibre.
Des
ign
and
Coo
rdin
atio
n: O
ve D
esig
n &
Com
mun
icat
ions
ww
w.o
ved
esig
n.co
m
Ed
itoria
l: B
arne
sMcI
nern
ey In
c.
2008
2008
2007
2006
2005
2004
Equipment Group Revenue ($ millions)
1,099.2
1,098.3
987.9
913.9
821.0
2008
2007
2006
2005
2004
Compression Group Revenue ($ millions)
1,022.0
788.4
758.3
671.0
594.5
2008
2007
2006
2005
2004
Equipment Group Operating Income ($ millions)
108.7
108.3
91.5
80.6
65.8
2008
2007
2006
2005
2004
Compression Group Operating Income ($ millions)
99.2
71.8
73.8
56.9
52.4
TOROMONT INDUSTRIES LTD. employs over 4,500 people in 128 locations, predominantly in Canada and the United States. Our common shares are listed on the Toronto Stock Exchange under the symbol TIH. We serve our customers through two business groups: Equipment and Compression.
We sell, rent and service a broad range of mobile equipment and industrial engines through our Caterpillar dealership and Battlefield – The CAT Rental Store in Ontario, Manitoba, Newfoundland, and most of Labrador and Nunavut.
Estimated Market: $5 billionDrivers: Housing and other development spending, infrastructure, mining and aggregate, marine and electric power.Opportunities: Product support growth, infrastructure initiatives, crushing, mine expansion and Great Lakes fleet repower.Strengths: Market leadership with Caterpillar the world’s leading equipment manufacturer, market coverage, customer support and skilled workforce.
We design, engineer, fabricate, install and service natural gas compression units and hydrocarbon and petrochemical process systems through Toromont Energy Systems and industrial and recreational refrigeration systems through CIMCO Refrigeration.
Estimated Market: $11 billionDrivers: Capital spending on natural gas production from well head through gathering and pipelines to storage, hydro carbon processing activities, and maintenance and construction of recreational and industrial refrigeration facilities.Opportunities: U.S. market penetration, product support growth, unconventional natural gas development, international markets.Strengths: Value-added engineering, strategic fabrication capabilities in the U.S. and Canada, branch coverage, international project management, strong alliances, decades of experience and product representation, and a skilled workforce.
Equipment Group Compression Group

TOROMONT INDUSTRIES LTD.Corporate Office3131 Highway 7 WestP.O. Box 5511Concord ON L4K 1B7Tel: 416 667 5511www.toromont.com
PROVEN STEADY GROWTH | 2008 ANNUAL REPORT
POWER ONGenerating new opportunities | Pg 16
PAVING THE ROAD TO THE FUTUREThe multi-billion dollar promise | Pg 12
PROGRESS REPORT: TESI IN THE U.S.Benefiting from long-term focus | Pg 06
TO
RO
MO
NT
IND
US
TR
IES
LTD
. 2008 AN
NU
AL R
EP
OR
T