Embed Size (px)
Citation preview

Progressing C-SAGD recovery of bitumen from the Grosmont D reservoir
Organized by:
LARICINA ENERGY
Steve Brand P. Eng.
WHOC15-280

Outline • Project overview
• 1D experience and knowledge gained
• Early cycle performance 3D well
• Modelling progress based on 3D results
• Summary

Forward-looking Statements Advisory
This Laricina Energy Ltd. (the “Company”) presentation contains certain forward-looking statements. Forward-looking statements may include, but are not limited to, statements concerning estimates of exploitable original-bitumen-in-place, predicted recovery factors, steam-to-oil ratios and well production rates, estimated recoverable resources as defined below, expected regulatory filing, review and approval dates, construction and start-up timelines and schedules, company project potential production volumes as well as comparisons to other projects, statements relating to the continued overall advancement of the Company’s projects, comparisons of recoverable resources to other oil sands projects, estimated relative supply costs, potential cost reductions, recovery and production increases resulting from the application of new technology and recovery schemes, estimates of carbon sequestration capacity, costs for carbon capture and sequestration and possible implementation schedule for carbon capture and sequestration processes or related emissions mitigation or reduction scheme and other statements which are not historical facts. You are cautioned not to place undue reliance on any forward-looking statements as there can be no assurance that the plans, intentions or expectations upon which they are based will occur. By their nature forward-looking statements involve numerous assumptions, known and unknown risks and uncertainties, both generally and specific, that contribute to the possibility that the predictions, forecasts, projections and other forward-looking statements will not occur. Although the Company believes that the expectations represented by such forward-looking statements are reasonable, there can be no assurance that such expectations will prove to be correct and, accordingly that actual results will be consistent with the forward-looking statements. Some of the risks and other factors that could cause results to differ materially from those expressed in the forward-looking statements contained in this presentation include, but are not limited to geological conditions relating to the Company’s properties, the impact of regulatory changes especially as such relate to royalties, taxation and environmental changes, the impact of technology on operations and processes and the performance of new technology expected to be applied or utilized by the Company; labour shortages; supply and demand metrics for oil and natural gas; the impact of pipeline capacity, upgrading capacity and refinery demand; general economic business and market conditions and such other risks and uncertainties described from time to time in the reports and filings made with security regulatory authorities, contained in other disclosure documents or otherwise provided by the Company. Furthermore the forward-looking statements contained in this presentation are made as of the date hereof. Unless required by law the Company does not undertake any obligation to update publicly or to revise any of the included forward-looking statements, whether as a result of new information, future events or otherwise. The forward-looking statements contained in this presentation are expressly qualified by this advisory and disclaimer.

Pilot Location and Geology
Laricina
Acreage
• Grosmont relative to the Wabiskaw
McMurray formation
• Laricina acreage is in the heart of a
significant resource
Grosmont

828 406
131
102
37
14 8
63 59
34 27
69
49
16 2
0
20
40
60
80
100
120
140
160
180
200
Init
ial V
olu
me In
-pla
ce (
bn
bb
l)
Source: Alberta Energy Regulator.
Grosmont Trend and Activity Map
• Increasing industry focus on the Grosmont Formation
• Second largest bitumen resource after McMurray
• Dolomitized carbonate platform
• Regionally extensive subcrop exposure
• Concentrated area of thick bitumen
• Resource capture with an exploration mindset
• Scale, quality and proximity to infrastructure
• Captured resource in the ‘sweet spot’ of the trend
*
Peace River Cold Lake Athabasca
Information based on AER filings

Project Description
• Saleski Pilot project – 1,800 bpd facility, approved
– Initially SAGD with transition to
SC-SAGD in stage 2
– Currently using cyclic thermal process
(C-SAGD)
Steam injection and production
through the same well
Alternate between injection and
production phases
Increasing steam injection volumes in
subsequent cycles
Longer production periods in
subsequent cycles
• Solvent Injection
Co-injection test performed in the C
in 2012
– 4 well pairs and 1 single cyclic well
2 well pairs in Grosmont D
1 single cyclic well in Grosmont D
2 well pairs in Grosmont C
– Grand Rapids water for steam
generation
– Grosmont and Cooking Lake disposal
zones
– Facility operating since Dec. 2010
6 NEXT STEPS
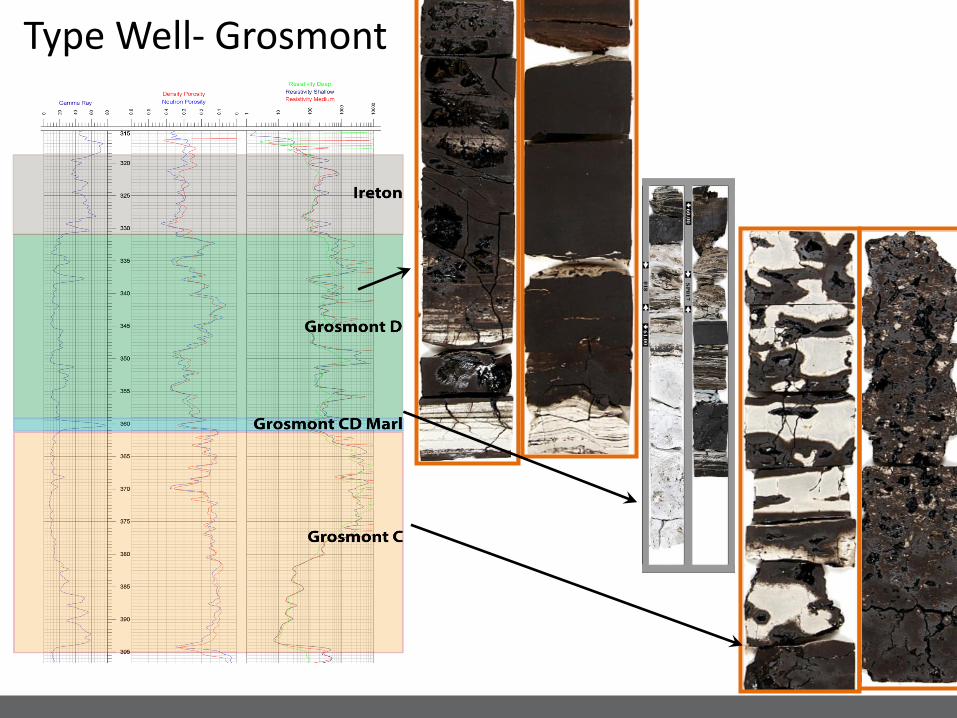
Type Well- Grosmont

Saleski Pilot Well Lay-out
115m 100m
1st Generation • Drilled with water, highly
overbalanced with no cuttings to surface
• Slotted liners run in the production section with acid washes
• D wells drilled this way: 1D and 2D.
2nd Generation • Drilled with foam near
balanced pressure to minimize fluid/cuttings losses, all cuttings back to surface
• No liner along production section with selective (packers) stimulation
• D well drilled this way: 3D

C-SAGD
green: bitumen blue: water red: steam brown: heated matrix
Initial C-SAGD injection
C-SAGD production
Cyclic Steam-Assisted Gravity Drainage • Steam injection pressure < fracture pressure • Gravity dominates flow (solution gas drive/thermal expansion also contribute)

Conversion from SAGD to C-SAGD
1D Performance CDOR
(m3/day) Peak rate (m3/day)
Cycle SOR
SAGD Dec 2010 – Jan 2012 3 37 36 Cycle 1 Feb 2012 – May 2012 13 67 19 Cycle 2 July 2012 – Sept 2012 25 111 1.6 Cycle 3 Oct 2012 – Jan 2013 28 89 2.9 Cycle 4 Jan 2013 – Present 15 61 1.9 Life to date
2010 - 2015 12 111 5.5
• Acid stimulation improved pressure differential between producer and injector
• Conversion to C-SAGD resulted in better oil rates and SOR
• Ongoing production continuing with benefit from underlying C heat

Communication through the CD Marl
• Direct steam communication from 1C to 1D resulted in rapid temperature increase
• Increased temperature at the toe of 1D following shut-in indicates heat communication from below

2nd Generation Saleski D Well Main Objective: Optimize production from Grosmont D by drilling a new generation D well
1D Well 3D Well
Well Length 800m 800m
Formation 1-2m above Marl
Below the fractured mudstone layer
3-4m above Marl
Above the fractured mudstone layer
Drilling Over Balanced Near Balanced
Completion Slotted Liner Perforated Liner
Acidization After Steaming/Production
Bullheaded at heel and toe
Before Steaming
Staged open-hole

• Well 3D began production in Q2 2014
• Peak oil production rate of 820 bbl/d (gross)
• SOR of 6.4 and calendar day oil rate of 110 bbl/d over first four cycles
3D Well Performance
Cycle 1 2 3 4
Cycle CDOR (bbl/d)
154 118 93 98
Cycle SOR 5.5 5.5 8.0 6.7
Notes: BHT refers to bottom hole temperature BHP refers to bottom hole pressure
Predictable injection rate increase with progressive cycles

Modelling Approach
• Started with the question, if fractures were less prominent in the Grosmont D, could we model it like a clastic?
• Utilized a single porosity model (inter-granular porosity only)

History Match – Single Porosity Model
Single porosity model missed the early peak

Well 3D FMI Fracture Interpretation
HEF: 36 healed fractures 76 open fractures
BEICIP: 5 healed fractures 177 open fractures
Heel
Toe

History Match – Dual Permeability Model
Dual porosity model produced earlier

Cycle 3 – End of Injection Single Porosity Model Dual Perm Model - Matrix Dual Perm Model - Fracture Temperature
Oil Saturation Single Porosity Model Dual Perm Model - Matrix Dual Perm Model - Fracture
Steam injection shaped by fracture system
Uniform heat and oil drainage profile

Cycle 3 – End of Production Single Porosity Model Dual Perm Model - Matrix Dual Perm Model - Fracture Temperature
Oil Saturation Single Porosity Model Dual Perm Model - Matrix Dual Perm Model - Fracture
Uniform heat and oil drainage profile
Matrix production shaped by fracture drainage

Oil Rate vs Temp
Field data indicates a repeated trend of peak production occurring at 150oC with a decline in peak rate cycle over cycle
Dual permeability model has replicated this production trend.

Summary
• C-SAGD potential is established at the Saleski Pilot
• Potential to co-develop the Grosmont C and D has also been demonstrated
– Long duration production cycle from 1D benefitting from C heat
• A new Grosmont D well, 3D, has presented an opportunity to evaluate standalone D potential
• Modelling of the Grosmont D requires consideration of both matrix and fracture permeability
• Ongoing modelling work can continue to refine the potential of the Grosmont D