Embed Size (px)
Citation preview
Project CLEAN AIR
“Quick” Business Guide
Organizers:
Consultant:Environmental Resources Management
www.cleanair.hk
"I know that our business community has taken the
initiative to sign a Clean Air Charter." (Policy Address, Oct 2005)
"I am very happy about that. That's a very important
scheme!" (Joint Chambers Luncheon, 17 Oct 2005)
"I commend the HKGCC for this initiative (Project Clean
Air) and I look forward to seeing more companies making a
contribution to cleaner air for all." (Newspaper supplements, 21 Oct 2005)
"I am much encouraged by the initiative taken by the
business community to sign a Clean Air Charter." (HKGCC 145th Anniversary Dinner, 25 Apr 2006. Mr Tsang also called on the Chamber to encourage more companies to adopt green initiatives)
(Referring to Hong Kong businesses with operations in the PRD)
"They should sign the Charter and clean up their factories." (Hong Kong Association of Banks Luncheon, 26 Apr 2006)
The Hon Donald Tsang
The Chief Executive
Project CLEAN AIR “Quick” Business Guide
CONTENTS
1 INTRODUCTION 1
1.1 CLEAN AIR CHARTER 1 1.2 "QUICK" BUSINESS GUIDE 2 1.3 SME PILOT SCHEME & BUSINESS GUIDEBOOK 2
2 IDENTIFYING AIR POLLUTANTS 3
2.1 COMPANY AND BUSINESS INFORMATION 3 2.2 IDENTIFIYING AIR POLLUTION 3
3 AIR QUALITY STANDARDS & HEALTH EFFECTS OF MAJOR AIR POLLUTANTS 5
3.1 HONG KONG 5 3.2 MAINLAND CHINA 8 3.3 INTERNATIONAL AIR QUALITY STANDARDS 8 3.4 AIR POLLUTANTS AND HEALTH EFFECTS 9
4 CONTINUOUS EMISSION MONITORING SYSTEM (CEMS) 11
4.1 WHAT IS CEMS? 11
5 QUANTIFICATION OF AIR EMISSIONS 12
5.1 ESTIMATION OF EMISSION RATE USING INTERNATIONAL FORMULA 12 5.2 ENERGY AUDIT 14 5.3 CONTINUOUS EMISSION MONITORING SYSTEMS (CEMS) 15 5.4 REGULAR EMISSION MONITORING OR AMBIENT AIR QUALITY MONITORING 15
6 EMISSION CONTROL MEASURES 16
6.1 GENERAL MEASURES 16 6.2 INDOOR ENVIRONMENT AND ENERGY CONSUMED IN OFFICES 17 6.3 MEASURES TO REDUCE STACK EMISSIONS 19 6.4 MEASURES TO REDUCE VEHICLE EMISSIONS 22
7 IMPLEMENTATION 23
Appendix Preliminary Air Emission and Energy Audit Checklist 24
1
1 INTRODUCTION
The Hong Kong General Chamber of Commerce (HKGCC) and the Hong Kong Business Coalition on the Environment (HKBCE) are driving a business-led initiative – Project CLEAN AIR – to combat air pollution with the goal of improving the quality of air in the Greater Pearl River Delta. The focal point of the Project is the Clean Air Charter, which is supported by a range of public campaigns and outreach programs to engage the government, business sector and the community in a collective effort.
1.1 CLEAN AIR CHARTER
The HKGCC and the HKBCE have joined forces with the Greater Pearl River Delta Business Council, the China Council for the Promotion of International Trade – Guangdong Sub-Council and the Guangdong Association of Environmental Protection Industry to encourage Hong Kong and Guangdong companies to collaborate and implement the Clean Air Charter on a voluntary basis. Currently, over 200 business organizations and companies have endorsed the Charter.
The Charter lists six commitments in which businesses can help reduce air pollution. These are: Statement of Commitment Implementation
1. Operate to a recognized world class standard, or the standards established by the Hong Kong / Guangdong governments on emissions of air pollutants, even if it is not a requirement to do so here.
Each participant can identify the relevant standard, and if not meeting it today, make plans to meet it. Participants with significant emissions should state which standard they are operating by, and how they are performing relative to that standard. Participants that are working towards a better standard can also disclose differences between their performance today and the better standards, as well as their plans and schedule for meeting it.
2. Use continuous emissions monitors (CEMs) at significant sources, e.g. large and medium plants.
Each participant can identify their own significant sources, and if not monitoring today, make plans to do so. These participants should state their intentions.
3. Publish information on energy and fuel use, as well as total emissions of air pollutants annually and timely, if emissions are significant.
Each participant can determine whether they have significant emissions, and if so, determine how to quantify them. They should publish information on their energy and fuel use, as well as air pollution emissions, as part of their regular environmental reporting, or as a special environmental report on air quality.
4. Undertake to adopt energy-efficient measures in their operations.
Each participant can identify energy-efficient measures and formulate a plan to implement these measures in their business operations.
5. Identify and encourage business-relevant measures to be taken on days when air pollution is high.
Each participant can determine how they can reduce emissions on days of high pollution, such as promoting use of public transportation, by working with their customers or vendors to reduce emissions elsewhere in the value chain, by substituting a different process, material or equipment at their own facilities, or by re-scheduling things that could be done at another time.
6. Share air quality expertise in business with others.
Participants that have expertise, particularly on any of the above items, can host visits or make other arrangements for their staff to share what is relevant to others.
2
1.2 “QUICK” BUSINESS GUIDE
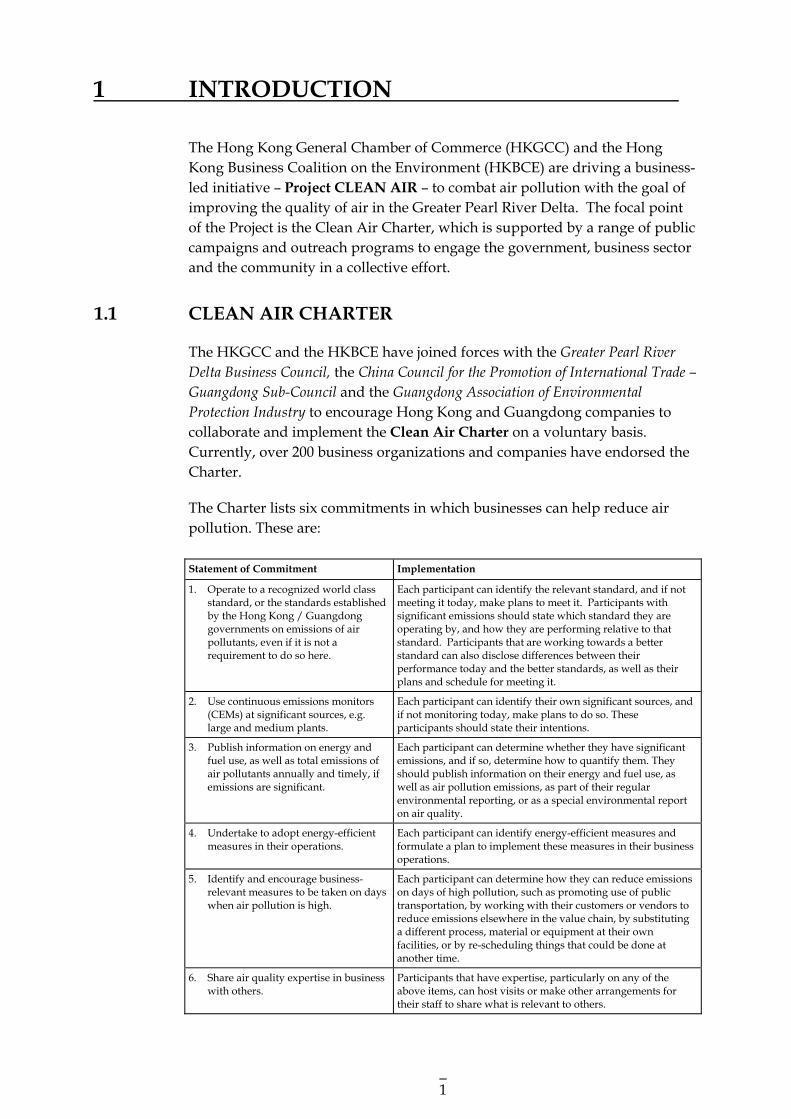
To assist Charter signatories to implement or achieve the six Commitments, this “Quick” Business Guide has been developed to provide a step-by-step process for businesses to follow.
1.3 SME PILOT SCHEME & BUSINESS GUIDEBOOK
We are conducting a SME Pilot Scheme to evaluate the costs and benefits of implementing emission reduction and air quality management. The results of the Pilot Scheme will be supplemented to this Guide to produce a “Clean Air Business Guidebook”.
Section 7 Implementation
Section 2 Identification of typical air pollutants
Commitment #1
Commitment #3
Commitments #4, #5 & #6
Commitment #2 Section 4
Continuous Emission Monitoring System (CEMS)
Section 3 Air quality standards &
health effects of major pollutants
Section 5 Quantification of air emissions
Section 6 Measures to reduce air emissions
3
2 IDENTIFIYING AIR POLLUTANTS
To develop an emissions reduction plan, companies should identify the key pollutants that they produce.
2.1 COMPANY AND BUSINESS INFORMATION
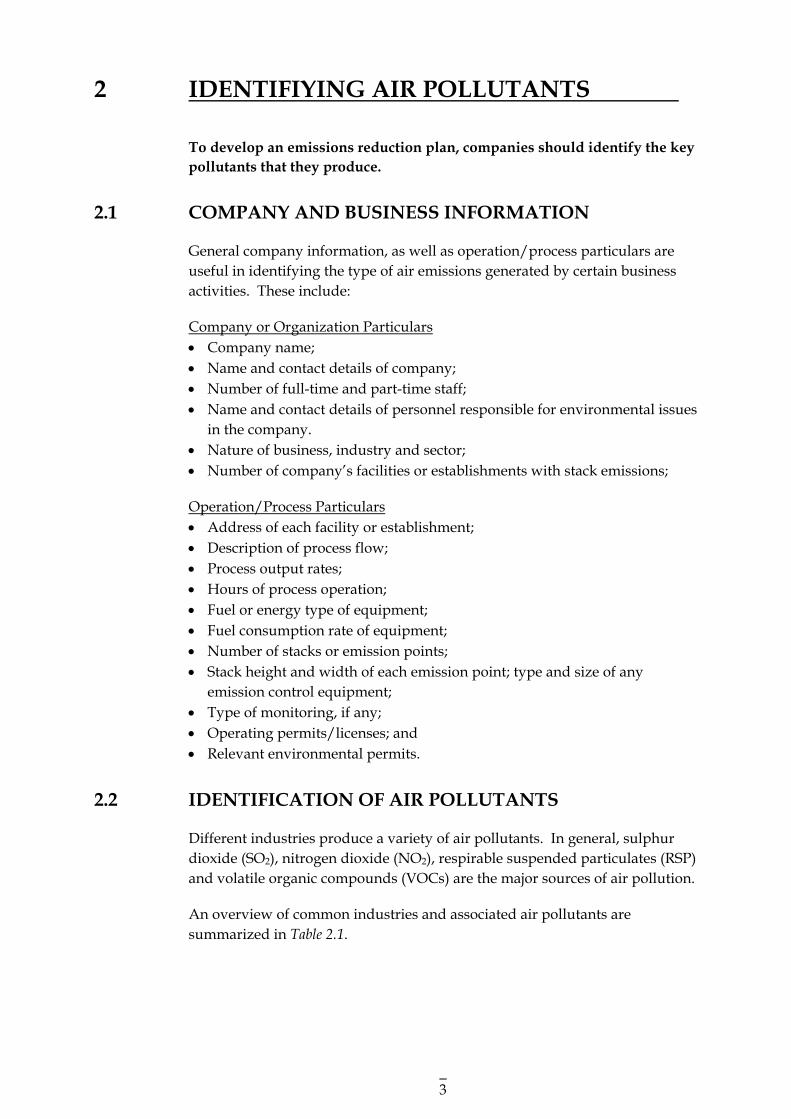
General company information, as well as operation/process particulars are useful in identifying the type of air emissions generated by certain business activities. These include:
Company or Organization Particulars • Company name; • Name and contact details of company; • Number of full-time and part-time staff; • Name and contact details of personnel responsible for environmental issues
in the company. • Nature of business, industry and sector; • Number of company’s facilities or establishments with stack emissions;
Operation/Process Particulars • Address of each facility or establishment; • Description of process flow; • Process output rates; • Hours of process operation; • Fuel or energy type of equipment; • Fuel consumption rate of equipment; • Number of stacks or emission points; • Stack height and width of each emission point; type and size of any
emission control equipment; • Type of monitoring, if any; • Operating permits/licenses; and • Relevant environmental permits.
2.2 IDENTIFICATION OF AIR POLLUTANTS
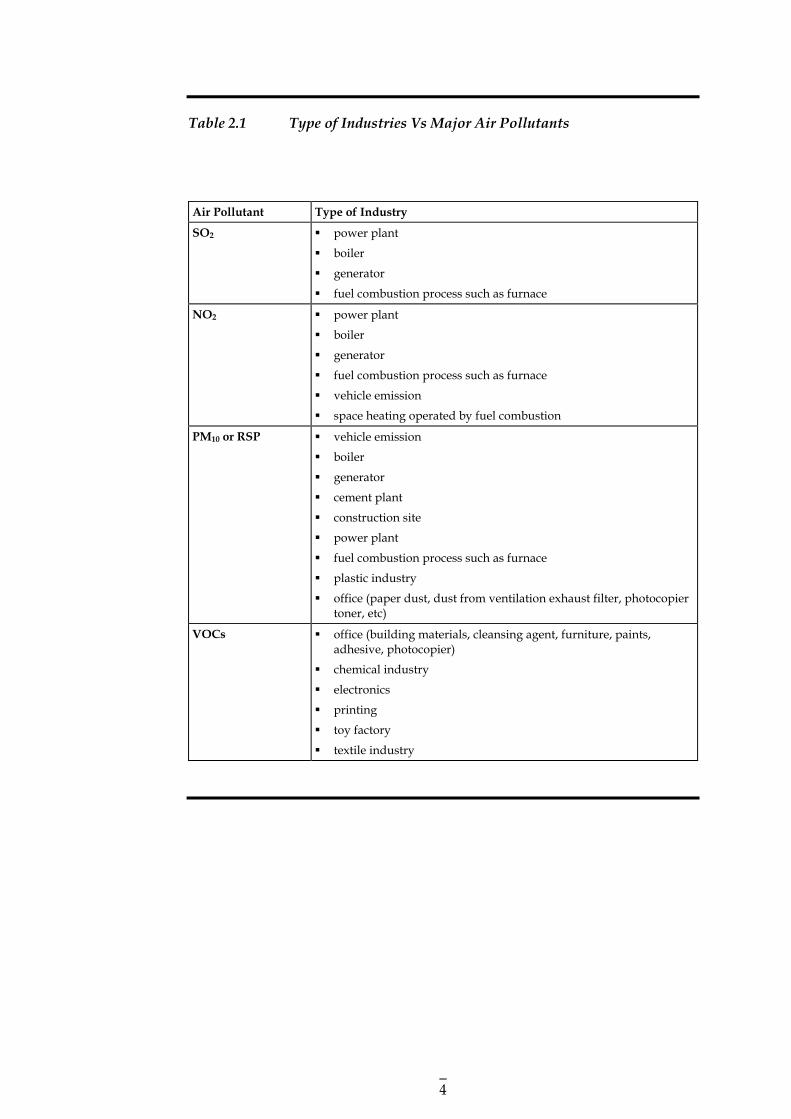
Different industries produce a variety of air pollutants. In general, sulphur dioxide (SO2), nitrogen dioxide (NO2), respirable suspended particulates (RSP) and volatile organic compounds (VOCs) are the major sources of air pollution.
An overview of common industries and associated air pollutants are summarized in Table 2.1.
4
Table 2.1 Type of Industries Vs Major Air Pollutants
Air Pollutant Type of Industry
SO2 power plant
boiler
generator
fuel combustion process such as furnace
NO2 power plant
boiler
generator
fuel combustion process such as furnace
vehicle emission
space heating operated by fuel combustion
PM10 or RSP vehicle emission
boiler
generator
cement plant
construction site
power plant
fuel combustion process such as furnace
plastic industry
office (paper dust, dust from ventilation exhaust filter, photocopier toner, etc)
VOCs office (building materials, cleansing agent, furniture, paints, adhesive, photocopier)
chemical industry
electronics
printing
toy factory
textile industry
5
3 AIR QUALITY STANDARDS & HEALTH EFFECTS OF MAJOR AIR POLLUTANTS
Clean Air Charter - Commitment #1 Operate to a recognized world class standard, or the standards established by the Hong Kong / Guangdong governments on emissions of air pollutants, even if it is not a requirement to do so here.
This section provides an overview of air quality standards or air emission limits established in Hong Kong, Mainland China and also other countries.
3.1 HONG KONG
3.1.1 Ambient Air Quality Standards
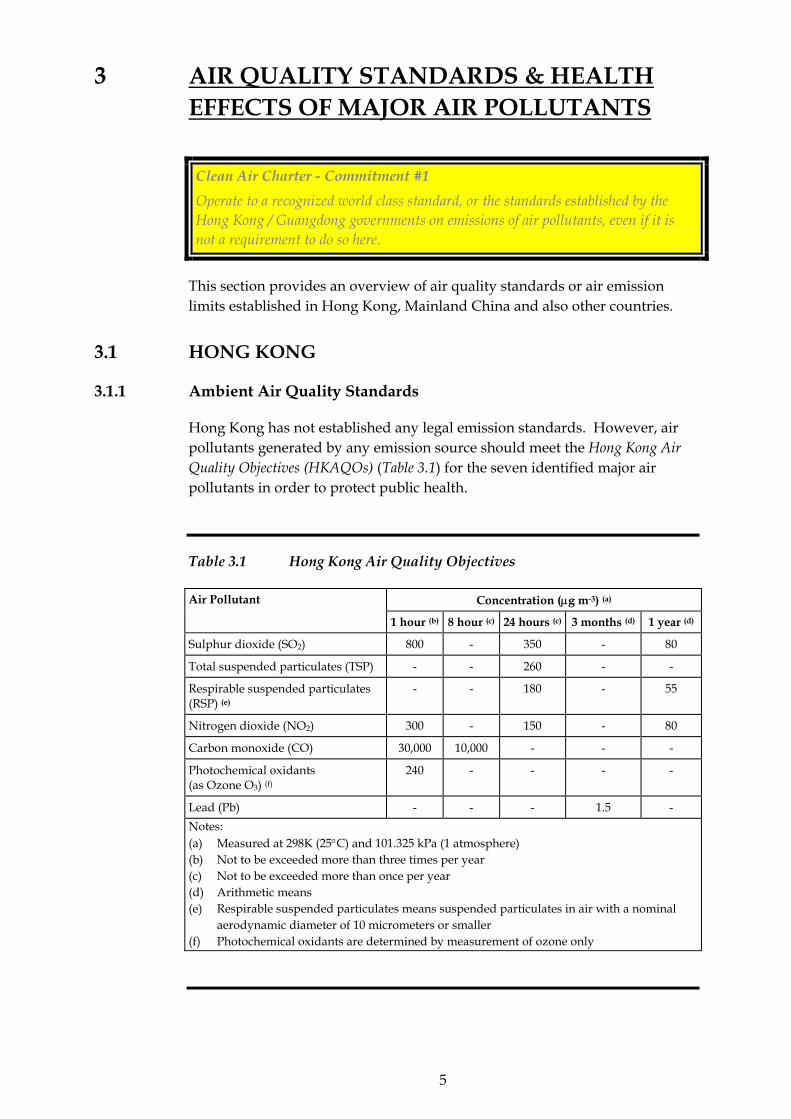
Hong Kong has not established any legal emission standards. However, air pollutants generated by any emission source should meet the Hong Kong Air Quality Objectives (HKAQOs) (Table 3.1) for the seven identified major air pollutants in order to protect public health.
Table 3.1 Hong Kong Air Quality Objectives
Concentration (µg m-3) (a) Air Pollutant
1 hour (b) 8 hour (c) 24 hours (c) 3 months (d) 1 year (d)
Sulphur dioxide (SO2) 800 - 350 - 80
Total suspended particulates (TSP) - - 260 - -
Respirable suspended particulates (RSP) (e)
- - 180 - 55
Nitrogen dioxide (NO2) 300 - 150 - 80
Carbon monoxide (CO) 30,000 10,000 - - -
Photochemical oxidants (as Ozone O3) (f)
240 - - - -
Lead (Pb) - - - 1.5 - Notes: (a) Measured at 298K (25°C) and 101.325 kPa (1 atmosphere) (b) Not to be exceeded more than three times per year (c) Not to be exceeded more than once per year (d) Arithmetic means (e) Respirable suspended particulates means suspended particulates in air with a nominal
aerodynamic diameter of 10 micrometers or smaller (f) Photochemical oxidants are determined by measurement of ozone only
6
3.1.2 Indoor Air Quality Standards
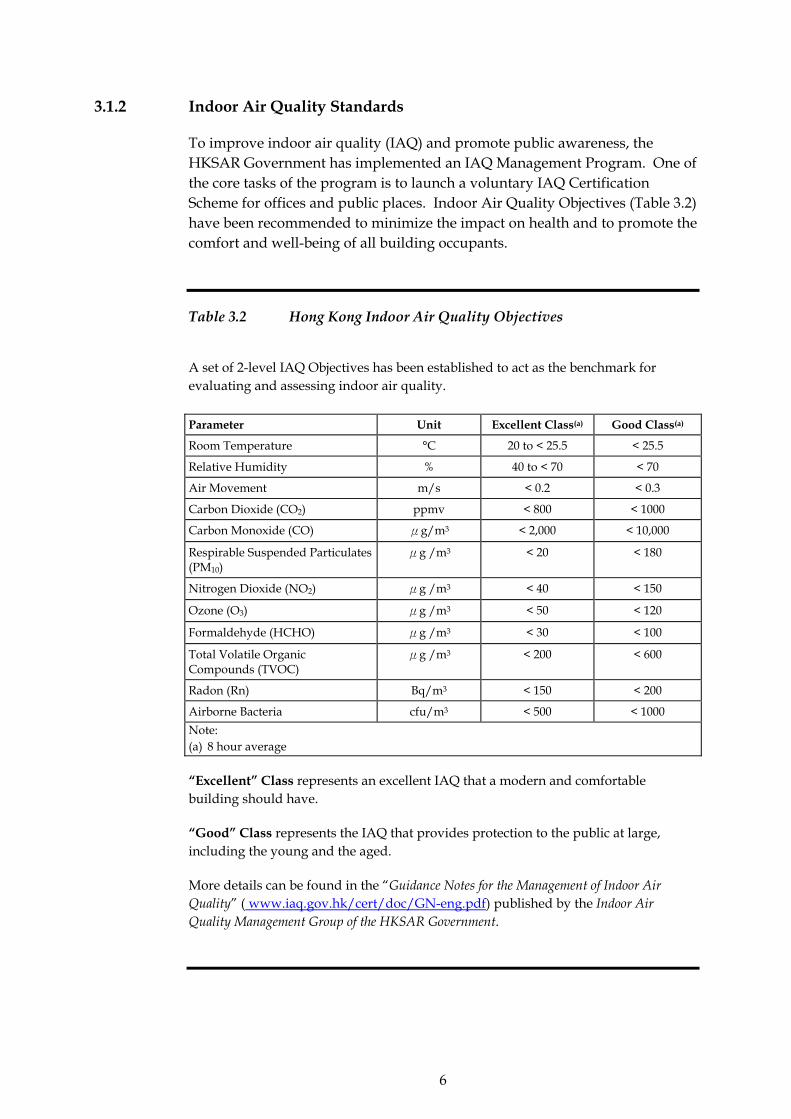
To improve indoor air quality (IAQ) and promote public awareness, the HKSAR Government has implemented an IAQ Management Program. One of the core tasks of the program is to launch a voluntary IAQ Certification Scheme for offices and public places. Indoor Air Quality Objectives (Table 3.2) have been recommended to minimize the impact on health and to promote the comfort and well-being of all building occupants.
Table 3.2 Hong Kong Indoor Air Quality Objectives
A set of 2-level IAQ Objectives has been established to act as the benchmark for evaluating and assessing indoor air quality. Parameter Unit Excellent Class(a) Good Class(a)
Room Temperature °C 20 to < 25.5 < 25.5
Relative Humidity % 40 to < 70 < 70
Air Movement m/s < 0.2 < 0.3
Carbon Dioxide (CO2) ppmv < 800 < 1000
Carbon Monoxide (CO) μg/m3 < 2,000 < 10,000
Respirable Suspended Particulates (PM10)
μg /m3 < 20 < 180
Nitrogen Dioxide (NO2) μg /m3 < 40 < 150
Ozone (O3) μg /m3 < 50 < 120
Formaldehyde (HCHO) μg /m3 < 30 < 100
Total Volatile Organic Compounds (TVOC)
μg /m3 < 200 < 600
Radon (Rn) Bq/m3 < 150 < 200
Airborne Bacteria cfu/m3 < 500 < 1000 Note: (a) 8 hour average
“Excellent” Class represents an excellent IAQ that a modern and comfortable building should have.
“Good” Class represents the IAQ that provides protection to the public at large, including the young and the aged.
More details can be found in the “Guidance Notes for the Management of Indoor Air Quality” ( www.iaq.gov.hk/cert/doc/GN-eng.pdf) published by the Indoor Air Quality Management Group of the HKSAR Government.
7
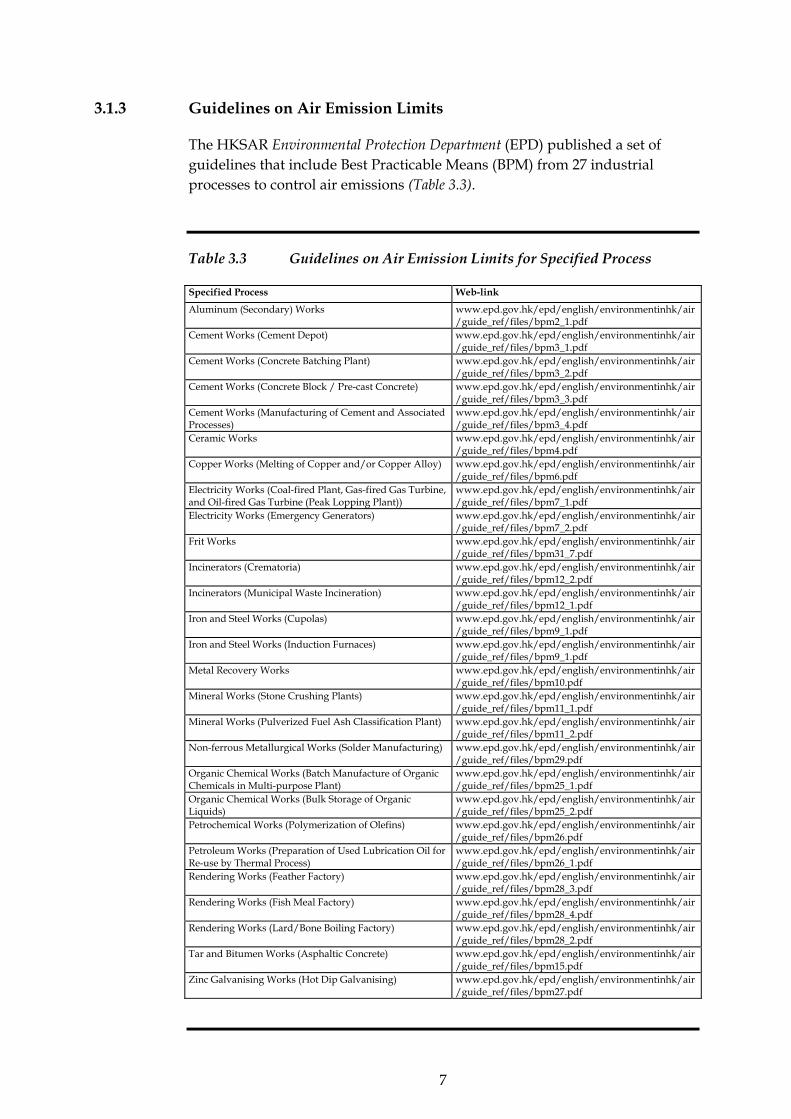
3.1.3 Guidelines on Air Emission Limits
The HKSAR Environmental Protection Department (EPD) published a set of guidelines that include Best Practicable Means (BPM) from 27 industrial processes to control air emissions (Table 3.3).
Table 3.3 Guidelines on Air Emission Limits for Specified Process
Specified Process Web-link
Aluminum (Secondary) Works www.epd.gov.hk/epd/english/environmentinhk/air/guide_ref/files/bpm2_1.pdf
Cement Works (Cement Depot) www.epd.gov.hk/epd/english/environmentinhk/air/guide_ref/files/bpm3_1.pdf
Cement Works (Concrete Batching Plant) www.epd.gov.hk/epd/english/environmentinhk/air/guide_ref/files/bpm3_2.pdf
Cement Works (Concrete Block / Pre-cast Concrete) www.epd.gov.hk/epd/english/environmentinhk/air/guide_ref/files/bpm3_3.pdf
Cement Works (Manufacturing of Cement and Associated Processes)
www.epd.gov.hk/epd/english/environmentinhk/air/guide_ref/files/bpm3_4.pdf
Ceramic Works www.epd.gov.hk/epd/english/environmentinhk/air/guide_ref/files/bpm4.pdf
Copper Works (Melting of Copper and/or Copper Alloy) www.epd.gov.hk/epd/english/environmentinhk/air/guide_ref/files/bpm6.pdf
Electricity Works (Coal-fired Plant, Gas-fired Gas Turbine, and Oil-fired Gas Turbine (Peak Lopping Plant))
www.epd.gov.hk/epd/english/environmentinhk/air/guide_ref/files/bpm7_1.pdf
Electricity Works (Emergency Generators) www.epd.gov.hk/epd/english/environmentinhk/air/guide_ref/files/bpm7_2.pdf
Frit Works www.epd.gov.hk/epd/english/environmentinhk/air/guide_ref/files/bpm31_7.pdf
Incinerators (Crematoria) www.epd.gov.hk/epd/english/environmentinhk/air/guide_ref/files/bpm12_2.pdf
Incinerators (Municipal Waste Incineration) www.epd.gov.hk/epd/english/environmentinhk/air/guide_ref/files/bpm12_1.pdf
Iron and Steel Works (Cupolas) www.epd.gov.hk/epd/english/environmentinhk/air/guide_ref/files/bpm9_1.pdf
Iron and Steel Works (Induction Furnaces) www.epd.gov.hk/epd/english/environmentinhk/air/guide_ref/files/bpm9_1.pdf
Metal Recovery Works www.epd.gov.hk/epd/english/environmentinhk/air/guide_ref/files/bpm10.pdf
Mineral Works (Stone Crushing Plants) www.epd.gov.hk/epd/english/environmentinhk/air/guide_ref/files/bpm11_1.pdf
Mineral Works (Pulverized Fuel Ash Classification Plant) www.epd.gov.hk/epd/english/environmentinhk/air/guide_ref/files/bpm11_2.pdf
Non-ferrous Metallurgical Works (Solder Manufacturing) www.epd.gov.hk/epd/english/environmentinhk/air/guide_ref/files/bpm29.pdf
Organic Chemical Works (Batch Manufacture of Organic Chemicals in Multi-purpose Plant)
www.epd.gov.hk/epd/english/environmentinhk/air/guide_ref/files/bpm25_1.pdf
Organic Chemical Works (Bulk Storage of Organic Liquids)
www.epd.gov.hk/epd/english/environmentinhk/air/guide_ref/files/bpm25_2.pdf
Petrochemical Works (Polymerization of Olefins) www.epd.gov.hk/epd/english/environmentinhk/air/guide_ref/files/bpm26.pdf
Petroleum Works (Preparation of Used Lubrication Oil for Re-use by Thermal Process)
www.epd.gov.hk/epd/english/environmentinhk/air/guide_ref/files/bpm26_1.pdf
Rendering Works (Feather Factory) www.epd.gov.hk/epd/english/environmentinhk/air/guide_ref/files/bpm28_3.pdf
Rendering Works (Fish Meal Factory) www.epd.gov.hk/epd/english/environmentinhk/air/guide_ref/files/bpm28_4.pdf
Rendering Works (Lard/Bone Boiling Factory) www.epd.gov.hk/epd/english/environmentinhk/air/guide_ref/files/bpm28_2.pdf
Tar and Bitumen Works (Asphaltic Concrete) www.epd.gov.hk/epd/english/environmentinhk/air/guide_ref/files/bpm15.pdf
Zinc Galvanising Works (Hot Dip Galvanising) www.epd.gov.hk/epd/english/environmentinhk/air/guide_ref/files/bpm27.pdf
8
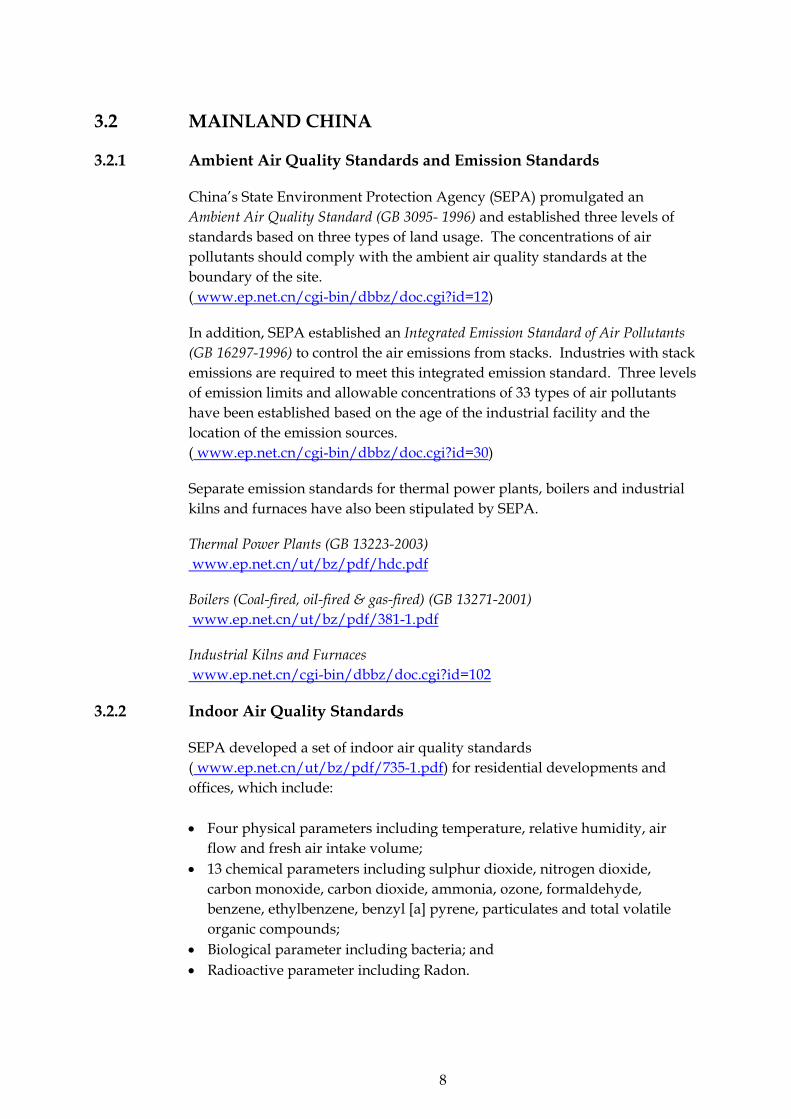
3.2 MAINLAND CHINA
3.2.1 Ambient Air Quality Standards and Emission Standards
China’s State Environment Protection Agency (SEPA) promulgated an Ambient Air Quality Standard (GB 3095- 1996) and established three levels of standards based on three types of land usage. The concentrations of air pollutants should comply with the ambient air quality standards at the boundary of the site. ( www.ep.net.cn/cgi-bin/dbbz/doc.cgi?id=12)
In addition, SEPA established an Integrated Emission Standard of Air Pollutants (GB 16297-1996) to control the air emissions from stacks. Industries with stack emissions are required to meet this integrated emission standard. Three levels of emission limits and allowable concentrations of 33 types of air pollutants have been established based on the age of the industrial facility and the location of the emission sources. ( www.ep.net.cn/cgi-bin/dbbz/doc.cgi?id=30)
Separate emission standards for thermal power plants, boilers and industrial kilns and furnaces have also been stipulated by SEPA.
Thermal Power Plants (GB 13223-2003) www.ep.net.cn/ut/bz/pdf/hdc.pdf
Boilers (Coal-fired, oil-fired & gas-fired) (GB 13271-2001) www.ep.net.cn/ut/bz/pdf/381-1.pdf
Industrial Kilns and Furnaces www.ep.net.cn/cgi-bin/dbbz/doc.cgi?id=102
3.2.2 Indoor Air Quality Standards
SEPA developed a set of indoor air quality standards ( www.ep.net.cn/ut/bz/pdf/735-1.pdf) for residential developments and offices, which include: • Four physical parameters including temperature, relative humidity, air
flow and fresh air intake volume; • 13 chemical parameters including sulphur dioxide, nitrogen dioxide,
carbon monoxide, carbon dioxide, ammonia, ozone, formaldehyde, benzene, ethylbenzene, benzyl [a] pyrene, particulates and total volatile organic compounds;
• Biological parameter including bacteria; and • Radioactive parameter including Radon.
9
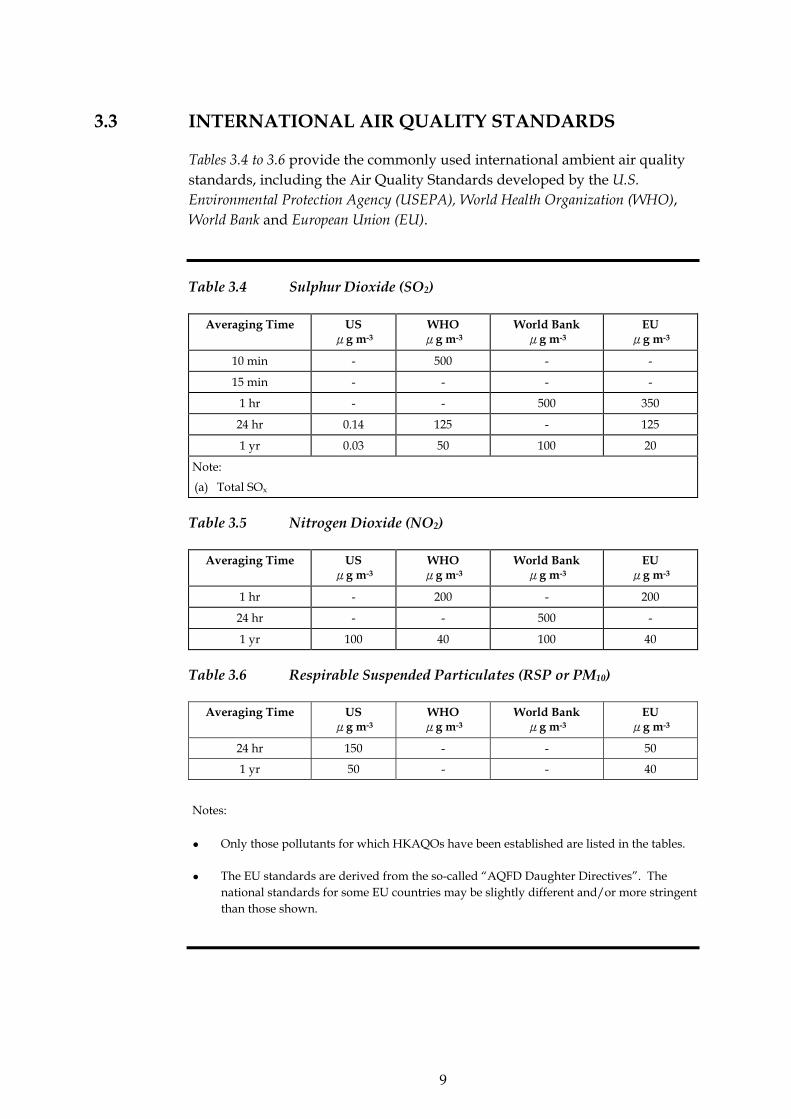
3.3 INTERNATIONAL AIR QUALITY STANDARDS
Tables 3.4 to 3.6 provide the commonly used international ambient air quality standards, including the Air Quality Standards developed by the U.S. Environmental Protection Agency (USEPA), World Health Organization (WHO), World Bank and European Union (EU).
Table 3.4 Sulphur Dioxide (SO2)
Averaging Time US μg m-3
WHO μg m-3
World Bank μg m-3
EU μg m-3
10 min - 500 - -
15 min - - - -
1 hr - - 500 350
24 hr 0.14 125 - 125
1 yr 0.03 50 100 20
Note:
(a) Total SOx
Table 3.5 Nitrogen Dioxide (NO2)
Averaging Time US μg m-3
WHO μg m-3
World Bank μg m-3
EU μg m-3
1 hr - 200 - 200
24 hr - - 500 -
1 yr 100 40 100 40
Table 3.6 Respirable Suspended Particulates (RSP or PM10)
Averaging Time US
μg m-3 WHO μg m-3
World Bank μg m-3
EU μg m-3
24 hr 150 - - 50
1 yr 50 - - 40
Notes:
Only those pollutants for which HKAQOs have been established are listed in the tables.
The EU standards are derived from the so-called “AQFD Daughter Directives”. The national standards for some EU countries may be slightly different and/or more stringent than those shown.
10
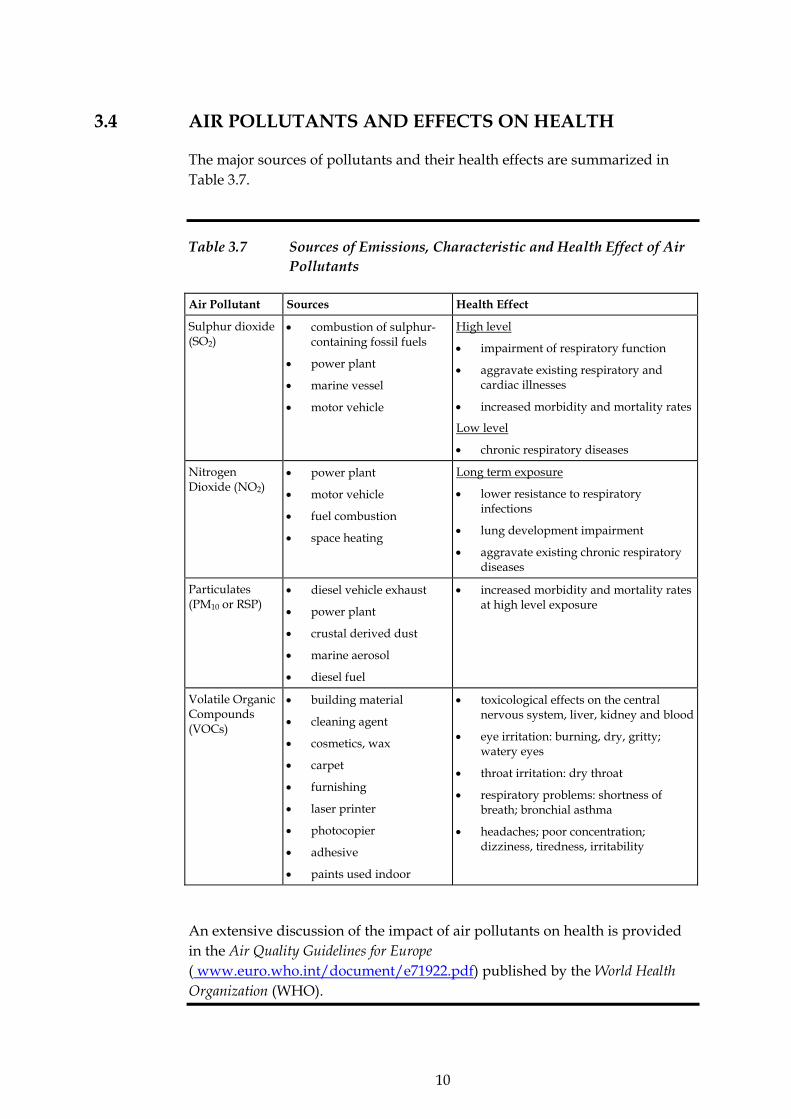
3.4 AIR POLLUTANTS AND EFFECTS ON HEALTH
The major sources of pollutants and their health effects are summarized in Table 3.7.
Table 3.7 Sources of Emissions, Characteristic and Health Effect of Air Pollutants
Air Pollutant Sources Health Effect
Sulphur dioxide (SO2)
• combustion of sulphur-containing fossil fuels
• power plant
• marine vessel
• motor vehicle
High level
• impairment of respiratory function
• aggravate existing respiratory and cardiac illnesses
• increased morbidity and mortality rates
Low level
• chronic respiratory diseases
Nitrogen Dioxide (NO2)
• power plant
• motor vehicle
• fuel combustion
• space heating
Long term exposure
• lower resistance to respiratory infections
• lung development impairment
• aggravate existing chronic respiratory diseases
Particulates (PM10 or RSP)
• diesel vehicle exhaust
• power plant
• crustal derived dust
• marine aerosol
• diesel fuel
• increased morbidity and mortality rates at high level exposure
Volatile Organic Compounds (VOCs)
• building material
• cleaning agent
• cosmetics, wax
• carpet
• furnishing
• laser printer
• photocopier
• adhesive
• paints used indoor
• toxicological effects on the central nervous system, liver, kidney and blood
• eye irritation: burning, dry, gritty; watery eyes
• throat irritation: dry throat
• respiratory problems: shortness of breath; bronchial asthma
• headaches; poor concentration; dizziness, tiredness, irritability
An extensive discussion of the impact of air pollutants on health is provided in the Air Quality Guidelines for Europe ( www.euro.who.int/document/e71922.pdf) published by the World Health Organization (WHO).
11
4 CONTINUOUS EMISSION MONITORING SYSTEM (CEMS)
Clean Air Charter - Commitment #2 Use continuous emissions monitors (CEMs) at significant sources, e.g. large and medium plants.
This commitment is relevant to industries and facilities that generate significant air emissions. Besides, facilities that participate in emissions trading programs are often required to have Continuous Emission Monitoring System (CEMS) to ensure a more consistent approach to emissions accounting.
4.1 WHAT IS CEMS?
CEMS generally refers to a packaged system of gas analyzers, gas sampling systems, temperature, flow and opacity monitors that are integrated with a data acquisition system to demonstrate environmental regulatory compliance of various industrial sources of air pollutants. Technical requirements and approved analytical techniques for continuous emission monitoring systems are available on the U.S. Environmental Protection Agency (US EPA) website: www.epa.gov/airmarkets/monitoring/polman/polman_oct_28_2003_vol1.pdf.
The most widely used type of continuous emissions monitoring is an extractive CEMS, in which a sample of gas is continuously drawn from the process point, filtered, transported, conditioned and presented to a gas analysis system. Gas concentrations are measured, recorded and stored as data. The data is used to generate reports, alarms or control some aspect of the industrial process.
CEMS is a useful tool in gathering process emissions data for environmental compliance demonstration, and process control and optimization.
Generally, all facilities are encouraged to use CEMS. However, as the investment and maintenance cost of CEMS is high, CEMS is generally more suitable for large industries (e.g. power plant) or those industries that will emit high levels of air pollutants or air toxins such as incineration facilities, cement plants, etc.
12
5 QUANTIFICATION OF AIR EMISSIONS
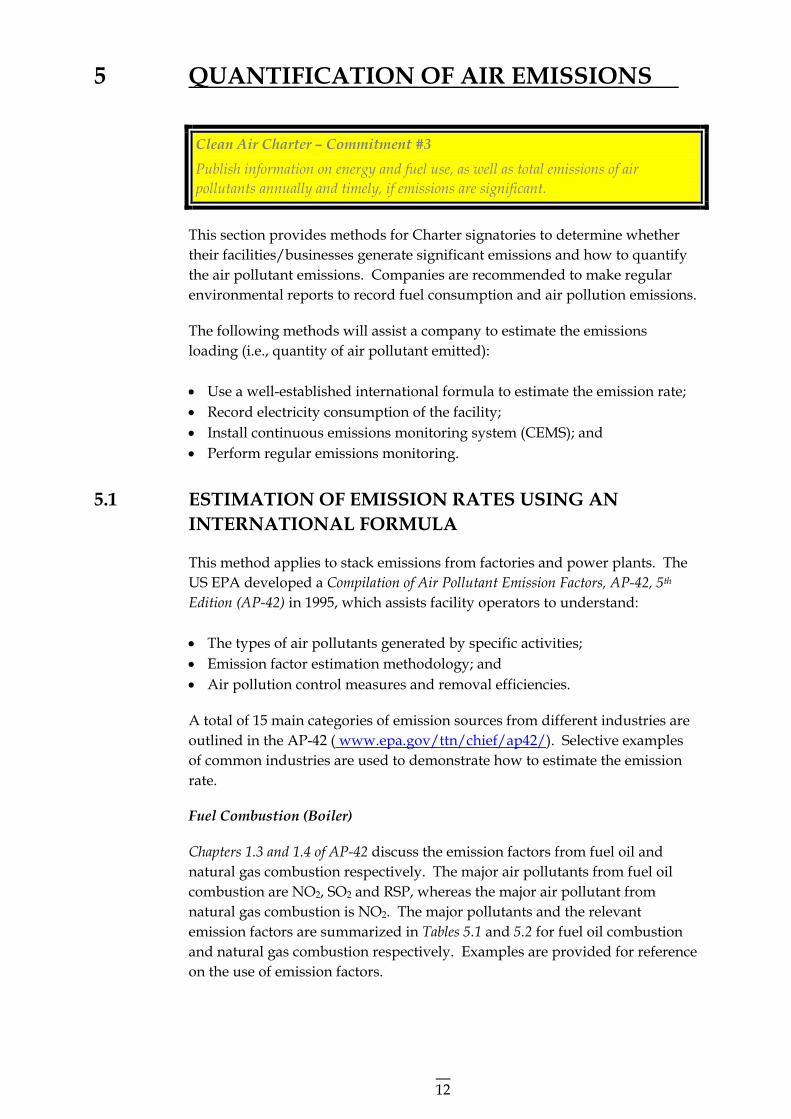
Clean Air Charter – Commitment #3 Publish information on energy and fuel use, as well as total emissions of air pollutants annually and timely, if emissions are significant.
This section provides methods for Charter signatories to determine whether their facilities/businesses generate significant emissions and how to quantify the air pollutant emissions. Companies are recommended to make regular environmental reports to record fuel consumption and air pollution emissions.
The following methods will assist a company to estimate the emissions loading (i.e., quantity of air pollutant emitted): • Use a well-established international formula to estimate the emission rate; • Record electricity consumption of the facility; • Install continuous emissions monitoring system (CEMS); and • Perform regular emissions monitoring.
5.1 ESTIMATION OF EMISSION RATES USING AN INTERNATIONAL FORMULA
This method applies to stack emissions from factories and power plants. The US EPA developed a Compilation of Air Pollutant Emission Factors, AP-42, 5th Edition (AP-42) in 1995, which assists facility operators to understand: • The types of air pollutants generated by specific activities; • Emission factor estimation methodology; and • Air pollution control measures and removal efficiencies.
A total of 15 main categories of emission sources from different industries are outlined in the AP-42 ( www.epa.gov/ttn/chief/ap42/). Selective examples of common industries are used to demonstrate how to estimate the emission rate.
Fuel Combustion (Boiler)
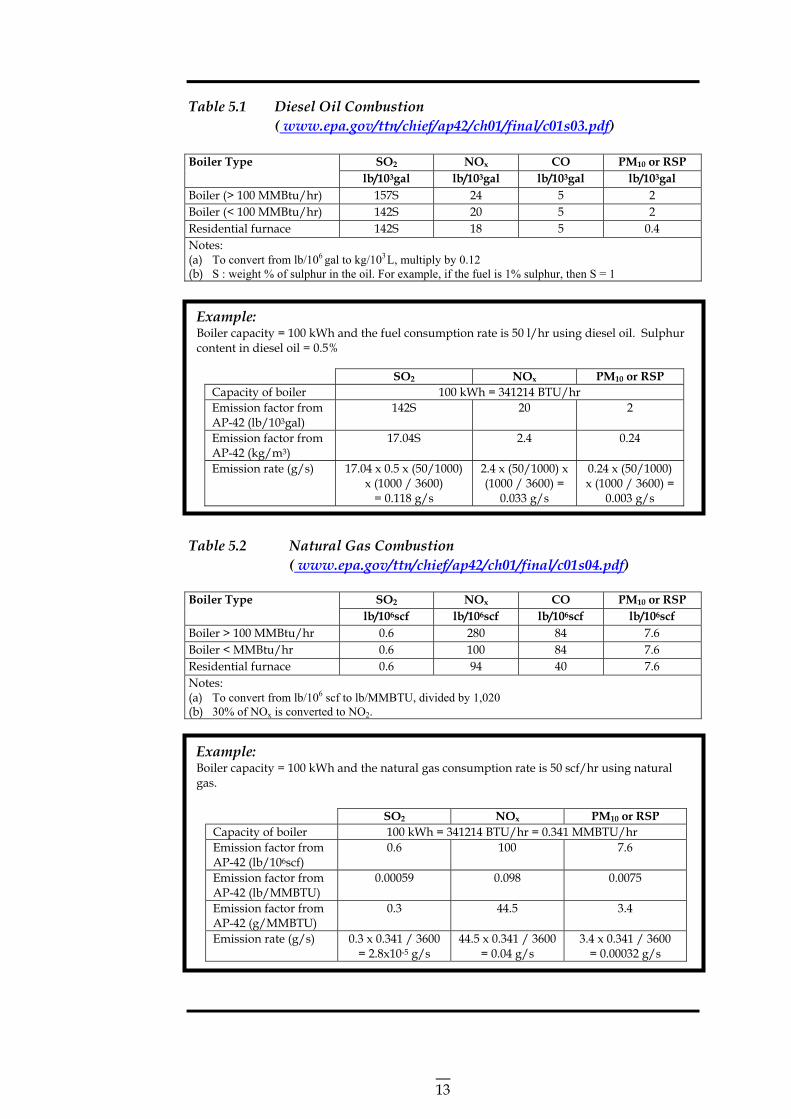
Chapters 1.3 and 1.4 of AP-42 discuss the emission factors from fuel oil and natural gas combustion respectively. The major air pollutants from fuel oil combustion are NO2, SO2 and RSP, whereas the major air pollutant from natural gas combustion is NO2. The major pollutants and the relevant emission factors are summarized in Tables 5.1 and 5.2 for fuel oil combustion and natural gas combustion respectively. Examples are provided for reference on the use of emission factors.
13
Table 5.1 Diesel Oil Combustion ( www.epa.gov/ttn/chief/ap42/ch01/final/c01s03.pdf)
SO2 NOx CO PM10 or RSP Boiler Type lb/103gal lb/103gal lb/103gal lb/103gal
Boiler (> 100 MMBtu/hr) 157S 24 5 2 Boiler (< 100 MMBtu/hr) 142S 20 5 2 Residential furnace 142S 18 5 0.4 Notes: (a) To convert from lb/106
gal to kg/103 L, multiply by 0.12 (b) S : weight % of sulphur in the oil. For example, if the fuel is 1% sulphur, then S = 1
Table 5.2 Natural Gas Combustion ( www.epa.gov/ttn/chief/ap42/ch01/final/c01s04.pdf)
SO2 NOx CO PM10 or RSP Boiler Type lb/106scf lb/106scf lb/106scf lb/106scf
Boiler > 100 MMBtu/hr 0.6 280 84 7.6 Boiler < MMBtu/hr 0.6 100 84 7.6 Residential furnace 0.6 94 40 7.6 Notes: (a) To convert from lb/106 scf to lb/MMBTU, divided by 1,020 (b) 30% of NOx is converted to NO2.
Example: Boiler capacity = 100 kWh and the fuel consumption rate is 50 l/hr using diesel oil. Sulphur content in diesel oil = 0.5%
SO2 NOx PM10 or RSP Capacity of boiler 100 kWh = 341214 BTU/hr Emission factor from AP-42 (lb/103gal)
142S 20 2
Emission factor from AP-42 (kg/m3)
17.04S 2.4 0.24
Emission rate (g/s) 17.04 x 0.5 x (50/1000) x (1000 / 3600)
= 0.118 g/s
2.4 x (50/1000) x (1000 / 3600) =
0.033 g/s
0.24 x (50/1000) x (1000 / 3600) =
0.003 g/s
Example: Boiler capacity = 100 kWh and the natural gas consumption rate is 50 scf/hr using natural gas.
SO2 NOx PM10 or RSP Capacity of boiler 100 kWh = 341214 BTU/hr = 0.341 MMBTU/hr Emission factor from AP-42 (lb/106scf)
0.6 100 7.6
Emission factor from AP-42 (lb/MMBTU)
0.00059 0.098 0.0075
Emission factor from AP-42 (g/MMBTU)
0.3 44.5 3.4
Emission rate (g/s) 0.3 x 0.341 / 3600 = 2.8x10⁻⁵ g/s
44.5 x 0.341 / 3600 = 0.04 g/s
3.4 x 0.341 / 3600 = 0.00032 g/s
14
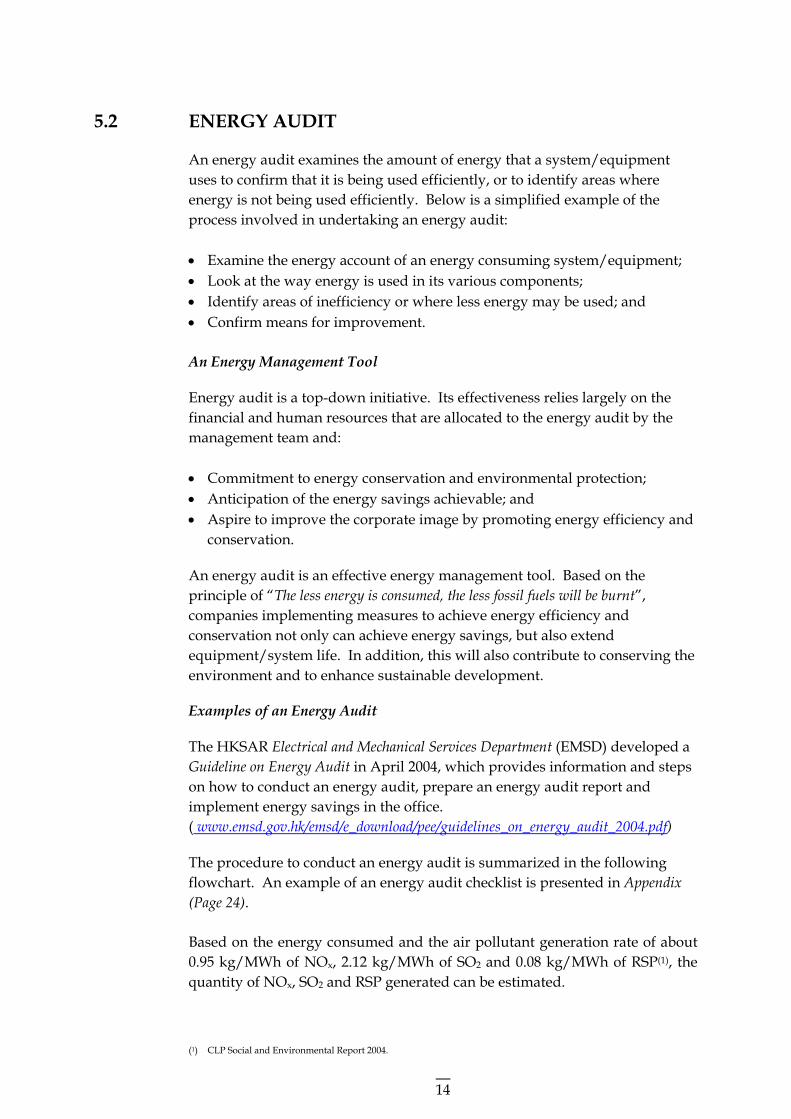
5.2 ENERGY AUDIT
An energy audit examines the amount of energy that a system/equipment uses to confirm that it is being used efficiently, or to identify areas where energy is not being used efficiently. Below is a simplified example of the process involved in undertaking an energy audit: • Examine the energy account of an energy consuming system/equipment; • Look at the way energy is used in its various components; • Identify areas of inefficiency or where less energy may be used; and • Confirm means for improvement. An Energy Management Tool
Energy audit is a top-down initiative. Its effectiveness relies largely on the financial and human resources that are allocated to the energy audit by the management team and: • Commitment to energy conservation and environmental protection; • Anticipation of the energy savings achievable; and • Aspire to improve the corporate image by promoting energy efficiency and
conservation.
An energy audit is an effective energy management tool. Based on the principle of “The less energy is consumed, the less fossil fuels will be burnt”, companies implementing measures to achieve energy efficiency and conservation not only can achieve energy savings, but also extend equipment/system life. In addition, this will also contribute to conserving the environment and to enhance sustainable development.
Examples of an Energy Audit
The HKSAR Electrical and Mechanical Services Department (EMSD) developed a Guideline on Energy Audit in April 2004, which provides information and steps on how to conduct an energy audit, prepare an energy audit report and implement energy savings in the office. ( www.emsd.gov.hk/emsd/e_download/pee/guidelines_on_energy_audit_2004.pdf)
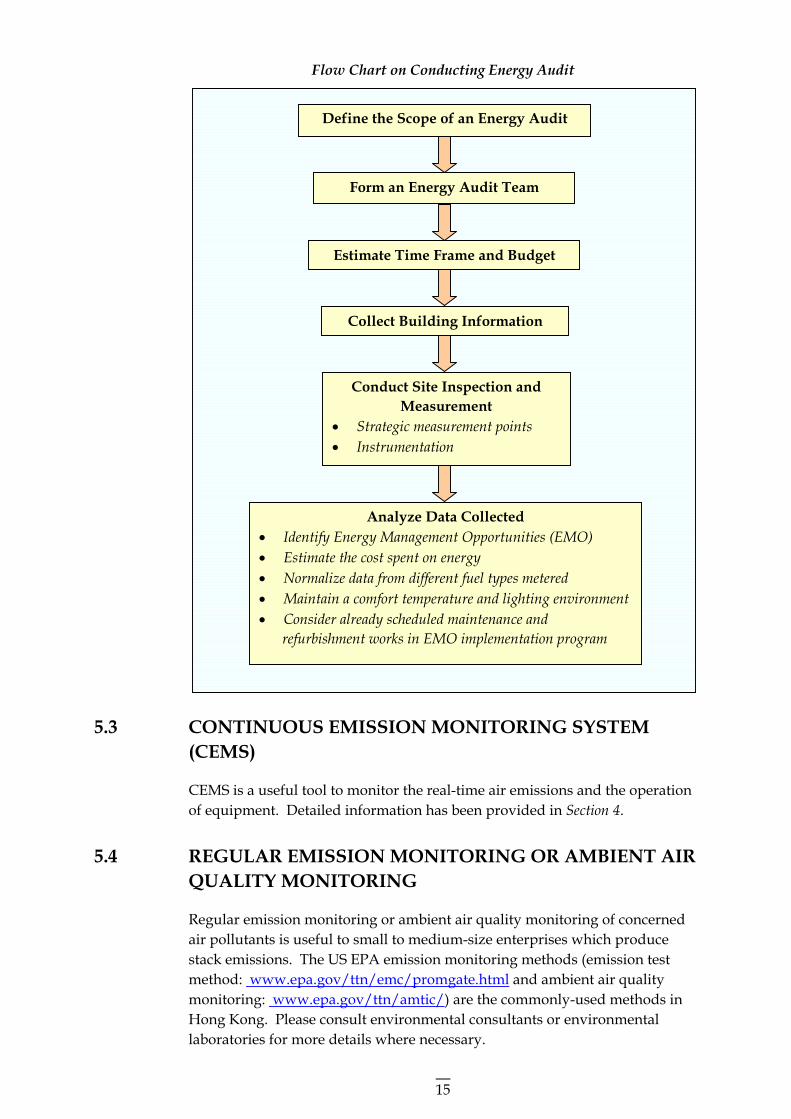
The procedure to conduct an energy audit is summarized in the following flowchart. An example of an energy audit checklist is presented in Appendix (Page 24).
Based on the energy consumed and the air pollutant generation rate of about 0.95 kg/MWh of NOx, 2.12 kg/MWh of SO2 and 0.08 kg/MWh of RSP(1), the quantity of NOx, SO2 and RSP generated can be estimated.
(1) CLP Social and Environmental Report 2004.
15
Flow Chart on Conducting Energy Audit
5.3 CONTINUOUS EMISSION MONITORING SYSTEM (CEMS)
CEMS is a useful tool to monitor the real-time air emissions and the operation of equipment. Detailed information has been provided in Section 4.
5.4 REGULAR EMISSION MONITORING OR AMBIENT AIR QUALITY MONITORING
Regular emission monitoring or ambient air quality monitoring of concerned air pollutants is useful to small to medium-size enterprises which produce stack emissions. The US EPA emission monitoring methods (emission test method: www.epa.gov/ttn/emc/promgate.html and ambient air quality monitoring: www.epa.gov/ttn/amtic/) are the commonly-used methods in Hong Kong. Please consult environmental consultants or environmental laboratories for more details where necessary.
Analyze Data Collected • Identify Energy Management Opportunities (EMO) • Estimate the cost spent on energy • Normalize data from different fuel types metered • Maintain a comfort temperature and lighting environment • Consider already scheduled maintenance and
refurbishment works in EMO implementation program
Define the Scope of an Energy Audit
Form an Energy Audit Team
Estimate Time Frame and Budget
Collect Building Information
Conduct Site Inspection and Measurement
• Strategic measurement points • Instrumentation
16
6 EMISSION CONTROL MEASURES
Clean Air Charter – Commitment #4 Undertake to adopt energy efficient measures in their operations. Clean Air Charter – Commitment #5 Identify and encourage business-relevant measures to be taken on days when air pollution is high. Clean Air Charter – Commitment #6 Share air quality expertise of business with others.
This Section provides simple, possible and cost-effective air emission control measures for the office, environment and vehicle fleet to reduce air emissions. Charter signatories are encouraged to incorporate these air emission control strategies and energy efficient measures into their day-to-day operation, and share their experience with regard to any successful air emission control measures. Examples of some air emission minimization measures are provided in this section.
6.1 GENERAL MEASURES
The HKGCC and the HKBCE have developed the "7-7-7 Care-for-Air" Guideline for the general public to take immediate, practical steps to contribute to improving air quality at home, at work and while travelling, especially when the Air Pollution Index is high.
7-7-7 Care-for-Air Public Guideline
Make That Little Effort at Home
1. Switch off unnecessary domestic appliances - make use of natural light and ventilation.
2. Don't use standby mode - turn off appliances completely when not in use.
3. Set a comfortable room temperature - don't over cool or over heat.
4. Avoid using the tumble drier.
5. Don't use products containing VOCs, e.g. paints, hair and personal care sprays, etc.
6. Reduce direct emissions from cooking, e.g. thaw food in the fridge before cooking, postpone your BBQ, etc.
7. Don't smoke
Make That Little Extra Effort at Work
1. Activate "sleep" mode in office equipment during office hours, including photocopiers, scanners and printers.
17
2. Don't use standby mode after working hours - turn off unnecessary equipment completely including the computer.
3. Minimize photocopying to reduce ozone emissions.
4. Wear clothing that keeps you comfortable in the office.
5. Make conference calls or use other electronic media to reduce travelling for business meetings.
6. Adopt flexible working hours to reduce emissions caused by traffic congestion.
7. Use products with zero or low VOCs during renovations.
Make That Little Extra Effort on the Road
1. Reduce unnecessary travel.
2. Use the stairs wherever possible to save energy.
3. Walk or ride a bicycle for short journeys.
4. Use public transport.
5. Plan your travel or carpool to avoid single-passenger car trips.
6. Stop using vehicles that emit black smoke.
7. Don't leave the engine idling
6.2 INDOOR ENVIRONMENT AND ENERGY CONSUMED IN OFFICES
The indoor environment and energy consumption in offices can be improved by applying the following measures: • Substitute an air emission source with one of lower emission rate or that
emits a less hazardous pollutant; Example: use a water based/polyurethane paint to replace organic solvent based paint; use a cleaning agent with lower but adequate chemical strength
• Relocate the source of an air emission away from occupied space;
Example: relocate photocopiers away from the general working area
• Adjust and rebalance the ventilation system to a level appropriate to the occupancy levels and sources of heat and pollutants;
• Increase the outside air supply;
• Upgrade air filtering systems to clean air more thoroughly;
• Install a gas filter to remove VOCs, ozone, hydrogen sulphide and reactive gases such as formaldehyde;
• Perform regular maintenance and cleaning of the ventilation system;
• Conduct an energy audit (see Example 2);
• Use renewable energy (e.g. solar panel); and
• Install a CO2 sensor.
18
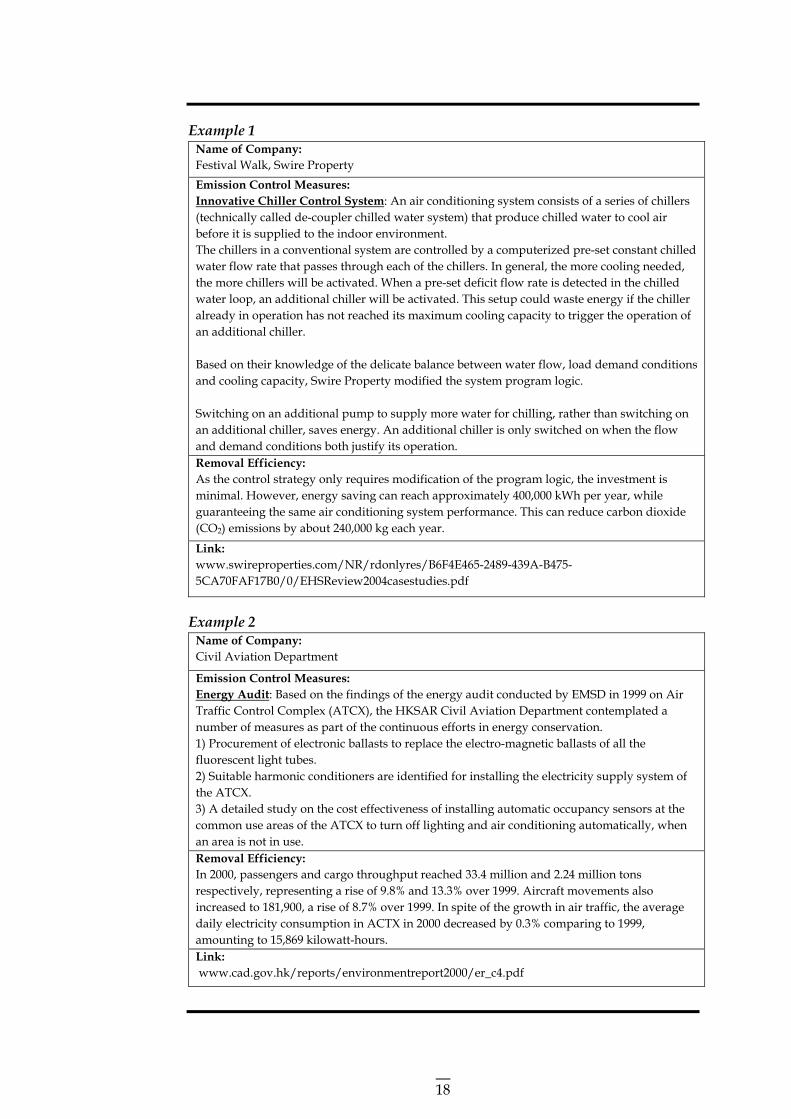
Example 1 Name of Company: Festival Walk, Swire Property Emission Control Measures: Innovative Chiller Control System: An air conditioning system consists of a series of chillers (technically called de-coupler chilled water system) that produce chilled water to cool air before it is supplied to the indoor environment. The chillers in a conventional system are controlled by a computerized pre-set constant chilled water flow rate that passes through each of the chillers. In general, the more cooling needed, the more chillers will be activated. When a pre-set deficit flow rate is detected in the chilled water loop, an additional chiller will be activated. This setup could waste energy if the chiller already in operation has not reached its maximum cooling capacity to trigger the operation of an additional chiller. Based on their knowledge of the delicate balance between water flow, load demand conditions and cooling capacity, Swire Property modified the system program logic. Switching on an additional pump to supply more water for chilling, rather than switching on an additional chiller, saves energy. An additional chiller is only switched on when the flow and demand conditions both justify its operation. Removal Efficiency: As the control strategy only requires modification of the program logic, the investment is minimal. However, energy saving can reach approximately 400,000 kWh per year, while guaranteeing the same air conditioning system performance. This can reduce carbon dioxide (CO2) emissions by about 240,000 kg each year.
Link: www.swireproperties.com/NR/rdonlyres/B6F4E465-2489-439A-B475-5CA70FAF17B0/0/EHSReview2004casestudies.pdf
Example 2 Name of Company: Civil Aviation Department
Emission Control Measures: Energy Audit: Based on the findings of the energy audit conducted by EMSD in 1999 on Air Traffic Control Complex (ATCX), the HKSAR Civil Aviation Department contemplated a number of measures as part of the continuous efforts in energy conservation. 1) Procurement of electronic ballasts to replace the electro-magnetic ballasts of all the fluorescent light tubes. 2) Suitable harmonic conditioners are identified for installing the electricity supply system of the ATCX. 3) A detailed study on the cost effectiveness of installing automatic occupancy sensors at the common use areas of the ATCX to turn off lighting and air conditioning automatically, when an area is not in use. Removal Efficiency: In 2000, passengers and cargo throughput reached 33.4 million and 2.24 million tons respectively, representing a rise of 9.8% and 13.3% over 1999. Aircraft movements also increased to 181,900, a rise of 8.7% over 1999. In spite of the growth in air traffic, the average daily electricity consumption in ACTX in 2000 decreased by 0.3% comparing to 1999, amounting to 15,869 kilowatt-hours. Link: www.cad.gov.hk/reports/environmentreport2000/er_c4.pdf
19
6.3 MEASURES TO REDUCE STACK EMISSIONS
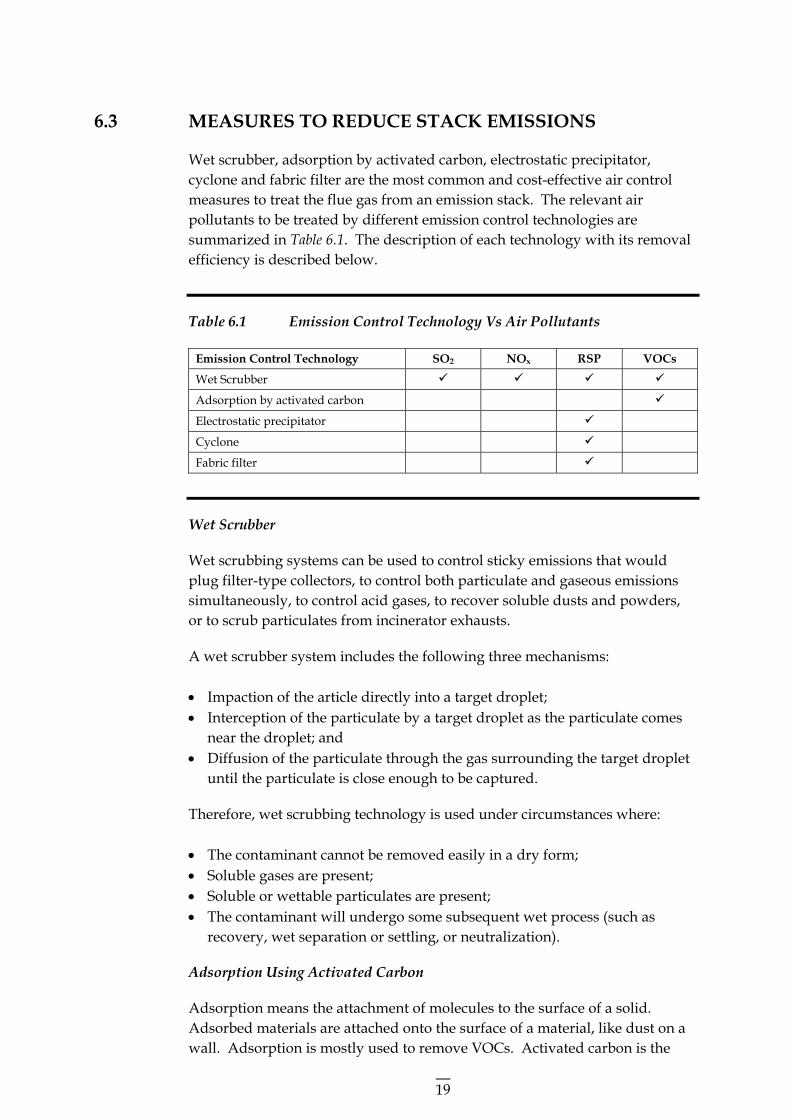
Wet scrubber, adsorption by activated carbon, electrostatic precipitator, cyclone and fabric filter are the most common and cost-effective air control measures to treat the flue gas from an emission stack. The relevant air pollutants to be treated by different emission control technologies are summarized in Table 6.1. The description of each technology with its removal efficiency is described below.
Table 6.1 Emission Control Technology Vs Air Pollutants
Emission Control Technology SO2 NOx RSP VOCs
Wet Scrubber
Adsorption by activated carbon
Electrostatic precipitator
Cyclone
Fabric filter
Wet Scrubber
Wet scrubbing systems can be used to control sticky emissions that would plug filter-type collectors, to control both particulate and gaseous emissions simultaneously, to control acid gases, to recover soluble dusts and powders, or to scrub particulates from incinerator exhausts.
A wet scrubber system includes the following three mechanisms: • Impaction of the article directly into a target droplet; • Interception of the particulate by a target droplet as the particulate comes
near the droplet; and • Diffusion of the particulate through the gas surrounding the target droplet
until the particulate is close enough to be captured.
Therefore, wet scrubbing technology is used under circumstances where: • The contaminant cannot be removed easily in a dry form; • Soluble gases are present; • Soluble or wettable particulates are present; • The contaminant will undergo some subsequent wet process (such as
recovery, wet separation or settling, or neutralization).
Adsorption Using Activated Carbon
Adsorption means the attachment of molecules to the surface of a solid. Adsorbed materials are attached onto the surface of a material, like dust on a wall. Adsorption is mostly used to remove VOCs. Activated carbon is the
20
most common adsorbent which is low-cost and can be regenerated. Three types of systems using adsorption theory comprise fixed or stationary bed, moving bed, and fluidized bed. Among the three systems, the fixed-bed adsorber is the most common choice for the control of gaseous pollutants. The gas stream containing the pollutant is passed continuously through a relatively deep bed of adsorbent.
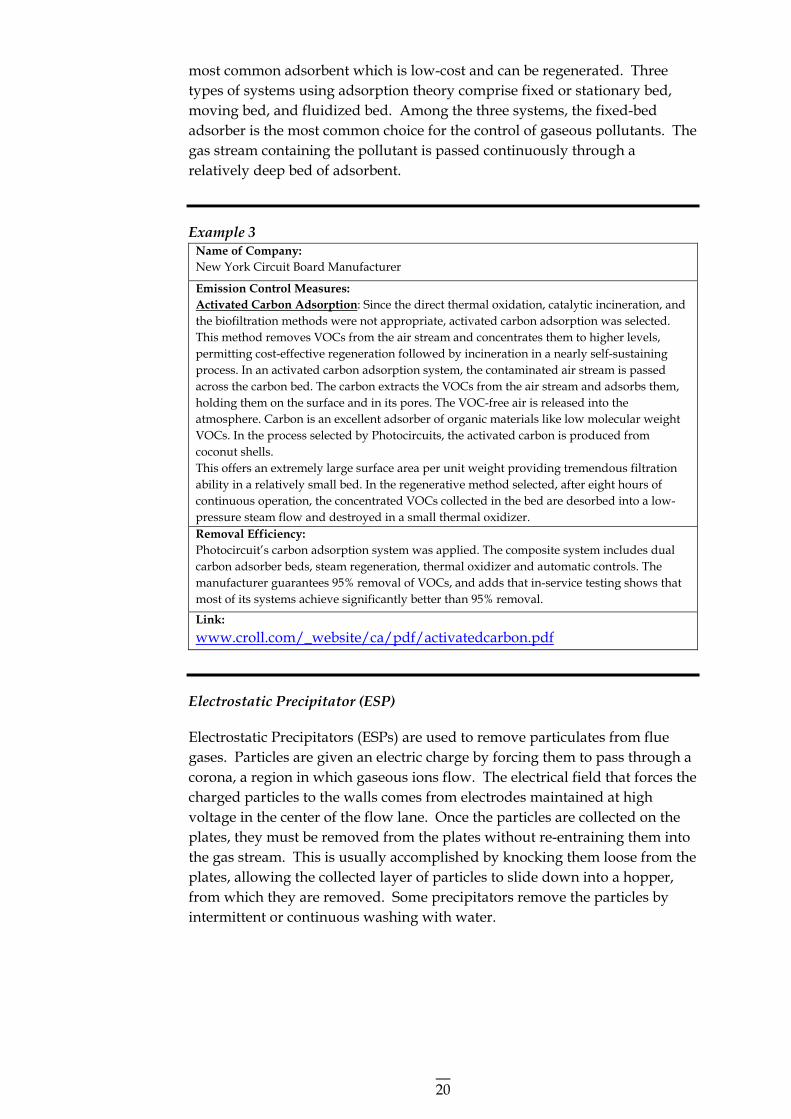
Example 3 Name of Company: New York Circuit Board Manufacturer
Emission Control Measures: Activated Carbon Adsorption: Since the direct thermal oxidation, catalytic incineration, and the biofiltration methods were not appropriate, activated carbon adsorption was selected. This method removes VOCs from the air stream and concentrates them to higher levels, permitting cost-effective regeneration followed by incineration in a nearly self-sustaining process. In an activated carbon adsorption system, the contaminated air stream is passed across the carbon bed. The carbon extracts the VOCs from the air stream and adsorbs them, holding them on the surface and in its pores. The VOC-free air is released into the atmosphere. Carbon is an excellent adsorber of organic materials like low molecular weight VOCs. In the process selected by Photocircuits, the activated carbon is produced from coconut shells. This offers an extremely large surface area per unit weight providing tremendous filtration ability in a relatively small bed. In the regenerative method selected, after eight hours of continuous operation, the concentrated VOCs collected in the bed are desorbed into a low-pressure steam flow and destroyed in a small thermal oxidizer. Removal Efficiency: Photocircuit’s carbon adsorption system was applied. The composite system includes dual carbon adsorber beds, steam regeneration, thermal oxidizer and automatic controls. The manufacturer guarantees 95% removal of VOCs, and adds that in-service testing shows that most of its systems achieve significantly better than 95% removal.
Link: www.croll.com/_website/ca/pdf/activatedcarbon.pdf
Electrostatic Precipitator (ESP)
Electrostatic Precipitators (ESPs) are used to remove particulates from flue gases. Particles are given an electric charge by forcing them to pass through a corona, a region in which gaseous ions flow. The electrical field that forces the charged particles to the walls comes from electrodes maintained at high voltage in the center of the flow lane. Once the particles are collected on the plates, they must be removed from the plates without re-entraining them into the gas stream. This is usually accomplished by knocking them loose from the plates, allowing the collected layer of particles to slide down into a hopper, from which they are removed. Some precipitators remove the particles by intermittent or continuous washing with water.
21
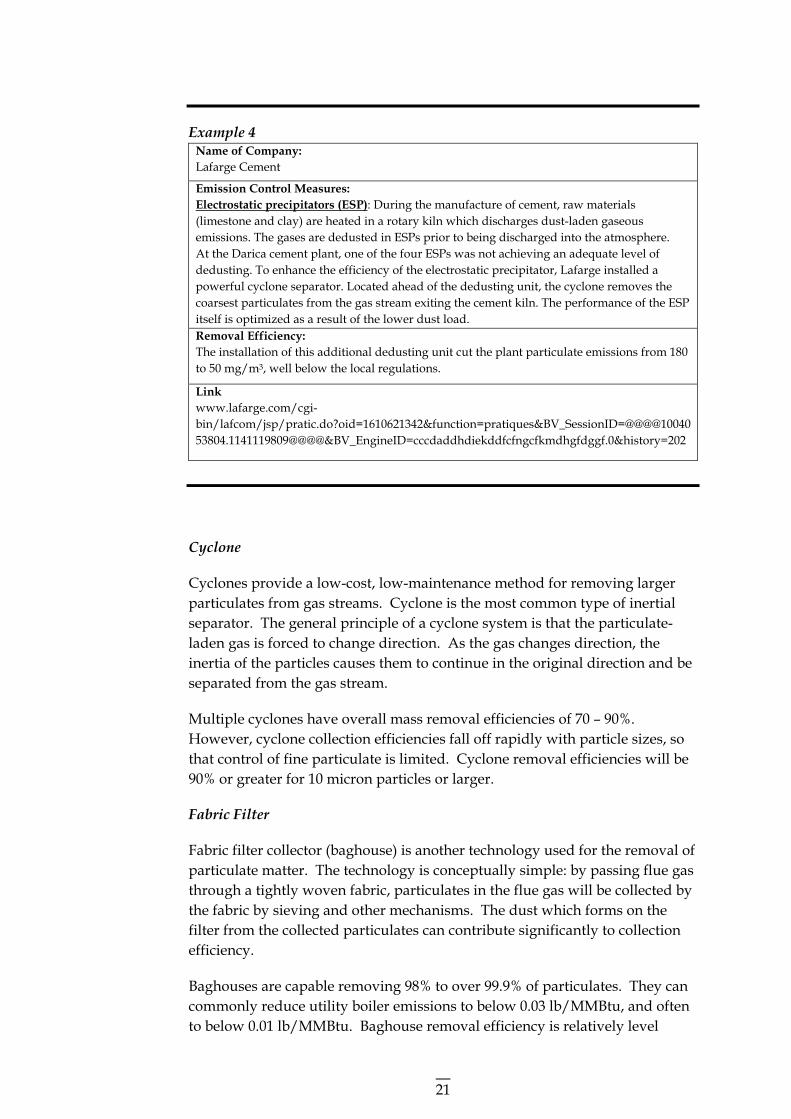
Example 4 Name of Company: Lafarge Cement
Emission Control Measures: Electrostatic precipitators (ESP): During the manufacture of cement, raw materials (limestone and clay) are heated in a rotary kiln which discharges dust-laden gaseous emissions. The gases are dedusted in ESPs prior to being discharged into the atmosphere. At the Darica cement plant, one of the four ESPs was not achieving an adequate level of dedusting. To enhance the efficiency of the electrostatic precipitator, Lafarge installed a powerful cyclone separator. Located ahead of the dedusting unit, the cyclone removes the coarsest particulates from the gas stream exiting the cement kiln. The performance of the ESP itself is optimized as a result of the lower dust load. Removal Efficiency: The installation of this additional dedusting unit cut the plant particulate emissions from 180 to 50 mg/m3, well below the local regulations.
Link www.lafarge.com/cgi-bin/lafcom/jsp/pratic.do?oid=1610621342&function=pratiques&BV_SessionID=@@@@1004053804.1141119809@@@@&BV_EngineID=cccdaddhdiekddfcfngcfkmdhgfdggf.0&history=202
Cyclone
Cyclones provide a low-cost, low-maintenance method for removing larger particulates from gas streams. Cyclone is the most common type of inertial separator. The general principle of a cyclone system is that the particulate-laden gas is forced to change direction. As the gas changes direction, the inertia of the particles causes them to continue in the original direction and be separated from the gas stream.
Multiple cyclones have overall mass removal efficiencies of 70 – 90%. However, cyclone collection efficiencies fall off rapidly with particle sizes, so that control of fine particulate is limited. Cyclone removal efficiencies will be 90% or greater for 10 micron particles or larger.
Fabric Filter
Fabric filter collector (baghouse) is another technology used for the removal of particulate matter. The technology is conceptually simple: by passing flue gas through a tightly woven fabric, particulates in the flue gas will be collected by the fabric by sieving and other mechanisms. The dust which forms on the filter from the collected particulates can contribute significantly to collection efficiency.
Baghouses are capable removing 98% to over 99.9% of particulates. They can commonly reduce utility boiler emissions to below 0.03 lb/MMBtu, and often to below 0.01 lb/MMBtu. Baghouse removal efficiency is relatively level
22
across the particle size range, so that excellent control of particulates can be obtained. However, they may not be as effective with smaller particulates.
Fabric filters are useful for collecting particles with resistivities either too low or too high for collection with ESPs. Fabric filters therefore may be good candidates for collecting fly ash from low-sulphur coal or fly ash containing high unburned carbon levels, which have low resistivities, and thus are relatively difficult to collect with electrostatic precipitators.
6.4 MEASURES TO REDUCE VEHICLE EMISSIONS
Vehicle emissions could be minimized by applying the following measures: • Using ultra-low sulphur diesel oil; • Using EURO IV/V type of vehicles; • Using liquefied petroleum-gas (LPG); • Hybrid vehicle; • Electric vehicle.
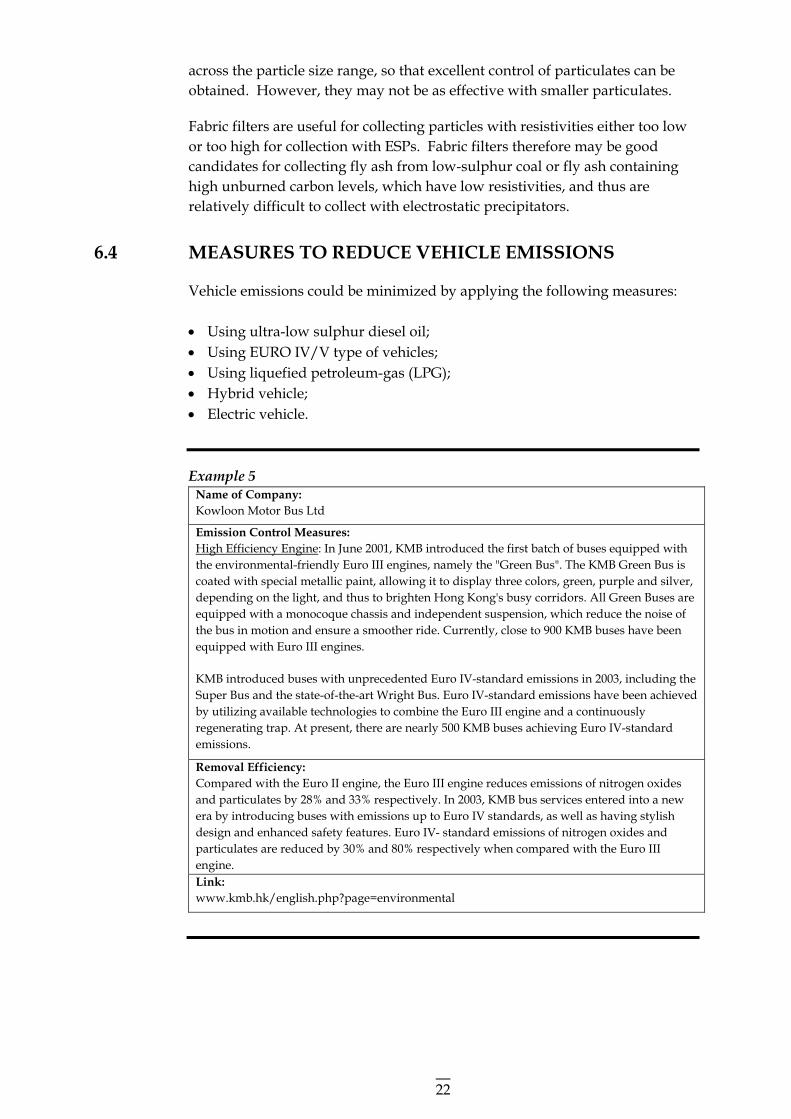
Example 5 Name of Company: Kowloon Motor Bus Ltd
Emission Control Measures: High Efficiency Engine: In June 2001, KMB introduced the first batch of buses equipped with the environmental-friendly Euro III engines, namely the "Green Bus". The KMB Green Bus is coated with special metallic paint, allowing it to display three colors, green, purple and silver, depending on the light, and thus to brighten Hong Kong's busy corridors. All Green Buses are equipped with a monocoque chassis and independent suspension, which reduce the noise of the bus in motion and ensure a smoother ride. Currently, close to 900 KMB buses have been equipped with Euro III engines. KMB introduced buses with unprecedented Euro IV-standard emissions in 2003, including the Super Bus and the state-of-the-art Wright Bus. Euro IV-standard emissions have been achieved by utilizing available technologies to combine the Euro III engine and a continuously regenerating trap. At present, there are nearly 500 KMB buses achieving Euro IV-standard emissions.
Removal Efficiency: Compared with the Euro II engine, the Euro III engine reduces emissions of nitrogen oxides and particulates by 28% and 33% respectively. In 2003, KMB bus services entered into a new era by introducing buses with emissions up to Euro IV standards, as well as having stylish design and enhanced safety features. Euro IV- standard emissions of nitrogen oxides and particulates are reduced by 30% and 80% respectively when compared with the Euro III engine. Link: www.kmb.hk/english.php?page=environmental
23
7 IMPLEMENTATION
The following guidelines are suitable for all business that do not directly produce emissions: • Set up a policy, strategy and/or plan with regard to air pollution; • Identify personnel responsible for environmental management; • Carry out an initial review of the organization’s activities that contribute to
air pollution, such as transportation, energy usage or use of chemicals. Some of these activities can be directly attributed to the company, others may be from assets that are owned by the company for example, factories in China, or from the company’s contractors or suppliers;
• Identify relevant standards, benchmarks or best practices that apply to the business;
• Conduct a simple energy audit. Identify areas where energy consumption can be minimized and establish an implementation timetable;
• Review the policy on business travel and identify if there are areas that can be improved to reduce emissions without compromising operational efficiency;
• Take part in voluntary environmental campaigns; • Confirm if targets are being achieved according to target dates; • Increase measures to improve other aspects of environmental performance
(energy saving measures are directly related to efforts on climate change) within the emission-reduction measures in place; and
• Review after 12 months and report the results in relation to emissions and future plans.
For businesses with operations in Hong Kong or Guangdong Province, the following tips are useful for minimizing air emissions: • Quantify air pollution emissions for SO2, NOx, RSP and VOCs; • Quantify fuel or electricity consumption (liter or tons of fuel or kWh of
electricity); • Perform regular environmental audits; • Identify international standards and best practices relevant to the emissions
of the business; and • Implement cost-effective pollution control measures.
A preliminary Air Emission and Energy Audit Checklist is presented in Annex A to assist Charter signatories to meet the six Commitments
24
Appendix
Preliminary Air Emission and Energy Audit Checklist
25
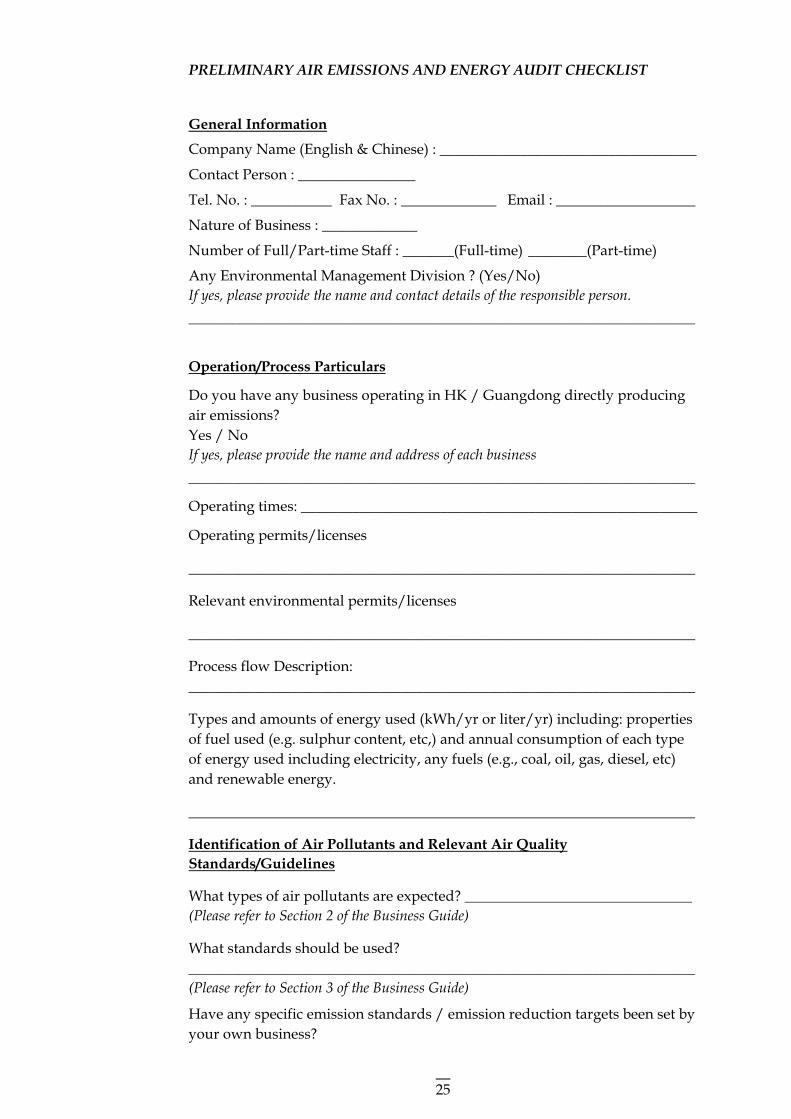
PRELIMINARY AIR EMISSIONS AND ENERGY AUDIT CHECKLIST
General Information
Company Name (English & Chinese) : ___________________________________
Contact Person : ________________
Tel. No. : ___________ Fax No. : _____________ Email : ___________________
Nature of Business : _____________
Number of Full/Part-time Staff : _______(Full-time) ________(Part-time)
Any Environmental Management Division ? (Yes/No) If yes, please provide the name and contact details of the responsible person. _____________________________________________________________________
Operation/Process Particulars
Do you have any business operating in HK / Guangdong directly producing air emissions? Yes / No If yes, please provide the name and address of each business _____________________________________________________________________
Operating times: ______________________________________________________
Operating permits/licenses
_____________________________________________________________________
Relevant environmental permits/licenses
_____________________________________________________________________
Process flow Description: _____________________________________________________________________
Types and amounts of energy used (kWh/yr or liter/yr) including: properties of fuel used (e.g. sulphur content, etc,) and annual consumption of each type of energy used including electricity, any fuels (e.g., coal, oil, gas, diesel, etc) and renewable energy.
_____________________________________________________________________
Identification of Air Pollutants and Relevant Air Quality Standards/Guidelines
What types of air pollutants are expected? _______________________________ (Please refer to Section 2 of the Business Guide)
What standards should be used? _____________________________________________________________________ (Please refer to Section 3 of the Business Guide)
Have any specific emission standards / emission reduction targets been set by your own business?
26
_____________________________________________________________________
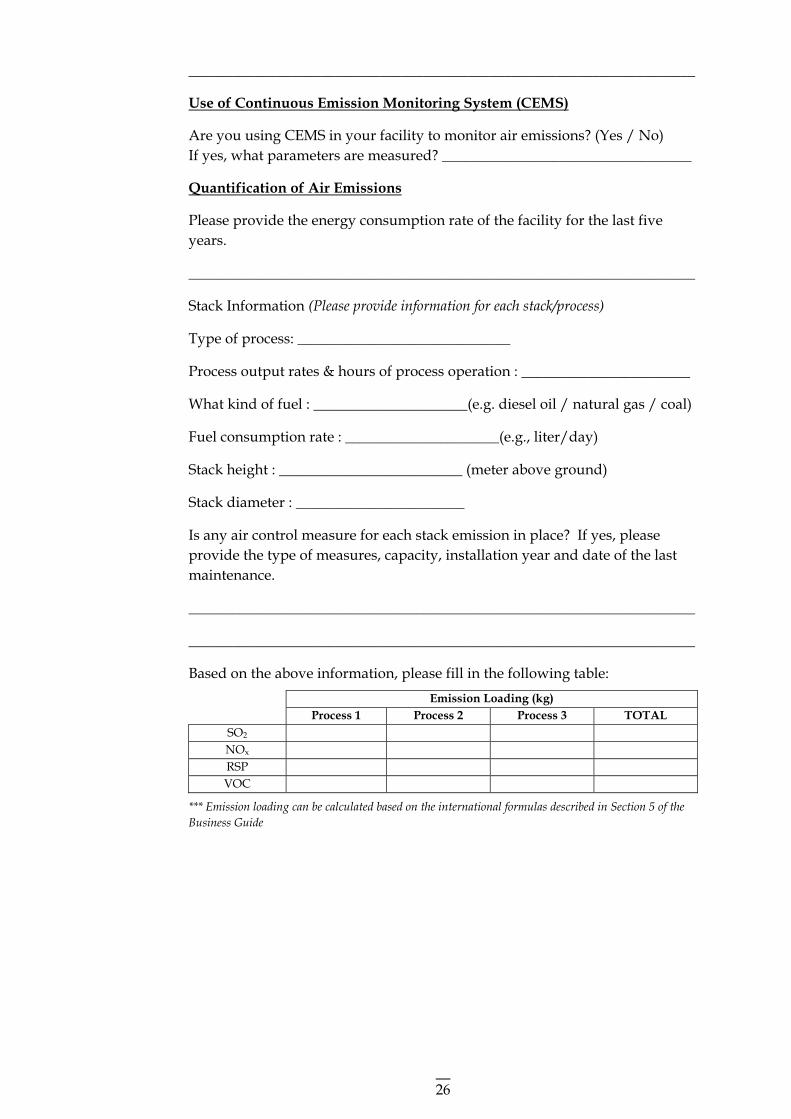
Use of Continuous Emission Monitoring System (CEMS)
Are you using CEMS in your facility to monitor air emissions? (Yes / No) If yes, what parameters are measured? __________________________________
Quantification of Air Emissions
Please provide the energy consumption rate of the facility for the last five years.
_____________________________________________________________________
Stack Information (Please provide information for each stack/process)
Type of process: _____________________________
Process output rates & hours of process operation : _______________________
What kind of fuel : _____________________(e.g. diesel oil / natural gas / coal)
Fuel consumption rate : _____________________(e.g., liter/day)
Stack height : _________________________ (meter above ground)
Stack diameter : _______________________
Is any air control measure for each stack emission in place? If yes, please provide the type of measures, capacity, installation year and date of the last maintenance.
_____________________________________________________________________
_____________________________________________________________________
Based on the above information, please fill in the following table: Emission Loading (kg) Process 1 Process 2 Process 3 TOTAL
SO2 NOx RSP VOC
*** Emission loading can be calculated based on the international formulas described in Section 5 of the Business Guide
27
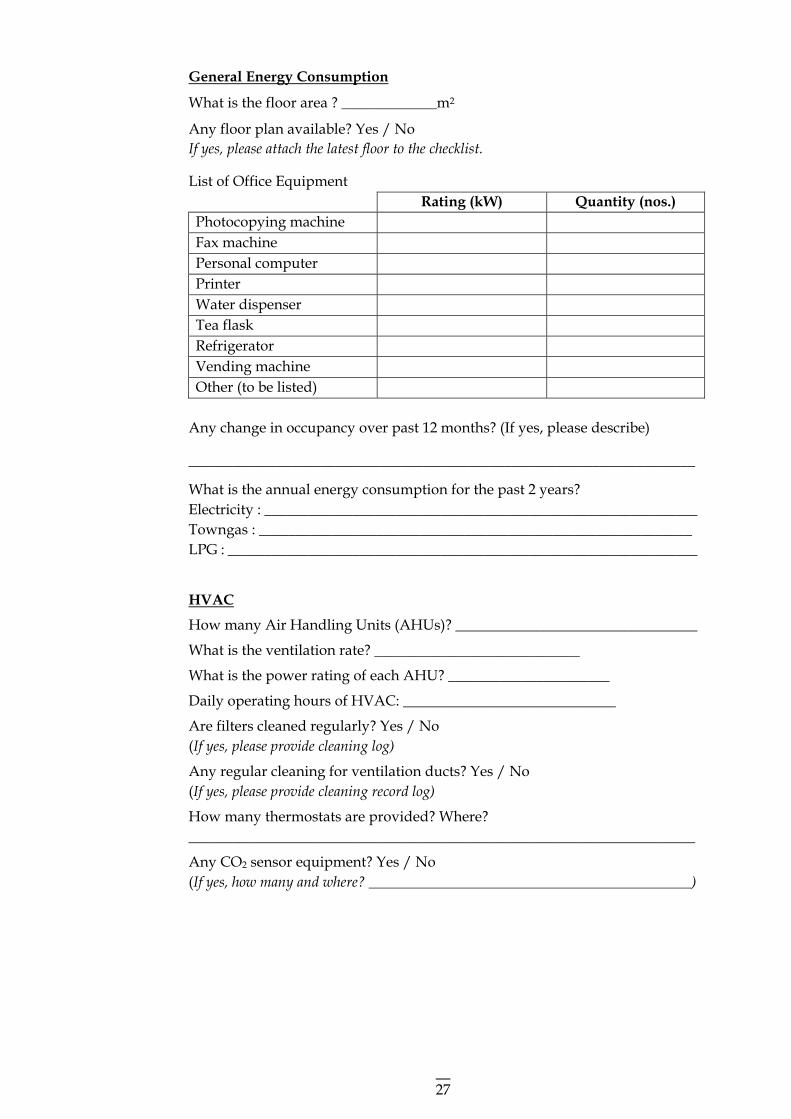
General Energy Consumption
What is the floor area ? _____________m2
Any floor plan available? Yes / No If yes, please attach the latest floor to the checklist.
List of Office Equipment Rating (kW) Quantity (nos.)
Photocopying machine Fax machine Personal computer Printer Water dispenser Tea flask Refrigerator Vending machine Other (to be listed)
Any change in occupancy over past 12 months? (If yes, please describe)
_____________________________________________________________________
What is the annual energy consumption for the past 2 years? Electricity : ___________________________________________________________ Towngas : ___________________________________________________________ LPG : ________________________________________________________________
HVAC
How many Air Handling Units (AHUs)? _________________________________
What is the ventilation rate? ____________________________
What is the power rating of each AHU? ______________________
Daily operating hours of HVAC: _____________________________
Are filters cleaned regularly? Yes / No (If yes, please provide cleaning log)
Any regular cleaning for ventilation ducts? Yes / No (If yes, please provide cleaning record log)
How many thermostats are provided? Where? _____________________________________________________________________
Any CO2 sensor equipment? Yes / No (If yes, how many and where? ____________________________________________)